


Highlights
What are the main findings?
- The Qinghai–Tibetan Plateau showed an overall greening trend during 2000–2020 with strong spatial clustering (“High–High” clusters in the southeast, “Low-Low” clusters in the northwest), dominated by nonlinear interactions of climate, topography, vegetation, and soil.
- Human activities exerted a greater impact on vegetation than climate alone, with clear elevation stratification: humans dominated at 2500–3500 m, while climate dominated above 3500 m.
What are the implications of the main findings?
- The coupled RESTREND–Geodetector framework reliably disentangles climate–human nonlinear effects, providing a transferable method for high-altitude ecosystem attribution.
- Spatially differentiated ecological management should prioritize human disturbance control at mid-elevations and climate adaptation in high-altitude zones to sustain plateau vegetation resilience.
Abstract
Disentangling the coupled, nonlinear impacts of climate change and anthropogenic activities on vegetation dynamics is critical yet challenging for global change research. The Qinghai–Tibetan Plateau (QTP), a highly climate-sensitive and ecologically strategic region, serves as a vital arena for examining such complex socio-ecological attributions. Based on multi-source environmental datasets from 2000 to 2020, this study developed an integrated, spatially explicit framework coupling residual trend analysis (RESTREND) and GeoDetector to quantify individual drivers and nonlinear climate–human interactions. The QTP exhibited a significant, widespread greening trend during 2000–2020, featuring prominent spatial clustering with “High–High” clusters in the southeast and “Low–Low” clusters in the northwest. Attribution modeling revealed that vegetation dynamics were governed not by isolated variables, but by multifaceted, nonlinear synergies among precipitation, temperature, topography, vegetation type, and land-use change. Key interactive pairs, particularly elevation–temperature and slope–precipitation, dramatically increased explanatory power over single-factor models. Crucially, climate–human synergies explained substantially more variance than climate variables alone, bounded by a distinct elevational threshold: human activities dominated vegetation dynamics at mid-elevations (2500–3500 m), while climate factors took over as the primary controller at high altitudes (above 3500 m). Quantitatively, human activities induced vegetation improvement across 38.6% of the plateau, maintained stability in 35.8%, and caused degradation in 25.6%. By successfully merging trend decomposition with spatial stratified heterogeneity analysis, this study provides a transferable approach to uncoupling complex environmental interactions. These insights highlight the intensifying human footprint on alpine ecosystems and advocate for zone-specific adaptive management: mitigating human disturbances at mid-elevations and fostering climate adaptation in higher zones to preserve plateau resilience.
1. Introduction
Vegetation constitutes a fundamental component of the Earth system, regulating biogeochemical cycles, buffering climate warming, and sustaining ecosystem functioning across scales [1,2,3]. Detecting and attributing vegetation dynamics under accelerating global change has therefore become a central challenge in contemporary Earth system science. This challenge is particularly pronounced in climate-sensitive regions, where ecosystem responses often exhibit amplified signals and complex feedbacks. The Qinghai–Tibetan Plateau (QTP), widely recognized as the “Roof of the World,” the “Asian Water Tower,” and the “Third Pole,” represents one of the most climatically sensitive and ecologically strategic regions globally [4]. Owing to its extreme elevation, complex topography, and diverse climatic gradients, the plateau functions as both a regional climate regulator and a critical ecological security barrier for Asia [5], making it ideal for investigating climate–human–vegetation system interactions under global change [6,7,8].
Over recent decades, substantial progress has been achieved in understanding the plateau’s surface processes, including regional climate dynamics [9], carbon cycling [10], and land-cover change [11,12]. Vegetation-related research has examined spatial distribution patterns [13], biodiversity gradients [14], vegetation coverage dynamics [15], and climatic controls on plant growth [16].The advent of satellite-based remote sensing has enabled long-term monitoring of vegetation change through indices such as the Normalized Difference Vegetation Index (NDVI). Major datasets—including GIMMS [17], MODIS (Moderate Resolution Imaging Spectro radiometer) [18], and SPOT (Système Pour l’Observation de la Terre) [19]—have provided critical observational foundations. Among them, MODIS MOD13Q1 offers a balanced combination of 250-m spatial resolution, 16-day temporal frequency, and long-term consistency, making it particularly suitable for plateau-scale vegetation monitoring [20].
Despite these observational insights, a robust attribution of vegetation dynamics remains elusive. The QTP has undergone rapid warming, altered precipitation regimes, intensified grazing pressure, land-use transitions, and accelerating infrastructure expansion. These processes have co-occurred with documented vegetation greening in certain sectors and degradation in others, alongside widespread biodiversity shifts, productivity fluctuations, soil erosion, desertification, and permafrost degradation [21,22]. These profound ecological shifts threaten the plateau’s capacity to function as a vital ecological security barrier and water-conservation zone for downstream basins across Asia [23]. Critically, vegetation dynamics rarely respond to isolated drivers; rather, they emerge from highly nonlinear interactions among climatic variability, topographic constraints, edaphic (soil) properties, and anthropogenic disturbances. The relative magnitudes, spatial heterogeneity, and synergistic or antagonistic behaviors of these concurrent drivers remain insufficiently resolved, obstructing a mechanistic understanding and constraining adaptive ecosystem management.
Consequently, a critical knowledge gap persists: while numerous studies have mapped vegetation trends, fewer have rigorously decoupled co-occurring climate–anthropogenic interactions or quantified their nonlinear effects within a unified analytical framework. Traditional correlation-based and linear regression methodologies frequently underestimate interaction intensity and fail to capture nonlinear synergistic effects among confounding drivers. Single-factor analyses risk oversimplifying complex socio-ecological systems, potentially yielding biased or incomplete attribution conclusions. To transcend these limitations, residual trend analysis (RESTREND) has been widely adopted to differentiate climate-driven from human-induced vegetation changes by modeling climate–NDVI relationships and allocating the remaining residuals to anthropogenic impacts. In parallel, the Geographical Detector (GeoDetector) model has proven highly effective at quantifying spatial stratified heterogeneity, identifying nonlinear interactions, and revealing dominant drivers without requiring strict linearity or normality assumptions. Integrating RESTREND and GeoDetector thus offers a powerful, complementary solution to disentangle and interpret climate and human signals in complex ecosystems. To date, however, few studies on the QTP have coupled these two methods to simultaneously quantify independent contributions and nonlinear interactive effects on vegetation dynamics.
To bridge these gaps, this study addresses three core research questions: (1) What are the spatiotemporal patterns and spatial clustering characteristics of vegetation dynamics across the QTP from 2000 to 2020? (2) How do climatic, topographic, soil, vegetation type, and anthropogenic factors individually and interactively shape the spatial heterogeneity of vegetation? (3) What are the relative contributions of climate change and human activities, and how does their dominant influence shift along elevation gradients? Implementing an integrated framework that leverages multi-source environmental datasets, we scrutinize vegetation dynamics by combining NDVI time-series trend analysis, spatial autocorrelation diagnosis, RESTREND-based climate–human attribution, and GeoDetector interaction detection. This framework allows for the quantitative segregation of climatic and anthropogenic impacts while capturing the nonlinear coupling among environmental drivers. The specific objectives are to characterize the spatiotemporal changes and clustering patterns of vegetation greening and degradation, to identify key driving factors and their nonlinear interactive effects, to quantify the relative contributions of climate and human activities alongside their elevational stratification, and to deliver a transferable, spatially explicit attribution framework that provides robust scientific support for adaptive ecosystem conservation on the QTP under ongoing environmental change.
2. Data and Methodology
2.1. General Description of the Study Area
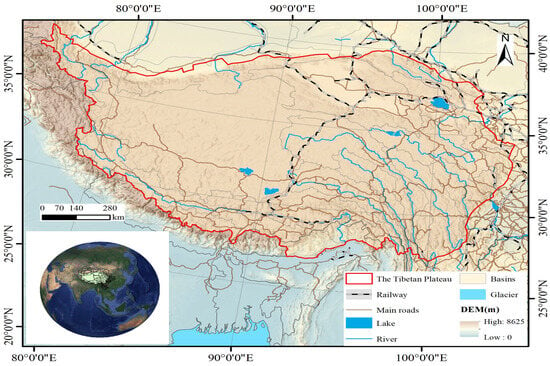
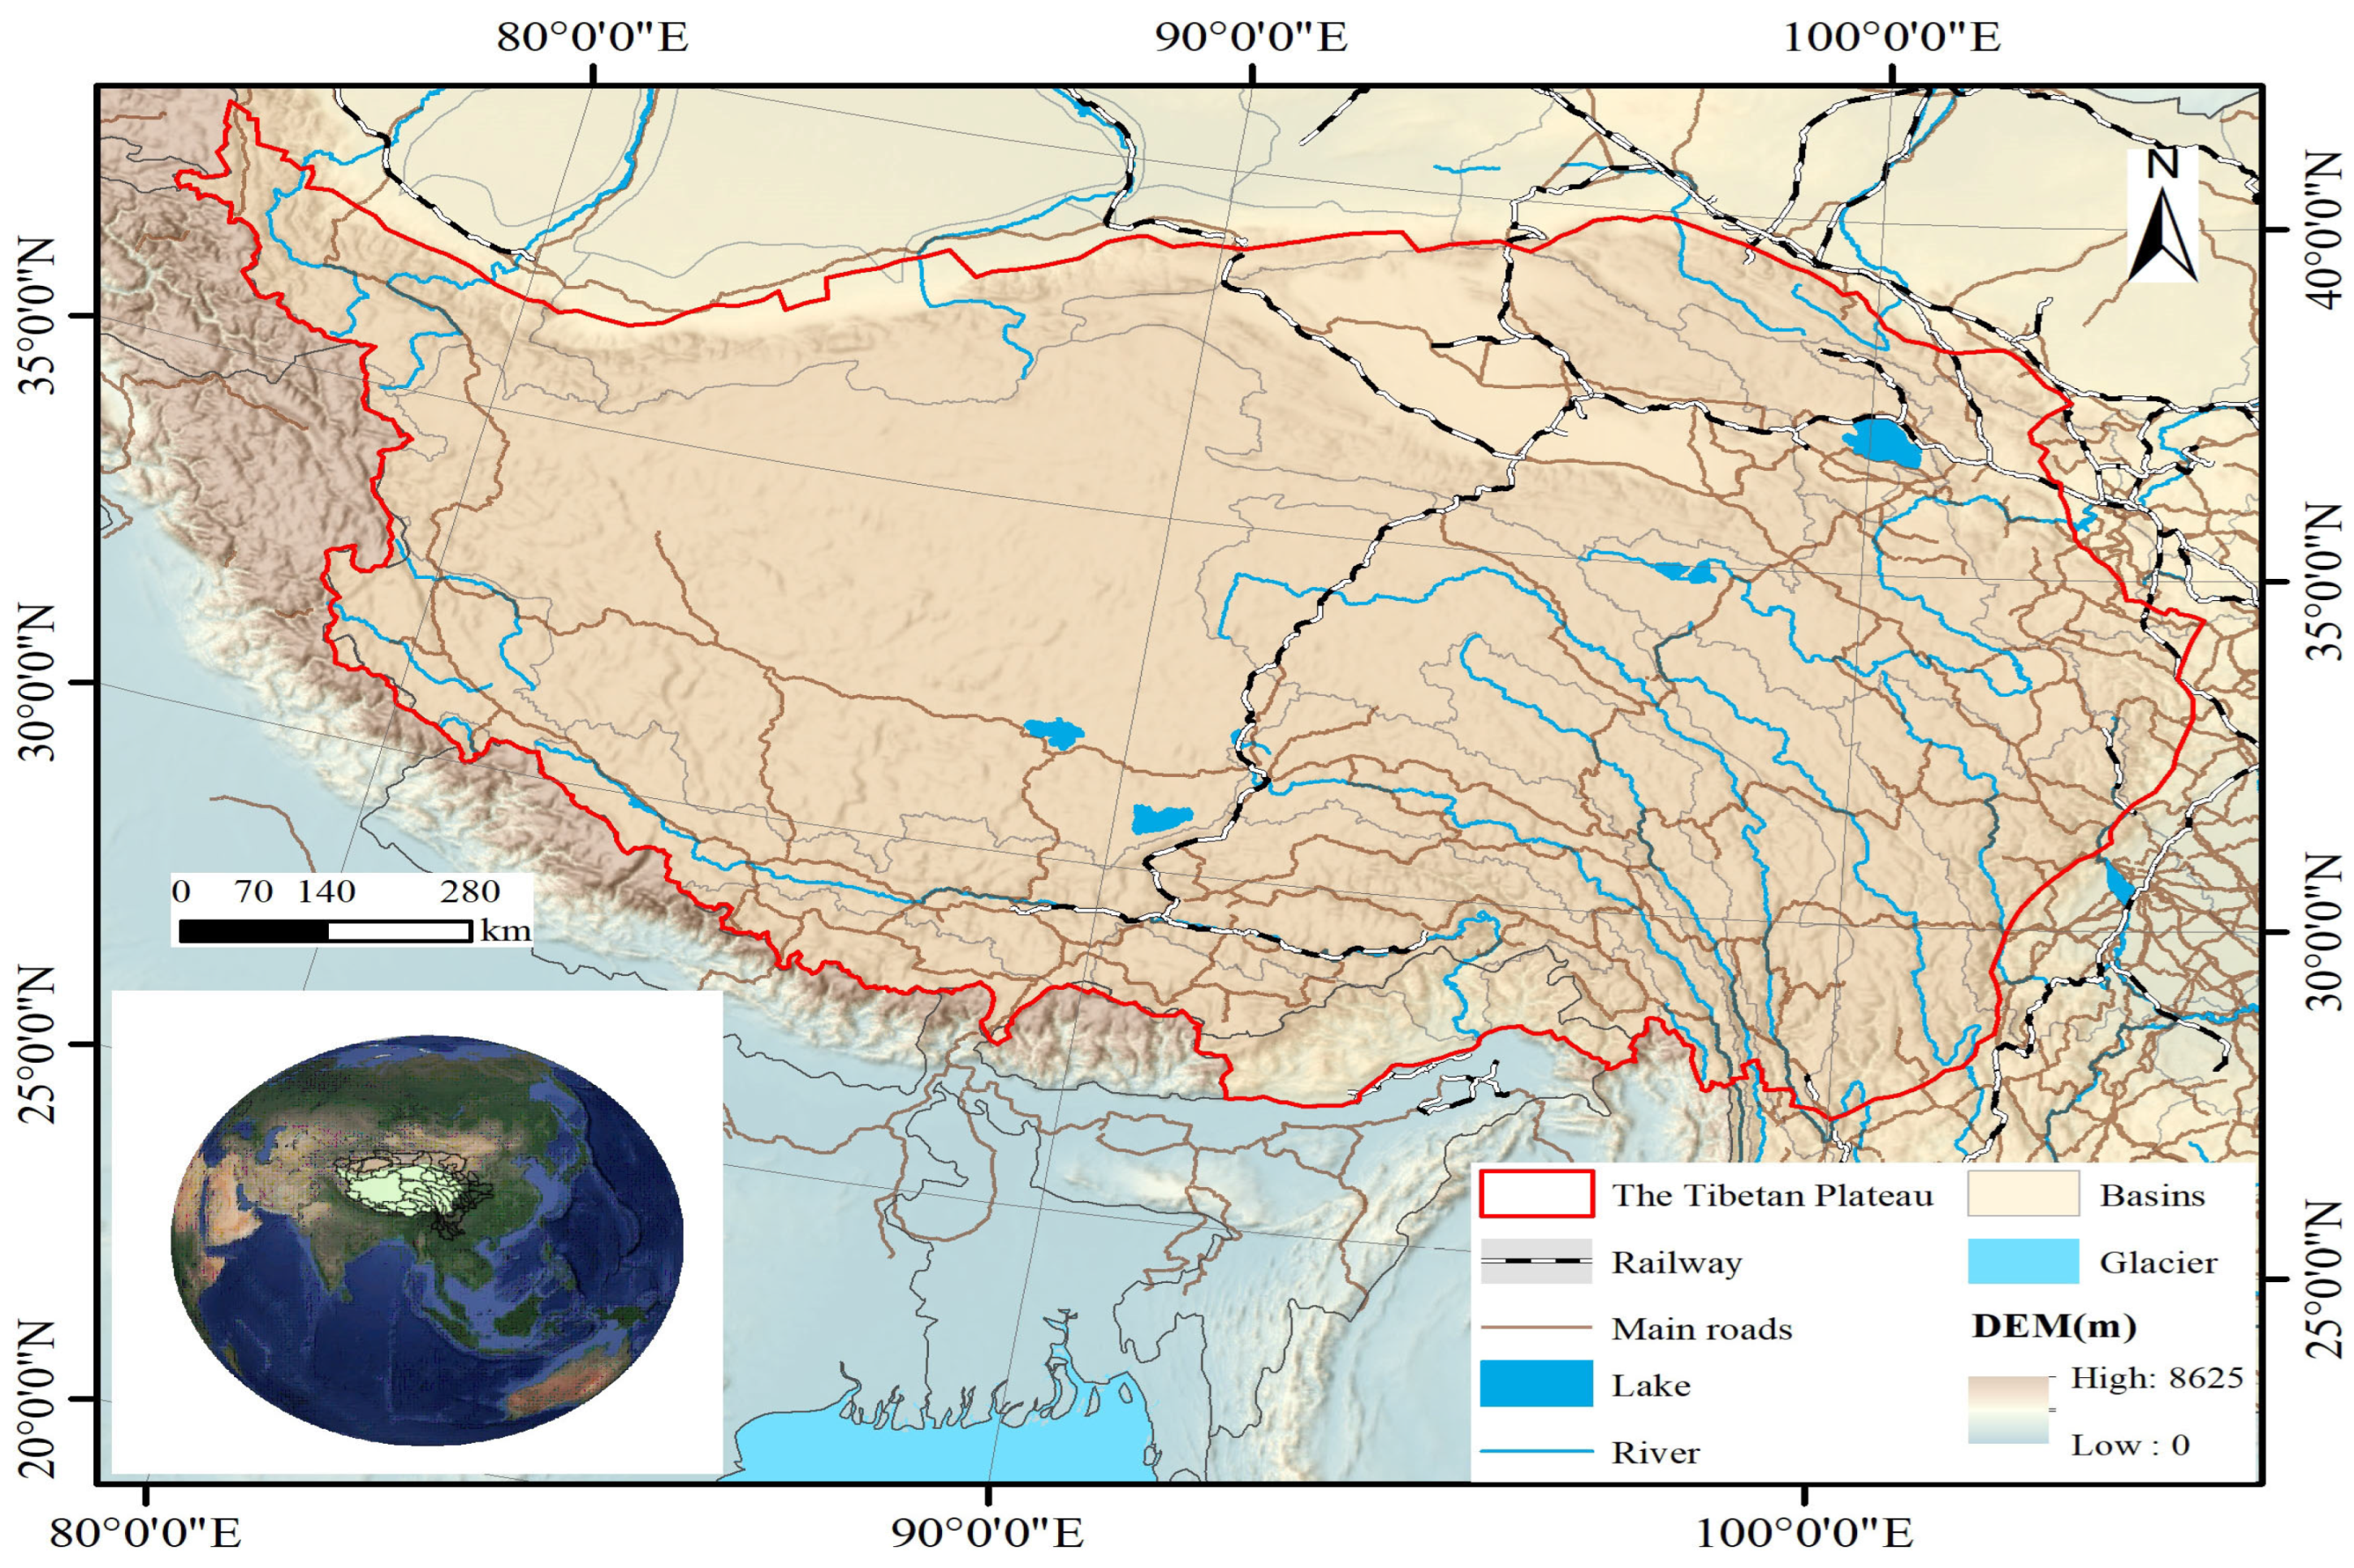
As shown in Figure 1, the Qinghai–Tibetan Plateau covers approximately 2.615 million square kilometers in central Asia, bordered by mainland China to the east, the Himalayas to the south and west, and the Kunlun Mountains to the north. With an average elevation above 4000 m, it is the highest and one of the largest high-altitude regions in the world. Affected by the southwest monsoon, the plateau has a distinct seasonal climate: warm and humid summers that support vegetation growth, and cold and dry winters [24]. It has experienced significant warming in recent decades [25], accompanied by substantial spatiotemporal variations in precipitation that strongly affect vegetation productivity [26]. Alpine grasslands and meadows are the dominant vegetation types, forming the core of the plateau’s ecosystem [27]. Due to its high sensitivity to climate change and human activities, the Qinghai–Tibetan Plateau serves as a key natural laboratory for studying vegetation dynamics under global change.
Figure 1.
Study area.
2.2. Data Sources and Description
Table 1 outlines the comprehensive suite of variables utilized in this study. The MOD13Q1 NDVI dataset was retrieved and processed via the Google Earth Engine (GEE) platform. Sourced from NASA’s Moderate Resolution Imaging Spectroradiometer (MODIS), this product offers global coverage at a 250-m spatial resolution and a 16-day temporal interval. Because the MOD13Q1 product undergoes rigorous radiometric and atmospheric corrections to mitigate aerosols, water vapor, and cloud contamination, it provides exceptional data fidelity and remains a benchmark for tracking long-term vegetation dynamics and environmental shifts [28,29].
Table 1.
The primary data sources used in this research.
The temporal scope of this study targeted the core growing season (May–September) across the Qinghai–Tibetan Plateau from 2000 to 2020. Preprocessing within GEE was executed to ensure methodological uniformity. This workflow involved stringent cloud-masking to eliminate residual atmospheric noise, seasonal filtering to capture peak phenological signals, and spatial interpolation to reconstruct missing data and ensure spatial continuity. These steps optimized the signal-to-noise ratio of the NDVI time series, enabling a high-fidelity diagnostic analysis of long-term trends and spatial heterogeneity.
To robustly disentangle the driving mechanisms of vegetation dynamics, eleven explanatory variables capturing biophysical and anthropogenic gradients were compiled. Biophysical factors included key meteorological variables (annual mean temperature and annual precipitation), topographic attributes (elevation, slope, and aspect), proximity to river networks, landform categories, vegetation types, and edaphic properties. Anthropogenic footprints were proxied by density and proximity indicators of roads and human settlements. All data layers were systematically harmonized to a common grid; they were projected to the WGS_1984_UTM_Zone_48N coordinate system and resampled to a uniform pixel size of 250 m × 250 m. This standardized integration guaranteed data interoperability and enhanced the statistical reliability of the subsequent modeling.
Meteorological fields, originally acquired at a 1-km resolution, were downscaled to 250 m using bilinear interpolation—a standard practice for continuous climate surfaces that preserves regional gradients while precluding the introduction of artificial high-frequency noise. This interpolation approach is conservative and avoids generating spurious spatial clustering, as it smoothly interpolates values rather than creating independent spatial structures. Furthermore, because climatic gradients vary smoothly across the alpine expanses of the plateau, and our spatial autocorrelation and pixel-wise regressions capitalize on structurally aggregated spatial covariance rather than localized micro-scale noise, this downscaling step does not bias the attribution results.
2.3. Methods
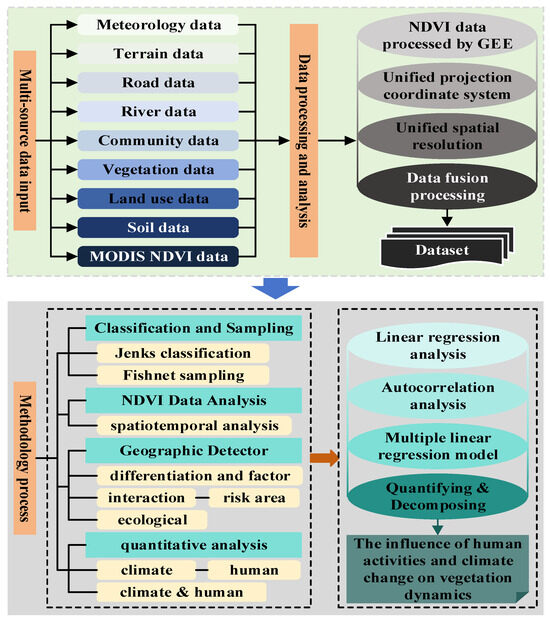
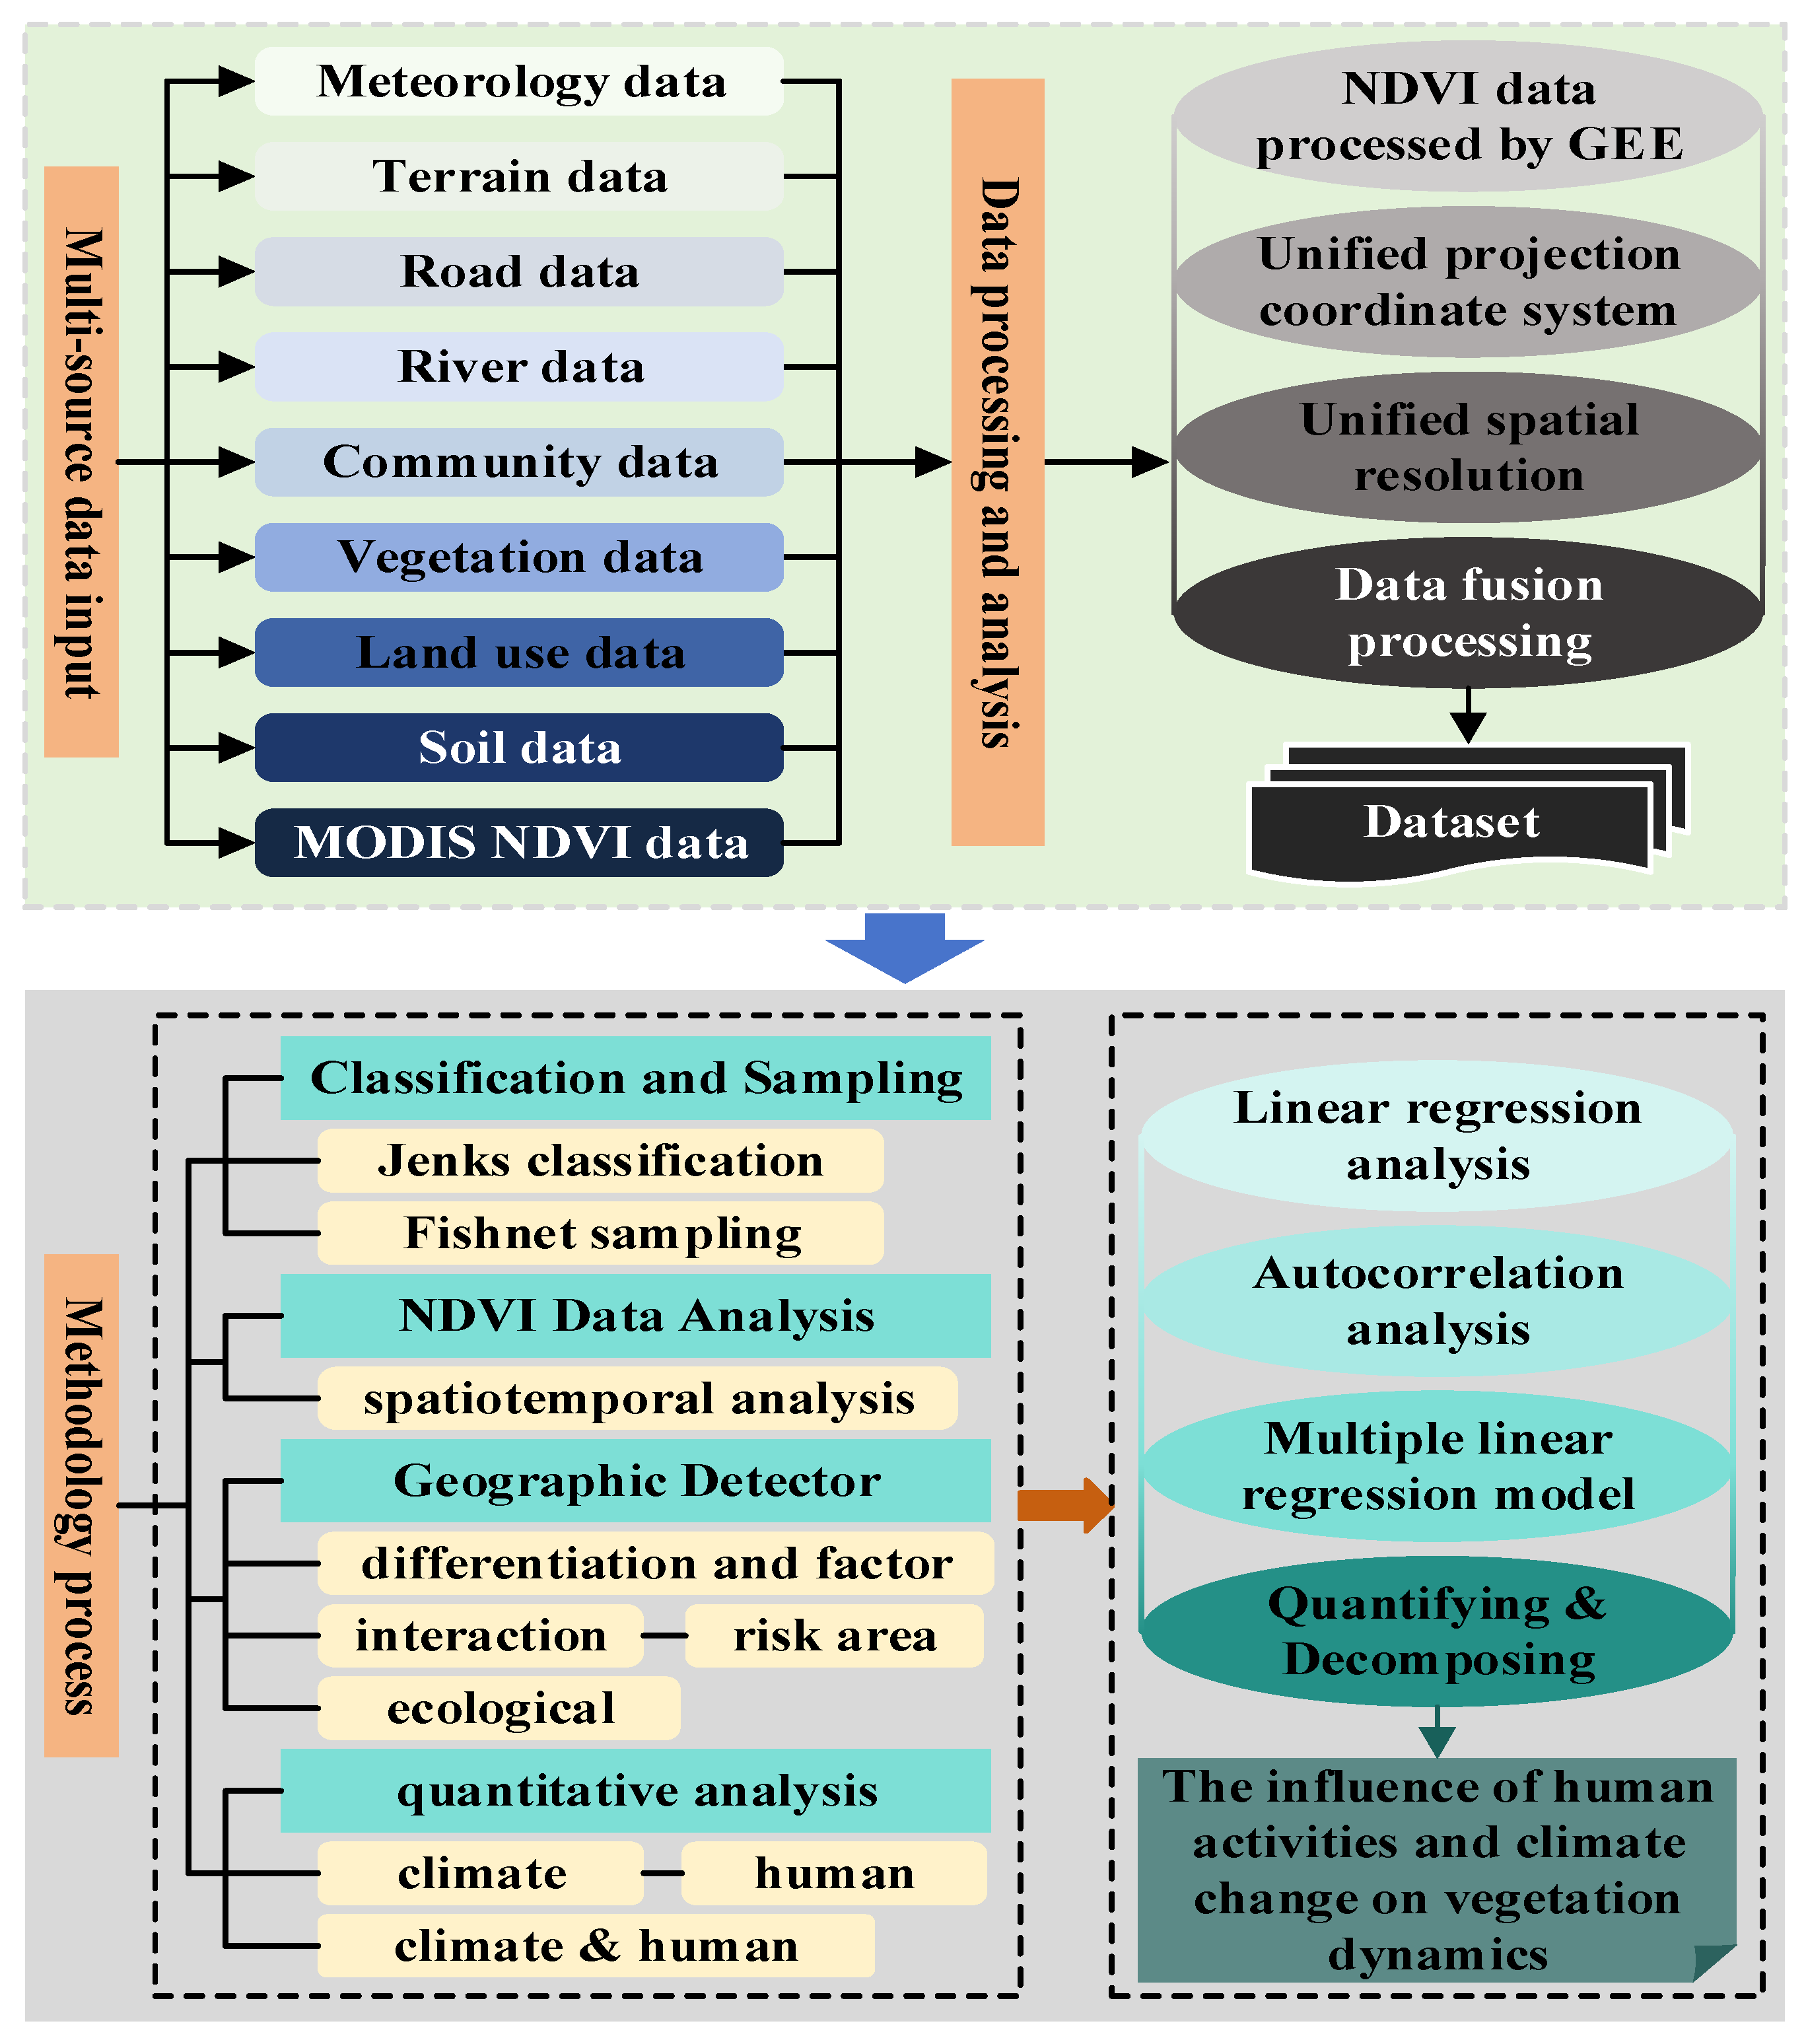
As illustrated in Figure 2, we developed a multi-stage framework to decouple the climatic and anthropogenic drivers of vegetation dynamics across the Qinghai–Tibetan Plateau (QTP). This workflow comprises four core components:
Figure 2.
Main Technical Roadmap of This Study.
(i) Spatial Stratification and Sampling Design
To build a robust sampling matrix, continuous environmental and anthropogenic factors were stratified using the Jenks natural breaks method. A regular 3 km × 3 km fishnet grid (294,783 nodes) was generated to extract all explanatory variables. Pixel-level NDVI data were then aggregated to this grid scale using mean statistics, and both global and local Moran’s indices were calculated to diagnose macro-scale and localized spatial clustering patterns.
(ii) Spatiotemporal NDVI Trend Analysis
Long-term vegetation trajectories were monitored using monthly growing-season (May–September, 2000–2020) MODIS NDVI data. Pixel-wise linear regression and trend analysis were executed to capture interannual fluctuations and long-term trajectories of vegetation greenness, providing an empirical baseline for subsequent driver attribution.
(iii) GeoDetector Modeling of Spatial Heterogeneity
The GeoDetector framework was implemented via four integrated modules to quantify the factors governing spatial NDVI heterogeneity. Specifically, the factor detector measured the independent explanatory power of individual variables, while the interaction detector evaluated synergistic or antagonistic effects between paired drivers. Concurrently, the risk detector compared mean NDVI values across stratified zones to identify optimal environmental ranges, and the ecological detector assessed whether the statistical differences in explanatory power between drivers were significant.
(iv) Quantitative Attribution of Climatic and Anthropogenic Drivers
A dual-tiered attribution protocol was established to separate climatic and human impacts. First, utilizing multi-temporal land-use data (1995–2020), pixels were dichotomized into pristine natural vegetation (climate-controlled baseline) and mixed-influence zones (co-regulated by climate and human activity). Second, the climatic contribution was isolated via pixel-by-pixel regression by multiplying NDVI sensitivity to weather variables by their long-term climate trends. The residual trend between the observed and climate-driven NDVI was then isolated and attributed to human activities.
2.3.1. Linear Regression Analysis
Linear regression equation [39]
A positive slope derived from the linear regression model indicates an increasing NDVI trend, reflecting enhanced vegetation greenness over the period 2000–2020. In contrast, a negative slope denotes a declining trend, suggesting vegetation degradation or reduced greenness during the same interval. By applying pixel-wise linear regression to the NDVI time series, spatially explicit trend coefficients were generated across the entire Tibetan Plateau. This approach enabled the systematic quantification of vegetation dynamics at fine spatial resolution, providing a robust empirical basis for assessing long-term ecological change and spatial heterogeneity in alpine ecosystems.
2.3.2. Autocorrelation Analysis
Autocorrelation analysis is a rigorous and widely applied statistical approach for detecting serial dependence in time series data [40]. When applied to vegetation indices such as NDVI, it enables the identification of temporal persistence, cyclical behavior, and long-term evolutionary patterns within the dataset. Assessing the autocorrelation structure of NDVI time series over the Tibetan Plateau facilitates the detection of intrinsic growth rhythms, potential lag effects, and sustained directional changes, thereby offering deeper insight into the temporal dynamics of alpine vegetation systems.
By quantifying the degree of correlation between observations separated by specific time lags, autocorrelation analysis reveals whether current vegetation conditions are significantly influenced by preceding states. This provides an essential basis for distinguishing stochastic fluctuations from structured temporal processes. The mathematical formulation adopted in this study follows [41]:
The equation describes the calculation of NDVI changes by considering the spatial weight matrix and evaluates these changes by comparing the NDVI values of each sampling point with the overall mean. An alternative expression is that signifies the spatial weight matrix, and represent the NDVI values at the ith and jth sampling points, n is the total sample count, and is the mean value of variable x. Essentially, this equation describes the assessment of NDVI changes by incorporating the spatial weight matrix and comparing the NDVI values of each sampling point with the overall mean.
2.3.3. Multiple Linear Regression Model
Multiple Linear Regression (MLR) is a well-established statistical framework designed to quantify the relationship between a single dependent variable and multiple independent variables [42]. By constructing a linear equation that simultaneously incorporates several predictors, the model enables the evaluation of both individual and joint effects of explanatory variables on the response variable. This approach is particularly effective in multivariate contexts, where complex interactions and confounding influences must be disentangled to obtain robust inferences.
MLR has been widely applied in environmental and ecological research for predictive modeling, explanatory analysis, and the assessment of variability within multidimensional datasets. Its capacity to integrate diverse climatic, topographic, and anthropogenic factors provides a systematic analytical framework for understanding the relative contributions and interactions among driving forces.
In the present study, the multiple linear regression model was formulated as follows:
To quantify the relationship between NDVI (dependent variable) and key climatic factors—precipitation and temperature (independent variables)—a multiple linear regression framework was implemented to estimate the regression coefficients (a, b, and c) at the pixel scale. This approach enables the explicit characterization of the sensitivity of vegetation greenness to climatic variability.
Given the pronounced spatial heterogeneity of vegetation responses across the Tibetan Plateau, it is critical to account for local ecological and climatic differences. Vegetation types, elevation gradients, hydrothermal conditions, and soil properties may substantially influence the magnitude and direction of NDVI responses to temperature and precipitation. To ensure spatial consistency and analytical precision, precipitation and temperature datasets were resampled to align with the 250 m spatial resolution of the NDVI product. Subsequently, pixel-wise regression modeling was conducted, generating location-specific regression parameters.
This spatially explicit modeling strategy effectively constructs an individualized linear relationship for each pixel, thereby accommodating local variability in climate–vegetation interactions. Such an approach enhances predictive accuracy and strengthens the robustness of inference regarding the climatic drivers of vegetation dynamics.
2.3.4. Geographical Detector
The Geographic Detector is a spatial statistical framework specifically designed to quantify spatial stratified heterogeneity and to identify the driving forces underlying observed spatial patterns [43]. Its fundamental premise is that, if an explanatory variable exerts a significant influence on a dependent variable, the spatial distributions of the two variables should exhibit a high degree of concordance. By evaluating the consistency between spatial stratification of explanatory factors and the distribution of the response variable, the method provides a robust means of attributing spatial variability to potential drivers.
A key advantage of the Geographic Detector lies in its applicability to both numerical and categorical variables, without requiring strict assumptions of linearity or normality. Moreover, it enables the assessment of interaction effects between pairs of factors, thereby facilitating the exploration of synergistic, independent, or antagonistic relationships. Through the comparison of explanatory power from individual factors and their combined effects, the method identifies dominant drivers and characterizes the strength and pattern of interactions [44]. The Geographic Detector framework comprises four complementary components: the factor detector (and differentiation detector), the interaction detector, the risk detector, and the ecological detector. These modules collectively evaluate the explanatory capacity of individual variables, the enhancement or weakening effects of factor interactions, the differences in risk levels across strata, and the statistical significance of differences between factors. These detectors function based on the following formulas [45]:
Factor detector:
In the Geographic Detector framework, the statistic q represents the explanatory power of a given driving factor with respect to the spatial variation in NDVI. Let N denote the total number of samples within the study area, and represent the number of samples within stratum (category) h of factor X. The term refers to the variance of the dependent variable (NDVI) across the entire study region, while denotes the variance of NDVI within stratum h of factor X. Through comparison of within-stratum and overall variance, the q statistic quantifies the degree to which a factor explains the spatial stratified heterogeneity of NDVI.
The interaction detector component of the Geographic Detector is specifically designed to assess whether two independent variables (risk factors) jointly enhance or weaken their explanatory effects on the spatial differentiation of the dependent variable [46]. By comparing the explanatory power of individual factors ( and ) with that of their intersection , the method identifies both the strength and the form (linear or nonlinear) of interaction effects.
The interaction types are interpreted as follows [47].
If , the interaction exhibits nonlinear enhancement, indicating that the combined effect exceeds the sum of individual contributions.
If , the two factors are considered independent, with additive effects.
If , a dual-factor enhancement is present, meaning the interaction strengthens explanatory power beyond either factor alone.
If ,, the result indicates single-factor nonlinear attenuation, where the interaction reduces the dominance of the stronger factor.
If , the interaction reflects nonlinear weakening, suggesting mutual suppression of explanatory effects.
Here, and denote the explanatory power of factors and on the dependent variable Y, respectively, while represents the explanatory power of their combined stratification. This interaction-based interpretation provides a rigorous statistical basis for identifying synergistic or antagonistic mechanisms among climatic, topographic, edaphic, and anthropogenic drivers, thereby deepening the understanding of complex spatial processes governing NDVI variability.
Risk detector:
Ecological detector [48]:
The ecological sensor can assess whether there is a noteworthy disparity in the influence of any two variables, and , on the spatial arrangement of NDVI, with the test employed for quantification.
2.3.5. Quantifying and Decomposing the Influence of Human Activities and Climate Change on Vegetation Dynamics
Based on multi-temporal Land Use and Land Cover (LULC) datasets from 1995 to 2020, vegetation was classified into two categories for attribution analysis: Vclimate, representing natural vegetation primarily influenced by climate variability and excluding farmland, non-vegetated areas, and regions experiencing vegetation-type conversion, and Vclimate + human, comprising all remaining vegetated areas affected by both climate change and human activities. A trend-based NDVI attribution framework was then applied to quantify the contributions of temperature and precipitation. Specifically, the climatic contribution was estimated by multiplying the regression coefficient between NDVI and each climatic variable by the corresponding temporal trend slope of that variable, thereby enabling a process-based assessment of climate-driven vegetation change at a fine spatial resolution
Through the integration of LULC-based classification and regression-based trend attribution, the methodology effectively disentangles the relative influences of climate change and human activities on vegetation dynamics. This framework provides a robust basis for diagnosing the dominant drivers of ecosystem change and supports more accurate environmental assessments. Such an approach is essential for informing adaptive ecosystem management and conservation strategies under ongoing climatic shifts and intensifying anthropogenic pressures.
In this analytical framework, denotes the long-term trend of NDVI derived from linear regression over the study period. The terms represent the respective contributions of temperature and precipitation to annual NDVI variation. Here, n denotes the total number of study years. The contribution of temperature to NDVI change, , is quantified using a slope-based decomposition approach that integrates two regression components: and . Specifically, corresponds to the slope of the linear regression between NDVI and temperature, reflecting the sensitivity of vegetation greenness to thermal variability. Similarly, denotes the contribution of precipitation to annual NDVI variation and is calculated using the regression slope between NDVI and precipitation () multiplied by the temporal trend in precipitation (). Through this formulation, the relative influence of hydrothermal drivers on vegetation dynamics can be quantitatively partitioned.
It is worth noting that while Equation (8) relies on a first-order partial derivative framework—which assumes linear additivity for temporal trend decomposition—this approach functions as a foundational baseline to quantitatively segregate the generalized multi-year climatic background from the remaining residuals at a pixel level. This temporal trend decomposition fundamentally complements, rather than contradicts, the nonlinear synergistic interactions highlighted by the GeoDetector modeling. While the linear regression architecture characterizes the broad-scale, long-term average sensitivity of NDVI to separate hydrothermal inputs over time, it does not imply that the spatial alignment of ecological drivers is strictly linear. In fact, environmental factors exhibit strong spatial stratified heterogeneity across the complex terrains of the QTP. The GeoDetector effectively captures these cross-sectional, spatial mechanics where paired variables (e.g., elevation–temperature) mutually amplify their explanatory power in a nonlinear fashion. Therefore, coupling the linear-based RESTREND for temporal partitioning with the non-linear GeoDetector for spatial interaction mapping establishes a robust, dual-dimensional framework that successfully uncovers both the quantitative trends and the complex, synergistic spatial constraints governing alpine vegetation dynamics.
3. Results
3.1. Spatial Variations in Vegetation on the Qinghai–Tibet Plateau
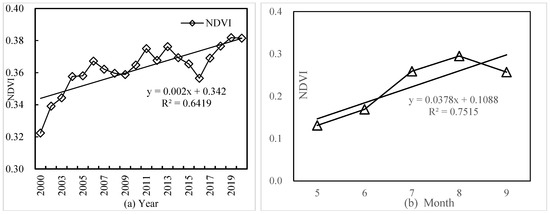
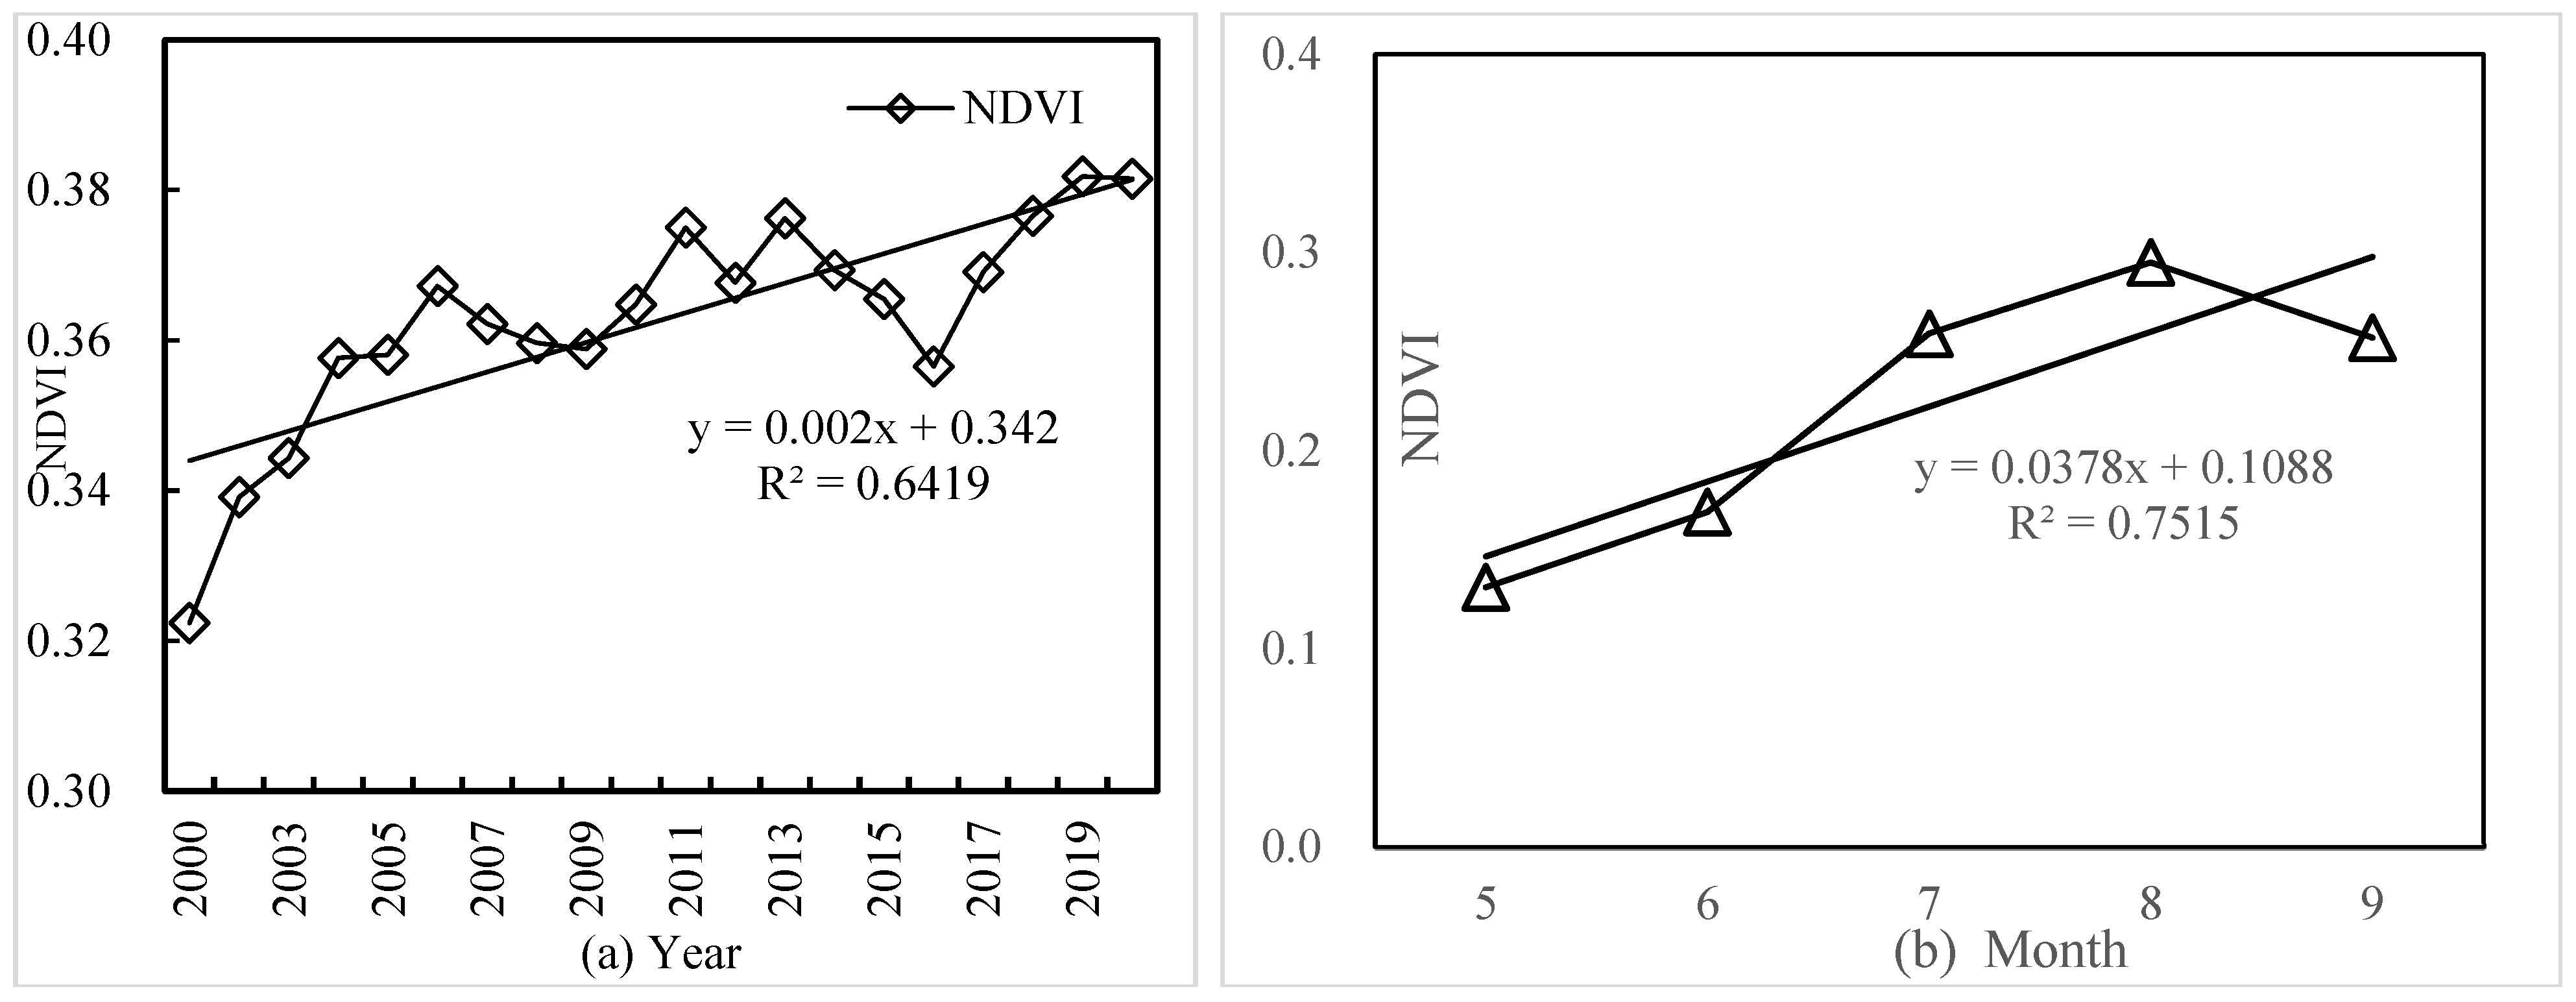
Figure 3 illustrates the interannual dynamics of mean NDVI across the Qinghai–Tibetan Plateau (QTP) during the growing seasons from 2000 to 2020. Overall, NDVI exhibited a fluctuating but statistically significant upward trend, with an R2 value of 0.6419, indicating moderate temporal explanatory power. The multi-year mean NDVI was 0.332, peaking at 0.362 in 2012 and reaching a minimum of 0.322 in 2000.
Figure 3.
Trends in Avg. NDVI on Qinghai–Tibetan Plateau, 2000–2020 ((a) Annual; (b) Monthly).
The temporal trajectory can be divided into three distinct phases. From 2000 to 2011, NDVI increased steadily, reflecting progressive enhancement of vegetation greenness. This was followed by a short-term decline between 2011 and 2015, after which NDVI resumed an upward trend during 2016–2020, indicative of a recovery phase. Despite these fluctuations, the amplitude of interannual variation remained relatively modest, suggesting a stabilizing influence of heterogeneous climate regimes, complex topography, and the inherently harsh alpine environment that limits vegetation productivity across the plateau.
At the intra-annual scale, NDVI during the growing season exhibited a pronounced seasonal pattern. Mean NDVI values increased progressively from May to August, followed by a decline thereafter. The lowest mean NDVI was observed in May (0.13), rising gradually through June and July to reach a peak in August (0.295). NDVI then decreased in September, corresponding with falling temperatures and the onset of vegetation senescence. This seasonal progression aligns with the phenological characteristics of alpine ecosystems and underscores the strong climatic regulation of vegetation growth, particularly by temperature and precipitation, in this high-elevation and environmentally sensitive region.
3.2. Autocorrelation of Vegetation on the Qinghai–Tibet Plateau
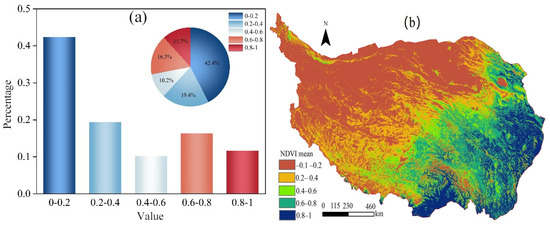
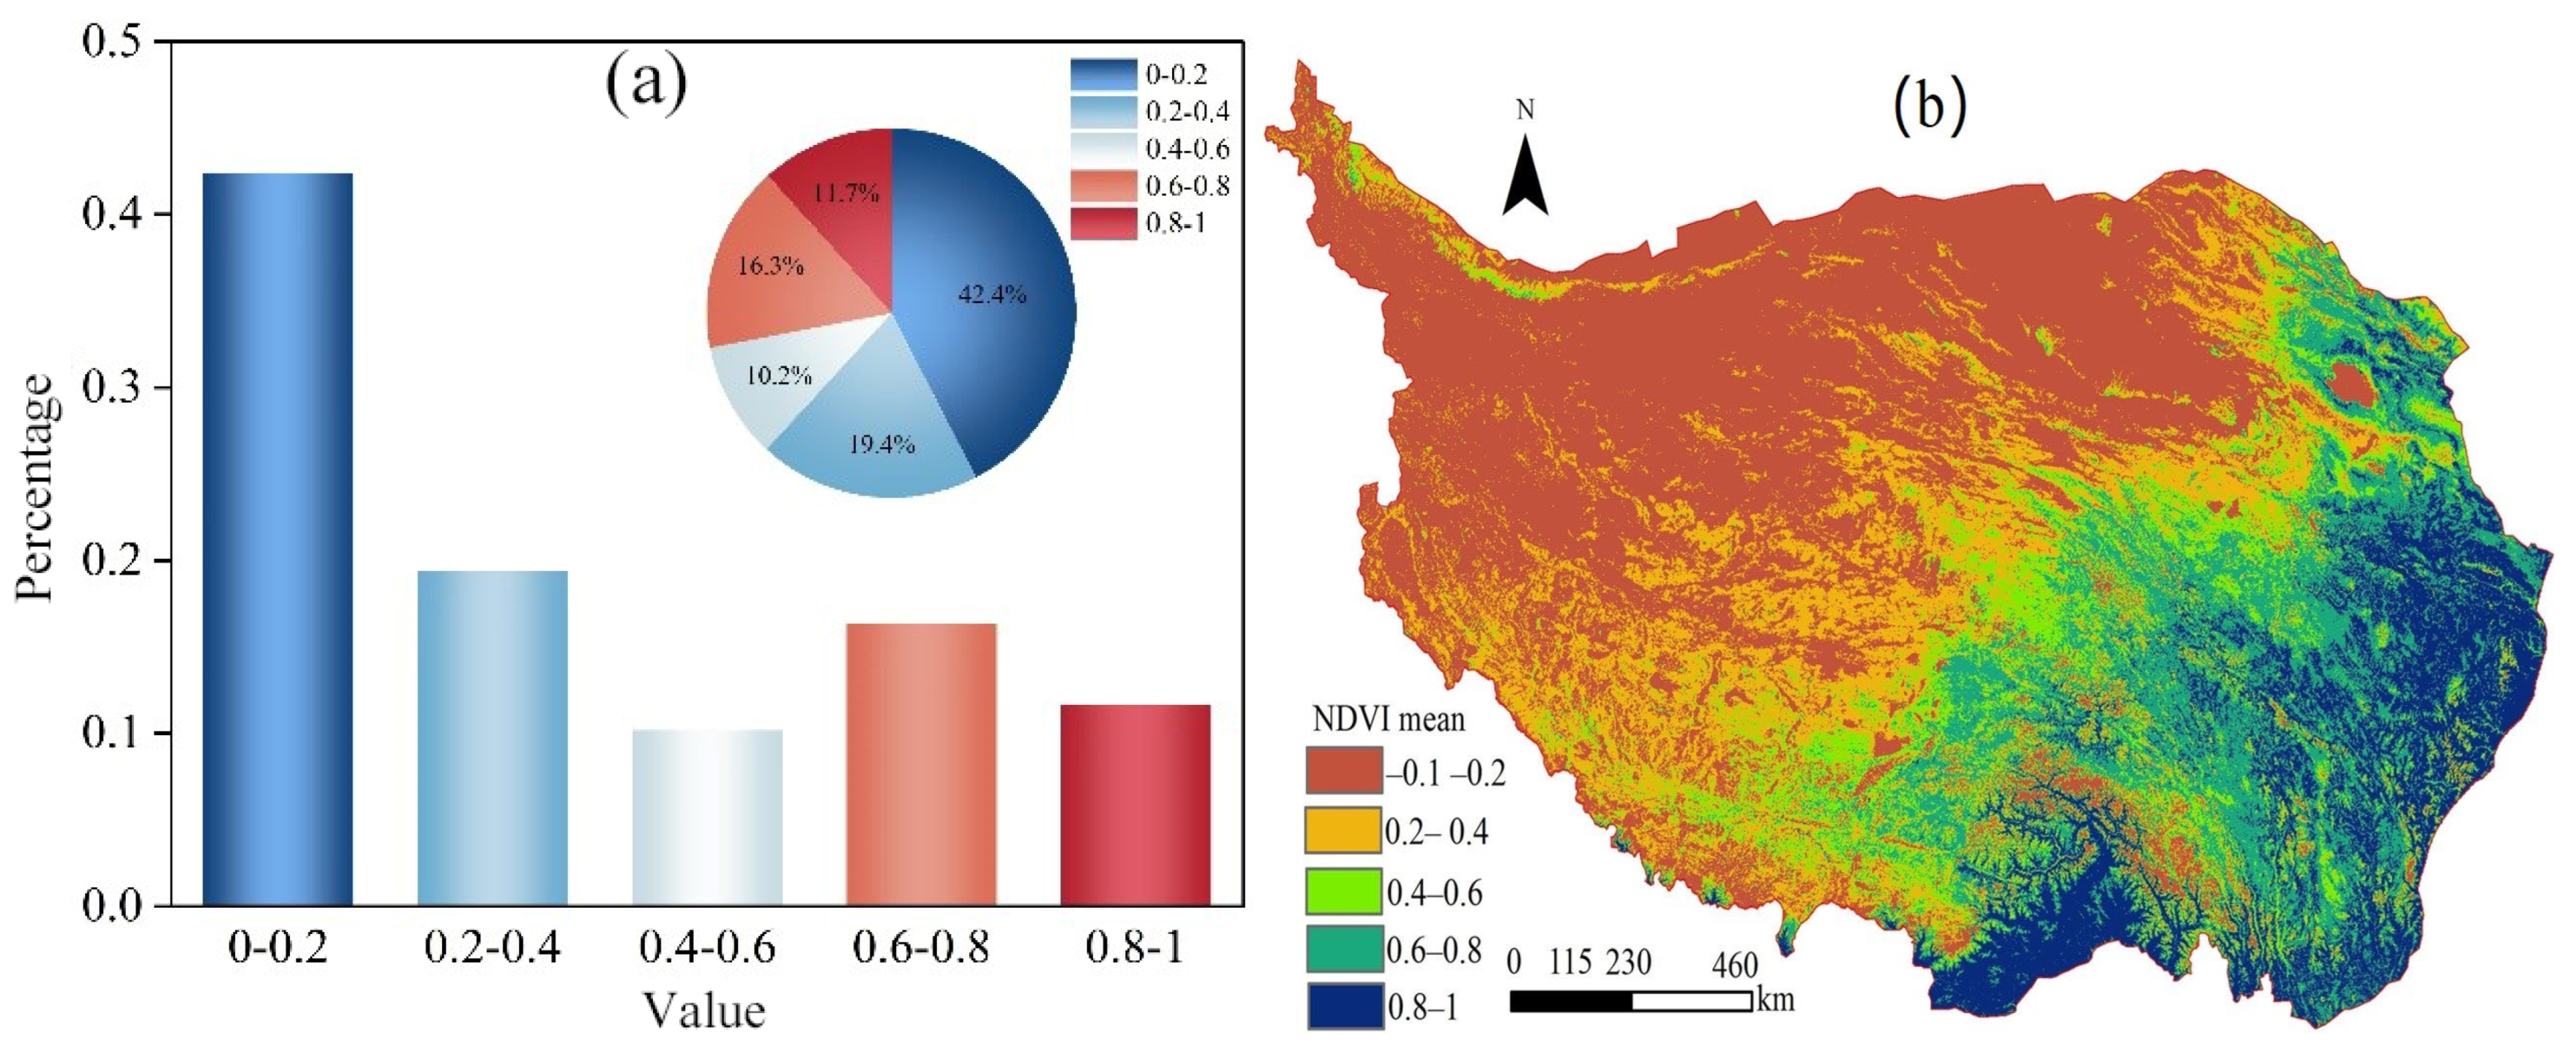
Figure 4 identifies a clear southeast-northwest gradient in NDVI distribution across the Qinghai–Tibet Plateau (QTP). NDVI decreases progressively from the humid, low-elevation southeast to the high-altitude, arid northwest. Dominated by meadows, grasslands and forest ecosystems, the southeastern plateau exhibits remarkably high NDVI, a pattern governed by superior hydrothermal conditions. Lower elevations mitigate the influence of cold air masses, bringing ample precipitation and moderate temperatures, which in turn support dense vegetation, vigorous photosynthesis and high biomass accumulation.
Figure 4.
Spatial Distribution of Average Annual NDVI on the Qinghai–Tibet Plateau. (a) Growing Season 2000–2020 & (b) NDVI Class Area Proportions.
Conversely, the northwestern and northern fringes of the QTP are typified by extreme elevations, cold deserts and water scarcity. These rigorous climatic and topographic conditions severely limit vegetation establishment and productivity, resulting in sparse plant cover and persistently low NDVI. The evident spatial gradient confirms that the combined effects of climate and topography control the large-scale vegetation distribution on the QTP.
Observed NDVI spatial heterogeneity embodies intricate couplings between environmental limitations and vegetation dynamics. Abundant hydrothermal supplies endow the southeastern region with high ecosystem productivity and resilience, as reflected by elevated NDVI. In the cold and arid northwest, low NDVI values suggest fragile ecological status. This spatial differentiation acts as a comprehensive proxy for alpine ecosystem function and stability, highlighting the fundamental role of environmental heterogeneity in regulating vegetation distribution, productivity and spatial autocorrelation over the plateau.
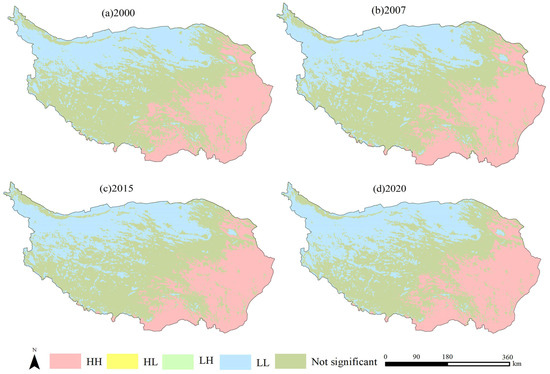
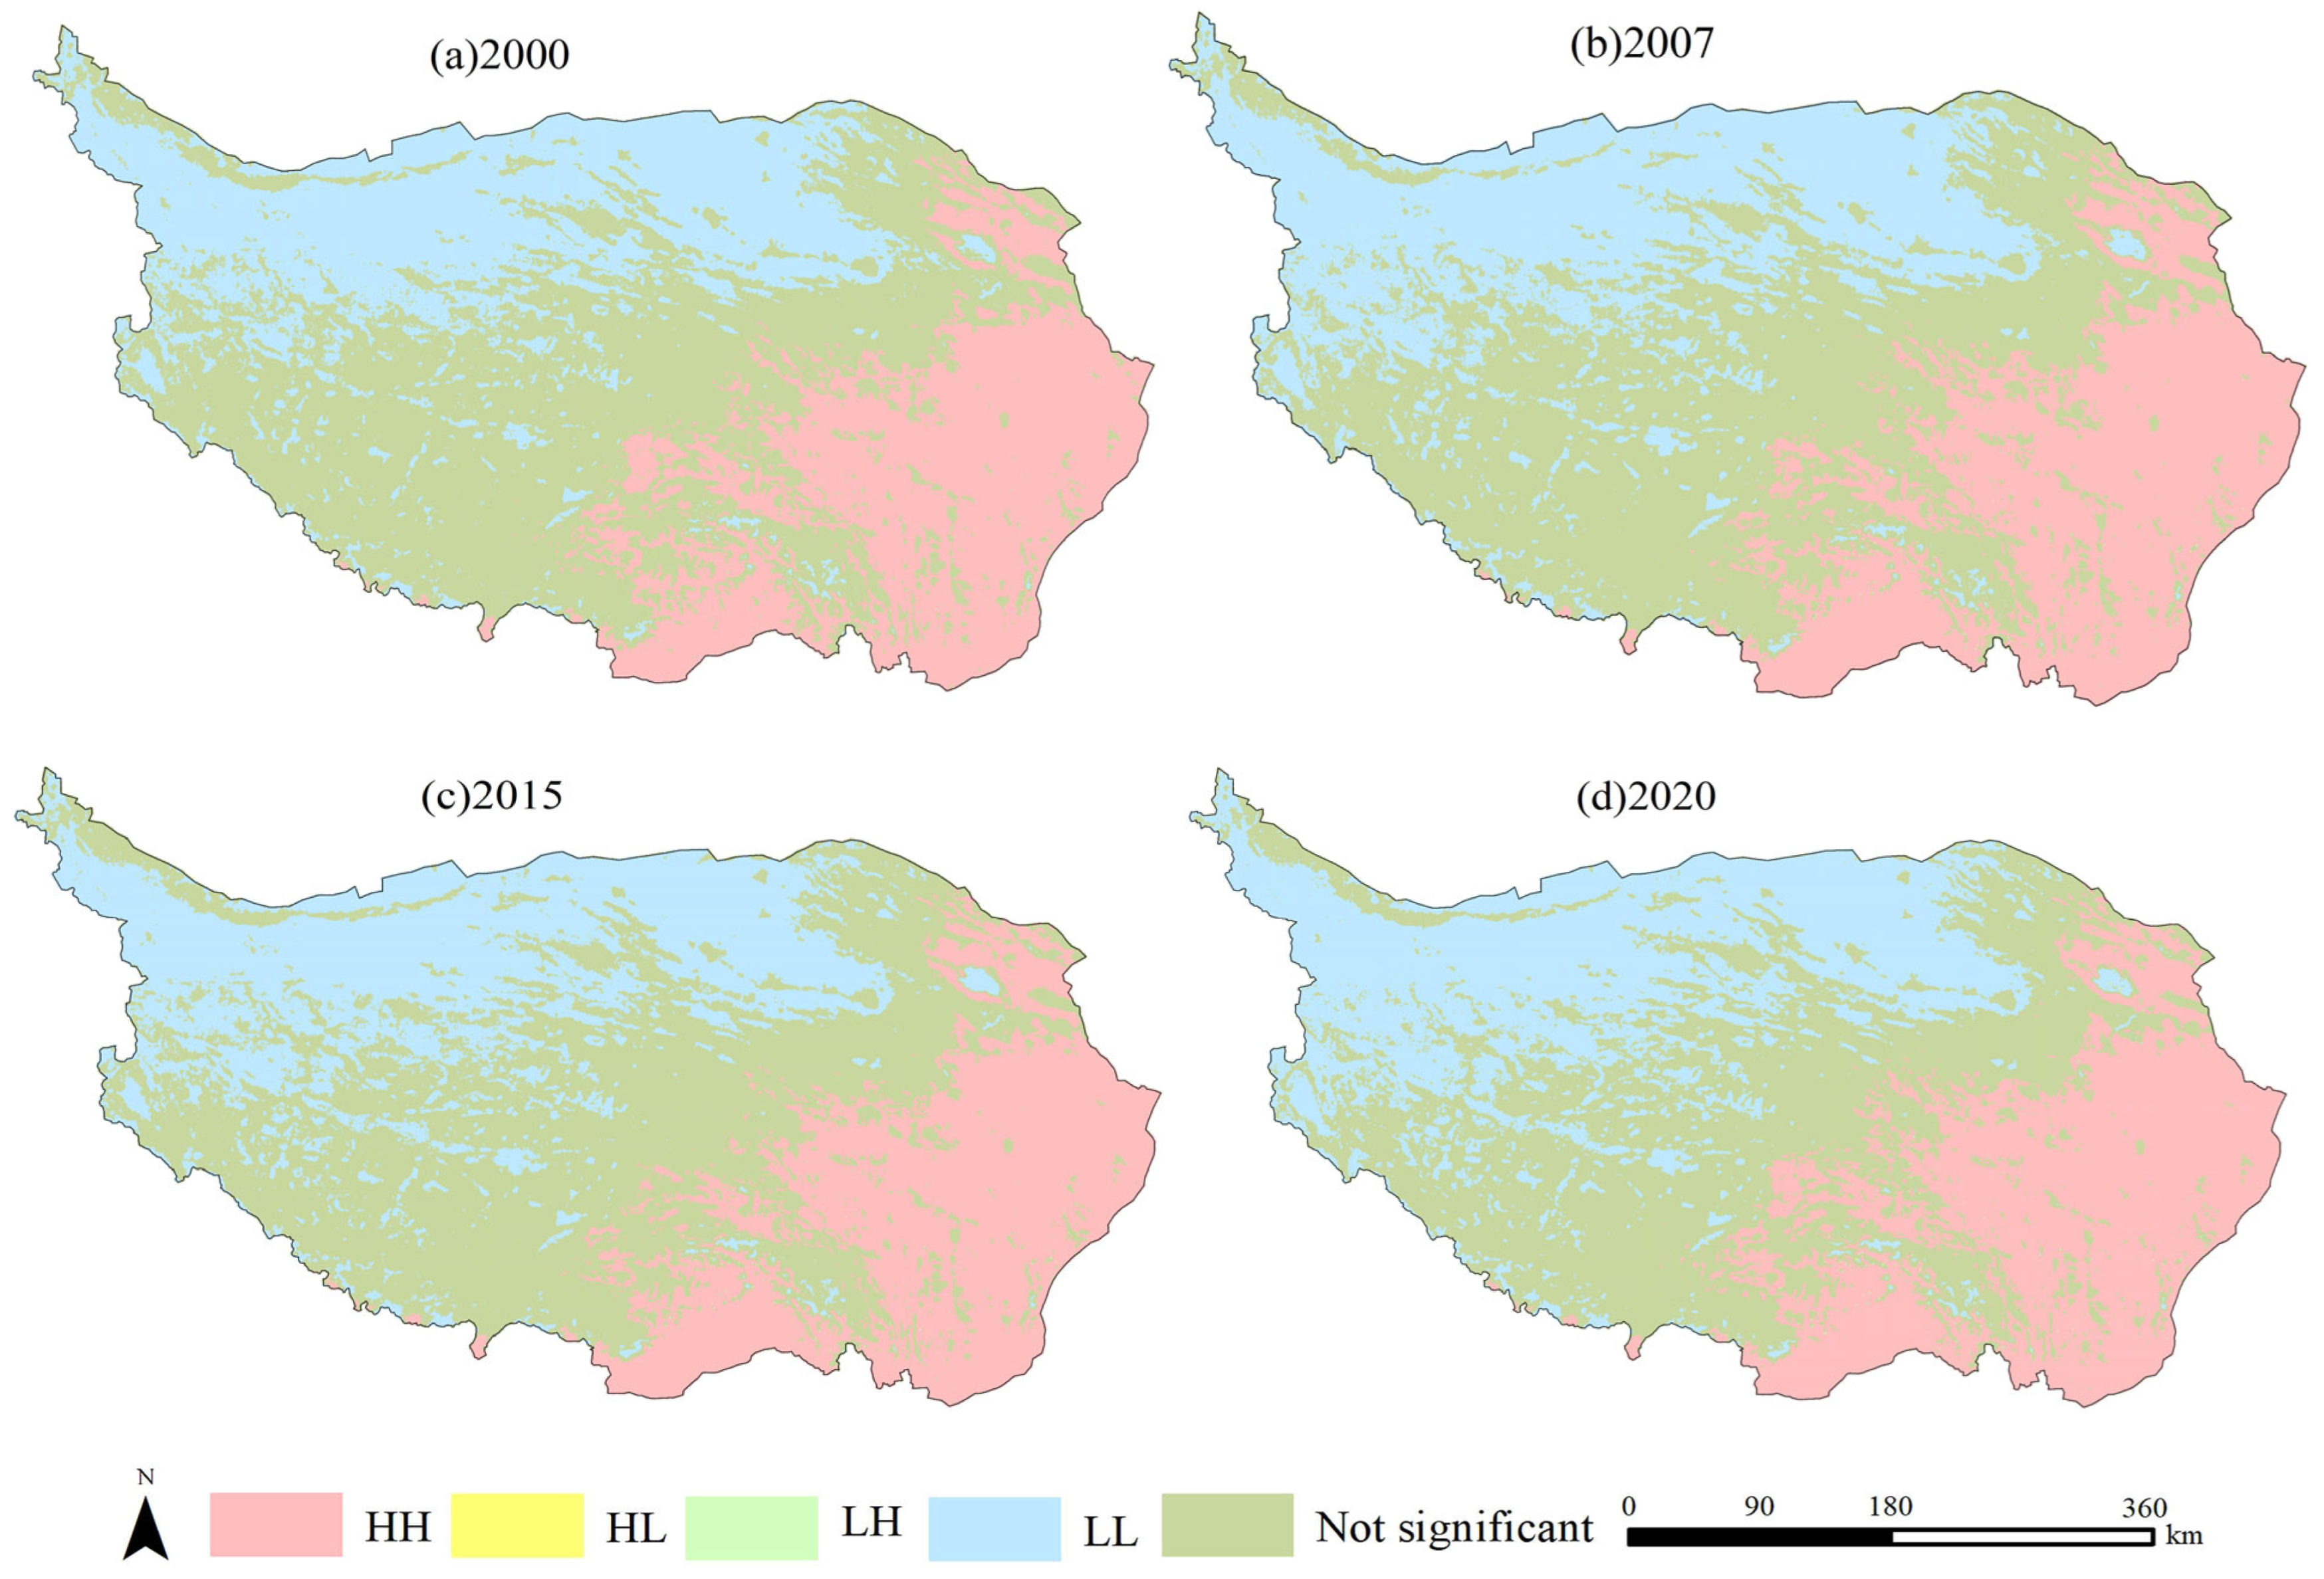
Figure 5 illustrates the spatial clustering patterns of vegetation conditions across the Qinghai–Tibetan Plateau (QTP). Pronounced spatial aggregation is evident, with “High–High” (HH) clusters concentrated in southeastern Tibet, southern Qinghai, and parts of Sichuan, where extensive grassland and forest ecosystems support dense vegetation cover. In contrast, “Low–Low” (LL) clusters dominate the northwestern Plateau, particularly southern Xinjiang and northern Qinghai, reflecting sparse vegetation under arid and high-elevation conditions.
Figure 5.
The LISA cluster maps of NDVI on the Qinghai–Tibet Plateau, 2000–2020 (HH and LL indicate clusters of similar values; HL and LH indicate opposite values to neighbors).
The distribution of HH and LL clusters corresponds closely with regional ecological restoration efforts. During 2001–2010, notable vegetation improvements occurred in the Sanjiangyuan region, the Qilian Mountains, and the eastern plateau, indicating the effectiveness of large-scale conservation programs. From 2011 to 2020, vegetation cover continued to improve in the northern plateau, particularly around the Qilian Mountains and the headwaters of the Yangtze and Lancang Rivers, suggesting sustained ecological benefits from long-term management measures.
Despite the overall greening trend, localized vegetation degradation was observed in the Qaidam Basin and parts of the Himalayan region, likely driven by increasing human pressures and climate change. Overall, the spatial clustering patterns reveal heterogeneous vegetation responses across the QTP and highlight the importance of continuous monitoring and region-specific management strategies to support long-term ecological security and sustainable development.
3.3. Identification of Driving Forces
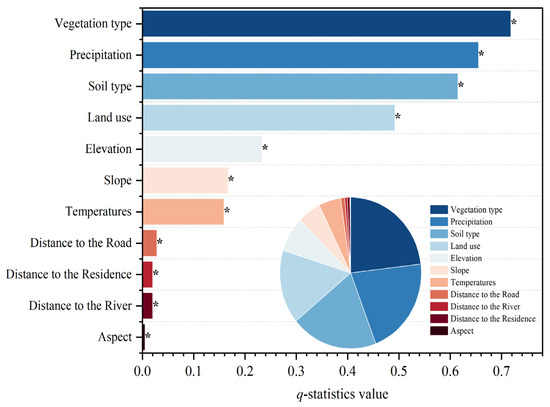
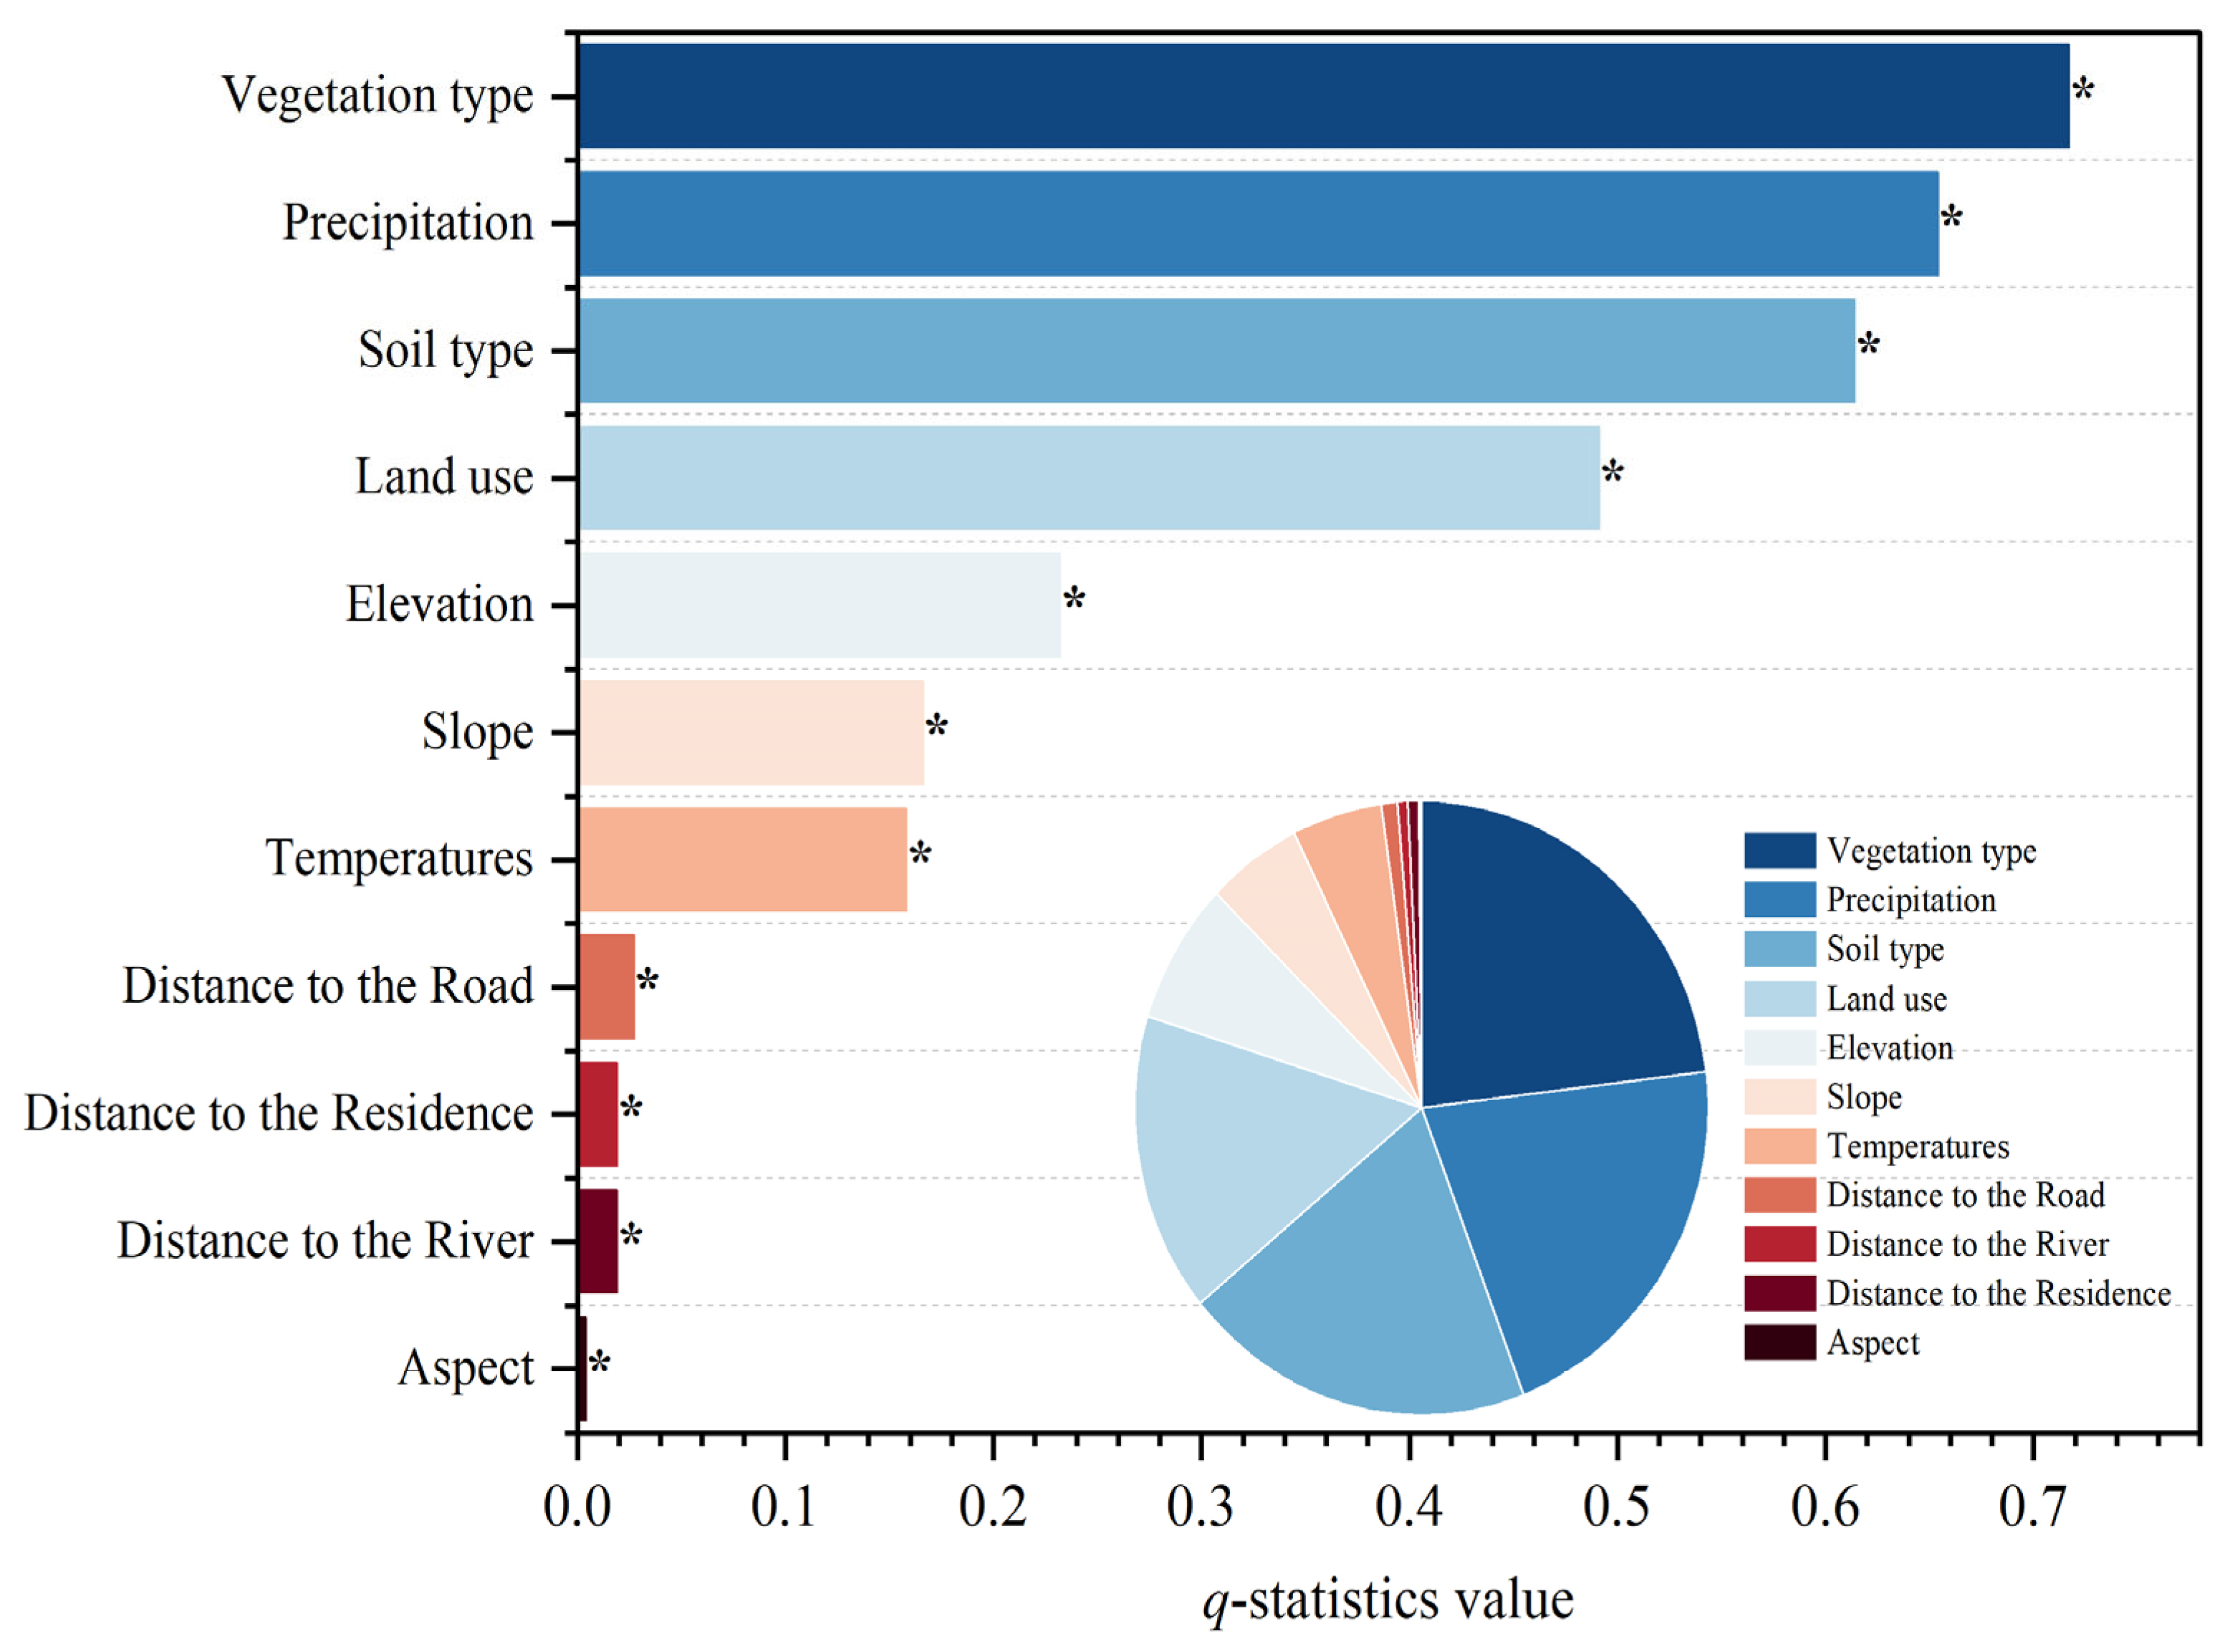
As illustrated in Figure 6, the GeoDetector approach was applied to quantitatively assess the explanatory power (q values) of major factors influencing the spatial heterogeneity of the Normalized Difference Vegetation Index (NDVI) across the Qinghai–Tibetan Plateau (QTP). The results demonstrate that all examined variables passed the significance test at the 95% confidence level, confirming the robustness and statistical reliability of the analysis. Among the tested factors, vegetation type, precipitation, soil type, land use, altitude, slope, and temperature exhibited comparatively high q values, identifying them as dominant determinants of NDVI variability. These findings indicate that vegetation productivity across the plateau is jointly regulated by intrinsic biophysical attributes (e.g., vegetation and soil types), climatic gradients (e.g., precipitation and temperature), and topographic conditions.
Figure 6.
Factor detection results of NDVI change.
Anthropogenic and proximity-related variables—including distance to residential areas, distance to rivers, and distance from roads—also displayed measurable explanatory power, suggesting that human activities exert indirect yet non-negligible influences on vegetation patterns. Such effects may operate through landscape fragmentation, resource accessibility, grazing intensity, infrastructure development, and microenvironmental modification. Although aspect is commonly regarded as an important control on vegetation growth due to its regulation of solar radiation and energy balance, its explanatory contribution in this study was relatively weak. This limited effect likely reflects the distinctive environmental context of the QTP, where extreme climatic constraints—such as low temperatures, limited moisture availability, and strong winds—may outweigh the influence of slope orientation on vegetation distribution.
Overall, the GeoDetector-based analysis provides a rigorous spatial-statistical assessment of the primary drivers shaping NDVI patterns across the QTP. The results highlight the coupled roles of natural environmental gradients and anthropogenic disturbances in structuring alpine vegetation dynamics. By clarifying the relative importance and hierarchical structure of these drivers, the findings offer critical insights into the mechanisms governing ecosystem variability and provide a scientific foundation for spatially targeted ecological conservation and sustainable land management strategies on the plateau.
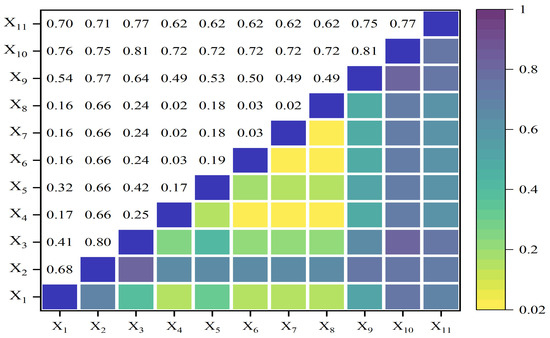
As shown in Figure 7, interaction detector results indicate that the explanatory power (q-values) of factor interactions is consistently greater than that of individual factors, demonstrating that NDVI variability across the Qinghai–Tibetan Plateau (QTP) is jointly controlled by multiple environmental drivers. Most factor combinations exhibit nonlinear enhancement, with their combined explanatory power exceeding the sum of individual effects. Strong enhancement effects were particularly evident for interactions involving vegetation type, soil type, elevation, and land use, highlighting the importance of coupled ecological and environmental controls on vegetation distribution.
Figure 7.
The interaction influence between factors on NDVI change (in the analysis, variables X1 to X11 cover diverse environmental factors including temperature, precipitation, elevation, aspect, slope, distance to roads, proximity to rivers, residential areas, land use, vegetation types, and soil characteristics, providing a thorough evaluation of the area’s ecological dynamics).
Nonlinear enhancement was also prominent in topographic–climatic interactions, especially for elevation–temperature, elevation–slope, elevation–aspect, and temperature–aspect combinations. These results indicate that topographic factors substantially strengthen the influence of climatic variables on NDVI patterns. Although slope and aspect showed relatively low explanatory power individually, their interactions with elevation and soil properties resulted in markedly higher q-values, revealing significant synergistic effects among environmental factors.
Anthropogenic variables further contributed to NDVI heterogeneity through their interactions with natural factors. Variables related to land use, roads, and settlements generally exhibited stronger explanatory power when combined with climatic, topographic, and soil factors than when considered independently. Overall, the prevalence of nonlinear enhancement demonstrates that vegetation variability on the QTP is shaped by the combined effects of climatic, topographic, edaphic, and anthropogenic factors rather than by any single driver.
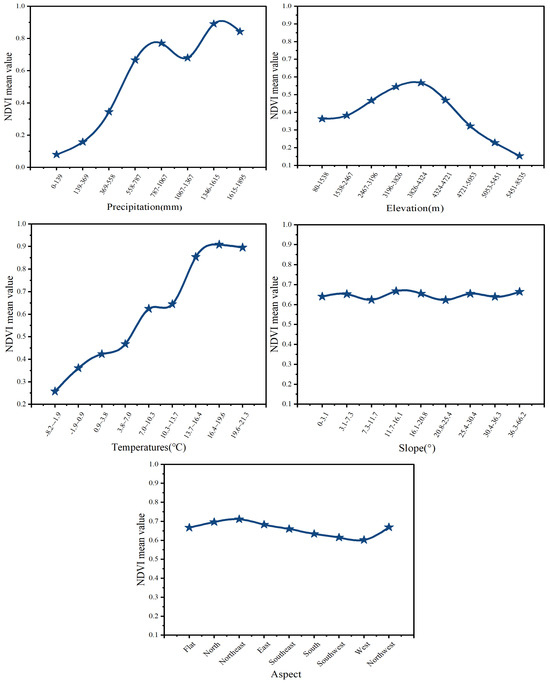
As shown in Figure 8, the risk detector results reveal pronounced spatial stratified heterogeneity in NDVI across the QTP. Higher NDVI values were consistently associated with ecologically favorable conditions, with significant differences observed among factor strata. Temperature emerged as a particularly influential determinant, as moderate thermal conditions strongly promoted vegetation growth by enhancing photosynthetic activity, extending the growing season, and increasing biomass accumulation in cold, high-altitude environments. In contrast, precipitation exhibited a weaker stratified effect, suggesting that water availability is not the dominant limiting factor at the plateau scale, largely because its ecological effects are mediated by soil characteristics, permafrost dynamics, meltwater inputs, and local hydrological processes. Collectively, these findings demonstrate that NDVI variability on the QTP results from complex interactions among climatic, edaphic, topographic, and anthropogenic factors, operating through synergistic reinforcement, feedback amplification, and nonlinear threshold responses. Understanding these mechanisms provides important insights into alpine vegetation dynamics and offers a scientific basis for improving predictive models and supporting adaptive land management under future environmental change.
Figure 8.
The statistical outcomes of NDVI under various influencing factors.
As shown in Table 2, proximity-related variables further reveal distinct ecological responses. Vegetation greenness is positively associated with proximity to rivers, indicating that riparian zones provide relatively stable moisture conditions and enhanced nutrient availability conducive to vegetation establishment and growth. Conversely, the lowest NDVI values are consistently observed in areas adjacent to roads, reflecting the negative ecological impacts of road infrastructure. Such impacts may arise from intensified human disturbance, grazing pressure, soil compaction, habitat fragmentation, pollutant deposition, and microclimatic alterations. This strong negative effect near roads suggests that linear infrastructure exerts persistent local pressure on vegetation, which may partially offset the benefits brought by ecological restoration projects.
Table 2.
Ecological factor analysis outcome (T = significant difference at 95% CI, F = no notable difference).
Overall, the risk detector analysis underscores the combined importance of climatic suitability, hydrological accessibility, and anthropogenic disturbance in shaping vegetation patterns across the QTP. These findings highlight the necessity of incorporating human-related pressures—particularly road networks—into ecological conservation planning and land management strategies aimed at sustaining and enhancing vegetation ecosystems in this environmentally sensitive high-altitude region.
3.4. Impacts of Human-Induced Activities and Climate Change on Vegetation Dynamics
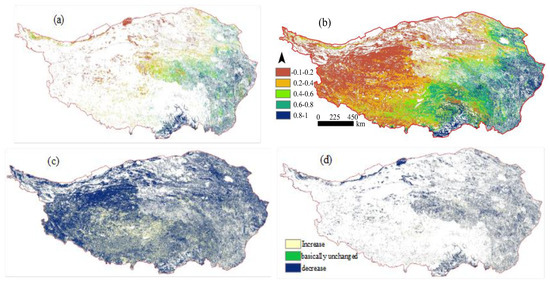
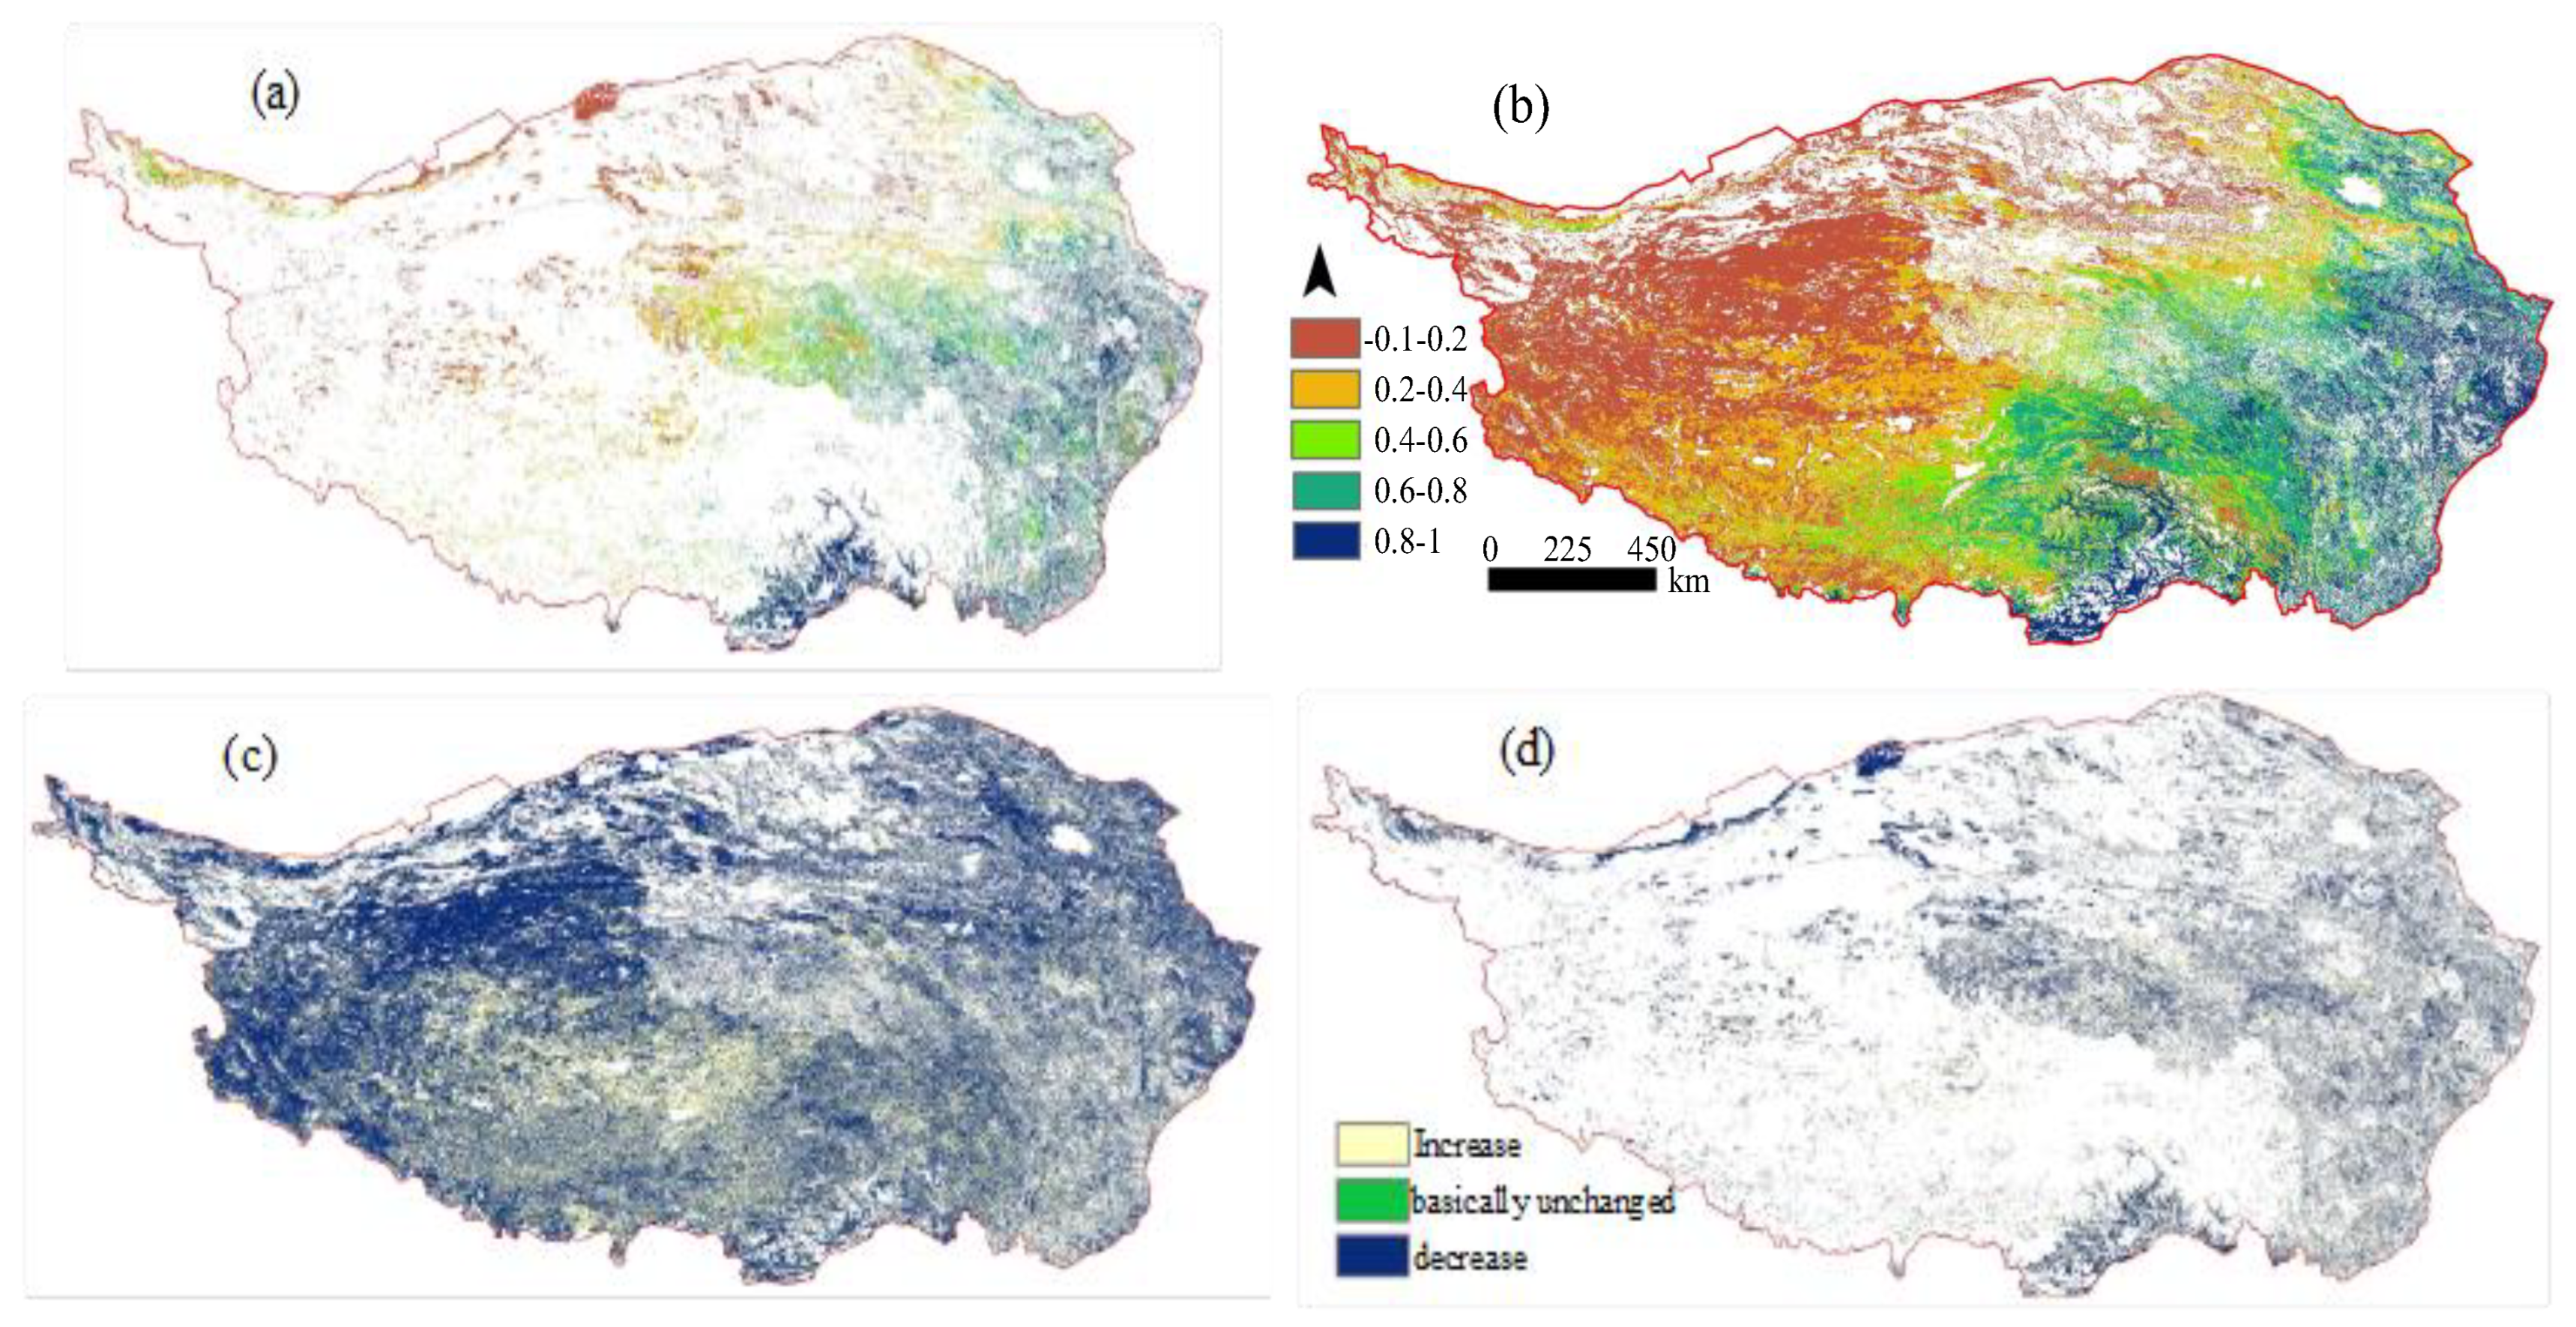
Figure 9 depicts the relative contributions of climate dynamics and human activities to NDVI variation across the Qinghai–Tibetan Plateau (QTP) during 2000–2020, revealing an overall greening trend indicative of considerable ecological resilience. Both the climate-driven component (V(climate)) and the combined climate–human component (V(climate + human)) exhibited broadly consistent upward trajectories over most regions, reflecting enhanced vegetation cover and improved ecosystem functioning. Notably, the magnitude of change associated with V(climate + human) exceeded that of V(climate) alone, highlighting the substantial role of anthropogenic processes in modulating vegetation dynamics alongside climatic variability.
Figure 9.
The Annual Average NDVI of (a) natural vegetation unaffected by human activities but influenced solely by climate change (V_climate), and (b) vegetation influenced by both climate change and human activities (V_climate + human). It also showcases the NDVI trend for (c) vegetation affected by both climate change and human activities (V_climate + human), and (d) provides a trend analysis for vegetation affected solely by climate change (V_climate).
Marked elevational differentiation was observed in the relative importance of climate and human drivers. Human impacts were most pronounced at mid-elevations (2500–3500 m), where agricultural activities, infrastructure development, and ecological restoration policies significantly influenced vegetation dynamics. In contrast, vegetation change at higher elevations (3500–5500 m) was primarily controlled by hydrothermal conditions, with temperature and precipitation acting as the dominant drivers. Both regression and GeoDetector analyses confirmed stronger anthropogenic effects in lower-elevation regions and greater climatic control in higher, less disturbed areas. Human activities promoted vegetation improvement across 38.6% of the Plateau, maintained stability in 35.8%, and contributed to degradation in 25.6%, indicating an overall positive contribution to vegetation growth despite increasing landscape fragmentation associated with urbanization and infrastructure expansion.
Spatially, anthropogenic influences were more evident in the western QTP, particularly in the Qiangtang and Kekexili Nature Reserves, where ecological restoration efforts facilitated vegetation recovery. Climatic factors played a larger role in the eastern plateau, where warming and increased precipitation favored vegetation growth. However, in degraded areas such as southern Qinghai and central-eastern Tibet, human pressures outweighed climatic influences. Overall, vegetation dynamics across the QTP were jointly shaped by climate change and human activities, with their relative contributions varying systematically across elevation and population gradients.
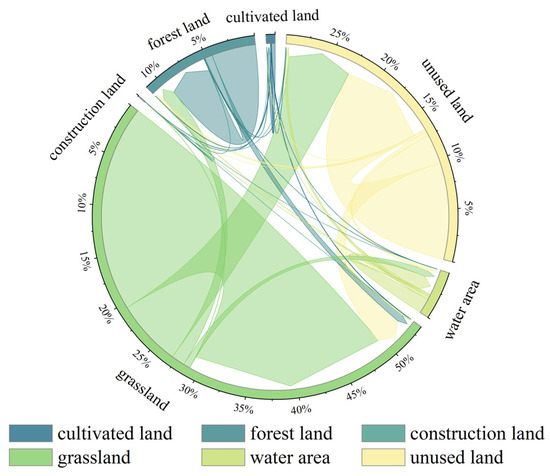
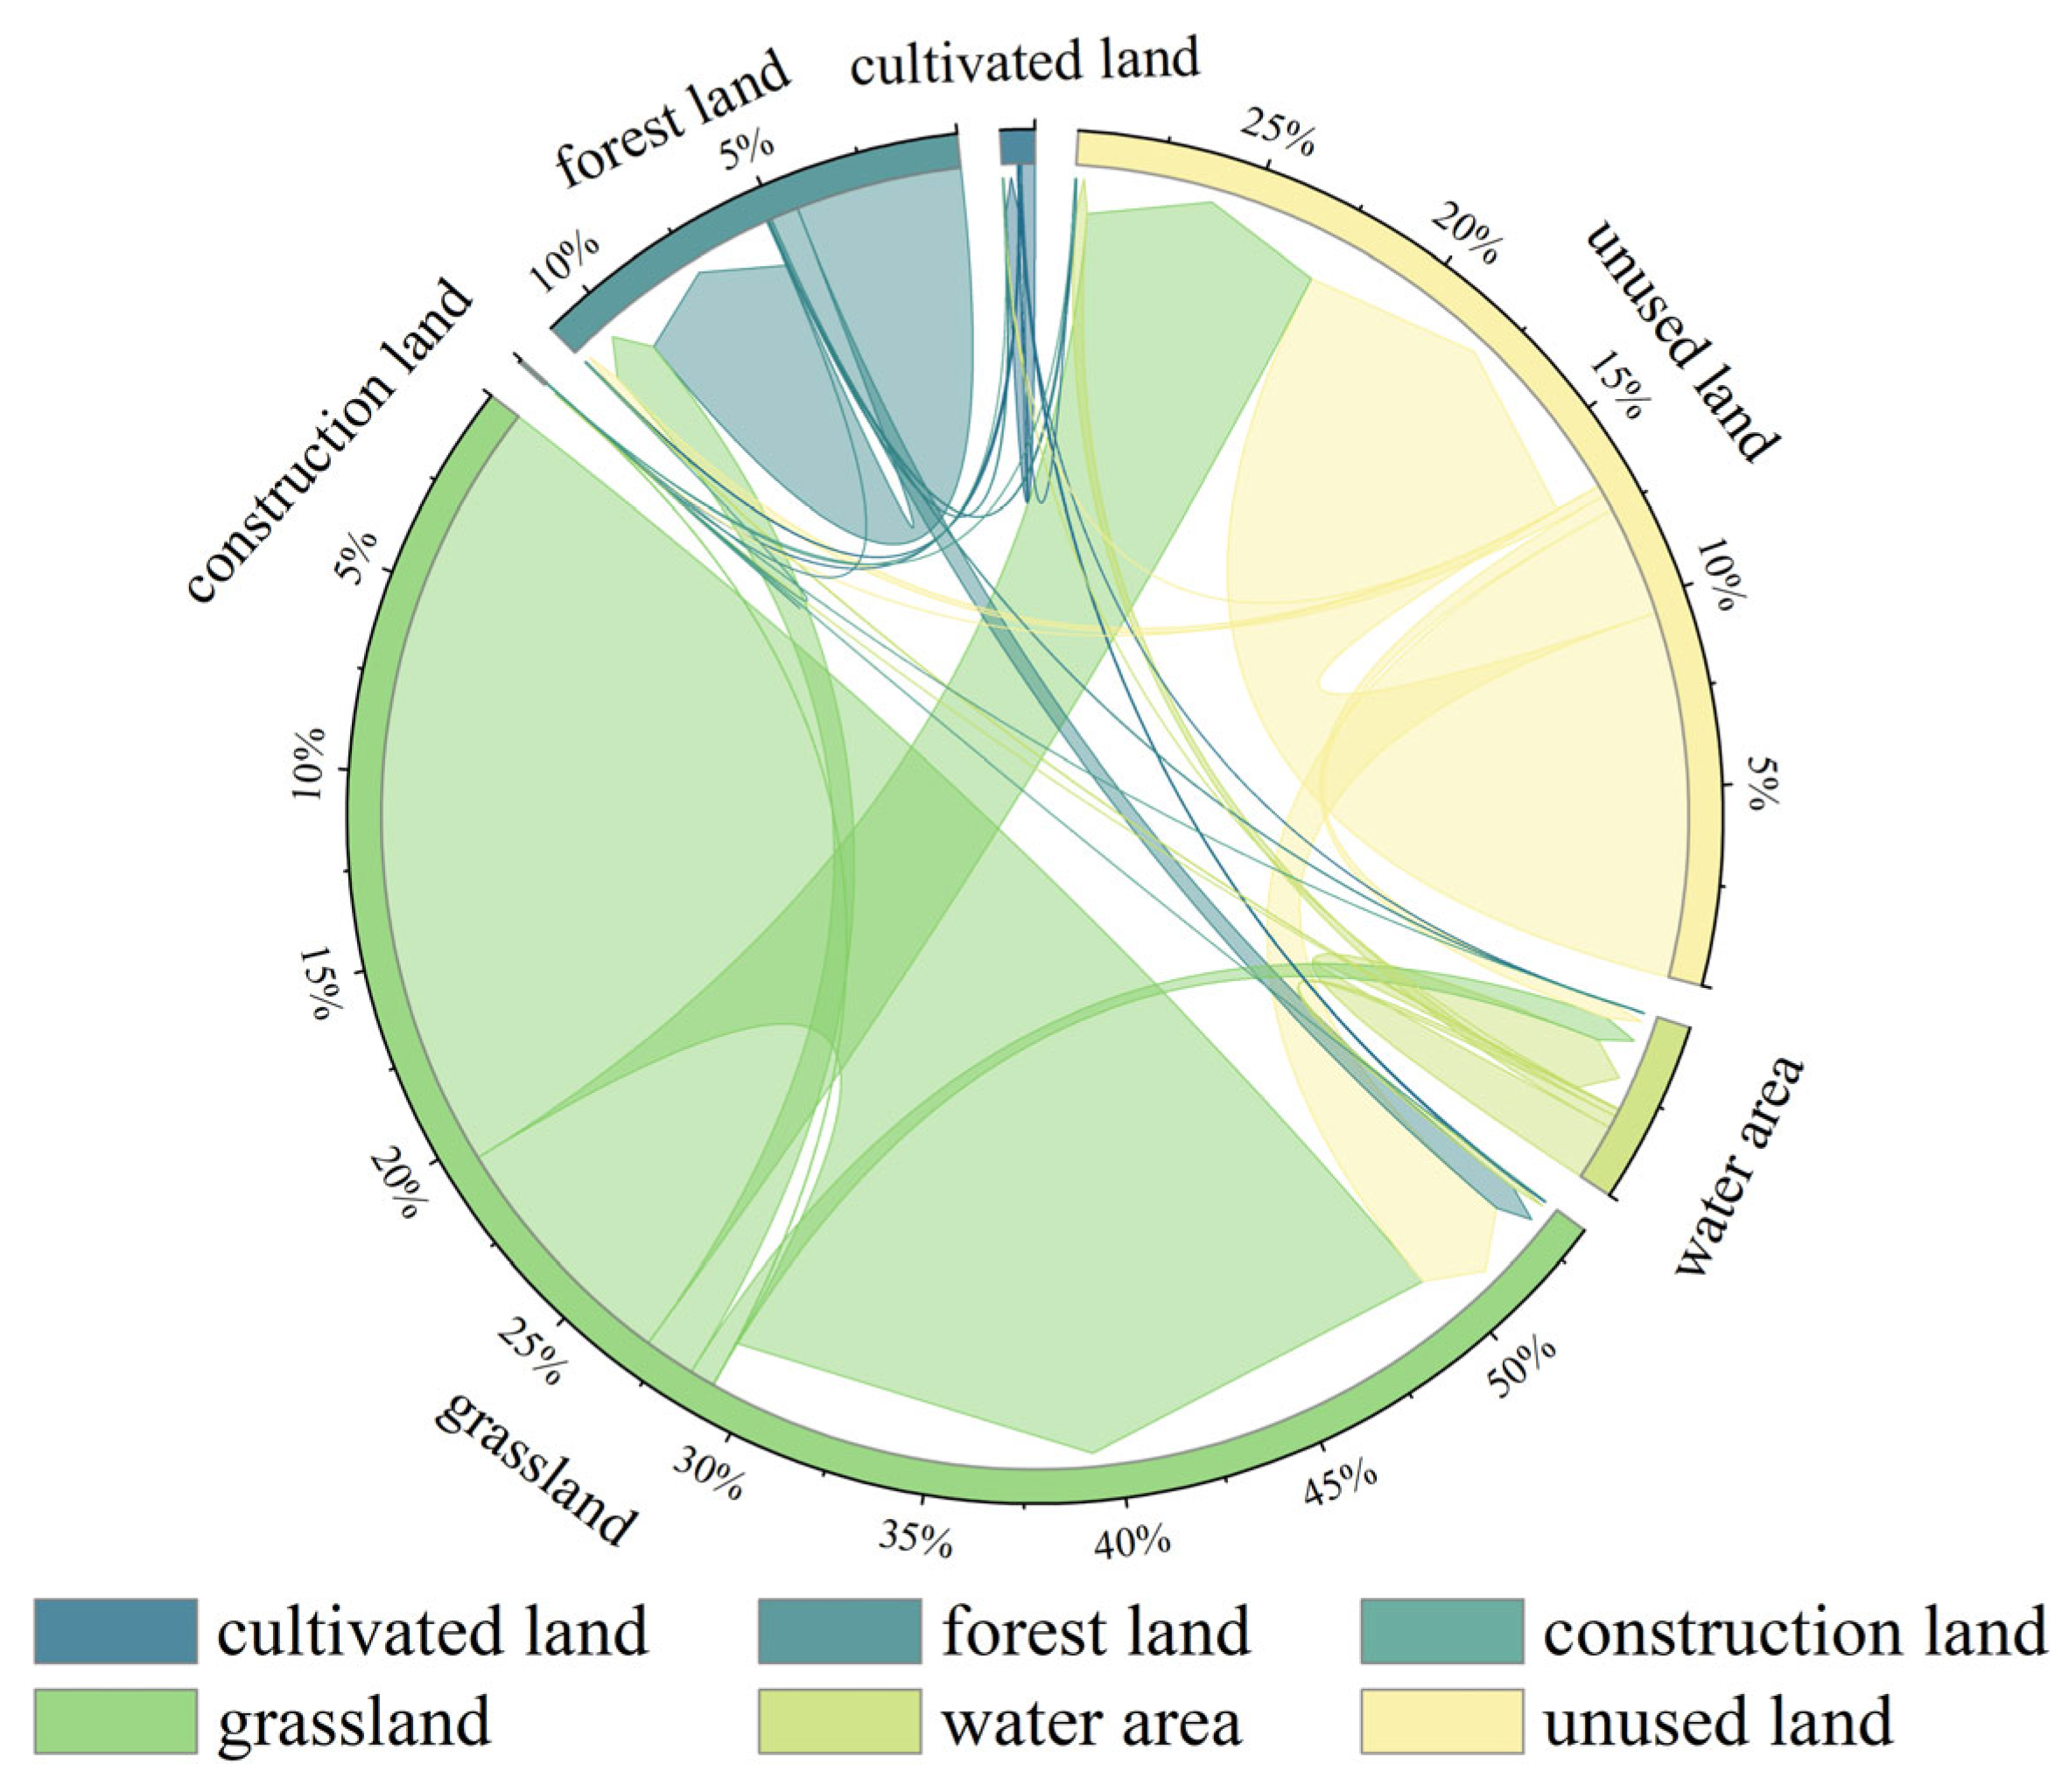
The land-use transfer matrix (Figure 10) reveals substantial landscape transformations across the Qinghai–Tibetan Plateau (QTP) between 2000 and 2020. Grassland experienced the largest decline, decreasing from 1,510,583.28 km2 to 1,261,816.55 km2, with considerable areas converted to unused land and construction land. In contrast, cultivated land increased from 23,744.72 km2 to 26,544.26 km2, while forestland expanded markedly from 271,395.25 km2 to 313,481.56 km2, largely through the conversion of grassland. Water bodies also increased from 104,322.82 km2 to 134,123.99 km2, mainly at the expense of unused land and grassland, indicating widespread lake expansion across the plateau.
Figure 10.
Land Use Changes on the Qinghai–Tibet Plateau over the Past 20 Years.
Construction land exhibited the fastest growth, nearly doubling from 1529.10 km2 to 2878.08 km2, reflecting accelerated urbanization and economic development. Meanwhile, the expansion of forestland was closely linked to ecological restoration programs, including the Grain for Green Program, shelterbelt construction, and natural forest protection initiatives, which have enhanced vegetation cover and ecosystem stability. The increase in unused land was primarily associated with grassland degradation, although some areas were simultaneously converted back to grassland under regional wetting trends and ecological management measures.
Overall, land-use change on the QTP reflects the combined influences of climate variability, ecological restoration, and socioeconomic development. While restoration efforts have promoted vegetation recovery and ecological improvement, the rapid expansion of construction land and associated habitat fragmentation continue to pose challenges to ecosystem sustainability. Given that cultivated land accounts for only 0.31% of the plateau’s total area, balancing ecological conservation, food security, and sustainable development remains a key priority for future land management.
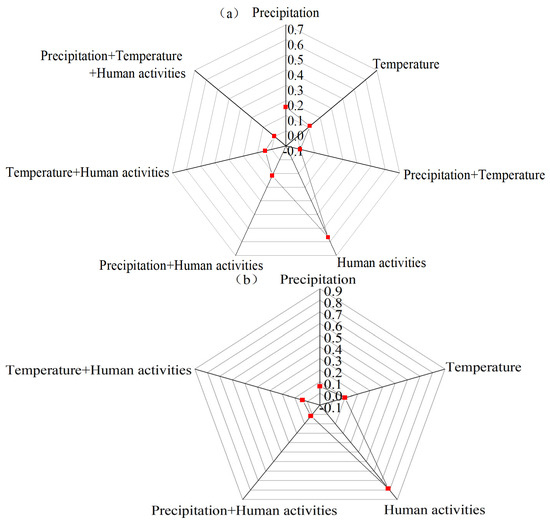
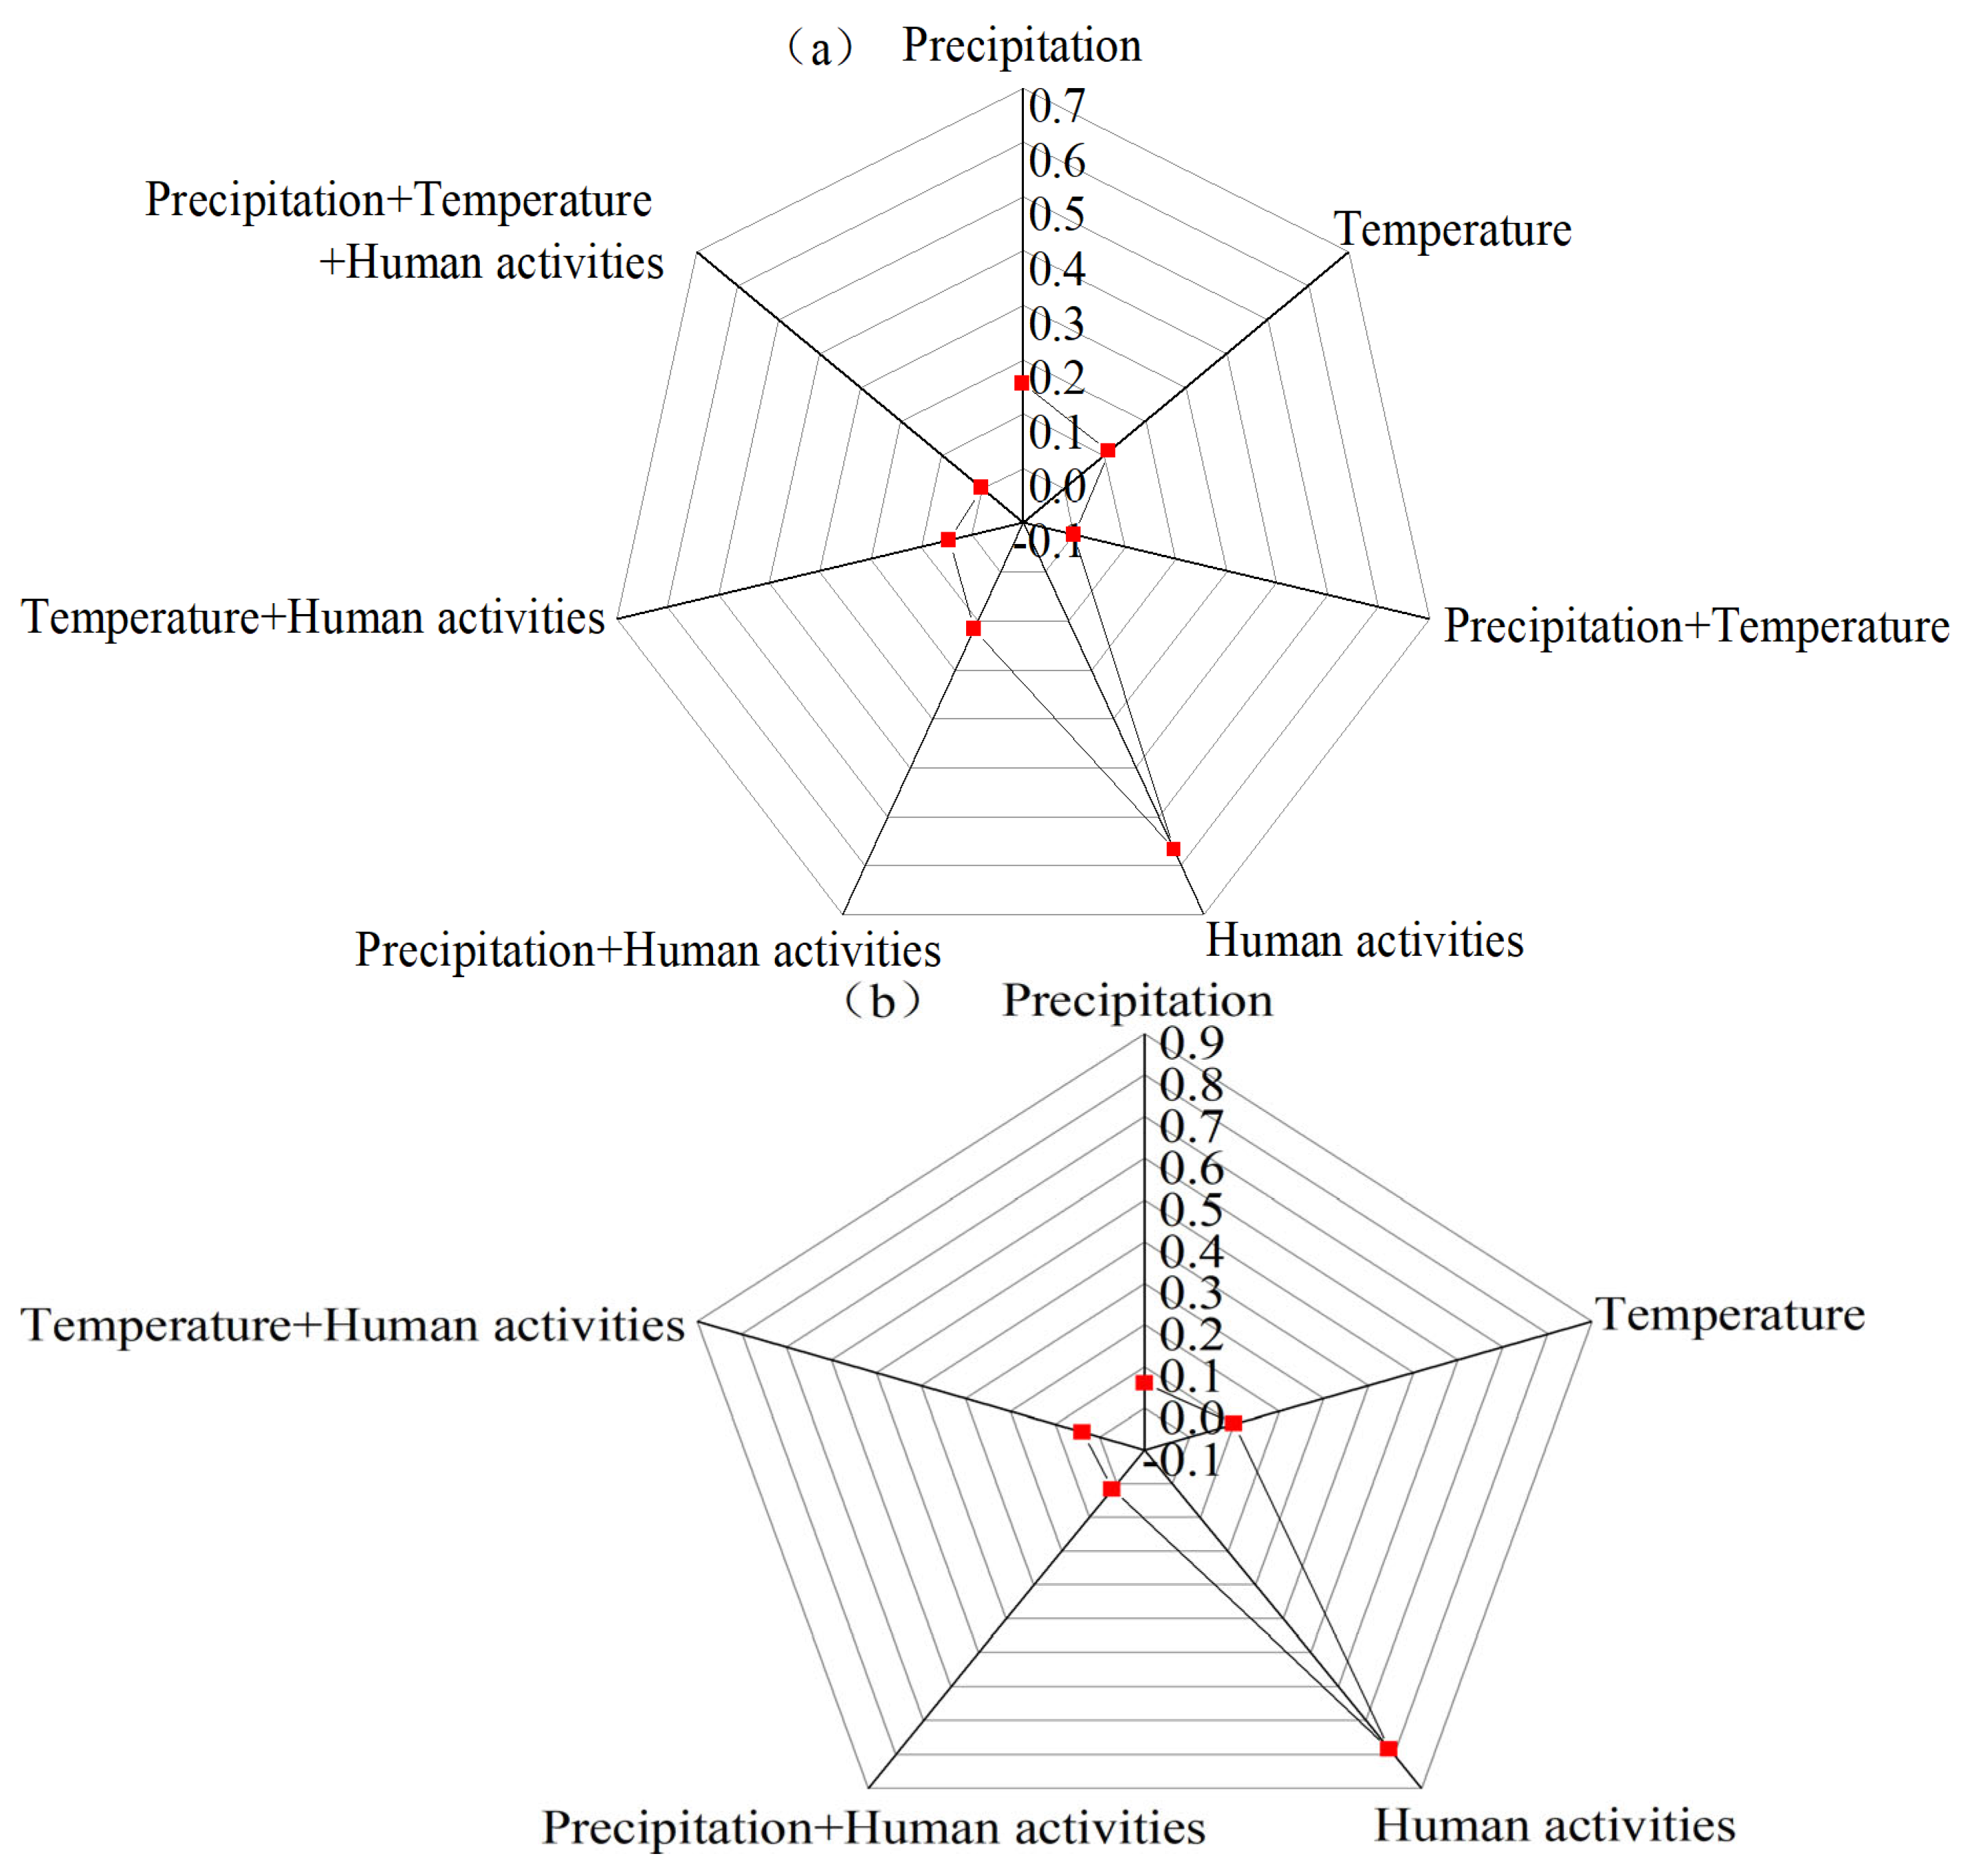
Figure 11 shows the dominant drivers of vegetation improvement and degradation across the Qinghai–Tibetan Plateau (QTP). In areas with significant vegetation improvement, precipitation, temperature, human activities, and their interactions jointly contributed to NDVI increases. Human activities were the primary driver, accounting for 56.9% of the improved area, followed by precipitation (15.8%) and temperature (11.1%). The remaining areas were influenced by interactions among climatic and anthropogenic factors, indicating that vegetation improvement was associated with both climate variability and human activities.
Figure 11.
(a) Driving factors of vegetation improvement areas. (b) Proportion of driving factors in vegetation degradation areas.
In areas experiencing significant vegetation degradation, five dominant driving types were identified: precipitation, temperature, human activities, precipitation–human interactions, and temperature–human interactions. These factors accounted for 6.0%, 10.0%, 78.5%, 1.7%, and 3.8% of the degraded area, respectively. Human activities were the dominant driver, contributing to nearly four-fifths of the total degraded area.
No degradation areas were primarily controlled by precipitation–temperature interactions or by the combined effects of precipitation, temperature, and human activities. Overall, human activities played a more prominent role in vegetation degradation than in vegetation improvement, whereas climatic factors and their interactions contributed relatively larger proportions in areas of vegetation recovery.
4. Conclusions and Discussion
4.1. Discussion
4.1.1. Vegetation Dynamics Variation Characteristics on the Qinghai–Tibet Plateau
Vegetation dynamics across the Qinghai–Tibetan Plateau (QTP) over the past two decades have exhibited a spatially heterogeneous yet macroscopically consistent pattern characterized by widespread greening punctuated by localized degradation [49]. This spatiotemporal trajectory is not anomalous but represents a deterministic response of alpine ecosystems to the coupled forces of climate change and anthropogenic disturbances. Unlike low-altitude ecosystems, vegetation on the QTP is exquisitely sensitive to exogenous forcing, making its evolutionary trajectory a highly sensitive bellwether of alpine ecosystem stress and resilience under accelerating global change.
Climate change acts as the foundational environmental driver [50,51]. Rising temperatures and shifting precipitation regimes directly modulate soil moisture profiles, evapotranspiration rates, and canopy photosynthetic capacity, thereby governing the overarching baseline of vegetation growth. However, this response is highly nonlinear and threshold-dependent. In arid and fragile eco-zones, such as the high-altitude deserts and the subalpine alpine belts of the Hengduan Mountains, regional warming escalates atmospheric vapor pressure deficits and exacerbates soil moisture limitations, thereby suppressing vegetative growth. Conversely, in the forest- and shrub-dominated southeastern sectors of the QTP, moderate warming prolongs the thermal growing season and enhances net primary productivity; nevertheless, excessive thermal acceleration can still induce transient moisture stress. These pronounced spatial divergent responses confirm that climate–vegetation interactions on the QTP are co-regulated by synchronous hydrothermal variations rather than isolated meteorological anomalies.
Anthropogenic activities further amplify this spatial heterogeneity. Land-use/land-cover (LULC) transformations, livestock grazing, agricultural expansion, and infrastructure development can induce either ecological degradation or localized restoration, depending heavily on policy orientations and management intensities. For instance, unsustainable grazing and grassland reclamation disrupt canopy cover and soil structural stability, whereas the implementation of targeted ecological restoration programs significantly bolsters biomass accumulation and ecosystem resilience. Consequently, the spatial superposition of climatic shifting and human activities engenders a highly stratified mosaic of vegetation dynamics.
Our findings explicitly identify a distinct elevation-dependent regulatory regime: human activities dominate vegetation trajectories within the 2500–3500 m altitudinal band, a zone characterized by dense populations and intensive land utilization. Above the 3500 m threshold, climate factors assume primary control, bounded by negligible direct human imprints. This altitudinal partitioning aligns with regional assessments highlighting elevation as a key geographic modifier of human–climate–vegetation interfaces [49]. Compared to single-driver attributions, our framework provides a more holistic mapping of this stratified environmental synergy.
4.1.2. The Impact of Natural and Human Activities on Vegetation Growth
Vegetation evolution on the QTP is driven by coupled natural and anthropogenic processes [52,53]. Accurate attribution requires a framework that can separate and quantify their respective contributions. In this study, a combined RESTREND framework integrated with long-term LULC data was used to distinguish climate-driven (Vclimate) and climate–human combined (Vclimate + human) components. This integration substantially enhances attribution fidelity by embedding structural land-use dynamics directly into the residual modeling chain [54,55].
The pervasive greening trend detected across the plateau is broadly consistent with macro-scale satellite observations. However, while previous efforts have largely relied on linear correlation techniques or failed to partition interactive covariance, our results demonstrate that nonlinear interaction effects—rather than isolated factors—exert dominant control over NDVI heterogeneity. The synergistic couplings of elevation–temperature and slope–precipitation dramatically boost the explanatory power of environmental modeling, capturing spatial dynamics that remain hidden within traditional linear regression structures.
In high-altitude zones, climate change primarily facilitates vegetative growth by alleviating low-temperature kinetic limitations and optimizing water availability, although this effect is mediated by localized evapotranspiration constraints. Concurrently, human interventions, particularly state-led ecological conservation programs, have driven prominent greening trends across low-to-middle altitude zones.
Crucially, utilizing residual components as a proxy for anthropogenic footprints hinges on a fundamental assumption: that the baseline climate–NDVI relationship remains temporally stationary and that all non-climatic signals represent human interventions. This assumption introduces inherent uncertainties. The residual term inevitably assimilates unmeasured biophysical variances, including cryospheric dynamics, soil nutrient heterogeneity, and discrete extreme weather events. This diagnostic limitation must be carefully weighted when interpreting empirical human contribution estimates.
4.1.3. Uncertainties and Limitations
While this integrated framework provides a robust foundation for spatial eco-attribution, several critical uncertainties remain to be resolved in future research.
First, cryospheric processes were not explicitly coupled into our modeling framework. Alpine vegetation growth on the QTP is profoundly shaped by permafrost degradation, glacier retreat, and active-layer freeze–thaw cycles [56,57,58,59,60,61,62], which govern ecohydrological and thermal dynamics independently of ambient temperature and precipitation trends. Omitting these cryospheric variables can systematically bias climate contribution estimates and obscure residual-based human attribution accuracy.
Second, methodological constraints persist regarding meteorological downscaling and residual partitioning. Resampling climate data from a 1 km to a 250 m resolution via bilinear interpolation inherently introduces spatial smoothing effects. Furthermore, because RESTREND cannot completely isolate subtle human signals from low-frequency natural biophysical variability, it retains a latent risk for the over- or underestimation of direct anthropogenic contributions.
Third, remote sensing data uncertainties remain an exogenous constraint. The MODIS NDVI time series is susceptible to residual cloud contamination, atmospheric aerosol interference, sensor drift, and processing artifacts [63,64]. These errors propagate into trend detection and driver analysis, especially in regions with frequent cloud cover.
To transcend these limitations, future research should assimilate high-resolution permafrost and cryospheric data products into process-based ecohydrological and machine learning architectures. Refinement of these non-linear interaction detectors will minimize attribution uncertainties and provide a more comprehensive representation of climate–cryosphere–human–vegetation feedbacks to support targeted, adaptive ecosystem management.
4.2. Conclusions
By integrating trend analysis, spatial autocorrelation, RESTREND, and GeoDetector, this study systematically explored the spatiotemporal dynamics of NDVI and its driving mechanisms across the Qinghai–Tibetan Plateau (QTP) during 2000–2020. The main conclusions are as follows:
(i) Persistent yet spatially heterogeneous greening.
The growing-season NDVI showed an overall increasing trend with pronounced spatial heterogeneity. “High–High” and “Low–Low” clusters dominated the landscape, while transitional “Low–High” and “High–Low” areas were limited, indicating largely stable ecological trajectories over the study period.
(ii) Multifactorial regulation and nonlinear coupling.
NDVI variability was jointly controlled by vegetation type, soil properties, land-use patterns, and topographic–climatic gradients. Interactions between factors, particularly elevation–temperature and slope–precipitation, substantially enhanced explanatory power compared with individual factors.
(iii) Intensifying anthropogenic imprint.
Attribution analysis revealed that synergistic climate–human drivers (Vclimate + human) accounted for greater NDVI variability than climate alone (Vclimate). A distinct altitudinal threshold was identified: low-to-middle elevation bands (2500–3500 m) were heavily governed by land-use changes and ecological policies, whereas high-elevation belts (3500–5500 m) remained predominantly under climate control. Crucially, the anthropogenic footprint exhibited a progressive increase over the study period.
Author Contributions
Writing—original draft preparation, L.J. and S.W.; Methodology, L.J. and J.Z.; Software, R.M. and S.W.; validation, X.L., writing—modification, and editing of the manuscript, X.L. and J.Z.; visualization, R.M. and X.L.; supervision, J.Z.; funding acquisition, X.L. and J.Z.; writing—reviewing, all authors; formal analysis of data, L.J. and R.M.; advice and design ideas, L.J., X.L. and J.Z. All authors have read and agreed to the published version of the manuscript.
Funding
This work was financially supported by the Special Survey on Science & Technology Infrastructure “Comprehensive Assessment and Shared Utilization of Stress-Tolerant Shrub Resources in the Three-North Regions” (2025FY100605); The Chinese Academy of Forestry Science and Technology Programme (CAFYBB2024ZA008).
Institutional Review Board Statement
Not applicable.
Informed Consent Statement
Not applicable.
Data Availability Statement
The data presented in this study are available on request from the first and corresponding author.
Acknowledgments
We would like to thank the editors and reviewers for their valuable opinions and suggestions that improved this research. We especially thanks to Yakui Shao from Institute of Forest Resource Information Techniques, Chinese Academy of Forestry and Qian Shen from Jiangsu Normal University for their guidance during the writing and revision of the paper.
Conflicts of Interest
The authors declare no conflicts of interest.
References
- Duarte, C.M.; Losada, I.J.; Hendriks, I.E.; Mazarrasa, I.; Marbà, N. The role of coastal plant communities for climate change mitigation and adaptation. Nat. Clim. Change 2013, 3, 961–968. [Google Scholar] [CrossRef] [Scilit]
- Ortega-Rosas, C.I.; Enciso-Miranda, C.A.; Macías-Duarte, A.; Morales-Romero, D.; Villarruel-Sahagún, L. Urban vegetation cover correlates with environmental variables in a desert city: Insights of mitigation measures to climate change. Urban Ecosyst. 2020, 23, 1191–1207. [Google Scholar] [CrossRef] [Scilit]
- De la Barrera, F.; Rubio, P.; Banzhaf, E. The value of vegetation cover for ecosystem services in the suburban context. Urban For. Urban Green. 2016, 16, 110–122. [Google Scholar] [CrossRef] [Scilit]
- Chen, F.; Wang, Y.; Zhen, X.; Sun, J. Research on Environmental Impacts and Response Strategies on the Tibetan Plateau under Global Change. China Tibetol. 2021, 4, 21–28. [Google Scholar]
- Sun, H.; Zheng, D.; Yao, T.; Zhang, Y. Protection and Construction of the National Ecological Security Shelter Zone on Tibetan Plateau. Acta Geogr. Sin. 2012, 67, 3–12. [Google Scholar]
- Zhu, Y.; Zhang, H.; Ding, M.; Li, L.; Zhang, Y. The multiple perspective response of vegetation to drought on the Qinghai-Tibetan Plateau. Remote Sens. 2023, 15, 902. [Google Scholar] [CrossRef] [Scilit]
- Wei, Y.; Lu, H.; Wang, J.; Wang, X.; Sun, J. Dual influence of climate change and anthropogenic activities on the spatiotemporal vegetation dynamics over the Qinghai-Tibetan plateau from 1981 to 2015. Earth’s Future 2022, 10, e2021EF002566. [Google Scholar]
- Shen, Q.; Zhou, Y.; Xu, Y.; Lai, Y.; Yan, X.; Huang, X.; Liu, X.; Zhong, J.; Zhu, S.; Li, Z. Late Quaternary river evolution and its response to climate changes in the upper Mekong River of the Qinghai–Tibetan Plateau. Geomorphology 2023, 442, 108920. [Google Scholar] [CrossRef] [Scilit]
- Zheng, B.; Xu, Q.; Shen, Y. The relationship between climate change and Quaternary glacial cycles on the Qinghai–Tibetan Plateau: Review and speculation. Quat. Int. 2002, 97, 93–101. [Google Scholar] [CrossRef] [Scilit]
- Lin, X.; Zhang, Z.; Wang, S.; Hu, Y.; Xu, G.; Luo, C.; Chang, X.; Duan, J.; Lin, Q.; Xu, B. Response of ecosystem respiration to warming and grazing during the growing seasons in the alpine meadow on the Tibetan plateau. Agric. For. Meteorol. 2011, 151, 792–802. [Google Scholar] [CrossRef] [Scilit]
- Zhang, H.; Fan, J.; Wang, J.; Cao, W.; Harris, W. Spatial and temporal variability of grassland yield and its response to climate change and anthropogenic activities on the Tibetan Plateau from 1988 to 2013. Ecol. Indic. 2018, 95, 141–151. [Google Scholar] [CrossRef] [Scilit]
- Li, S.; He, F.; Zhang, X.; Zhou, T. Evaluation of global historical land use scenarios based on regional datasets on the Qinghai–Tibet Area. Sci. Total Environ. 2019, 657, 1615–1628. [Google Scholar] [CrossRef] [Scilit] [PubMed]
- Fan, Z.; Bai, X. Scenarios of potential vegetation distribution in the different gradient zones of Qinghai-Tibet Plateau under future climate change. Sci. Total Environ. 2021, 796, 148918. [Google Scholar] [CrossRef] [Scilit] [PubMed]
- Mao, K.S.; Wang, Y.; Liu, J.Q. Evolutionary origin of species diversity on the Qinghai–Tibet Plateau. J. Syst. Evol. 2021, 59, 1142–1158. [Google Scholar] [CrossRef] [Scilit]
- Han, H.; Yin, Y.; Zhao, Y.; Qin, F. Spatiotemporal Variations in Fractional Vegetation Cover and Their Responses to Climatic Changes on the Qinghai–Tibet Plateau. Remote Sens. 2023, 15, 2662. [Google Scholar] [CrossRef] [Scilit]
- Ma, S.; Wang, L.-J.; Jiang, J.; Chu, L.; Zhang, J.-C. Threshold effect of ecosystem services in response to climate change and vegetation coverage change in the Qinghai-Tibet Plateau ecological shelter. J. Clean. Prod. 2021, 318, 128592. [Google Scholar] [CrossRef] [Scilit]
- Chávez, R.O.; Moreira-Muñoz, A.; Galleguillos, M.; Olea, M.; Aguayo, J.; Latín, A.; Aguilera-Betti, I.; Muñoz, A.A.; Manríquez, H. GIMMS NDVI time series reveal the extent, duration, and intensity of “blooming desert” events in the hyper-arid Atacama Desert, Northern Chile. Int. J. Appl. Earth Obs. Geoinf. 2019, 76, 193–203. [Google Scholar] [CrossRef] [Scilit]
- Fensholt, R.; Proud, S.R. Evaluation of earth observation based global long term vegetation trends—Comparing GIMMS and MODIS global NDVI time series. Remote Sens. Environ. 2012, 119, 131–147. [Google Scholar]
- Cong, N.; Piao, S.; Chen, A.; Wang, X.; Lin, X.; Chen, S.; Han, S.; Zhou, G.; Zhang, X. Spring vegetation green-up date in China inferred from SPOT NDVI data: A multiple model analysis. Agric. For. Meteorol. 2012, 165, 104–113. [Google Scholar] [CrossRef] [Scilit]
- Tian, F.; Fensholt, R.; Verbesselt, J.; Grogan, K.; Horion, S.; Wang, Y. Evaluating temporal consistency of long-term global NDVI datasets for trend analysis. Remote Sens. Environ. 2015, 163, 326–340. [Google Scholar] [CrossRef] [Scilit]
- Wang, D.; Li, S.; Gao, S. Distribution characteristics of the alpine treeline and vegetation response to climate change of Taibai Mountain, China. Geofluids 2022, 2022, 4517515. [Google Scholar] [CrossRef] [Scilit]
- Yong, Z.; Wang, W.; Chen, D.; Liu, L.; Ma, Y.; He, J. Pollen reconstructed Holocene vegetation response to climate change and human activity in a semi-arid mountain area of north China. Catena 2020, 195, 104878. [Google Scholar] [CrossRef] [Scilit]
- Li, Y.; Wang, X.; Chu, B.; Niu, Z.; Fu, X.; Yan, Y. Spatiotemporal ecosystem evolution and driving mechanism in the Oinghai-Tibet Plateau ecological barrier area. Acta Ecol. Sin. 2022, 42, 8581–8593. [Google Scholar]
- Chen, X.; Wang, X.; Feng, X.; Zhang, X.; Luo, G. Ecosystem service trade-off and synergy on Qinghai-Tibet Plateau. Geogr. Res. 2021, 40, 18–34. [Google Scholar]
- Yao, T.; Thompson, L.; Yang, W.; Yu, W.; Gao, Y.; Guo, X.; Yang, X.; Duan, K.; Zhao, H.; Xu, B. Different glacier status with atmospheric circulations in Tibetan Plateau and surroundings. Nat. Clim. Change 2012, 2, 663–667. [Google Scholar] [CrossRef] [Scilit]
- Kang, S.; Xu, Y.; You, Q.; Flügel, W.-A.; Pepin, N.; Yao, T. Review of climate and cryospheric change in the Tibetan Plateau. Environ. Res. Lett. 2010, 5, 015101. [Google Scholar] [CrossRef] [Scilit]
- Wang, Z.; Wang, H.; Feng, X.; Wang, X.; Zhang, L.; Fu, B. Evaluation index system of comprehensive benefits of ecological restoration in key ecologically vulnerable regions. Acta Ecol. Sin. 2019, 39, 7356–7366. [Google Scholar] [CrossRef] [Scilit]
- Huete, A.; Didan, K.; Miura, T.; Rodriguez, E.P.; Gao, X.; Ferreira, L.G. Overview of the radiometric and biophysical performance of the MODIS vegetation indices. Remote Sens. Environ. 2002, 83, 195–213. [Google Scholar] [CrossRef] [Scilit]
- Ma, Z.; Dong, C.; Lin, K.; Yan, Y.; Luo, J.; Jiang, D.; Chen, X. A Global 250-m Downscaled NDVI Product from 1982 to 2018. Remote Sens. 2022, 14, 3639. [Google Scholar] [CrossRef] [Scilit]
- He, Q.; Wang, M.; Liu, K.; Li, K.; Jiang, Z. GPRChinaTemp1km: A high-resolution monthly air temperature dataset for China (1951–2020) based on machine learning. Earth Syst. Sci. Data Discuss. 2022, 14, 3273–3292. [Google Scholar] [CrossRef] [Scilit]
- Qu, L.; Zhu, Q.; Zhu, C.; Zhang, J. Monthly Precipitation Data Set with 1 km Resolution in China from 1960 to 2020. Chin. Sci. Data 2023, 8, 286–297. [Google Scholar]
- Xiong, Y.; Li, Y.; Xiong, S.; Wu, G.; Deng, O. Multi-scale spatial correlation between vegetation index and terrain attributes in a small watershed of the upper Minjiang River. Ecol. Indic. 2021, 126, 107610. [Google Scholar] [CrossRef] [Scilit]
- Dunnett, N.; Willis, A.; Hunt, R.; Grime, J. A 38-year study of relations between weather and vegetation dynamics in road verges near Bibury, Gloucestershire. J. Ecol. 1998, 86, 610–623. [Google Scholar]
- Dunn, W.C.; Milne, B.T.; Mantilla, R.; Gupta, V.K. Scaling relations between riparian vegetation and stream order in the Whitewater River network, Kansas, USA. Landsc. Ecol. 2011, 26, 983–997. [Google Scholar] [CrossRef] [Scilit]
- Jenerette, G.D.; Harlan, S.L.; Brazel, A.; Jones, N.; Larsen, L.; Stefanov, W.L. Regional relationships between surface temperature, vegetation, and human settlement in a rapidly urbanizing ecosystem. Landsc. Ecol. 2007, 22, 353–365. [Google Scholar]
- Savva, Y.; Szlavecz, K.; Pouyat, R.V.; Groffman, P.M.; Heisler, G. Effects of land use and vegetation cover on soil temperature in an urban ecosystem. Soil Sci. Soc. Am. J. 2010, 74, 469–480. [Google Scholar] [CrossRef] [Scilit]
- Amundson, R.; Heimsath, A.; Owen, J.; Yoo, K.; Dietrich, W.E. Hillslope soils and vegetation. Geomorphology 2015, 234, 122–132. [Google Scholar] [CrossRef] [Scilit]
- Gorelick, N.; Hancher, M.; Dixon, M.; Ilyushchenko, S.; Thau, D.; Moore, R. Google Earth Engine: Planetary-scale geospatial analysis for everyone. Remote Sens. Environ. 2017, 202, 18–27. [Google Scholar] [CrossRef] [Scilit]
- James, G.; Witten, D.; Hastie, T.; Tibshirani, R.; Taylor, J. Linear regression. In An Introduction to Statistical Learning: With Applications in Python; Springer: Berlin/Heidelberg, Germany, 2023; pp. 69–134. [Google Scholar]
- Dormann, C.F.; McPherson, J.M.; Araújo, M.B.; Bivand, R.; Bolliger, J.; Carl, G.; Davies, R.G.; Hirzel, A.; Jetz, W.; Daniel Kissling, W. Methods to account for spatial autocorrelation in the analysis of species distributional data: A review. Ecography 2007, 30, 609–628. [Google Scholar] [CrossRef] [Scilit]
- Shao, Y.; Wang, Z.; Feng, Z.; Sun, L.; Yang, X.; Zheng, J.; Ma, T. Assessment of China’s forest fire occurrence with deep learning, geographic information and multisource data. J. For. Res. 2023, 34, 963–976. [Google Scholar] [CrossRef] [Scilit]
- Uyanık, G.K.; Güler, N. A study on multiple linear regression analysis. Procedia-Soc. Behav. Sci. 2013, 106, 234–240. [Google Scholar] [CrossRef] [Scilit]
- Qiao, P.; Yang, S.; Lei, M.; Chen, T.; Dong, N. Quantitative analysis of the factors influencing spatial distribution of soil heavy metals based on geographical detector. Sci. Total Environ. 2019, 664, 392–413. [Google Scholar] [CrossRef] [Scilit] [PubMed]
- Peng, W.; Kuang, T.; Tao, S. Quantifying influences of natural factors on vegetation NDVI changes based on geographical detector in Sichuan, western China. J. Clean. Prod. 2019, 233, 353–367. [Google Scholar] [CrossRef] [Scilit]
- Wang, J.; Xu, C. Geodetector: Principle and prospective. Acta Geogr. Sin. 2017, 72, 116–134. [Google Scholar]
- Ji, J.; Jiang, L.; Liu, W.; Wang, L.; Zhang, W. Analysis on Influence Factors of Geological Hazards in Beijing-Tianjin-Hebei Urban Agelomeration Based on Multi parameters Optimized by Geodetector. Geogr. Geo-Inf. Sci. 2023, 39, 39–45. [Google Scholar]
- Liu, D.; Pan, P.; Fu, J.; Ouyang, X. Spatiotemporal variation and driving factor of vegetation coverage from 2000 to 2020 in southern Jiangxi Province, China. Chin. J. Appl. Ecol. 2023, 34, 2919–2928. [Google Scholar] [CrossRef] [Scilit] [PubMed]
- Wen, M.; He, X.; Liu, H.; Zhang, J.; Luo, C.; Jia, F.; Wang, Y.; Hu, Y. Analysis of the spatiotemporal variation characteristics and driving factors of grassland vegetation cover in Ningxia based on geographical detectors. Arid Zone Res. 2023, 40, 1322–1332. [Google Scholar] [CrossRef]
- Chen, S.; Guo, B.; Yang, F.; Han, B.; Fan, Y.; Yang, X.; He, T.; Liu, Y.; Yang, W. Spatial and temporal patterns of NPP and its response to climate change in the Qinghai-Tibet Plateau from 2000 to 2015. J. Nat. Resour. 2020, 35, 2511–2527. [Google Scholar] [CrossRef] [Scilit]
- Richardson, A.D.; Keenan, T.F.; Migliavacca, M.; Ryu, Y.; Sonnentag, O.; Toomey, M. Climate change, phenology, and phenological control of vegetation feedbacks to the climate system. Agric. For. Meteorol. 2013, 169, 156–173. [Google Scholar] [CrossRef] [Scilit]
- Svenning, J.C.; Sandel, B. Disequilibrium vegetation dynamics under future climate change. Am. J. Bot. 2013, 100, 1266–1286. [Google Scholar] [CrossRef] [Scilit] [PubMed]
- Su, C.; Fu, B. Evolution of ecosystem services in the Chinese Loess Plateau under climatic and land use changes. Glob. Planet. Change 2013, 101, 119–128. [Google Scholar] [CrossRef] [Scilit]
- Azaele, S.; Pigolotti, S.; Banavar, J.R.; Maritan, A. Dynamical evolution of ecosystems. Nature 2006, 444, 926–928. [Google Scholar] [CrossRef] [Scilit] [PubMed]
- Li, A.; Wu, J.; Huang, J. Distinguishing between human-induced and climate-driven vegetation changes: A critical application of RESTREND in inner Mongolia. Landsc. Ecol. 2012, 27, 969–982. [Google Scholar]
- Xu, L.; Yu, G.; Tu, Z.; Zhou, Y. Profile human-induced vegetation change in ArHorqin banner of China using time series datasets. In Proceedings of the 2017 IEEE International Geoscience and Remote Sensing Symposium (IGARSS), Fort Worth, TX, USA, 23–28 July 2017; pp. 1107–1110. [Google Scholar]
- Gao, B.; Yang, D.; Qin, Y.; Wang, Y.; Li, H.; Zhang, Y.; Zhang, T. Change in frozen soils and its effect on regional hydrology, upper Heihe basin, northeastern Qinghai–Tibetan Plateau. Cryosphere 2018, 12, 657–673. [Google Scholar] [CrossRef] [Scilit]
- Luo, D.; Jin, H.; He, R.; Wang, X.; Muskett, R.; Marchenko, S.; Romanovsky, V. Characteristics of water-heat exchanges and inconsistent surface temperature changes at an elevational permafrost site on the Qinghai-Tibet Plateau. J. Geophys. Res. Atmos. 2018, 123, 10057–10075. [Google Scholar]
- Wang, X.; Chen, G.; Wu, Q.; Cao, L.; Awange, J.; Song, Y.; Wu, M. Spatio-temporal patterns and drivers of carbon–water coupling in frozen soil zones across the gradients of freezing over the Qinghai-Tibet Plateau. J. Hydrol. 2023, 621, 129674. [Google Scholar]
- Zhu, Z.; Wang, H.; Harrison, S.P.; Prentice, I.C.; Qiao, S.; Tan, S. Optimality principles explaining divergent responses of alpine vegetation to environmental change. Glob. Change Biol. 2023, 29, 126–142. [Google Scholar]
- Shen, X.; Jiang, M.; Lu, X.; Liu, X.; Liu, B.; Zhang, J.; Wang, X.; Tong, S.; Lei, G.; Wang, S. Aboveground biomass and its spatial distribution pattern of herbaceous marsh vegetation in China. Sci. China Earth Sci. 2021, 64, 1115–1125. [Google Scholar] [CrossRef] [Scilit]
- Wang, Y.; Shen, X.; Jiang, M.; Tong, S.; Lu, X. Spatiotemporal change of aboveground biomass and its response to climate change in marshes of the Tibetan Plateau. Int. J. Appl. Earth Obs. Geoinf. 2021, 102, 102385. [Google Scholar] [CrossRef] [Scilit]
- Shen, X.; Shen, M.; Wu, C.; Peñuelas, J.; Ciais, P.; Zhang, J.; Freeman, C.; Palmer, P.I.; Liu, B.; Henderson, M. Critical role of water conditions in the responses of autumn phenology of marsh wetlands to climate change on the Tibetan Plateau. Glob. Change Biol. 2024, 30, e17097. [Google Scholar]
- Shen, J.; Evans, F.H. The potential of Landsat NDVI sequences to explain wheat yield variation in fields in Western Australia. Remote Sens. 2021, 13, 2202. [Google Scholar] [CrossRef] [Scilit]
- Wang, D.; Morton, D.; Masek, J.; Wu, A.; Nagol, J.; Xiong, X.; Levy, R.; Vermote, E.; Wolfe, R. Impact of sensor degradation on the MODIS NDVI time series. Remote Sens. Environ. 2012, 119, 55–61. [Google Scholar] [CrossRef] [Scilit]

Disclaimer/Publisher’s Note: The statements, opinions and data contained in all publications are solely those of the individual author(s) and contributor(s) and not of MDPI and/or the editor(s). MDPI and/or the editor(s) disclaim responsibility for any injury to people or property resulting from any ideas, methods, instructions or products referred to in the content. |
© 2026 by the authors. Licensee MDPI, Basel, Switzerland. This article is an open access article distributed under the terms and conditions of the Creative Commons Attribution (CC BY) license.