


Highlights
What are the main findings?
- A ConvTransformer framework was developed for estimating grassland GPP in Inner Mongolia.
- The model outperformed RF, GBRT, SVR, and EC-LUE, generating a daily 1 km GPP dataset (2003–2018).
What are the implications of the main findings?
- The framework improves the representation of spatiotemporal dynamics in arid and semi-arid grasslands and enhances regional GPP estimation accuracy.
- The generated long-term high-resolution GPP dataset provides valuable support for carbon cycle research, ecological monitoring, and sustainable grassland management.
Abstract
Understanding ecosystem carbon processes relies heavily on the reliable assessment of gross primary productivity (GPP) yet remains challenging in the Inner Mongolia grasslands due to data scarcity and high uncertainty among existing products. We developed a ConvTransformer-based framework that exploits complementary information from satellite observations and meteorological datasets to enhance the representation of complex spatiotemporal dependencies in grassland ecosystems. Grounded in leave-one-site-out cross-validation across six eddy covariance sites, the model achieved average performance metrics of R2 = 0.59, RMSE = 1.40 g C m−2 d−1, Bias = −0.31 g C m−2 d−1, and KGE = 0.46, outperforming traditional machine learning models (RF, GBRT, and SVR) as well as the light use efficiency model (EC-LUE) in both accuracy and robustness. Using this framework, we generated a daily GPP dataset at spatial granularity of 1 km for the Inner Mongolia grasslands from 2003 to 2018. The results reveal a clear spatial gradient, with GPP decreasing from southeast to northwest. Comparisons with established products, including FLUXCOM, BESS V2, and PML V2, show strong spatial consistency and reduced discrepancies, supporting the reliability of the estimates. Overall, the proposed framework provides an effective approach for characterizing regional carbon dynamics and supports long-term ecological monitoring in semi-arid regions.
1. Introduction
In research on carbon cycling within land ecosystems, gross primary productivity (GPP) is considered a central quantitative indicator and characterizes the photosynthetic carbon assimilation rate of vegetation. Beyond directly reflecting ecosystem carbon sequestration capacity, it serves as an important metric for quantifying climate change impacts and supporting the development of sustainable environmental policies at broader scales [1]. Grasslands are estimated to cover approximately 22.8% of the terrestrial land surface [2]. Their GPP constitutes an important part of the remaining carbon budget and has a considerable impact on atmospheric carbon regulation [3]. Particularly, the Inner Mongolia grassland, as the biggest temperate grassland region in China [4], exhibits high sensitivity and vulnerability to climate change. Therefore, accurately assessing grassland GPP in Inner Mongolia is essential for elucidating regional ecosystem functions and carbon sequestration processes, along with how climate alters them.
Current GPP estimation approaches can be broadly classified into flux-based observations and remote sensing-based methods. Flux-based techniques, such as Eddy Covariance (EC), provide direct and continuous measurements of ecosystem–atmosphere carbon exchange, enabling reliable site-scale GPP estimation [5,6]. Through subsequent data processing and model inversion, ecosystem GPP can be derived from net ecosystem exchange observations. Although EC measurements provide temporally continuous flux data at the ecosystem scale, they are spatially discrete and associated with considerable installation and maintenance costs, making this method unsuitable for spatially continuous GPP estimation at regional scales [7,8]. In contrast, remote sensing techniques can acquire spatially continuous information on variables closely related to GPP, thereby opening new avenues for large-scale GPP retrieval [9]. Remote sensing-based GPP estimation methods primarily include ecological process models, light use efficiency (LUE) models, and machine learning methods [10]. Ecological process models integrate detailed representations of surface energy balance, plant physiological processes, and biogeochemical cycles, offering strong mechanistic interpretability [11,12]. However, these models depend on extensive input datasets, whose acquisition with reliable spatiotemporal coverage over large regions remains challenging, thus increasing model uncertainty [13]. While LUE models combine a simplified physical representation of photosynthetic processes with the advantage of spatially continuous input data, their performance is still influenced by variations in maximum light use efficiency (), heterogeneous environmental conditions, and complex vegetation compositions, leading to significant uncertainties and limited explanatory power in heterogeneous landscapes [9,14]. Furthermore, in regions such as the Inner Mongolia grasslands, characterized by harsh climatic conditions, strong environmental heterogeneity, and limited high-quality observational data, these challenges are further exacerbated, making accurate GPP estimation particularly difficult.
Driven by advances in remote sensing big data and artificial intelligence, machine learning models are now widely adopted for GPP estimation. A variety of models, including Random Forest (RF), Categorical Boosting (CatBoost), Support Vector Regression (SVR) [15,16,17], as well as deep learning architectures such as Deep Neural Networks (DNN), Convolutional Neural Networks (CNN) and Long Short-Term Memory (LSTM) networks, have been widely used to integrate multi-source remote sensing and meteorological data [18,19,20]. These approaches have demonstrated clear advantages over traditional methods, particularly in improving prediction accuracy across heterogeneous ecosystems. Zhou et al. [21] utilized a backpropagation neural network to assimilate ground-based phenological greenness metrics and satellite-derived vegetation indices, resulting in more accurate daily GPP estimates than the LUE model. In addition, Biegel et al. [22] trained LSTM, multilayer perceptron, and theory-based P-model frameworks for GPP prediction, demonstrating that LSTM-based models are capable of capturing temporal dependencies and lag effects in ecosystem processes and achieved the highest predictive accuracy among the evaluated models. Despite these advances, existing approaches still face challenges in jointly capturing fine-scale spatial heterogeneity and long-range temporal dependencies, especially under strong environmental variability. This limitation restricts their applicability in complex regions such as the Inner Mongolia grasslands.
To address the above limitations in jointly capturing spatial heterogeneity and long-range temporal dependencies, recent studies have explored advanced deep learning architectures capable of integrating both spatial and temporal information. Among these, the ConvTransformer model, which incorporates convolutional operations into the Transformer framework, has emerged as a promising approach [23]. By leveraging convolutional layers for local spatial feature extraction and self-attention mechanisms for modeling global temporal dependencies, ConvTransformer enables more effective representation of complex spatiotemporal patterns. This architecture has demonstrated strong performance in fields such as computer vision and time-series forecasting [24,25]. However, despite its advantages, the direct application of ConvTransformer in GPP estimation remains largely unexplored. Existing attention-based studies in GPP modeling have mainly adopted standard Transformer-related structures, including the Temporal Fusion Transformer for global hourly GPP upscaling [26] and the LSTM-Transformer-Group model for predicting future GPP changes in Central Asia [27]. These studies indicate the potential of attention mechanisms for representing temporal dependencies in ecosystem productivity, but they do not explicitly embed convolutional operations into the attention mechanism to capture local eco-physiological responses. Compared with these studies, the ConvTransformer used in this study introduces one-dimensional convolution into the self-attention framework, enabling local temporal feature extraction and long-range dependency modeling to be integrated within a unified architecture. In particular, its potential for capturing the coupled spatiotemporal dynamics of ecosystem productivity under heterogeneous environmental conditions has not yet been fully investigated.
Against this background, this study focuses on the Inner Mongolia grassland, aiming to develop and apply a coupled ConvTransformer model for grassland GPP estimation. We will systematically evaluate the performance of the proposed model across multiple dimensions and thoroughly analyze its ability to characterize the spatiotemporal dynamics of regional GPP. Specifically, the objectives of this study include the following: (1) to construct a ConvTransformer framework for grassland GPP estimation; (2) to comprehensively assess model performance using multiple evaluation criteria; and (3) to generate spatially explicit GPP distributions for the Inner Mongolia grasslands during the period 2003–2018 using the proposed ConvTransformer model.
2. Study Area and Data
2.1. Study Area
The Inner Mongolia grassland extends across northern China. Most areas occur at elevations greater than 1000 m. The terrain generally decreases from west to east and from south to north. Geographically, the region extends from 97°12′ to 126°04′ E and from 37°24′ to 53°23′ N, covering a total area of approximately 1.183 million km2, which accounts for about 12.3% of China’s total land area [4].
The climate of the Inner Mongolia grassland is dominated by a temperate continental monsoon regime and spans three major climatic zones, temperate semi-humid, semi-arid, and arid regions, resulting in a pronounced climatic gradient across the study area [28]. The mean annual air temperature ranges from 0 to 8 °C and generally exhibits an increasing trend from east to west. In contrast, the mean annual precipitation varies between 50 and 450 mm and displays a decreasing gradient from east to west, opposite to the temperature pattern, with substantial spatial heterogeneity [29]. This inverse distribution of heat and moisture leads to a pronounced imbalance in hydrothermal conditions across the grassland. The region frequently experiences meteorological hazards such as droughts and cold surges, rendering it highly sensitive to climate variability and change and ecologically fragile. Therefore, accurate estimation of grassland GPP in Inner Mongolia is of critical importance for advancing our understanding of grassland ecosystem functioning and carbon sequestration processes, along with how climate alters them.
2.2. Eddy Covariance Flux Observations
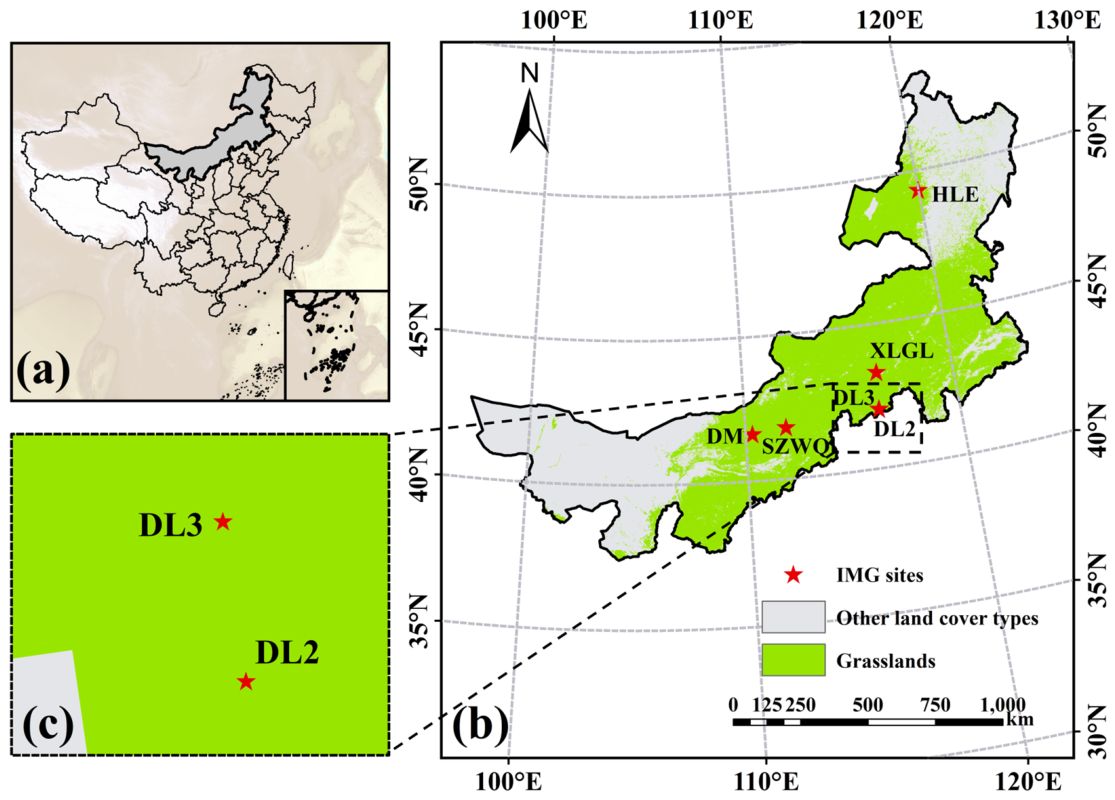
The study leveraged EC observations and meteorological originating from 6 grassland sites, with collection from FLUXNET (https://fluxnet.org), ChineseFLUX (https://www.chinaflux.org), Science Data Bank (SDB) and Chinese Academy Of Agricultural Science (CAAS) (Table 1, Figure 1). If more than 25% of one-day measurements were invalid, the observations of the day were considered missing.
Table 1.
Summary of six grassland EC flux sites in Inner Mongolia, including the Site Code, Name, Location (N, °E), Mean Annual Temperature (MAT, °C), Mean Annual Precipitation (MAP, mm), Elevation (Elev, m), Duration, Project and Reference.
Figure 1.
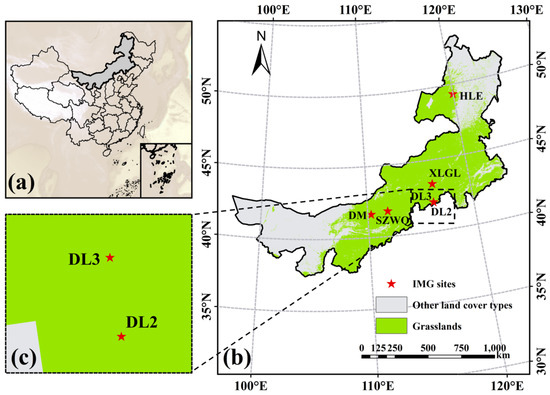
Study domains of the Inner Mongolia. (a) Location of Inner Mongolia in China. (b) Locations of six grassland sites and distributions of grasslands over Inner Mongolia. (c) Area amplification.
2.3. Remote Sensing and Meteorological Datasets
We integrated multi-source remote sensing and meteorological datasets in this study. Land cover-type data were obtained from the MODIS MCD12Q1 product, which provides a spatial resolution of 500 m and an annual temporal resolution. To ensure consistency with other datasets, the MCD12Q1 product was resampled to a 1 km spatial resolution using the nearest neighbor method. Grassland areas were then extracted based on the International Geosphere Biosphere Program (IGBP) classification scheme, using class code 10.
We further utilized the Global Land Surface Satellite (GLASS) dataset [35,36,37,38]. We used its photosynthetically active radiation (PAR), fraction of photosynthetically active radiation (FPAR), net radiation (), and latent heat flux (LE), which are provided at 0.05° in space and aggregated over 8-day periods. These variables were converted to a daily temporal resolution using linear interpolation and subsequently resampled to 1 km to conform to the spatial framework defined for this study.
Meteorological data were derived from the China Meteorological Forcing Dataset (CMFD) version 1.6 provided by the National Qinghai–Tibet Plateau Science Data Center [39]. The temporal coverage of CMFD version 1.6 determined the study period of 2003–2018. This dataset originally provides meteorological variables at 10 km in space and a temporal sampling interval of 3 h. Only near-surface air temperature was selected as the meteorological input variable. The temperature data were first aggregated to daily values and then downscaled to a 1 km grid spacing using bilinear interpolation to ensure compatibility with the remote sensing datasets.
To further evaluate the performance and reliability of the generated daily 1 km GPP product, three widely recognized global GPP datasets—FLUXCOM, BESS V2, and PML V2—were employed for inter-comparison. These datasets serve as independent benchmarks to assess the spatiotemporal consistency and performance of the proposed model in the Discussion section. Detailed information, including their underlying models, spatial and temporal resolutions, and scale conversion methods, is summarized in Table 2.
Table 2.
Summary of the three global GPP products used for model evaluation.
3. Methodology
3.1. ConvTransformer Architecture
To reconcile local environmental variability with long-range temporal dependence in GPP dynamics, we propose a hybrid deep learning framework termed ConvTransformer [25]. The architectural design is motivated by the eco-physiological mechanisms governing photosynthesis. GPP responds instantaneously to environmental forcing—such as radiation and temperature—while simultaneously exhibiting pronounced seasonal cycles and interannual variability. Therefore, an effective model must jointly characterize short-term local fluctuations and long-term temporal dependencies within a unified structure.
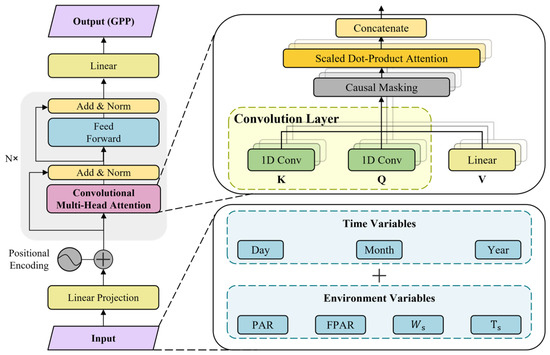
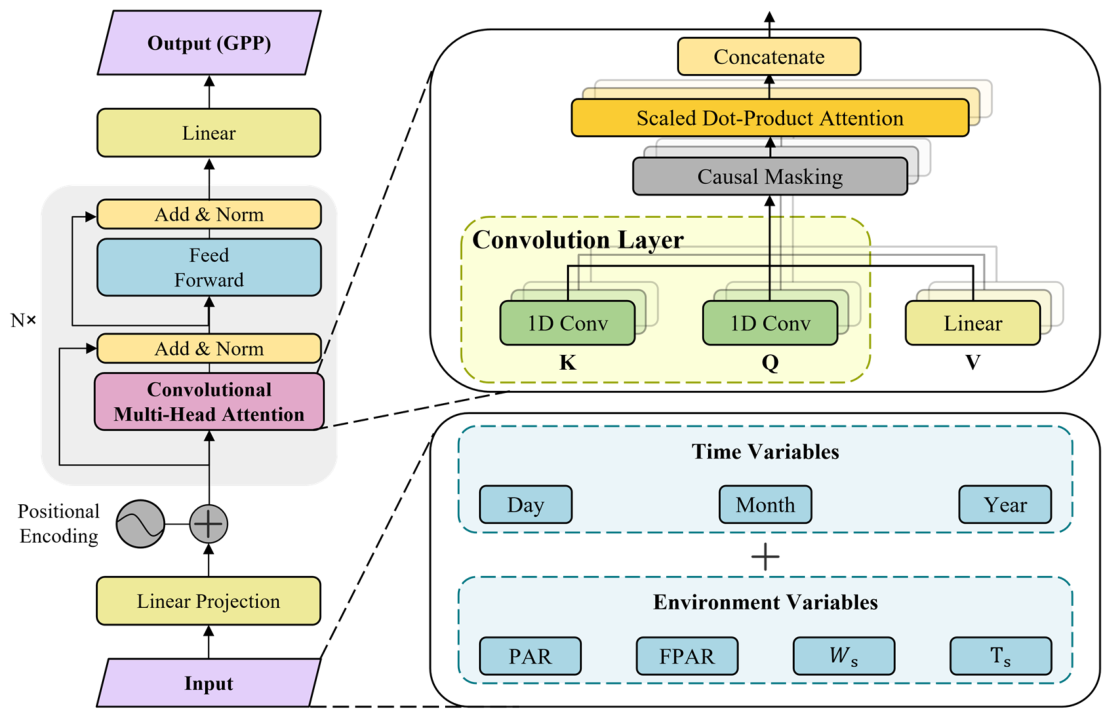
The ConvTransformer integrates one-dimensional convolutional operations with self-attention mechanisms to achieve this objective. Convolutional layers are employed to extract local temporal patterns from environmental drivers, whereas the attention module captures global dependencies across extended time horizons. This coupling enables the model to reflect both the continuous ecological response to environmental stress and the cumulative effects embedded in long time series. As shown in Figure 2, the ConvTransformer architecture consists of three key components, which are detailed in the following sections: a convolutional attention mechanism that enhances temporal feature extraction, a physically interpretable input-variable design based on environmental and temporal drivers, and an output module that converts the learned temporal representation into deterministic GPP estimates.
Figure 2.
Schematic architecture of the proposed ConvTransformer model for GPP estimation. The input variables include photosynthetically active radiation (PAR), fraction of photosynthetically active radiation (FPAR), water stress factor (), temperature constraint factor (), and temporal variables. Q, K, and V denote query, key, and value, respectively; 1D Conv denotes one-dimensional convolution; Add & Norm denotes residual addition and layer normalization.
- (1)
- Convolutional Attention Mechanism: In the ConvTransformer, the input sequence (comprising concatenated environmental and temporal features) is first projected into a hidden space via a linear embedding layer and positional encoding. Unlike the standard Transformer, which generates query (Q), key (K), and value (V) representations through linear projections, the ConvTransformer introduces a convolutional structure to encode local temporal context into the attention scoring process. Specifically,
The convolutional kernels provide localized receptive fields that explicitly capture short-term environmental variability across adjacent time steps. By embedding local correlation priors into the Q and K representations, the attention mechanism becomes more sensitive to ecologically meaningful temporal transitions. To ensure temporal causality, a causal masking matrix M is incorporated:
the upper triangular elements of M are assigned , enforcing zero attention weights for future states and preserving the physical consistency of temporal forecasting.
- (2)
- Input Variable: Input features are selected based on eco-physiological principles. Temporal variables include day, month and year indicators, characterizing diurnal and phenological rhythms. Environmental variables comprise PAR, FPAR, temperature constraint factor () and water stress factor ().
By incorporating variables with explicit biophysical interpretations, the ConvTransformer operates within a physically interpretable domain, mitigating “black-box” behavior through structured input design.
- (3)
- Output Formulation: The attention-derived representation is processed through residual connections, layer normalization, and a position-wise feed-forward network (FFN). The model generates parameters for a probability distribution (, ); however, for deterministic GPP estimation, only the mean value of the final time step is utilized:
3.2. Comparison with Other GPP Methods
To comprehensively evaluate the accuracy and generalization capability of the ConvTransformer model, four benchmark models were selected for comparison, including three representative machine learning approaches: RF, Gradient Boosting Regression Trees (GBRT), and SVR, as well as the EC-LUE model adapted from the LUE framework.
3.2.1. Random Forest
RF adopts an ensemble strategy grounded in bootstrap aggregation [43], where numerous decision trees are generated from resampled datasets, while random subsets of features are selected at each split to enhance model diversity. Each tree independently learns input–output relationships; the ensemble output is computed as the average of predictions generated by individual trees. This mechanism reduces variance and improves robustness against overfitting [44].
3.2.2. Gradient Boosting Regression Trees
GBRT adopt a boosting-driven ensemble framework [45], in which decision trees are added iteratively, with each new component focusing on correcting the errors of the current model. Through this stage-wise additive learning process, GBRT gradually corrects prediction errors and captures complex nonlinear relationships between variables [46].
3.2.3. Support Vector Regression
SVR is a kernel-based regression method grounded in statistical learning theory [47]. It constructs a regression function by maximizing the margin within a predefined error tolerance. By introducing kernel functions, SVR maps input variables into a high-dimensional feature space, where nonlinear relationships can be represented linearly. Only a subset of training samples (support vectors) contributes to the final model [48].
3.2.4. EC-LUE
The EC-LUE model is a LUE model derived from LUE theory [49,50]. It assumes that GPP is proportional to absorbed photosynthetically active radiation, while actual LUE is regulated by environmental constraints. The model is expressed as
where is the maximum LUE. and represent temperature and water stress constraint factors, respectively, and they are defined as
where is air temperature; , and denote minimum (0 °C), maximum (40 °C) and the optimum (20.33 °C) air temperatures for photosynthesis [51].
3.3. Experimental Setup
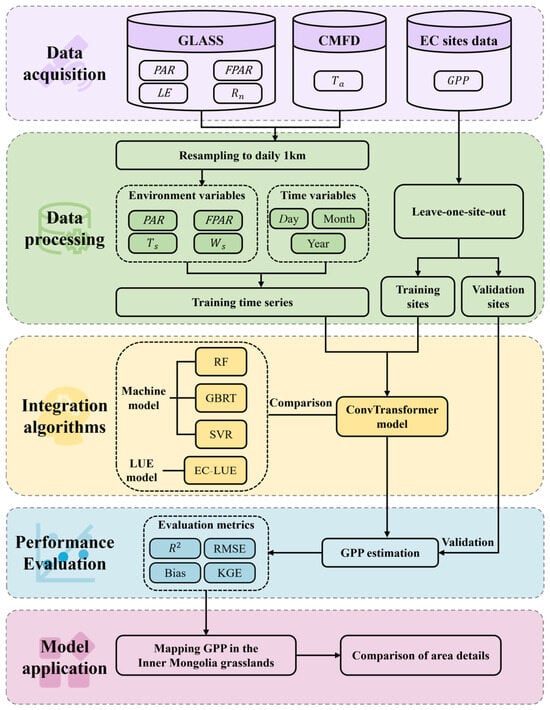
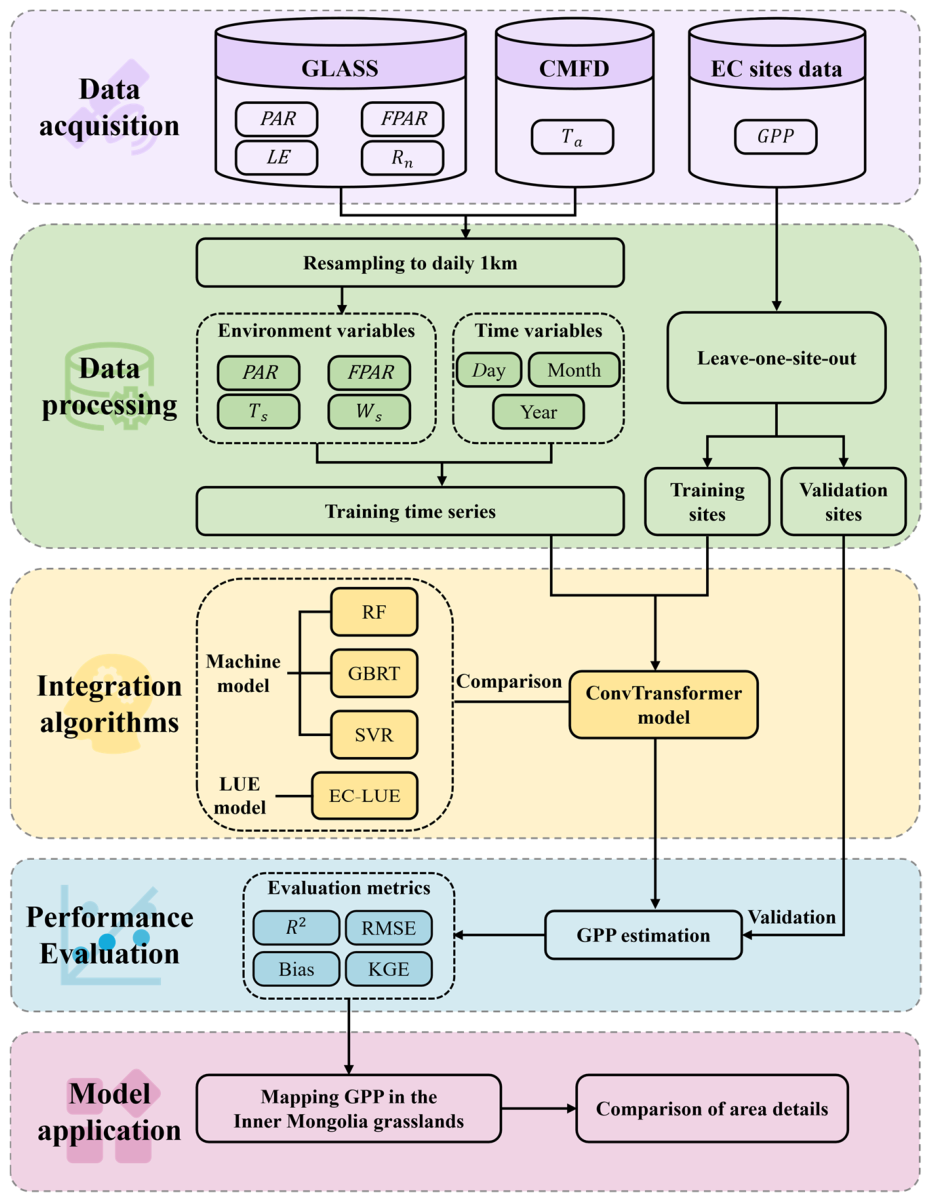
To construct the model, GPP observations were extracted from EC flux tower sites. The input variables included PAR, FPAR, , and LE derived from the GLASS product, as well as obtained from the CMFD. These variables were further combined with temporal features (day, month, and year) from the observation sites to form the model inputs (Figure 3). To improve robustness and cross-site generalization, a combination of leave-one-site-out cross-validation and multi-site pooled training was implemented in this study. Specifically, among the six observation sites, one site served as an independent testing site per round, while data from the remaining five sites were employed for model training. Therefore, repeating this procedure six times allowed each site to serve as the validation site once. Such a strategy ensures complete spatial independence between training and validation datasets, preventing data from the same site from being used simultaneously for both purposes and thus enabling a more objective assessment of the model’s cross-regional generalization capability.
Figure 3.
Overall workflow for GPP estimation and model application in Inner Mongolia grasslands. The workflow shows the complete procedure from multi-source data acquisition and preprocessing to model training, validation, comparison, and regional GPP mapping.
In terms of parameter settings for the ConvTransformer model, a sliding window strategy was adopted to construct supervised learning samples. Considering the short-term continuity of meteorological drivers influencing GPP, the window length was set to 5. Specifically, five consecutive time steps of input features were used to predict the GPP at the sixth time step, forming a many-to-one time series prediction structure. This configuration effectively captures local temporal dependencies while enhancing training stability under multi-site joint modeling. With respect to model architecture, the ConvTransformer employs two stacked encoder modules, with each module integrating multi-head attention mechanisms and FFN components, with the number of attention heads set to eight. To mitigate overfitting, a Dropout ratio of 0.1 was utilized for regularization. Model parameters were optimized using the Adam optimizer. The selected window length and architectural hyperparameters balance representational capacity, computational efficiency, and generalization performance, making this model effectively learn the temporal dynamics of GPP.
For the RF, GBRT, and SVR models, hyperparameter optimization was systematically conducted using the GridSearchCV module in scikit-learn. A predefined parameter grid was constructed for each model, and an exhaustive search strategy with cross-validation served to identify the optimal set of hyperparameters that yields the highest predictive accuracy, making a fair and robust comparison among different machine learning models by minimizing the influence of suboptimal parameter settings. For the EC-LUE model, was fixed at 2.14, consistent with Yuan et al. [49]. This choice represents a standard empirical constant in LUE-based models and ensures a consistent foundation for comparison against our data-driven approaches.
3.4. Evaluation Metrics
We thoroughly evaluated diverse algorithms’ effectiveness, using several indicators such as Bias, Root-Mean-Square Error (RMSE), Coefficient of Determination (), and the Kling–Gupta Efficiency (KGE). KGE, functioning as an integrated evaluation index, which comprises the correlation coefficient (), relative variability ratio (), and average value ratio () [52]:
where ED represents the ideal Euclidian distance; and are the standard deviations of estimations and in situ GPP; and and are the means of estimations and in situ GPP. The ideal , , and are all equal to 1 without prediction errors. Hence, the ideal KGE is equivalent to 1.
4. Results
4.1. Model Evaluation Using Leave-One-Out Cross-Validation
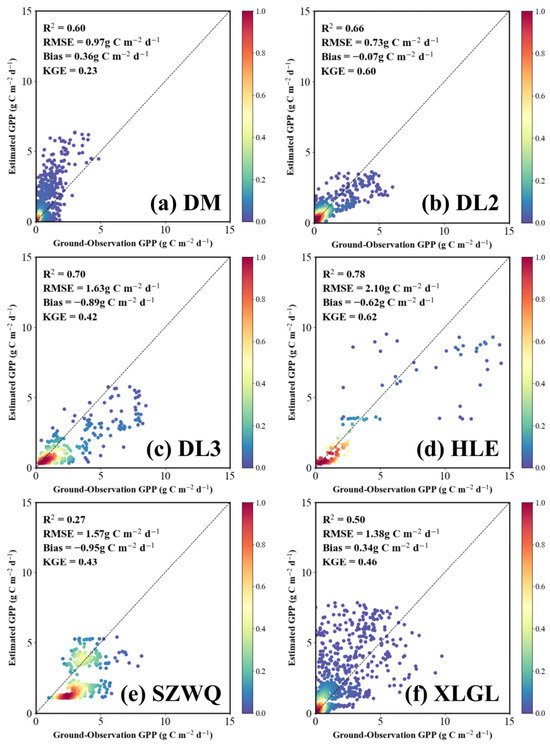
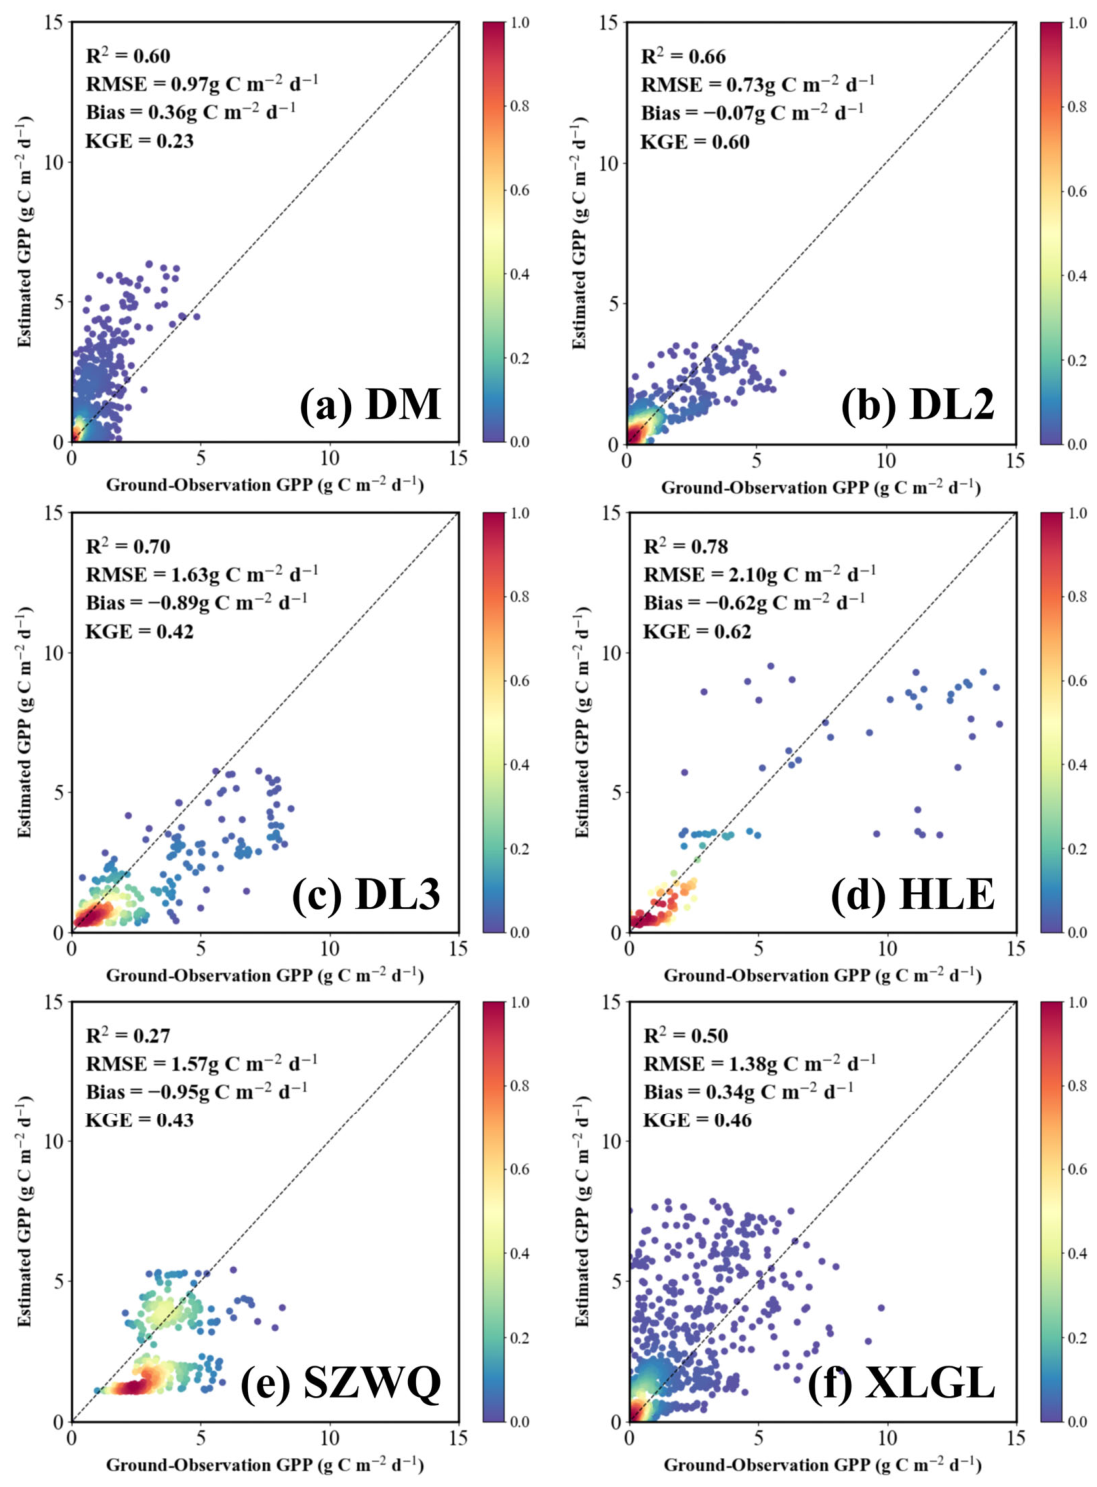
To rigorously evaluate model generalization, we employed a leave-one-site-out cross-validation strategy to independently validate GPP simulation performance at six sites: DM, DL2, DL3, HLE, SZWQ, and XLGL (Figure 4).
Figure 4.
Scatterplots of ConvTransformer-estimated GPP versus ground-observed GPP. (a–f) Independent validation results at the DM, DL2, DL3, HLE, SZWQ and XLGL sites, respectively. The color bar covers the range from space (0) to dense (1).
The model demonstrated strong performance across the validation sites, with clear differences in accuracy among locations. The HLE site achieved the best performance (KGE = 0.62, = 0.78), indicating a strong ability to capture both temporal dynamics and variability. Similarly, the DL2 site showed high accuracy, with a KGE of 0.60, RMSE of 0.73 , and near-zero Bias, reflecting excellent agreement in correlation, magnitude, and variability. Moderate performance was observed at several sites. The XLGL site achieved a of 0.50, RMSE of 1.38 , Bias of 0.34 and KGE of 0.46, indicating a balanced performance with moderate uncertainty. The DL3 and SZWQ sites showed comparable performance, with KGEs of 0.42 and 0.43, respectively, further demonstrating the model’s applicability across different grassland types. Relatively lower performance was found at the DM site, where the KGE was 0.23 despite a moderate of 0.60, suggesting that the model captured temporal correlation but had limitations in representing variability and bias. This discrepancy is likely attributable to the site’s pronounced aridity (MAP = 225.2 mm) and high elevation (1409 m), which impose severe water constraints and physiological stress that are challenging to fully parameterize.
Overall, the model achieved an average KGE of 0.46 across the six sites, with two sites exceeding 0.60. The outcomes reveal a robust model that can reproduce grassland carbon flux dynamics across heterogeneous environmental conditions, with particularly strong performance at high-quality sites.
4.2. Comparison with Other GPP Methods
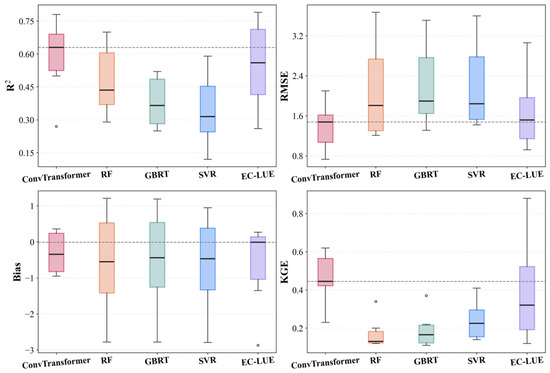
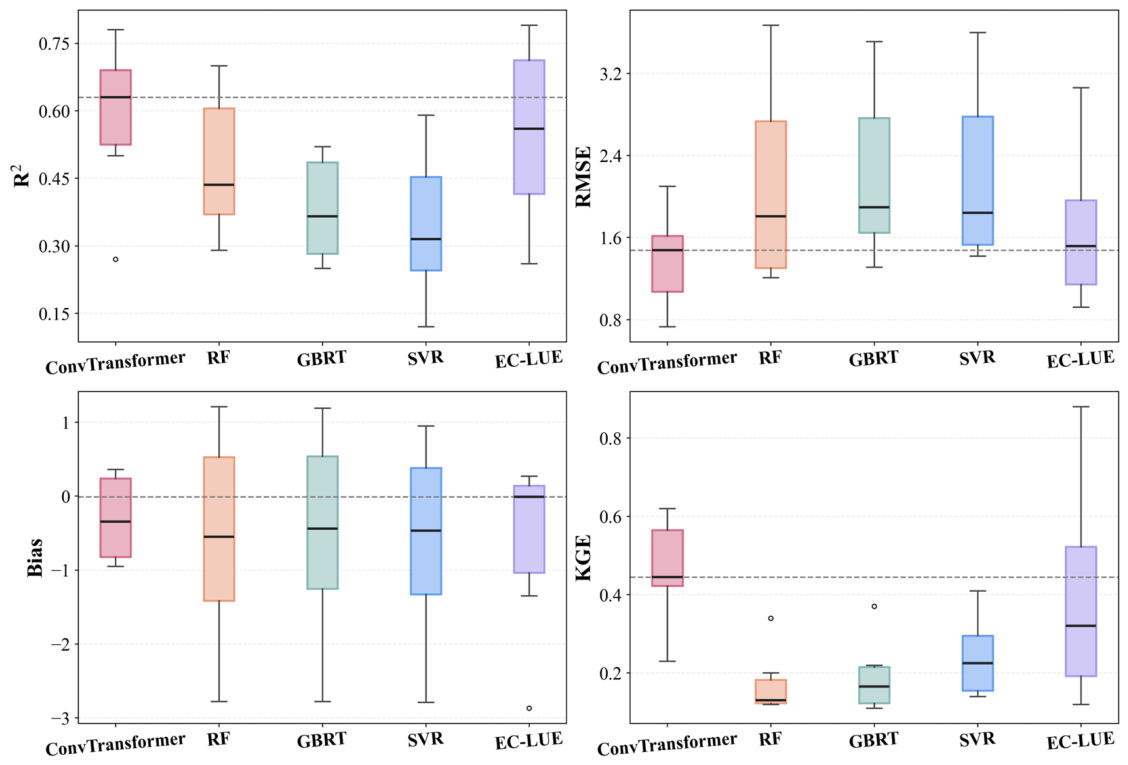
To rigorously evaluate the performance of the ConvTransformer in GPP estimation, a comparative assessment was conducted against four representative benchmarks, including three machine learning models (RF, GBRT, and SVR) and a LUE model (EC-LUE). Model performance was first characterized using boxplots (Figure 5), which summarize the distributional properties across four key metrics (, RMSE, Bias, and KGE), enabling a joint assessment of central tendency and dispersion at the site scale. The ConvTransformer exhibits superior predictive skill, with a median of 0.63, exceeding RF (0.44), GBRT (0.36), and SVR (0.32) by 0.2–0.3, remaining slightly higher than EC-LUE (0.56). Its median KGE (0.45) is also substantially higher than RF, GBRT, and SVR (0.13–0.23) and moderately higher than EC-LUE (0.32). In terms of RMSE, the ConvTransformer achieves the lowest median (1.48 ), improving by 0.33–0.42 over the machine learning models and slightly outperforming EC-LUE (1.52 ). Meanwhile, its narrower interquartile ranges indicate reduced dispersion and stronger cross-site robustness. Regarding Bias, the median value for ConvTransformer (−0.35 ) is slightly higher, while EC-LUE shows a median of −0.01 ; nevertheless, ConvTransformer exhibits a more symmetric and tightly bounded distribution, whereas EC-LUE displays a wider spread, indicating less stable error behavior.
Figure 5.
Boxplots of model performance across six sites for , RMSE, Bias, and KGE. The gray horizontal dashed line in each panel indicates the median value of the best-performing model for the corresponding metric, defined as the model with the highest median and KGE, the lowest median RMSE, and the median Bias closest to zero.
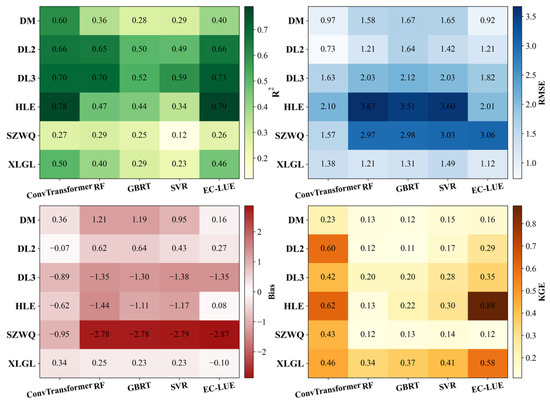
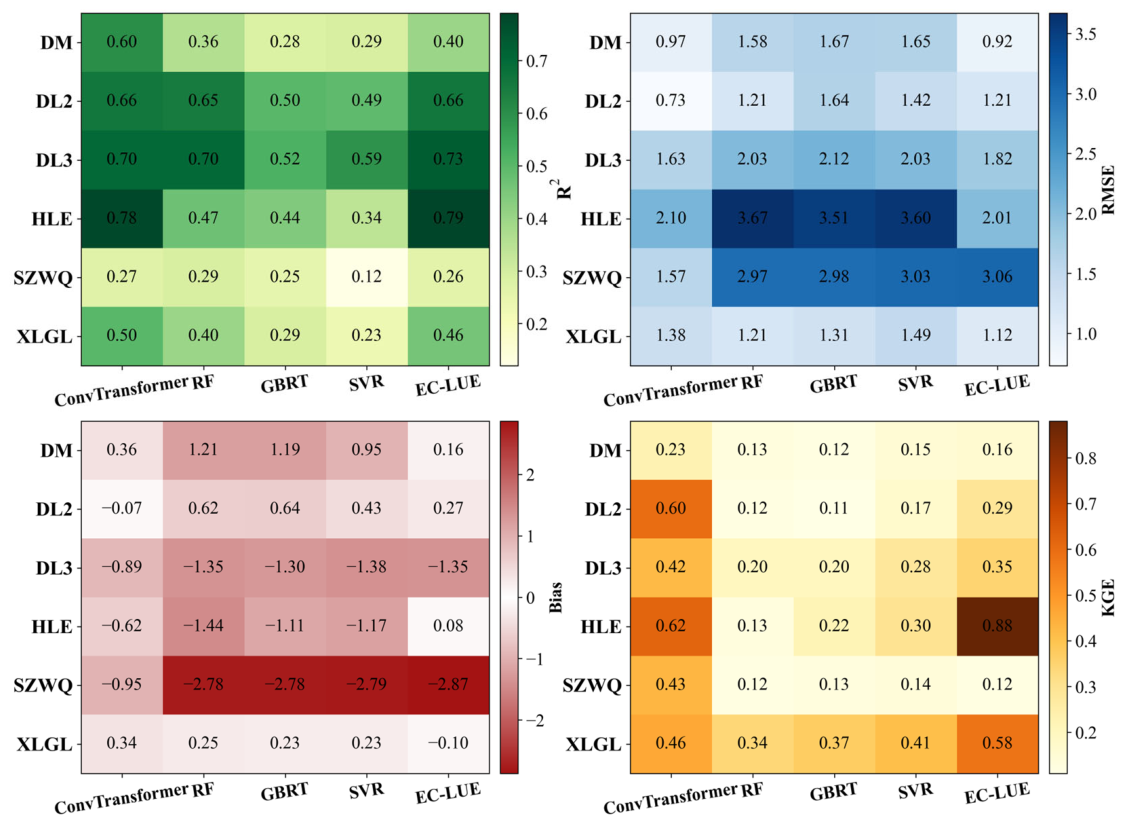
A minor outlier is observed in the distribution of the ConvTransformer, yet its overall variability remains constrained. To further attribute this deviation, Figure 6 provides a site-resolved perspective. The heatmap reveals pronounced spatial heterogeneity, with certain sites (e.g., SZWQ) consistently exhibiting low (0.12–0.29) across all models, indicating that the observed outlier originates from site-specific complexity rather than model instability. Notably, under such challenging conditions, the ConvTransformer maintains relatively higher predictive skill and mitigates the magnitude of negative Bias compared to the benchmark approaches. Across most sites, particularly HLE and DL3, the ConvTransformer achieves the highest accuracy, demonstrating its capacity to account for both time-varying patterns and spatial heterogeneity. Although EC-LUE performs well at individual sites, its performance is less consistent across the sites.
Figure 6.
Heatmap of site-specific performance metrics for each model.
4.3. Spatial Patterns of Grassland GPP in Inner Mongolia
4.3.1. Annual Mean Spatial Distribution
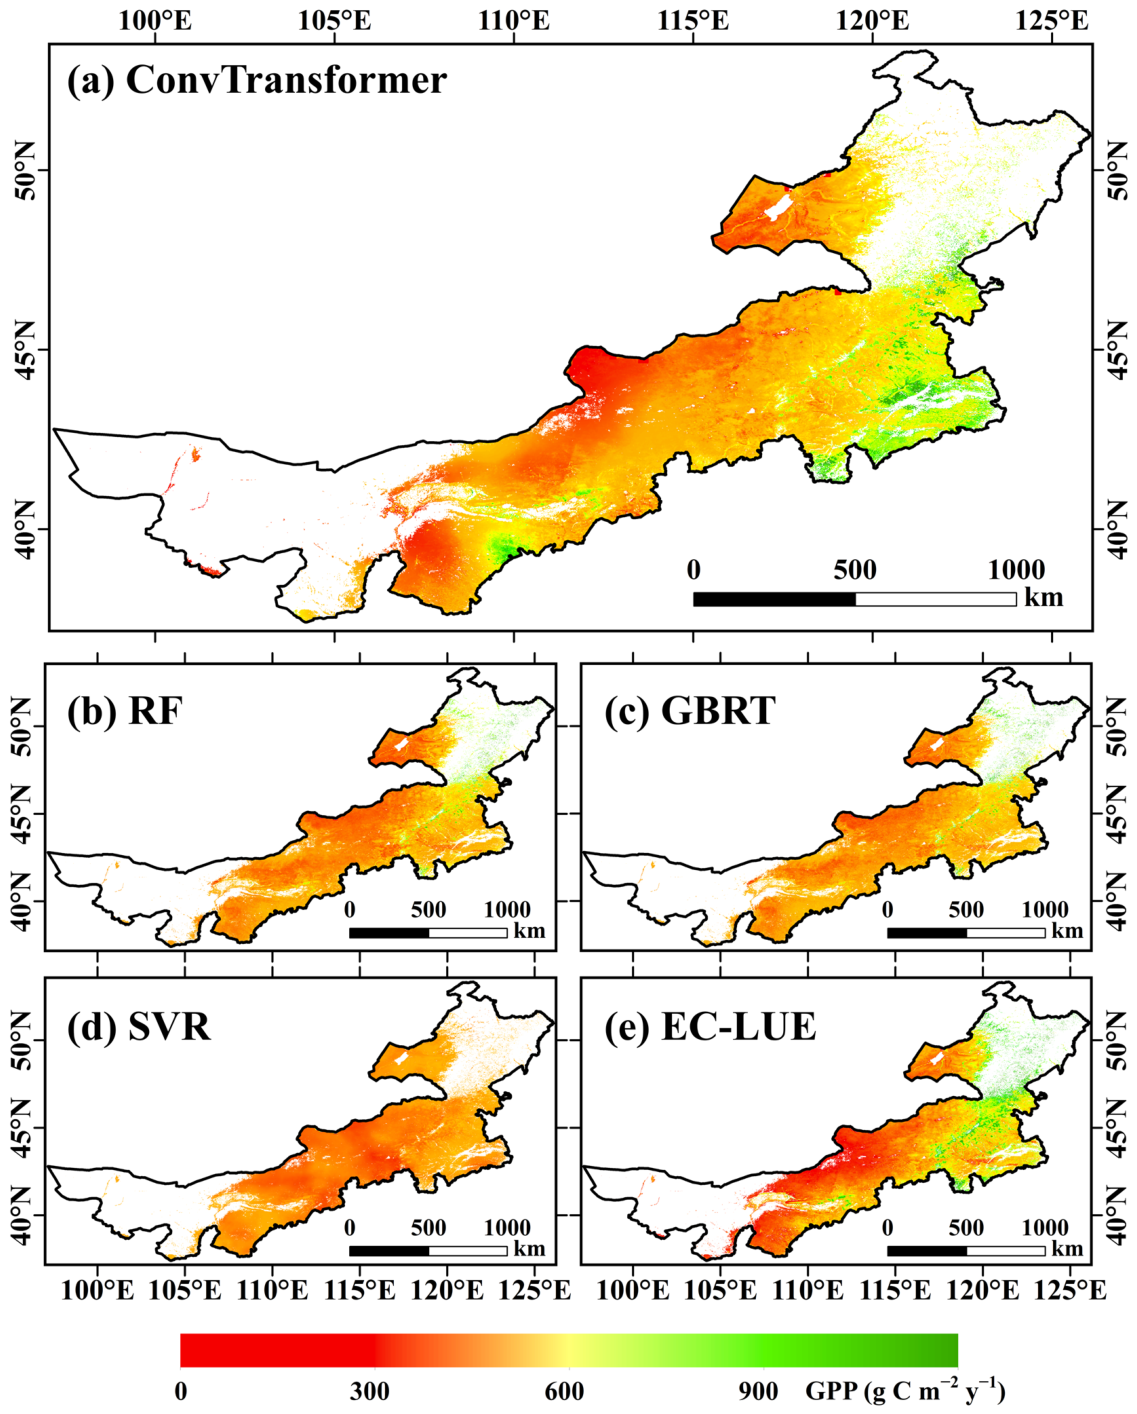
The map of the multi-year (2003–2018) average annual GPP across the Inner Mongolia grasslands is shown in Figure 7. The ConvTransformer reproduces a clear large-scale gradient, with GPP decreasing from the southeastern to the northwestern regions. Relatively high values are concentrated in the southeastern part of the study area, generally exceeding 500 , while low values, typically below 100 , dominate the northwestern regions. This pattern is consistent with the regional hydrothermal gradient.
Figure 7.
Spatial distribution of multi-year mean annual GPP over the Inner Mongolia grasslands estimated by the ConvTransformer and benchmark models (2003–2018).
In comparison, RF, GBRT, and EC-LUE produce spatial patterns largely consistent with that of the ConvTransformer, all capturing the dominant gradient. In contrast, the SVR results exhibit a more fragmented spatial structure, with weaker continuity in transitional regions. Additionally, the ConvTransformer identifies a localized high-value area in the southwestern region, which is less pronounced in RF and GBRT and only partially captured by EC-LUE, indicating differences in sensitivity to localized environmental variability among models.
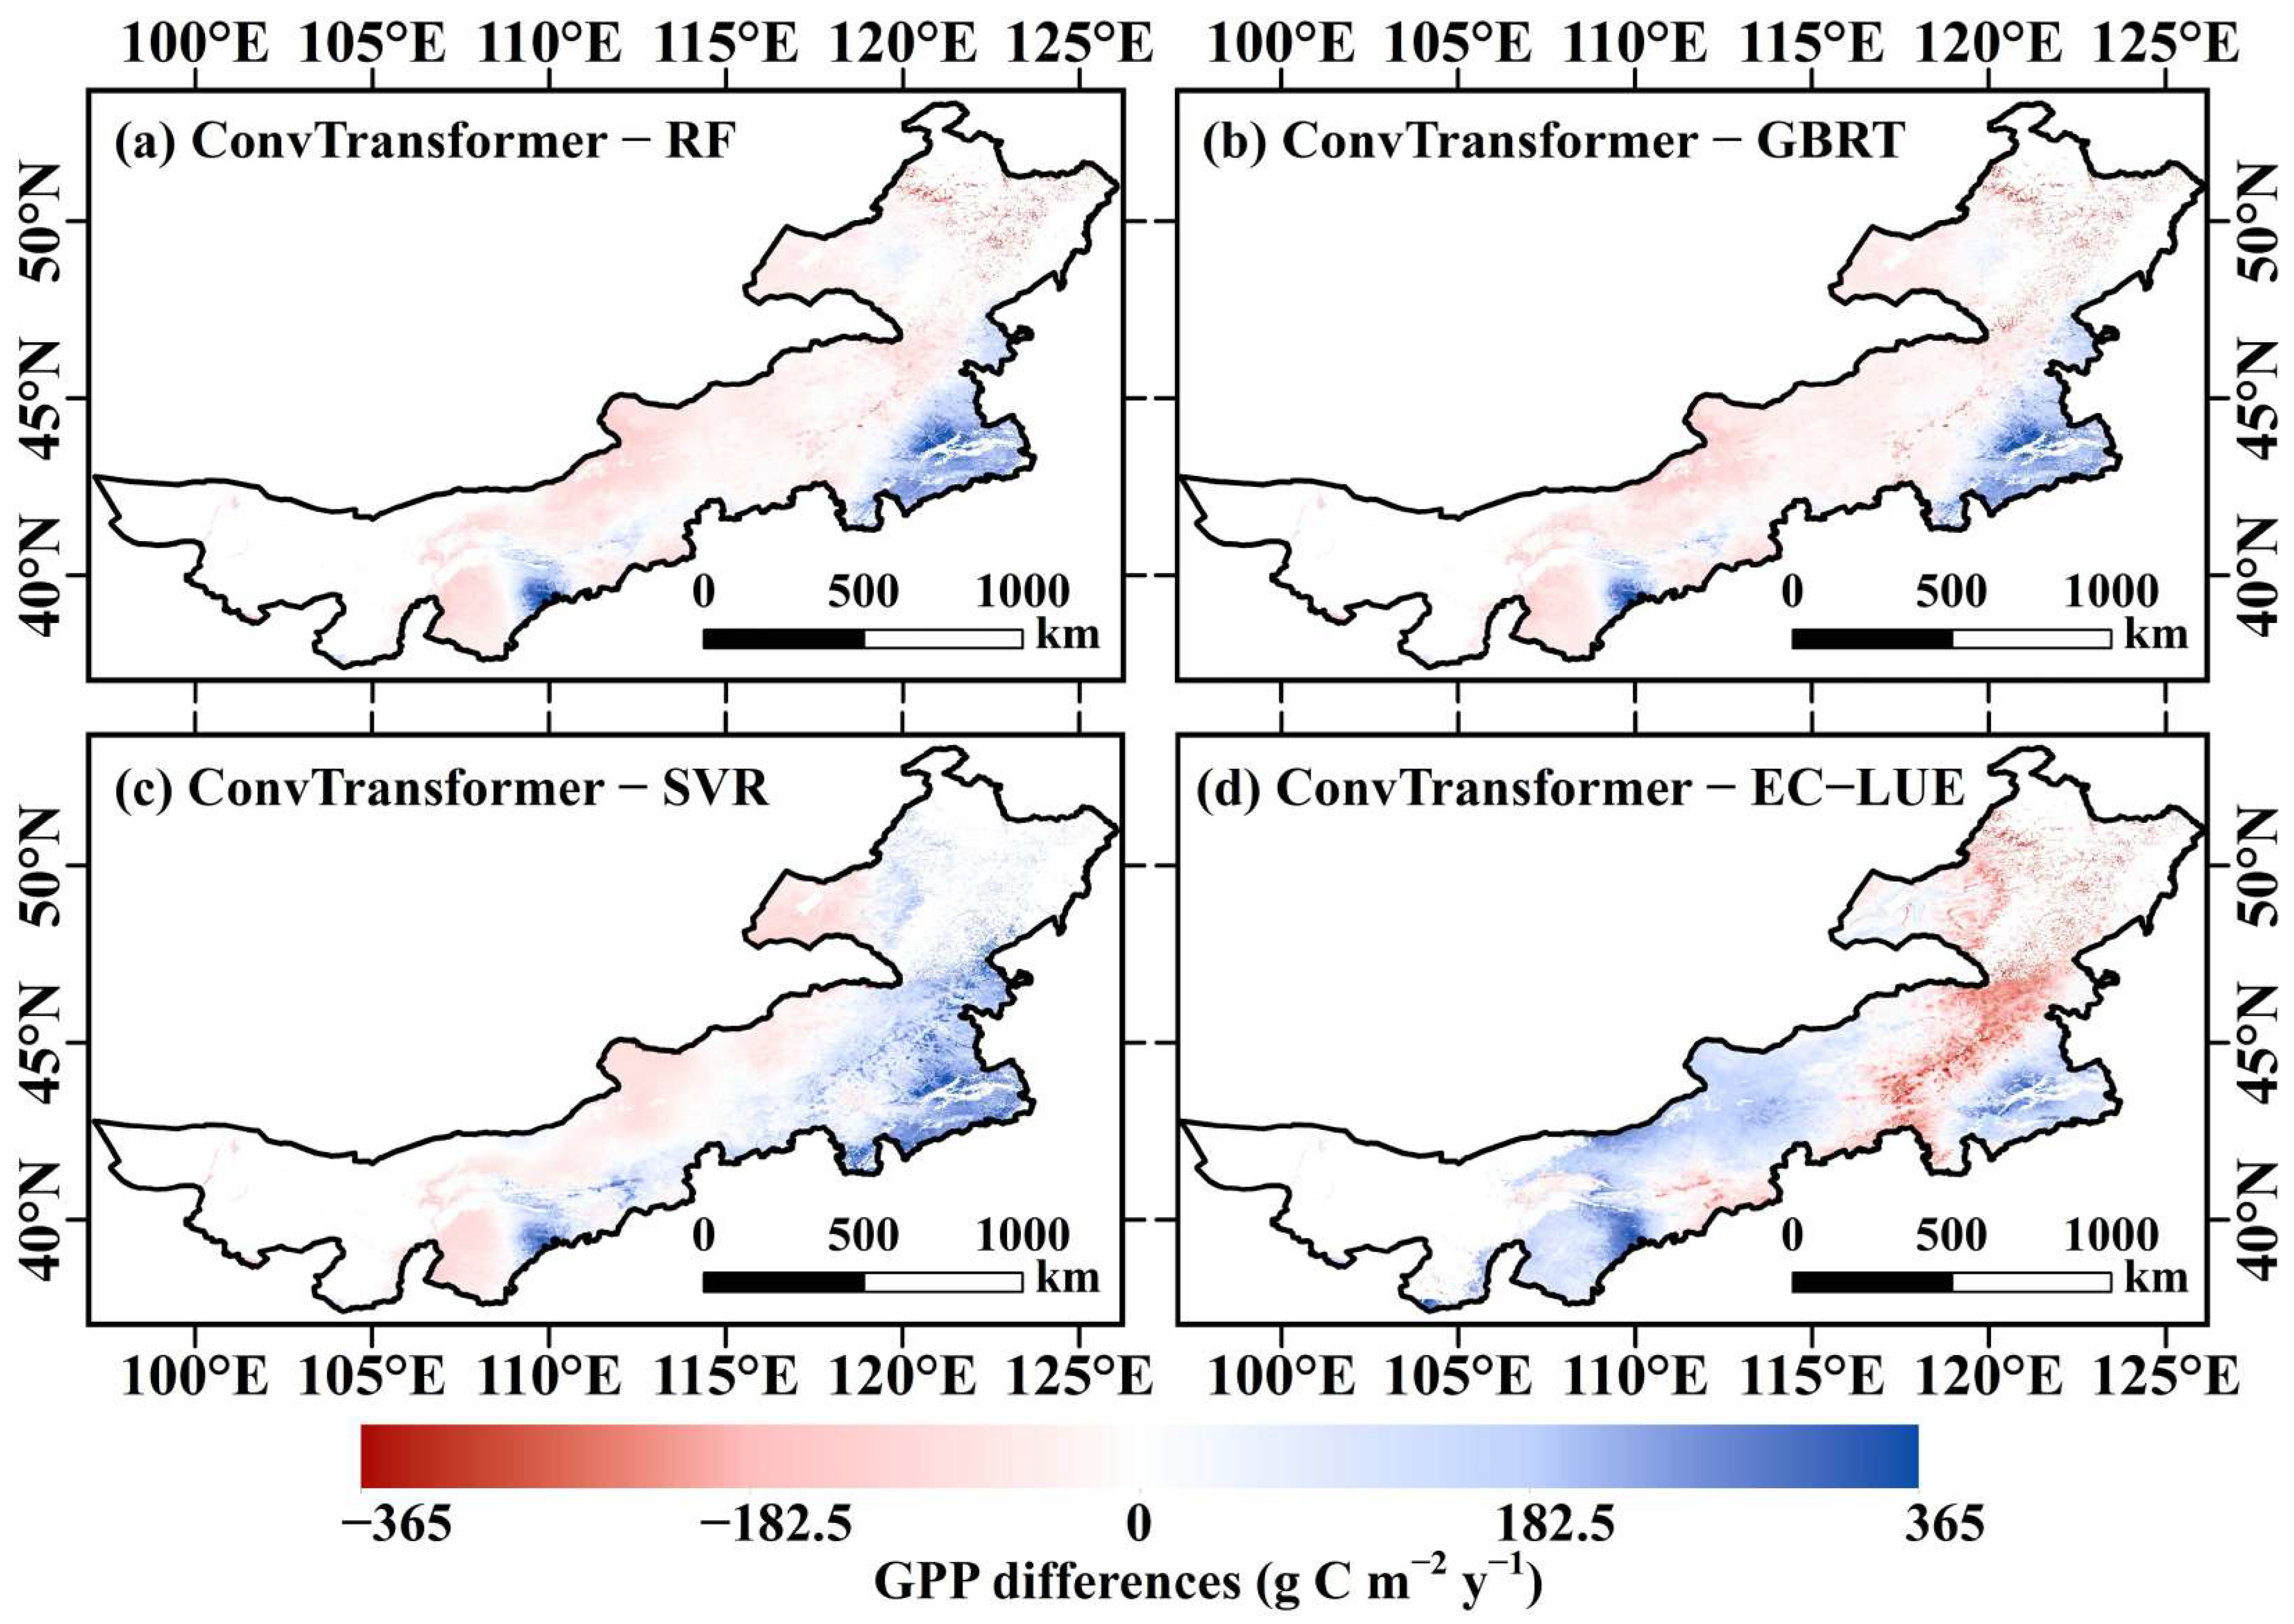
The spatial differences between the ConvTransformer and the benchmark models are presented in Figure 8. The discrepancies exhibit clear spatial organization rather than random variation. In relatively high-productivity regions, the ConvTransformer generally yields higher estimates than EC-LUE and SVR, whereas in the northwestern regions, its estimates are lower or comparable to those of RF and GBRT. These differences primarily reflect varying model sensitivities to environmental constraints, particularly under water-limited versus energy-limited conditions.
Figure 8.
Spatial differences in GPP between the ConvTransformer and benchmark models (ConvTransformer minus others) over the Inner Mongolia grasslands.
4.3.2. Seasonal Spatial Distribution
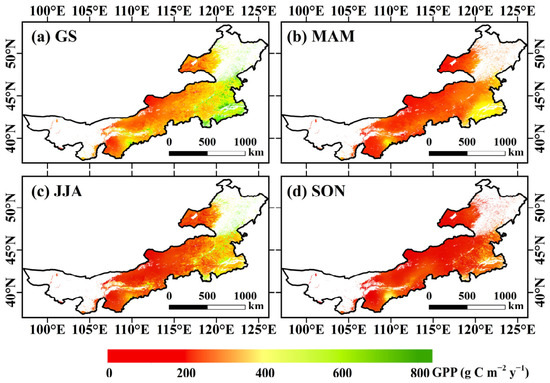
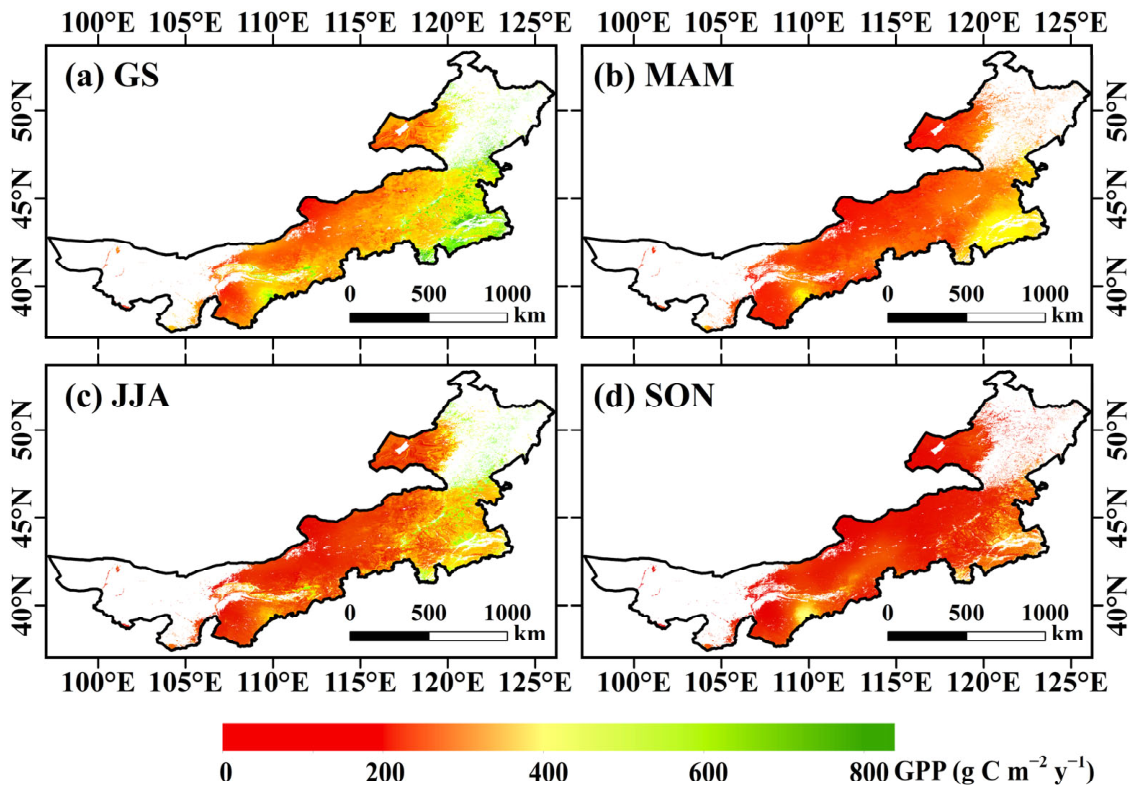
Comparative analysis of seasonal GPP distributions reveals strong seasonality in the productivity of Inner Mongolia grasslands (Figure 9). Between 2003 and 2018, the spatial pattern of GPP within the growing season (GS) closely mirrored the annual mean distribution, representing the core period for regional carbon sequestration. Among the four seasons, summer (JJA) exhibited the highest productivity level, accounting for the vast majority of the annual GPP total, matching the findings from Zhang et al. [53]. In the core regions of the east, summer GPP can reach over 600 . In contrast, GPP values across the region remain significantly lower during spring (MAM) and autumn (SON) (lower than 200 ).
Figure 9.
Spatial distribution of mean annual GPP during growing season and individual seasons in Inner Mongolia grasslands estimated by the ConvTransformer (2003–2018). GS (Growing Season, May-September), MAM (March, April, and May), JJA (June, July, and August), and SON (September, October, and November).
The concentrated growth in summer productivity is primarily driven by the “synchrony of rain and heat” characteristic of the Inner Mongolian steppe climate [54]. During summer, temperatures rise to the optimal range for vegetation metabolism, coinciding with the peak intensity of annual precipitation. This effective synergy between moisture and thermal conditions significantly enhances photosynthetic efficiency. Conversely, spring productivity is primarily constrained by low soil temperatures and frequent spring droughts, leading to a delayed green-up period. In autumn, declining temperatures and shortened photoperiods trigger the senescence phase of the vegetation. In summary, the abundant hydro-thermal combination in summer is the key driver for the formation of grassland productivity, determining both the interannual GPP totals and the overall spatial trends across the region.
5. Discussion
5.1. The Performance of the ConvTransformer Model
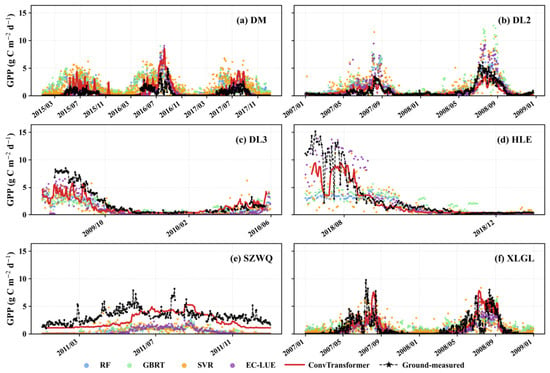
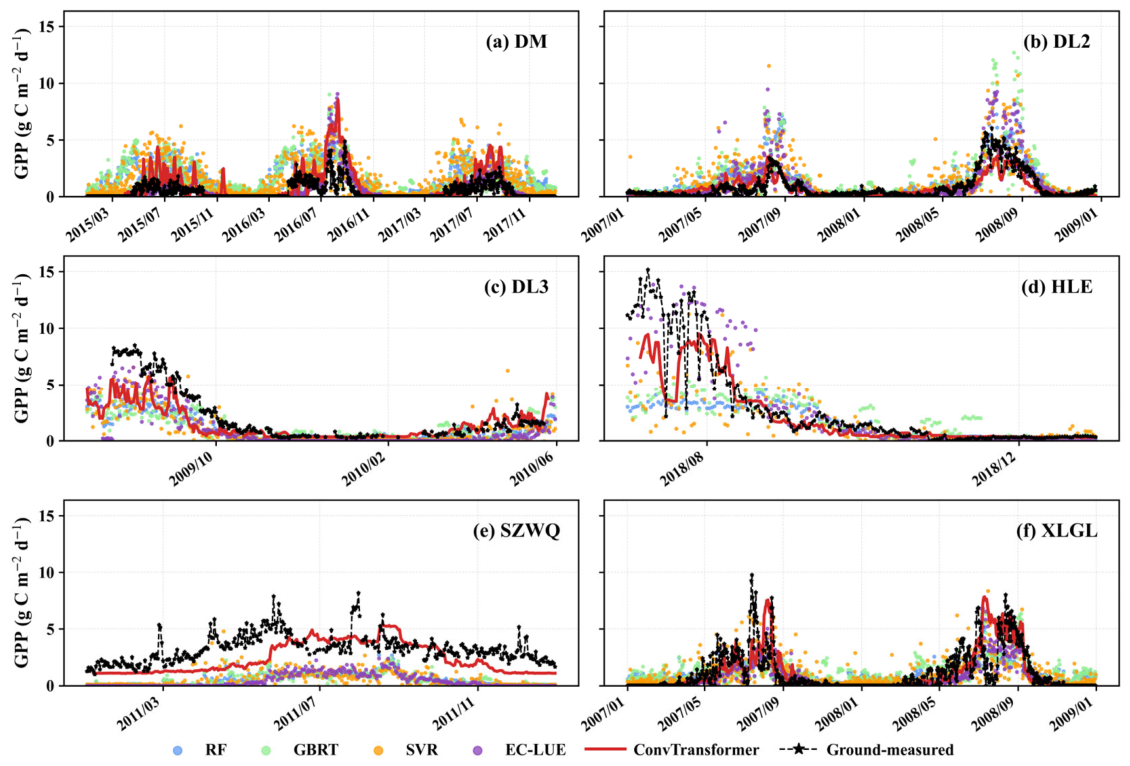
The temporal dynamics of GPP simulated by different models across six representative sites (DM, DL2, DL3, HLE, SZWQ, and XLGL; Figure 10) reveal clear differences in model performance under varying ecological and climatic conditions. Overall, the ConvTransformer shows the closest agreement with in situ observations, particularly in capturing peak growing season dynamics and inter-annual variability. At high-productivity sites (e.g., XLGL and DL2), traditional machine learning models (RF, GBRT, and SVR) tend to underestimate peak GPP or exhibit temporal lag effects, which is consistent with previous findings that conventional machine learning approaches have limited capability in representing temporal dependencies and rapid ecosystem responses [55]. In contrast, the ConvTransformer more accurately reproduces both the magnitude and timing of peak productivity. At low-productivity sites (e.g., DM), all models show reduced variability, indicating limitations imposed by weak vegetation signals and low signal-to-noise ratios, a phenomenon widely reported in arid and semi-arid ecosystems [56].
Figure 10.
Temporal comparison between ground-observed and model-estimated GPP at six representative sites. Panels (a–f) correspond to the DM, DL2, DL3, HLE, SZWQ, and XLGL sites, respectively. The compared models include ConvTransformer, RF, GBRT, SVR, and EC-LUE.
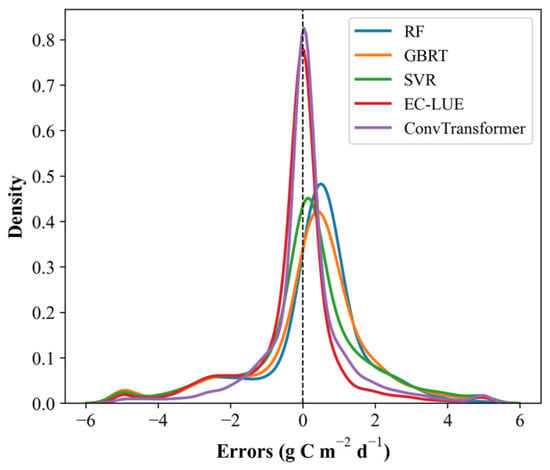
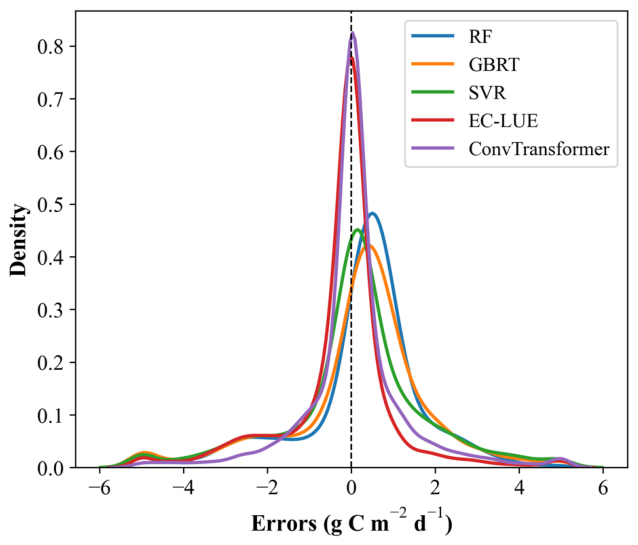
The error distribution (Figure 11) further highlights differences in model accuracy and robustness. The ConvTransformer exhibits a sharply peaked distribution centered near zero, indicating high precision and minimal bias. EC-LUE performs better than traditional machine learning models but still shows a broader spread and lower peak than the ConvTransformer. In contrast, RF and GBRT display evident overestimation tendencies, while SVR shows larger dispersion and instability. Such differences are closely related to the nonlinear response of GPP to environmental drivers, particularly during peak growing periods, which often leads to increased prediction uncertainty and extreme errors [5,40]. Although both ConvTransformer and EC-LUE maintain relatively low systematic bias, the ConvTransformer further reduces distribution width, indicating lower uncertainty and improved robustness under varying environmental conditions.
Figure 11.
Probability density distributions of GPP prediction errors for different models. Prediction errors were calculated as model-estimated GPP minus ground-observed GPP. Positive errors indicate overestimation, whereas negative errors indicate underestimation. The compared models include RF, GBRT, SVR, EC-LUE, and ConvTransformer. The vertical dashed line indicates zero error.
5.2. Spatial Patterns and Uncertainty
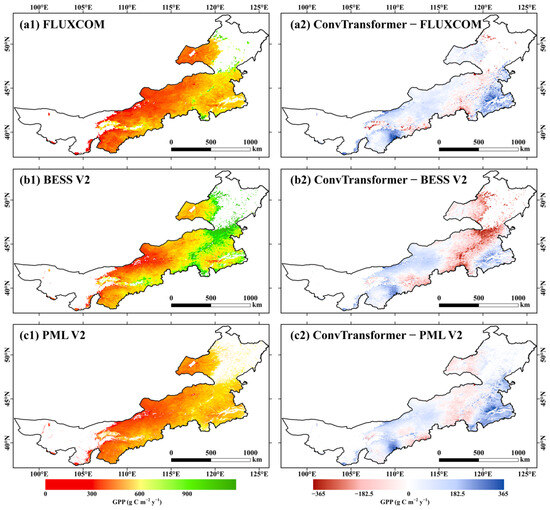
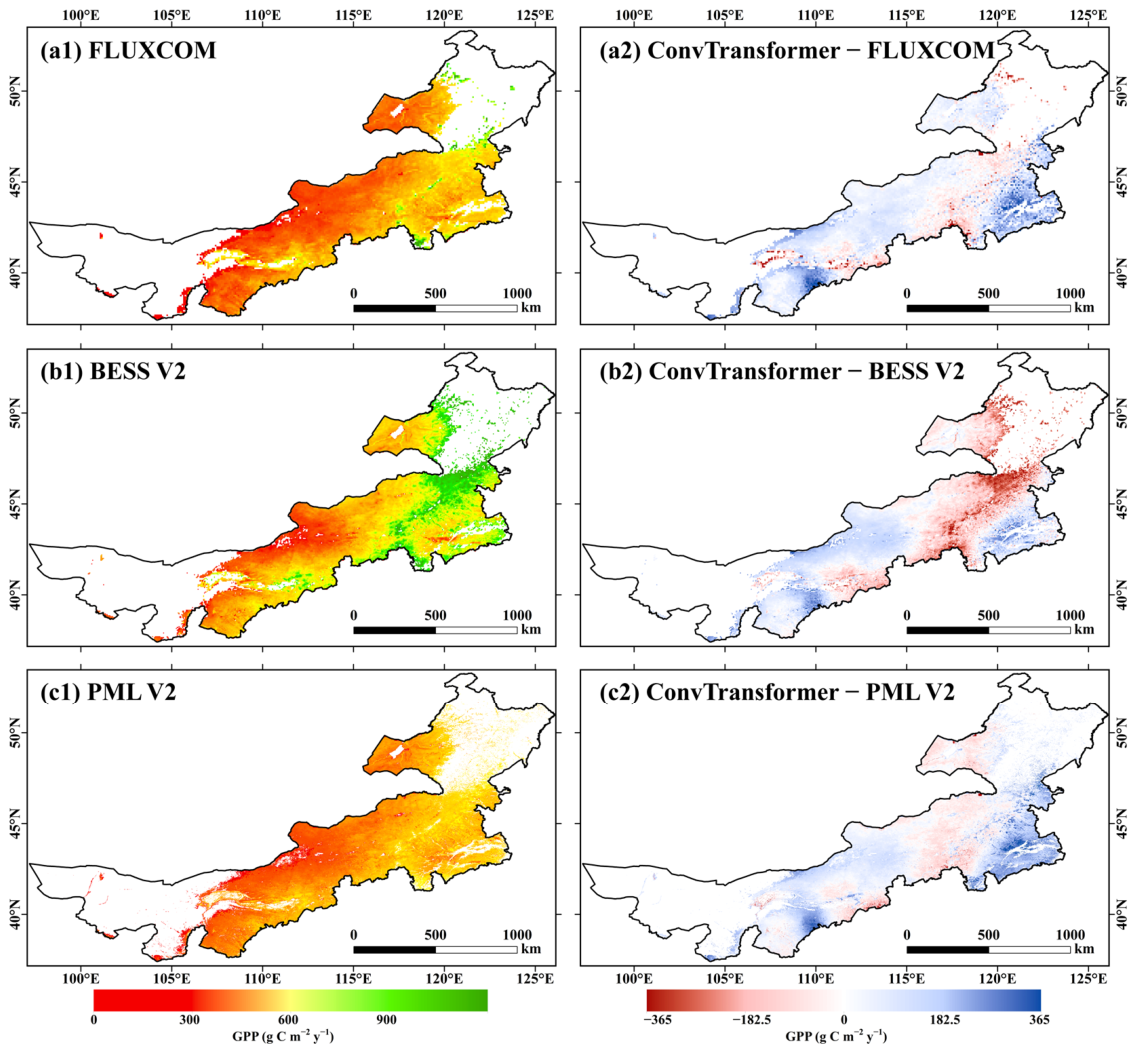
The spatial distribution of GPP and its differences relative to FLUXCOM, BESS V2, and PML V2 (Figure 12) demonstrate that all datasets capture a consistent large-scale gradient, with GPP decreasing from southeast to northwest across Inner Mongolia.
Figure 12.
Spatial distributions of multi-year mean GPP from existing products and their differences relative to ConvTransformer estimates over Inner Mongolia grasslands (2003–2018).
At finer scales, discrepancies become evident. The ConvTransformer tends to produce slightly lower estimates in high-productivity regions compared with FLUXCOM and BESS V2, while differences with PML V2 are more spatially heterogeneous [57]. Meanwhile, it captures finer spatial heterogeneity, likely due to its higher spatial resolution and enhanced feature representation capability.
These differences are closely linked to uncertainties in both data and methodology. Remote sensing inputs are affected by cloud contamination, atmospheric noise, and sensor limitations, while gap-filling procedures may smooth short-term variability and extreme signals [58]. The integration of multi-source datasets further introduces spatiotemporal inconsistencies, where differences in resolution and temporal compositing can lead to scale mismatch and distort predictor–response relationships [59,60]. Such effects are amplified in heterogeneous grassland systems due to mixed-pixel influences.
Uncertainties in EC measurements [61], together with the mismatch between point-scale observations and pixel-scale simulations, also contribute to residual discrepancies and represent a persistent challenge in regional GPP estimation.
5.3. Limitations and Outlooks of This Study
Despite the advancements made in GPP simulation in this study, substantial room for optimization remains in characterizing water-limiting factors within ecologically vulnerable grassland regions. Water accessibility serves as the primary restrictive element for the growth of vegetation in dry and semi-dry zones; however, a universal index that comprehensively and dynamically explains all water-related stress mechanisms remains elusive in current ecological research [62]. Against this backdrop, water limitation is approximated through energy partitioning metrics derived from surface fluxes (e.g., the Bowen ratio and the relative contribution of latent heat flux), linking water availability to evapotranspiration processes. Although this formulation is physically grounded, it remains an indirect proxy and may not fully capture root-zone soil moisture dynamics under prolonged drought conditions. Future work will incorporate more explicit water constraints, such as soil moisture and vapor pressure deficit from microwave remote sensing [63], to improve the representation of plant water stress across heterogeneous environments.
Furthermore, the unique geographical environment and the uneven distribution of monitoring facilities present a severe data scarcity challenge in the study area. The prevalence of low-quality input data and the limited number of ground-truth samples constitute a major bottleneck for further breakthroughs in model performance [64]. To address this common challenge, future research will pivot toward transfer learning strategies. Specifically, knowledge extraction can be performed on pre-trained models using high-precision, long-term EC datasets from global networks, followed by the migration of model parameters to data-poor target regions using domain adaptation techniques. This pre-training and fine-tuning approach not only effectively mitigates overfitting issues caused by insufficient local samples but also enhances the model’s generalizability across diverse spatiotemporal contexts via physical constraints, thereby providing more robust technical support for regional carbon sink assessment.
6. Conclusions
We integrated multi-source remote sensing data, meteorological reanalysis products, and EC flux observations to develop a GPP estimation framework for Inner Mongolian grasslands based on the ConvTransformer model, with explicit consideration of the temporal dependencies inherent in vegetation growth. We assessed model predictive accuracy via site-scale cross-validation applying a leave-one-out scheme, and comparisons with four benchmark models demonstrated that the ConvTransformer model produced the most accurate predictions and robustness, as indicated by the highest median (0.63), the lowest median RMSE (1.48 ), the second-lowest median Bias (−0.35 ), and the highest median KGE (0.45). This approach effectively overcame the overestimation of low GPP values commonly encountered with traditional machine learning algorithms (RF, GBRT, and SVR) and exhibited greater estimation stability than the LUE model (EC-LUE) in dry and semi-dry zones.
We generated a 1 km daily GPP dataset for Inner Mongolian grasslands spanning 2003–2018 using this model. The results indicate that the spatial gradient of GPP declines from the southeast to the northwest, matching the regional hydrothermal gradient. Temporally, GPP exhibited strong seasonal fluctuations, with summer contributing the majority of the growing-season total GPP. Furthermore, compared with existing GPP products (FLUXCOM, BESS V2, and PML V2), our estimates provide finer spatial detail and exhibit fewer anomalous spatial discontinuities.
Overall, the ConvTransformer model substantially improves the precision of daily GPP estimation for Inner Mongolia grasslands, offering a rational and reliable approach for future GPP estimation in dry and semi-dry zones.
Author Contributions
Conceptualization, D.S. and Y.Y.; methodology, D.S. and Y.Y.; validation, R.Y., B.J., L.L. and F.Q.; data curation, R.Y.; formal analysis, D.S.; writing—original draft preparation, D.S.; writing—review and editing, Y.Y., Y.L., X.Z. (Xueyi Zhang), Z.X. and J.F.; visualization, D.S.; supervision, X.Z. (Xiaotong Zhang); funding acquisition, Y.Y. All authors have read and agreed to the published version of the manuscript.
Funding
This research was funded by the Natural Science Fund of China (No. 42571373).
Data Availability Statement
The data presented in this study are available at https://fluxnet.org, http://www.chinaflux.org/, https://glass-product.bnu.edu.cn/ and http://data.tpdc.ac.cn/.
Acknowledgments
We are grateful to FLUXNET (https://fluxnet.org), ChinaFLUX (http://www.chinaflux.org/) and Science Data Bank for providing EC and meteorological observations. We also thank Kun Yang from Institute of Tibetan Plateau Research, Chinese Academy of Sciences for providing China Meteorological Forcing Dataset (CMFD, http://data.tpdc.ac.cn/). We sincerely thank Changliang Shao from the Institute of Agricultural Resources and Regional Planning, Chinese Academy of Agricultural Sciences, for providing the eddy covariance flux data from the Hailar site. GLASS PAR, FPAR, LE and are obtained online (https://glass-product.bnu.edu.cn/).
Conflicts of Interest
The authors declare no conflicts of interest.
References
- Yang, Y.; Shi, Y.; Sun, W.; Chang, J.; Zhu, J.; Chen, L.; Wang, X.; Guo, Y.; Zhang, H.; Yu, L.; et al. Terrestrial carbon sinks in China and around the world and their contribution to carbon neutrality. Sci. China Life Sci. 2022, 65, 861–895. [Google Scholar] [CrossRef] [Scilit] [PubMed]
- MacDougall, A.S.; Vanzant, B.; Sulik, J.; Bagchi, S.; Naidu, D.; Muraina, T.O.; Seabloom, E.W.; Borer, E.T.; Wilfahrt, P.; Slette, I.; et al. The global extent of the grassland biome and implications for the terrestrial carbon sink. Nat. Ecol. Evol. 2026, 10, 246–257. [Google Scholar] [CrossRef] [Scilit] [PubMed]
- Wei, X.; He, W.; Zhou, Y.; Ju, W.; Xiao, J.; Li, X.; Liu, Y.; Xu, S.; Bi, W.; Zhang, X.; et al. Global assessment of lagged and cumulative effects of drought on grassland gross primary production. Ecol. Indic. 2022, 136, 108646. [Google Scholar] [CrossRef] [Scilit]
- Briske, D.D.; Zhao, M.; Han, G.; Xiu, C.; Kemp, D.R.; Willms, W.; Havstad, K.; Kang, L.; Wang, Z.; Wu, J.; et al. Strategies to alleviate poverty and grassland degradation in Inner Mongolia: Intensification vs production efficiency of livestock systems. J. Environ. Manag. 2015, 152, 177–182. [Google Scholar] [CrossRef] [Scilit] [PubMed]
- Beer, C.; Reichstein, M.; Tomelleri, E.; Ciais, P.; Jung, M.; Carvalhais, N.; Rödenbeck, C.; Arain, M.A.; Baldocchi, D.; Bonan, G.B.; et al. Terrestrial Gross Carbon Dioxide Uptake: Global Distribution and Covariation with Climate. Science 2010, 329, 834–838. [Google Scholar] [CrossRef] [Scilit] [PubMed]
- Baldocchi, D.; Falge, E.; Gu, L.; Olson, R.; Hollinger, D.; Running, S.; Anthoni, P.; Davis, K.; Evans, R.; Fuentes, J.; et al. FLUXNET: A New Tool to Study the Temporal and Spatial Variability of Ecosystem-Scale Carbon Dioxide, Water Vapor, and Energy Flux Densities. Bull. Am. Meteorol. Soc. 2001, 82, 2415–2434. [Google Scholar] [CrossRef] [Scilit]
- Zhao, M.; Liu, Y.; Yang, J.; Liu, Y.; Zhao, N.; Tianxiang, Y. Spatio-temporal Patterns of NPP and Its Relations to Climate in China Based on HASM. Ecol. Environ. Sci. 2019, 28, 215–225. [Google Scholar] [CrossRef]
- Schmid, H.P. Source areas for scalars and scalar fluxes. Bound.-Layer Meteorol. 1994, 67, 293–318. [Google Scholar] [CrossRef] [Scilit]
- Yuan, W.; Cai, W.; Liu, D.; Dong, W. Satellite-based Vegetation Production Models of Terrestrial Ecosystem: An Overview. Adv. Earth Sci. 2014, 29, 541–550. [Google Scholar] [CrossRef]
- Lin, S.; Li, J.; Liu, Q. Overview on estimation accuracy of gross primary productivity with remote sensing methods. Yaogan Xuebao/J. Remote Sens. 2018, 22, 234–252. [Google Scholar] [CrossRef] [Scilit]
- Ryu, Y.; Baldocchi, D.D.; Kobayashi, H.; van Ingen, C.; Li, J.; Black, T.A.; Beringer, J.; van Gorsel, E.; Knohl, A.; Law, B.E.; et al. Integration of MODIS land and atmosphere products with a coupled-process model to estimate gross primary productivity and evapotranspiration from 1 km to global scales. Glob. Biogeochem. Cycles 2011, 25, GB4017. [Google Scholar] [CrossRef] [Scilit]
- Zhang, Y.; Kong, D.; Gan, R.; Chiew, F.H.S.; McVicar, T.R.; Zhang, Q.; Yang, Y. Coupled estimation of 500 m and 8-day resolution global evapotranspiration and gross primary production in 2002–2017. Remote Sens. Environ. 2019, 222, 165–182. [Google Scholar] [CrossRef] [Scilit]
- Zhang, X.; Wang, H.; Yan, H.; Ai, J. Analysis of spatio-temporal changes of gross primary productivity in China from 2001 to 2018 based on Romote Sensing. Acta Ecol. Sin. 2021, 41, 6351–6362. [Google Scholar] [CrossRef] [Scilit]
- Xie, X.; Li, A.; Tan, J.; Jin, H.; Nan, X.; Zhang, Z.; Bian, J.; Lei, G. Assessments of gross primary productivity estimations with satellite data-driven models using eddy covariance observation sites over the northern hemisphere. Agric. For. Meteorol. 2020, 280, 107771. [Google Scholar] [CrossRef] [Scilit]
- Guo, R.; Chen, T.; Chen, X.; Yuan, W.; Liu, S.; He, B.; Li, L.; Wang, S.; Hu, T.; Yan, Q.; et al. Estimating Global GPP From the Plant Functional Type Perspective Using a Machine Learning Approach. J. Geophys. Res. Biogeosciences 2023, 128, e2022JG007100. [Google Scholar] [CrossRef] [Scilit]
- Li, Y.; Liu, X.; Zhang, Z.; Lang, J. GPP estimation based on CatBoost and analysis of change driving factors in Shanxi Province, China. Sci. Rep. 2025, 15, 22346. [Google Scholar] [CrossRef] [Scilit] [PubMed]
- Zhu, S.; Quaife, T.; Hill, T. Uniform upscaling techniques for eddy covariance FLUXes (UFLUX). Int. J. Remote Sens. 2024, 45, 1450–1476. [Google Scholar] [CrossRef] [Scilit]
- Shangguan, W.; Xiong, Z.; Nourani, V.; Li, Q.; Lu, X.; Li, L.; Huang, F.; Zhang, Y.; Sun, W.; Dai, Y. A 1 km Global Carbon Flux Dataset Using In Situ Measurements and Deep Learning. Forests 2023, 14, 913. [Google Scholar] [CrossRef] [Scilit]
- Yu, T.; Pang, Y.; Sun, R.; Niu, X. Spatial Downscaling of Vegetation Productivity in the Forest From Deep Learning. IEEE Access 2022, 10, 104449–104460. [Google Scholar] [CrossRef] [Scilit]
- Montero, D.; Mahecha, M.D.; Martinuzzi, F.; Aybar, C.; Klosterhalfen, A.; Knohl, A.; Koebsch, F.; Anaya, J.; Wieneke, S. Recurrent Neural Networks for Modelling Gross Primary Production. In Proceedings of the IGARSS 2024—2024 IEEE International Geoscience and Remote Sensing Symposium, Athens, Greece, 7–12 July 2024; pp. 4214–4217. [Google Scholar]
- Zhou, X.; Wang, X.; Zhang, S.; Zhang, Y.; Bai, X. Combining Phenological Camera Photos and MODIS Reflectance Data to Predict GPP Daily Dynamics for Alpine Meadows on the Tibetan Plateau. Remote Sens. 2020, 12, 3735. [Google Scholar] [CrossRef] [Scilit]
- Biegel, S.; Schindler, K.; Stocker, B.D. Unrecognised water limitation is a main source of uncertainty for models of terrestrial photosynthesis. Biogeosciences 2025, 22, 7455–7481. [Google Scholar] [CrossRef] [Scilit]
- Wen, Q.; Zhou, T.; Zhang, C.; Chen, W.; Ma, Z.; Yan, J.; Sun, L. Transformers in time series: A survey. In Proceedings of the Thirty-Second International Joint Conference on Artificial Intelligence, Macao, China, 19–25 August 2023; p. 759. [Google Scholar]
- Zhang, M.; Cheng, W.; Sun, L.; Zou, Y. An Improved Adversarial Convolutional Transformer Model for Time Series Forecasting. In Proceedings of the 2024 5th International Conference on Intelligent Computing and Human-Computer Interaction (ICHCI), Nanchang, China, 27–29 September 2024; pp. 42–46. [Google Scholar]
- Liu, Z.; Luo, S.N.; Li, W.; Lu, J.; Wu, Y.; Li, C.; Yang, L. ConvTransformer: A Convolutional Transformer Network for Video Frame Synthesis. arXiv 2020, arXiv:2011.10185. [Google Scholar]
- Nakagawa, R.; Chau, M.; Calzaretta, J.; Keenan, T.; Vahabi, P.; Todeschini, A.; Bassiouni, M.; Kang, Y. Upscaling Global Hourly GPP with Temporal Fusion Transformer (TFT). arXiv 2023, arXiv:2306.13815. [Google Scholar]
- Shao, W.; Wu, C.; Yue, T.; Zhao, N.; Hu, Y. Prediction of Gross Primary Productivity Change in Central Asia Under Climate Change Using Deep Learning. IEEE J. Sel. Top. Appl. Earth Obs. Remote Sens. 2025, 18, 11031–11046. [Google Scholar] [CrossRef] [Scilit]
- Yu, F.; Price, K.P.; Ellis, J.; Shi, P. Response of seasonal vegetation development to climatic variations in eastern central Asia. Remote Sens. Environ. 2003, 87, 42–54. [Google Scholar] [CrossRef] [Scilit]
- Lu, N.; Wilske, B.; Ni, J.; John, R.; Chen, J. Climate change in Inner Mongolia from 1955 to 2005—Trends at regional, biome and local scales. Environ. Res. Lett. 2009, 4, 045006. [Google Scholar] [CrossRef] [Scilit]
- Jia, S.; Li, Z.; Guang, Z.; Yu, Y.A.N.; Sen, Z. A dataset of carbon and water fluxes of the temperate desert steppe in Damao Banner, Inner Mongolia (2015–2018). China Sci. Data 2023, 8, 1–9. [Google Scholar] [CrossRef] [Scilit]
- Chen, S.; Chen, J.; Lin, G.; Zhang, W.; Miao, H.; Wei, L.; Huang, J.; Han, X. Energy balance and partition in Inner Mongolia steppe ecosystems with different land use types. Agric. For. Meteorol. 2009, 149, 1800–1809. [Google Scholar] [CrossRef] [Scilit]
- Pastorello, G.; Trotta, C.; Canfora, E.; Chu, H.; Christianson, D.; Cheah, Y.-W.; Poindexter, C.; Chen, J.; Elbashandy, A.; Humphrey, M.; et al. The FLUXNET2015 dataset and the ONEFlux processing pipeline for eddy covariance data. Sci. Data 2020, 7, 225. [Google Scholar] [CrossRef] [Scilit] [PubMed]
- Shao, C.; Chen, J.; Li, L.; Dong, G.; Han, J.; Abraha, M.; John, R. Grazing effects on surface energy fluxes in a desert steppe on the Mongolian Plateau. Ecol. Appl. 2017, 27, 485–502. [Google Scholar] [CrossRef] [Scilit] [PubMed]
- Hao, Y.; Zhang, L.; Sun, X.; Yu, G.; Chen, Z.; Wang, Y. A Dataset of Carbon and Water Fluxes over Xilinhot Temperate Steppe in Inner Mongolia (2003–2010). China Sci. Data 2021, 6. [Google Scholar] [CrossRef] [Scilit]
- Zhang, X.; Liang, S.; Zhou, G.; Wu, H.; Zhao, X. Generating Global Land Surface Satellite incident shortwave radiation and photosynthetically active radiation products from multiple satellite data. Remote Sens. Environ. 2014, 152, 318–332. [Google Scholar] [CrossRef] [Scilit]
- Zhang, X.; Wang, D.; Liu, Q.; Yao, Y.; Jia, K.; He, T.; Jiang, B.; Wei, Y.; Ma, H.; Zhao, X.; et al. An Operational Approach for Generating the Global Land Surface Downward Shortwave Radiation Product From MODIS Data. IEEE Trans. Geosci. Remote Sens. 2019, 57, 4636–4650. [Google Scholar] [CrossRef] [Scilit]
- Ma, H.; Liang, S.; Xiong, C.; Wang, Q.; Jia, A.; Li, B. Global land surface 250 m 8 d fraction of absorbed photosynthetically active radiation (FAPAR) product from 2000 to 2021. Earth Syst. Sci. Data 2022, 14, 5333–5347. [Google Scholar] [CrossRef] [Scilit]
- Yao, Y.; Liang, S.; Li, X.; Hong, Y.; Fisher, J.B.; Zhang, N.; Chen, J.; Cheng, J.; Zhao, S.; Zhang, X.; et al. Bayesian multimodel estimation of global terrestrial latent heat flux from eddy covariance, meteorological, and satellite observations. J. Geophys. Res. Atmos. 2014, 119, 4521–4545. [Google Scholar] [CrossRef] [Scilit]
- He, J.; Yang, K.; Tang, W.; Lu, H.; Qin, J.; Chen, Y.; Li, X. The first high-resolution meteorological forcing dataset for land process studies over China. Sci. Data 2020, 7, 25. [Google Scholar] [CrossRef] [Scilit] [PubMed]
- Jung, M.; Schwalm, C.; Migliavacca, M.; Walther, S.; Camps-Valls, G.; Koirala, S.; Anthoni, P.; Besnard, S.; Bodesheim, P.; Carvalhais, N.; et al. Scaling carbon fluxes from eddy covariance sites to globe: Synthesis and evaluation of the FLUXCOM approach. Biogeosciences 2020, 17, 1343–1365. [Google Scholar] [CrossRef] [Scilit]
- Li, B.; Ryu, Y.; Jiang, C.; Dechant, B.; Liu, J.; Yan, Y.; Li, X. BESSv2.0: A satellite-based and coupled-process model for quantifying long-term global land–atmosphere fluxes. Remote Sens. Environ. 2023, 295, 113696. [Google Scholar] [CrossRef] [Scilit]
- He, S.; Zhang, Y.; Ma, N.; Tian, J.; Kong, D.; Liu, C. A daily and 500 m coupled evapotranspiration and gross primary production product across China during 2000–2020. Earth Syst. Sci. Data 2022, 14, 5463–5488. [Google Scholar] [CrossRef] [Scilit]
- Breiman, L. Random Forests. Mach. Learn. 2001, 45, 5–32. [Google Scholar] [CrossRef] [Scilit]
- Elith, J.; Leathwick, J.R.; Hastie, T. A working guide to boosted regression trees. J. Anim. Ecol. 2008, 77, 802–813. [Google Scholar] [CrossRef] [Scilit] [PubMed]
- Friedman, J.H. Greedy function approximation: A gradient boosting machine. Ann. Stat. 2001, 29, 1189–1232. [Google Scholar] [CrossRef] [Scilit]
- Kotsiantis, S.B. Decision trees: A recent overview. Artif. Intell. Rev. 2013, 39, 261–283. [Google Scholar] [CrossRef] [Scilit]
- Suykens, J.A.K. Support Vector Machines: A Nonlinear Modelling and Control Perspective. Eur. J. Control 2001, 7, 311–327. [Google Scholar] [CrossRef] [Scilit]
- Yao, Y.; Liang, S.; Li, X.; Chen, J.; Liu, S.; Jia, K.; Zhang, X.; Xiao, Z.; Fisher, J.B.; Mu, Q.; et al. Improving global terrestrial evapotranspiration estimation using support vector machine by integrating three process-based algorithms. Agric. For. Meteorol. 2017, 242, 55–74. [Google Scholar] [CrossRef] [Scilit]
- Yuan, W.; Liu, S.; Zhou, G.; Zhou, G.; Tieszen, L.L.; Baldocchi, D.; Bernhofer, C.; Gholz, H.; Goldstein, A.H.; Goulden, M.L.; et al. Deriving a light use efficiency model from eddy covariance flux data for predicting daily gross primary production across biomes. Agric. For. Meteorol. 2007, 143, 189–207. [Google Scholar] [CrossRef] [Scilit]
- Yuan, W.; Liu, S.; Yu, G.; Bonnefond, J.-M.; Chen, J.; Davis, K.; Desai, A.R.; Goldstein, A.H.; Gianelle, D.; Rossi, F.; et al. Global estimates of evapotranspiration and gross primary production based on MODIS and global meteorology data. Remote Sens. Environ. 2010, 114, 1416–1431. [Google Scholar] [CrossRef] [Scilit]
- Raich, J.W.; Rastetter, E.B.; Melillo, J.M.; Kicklighter, D.W.; Steudler, P.A.; Peterson, B.J.; Grace, A.L.; Moore III, B.; Vorosmarty, C.J. Potential Net Primary Productivity in South America: Application of a Global Model. Ecol. Appl. 1991, 1, 399–429. [Google Scholar] [CrossRef] [Scilit] [PubMed]
- Gupta, H.V.; Kling, H.; Yilmaz, K.K.; Martinez, G.F. Decomposition of the mean squared error and NSE performance criteria: Implications for improving hydrological modelling. J. Hydrol. 2009, 377, 80–91. [Google Scholar] [CrossRef] [Scilit]
- Zhang, M.; Lal, R.; Zhao, Y.; Jiang, W.; Chen, Q. Spatial and temporal variability in the net primary production of grassland in China and its relation to climate factors. Plant Ecol. 2017, 218, 1117–1133. [Google Scholar] [CrossRef] [Scilit]
- You, G.; Liu, B.; Zou, C.; Li, H.; McKenzie, S.; He, Y.; Gao, J.; Jia, X.; Altaf Arain, M.; Wang, S.; et al. Sensitivity of vegetation dynamics to climate variability in a forest-steppe transition ecozone, north-eastern Inner Mongolia, China. Ecol. Indic. 2021, 120, 106833. [Google Scholar] [CrossRef] [Scilit]
- Reichstein, M.; Camps-Valls, G.; Stevens, B.; Jung, M.; Denzler, J.; Carvalhais, N.; Prabhat, F. Deep learning and process understanding for data-driven Earth system science. Nature 2019, 566, 195–204. [Google Scholar] [CrossRef] [Scilit] [PubMed]
- Tramontana, G.; Jung, M.; Schwalm, C.R.; Ichii, K.; Camps-Valls, G.; Ráduly, B.; Reichstein, M.; Arain, M.A.; Cescatti, A.; Kiely, G.; et al. Predicting carbon dioxide and energy fluxes across global FLUXNET sites with regression algorithms. Biogeosciences 2016, 13, 4291–4313. [Google Scholar] [CrossRef] [Scilit]
- Bai, Y.; Liang, S.; Jia, A.; Li, S. Different Satellite Products Revealing Variable Trends in Global Gross Primary Production. J. Geophys. Res. Biogeosciences 2023, 128, e2022JG006918. [Google Scholar] [CrossRef] [Scilit]
- Zhao, M.; Heinsch, F.A.; Nemani, R.R.; Running, S.W. Improvements of the MODIS terrestrial gross and net primary production global data set. Remote Sens. Environ. 2005, 95, 164–176. [Google Scholar] [CrossRef] [Scilit]
- Chai, H.; Ma, J.; Zhang, J.; Li, J.; Meng, B.; Wang, C.; Pan, D.; Li, J.; Sun, W.; Zhou, X. Nonlinear responses of ecosystem carbon fluxes to precipitation change in a semiarid grassland. Front. Plant Sci. 2025, 16, 1519879. [Google Scholar] [CrossRef] [Scilit] [PubMed]
- Li, X.; Wang, Y.-P.; Lu, X.; Yan, J. Diagnosing the impacts of climate extremes on the interannual variations of carbon fluxes of a subtropical evergreen mixed forest. Agric. For. Meteorol. 2021, 307, 108507. [Google Scholar] [CrossRef] [Scilit]
- Baldocchi, D.D. Assessing the eddy covariance technique for evaluating carbon dioxide exchange rates of ecosystems: Past, present and future. Glob. Change Biol. 2003, 9, 479–492. [Google Scholar] [CrossRef] [Scilit]
- Wei, J.; Chen, Y.; Gu, Q.; Jiang, C.; Ma, M.; Song, L.; Tang, X. Potential of the remotely-derived products in monitoring ecosystem water use efficiency across grasslands in Northern China. Int. J. Remote Sens. 2019, 40, 6203–6223. [Google Scholar] [CrossRef] [Scilit]
- Dannenberg, M.P.; Barnes, M.L.; Smith, W.K.; Johnston, M.R.; Meerdink, S.K.; Wang, X.; Scott, R.L.; Biederman, J.A. Upscaling dryland carbon and water fluxes with artificial neural networks of optical, thermal, and microwave satellite remote sensing. Biogeosciences 2023, 20, 383–404. [Google Scholar] [CrossRef] [Scilit]
- Reyes-Muñoz, P.; Kovács, D.D.; Verrelst, J. Tower-to-global upscaling of terrestrial carbon fluxes driven by MODIS-LAI, Sentinel-3-LAI and ERA5-Land data. Ecol. Indic. 2025, 177, 113597. [Google Scholar] [CrossRef] [Scilit] [PubMed]

Disclaimer/Publisher’s Note: The statements, opinions and data contained in all publications are solely those of the individual author(s) and contributor(s) and not of MDPI and/or the editor(s). MDPI and/or the editor(s) disclaim responsibility for any injury to people or property resulting from any ideas, methods, instructions or products referred to in the content. |
© 2026 by the authors. Licensee MDPI, Basel, Switzerland. This article is an open access article distributed under the terms and conditions of the Creative Commons Attribution (CC BY) license.