


Highlights
What are the main findings?
- Meteorological factors exhibit pronounced threshold effects, whereby exceeding critical rainfall levels triggers a nonlinear escalation in urban inundation severity.
- Urban morphology primarily governs spatial risk heterogeneity under non-extreme rainfall conditions.
What are the implications of the main findings?
- The identified rainfall characteristic thresholds offer critical references for refining early warning systems and optimizing drainage infrastructure.
- Optimizing building configurations offers a practical and innovative planning strategy to enhance urban flood resilience.
Abstract
Urban flooding poses escalating threats to high-density cities, yet the nonlinear mechanisms linking rainfall characteristics and urban morphology to waterlogging severity remain poorly understood. This study proposes a rainfall-stratified explainable machine learning framework to distinguish deep from shallow inundation at the block scale, taking Shanghai as a case study. Four models (XGBoost, random forest, SVM, and logistic regression) were compared via nested cross-validation and Bayesian optimization, with XGBoost identified as the optimal model. Three physically distinct rainfall dimensions and multi-dimensional urban morphological indicators were incorporated as predictive features. SHAP-based attribution and PDP were employed to unveil the driving mechanisms behind inundation severity, characterizing scenario-dependent shifts in driver dominance and nonlinear threshold effects. Urban morphology primarily governs spatial risk under non-extreme rainfall, with building shape coefficient (BSC) remaining the primary driver overall. Meteorologically, waterlogging severity surges beyond critical thresholds for maximum hourly rainfall (>18.40 mm/h) and total volume (>139 mm), while duration exhibits an inverted U-shaped response. Morphologically, a high BSC (>0.39 m−1) is consistently associated with elevated deep inundation probability, whereas higher SDBV (>54,155 m3) and greater DR (>582 m) are associated with a severity-attenuating effect. These findings provide threshold-driven insights for integrating morphological resilience into urban renewal and sustainable flood adaptation strategies in high-density metropolises.
1. Introduction
Urban pluvial flooding ranks among the most pervasive and economically destructive natural hazards globally [1]. This crisis is increasingly exacerbated by rapid urbanization [2,3]. Particularly, the compound effects of climate-driven extreme precipitation and urban expansion have drastically escalated flood exposure in high-density metropolises [4]. Therefore, unraveling the nonlinear interactions between meteorological extremes and the spatial heterogeneity of urban underlying surfaces is of vital importance [5]. Such knowledge forms the essential prerequisite for formulating evidence-based disaster reduction strategies and enhancing spatial flood resilience.
Conventional spatial risk assessment approaches, such as GIS-based multi-criteria decision analysis (GIS-MCDA) integrated with the analytic hierarchy process (AHP) [6,7,8] and its extensions incorporating physically-based models such as HEC-RAS 2D for calibration [9,10,11,12], have been widely applied to delineate flood-prone zones. However, the weighting of indicators in MCDA-AHP frameworks relies heavily on expert judgment, introducing subjectivity and limiting reproducibility across different study contexts. In contrast, coupled hydrological-hydrodynamic models such as the Storm Water Management Model (SWMM) [13,14,15], MIKE URBAN [16,17,18], and InfoWorks ICM [19,20,21,22] have been widely adopted for urban inundation simulation, explicitly representing rainfall-runoff processes, pipe network dynamics, and surface flow routing. While capable of spatially explicit flood simulation, these models are computationally prohibitive for real-time applications [23] and require extensive data inputs and calibration effort, limiting their operational scalability [24,25].
To overcome these computational and data-related barriers, data-driven approaches, particularly machine learning (ML) models, have emerged as highly efficient alternatives for urban flood susceptibility assessment [26,27,28], capable of learning complex nonlinear mappings from historical records without explicit hydraulic parameterization [29,30]. Tehrany et al. [31,32] and Bera et al. [32] demonstrated that support vector machine (SVM) has strong predictive accuracy and superiority over conventional approaches. While ensemble methods such as random forest (RF) and gradient boosting algorithms including extreme gradient boosting (XGBoost) have shown enhanced performance in handling nonlinear relationships and high-dimensional feature spaces [33,34,35]. Nevertheless, comparative results remain inconsistent across geographical contexts, with some studies finding RF superior to XGBoost [36,37]. Such inconsistencies highlight the absence of a universally superior model, necessitating systematic evaluation for site-specific urban waterlogging prediction. While most ML-based studies focus on spatial susceptibility to estimate the probability of waterlogging occurrence [38,39,40], assessing the severity of inundation in already-flooded areas is equally critical. Predicting whether a waterlogging event will exceed critical depth thresholds carries direct operational relevance for emergency response and infrastructure triage.
Beyond model selection, existing machine learning-based studies on urban waterlogging still exhibit certain limitations in feature variable construction. First, regarding meteorological factors, most research is largely confined to total rainfall volume, neglecting the independent contributions of rainfall intensity and duration [41,42]. High-intensity short-duration bursts can trigger waterlogging even at low cumulative volumes [43], as rainfall structural features exert fundamentally different hydrological impacts on drainage capacity and peak runoff generation [44,45,46]. Zhou et al. [47] demonstrated that short-term intensities, temporal asymmetry, and peak-mean ratios provide complementary explanatory power beyond total rainfall volume alone, suggesting that a multidimensional characterization of rainfall structure may better capture the hydrometeorological drivers of inundation severity. Furthermore, concerning urban morphology, the influence on inundation risk is predominantly characterized through 2D land cover metrics (such as the proportion of impervious surfaces, land use, soil properties, NDVI, and DEM) [48,49,50,51], but limited attention has been paid to the critical role of 3D building configurations in altering surface runoff pathways and hydraulic connectivity. Wang et al. [52] demonstrated that the 3D spatial patterns of cities significantly impact urban flooding. Specifically, the aggregation of buildings (e.g., higher building density and compact building forms) influences the behavior of rainfall runoff in complex ways. Lin et al. [53] and Zhang et al. [54] both revealed that building coverage rate, building congestion degree, and building density exerted a dominant influence on pluvial flooding.
Despite the predictive advances offered by machine learning models, their inherent black-box nature has long impeded the interpretability of model outputs [55,56,57], limiting the capacity of decision-makers to understand the underlying physical mechanisms driving urban inundation. To address this interpretability gap, explainable artificial intelligence (XAI) techniques have been increasingly integrated into urban flood research. Among these, Shapley Additive exPlanation (SHAP), which is rooted in cooperative game theory, has emerged as a particularly rigorous framework for quantifying the marginal contribution of each feature to individual predictions [58,59], while partial dependence plots (PDPs) visualize average and instance-level feature effects, facilitating the identification of risk thresholds [60,61]. Collectively, these interpretable techniques have demonstrated considerable effectiveness in quantitatively disentangling nonlinear interactions among complex drivers of hydroclimatic processes [62,63,64,65]. Li et al. [66] established the XGBoost-SHAP framework, which revealed the complex bidirectional drivers of urban inundation: factors such as daily rainfall volume, river density (RVD), and temperature (Temp) act as primary positive drivers of flood risk. Zhou et al. [67] employed SHAP-PDP analysis to identify the dominant drivers of urban flooding risk, among which rainfall characteristics and built environment indicators were the primary contributors to flood susceptibility.
However, most existing SHAP applications rely heavily on global feature importance [38,67,68,69,70], implicitly assuming that predictor influence remains constant across all meteorological conditions. This ignores the dynamic nature of urban waterlogging mechanisms. In reality, the dominant drivers shift under different rainfall scenarios: urban morphology primarily dictates spatial risk during moderate rainfall, whereas extreme precipitation can easily overwhelm these local structural effects. However, the stratification criteria used to delineate such rainfall boundary conditions, and the robustness of mechanism shifts across alternative stratification schemes, have rarely been systematically examined.
To address the aforementioned gaps, this study proposes a rainfall-stratified explainable machine learning framework to assess block-scale urban waterlogging severity, specifically, distinguishing deep from shallow inundation among historically flooded blocks in Shanghai, China. The specific objectives of this research were fourfold: (1) constructing a comprehensive multidimensional framework integrating meteorological forcings, land surface characteristics, and building configurations for urban waterlogging depth severity classification; (2) developing a cascade modeling pipeline coupled with Bayesian optimization to identify the most robust predictive algorithm; (3) predicting the probability of deep inundation (≥20 cm) conditional on waterlogging occurrence under different rainfall scenarios and map the severity probability, exploring how hydrometeorological factors influence the shift in depth severity; and (4) deciphering the nonlinear interactive mechanisms and extract the critical morphological thresholds governing inundation depth using explainable artificial intelligence (XAI). The findings aim to provide quantitative insights into inundation adaptation strategies for sustainable urban planning and design in high-density urban environments.
2. Study Area and Materials
2.1. Study Area
This study selected the central urban area of Shanghai as its research region to investigate the nonlinear mechanisms of urban flooding within city blocks under different rainfall scenarios. Shanghai is located on the eastern coast of China, at the mouth of the Yangtze River (30°40′–31°53′N, 120°52′–122°12′E), covering a total area of approximately 6340.5 km2 (Figure 1). As China’s largest financial center and a megacity with a permanent resident population exceeding 24 million, Shanghai has experienced rapid urbanization accompanied by substantial changes in land surface characteristics, resulting in a high proportion of impervious surfaces. The city’s long-term mean annual precipitation ranges from approximately 1200 mm to 1400 mm, with roughly 60% concentrated during the flood season (May to September). The predominance of artificial surfaces weakens the natural infiltration capacity and alters urban hydrological processes, leading to earlier peak runoff and increased runoff volume, which frequently trigger severe pluvial flooding. According to the Shanghai Water Affairs Bureau, as of the end of 2025, the majority of Shanghai’s municipal drainage infrastructure was designed to withstand rainfall events with a 1-year return period, which represents a relatively low level of flood protection capacity. Only approximately 29% of the stormwater pipe network has been upgraded to meet the 3–5-year return period standard. Furthermore, certain low-lying residential areas located at the periphery of pumping station service zones are particularly vulnerable to urban flooding, as these areas are prone to large-scale inundation during heavy rainfall events due to insufficient drainage capacity. This structural vulnerability in the drainage system underscores the practical significance of investigating the meteorological and urban morphological factors driving urban flood risk in Shanghai.
Figure 1.
The study area and waterlogging records in the urban area of Shanghai.
2.2. Data
2.2.1. Spatial Analysis Unit
Shanghai is a typical plain city, characterized by negligible micro-relief and a mean elevation of approximately 4 m. Previous studies [71] often employed gravity-based natural drainage algorithms, which are limited in high-density urban areas subject to substantial human intervention. This study adopted the city block, delineated by the urban road network, as the fundamental spatial unit. The central urban area of Shanghai is accordingly divided into 443 blocks (Figure 1). The road network functions as both an “artificial watershed” and a “convergence channel”, governing the partitioning of surface runoff and the drainage of the sewer system. From an urban planning perspective, block-scale indicators are the primary units of morphological control, making this spatial unit particularly suitable for translating research findings directly into planning and risk mitigation strategies.
2.2.2. Recorded Waterlogging Data
The flood inundation data used in this study were provided by the Shanghai Water Affairs Bureau, covering the period from 2018 to 2024. The dataset comprises records from 650 historical waterlogging events monitored by road-shoulder sensors, documenting the geographic location, inundation duration, and depth of each event. Geographic coordinates were extracted via geocoding, and a spatial join operation using the nearest neighbor algorithm was performed in QGIS 3.42.3 to assign individual flood records to their corresponding block polygons.
To address spatiotemporal heterogeneity, the 650 point-level waterlogging records were aggregated to the block scale using urban blocks and rainfall dates as joint identifiers. Where multiple sensor points fell within the same block during the same rainfall event, the maximum observed inundation depth was retained as the representative target value for that block-date unit. This approach is grounded in the hydraulic interpretation of urban inundation: the severe water depth at a single location is not an isolated issue, but rather a direct reflection of the overall drainage burden imposed on the entire block. Adopting the maximum depth therefore provides a conservative and operationally appropriate estimate of the block’s worst-case inundation state, consistent with the risk-oriented framing of this study.
This aggregation process yielded 379 unique block-date samples. All samples originated from verified waterlogging events in the historical record; no blocks without waterlogging records were included. To formulate the machine learning task, a binary classification scheme was applied using a 20 cm severity threshold. The 224 samples at or above 20 cm represented deep inundation events (labeled as 1, the positive class), while the 155 samples with a maximum water depth below 20 cm represented shallow inundation events (labeled as 0, the negative class). Accordingly, the classification task in this study should be understood as distinguishing deep from shallow inundation within the universe of recorded waterlogging events.
The 20 cm threshold was selected on the basis of two complementary rationales. First, it corresponds to a formally established operational standard in Shanghai: municipal regulations specify that roads are subject to traffic restriction when the inundation depth reaches 20 cm (Shanghai Special Emergency Plan for Flood and Typhoon Prevention). Second, from a statistical standpoint, 20 cm is the median of the maximum depth distribution in the dataset (mean = 20.45 cm, median = 20 cm, SD = 9.08 cm, range: 5–50 cm), yielding a positive-to-negative sample ratio of approximately 1.45:1. This near-balanced class structure reduces the risk of class imbalance during model training and provides a stable foundation for classification. The convergence of regulatory significance and distributional balance reinforces the suitability of 20 cm as the classification boundary for this study.
2.3. Explanatory Factors
Urban flooding results from the complex interaction of multiple environmental conditions. To reflect its true driving mechanisms, this study integrated findings from previous research while addressing gaps in factor selection. Based on this, 21 variables were selected, comprising 3 meteorological factors, 9 surface morphological factors, and 9 building configuration factors.
2.3.1. Meteorological Factors
Meteorological data were obtained from the China Meteorological Administration at a station located at 121°25′54″E, 31°11′32″N, with a 1-h sampling interval. Records corresponding to 40 rainfall dates with documented inundation events were extracted. To capture distinct dimensions of rainfall characteristics, three key variables were calculated for each event: (1) total rainfall volume (cumulative 24-h precipitation), representing the overall water load input to the drainage system; (2) maximum hourly rainfall (peak recorded hourly precipitation), indicating the instantaneous hydraulic stress imposed on urban infrastructure; and (3) rainfall duration (total consecutive hours with rainfall exceeding 0.1 mm), serving as a proxy for the sustained loading of the drainage network.
2.3.2. Surface Morphological Factors
In urban flood risk assessments, topography is a fundamental determinant of surface runoff pathways. Three topographic indicators were incorporated in this study: average slope (AS), average altitude (AA), and average roughness (ARH). ARH is a macro-scale indicator quantifying the complexity of surface topographic undulations, defined as the ratio of actual surface area to projected plan area. Blocks characterized by steeper slopes and greater topographic roughness generally exhibit lower flood susceptibility.
Underlying surface factors introduce significant spatial heterogeneity in urban flooding dynamics by altering the surface runoff generation and infiltration processes. This study incorporated four land cover indicators: green space ratio (GSR), impervious surface ratio (ISR), water coverage ratio (WCR), and the normalized difference vegetation index (NDVI). NDVI, ranging from −1 to 1, serves as a proxy for vegetation density; higher values indicate that dense vegetation cover contributes to precipitation interception, suppression of soil erosion, and enhanced soil water retention capacity. ISR reflects the extent of hardened surfaces that impede infiltration, while WCR reflects the proportion of surface water bodies within each block.
Distance to river (DR) quantifies the spatial proximity of each block to the nearest waterway, derived using Euclidean distance within QGIS. Blocks adjacent to rivers face elevated flood risk due to potential backwater effects and riverbank overflow. Road density (RD) exerts a dual influence on urban flooding: on the one hand, a high-density road network increases impervious surface coverage and accelerates surface runoff; on the other hand, it may reflect a more developed underground drainage infrastructure, which can partially mitigate flood risk. The data sources and spatial resolutions, and format for all aforementioned feature variables are summarized in Table 1, and the raster maps of the topographic factors are illustrated in Figure 2.
Table 1.
Description and sources of the main data.
Figure 2.
Distribution maps of surface morphological factors in Shanghai. (a) altitude; (b) surface slope; (c) terrain roughness; (d) NDVI; (e) distance to river; (f) landuse.
2.3.3. Building Configuration Factors
Urban morphological factors, encompassing both two-dimensional surface characteristics and three-dimensional building configurations, have been shown to jointly govern flood discharge and inundation depth [69,72]. To accurately quantify the impact of block-level morphology on urban flooding, this study selected nine three-dimensional building indicators, organized into three functional groups. First, density of buildings (DB), building coverage ratio (BCR), and building congestion degree (BCD) serve as density indices to characterize the three-dimensional compactness and spatial packing of building clusters. Second, mean building height (MBH), standard deviation of building height (SDBH), and floor area ratio (FAR) quantify the vertical development intensity and spatial heterogeneity of building height distribution. Third, mean building volume (MBV), standard deviation of building volume (SDBV), and building shape coefficient (BSC) characterize the volumetric scale and morphological compactness of the built environment. The complex three-dimensional configuration of urban buildings can substantially redirect surface runoff pathways and increase the load on drainage systems. A well-distributed spatial arrangement of buildings helps disperse runoff and mitigate locally concentrated flow, thereby reducing urban flood risk. A summary of all variables is presented in Table 2.
Table 2.
Detailed information of building configuration factors.
3. Methodology
As depicted in Figure 3, the overall analytical pipeline for assessing urban waterlogging severity and dynamically decoupling its driving mechanisms comprised four interconnected phases. (1) candidate features from three core aspects were screened through correlation and multicollinearity analysis to determine the final model inputs. (2) four machine learning classifiers (XGBoost, random forest, SVM, and logistic regression) were trained and systematically compared using five evaluation metrics to identify the optimal model. (3) the calibrated optimal model was applied to predict deep inundation probabilities and generate spatial risk maps under different rainfall scenarios. (4) rainfall-stratified SHAP analysis and partial dependence plots (PDPs) are employed to decouple the nonlinear contributions and threshold effects of meteorological and morphological drivers across varying precipitation categories.
Figure 3.
The four-step analytical framework of this study.
3.1. Feature Selection via Spearman Correlation and Multicollinearity Diagnosis
To reduce dimensionality and mitigate overfitting, feature selection was conducted prior to model construction in two sequential steps. Given the non-normal distribution of the meteorological and urban morphological variables (e.g., green coverage ratio, building density) and their nonlinear relationships with inundation depth, Spearman’s rank correlation was employed to assess monotonic associations between features, with one variable removed from the correlated set exceeding 0.8. Multicollinearity was subsequently diagnosed using the variance inflation factor (VIF), and features with VIF ≥ 10 were excluded following the widely adopted criterion [73]. Although tree-based ensemble models exhibit an inherent tolerance to multicollinearity, severe inter-feature correlations can introduce redundant attribution among overlapping features, compromising the stability of downstream SHAP-based interpretability analysis. This dual-stage procedure ensures that the retained feature subset represents physically independent contributions to urban waterlogging severity.
3.2. Principle of the Algorithm
To investigate its driving mechanisms, this study selected logistic regression (LR), support vector machine (SVM), random forest (RF), and extreme gradient boosting (XGBoost) for modeling and comparative evaluation. LR served as the baseline given its linear interpretability. SVM was included for its ability to handle high-dimensional non-linear data [74], while RF and XGBoost were selected as ensemble methods known for capturing complex feature interactions with built-in overfitting control. The core principles and mathematical formulations of the optimal model (XGBoost) are described in detail here, and those of the remaining models (LR, SVM, and RF) are provided in Appendix A.
Extreme Gradient Boosting (XGBoost)
XGBoost is an advanced ensemble algorithm based on the framework of gradient boosted decision trees (GBDTs). It sequentially builds trees in a forward stagewise manner. At each boosting round , the objective function utilizes a second-order Taylor expansion to accelerate convergence, while simultaneously integrating a regularization term to penalize model complexity and prevent overfitting during binary classification [75].
where and are the first- and second-order gradients of the loss function, respectively. In the regularization term, denotes the number of leaf nodes, is the leaf score (weight) of the -th leaf, and and are penalty coefficients controlling model complexity.
For a fixed tree structure, setting the derivative of the objective with respect to to zero yields the optimal weight for the -th leaf node (i.e., the predicted weight for deep inundation for samples falling into that leaf):
During tree construction, the optimal split point for each feature is determined by maximizing the reduction in the objective function. Substituting back into the objective yields the score for a given tree structure, from which the splitting Gain is derived as
where subscripts L and R denote the left and right child nodes after splitting, respectively, and the third term represents the score of the parent node before splitting. The Gain function thus balances predictive improvement against model complexity, where directly controls the minimum gain required to justify a further split. This regularization mechanism prevents overfitting by penalizing unnecessary splits, contributing to XGBoost’s strong generalization in high-dimensional feature spaces.
3.3. Bayesian Optimization and Model Evaluation
To efficiently search for the optimal hyperparameter configurations of various machine learning models, Bayesian optimization (BO) is introduced. Unlike conventional grid search or random search, Bayesian optimization constructs a probabilistic surrogate model of the objective function and leverages an acquisition function to intelligently guide the search direction, thereby approximating the global optimum at a significantly reduced computational cost.
To prevent spatial data leakage and ensure robust evaluation, we utilized a nested cross-validation framework. The outer loop applied a 5-fold stratified group to split the 379 samples (80% train, 20% test), grouping data by neighborhood block to keep spatial units intact. For hyperparameter tuning, an inner 3-fold cross-validation was performed exclusively on the training sets using 50 iterations of Bayesian optimization. This strict separation prevents overfitting and guarantees an unbiased assessment of the model’s generalization. The receiver operating characteristic (ROC) curve and the area under the curve (AUC) were employed to measure the overall discriminative capacity of the models. Furthermore, accuracy, precision, recall, and the F1-score were incorporated as holistic performance indicators.
where TP and TN represent the number of correctly classified positive and negative instances, respectively; FP denotes the number of negative instances incorrectly predicted as positive, and FN indicates the number of positive instances incorrectly predicted as negative.
3.4. Interpretability Analysis
This study integrates the SHAP (SHapley Additive exPlanations) framework with PDP (partial dependence plot) analysis, constructing an interpretability pipeline from global feature attribution to local marginal effect characterization.
3.4.1. SHAP (SHapley Additive exPlanations)
SHAP is a post hoc model interpretation framework grounded in cooperative game theory. It quantifies each feature’s independent contribution by computing Shapley values—the marginal contribution of each feature averaged across all possible feature coalitions. For a given block sample , the SHAP value of the -th feature is formally defined as:
where represents the SHAP value of feature , is the set of all input features, and denotes a feature subset excluding feature . The term is the expected model output given subset , which represents the expected probability of deep inundation when only the information in subset is utilized.
In contrast to traditional Gini-based metrics, SHAP provides both global rankings of flood-driving factors and precise local attribution for individual block samples. Crucially, by capturing the directionality of feature impacts and their interactions, SHAP serves as the analytical framework for the rainfall stratified mechanistic analysis presented in this study.
3.4.2. PDP (Partial Dependence Plot)
PDPs are employed to reveal the nonlinear marginal effects of one or two target features on model predictions by marginalizing over the distribution of the remaining features. For a target feature subset and its complement (the remaining features), the unbiased estimation function is:
where is the total number of training samples, and represents the actual observed values of the complementary features in the -th sample. In the context of urban inundation mechanisms, PDPs can effectively identify critical physical thresholds that trigger abrupt shifts in waterlogging severity.
4. Results
4.1. Correlation and Multi-Collinearity Analysis of Characteristic Variables
The Spearman correlation analysis (Figure 4) revealed that total rainfall volume, rainfall duration, and maximum hourly rainfall were the primary factors significantly and positively correlated with urban waterlogging depth. Several indicators, including GSR, NDVI, DR, SDBV, MBV, and BCD, exhibited slight negative correlations with waterlogging depth; however, none of these associations reached statistical significance, suggesting that their influence on waterlogging depth may be indirect or mediated by nonlinear mechanisms. Indeed, the relationship between most urban morphological factors and object variable does not follow a simple linear or monotonic pattern; rather, it is characterized by complex multivariate interactions among features.
Figure 4.
Spearman’s rank correlation matrix of the explanatory variables. ***: p < 0.01; **: p < 0.05; *: p < 0.1. Y (maximum depth of ponding water); X1 (total rainfall volume); X2 (rainfall duration); X3 (maximum hourly rainfall); X4 (water coverage ratio); X5 (green space ratio); X6 (impervious surface ratio); X7 (NDVI); X8 (distance to river); X9 (SDBH); X10 (SDBV); X11 (BSC); X12 (BD); X13 (average altitude); X14 (road density); X15 (MBH); X16 (FAR); X17 (average roughness); X18 (slope); X19 (BCR); X20 (MBV); X21 (BCD).
Regarding inter-predictor correlations, total rainfall volume and rainfall duration showed a strong positive correlation ( = 0.86, p < 0.001). ISR was strongly correlated with multiple urban morphological indicators, including DB ( = 0.85), BCR ( = 0.82), and FAR ( = 0.78). Meanwhile, BCD showed strong correlations with FAR ( = 0.80, p < 0.001) and BCR ( = 0.81, p < 0.001). Furthermore, ARH and AS exhibited perfect collinearity, with a correlation coefficient of = 1.0; MBV was positively correlated with SDBV ( = 0.72, p < 0.001). Collectively, these results indicate that rainfall-related variables are the dominant factors significantly associated with urban waterlogging depth, while a certain degree of multicollinearity exists among the urban morphological variables.
Building upon the aforementioned correlation analysis, highly inter-correlated variables, namely AS, ARH, BCR, and BCD, were initially excluded to reduce redundancy. Notably, two pairs of variables with moderate inter-correlations but fundamentally distinct physical mechanisms were retained. As noted above, rainfall duration and total rainfall volume each reflects different dimensions of meteorological forcing; similarly, DB primarily reflects the physical obstruction of surface runoff by building structures, whereas ISR governs the overall scale of surface runoff generation and concentration. A multicollinearity diagnostic was subsequently conducted on the remaining 17 variables.
Subsequently, to further eliminate severe multicollinearity and ensure model stability, a variance inflation factor (VIF) diagnostic was conducted on the remaining features, and the results are presented in Table 3. During this step, although MBV and SDBV both describe the building volume effects, MBV was explicitly removed because its VIF exceeded the critical threshold of 10. Furthermore, ensemble tree-based models are inherently robust to multicollinearity due to their adaptive feature selection during node splitting. Consequently, having excluded severe collinearity (VIF < 10), retaining the remaining moderately correlated variables with distinct physical interpretations was methodologically justified. This approach is essential for comprehensively disentangling the individual contributions of complex environmental drivers to urban waterlogging severity.
Table 3.
VIF and tolerance values for the refined feature set.
4.2. Model Performance Evaluation and Comparison
This study employed a nested cross-validation framework to ensure unbiased model evaluation and hyperparameter optimization. In the outer loop, the dataset was partitioned into 80% training and 20% holdout test sets using 5-fold cross-validation. Within each outer training fold, an inner 3-fold cross-validation loop was nested and combined with Bayesian optimization for hyperparameter tuning. This design ensures complete independence between hyperparameter selection and model evaluation: the test set remains strictly unseen throughout the tuning process, effectively eliminating selection bias arising from overfitting hyperparameters to a specific validation set and thereby guaranteeing the objectivity of performance estimates. Finally, the globally optimal hyperparameter configuration for each model was determined by applying Bayesian optimization to the full dataset, as summarized in Table 4.
Table 4.
The optimum hyperparameter results for each ML model.
Furthermore, given that records from the same block across different rainfall events share identical static urban morphological characteristics, conventional random cross-validation (StratifiedKFold) would violate block-level independence and introduce spatial data leakage. To address this, this study adopted StratifiedGroupKFold for nested cross-validation, utilizing the block ID as the grouping variable. This ensures that all temporal samples from a given block are strictly assigned to the same fold partition. Consequently, during the training phase, the model learns the complex interactions between dynamic meteorological events and static morphology. During the testing phase, it is evaluated on entirely unseen blocks. This approach strictly prevents the model from memorizing localized spatial features (intra-block data leakage), thereby enabling an objective assessment of the model’s true spatial generalization capacity.
Figure 5a–d presents the receiver operating characteristic (ROC) curves and corresponding area under the curve (AUC) values across five independent experiments, reflecting each model’s generalization performance on unseen samples. Among the four models evaluated, XGBoost demonstrated superior predictive performance and stability. Its mean AUC reached 0.84 with a standard deviation of only 0.036, indicating highly consistent performance across block samples with varying spatial characteristics. As shown in Figure 5f, XGBoost also outperformed all other models across multiple evaluation metrics, achieving an accuracy of 0.741, precision of 0.790, recall of 0.779, and F1-score of 0.780. Additionally, the mean gap between the training and test sets across 5-fold cross-validation was 0.15 for AUC and 0.17 for F1-score (Figure 5e). Given the inherent complexity of urban flooding driven by multiple interacting morphological factors, the model effectively suppressed overfitting on unseen blocks and demonstrated sound generalization performance. Accordingly, XGBoost was selected as the final model for waterlogging depth classification and feature interpretation in this study.
Figure 5.
Cross-validation performance and comparative evaluation of four machine learning models. (a–d) Fivefold cross-validation ROC curves for logistic regression, SVM, random forest, and XGBoost, respectively; colored lines represent individual folds, the bold black line indicates the mean ROC, the grey shaded band denotes ± 1 standard deviation across folds, and the gray dotted line represents a random classifier (AUC = 0.5). (e) Performance gap between training and testing sets in 5-fold cross-validation for XGBoost. (f) Radar chart comparing model performance across precision, recall, accuracy, F1, and AUC.
4.3. Mapping Deep Inundation Probability Under Different Rainfall Scenarios
To map inundation severity, the XGBoost model was employed to predict the probability of deep inundation. The predicted probabilities, ranging from 0 to 1, were classified into five equal intervals, corresponding to very low, low, moderate, high, and very high risk levels, respectively. A value approaching 1 indicates a higher likelihood of a location being classified as a deep inundation area, whereas a value closer to 0 suggests a tendency toward shallow inundation. It should be noted that the predicted probabilities reflect the conditional likelihood of deep inundation (≥20 cm) given that waterlogging occurs. Blocks with no historical waterlogging records are not necessarily flood-free; the absence of records may reflect monitoring gaps.
To evaluate the impacts of varied rainfall characteristics on inundation, six rainfall scenarios were constructed (Table 5), encompassing different combinations of total rainfall volume, peak intensity, and duration. These scenarios were designed based on historical data distributions—anchoring parameters between the 25th and 90th percentiles and matching historical peak-to-mean intensity ratios to guarantee physical plausibility. Furthermore, guided by the model’s key decision split thresholds, we constructed specific scenario pairs. By varying select rainfall characteristics while keeping others approximately constant, this design allowed us to quantitatively compare how different rainfall patterns shift the predicted probabilities of severe inundation. The subsequent spatial variations in deep inundation probabilities across these scenarios are illustrated in Figure 6. Importantly, these scenarios serve as a sensitivity analysis rather than operational forecasts, designed to illustrate how the model’s predicted probabilities respond to varying rainfall inputs.
Table 5.
Area and proportion of deep inundation probabilities.
Figure 6.
Spatial mapping of deep waterlogging probabilities under multiple rainfall scenarios. (a) R1; (b) R2; (c) R3; (d) R4; (e) R5; (f) R6.
A comparison between scenarios R1 and R2 revealed that under a constant total rainfall volume of 30 mm, an increase in peak intensity from 10 to 25 mm/h reduced the very low risk proportion from 48.5% to 17.2%, while the low risk proportion rose from 25.4% to 54.7%. This demonstrates that even with a limited total volume, short-duration rainfall with a high peak triggers rapid surface runoff concentration. Such conditions can quickly exceed both the initial soil infiltration rate and the instantaneous capacity of the drainage network, thereby potentially shifting the overall risk profile toward higher levels.
Although scenarios R4 and R5 shared an identical total rainfall volume of 100 mm, they exhibited drastically different inundation risk distributions. Specifically, R4 (with a peak intensity of 20 mm/h) leaves 63.9% of the area at high risk. Conversely, under the long-duration, low-peak scenario (R5), over 98% of the region remains at low to very low risk. This simulated outcome strongly aligns with observations from actual long-duration rainfall events, further validating the model’s reliability.
For scenarios R3 and R4, the peak intensity remained constant at 20 mm/h. However, as the duration extended from 4 to 8 h (with a corresponding increase in total volume), a fundamental shift in risk distribution occurred: R3 was dominated by low risk (58.3%), whereas R4 experienced a pronounced transition, with the high risk proportion reaching 63.9%. In R3, while the 20 mm/h peak stressed the regional drainage system, the relatively short 4-h duration allowed the existing surface retention and general drainage infrastructure to mitigate the impact, thereby preventing widespread deep inundation. In contrast, the sustained high-load input over 8 h in R4 may imply that the watershed’s overall resilience may be overwhelmed. This highlights a significant threshold effect regarding rainfall duration. Once the duration of a high-intensity peak exceeds the system’s saturation tipping point, the progression of inundation risk is no longer a linear spatial expansion, but rather a step-wise escalation. Scenarios R4 and R6 shared an 8-h duration. With further increases in both rainfall volume and peak intensity, the high risk area expanded from 63.9% to 80.6%, and the very high risk area doubled from 4.2% to 8.5%. Under the extreme rainfall conditions of R4, the algorithm indicates that the system is already approaching its critical capacity limit. By further elevating the peak intensity to 30 mm/h (R6), the rapid accumulation of surface water suggests that the input may have already exceeded the regional drainage capacity, with the majority of additional precipitation likely contributing directly to severe surface inundation.
Spatial distribution analysis revealed that the very high-risk waterlogging areas are significantly clustered in Shanghai’s Hongkou, Jing’an, and Yangpu Districts, as well as the northwestern part of Pudong New Area, with sporadic occurrences in partial blocks of Xuhui, Minhang, and Qingpu Districts. These specific areas are highly susceptible to severe inundation under extreme rainfall events, thereby posing a substantial threat to transportation network resilience and public commuting safety. Consequently, in future urban flood risk management, these highly exposed zones must be prioritized for emergency response, coupled with the strategic stockpiling and proactive deployment of flood control resources.
4.4. Model Interpretability Analysis
While previous studies typically rely on global feature interpretability, the contribution of urban morphology to waterlogging severity is highly sensitive to meteorological boundary conditions. To examine how driving mechanisms evolve under varying rainfall conditions, the 379 samples were stratified using three rainfall characteristics. The primary stratification followed 24-h cumulative rainfall thresholds defined by the China Meteorological Administration (CMA), with events below 50 mm aggregated into a single baseline group to ensure adequate sample sizes: ordinary rainfall (<50 mm, n = 133), rainstorm (50–101 mm, n = 105), and heavy rainstorm (≥101 mm, n = 141).
Two supplementary stratification schemes were applied to validate robustness. By integrating CMA standards with commonly adopted classification practices in the field, maximum hourly rainfall intensity was categorized as low (<20 mm/h, n = 172), high (20–40 mm/h, n = 122), and extreme (≥40 mm/h, n = 85), while rainfall duration was classified as short (≤6 h, n = 108), moderate (6–12 h, n = 102), and long (>12 h, n = 169). Results of the supplementary stratifications are presented in Appendix A, Figure A1 and Figure A2.
4.4.1. SHAP-Based Analysis of Factor Contributions
The SHAP group contribution analysis revealed a systematic shift in the relative importance of driving factors across rainfall categories. Table 6 presents the specific contributions and rankings of each feature variable grouped by rainfall volume. Additionally, the supplementary group rankings and the contribution rates of the various variable categories are detailed in Table A1 and Table A2, respectively. Under ordinary rainfall (<50 mm), depth-exceedance probability is jointly shaped by rainfall features (41.4%) and urban morphological factors (58.6%, comprising surface morphology and building configuration), indicating a comparatively balanced contribution structure. As intensity increases to a rainstorm (50–101 mm), the contribution of rainfall factors rises to 47.2%, with a corresponding decline in morphological influences. Under heavy rainstorm (≥101 mm) conditions, this trend intensifies markedly: the impact of rainfall surges to 70.6%, whereas the contributions of surface morphology and building configuration contract to 16.3% and 13.1%, respectively. This progressive shift indicates that beyond a critical rainfall threshold, the driving influence of meteorological forcing undergoes nonlinear amplification, ultimately overwhelming the spatial heterogeneity of the underlying surface and significantly diminishing the regulatory capacity of the urban physical environment. This contribution shift pattern was consistently reproduced under both supplementary stratification schemes: morphological factors declined from 60.4% to 33.1% across short-to-long duration groups, and from 52.2% to 30.6% across low-to-extreme intensity groups (Table A2). Across all nine subgroups, BSC and water coverage ratio persistently ranked as the top two morphological contributors, confirming that the identified contribution transition is robust to the choice of stratification criterion.
Table 6.
Contribution rates and importance rankings of all features under rainfall-volume stratification.
4.4.2. Meteorological Factors
Transitioning from the overall contribution rates, a detailed examination using the SHAP beeswarm plot elucidates the directional impacts and internal dominance shifts among variables. (Figure 7b,d,f). Under ordinary rainfall and rainstorm conditions (<101 mm), the spatial differentiation of waterlogging severity is predominantly driven by rainfall duration, peak hourly intensity, and block morphological features. Specifically, for events <50 mm, rainfall duration acts as the primary meteorological determinant (20.2%). Notably, morphological features exhibit high SHAP value dispersion with distinct bilateral polarization (red/blue) and significantly greater intra-group standard deviations than rainfall variables. This highlights their robust discriminatory power for spatial risk variations among blocks. In contrast, SHAP values for total rainfall in these groups fall entirely within the negative region, reflecting that their volumes are below the training set mean. Their uniformly negative marginal contributions fail to differentiate deep inundation from shallow inundation samples within the group. These findings confirm that under non-extreme rainfall conditions (<101 mm), morphological heterogeneity is the primary driver of spatial risk differentiation.
Figure 7.
Feature importance and SHAP partial dependence plots of the XGBoost model stratified by total rainfall volume. Note: (a,b) ordinary rainfall (<50 mm); (c,d) rainstorm (50–101 mm); (e,f) heavy rainstorm (≥101 mm).
Conversely, during extreme rainstorms (≥101 mm), total rainfall volume emerged as the absolute dominant factor, with its contribution surging to 43.7%. High values of total rainfall densely clustered in the highly positive SHAP range (+2 to +3), reflecting a profound triggering effect on deep inundation. Interestingly, long-duration features within this extreme group clustered on the left side of the plot, exerting a severity-attenuating effect. Meanwhile, maximum hourly intensity consistently exhibited a positive hazard-inducing impact across all three rainfall categories. This divergence underscores a critical physical mechanism: high-intensity rainfall that rapidly exceeds the design capacities of urban drainage systems is the decisive catalyst for deep inundation.
The supplementary stratifications based on maximum hourly intensity and rainfall duration further corroborate these findings (Figure A1 and Figure A2). Under low rainfall intensity, the rainfall peaks exhibit a distinct two-sided distribution, demonstrating a strong capacity to differentiate between shallow and deep waterlogging. Conversely, as the intensity escalates to ‘high’ and ‘extreme’ levels, the point clouds in the SHAP plot shift entirely to the right side, indicating that rainfall at these intensities consistently drives up the waterlogging depth. Furthermore, a comparison across categories reveals that the deep waterlogging rate increases significantly with rising rainfall intensity. Regarding rainfall duration, the deep waterlogging rate during the 6–12 h window is notably higher than that observed for durations exceeding 12 h.
4.4.3. Surface Morphological Factors
Although the overall importance rankings of surface morphological factors are lower than those of building configurations, their directional impacts on deep inundation probability exhibit significant heterogeneity. Across all three rainfall scenarios, GSR, NDVI, DR, and AA consistently exerted a severity-attenuating effect. Conversely, RD and ISR demonstrated a severity-amplifying effect. Topographically, areas with higher elevations are typically situated upstream along runoff pathways, making them naturally less susceptible to deep inundation. Similarly, a greater DR implies being further from the terminal outfalls of drainage networks or river channels, thereby mitigating the risk of backwater effects or riverine reverse flow. Notably, the importance ranking of DR rose significantly across all stratifications as the rainfall metrics transitioned from low to high. This suggests that under intensifying rainfall stress, the block’s resilience against severe inundation may transition from relying on local micro-topographical buffers to being primarily associated with macroscopic drainage advantages. Furthermore, areas with high vegetation coverage (characterized by high GSR and NDVI values) significantly reduce the deep inundation probability by effectively retaining precipitation and attenuating surface runoff.
As illustrated in Figure 8a, green space ratio showed a consistent protective effect against deep ponding. As GSR increased from Q1 to Q4, the deep ponding rate declined from 67.4% to 53.8%, indicating that greater green space coverage reduces the deep inundation probability, which is consistent with sponge city theory. However, the protective effect varied markedly with rainfall intensity (Figure 8b). Under ordinary rainfall, the deep ponding rate gap between low-GSR (Q1) and high-GSR (Q4) groups reached 34.7%, suggesting that green space plays a substantial role in stormwater retention under typical conditions. However, under heavy rainstorm events (≥101 mm), this gap narrowed to just 7%, implying that the marginal protective effect of green space diminishes under extreme rainfall, consistent with its relatively limited contribution observed in the feature importance analysis.
Figure 8.
Deep ponding rate associated with water coverage ratio and green space ratio. (a) deep ponding rate across green space ratio quartiles; (b) deep ponding rate of high and low green space ratio groups under different rainfall scenarios; (c) deep ponding rate across water coverage ratio quartiles; (d) terrain and hydrological characteristics of high and low water coverage ratio groups.
SHAP results revealed a positive, albeit modest, association between water coverage ratio and deep inundation probability. As supported by the quartile analysis (Figure 8c), water coverage acts as a secondary contributing factor rather than a dominant driver. This seemingly counterintuitive correlation stems from water bodies serving as a spatial proxy for low-lying, hydrologically vulnerable terrain. Specifically, blocks with extensive water coverage exhibited significantly lower mean elevations (6.77 m vs. 7.73 m) and closer proximity to rivers (189 m vs. 347 m) compared to their counterparts (Figure 8d). Consequently, the machine learning model captures an underlying geospatial association—where elevated risk reflects inherent topographic disadvantages—rather than a direct causal link between water bodies and flood induction.
4.4.4. Building Configuration Factors
Building configuration features play a critical role in distinguishing waterlogging severity. In the SHAP beeswarm plots, BSC, MBH and SDBV all exhibited a distinct bilateral polarization pattern, indicating that the model effectively captures the directional associations between their extreme values and inundation probability. Although the relative contribution magnitudes of these three metrics attenuated as the rainfall intensity increased, their directional associations with inundation probability remained consistent and robust across all rainfall scenarios.
Specifically, BSC emerged as the most influential urban morphological factor across the three rainfall scenarios (with contribution rates of 10.6%, 9.5%, and 5.6%, respectively), demonstrating exceptional cross-scenario robustness. BSC represents the ratio of a building’s surface area to its volume; for a given volume, a higher BSC indicates more complex, elongated, or fragmented building layouts. The positive association between BSC and deep inundation probability may reflect the role of fragmented configurations in impeding local surface runoff dissipation, though this interpretation remains correlational and would require hydrodynamic validation to establish causal pathways. Similarly, MBH exhibited a positive association with deep inundation probability, as areas with higher MBH values tended to show greater severe inundation probability. This pattern is consistent with the hypothesis that densely packed high-rise areas are typically accompanied by high surface imperviousness and compressed green infrastructure, though confounding factors such as land use intensity and socioeconomic characteristics cannot be ruled out without further investigation. In contrast, SDBV was the only building configuration factor exhibiting an overall negative association with deep inundation probability. SDBV measures the volumetric diversity of buildings within a site, reflecting a staggered spatial pattern of alternating high and low-rise structures. The mitigating association of high SDBV may be consistent with the hypothesis that highly variable layouts potentially disrupt continuous surface runoff convergence planes and facilitate a “temporal staggering” effect for roof runoff. Contribution rates across the three scenarios were 4.1%, 3.7%, and 2.6%, respectively, with gradual attenuation as rainfall intensified. These findings suggest that enhancing vertical building volume heterogeneity during urban planning may represent a potentially viable strategy for reducing severe deep inundation probability.
Across the nine subgroups (Figure 7, Figure A1 and Figure A2) defined by our three stratification schemes, the surface morphology and building configuration indicators exhibited varying impact magnitudes but maintained entirely consistent directional associations with severe inundation. We observed no directional reversals under any grouping criterion. Regardless of whether events were classified by rainfall volume, intensity, or duration, key building indicators such as BSC, MBH, and SDBV consistently ranked highly among all morphological contributors, with BSC remaining the most important factor overall (Table A2). This directional stability indicates that the regulatory effect of urban morphology on waterlogging is largely independent of specific rainfall conditions and remains unaffected by the choice of stratification criteria. Consequently, targeted planning interventions can provide reliable risk-reduction benefits across diverse meteorological scenarios.
4.5. Partial Dependence Plot Analysis
Beyond identifying broad trends, effective urban flood management requires precise quantitative thresholds to anticipate sudden shifts in risk. Accordingly, we generated PDPs combined with Individual Conditional Expectation (ICE) curves, as PDPs illustrate the average marginal effect of a feature on the predicted outcome, whereas ICE curves detail the localized prediction variance across individual instances.
The PDP for total rainfall volume (Figure 9a) exhibited deep inundation probability plateaus at approximately 0.48 for rainfall volumes under 139 mm, but surged significantly beyond this threshold, at which point it began to exert a totally dominant influence on deep inundation. Furthermore, the 44 mm discrepancy in mean rainfall between deep and shallow inundation samples further validates this threshold-driven risk pattern. Maximum hourly rainfall (Figure 9b) revealed a critical inflection point at 18.40 mm/h. Surpassing this threshold triggered a sharp escalation in flood probability, clearly distinguishing deep inundation events (median 27.40 mm/h) from shallow inundation ones (median 18.40 mm/h). Conversely, rainfall duration (Figure 9c) demonstrated an inverted U-shaped risk pattern, where deep inundation probability peaked during moderate events (8–16 h) but dropped sharply beyond 16 h. This paradoxically attenuated risk during excessively prolonged events is likely due to diminished rainfall intensity and drainage recovery, which explains the directional shifts observed in prior SHAP analyses.
Figure 9.
Partial dependence plots of important predictor variables. (a) total rainfall volume; (b) rainfall duration; (c) maximum hourly rainfall; (d) BSC; (e) MBH; (f) SDBV; (g) average altitude; (h) green space ratio; (i) distance to river.
The morphological features exhibited distinct nonlinear impacts on waterlogging (Figure 9d–f). BSC revealed a strict threshold effect: deep inundation risk sharply escalated from 0.48 to 0.63 at 0.39 m−1 before plateauing, indicating that maintaining BSC below this critical value effectively suppresses risk. Conversely, SDBV exerted a severity-attenuating effect, characterized by a gradual decline that accelerated into a pronounced drop (to 0.55) when the volume heterogeneity exceeded 54,155 m3. Meanwhile, MBH displayed a steep risk escalation at 15.67 m; however, given the nearly identical MBH medians between risk groups, its contribution likely manifests through complex interactions with other features rather than as an isolated driver.
Both AA and GSR exerted consistent, monotonic negative associations with inundation depth (Figure 9g,h), albeit with more modest marginal impacts compared to meteorological drivers and BSC. For AA, a notable drop in predicted probability occurred at 10.22 m, suggesting that topographically elevated areas are systematically associated with lower depth-exceedance probability in the model, which aligns with gravity-driven surface runoff mechanisms. For GSR, the steepest gradient was reached at approximately 0.03, beyond which the curve plateaued, with the overall predicted probability declining from 0.61 to 0.58, reflecting the model’s partial capture of vegetation-mediated infiltration and runoff retention. Despite their smaller effect magnitudes, maximizing topographic advantages and green infrastructure remains a reliable regulatory strategy for urban flood mitigation. The PDP for DR (Figure 9i) exhibited a monotonic decline with a pronounced inflection point at 582 m. The distribution histogram further revealed that deep inundation samples were densely concentrated within 200 m of waterways, confirming that proximity to rivers is associated with substantially elevated deep inundation probability. This finding is consistent with the established understanding in urban hydrology that low-lying riparian areas are subject to impeded drainage due to backwater effects.
5. Discussion
5.1. Applicability of Predictive Models
Among the four models evaluated, XGBoost achieved the highest overall performance. LR and SVM, as linear or kernel-based classifiers, are limited in capturing nonlinear interactions among urban flooding drivers. Although some studies have identified RF as the top-performing model [36,37,50], this likely reflects differences in problem formulation: most prior work addresses binary occurrence classification, whereas the present study distinguished shallow from deep inundation using a 20 cm depth threshold, demanding sharper decision boundaries near the critical transition zone. Under this setting, RF showed only moderate performance, as Bagging-based ensemble averaging tends to soften boundaries precisely where discrimination matters most, and systematic bias near the threshold remains uncorrected without a boosting mechanism. XGBoost addresses both limitations through iterative residual minimization and L1/L2 regularization, enabling more precise resolution of the abrupt hydrological transitions.
5.2. Nonlinear Interpretation of Factors
In contrast to most studies that rely on global SHAP analysis [38,67,68,69,70], this research stratified samples by standardized rainfall classification to examine how the relative dominance of meteorological drivers shifts across distinct rainfall scenarios. Conventional importance metrics embedded in tree models fail to capture these scenario-specific variations as they typically aggregate importance across the entire dataset [76]. Consequently, this approach underscores the significant interpretive value of explainable machine learning for deciphering the complex mechanisms of urban waterlogging.
5.2.1. Meteorological Factors
Unlike previous studies that primarily relied on total rainfall volume as the sole meteorological predictor [77,78], this research decomposed the rainfall process into three physically distinct dimensions: total volume, duration, and maximum hourly intensity. By controlling for total volume and further stratifying the data across different duration and intensity gradients, this approach evaluates the distinct influences of these factors on waterlogging severity. In the ordinary and rainstorm categories, the contribution of total rainfall volume to deep inundation exhibits a systematically negative direction, indicating that waterlogging severity is largely regulated by urban morphological factors, reflecting the inherent vulnerability of the blocks. As both rainfall intensity and total volume escalate to heavy rainstorm levels, the drainage network becomes progressively overwhelmed, with deep inundation probability surging abruptly once the total rainfall exceeds 139 mm. This behavior is primarily attributable to the limitations of Shanghai’s conventional shallow underground drainage network, which is increasingly inadequate in handling extreme rainstorm events. In response, Shanghai has been actively advancing the construction of deep drainage systems, with the Suzhou Creek Deep Tunnel Stormwater Storage Project serving as the most representative initiative. These large-scale underground tunnels are designed to intercept and retain excess runoff during extreme rainfall, thereby alleviating the capacity constraints of the conventional shallow sewer network.
Maximum hourly rainfall intensity consistently emerged as the primary driver of deep inundation across all precipitation levels, with a critical threshold identified at 18.40 mm/h, beyond which the deep inundation probability escalates abruptly. Urban waterlogging is fundamentally governed by the interplay between hydraulic loading rate and drainage discharge rate. When an intense rainfall peak drives a rapid surge in surface runoff that outpaces the effective drainage capacity of the local system, widespread inundation can develop within a short period, even if the total event rainfall remains moderate. This finding is further corroborated by the inverted U-shaped response of rainfall duration, wherein risk declines beyond 16 h, reflecting the attenuated hydraulic stress imposed by temporally dispersed precipitation on urban stormwater infrastructure.
5.2.2. The Modulating Effect of Urban Morphology on Waterlogging Severity
Historically, impervious surfaces and vegetation coverage have served as the classic drivers of urban waterlogging in traditional research [48,79], while the present study additionally incorporated building morphology indicators. Among the leading contributors identified were BSC, WCR, DR, MBH, SDBV, SDBH, AA, and ISR, a pattern broadly consistent with prior findings and confirming that building-related metrics exert a significant influence on inundation severity. Dense building clusters disrupt natural overland flow pathways, constraining runoff conveyance and promoting localized ponding where drainage capacity is insufficient. As the most important urban morphological factor, BSC demonstrates a strong capacity to distinguish between deep and shallow inundation. Since high BSC values correspond to spatially fragmented built environments, this severity aggravating effect may be related to mechanisms such as increased flow path tortuosity and reduced hydraulic connectivity. Conversely, SDBV was the only building indicator associated with a suppressive effect, a finding in line with previous studies. [71,80]. High SDBV values corresponded to spatially heterogeneous building clusters with varied heights and volumes. We hypothesize that these highly variable layouts potentially disrupt continuous surface runoff convergence planes and facilitate a “temporal staggering” effect for roof runoff. It must be emphasized, however, that these physical interpretations are plausible hypotheses derived from data driven correlations. Explicit causal attribution cannot be fully established through machine learning alone and would require future verification using explicit hydrodynamic simulations or observed runoff processes.
The contribution of urban morphological features to overall model predictions was 58.6%, 52.8%, and 29.4% across the three rainfall scenarios respectively. Under normal rainfall conditions, this suggests that optimizing building layout, adjusting underlying surface structure, and expanding water retention capacity can meaningfully reduce the waterlogging deep inundation probability [81]. However, under extreme high-intensity rainfall, the regulatory role of urban morphology diminishes considerably, indicating that the storage capacity of low-impact development facilities, such as sponge city infrastructure, approaches saturation and then their marginal flood mitigation benefit begins to decline.
5.3. Policy Implication
It is noteworthy that existing statutory planning indicators, including FAR, BD, and GSR were primarily established to serve land development control and residential amenity objectives, with limited consideration of stormwater or flood risk management. The integration of novel three-dimensional metrics such as BSC and SDBV into future regulatory guidelines would therefore complement existing frameworks from a hydrological perspective, while also aligning with the Chinese government’s strategic promotion of resilient city construction and providing a scientifically grounded basis for sustainable stormwater management at the planning stage.
For existing densified built environments where morphological alteration is practically unfeasible, the thresholds function as critical risk screening criteria: blocks whose morphological indicators exceed the identified boundaries should be flagged as priority intervention zones, prompting municipal authorities to establish appropriate runoff pathways and break continuous convergence surfaces, or deploy targeted stormwater infrastructure to proactively offset morphological vulnerabilities.
5.4. Limitations and Future Prospects
While conventional green infrastructure strategies are often constrained by land availability in dense cities like Shanghai, this study highlights that building morphology exerts a critical influence on waterlogging severity. The identified thresholds for BSC and SDBV thus provide practical guidance for morphological resilience management. Integrating these 3D metrics into micro-renewal guidelines allows planners to control high-BSC clusters and enhance volumetric diversity, thereby mitigating localized runoff convergence.
However, the current framework possesses certain limitations that should be addressed in future studies. First, given the close relationship between building development and local economic conditions [82,83], applying these morphological thresholds must be balanced with regional socioeconomic constraints. Second, although the total proportion of vegetation was analyzed, the specific spatial configuration of these green elements was not explicitly considered. Because the absolute amount of green space is limited in dense cities, its spatial arrangement becomes especially important. As demonstrated by Wu et al. [84], incorporating landscape pattern indices (such as cohesion, division, and the largest patch index) is crucial for quantifying the spatial characteristics of land use and the regulatory capacity of ecological spaces. Therefore, future work would benefit from integrating socioeconomic variables and macroscale landscape pattern indices with the current microscale building metrics to construct a more multidimensional and comprehensive urban resilience evaluation framework.
6. Conclusions
This study integrated urban waterlogging records from Shanghai spanning 2018 to 2024, incorporating three categories of indicators—meteorological variables, urban underlying surface characteristics, and building configuration factors. The final dataset was established through correlation analysis and multicollinearity diagnostics. An interpretable machine learning framework was applied to quantify the dynamic shift in feature contributions across varying rainfall scenarios. By identifying key environmental drivers of waterlogging severity, this study offers specific evidence for urban planning and flood risk management. The main conclusions are as follows:
- (1)
- A nested cross-validation scheme based on StratifiedGroupKFold, integrated with Bayesian optimization, was employed to objectively evaluate the model’s generalization performance. Comparative analysis demonstrated that XGBoost outperformed other candidate models across all metrics, including accuracy, precision, recall, F1-score, and AUC. Its superior capability in handling spatial heterogeneity provides a robust framework for inundation severity prediction in Shanghai.
- (2)
- Deep inundation probability maps across various rainfall scenarios revealed a nonlinear response mechanism in waterlogging severity, primarily driven by rainfall characteristics. Maximum hourly rainfall acts as the decisive trigger for initial waterlogging: when short-term hydrological loading exceeds the instantaneous capacity of the drainage network, risk levels rapidly escalate toward higher severity. Spatially, severe waterlogging is heavily concentrated in core urban districts, particularly Hongkou and Jing’an in Shanghai, which should be prioritized as critical nodes for flood risk management and infrastructure intervention.
- (3)
- Based on the SHAP group contribution analysis, a stratified sampling approach was adopted to examine feature contributions, revealing a systematic shift in driver dominance across rainfall categories. The combined contribution of surface morphology and building configuration declined from 58.6% to 29.4%, indicating that under non-extreme rainfall conditions (<101 mm), morphological heterogeneity primarily governs spatial risk differentiation, with BSC consistently ranking as the leading predictor across all rainfall scenarios. As rainfall intensity increases, however, the regulatory role of the urban physical environment is progressively diminished.
- (4)
- Rainfall factors exhibited pronounced nonlinear threshold effects as the primary triggers of urban inundation. Maximum hourly rainfall intensity consistently constituted the dominant driver of deep inundation probability across all precipitation levels, with a critical transition at 18.40 mm/h, beyond which disaster risk escalates abruptly. Rainfall duration displayed an inverted U-shaped response, with risk declining beyond 16 h—a pattern consistent with prolonged, low intensity events that accumulate substantial total volume yet fail to generate deep inundation due to insufficient peak intensity. Under extreme storm conditions, the total rainfall volume assumed dominance, contributing 43.7% of the predicted risk with a sharp threshold transition beyond 139 mm.
- (5)
- Urban morphological characteristics exert differentiated and directional influences on deep inundation probability, with each factor exhibiting distinct threshold-dependent response patterns that collectively govern the spatial heterogeneity of inundation severity across blocks. Building configuration factors exert a significant influence on urban waterlogging severity. BSC and MBH emerged as critical risk-driving factors, with threshold values of 0.39 m−1 and 15.67 m, respectively, beyond which the probability of waterlogging increases markedly. In contrast, greater heterogeneity in building volume (SDBV > 54,155 m3) was associated with reduced deep inundation probability, suggesting a potential buffering role. Among the surface morphological factors, GSR, NDVI, AA, and DR consistently exhibited monotonic severity-attenuating effects. These findings suggest that rational urban spatial planning can substantially enhance urban flood resilience.
Author Contributions
Conceptualization, P.D. and Z.Z.; methodology, P.D.; software, P.D.; validation, P.D., Y.G. and S.S.; formal analysis, Z.Z.; investigation, P.D.; resources, Y.G. and S.S.; data curation, P.D.; writing—original draft preparation, P.D.; writing—review and editing, P.D.; visualization, P.D.; supervision, Z.Z.; project administration, Y.G.; funding acquisition, Z.Z. All authors have read and agreed to the published version of the manuscript.
Funding
This work was supported by the National Key R&D Program of China under Grant No. 2022YFC3800500.
Data Availability Statement
The data supporting the findings of this study are available within the article. The meteorological and waterlogging records are proprietary to the relevant authorities. Due to confidentiality and data security restrictions, these specific datasets are not publicly available. They may be shared by the corresponding author upon reasonable request and with explicit permission from the original data providers.
Acknowledgments
We gratefully acknowledge the Shanghai Water Authority (Shanghai Municipal Oceanic Bureau) for providing the historical waterlogging records (2018–2024), which were instrumental to the spatial analysis and model construction in this research.
Conflicts of Interest
The authors declare no conflicts of interest.
Abbreviations
The following abbreviations are used in this manuscript:
| DB | Density of buildings |
| MBH | Mean building height |
| MBV | Mean building volume |
| FAR | Floor area ratio |
| ISR | Impervious surface ratio |
| SDBH | Standard deviation of building height |
| SDBV | Standard deviation of building volume |
| BSC | Building shape coefficient |
| BCR | Building coverage ratio |
| BCD | Building congestion degree |
| AA | Average altitude |
| ARH | Average roughness |
| AS | Average slope |
| NDVI | Normalized difference vegetation index |
| GSR | Green space ratio |
| DR | Distance to river |
| RD | Road density |
| WCR | Water coverage ratio |
| RF | Random forest |
| LR | Logistic regression |
| SVM | Support vector machine |
| XGBOOST | Extreme gradient boosting |
| SHAP | SHapley Additive exPlanations |
| PDP | Partial dependence plot |
Appendix A
Appendix A.1. Mathematical Formulations for LR, SVM, and RF
- Logistic Regression (LR)
LR is a generalized linear model widely used as a baseline classifier for binary prediction tasks. Its core principle maps the continuous output of a linear function onto the (0, 1) interval via the Sigmoid function, yielding the probability that a given block sample belongs to the deep inundation class (). The probability prediction function is given by:
where is the feature vector of the block sample, and and are the weight vector and bias term, respectively. Due to its transparent, interpretable nature, and rigorous statistical foundations, LR serves as the baseline for evaluating the classification performance of tree-based ensemble models.
- 2.
- Support Vector Machine (SVM)
SVM seeks an optimal hyperplane to maximize the classification margin between deep and shallow inundation categories. Due to the complex spatial coupling of driving factors, inundation samples are often linearly inseparable. To address this, the radial basis function (RBF) kernel defined as is employed to implicitly map the original low-dimensional features into a higher-dimensional space. By introducing slack variables , the soft-margin optimization objective is formulated as:
subject to:
Here, represents the weight vector orthogonal to the hyperplane, and is the regularization parameter that balances margin maximization against classification error (misclassification tolerance). To bridge the mapping and the computation, the kernel function is defined as , allowing the optimization to occur in the high-dimensional space without explicit feature transformation.
Upon solving this convex quadratic programming problem, the classification for a new block sample is determined by:
where are the Lagrange multipliers obtained during optimization. SVM is well-suited for the moderate-scale dataset used in this study, as it effectively mitigates the curse of dimensionality and ensures robust generalization performance through its structural risk minimization principle.
As both SVM and LR are sensitive to feature scale, all features were standardized using StandardScaler prior to model training.
- 3.
- Random Forest (RF)
RF is a robust supervised ensemble algorithm based on the Bagging strategy. To predict urban inundation severity at the block level, RF constructs an ensemble of independent decision trees by drawing bootstrap samples (with replacement) from the training dataset. During tree growth, each node is split by evaluating a random subset of features and selecting the split that minimizes the Gini impurity, which measures the probability of misclassification between deep and shallow inundation classes within a node:
where is the set of block samples at the current node, and is the proportion of samples belonging to class (deep or shallow inundation) at that node.
After constructing trees, the final classification of a new input sample is determined by majority voting across all trees in the ensemble:
where is the final classification result, is the prediction of the -th decision tree, and is the indicator function. By integrating bootstrap sampling and random feature subsampling, RF effectively reduces model variance, thereby mitigating overfitting and robustly handling high-dimensional feature sets.
Appendix A.2. Supplementary Stratification Schemes
Figure A1.
Feature importance and SHAP partial dependence plots of the XGBoost model stratified by maximum hourly rainfall intensity. Note: (a,b) low intensity (<20 mm/h); (c,d) high intensity (20–40 mm/h); (e,f) extreme intensity (≥40 mm/h).
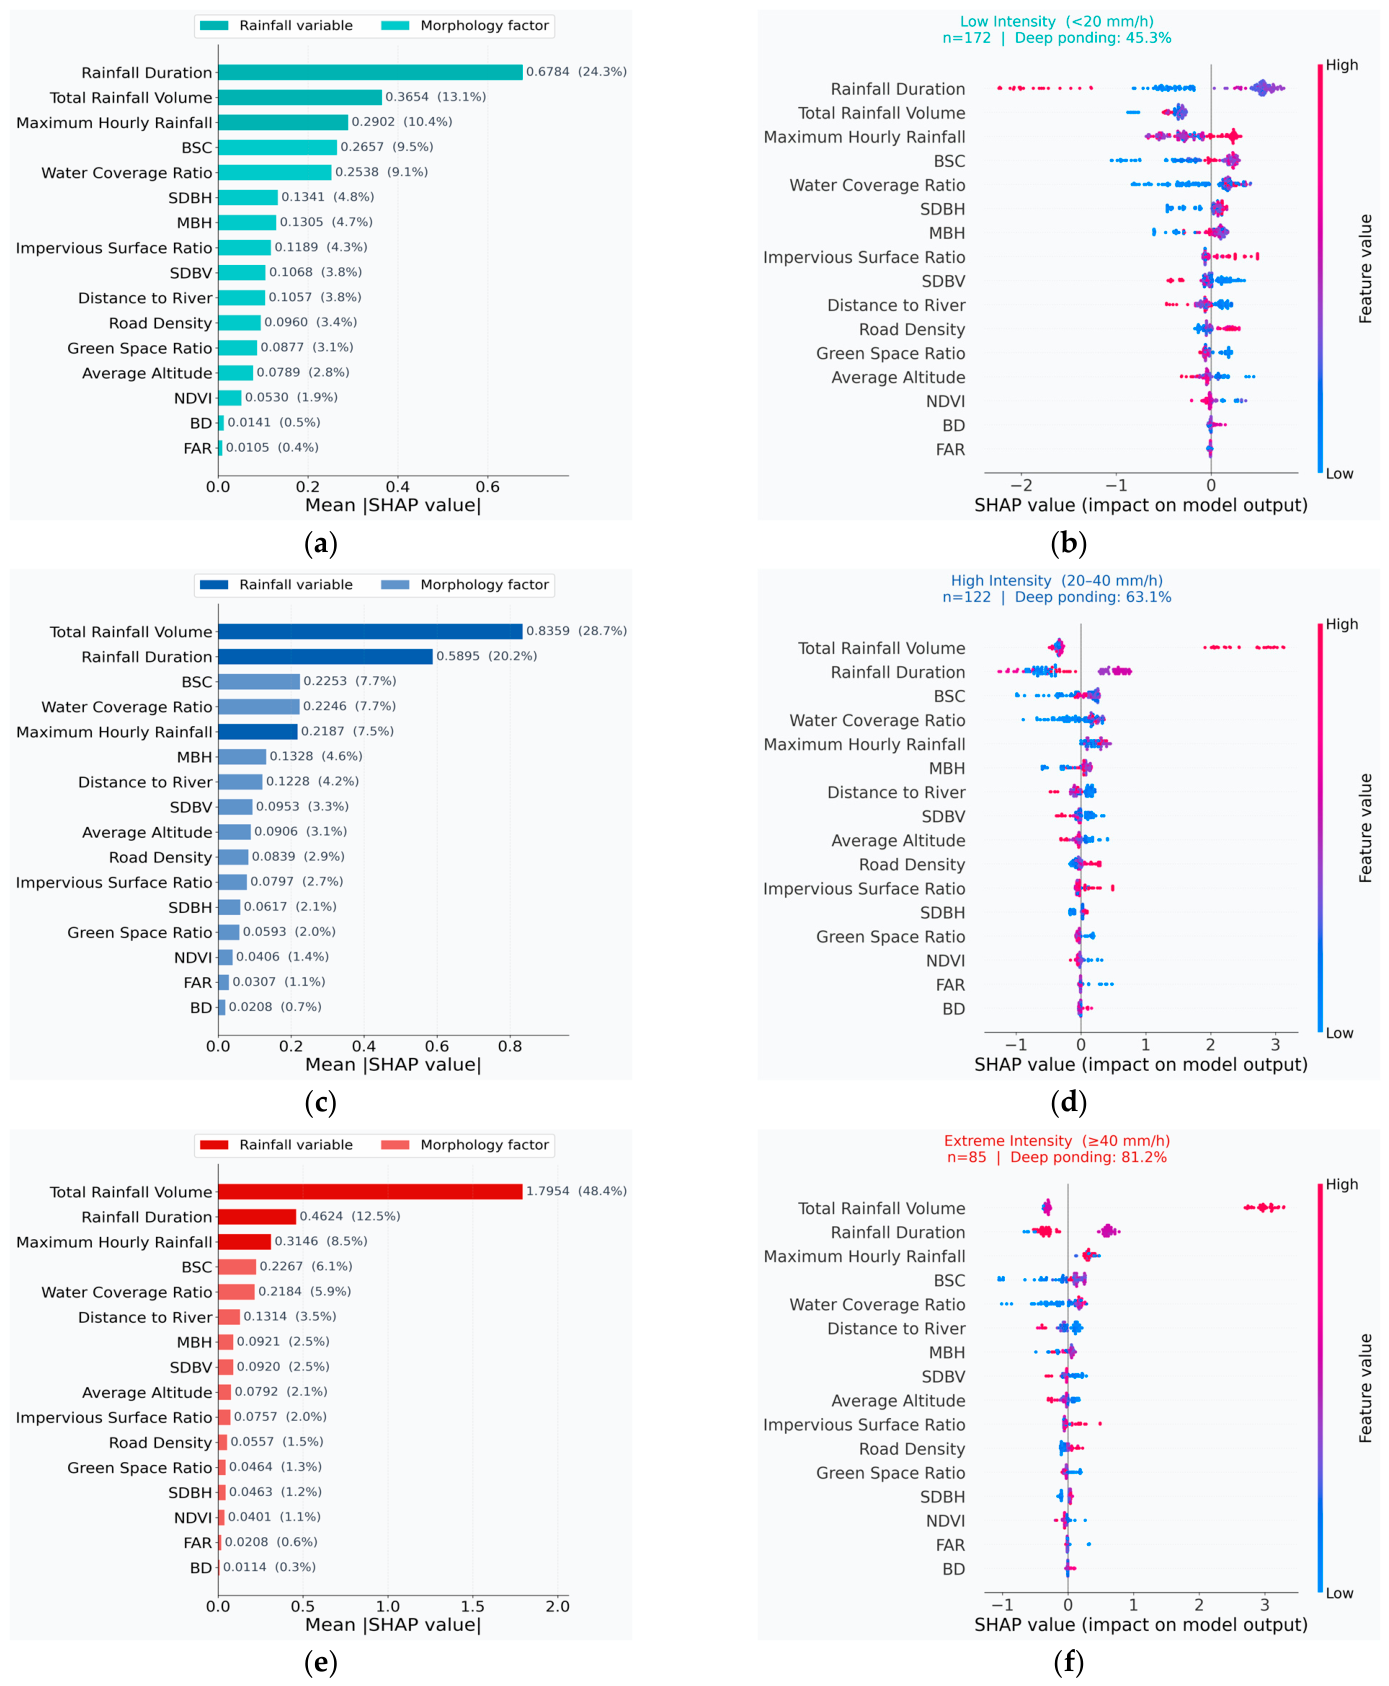
Figure A2.
Feature importance and SHAP partial dependence plots of the XGBoost model stratified by rainfall duration. Note: (a,b) short duration (<6 h); (c,d) moderate duration (6–12 h); (e,f) long duration (≥12 h).
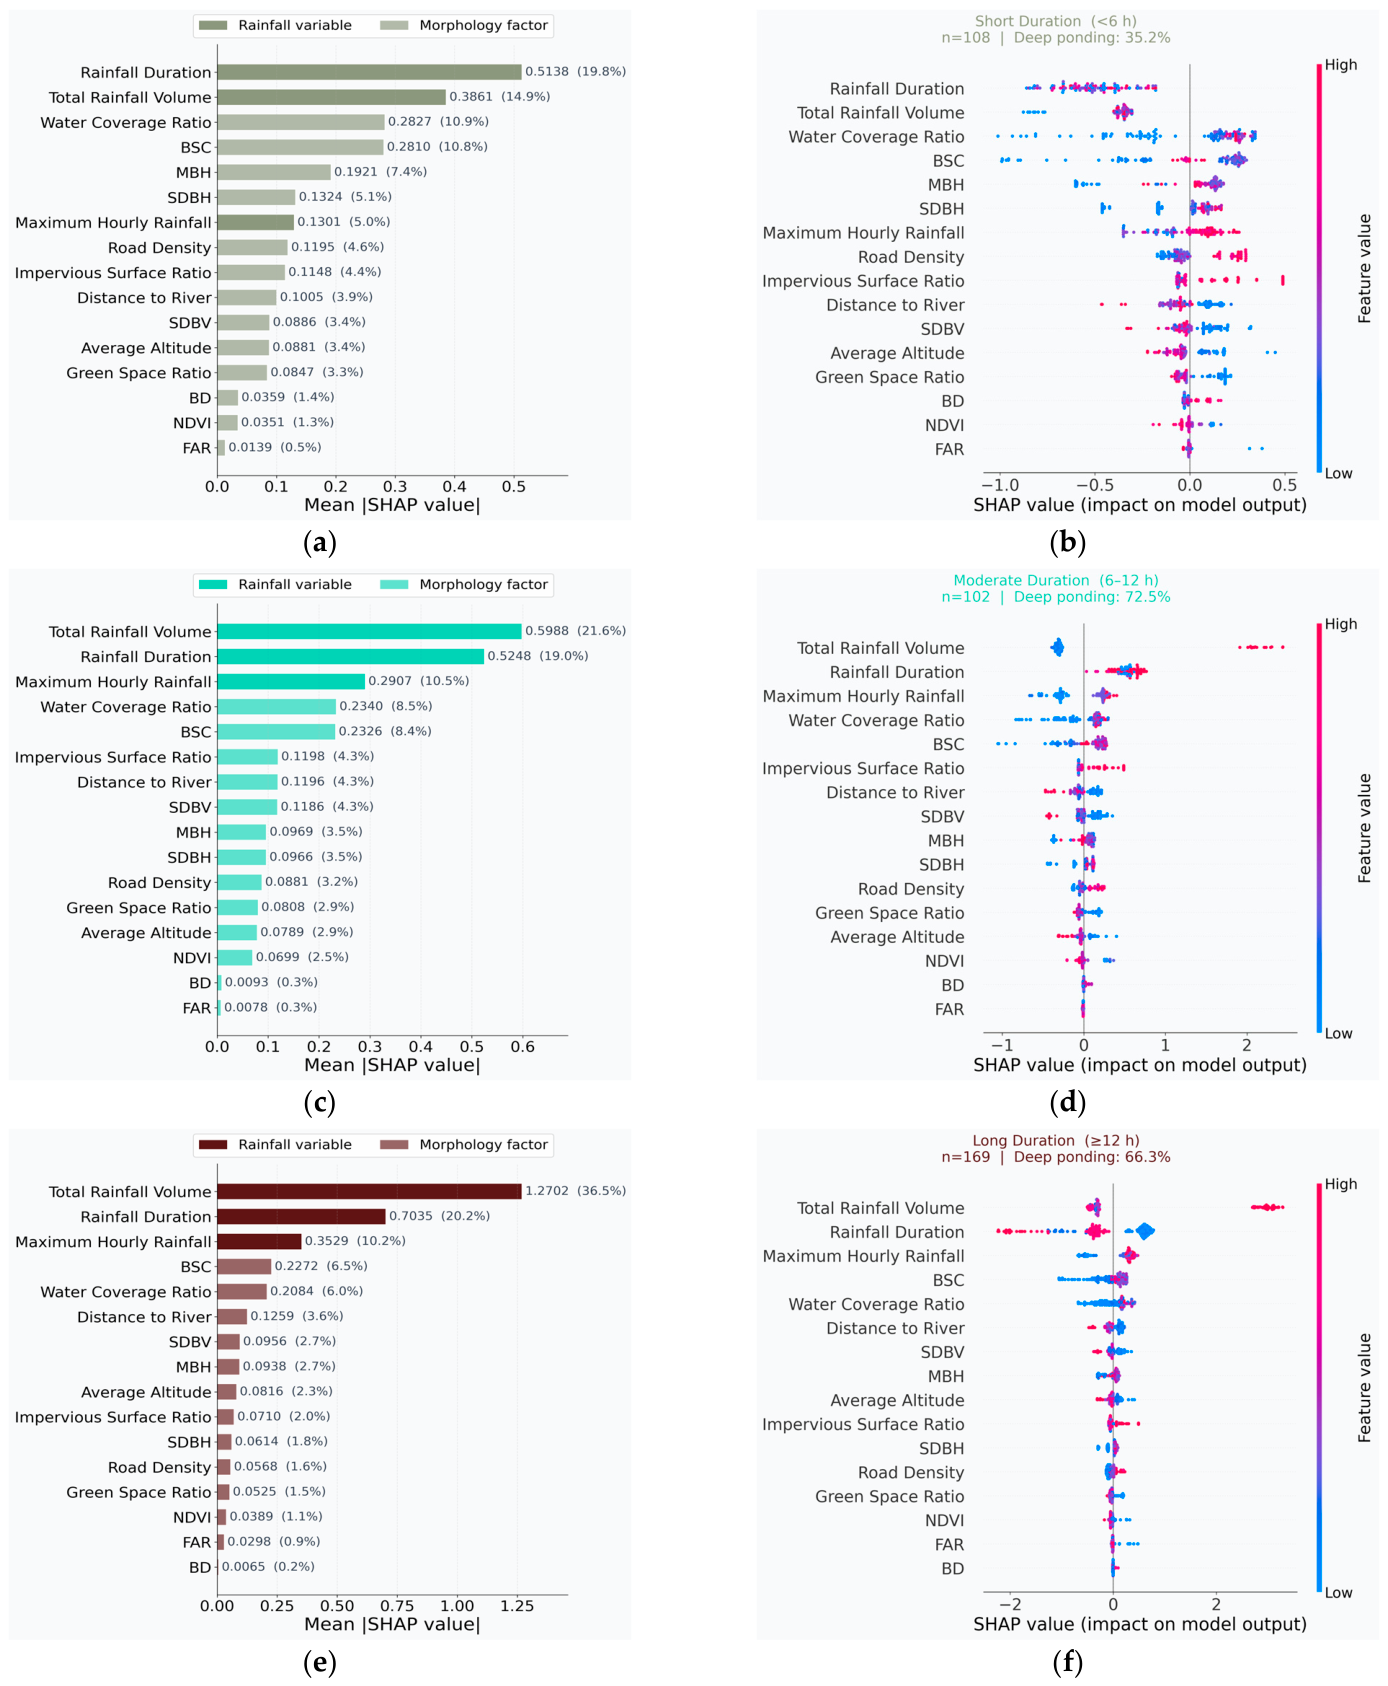
Table A1.
Robustness check: factor importance rankings under alternative stratification criteria.
Table A2.
SHAP-derived relative contributions of the morphological and meteorological factors under different rainfall scenarios.
References
- Xuan, D.; Hsieh, M.A.; Pongeluppe, L.S.; Weaver, M.M.; Mann, M.E.; Jerolmack, D.J.; Ulloa, H.N. Climate extremes and urbanization drive flood tipping points at the city–river interface. npj Nat. Hazards 2026, 3, 20. [Google Scholar] [CrossRef] [Scilit]
- Yang, L.; Yang, Y.; Shen, Y.; Yang, J.; Zheng, G.; Smith, J.; Niyogi, D. Urban development pattern’s influence on extreme rainfall occurrences. Nat. Commun. 2024, 15, 3997. [Google Scholar] [CrossRef] [Scilit]
- Guccione, A.; Bassi, P.; Desbiolles, F.; Borgnino, M.; D’Andrea, F.; Pasquero, C. Extreme precipitation changes in relation to urbanization. npj Nat. Hazards 2026, 3, 10. [Google Scholar] [CrossRef] [Scilit]
- Papalexiou, S.M.; Montanari, A. Global and Regional Increase of Precipitation Extremes Under Global Warming. Water Resour. Res. 2019, 55, 4901–4914. [Google Scholar] [CrossRef] [Scilit]
- Ke, E.; Zhao, J.; Zhao, Y. Investigating the influence of nonlinear spatial heterogeneity in urban flooding factors using geographic explainable artificial intelligence. J. Hydrol. 2025, 648, 132398. [Google Scholar] [CrossRef] [Scilit]
- Cardone, B.; D’Ambrosio, V.; Di Martino, F.; Miraglia, V. Hierarchical Fuzzy MCDA Multi-Risk Model for Detecting Critical Urban Areas in Climate Scenarios. Appl. Sci. 2024, 14, 3066. [Google Scholar] [CrossRef] [Scilit]
- Gupta, L.; Dixit, J. A GIS-based flood risk mapping of Assam, India, using the MCDA-AHP approach at the regional and administrative level. Geocarto Int. 2022, 37, 11867–11899. [Google Scholar] [CrossRef] [Scilit]
- Suárez-Inclán, A.M.; Allende-Prieto, C.; Roces-García, J.; Rodríguez-Sánchez, J.P.; Sañudo-Fontaneda, L.A.; Rey-Mahía, C.; Álvarez-Rabanal, F.P. Development of a Multicriteria Scheme for the Identification of Strategic Areas for SUDS Implementation: A Case Study from Gijón, Spain. Sustainability 2022, 14, 2877. [Google Scholar] [CrossRef] [Scilit]
- Abdelalim, M.; El Naggar, H. Urban flood hazard mapping in Dubai’s Hyper-Arid environment using a 2D HEC-RAS and GIS–MCDA–AHP integrated framework. Total Environ. Adv. 2026, 17, 200141. [Google Scholar] [CrossRef] [Scilit]
- Corvacho-Ganahín, O.; González-Pacheco, M.; Francos, M.; Carvalho, F. Evaluation of potential flood hazard through spatial zoning in Acha–Arica, northern Chile, integrating GIS, multi-criteria analysis and two-dimensional numerical simulation. Nat. Hazards 2023, 118, 755–783. [Google Scholar] [CrossRef] [Scilit]
- Hidayatulloh, A.; Bahrawi, J.; Psilovikos, A.; Elhag, M. Integrating MCDA and Rain-on-Grid Modeling for Flood Hazard Mapping in Bahrah City, Saudi Arabia. Geosciences 2026, 16, 32. [Google Scholar] [CrossRef] [Scilit]
- Boulomytis, V.T.G.; Zuffo, A.C.; Imteaz, M.A. Assessment of flood susceptibility in coastal peri-urban areas: An alternative MCDA approach for ungauged catchments. Urban Water J. 2024, 21, 1022–1034. [Google Scholar] [CrossRef] [Scilit]
- Rossman, L.A.; Dickinson, R.E.; Schade, T.; Chan, C.C.; Burgess, E.; Sullivan, D.; Lai, F.-H. SWMM 5-the next generation of EPA’s storm water management model. J. Water Manag. Model. 2004, 12, 339–358. [Google Scholar] [CrossRef] [Scilit]
- Rossman, L.A.; Huber, W.C. Hydrology. In Storm Water Management Model Reference Manual; US Environmental Protection Agency: Washington, DC, USA, 2016; Volume 1. [Google Scholar]
- Cheng, S.; Yang, M.; Li, C.; Xu, H.; Chen, C.; Shu, D.; Jiang, Y.; Gui, Y.; Dong, N. An Improved Coupled Hydrologic-Hydrodynamic Model for Urban Flood Simulations Under Varied Scenarios. Water Resour. Manag. 2024, 38, 5523–5539. [Google Scholar] [CrossRef] [Scilit]
- DHI. MIKE FLOOD 1D-2D Modelling User Manual; DHI Water & Environment: Hørsholm, Denmark, 2011. [Google Scholar]
- Anni, A.H.; Cohen, S.; Praskievicz, S. Sensitivity of urban flood simulations to stormwater infrastructure and soil infiltration. J. Hydrol. 2020, 588, 125028. [Google Scholar] [CrossRef] [Scilit]
- Li, Y.; Li, H.; Han, Y.; Huang, T.; Wang, Q.; Wang, X. Impact analysis of urban super-standard flood disasters based on MIKE+. Nat. Hazards 2025, 121, 15949–15963. [Google Scholar] [CrossRef] [Scilit]
- Chen, Y.; Hou, H.; Li, Y.; Wang, L.; Fan, J.; Wang, B.; Hu, T. Urban Inundation under Different Rainstorm Scenarios in Lin’an City, China. Int. J. Environ. Res. Public Health 2022, 19, 7210. [Google Scholar] [CrossRef] [Scilit] [PubMed]
- Dobson, B.; Watson-Hill, H.; Muhandes, S.; Borup, M.; Mijic, A. A Reduced Complexity Model with Graph Partitioning for Rapid Hydraulic Assessment of Sewer Networks. Water Resour. Res. 2022, 58, e2021WR030778. [Google Scholar] [CrossRef] [Scilit]
- Yang, K.; Hou, H.; Li, Y.; Chen, Y.; Wang, L.; Wang, P.; Hu, T. Future urban waterlogging simulation based on LULC forecast model: A case study in Haining City, China. Sustain. Cities Soc. 2022, 87, 104167. [Google Scholar] [CrossRef] [Scilit]
- Sidek, L.M.; Jaafar, A.S.; Majid, W.H.A.W.A.; Basri, H.; Marufuzzaman, M.; Fared, M.M.; Moon, W.C. High-Resolution Hydrological-Hydraulic Modeling of Urban Floods Using InfoWorks ICM. Sustainability 2021, 13, 10259. [Google Scholar] [CrossRef] [Scilit]
- Guo, K.; Guan, M.; Yu, D. Urban surface water flood modelling—A comprehensive review of current models and future challenges. Hydrol. Earth Syst. Sci. 2021, 25, 2843–2860. [Google Scholar] [CrossRef] [Scilit]
- Liu, J.; Shao, W.; Xiang, C.; Mei, C.; Li, Z. Uncertainties of urban flood modeling: Influence of parameters for different underlying surfaces. Environ. Res. 2020, 182, 108929. [Google Scholar] [CrossRef] [Scilit]
- Mondal, K.; Bandyopadhyay, S.; Karmakar, S. Framework for global sensitivity analysis in a complex 1D-2D coupled hydrodynamic model: Highlighting its importance on flood management over large data-scarce regions. J. Environ. Manag. 2023, 332, 117312. [Google Scholar] [CrossRef] [Scilit] [PubMed]
- Imroz, M.; Akhtar, M.P.; Sharma, M.K.; Alshehri, F. Integrated assessment of urban flooding and heat island interactions: A systematic review of geospatial technologies, machine learning approaches, and microclimate dynamics. J. Environ. Manag. 2025, 395, 127984. [Google Scholar] [CrossRef] [Scilit] [PubMed]
- Anik, M.S.B.M.; An, C.; Li, S.S. Evolution from the physical process-based approaches to machine learning approaches to predicting urban floods: A literature review. Environ. Syst. Res. 2025, 14, 15. [Google Scholar] [CrossRef] [Scilit]
- Islam, T.; Zeleke, E.B.; Afroz, M.; Melesse, A.M. A Systematic Review of Urban Flood Susceptibility Mapping: Remote Sensing, Machine Learning, and Other Modeling Approaches. Remote Sens. 2025, 17, 524. [Google Scholar] [CrossRef] [Scilit]
- Liu, B.; Li, Y.; Ma, M.; Mao, B. A Comprehensive Review of Machine Learning Approaches for Flood Depth Estimation. Int. J. Disaster Risk Sci. 2025, 16, 433–445. [Google Scholar] [CrossRef] [Scilit]
- Fraehr, N.; Wang, Q.J.; Wu, W.; Nathan, R. Generation and selection of training events for surrogate flood inundation models. J. Environ. Manag. 2025, 373, 123570. [Google Scholar] [CrossRef] [Scilit]
- Tehrany, M.S.; Pradhan, B.; Jebur, M.N. Flood susceptibility mapping using a novel ensemble weights-of-evidence and support vector machine models in GIS. J. Hydrol. 2014, 512, 332–343. [Google Scholar] [CrossRef] [Scilit]
- Bera, S.; Das, A.; Mazumder, T. Evaluation of machine learning, information theory and multi-criteria decision analysis methods for flood susceptibility mapping under varying spatial scale of analyses. Remote Sens. Appl. Soc. Environ. 2022, 25, 100686. [Google Scholar] [CrossRef] [Scilit]
- Wang, Z.; Lai, C.; Chen, X.; Yang, B.; Zhao, S.; Bai, X. Flood hazard risk assessment model based on random forest. J. Hydrol. 2015, 527, 1130–1141. [Google Scholar] [CrossRef] [Scilit]
- Ma, M.; Zhao, G.; He, B.; Li, Q.; Dong, H.; Wang, S.; Wang, Z. XGBoost-based method for flash flood risk assessment. J. Hydrol. 2021, 598, 126382. [Google Scholar] [CrossRef] [Scilit]
- Bao, S.; Yu, C.; Wan, Z. Spatial Mismatch and Attribution Analysis of Flood Risk and Resilience in Megacities: Insights from a “Risk-Resilience-Effect” Framework and an Interpretable XGBoost-SHAP Model. Sustain. Cities Soc. 2025, 131, 106758. [Google Scholar] [CrossRef] [Scilit]
- Ren, H.C.; Pang, B.; Bai, P.; Zhao, G.; Liu, S.; Liu, Y.Y.; Li, M. Flood Susceptibility Assessment with Random Sampling Strategy in Ensemble Learning (RF and XGBoost). Remote Sens. 2024, 16, 320. [Google Scholar] [CrossRef] [Scilit]
- Ahmad, I.; Farooq, R.; Ashraf, M.; Waseem, M.; Shangguan, D. Improving flood hazard susceptibility assessment by integrating hydrodynamic modeling with remote sensing and ensemble machine learning. Nat. Hazards 2025, 121, 7839–7868. [Google Scholar] [CrossRef] [Scilit]
- Wei, Q.; Zhang, H.; Chen, Y.; Xie, Y.; Yin, H.; Xu, Z. City scale urban flooding risk assessment using multi-source data and machine learning approach. J. Hydrol. 2025, 651, 132626. [Google Scholar] [CrossRef] [Scilit]
- Yan, M.; Yang, J.; Ni, X.; Liu, K.; Wang, Y.; Xu, F. Urban waterlogging susceptibility assessment based on hybrid ensemble machine learning models: A case study in the metropolitan area in Beijing, China. J. Hydrol. 2024, 630, 130695. [Google Scholar] [CrossRef] [Scilit]
- Zhang, Q.; Zhou, S.; Li, J.; Xu, Z. Waterlogging susceptibility assessment in developed urban area using explainable machine learning methods with different negative sampling strategies. Int. J. Disaster Risk Reduct. 2026, 132, 105978. [Google Scholar] [CrossRef] [Scilit]
- Rasool, U.; Yin, X.; Xu, Z.; Padulano, R.; Rasool, M.A.; Siddique, M.A.; Hassan, M.A.; Senapathi, V. Rainfall-driven machine learning models for accurate flood inundation mapping in Karachi, Pakistan. Urban Clim. 2023, 49, 101573. [Google Scholar] [CrossRef] [Scilit]
- Zhou, Z.; Smith, J.A.; Baeck, M.L.; Wright, D.B.; Smith, B.K.; Liu, S. The impact of the spatiotemporal structure of rainfall on flood frequency over a small urban watershed: An approach coupling stochastic storm transposition and hydrologic modeling. Hydrol. Earth Syst. Sci. 2021, 25, 4701–4717. [Google Scholar] [CrossRef] [Scilit]
- David, N.; Alpert, P.; Messer, H. The potential of cellular network infrastructures for sudden rainfall monitoring in dry climate regions. Atmos. Res. 2013, 131, 13–21. [Google Scholar] [CrossRef] [Scilit]
- Zhang, Z.; Jian, X.; Chen, Y.; Huang, Z.; Liu, J.; Yang, L. Urban waterlogging prediction and risk analysis based on rainfall time series features: A case study of Shenzhen. Front. Environ. Sci. 2023, 11, 1131954. [Google Scholar] [CrossRef] [Scilit]
- Bruni, G.; Reinoso, R.; van de Giesen, N.C.; Clemens, F.H.L.R.; ten Veldhuis, J.A.E. On the sensitivity of urban hydrodynamic modelling to rainfall spatial and temporal resolution. Hydrol. Earth Syst. Sci. 2015, 19, 691–709. [Google Scholar] [CrossRef] [Scilit]
- Cristiano, E.; ten Veldhuis, M.-c.; Wright, D.B.; Smith, J.A.; van de Giesen, N. The Influence of Rainfall and Catchment Critical Scales on Urban Hydrological Response Sensitivity. Water Resour. Res. 2019, 55, 3375–3390. [Google Scholar] [CrossRef] [Scilit]
- Zhou, Z.; Liu, S.; Sun, L.; Liu, Y. Unraveling nonlinear urban waterlogging responses to rainfall structure: A data-driven analysis in a highly urbanized megacity. J. Hydrol. 2026, 664, 134349. [Google Scholar] [CrossRef] [Scilit]
- Zhang, Q.; Wu, Z.; Guo, G.; Zhang, H.; Tarolli, P. Explicit the urban waterlogging spatial variation and its driving factors: The stepwise cluster analysis model and hierarchical partitioning analysis approach. Sci. Total Environ. 2021, 763, 143041. [Google Scholar] [CrossRef] [Scilit] [PubMed]
- Qi, X.; Zhang, Z.; Jing, J.; Hu, W.; Zhao, X. Regional planning for ecological protection of rivers in highly urbanized areas. Ecol. Indic. 2023, 149, 110158. [Google Scholar] [CrossRef] [Scilit]
- Zhang, W.; Hu, B.; Liu, Y.; Zhang, X.; Li, Z. Urban Flood Risk Assessment through the Integration of Natural and Human Resilience Based on Machine Learning Models. Remote Sens. 2023, 15, 3678. [Google Scholar] [CrossRef] [Scilit]
- Asrade, T.M.; Abebe, S.A.; Tadesse, K.B.; Kerebih, M.S.; Meshesha, T.M. Flood susceptibility assessment using three machine learning techniques and comparison of their performance. Sci. Rep. 2026, 16, 8099. [Google Scholar] [CrossRef] [Scilit]
- Wang, Y.; Zhang, Q.; Zhang, J.; Lin, K. Impact of 2D and 3D factors on urban flooding: Spatial characteristics and interpretable analysis of drivers. Water Res. 2025, 280, 123537. [Google Scholar] [CrossRef] [Scilit]
- Lin, J.; He, X.; Lu, S.; Liu, D.; He, P. Investigating the influence of three-dimensional building configuration on urban pluvial flooding using random forest algorithm. Environ. Res. 2021, 196, 110438. [Google Scholar] [CrossRef] [Scilit]
- Zhang, W.; Qiu, S.; Lin, Z.; Chen, Z.; Yang, Y.; Lin, J.; Li, S. Assessing the influence of green space morphological spatial pattern on urban waterlogging: A case study of a highly-urbanized city. Environ. Res. 2024, 266, 120561. [Google Scholar] [CrossRef] [Scilit] [PubMed]
- Gu, T.; Zhao, H.; Yue, L.; Guo, J.; Cui, Q.; Tang, J.; Gong, Z.; Zhao, P. Attribution analysis of urban social resilience differences under rainstorm disaster impact: Insights from interpretable spatial machine learning framework. Sustain. Cities Soc. 2025, 118, 106029. [Google Scholar] [CrossRef] [Scilit]
- Rudin, C. Stop explaining black box machine learning models for high stakes decisions and use interpretable models instead. Nat. Mach. Intell. 2019, 1, 206–215. [Google Scholar] [CrossRef] [Scilit]
- Li, Z. Extracting spatial effects from machine learning model using local interpretation method: An example of SHAP and XGBoost. Comput. Environ. Urban Syst. 2022, 96, 101845. [Google Scholar] [CrossRef] [Scilit]
- Lundberg, S.M.; Lee, S.-I. A Unified Approach to Interpreting Model Predictions. Adv. Neural Inf. Process. Syst. 2017, 30, 4765–4774. [Google Scholar] [CrossRef] [Scilit]
- Lundberg, S.M.; Erion, G.; Chen, H.; DeGrave, A.; Prutkin, J.M.; Nair, B.; Katz, R.; Himmelfarb, J.; Bansal, N.; Lee, S.-I. From local explanations to global understanding with explainable AI for trees. Nat. Mach. Intell. 2020, 2, 56–67. [Google Scholar] [CrossRef] [Scilit] [PubMed]
- Friedman, J.H. Greedy function approximation: A gradient boosting machine. Ann. Stat. 2001, 29, 1189–1232. [Google Scholar] [CrossRef] [Scilit]
- Goldstein, A.; Kapelner, A.; Bleich, J.; Pitkin, E. Peeking Inside the Black Box: Visualizing Statistical Learning with Plots of Individual Conditional Expectation. J. Comput. Graph. Stat. 2015, 24, 44–65. [Google Scholar] [CrossRef] [Scilit]
- Gulshad, K.; Yaseen, A.; Szydłowski, M. From Data to Decision: Interpretable Machine Learning for Predicting Flood Susceptibility in Gdańsk, Poland. Remote Sens. 2024, 16, 3902. [Google Scholar] [CrossRef] [Scilit]
- Aydin, H.E.; Iban, M.C. Predicting and analyzing flood susceptibility using boosting-based ensemble machine learning algorithms with SHapley Additive exPlanations. Nat. Hazards 2023, 116, 2957–2991. [Google Scholar] [CrossRef] [Scilit]
- Lu, J.; Jiao, S.; Guo, Q.; Zhu, X. An explainable artificial intelligence approach for synergistic flood risk governance by decoupling hydrological process and spatial heterogeneity. J. Hydrol. 2026, 669, 135136. [Google Scholar] [CrossRef] [Scilit]
- Tan, C.; Ke, E.; Shi, H. Leveraging Explainable Artificial Intelligence for Place-Based and Quantitative Strategies in Urban Pluvial Flooding Management. ISPRS Int. J. Geo Inf. 2025, 14, 475. [Google Scholar] [CrossRef] [Scilit]
- Li, S.; Ge, X.; Jin, G.; Lou, Z.; Yang, H. Flood dynamic monitoring and XGBoost-SHAP based risk assessment: A case study of the 23·7 extreme rainstorm in BTH region, China. Environ. Sustain. Indic. 2025, 28, 101020. [Google Scholar] [CrossRef] [Scilit]
- Zhou, S.; Zhang, D.; Wang, M.; Liu, Z.; Gan, W.; Zhao, Z.; Xue, S.; Müller, B.; Zhou, M.; Ni, X.; et al. Risk-driven composition decoupling analysis for urban flooding prediction in high-density urban areas using Bayesian-Optimized LightGBM. J. Clean. Prod. 2024, 457, 142286. [Google Scholar] [CrossRef] [Scilit]
- Pradhan, B.; Lee, S.; Dikshit, A.; Kim, H. Spatial flood susceptibility mapping using an explainable artificial intelligence (XAI) model. Geosci. Front. 2023, 14, 101625. [Google Scholar] [CrossRef] [Scilit]
- Zhou, S.; Jia, W.; Wang, M.; Liu, Z.; Wang, Y.; Wu, Z. Synergistic assessment of multi-scenario urban waterlogging through data-driven decoupling analysis in high-density urban areas: A case study in Shenzhen, China. J. Environ. Manag. 2024, 369, 122330. [Google Scholar] [CrossRef] [Scilit]
- Deng, Y.; Lu, X. Explainable Machine Learning-Based Urban Waterlogging Prediction Framework. Urban Sci. 2026, 10, 156. [Google Scholar] [CrossRef] [Scilit]
- Wang, M.; Li, Y.; Yuan, H.; Zhou, S.; Wang, Y.; Adnan Ikram, R.M.; Li, J. An XGBoost-SHAP approach to quantifying morphological impact on urban flooding susceptibility. Ecol. Indic. 2023, 156, 111137. [Google Scholar] [CrossRef] [Scilit]
- Bruwier, M.; Maravat, C.; Mustafa, A.; Teller, J.; Pirotton, M.; Erpicum, S.; Archambeau, P.; Dewals, B. Influence of urban forms on surface flow in urban pluvial flooding. J. Hydrol. 2020, 582, 124493. [Google Scholar] [CrossRef] [Scilit]
- Hair, J.F. Multivariate Data Analysis: An Overview. In International Encyclopedia of Statistical Science; Lovric, M., Ed.; Springer: Berlin/Heidelberg, Germany, 2011; pp. 904–907. [Google Scholar]
- Cortes, C.; Vapnik, V. Support-vector networks. Mach. Learn. 1995, 20, 273–297. [Google Scholar] [CrossRef] [Scilit]
- Chen, T.; Guestrin, C. XGBoost: A Scalable Tree Boosting System. In Proceedings of the 22nd ACM SIGKDD International Conference on Knowledge Discovery and Data Mining, San Francisco, CA, USA, 13–17 August 2016; Association for Computing Machinery: New York, NY, USA, 2016; pp. 785–794. [Google Scholar]
- Wu, Y.; Zhang, Z.; Qi, X.; Hu, W.; Si, S. Prediction of flood sensitivity based on Logistic Regression, eXtreme Gradient Boosting, and Random Forest modeling methods. Water Sci. Technol. 2024, 89, 2605–2624. [Google Scholar] [CrossRef] [Scilit]
- Fu, X.; Wang, M.; Zhang, D.; Chen, F.; Peng, X.; Wang, L.; Tan, S.K. An XGBoost-SHAP framework for identifying key drivers of urban flooding and developing targeted mitigation strategies. Ecol. Indic. 2025, 175, 113579. [Google Scholar] [CrossRef] [Scilit]
- Li, Y.; Fang, Z.; Liu, J.; Lu, Z.; Zhou, H.; Yin, W.; Chen, X. A Comparative Study of Urban Pluvial Flood Susceptibility Assessment Based on Multi-Machine Learning Algorithm. Water Resour. Manag. 2025, 40, 35. [Google Scholar] [CrossRef] [Scilit]
- Liu, F.; Liu, X.; Xu, T.; Yang, G.; Zhao, Y. Driving Factors and Risk Assessment of Rainstorm Waterlogging in Urban Agglomeration Areas: A Case Study of the Guangdong-Hong Kong-Macao Greater Bay Area, China. Water 2021, 13, 770. [Google Scholar] [CrossRef] [Scilit]
- Zhou, S.; Liu, Z.; Wang, M.; Gan, W.; Zhao, Z.; Wu, Z. Impacts of building configurations on urban stormwater management at a block scale using XGBoost. Sustain. Cities Soc. 2022, 87, 104235. [Google Scholar] [CrossRef] [Scilit]
- Zhang, Q.; Wu, Z.; Cao, Z.; Guo, G.; Zhang, H.; Li, C.; Tarolli, P. How to develop site-specific waterlogging mitigation strategies? Understanding the spatial heterogeneous driving forces of urban waterlogging. J. Clean. Prod. 2023, 422, 138595. [Google Scholar] [CrossRef] [Scilit]
- Yuan, H.; Wang, M.; Zhang, D.; Muhammad Adnan Ikram, R.; Su, J.; Zhou, S.; Wang, Y.; Li, J.; Zhang, Q. Data-driven urban configuration optimization: An XGBoost-based approach for mitigating flood susceptibility and enhancing economic contribution. Ecol. Indic. 2024, 166, 112247. [Google Scholar] [CrossRef] [Scilit]
- Ibebuchi, C.C. Equity-focused flood risk assessment in Maryland using a hybrid explainable machine learning framework with FEMA and USGS data. Nat. Hazards 2026, 122, 106. [Google Scholar] [CrossRef] [Scilit]
- Wu, Z.; Lin, J.; Li, S.; Zhang, X. Urban Waterlogging Risk Prediction Considering the Influence of Land Use Patterns: A Case Study of Shenzhen. Trans. GIS 2026, 30, e70252. [Google Scholar] [CrossRef] [Scilit]
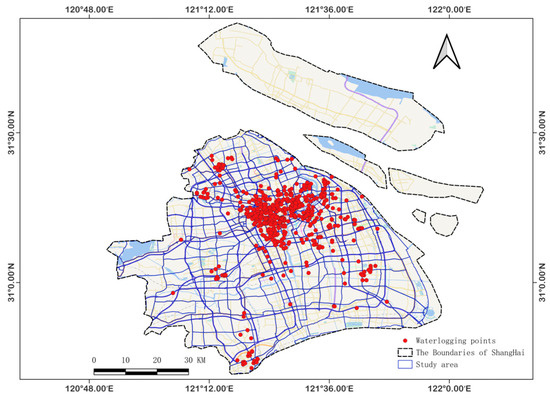
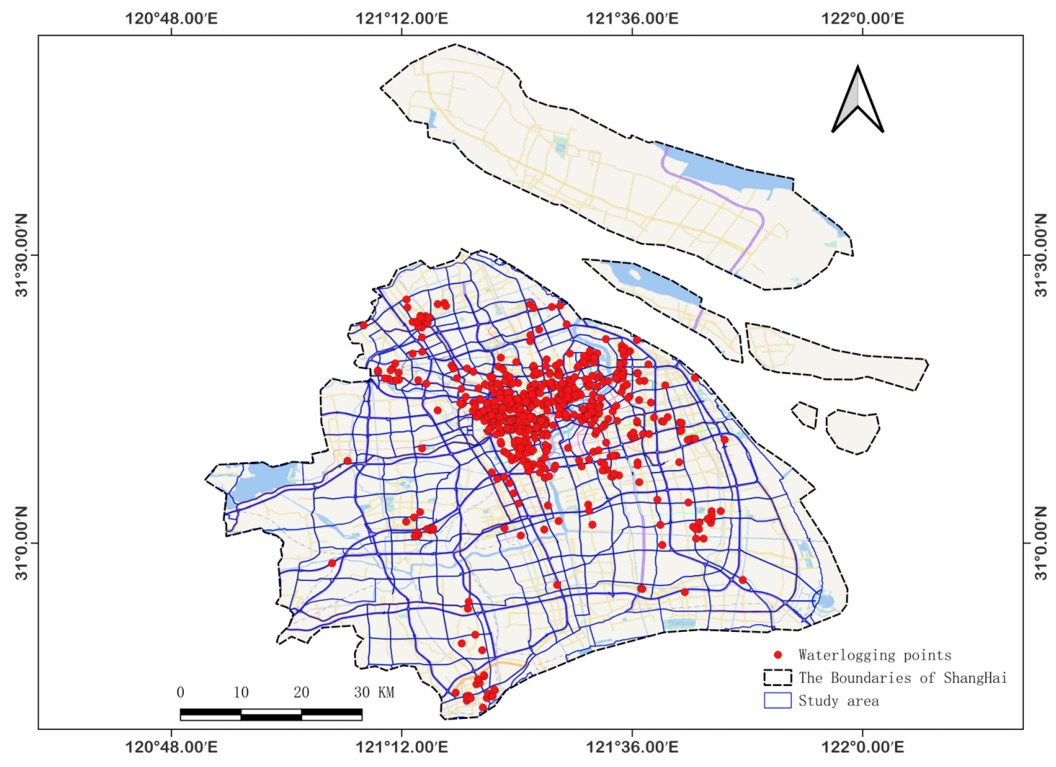
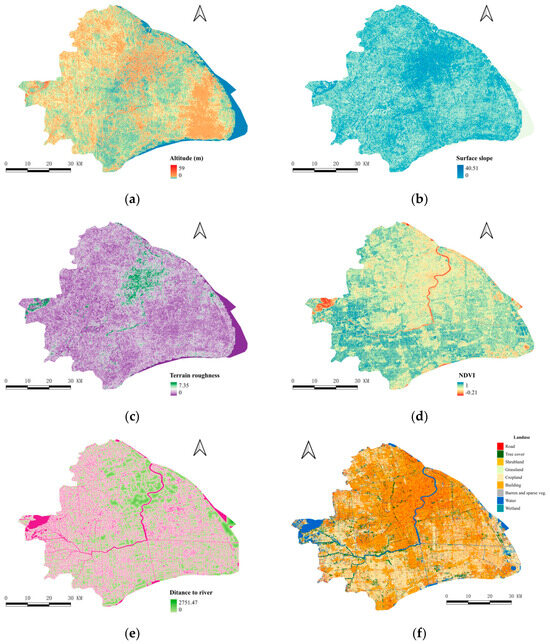
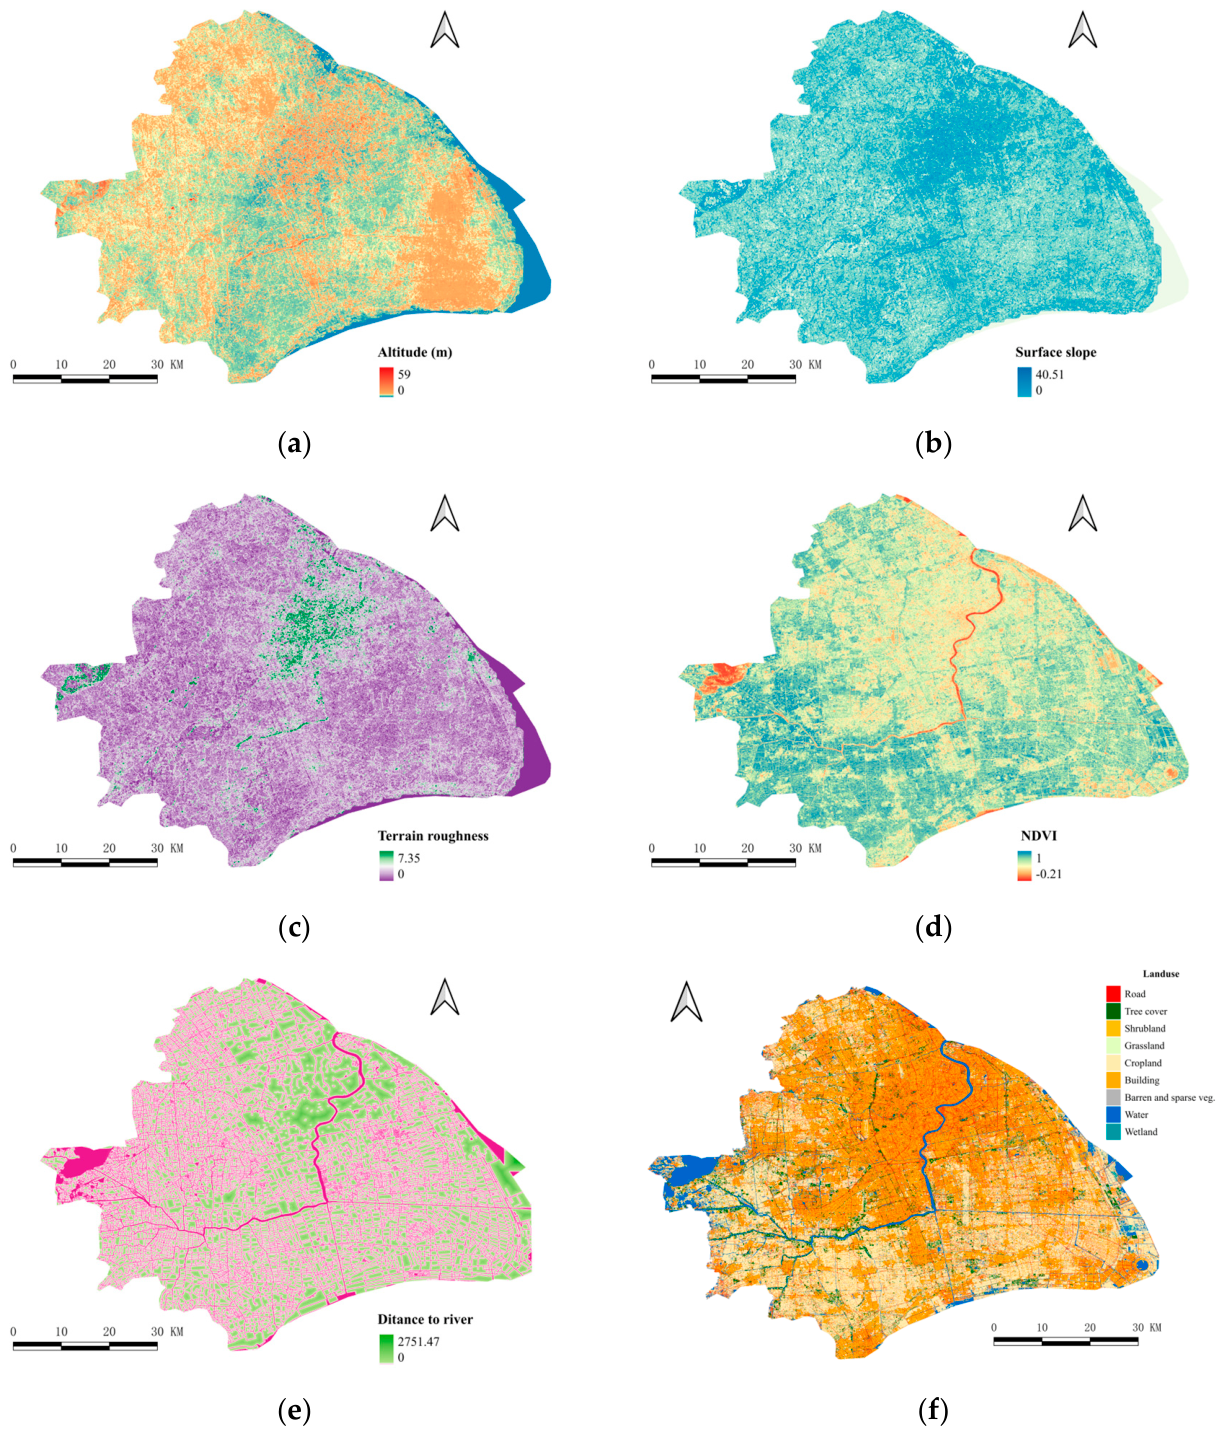
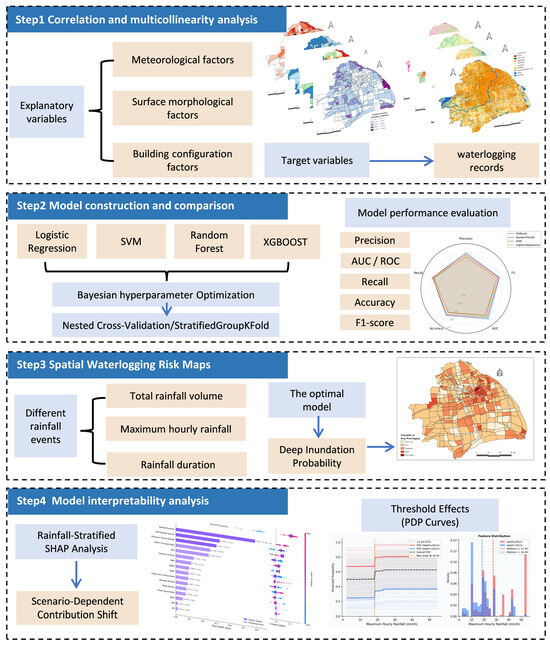
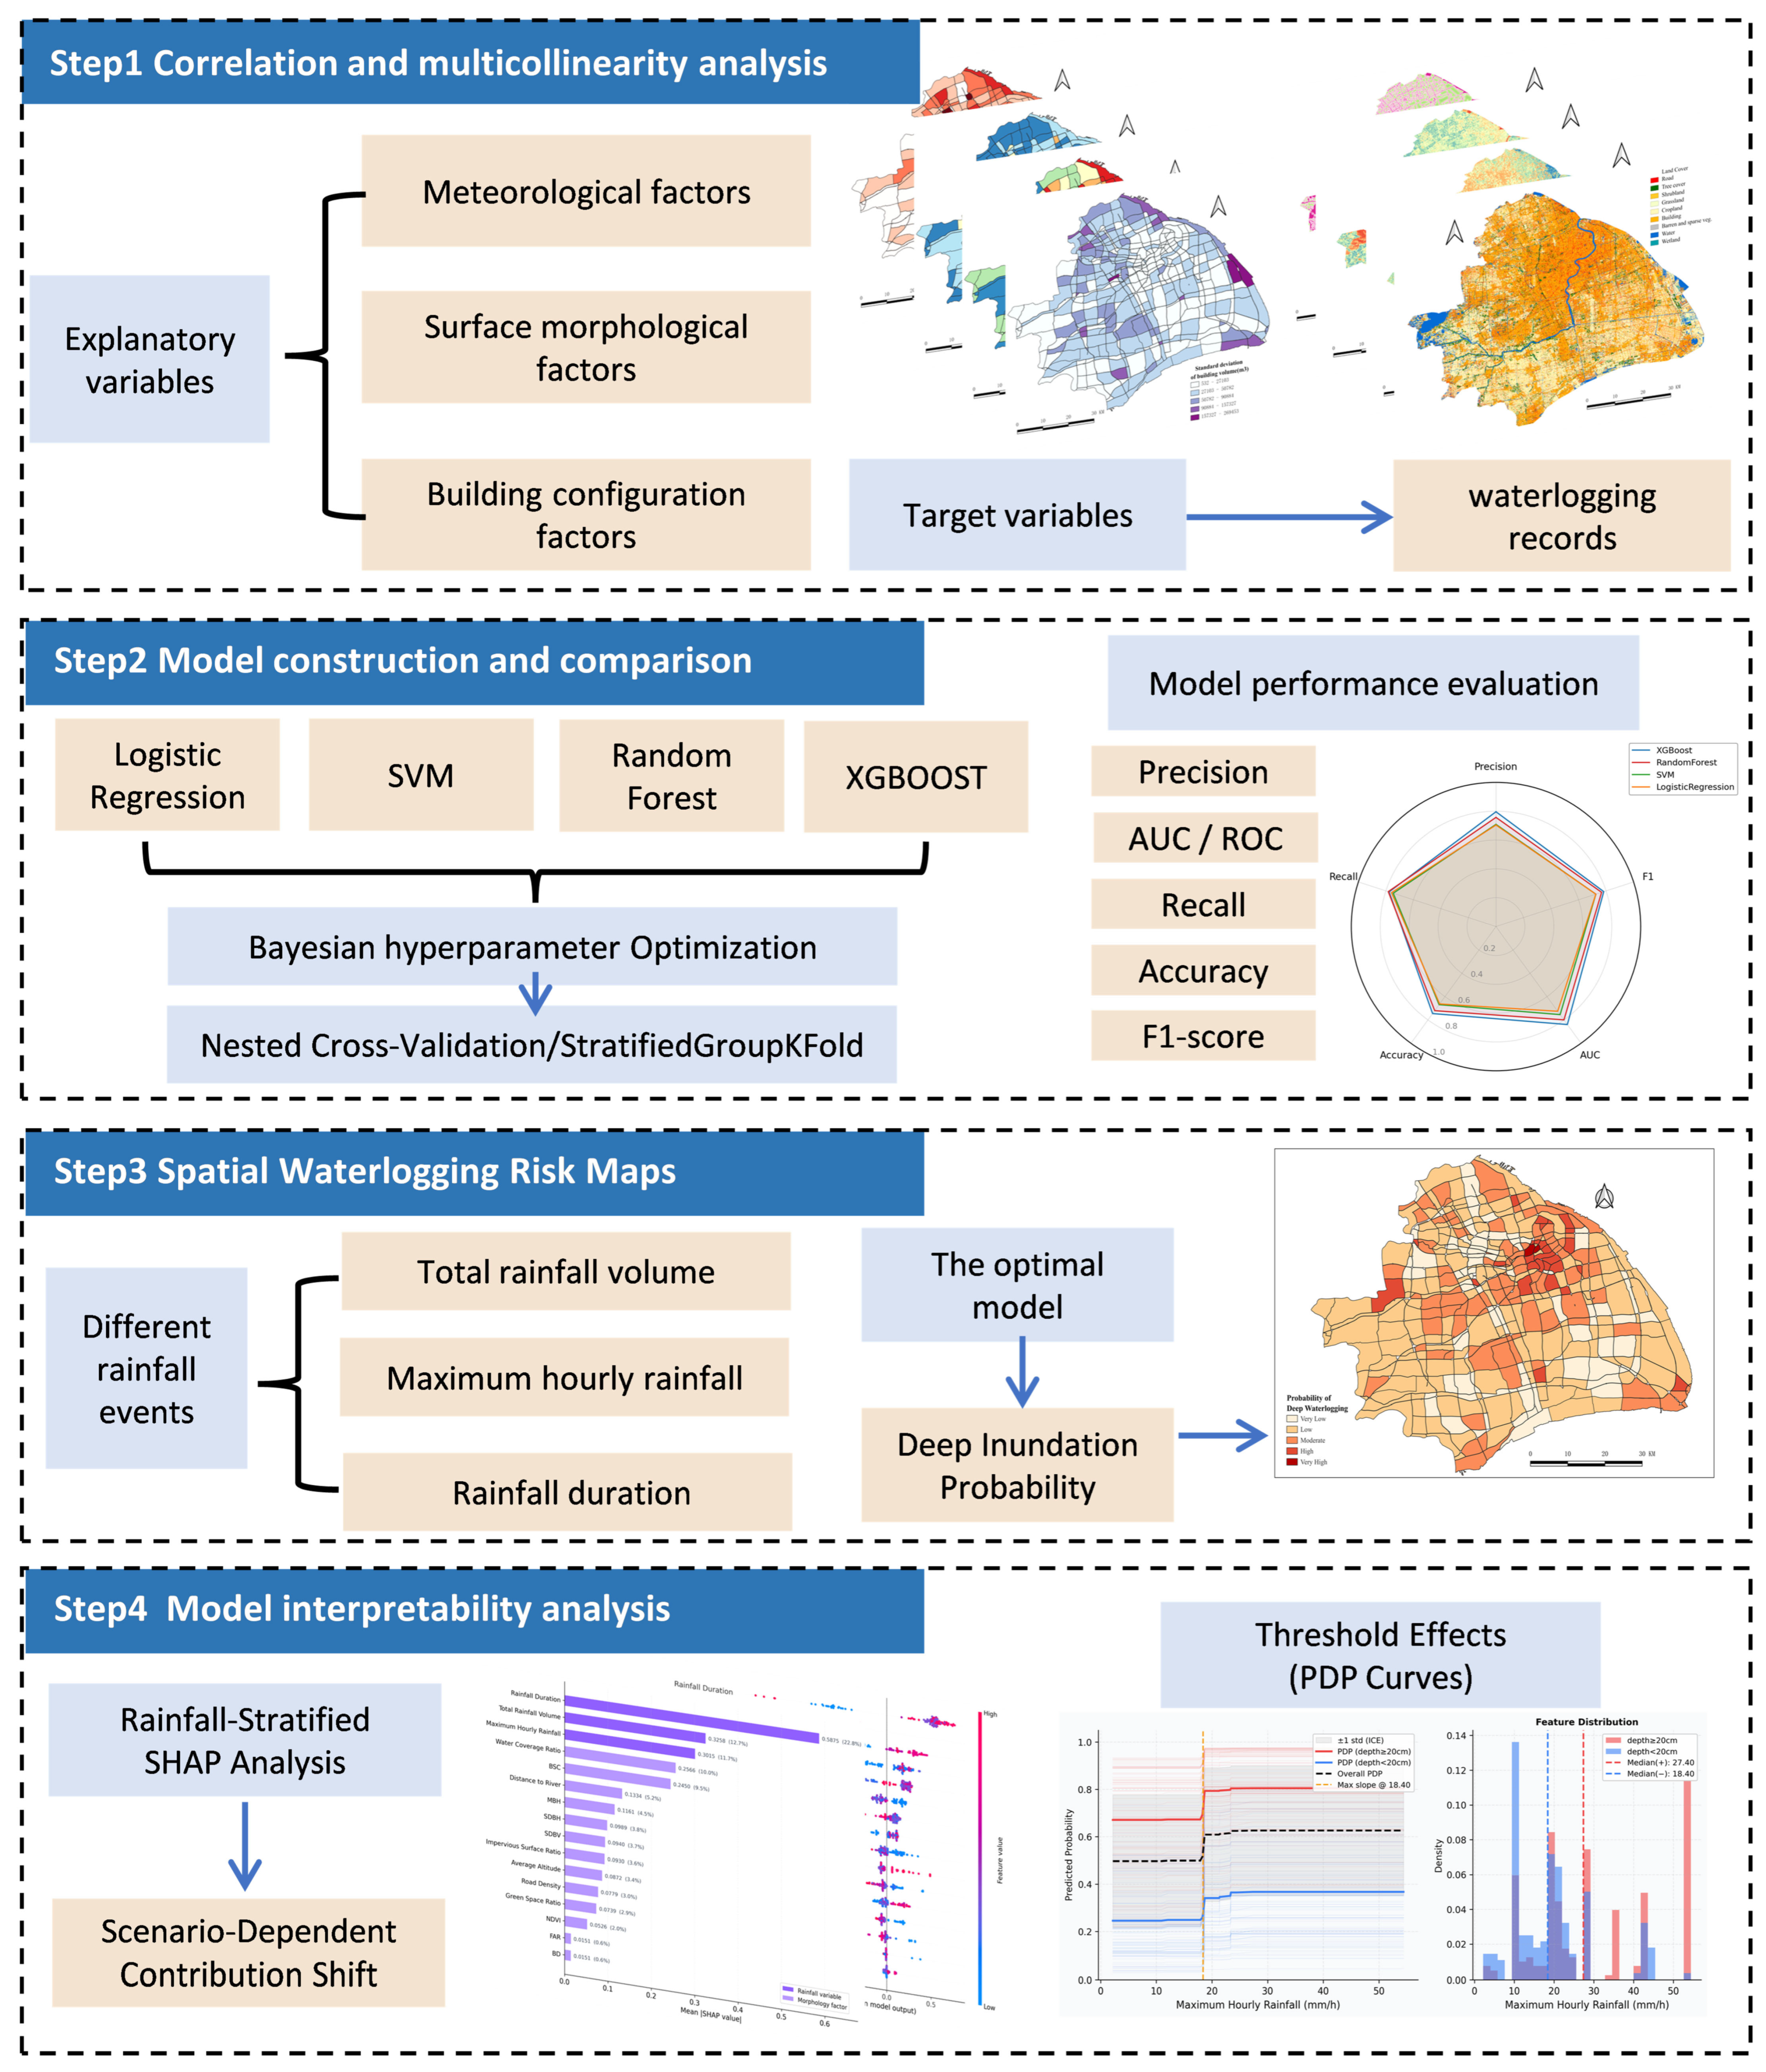
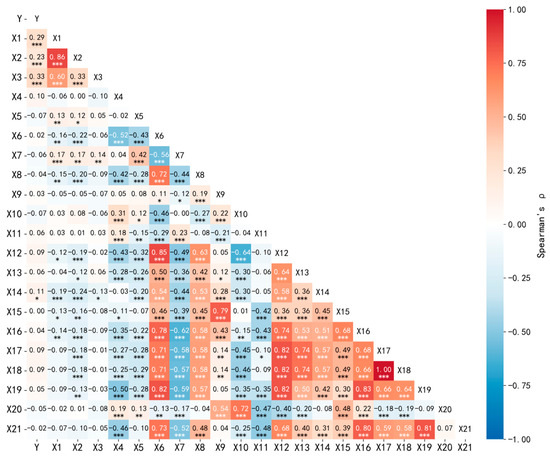
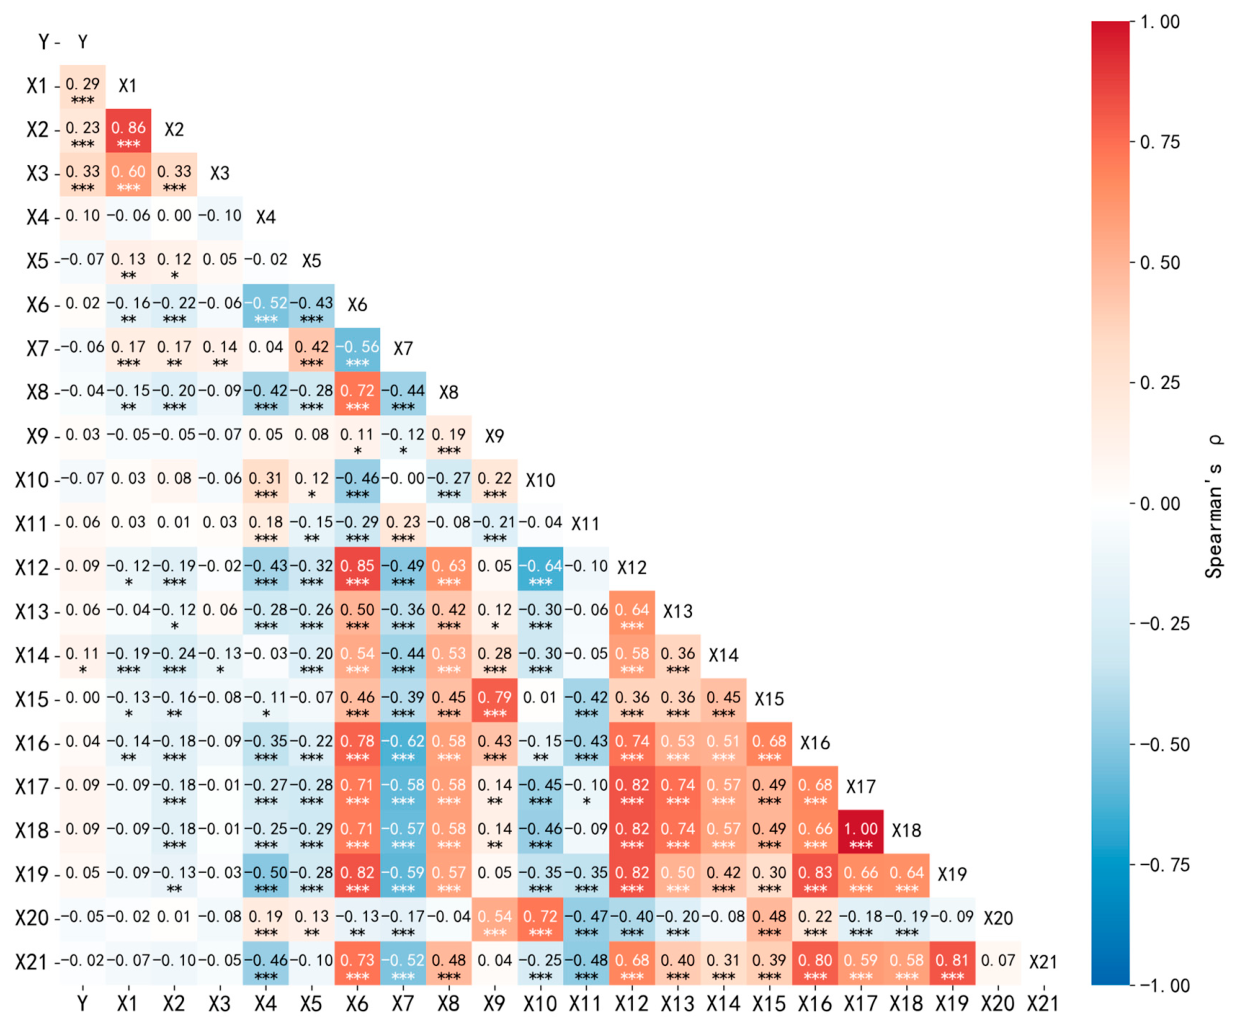
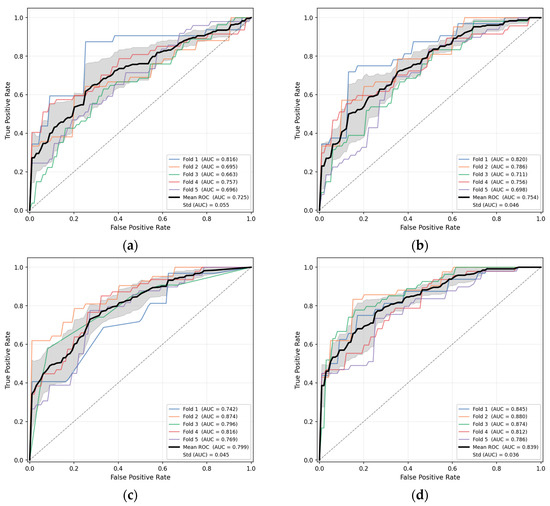
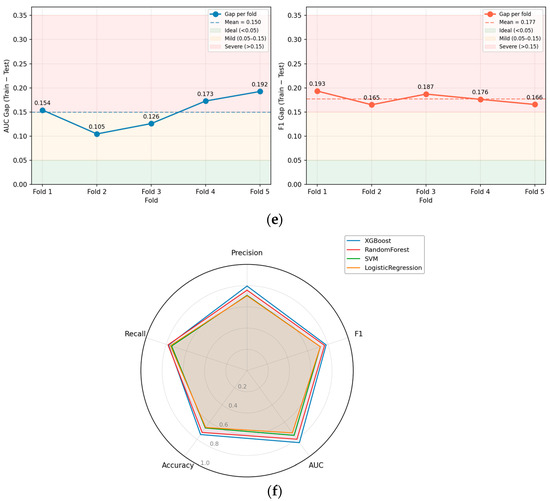
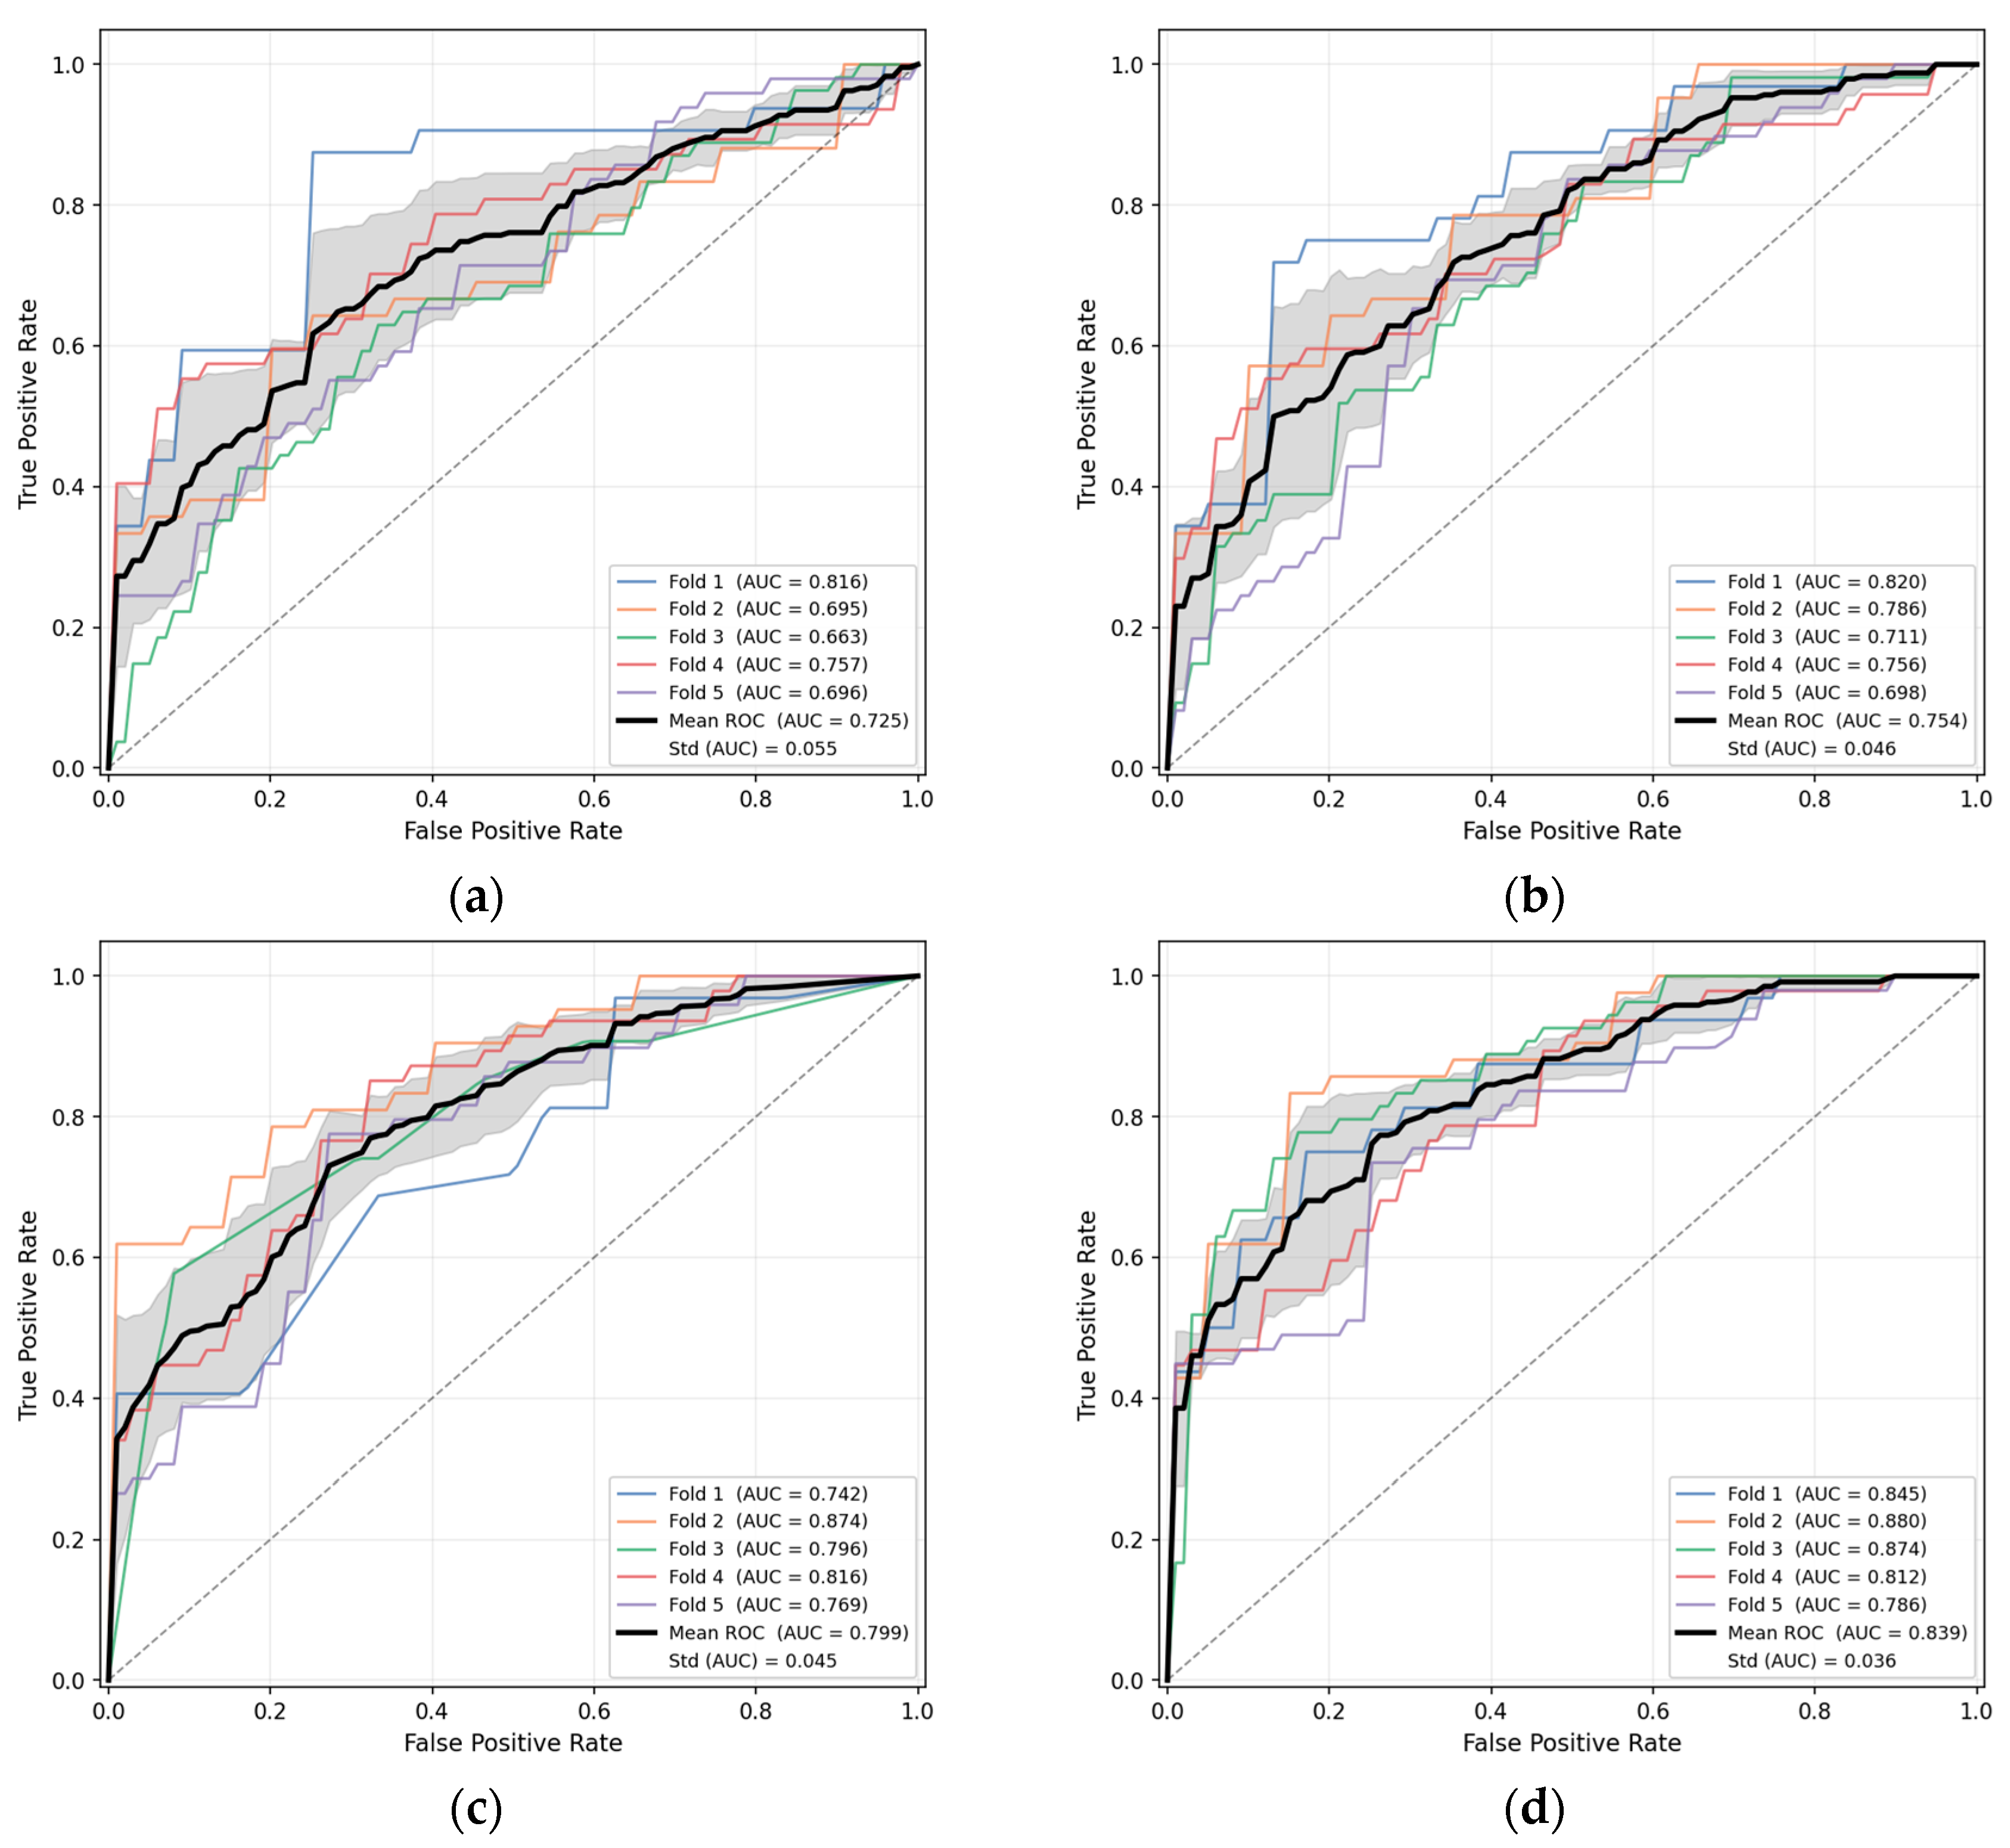
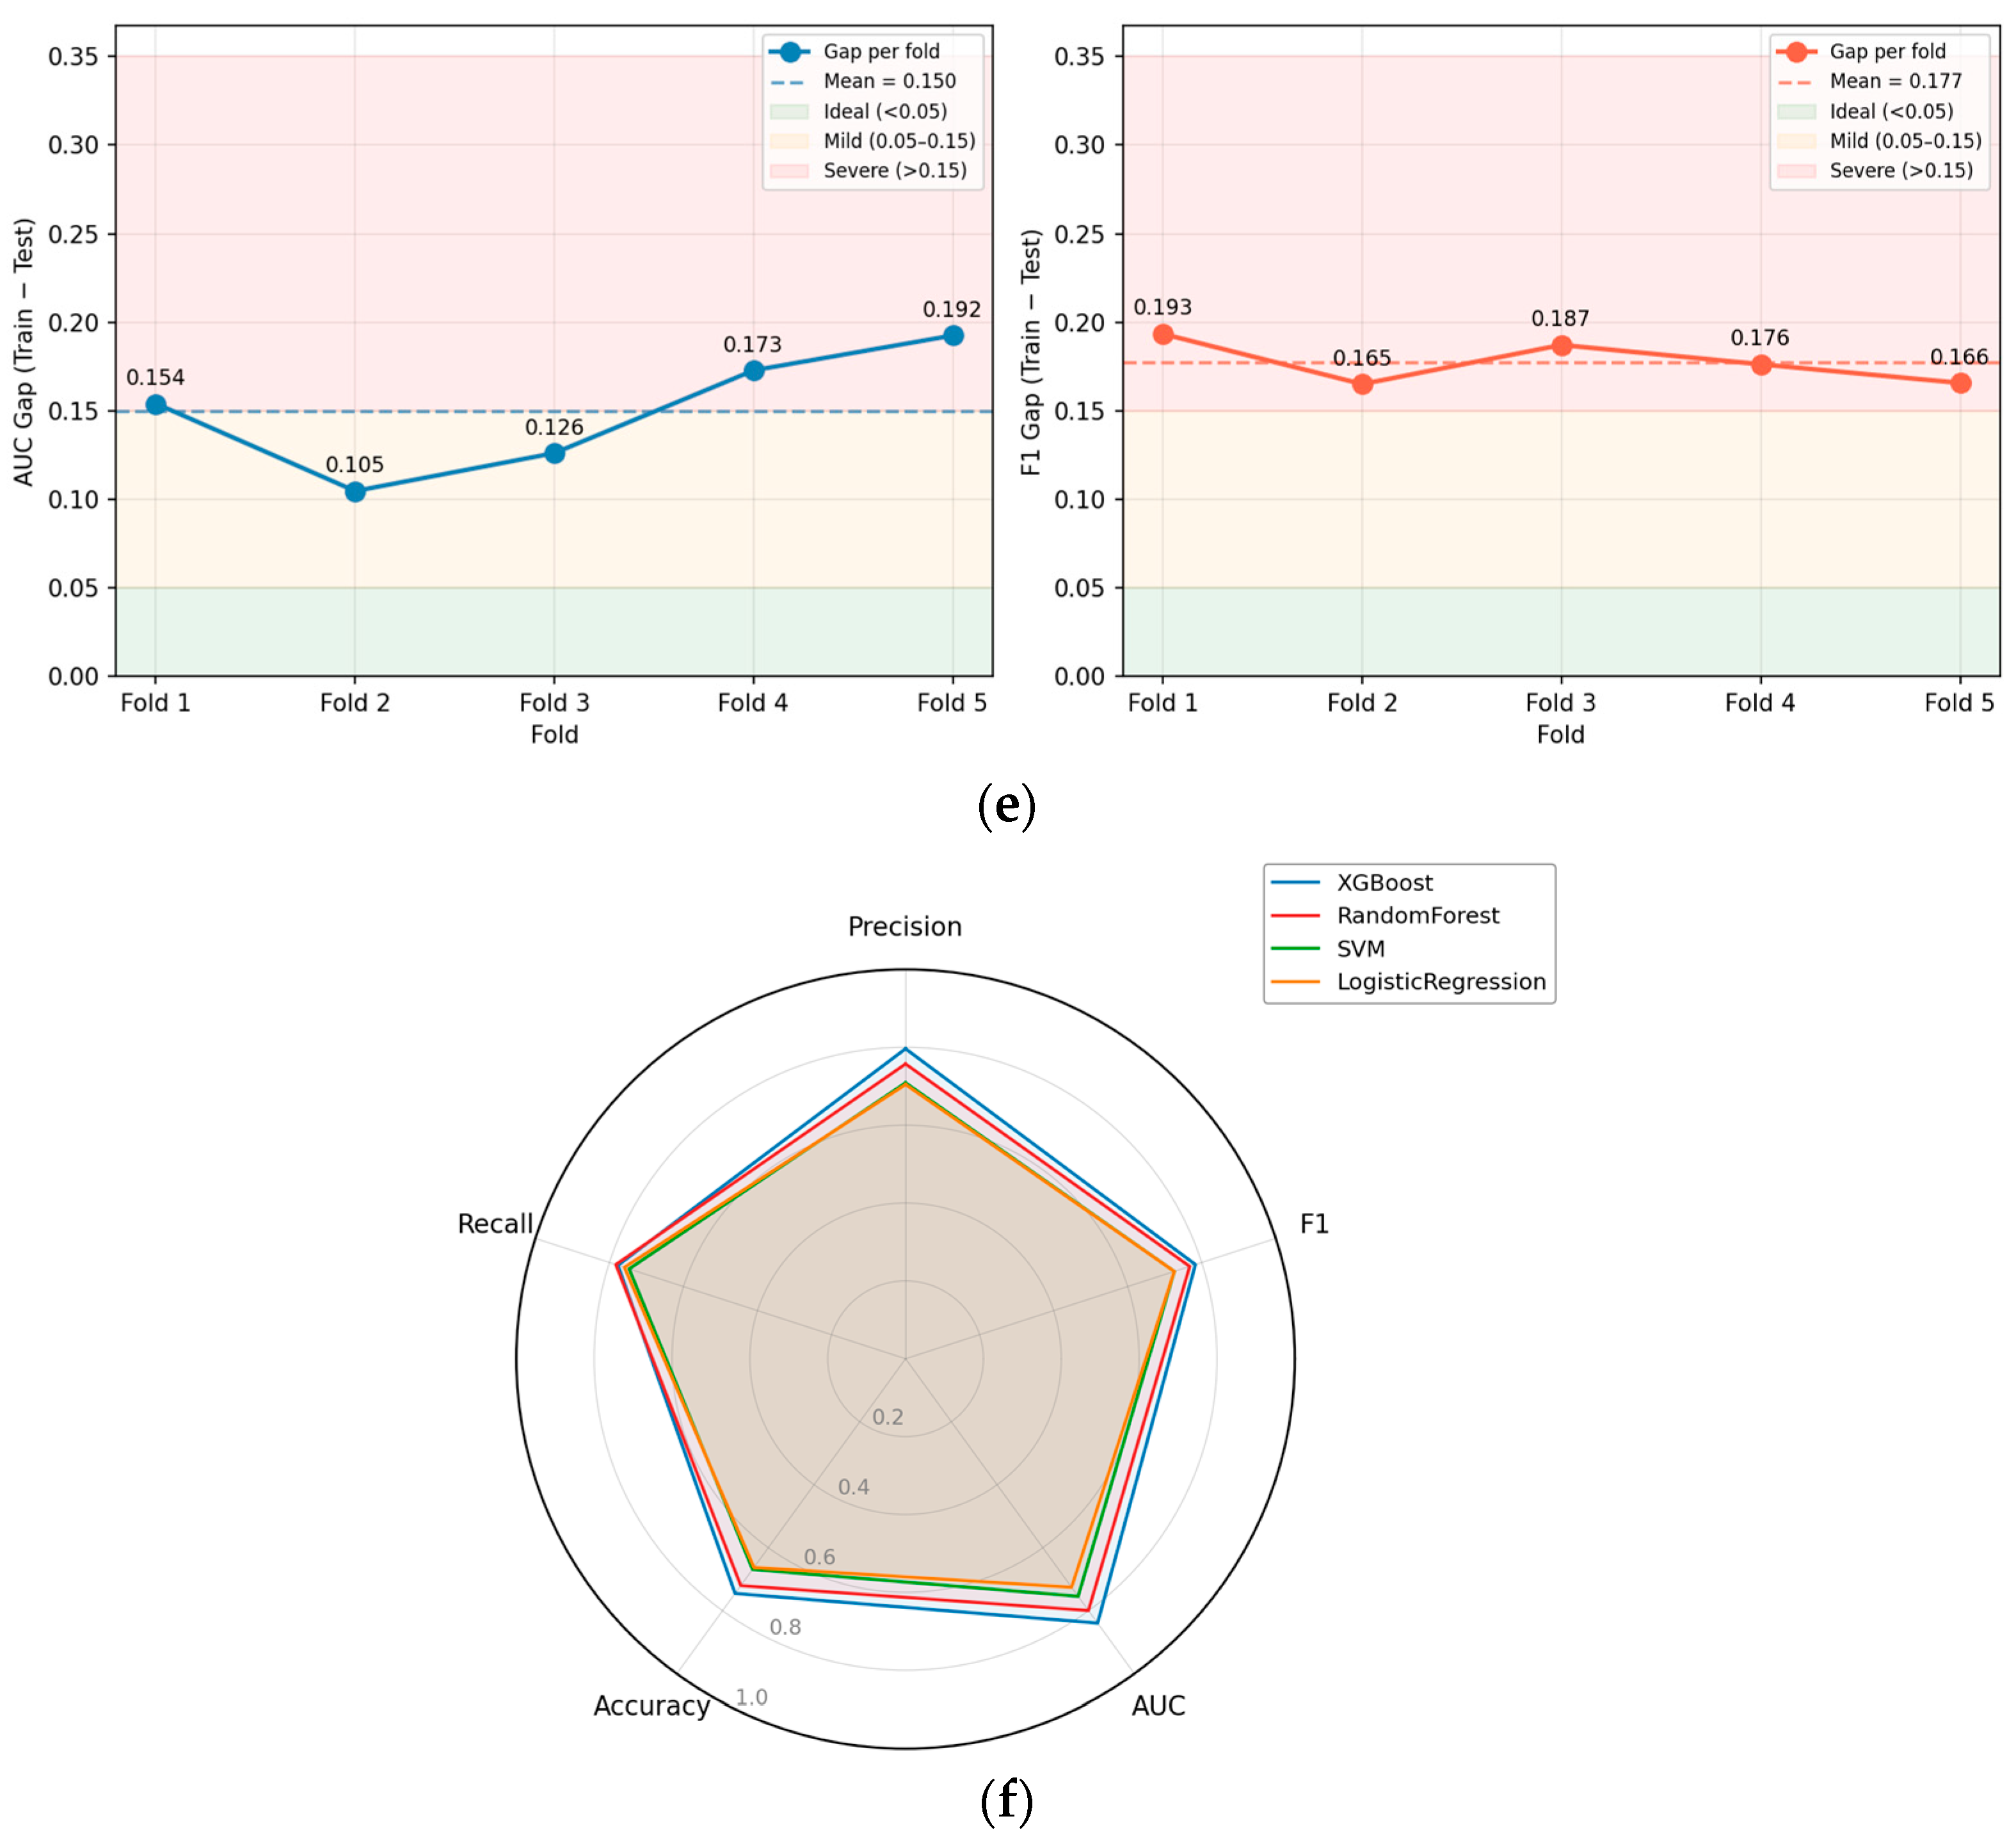
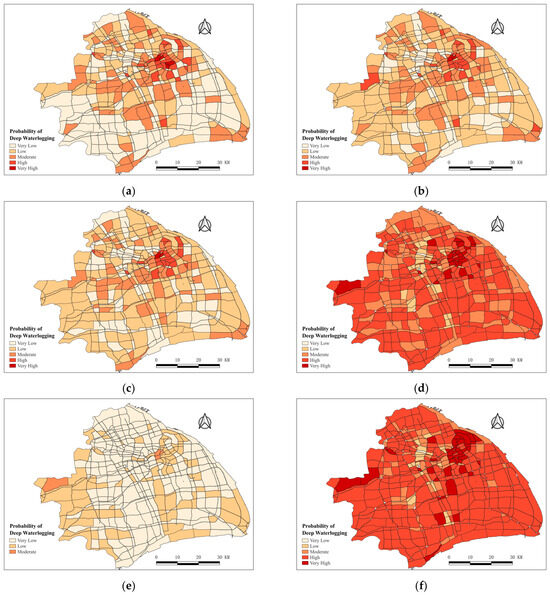
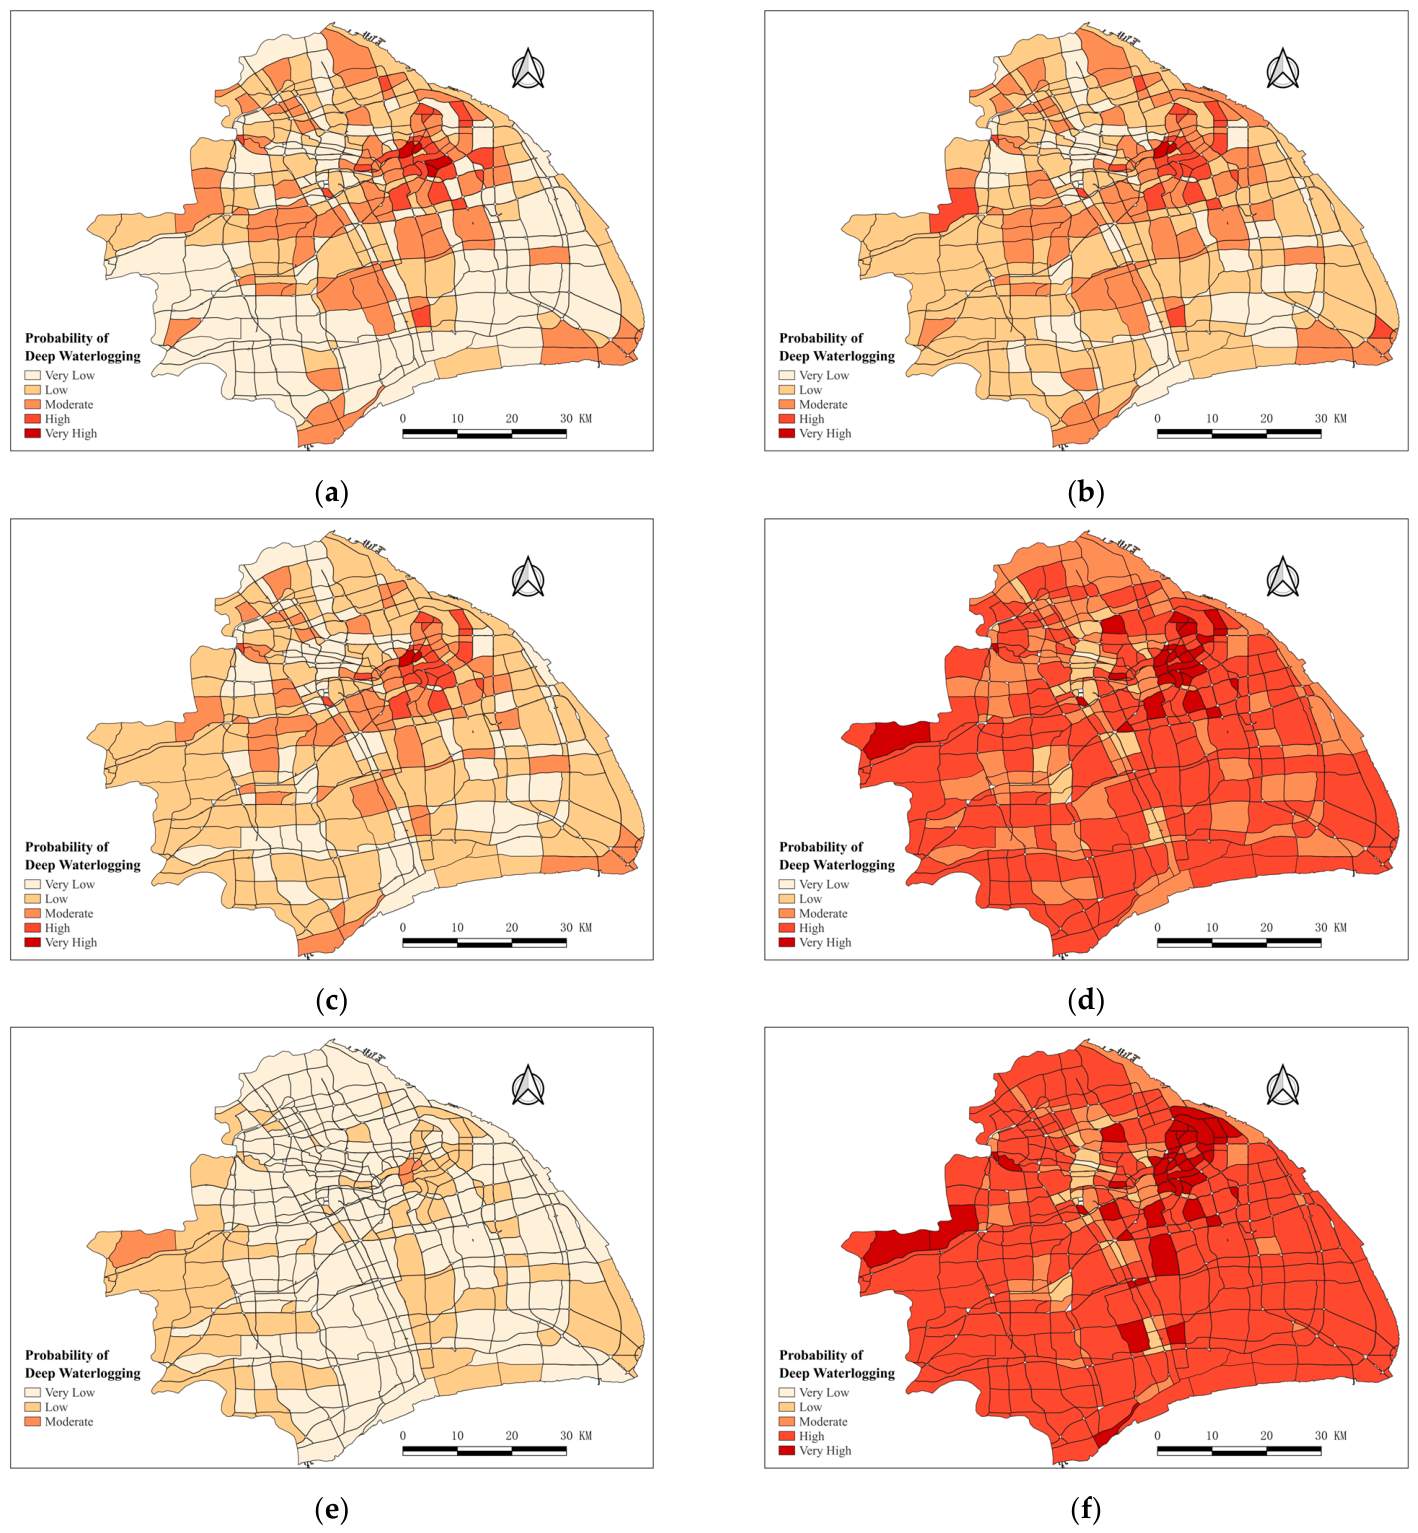
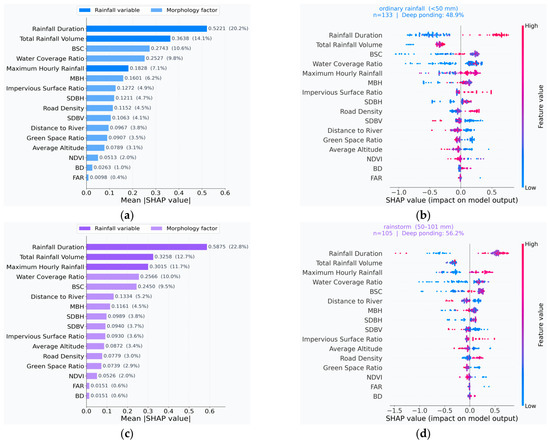
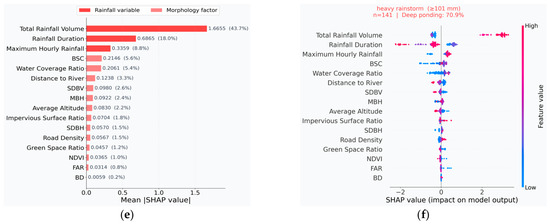
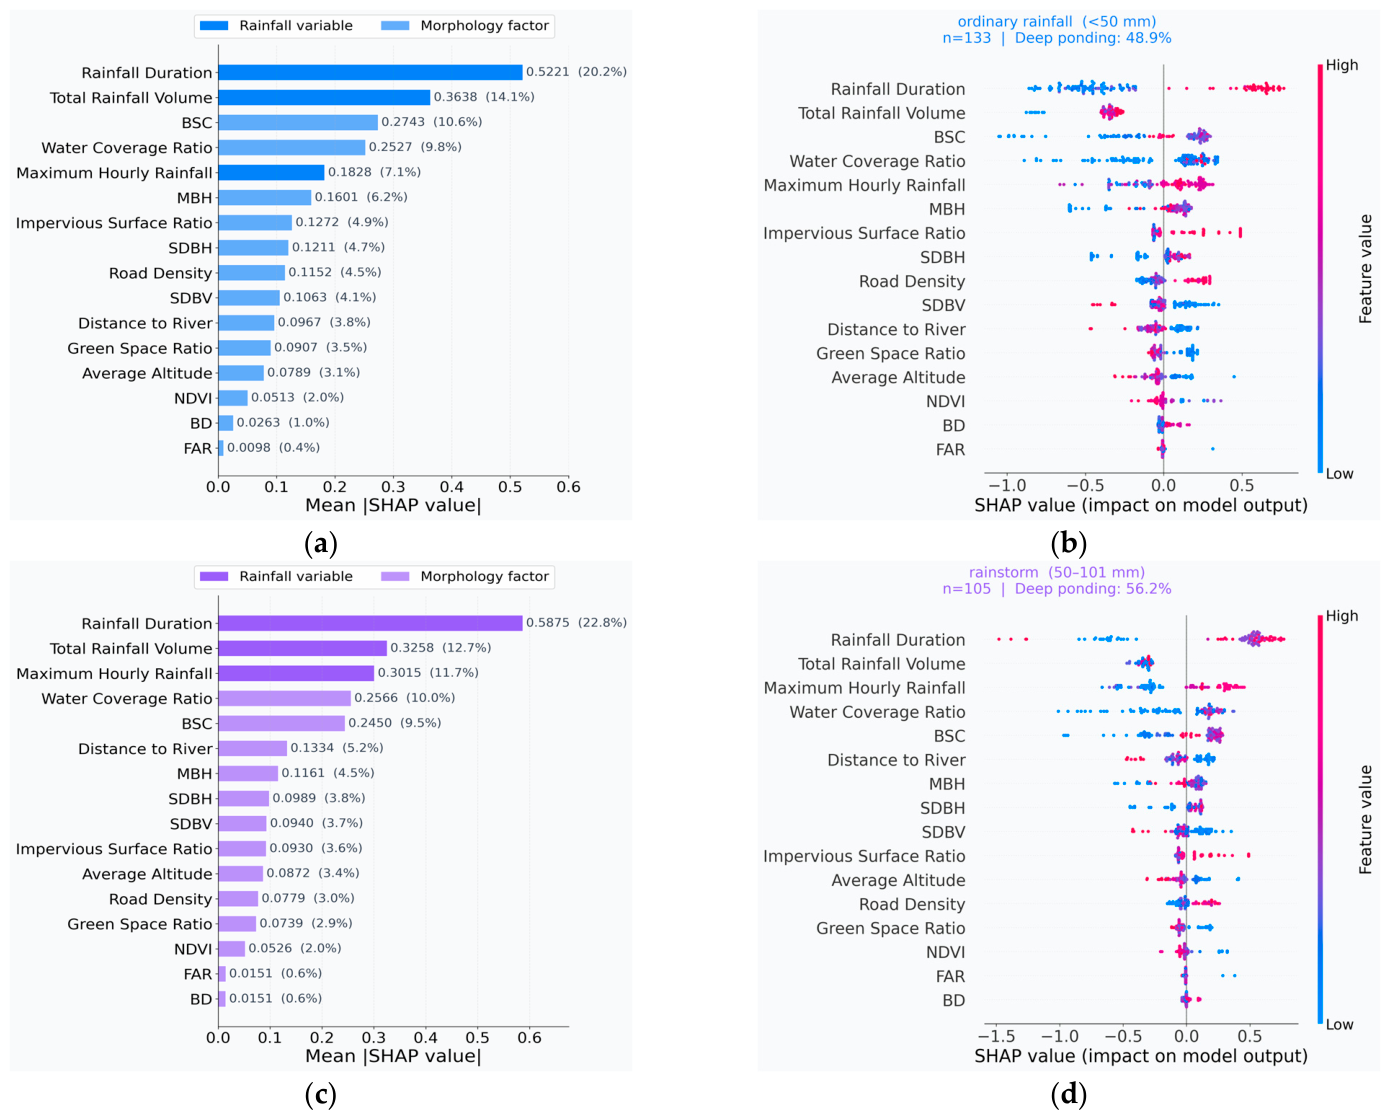
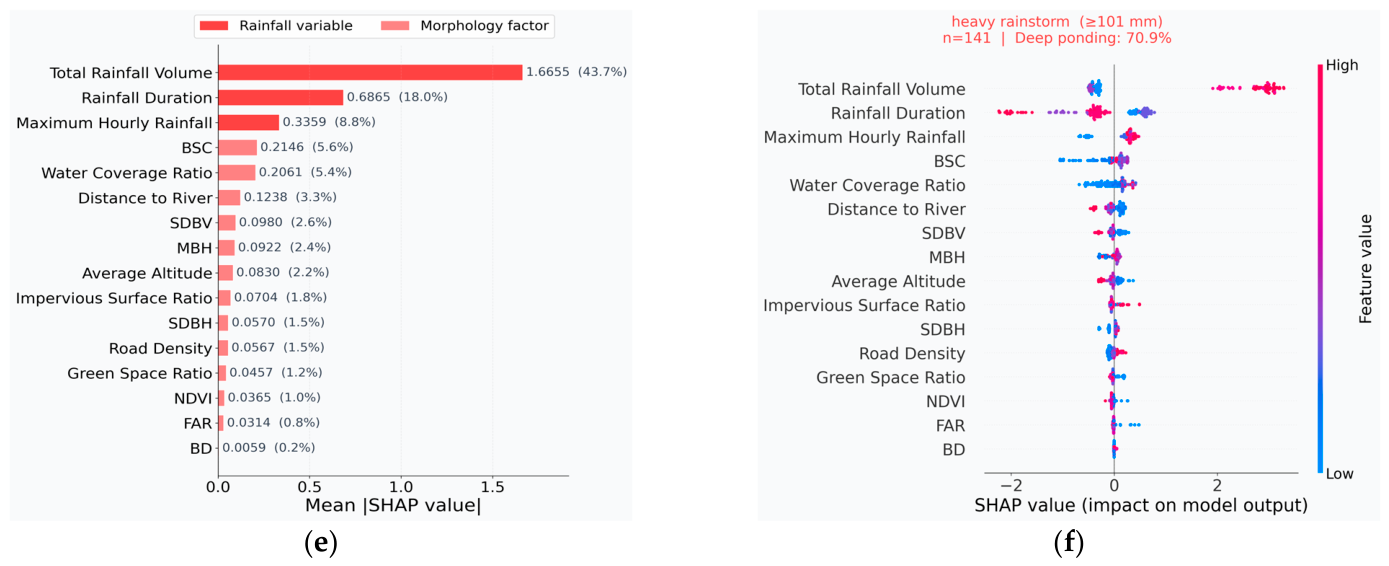
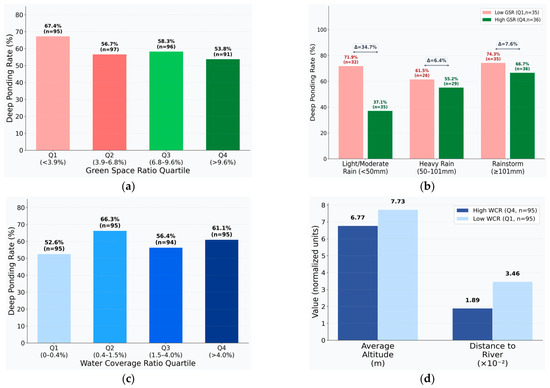
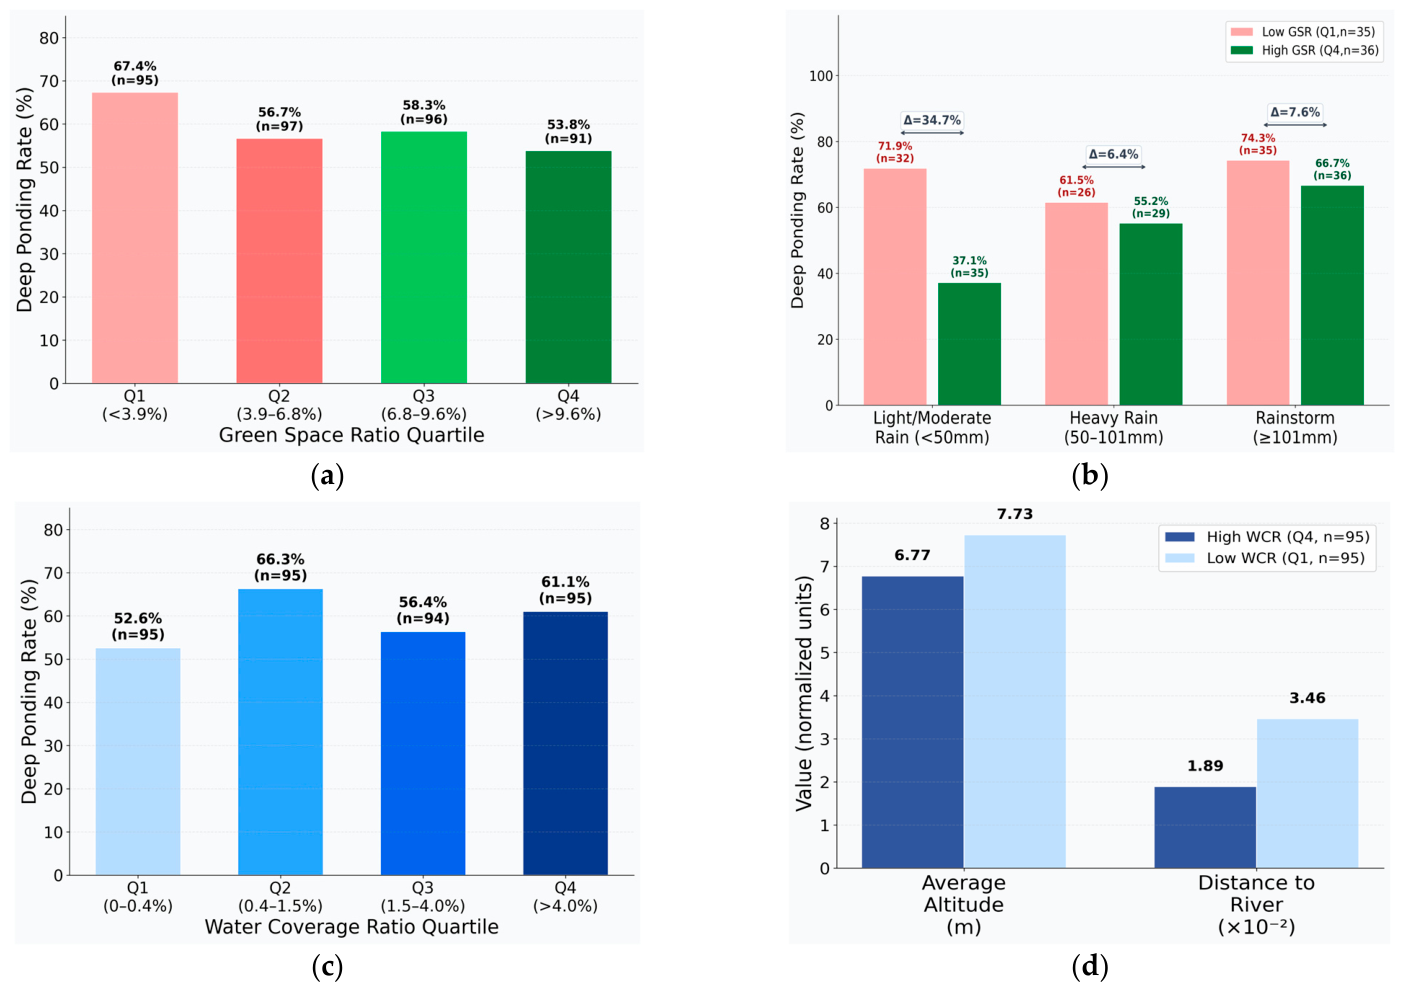
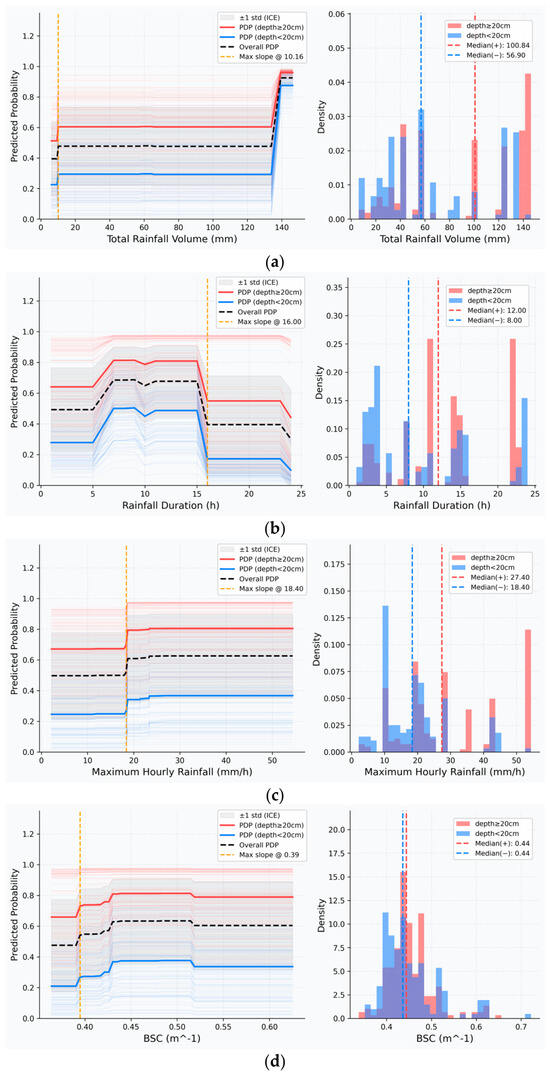
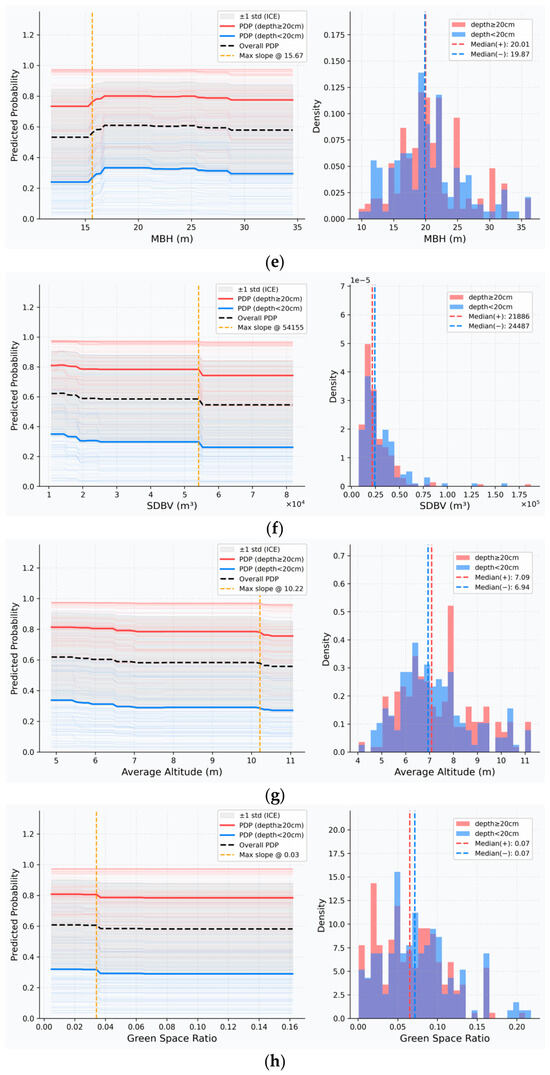
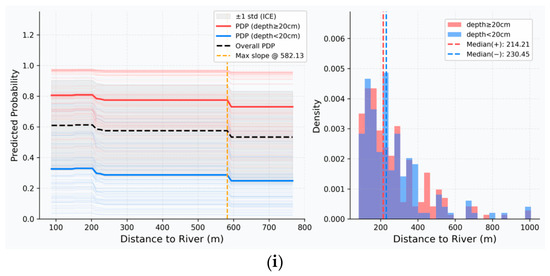
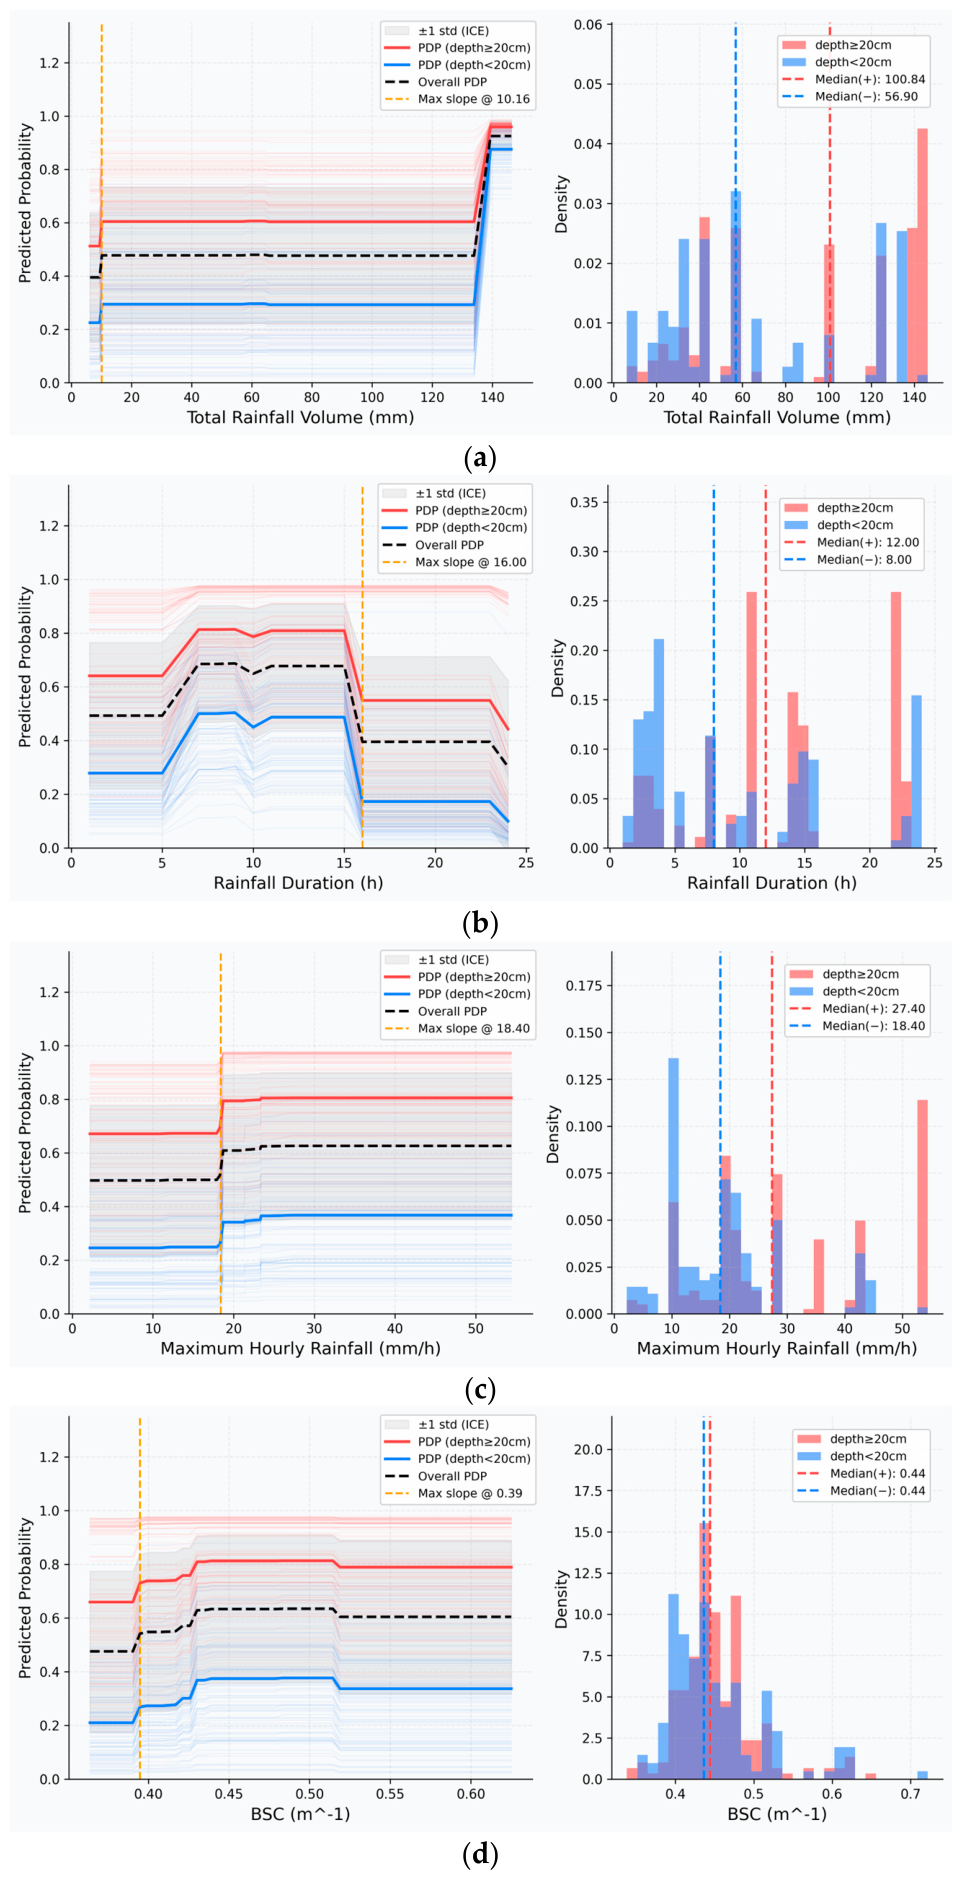
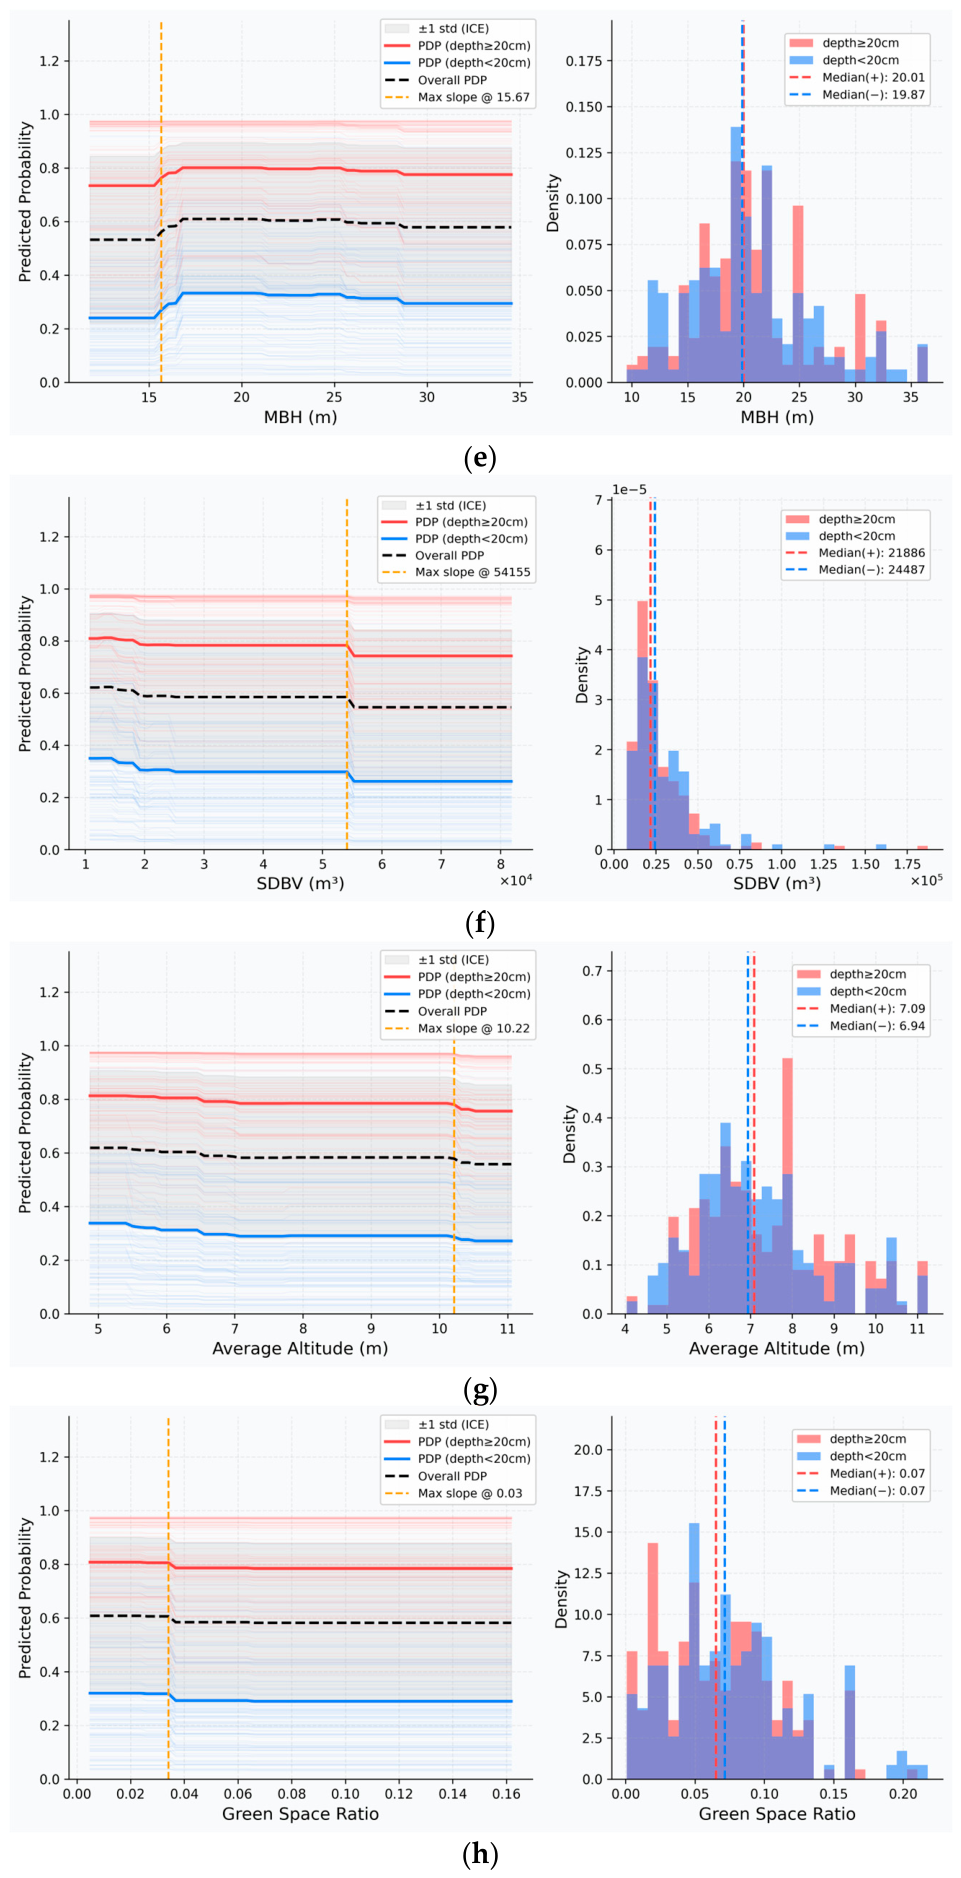
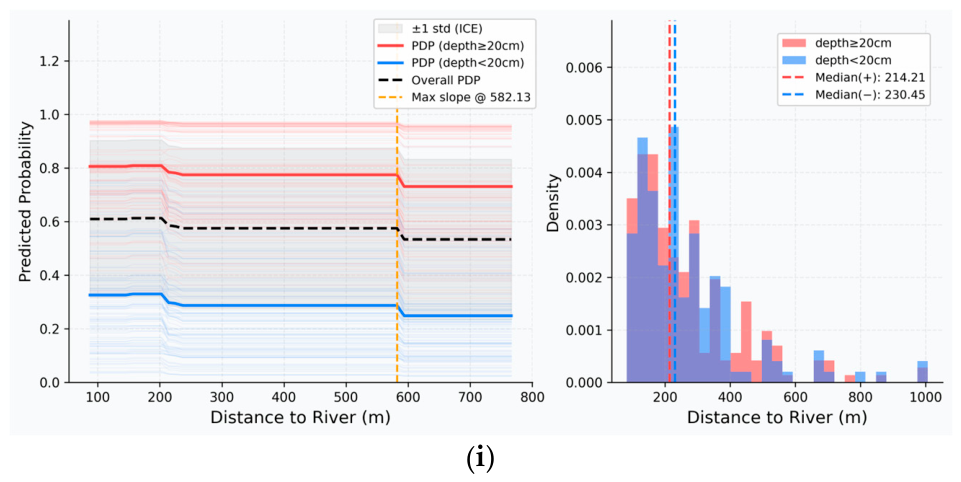

Disclaimer/Publisher’s Note: The statements, opinions and data contained in all publications are solely those of the individual author(s) and contributor(s) and not of MDPI and/or the editor(s). MDPI and/or the editor(s) disclaim responsibility for any injury to people or property resulting from any ideas, methods, instructions or products referred to in the content. |
© 2026 by the authors. Licensee MDPI, Basel, Switzerland. This article is an open access article distributed under the terms and conditions of the Creative Commons Attribution (CC BY) license.