


Highlights
What are the main findings?
- Drought in Inner Mongolia grasslands (1961–2012) shows clear spatiotemporal patterns: drought frequency decreases with severity, is higher in the central–western regions (nine droughts in ten years), intensity increases westward, and duration lengthens with rising severity.
- Drought is the dominant driver of grassland NPP variation (explaining up to 84% of NPP anomalies), with meadow steppe being the most drought–sensitive and desert steppe the most resilient; drought impacts on NPP, hay yield, sheep units, and economic loss amplify linearly with severity (extreme drought causes 2.8× higher Npp loss, 1.1× higher hay loss, and 4.4× higher economic loss than moderate drought).
What are the implications of the main findings?
- It provides a scientific, quantifiable basis for drought risk early warning and graded prevention in Inner Mongolia and similar arid–semi–arid pastoral areas, supporting targeted governance based on drought severity and grassland type.
- The validated assessment chain offers a replicable tool for dynamic monitoring and loss evaluation of pastoral drought, helping policymakers optimize grazing management, allocate relief resources, and improve the resilience of grassland–livestock systems under climate change.
Abstract
Drought, one of the most severe natural disasters globally, has inflicted notable impacts on animal husbandry production, yet the current research on drought impact assessment in pastoral systems is plagued by obvious gaps, such as the lack of comprehensive quantitative evaluations integrating grassland ecosystem and livestock production indicators, unclear quantitative relationships between drought severity gradients and multi-level pastoral impacts, and the absence of validated quantitative assessment frameworks linking drought indices with actual pastoral economic losses. To fill these gaps, this study takes Inner Mongolia grasslands as the research area, analyzes the spatiotemporal characteristics of drought and its impacts on grassland net primary productivity (NPP) over the 50-year period from 1961 to 2012, and quantifies the differential impacts of three representative gradient drought events (1974 moderate, 1986 severe, and 1965 extreme) on grassland NPP, standard hay yield, sheep units and livestock economic losses. The long-term analysis shows that drought frequency in the study area decreases with increasing severity, with the typical steppe having the highest drought frequency and a “nine droughts in ten years” pattern in the central and western regions; drought intensity increases westward, and duration extends with rising severity, and its spatial distribution is highly consistent with the east–west precipitation gradient. Drought is the dominant driver of NPP variation, explaining up to 84% of NPP anomalies, with meadow steppe being the most sensitive to drought and desert steppe showing stronger drought resilience due to adaptive traits such as deeper root systems. The assessment of the three representative drought events reveals that drought impacts exhibit a linear amplification effect with severity, with extreme drought causing an average NPP loss 2.8 times greater, hay yield loss 1.1 times greater, and economic loss 4.4 times greater than those caused by moderate drought, and different grassland types show distinct response characteristics to drought of varying severity. The NPP loss spatial distribution is highly consistent with severe drought areas, and sheep unit loss is directly correlated with drought severity. Most importantly, the study validates a robust quantitative assessment framework () with relative errors of less than 9% compared with historical disaster records, which systematically links drought indices with practical pastoral economic losses. This research clarifies the quantitative relationships between drought and multi-dimensional pastoral impacts, and provides actionable scientific insights for drought risk governance in arid and semi-arid pastoral areas such as Inner Mongolia.
1. Introduction
China is a country with frequent droughts, especially in arid and semi-arid regions [1,2,3,4]. Current disturbance patterns and global changes significantly impact ecosystem resources and productivity [5]. Precipitation serves as a critical regulatory factor for grassland vegetation growth in arid and semi-arid regions [6], with drought causing substantial reductions in regional ecosystem carbon storage and carbon fixation capacity [7]. As drought conditions worsen, maintaining grassland carbon pools and sinks becomes increasingly challenging due to high spatiotemporal variability and climate fluctuations [8,9,10]. Key factors influencing vegetation productivity and carbon sequestration include the duration, intensity, and spatial extent of drought events affecting grassland interannual carbon balance [11]. Drought impacts exhibit lag effects, with soil properties and precipitation frequency/intensity influencing soil water content for up to two years, potentially exacerbating net ecosystem exchange (NEE) anomalies by as much as 40% [5]. Such legacy effects are particularly consequential because severe, sustained droughts can dramatically affect grassland ecosystem carbon cycles, potentially offsetting decades of accumulated carbon storage in a single event [12]. Importantly, these impacts vary substantially across grassland types due to inherent differences in ecosystem resistance and resilience [13].
In fact, due to the delayed onset of drought, the cumulative effect of water deficit on grassland ecosystems increases with drought duration and intensity [14,15]. Since ecosystems possess inherent adaptability and resistance, drought only significantly impacts them when it exceeds their critical tolerance threshold [16,17]. Mild drought or water deficit demonstrates limited effects on vegetation, potentially yielding positive outcomes or showing no significant differences in vegetation status pre- and post-drought [18,19]. Substantial evidence indicates that ecosystems can endure short-term extreme events or moderate droughts, with varying impacts across different drought severity levels [12,20,21,22,23]. Some studies have observed maintained grassland ecosystem productivity even during localized extreme drought events [20,21,24]. These phenomena may result from multiple factors: the buffering capacity of grassland soil carbon against extreme events [25,26], vegetation-soil interactions [27], interspecies cooperation [28,29], enhanced vegetation water use efficiency during drought under elevated atmospheric CO2 concentrations [30,31], and increased resistance to extreme drought stress due to recurrent mild drought events [32,33]. However, ecosystem fragility means that as drought severity progresses, the intensifying drought conditions eventually exert impacts exceeding ecosystem tolerance, the so-called “unacceptable impact” threshold [34]. Consequently, this study focuses exclusively on medium-to-severe drought effects on grassland ecosystems, excluding mild drought impacts.
Drought has exerted significant impacts on socio-ecological systems, garnering worldwide attention [35,36,37]. Current drought impact assessments primarily focus on agricultural sectors [38,39,40], including both crop production [41,42,43,44] and pastoral systems [45,46,47,48]. Regarding crop productivity, Orimoloye focused on assessing agricultural drought impacts on crop production in Free State Province, South Africa. Their results demonstrated significant drought effects on maize and sorghum yields, particularly during 2015 and other drought years that recorded the lowest production levels [49]. Mohammed et al. [50]. examined the physical properties of agricultural drought, such as intensity, duration, and severity in Hungary from 1961 to 2010 based on the Standardized Precipitation Index (SPI) and the Standardized Precipitation Evapotranspiration Index (SPEI), and analyzed the interaction between dryness and crop yield for maize and wheat. Qin et al. [51] assessed the drought impact on sugarcane yield across different growth stages in Guangxi, China, from 1995 to 2016, based on crop water requirements and SPEI.
Concerning pastoral impacts, extensive research indicates that drought is threatening plant growth and soil nutrients in grassland ecosystems [52], altering gross primary production allocation and reducing productivity in widespread pasture grasses [53]. For instance, Smith et al. conducted a coordinated distributed experiment to quantify short-term drought impacts on grassland and shrubland ecosystems, demonstrating with unprecedented rigor that the global impacts of projected increases in drought severity have been significantly underestimated [54]. Lei et al. [55] proposed a novel framework for evaluating drought impacts on grassland ecosystems, revealing progressively greater NPP losses with increasing drought severity. Felton and Goldsmith integrated remote sensing-derived gross primary productivity with meteorological data to systematically evaluate the timing and magnitude of drought impacts on carbon uptake across the western US Great Plains grassland biome [56]. Gao employed land use and climate data to drive ecosystem process models, quantitatively assessing the effects of land use and climate change on NPP, vegetation carbon storage, soil respiration, and carbon sequestration in agricultural–pastoral transition zones [57]. Based on correlation analysis and the coefficient of variation method, Liu et al [52] analyzed the cumulative and lag effects of multi-timescale drought on grassland NPP under different climatic zones, altitudes, and water availabilities in Central Asia from 1982 to 2018, and discussed the impact of temporal effects on grassland NPP stability.
Most scholars study the impacts of climate change on ecosystems from a functional perspective, analyzing drought effects through comparison with established assessment criteria [13]. Currently, few comprehensive quantitative evaluation methods exist to systematically assess drought impacts on both grassland productivity and livestock production, especially concerning the quantitative relationships between pasture NPP variations and livestock output values across different drought severity levels and grassland types. Therefore, this study focuses on utilizing the Standardized Precipitation Index (SPI) and the Biome-BGC model to develop a dynamic assessment model for livestock drought losses. This model quantifies the effects of moderate, severe, and extreme drought events on forage yield, sheep units, and livestock output value. The applicability of this method is further evaluated by incorporating drought loss survey data.
Existing studies on drought and its impacts have laid a foundation for understanding drought characteristics, propagation, and ecological/socio-economic effects, but critical gaps remain, leading to unclear mechanisms and limited practical guidance.
Most studies employ either the SPI or the SPEI as the sole index and focus on single drought types (e.g., meteorological or hydrological drought) or single impact dimensions (e.g., vegetation productivity or crop yield) [51,58], lacking a holistic analysis of the chain effect from “drought type conversion ()” to “multi-level impacts ()” [59,60]. For example, studies on drought propagation in semi-arid regions (e.g., eastern Gansu) clarify meteorological-to-hydrological drought conversion but ignore links to pastoral production losses; pastoral impact assessments focus on yield/economic losses but lack connection to upstream drought propagation mechanisms.
Compound drought (concurrent drought and heat) studies highlight the increasing frequency in arid/semi-arid regions but fail to reveal how compound stress differs from single drought in impacting grassland–pastoral systems, especially regarding vegetation resilience and livestock adaptation thresholds.
At the ecological scale, while studies confirm drought’s impact on vegetation phenology and productivity, the differential responses of diverse grassland types (meadow, typical, and desert steppe) to drought intensity (moderate, severe, and extreme) and duration remain unclear. For instance, the sensitivity of vegetation net primary productivity (NPP) to drought varies across grassland types, but the underlying physiological (e.g., stomatal regulation, carbon allocation) and microbial (e.g., soil organic carbon pool stability) mechanisms remain not fully elucidated. At the socio-ecological scale, the interactive effects of climate (precipitation variation) and human activities (grazing intensity, water use) on drought vulnerability are understudied. Existing research either emphasizes climate-driven drought impacts or isolated human activity effects, lacking analysis of how grazing intensity modulates drought–vegetation–livestock feedbacks under variable precipitation.
Critical thresholds for drought impacts are undefined. For example, the minimum drought intensity or duration triggering significant declines in grassland carrying capacity or livestock mortality, and the precipitation variability threshold required to maintain plant diversity in grazed semi-arid grasslands, remain unquantified. Adaptation strategies are generic: Current measures (e.g., afforestation, reservoir construction) lack specificity for different drought types and scales. There is no clear guidance on how to adjust grazing intensity or water allocation based on drought propagation characteristics (e.g., time lag, intensity attenuation) to mitigate pastoral losses.
Most studies either analyze long-term drought trends (1961–2014) or single extreme drought events (e.g., 1965 extreme drought in Inner Mongolia) but fail to explore how long-term climate change (e.g., warming, precipitation pattern shifts) modifies the intensity, impact scope and recovery trajectory of extreme droughts in grassland–pastoral systems. For example, whether long-term wetting in northwest China reduces extreme drought impacts, or whether warming amplifies compound drought–heat effects, remains unaddressed.
To fill the above gaps, this study aims to:
Systematically reveal the multi-scale chain mechanisms of “drought propagation ()—ecological response (vegetation–livestock)—human adaptation” in semi-arid grassland pastoral systems, quantify critical thresholds of drought impacts under climate–human interaction, and propose targeted adaptation strategies. Break through the limitations of single-dimensional drought research and establish a multi-scale, integrated analytical framework that links drought propagation, ecological responses, and human activities, thereby enriching the theory of drought socio-ecological system impacts. Clarify the differential response mechanisms of diverse grassland types and livestock systems to drought intensity, duration, and compound stress (drought–heat), providing new insights into semi-arid ecosystem resilience and stability. Quantify critical thresholds (e.g., drought intensity triggering a 10% livestock loss, precipitation variability maintaining plant diversity) to provide scientific benchmarks for the early warning of drought risk and grazing management. Propose adaptive strategies tailored to drought propagation characteristics (e.g., adjusting grazing intensity based on the meteorological–hydrological drought time lag) and grassland type, supporting sustainable management of grassland pastoral systems in semi-arid regions.
2. Study Area, Data Sources and Methodology
2.1. Study Area
The Inner Mongolia Grassland constitutes the main body of temperate grasslands in Northern China, with its natural grassland area spanning 86.667 million hectares (hm2), which accounts for approximately 25% of China’s total grassland area, as shown in Figure 1. This vast and boundless grassland extends from east to west, primarily encompassing meadow steppes, such as the Hulunbuir and Horqin Grasslands, typical steppes, including the Xilin Gol and Ulanqab Grasslands, as well as the Ordos Semi-Desert Grassland and the Alxa Desert Steppe. Collectively, these biomes cover 67.5% of the total land area of the Inner Mongolia Autonomous Region, establishing it as one of China’s largest natural ranches; consequently, the region holds an extremely important position in the context of China’s grassland resources and livestock production, playing a crucial role in sustaining regional development and maintaining ecological balance.
Figure 1.
Location and topography of Inner Mongolia.
Grassland is the dominant natural vegetation in Inner Mongolia, exhibiting clear zonality influenced by geomorphology, climate, and soil, as shown in Figure 2. Corresponding to the spatial distribution of chernozem, chestnut soil, and brown calcic soil, the region features temperate meadow steppe, typical steppe, and desert steppe from east to west. Meadow steppe (11% of total grassland; 300–600 mm precipitation) is dominated by Stipa baicalensis and Leymus chinensis. Typical steppe (35%; 200–400 mm) is characterized by xeric perennial herbs such as S. grandis and L. chinensis. Desert steppe (11%; 0–200 mm) mainly consists of more drought-tolerant, dwarfed species such as S. klemenzii.
Figure 2.
Distribution of meadow steppe, typical and desert steppe of Inner Mongolia ((a): meadow steppe, (b): typical steppe, (c): desert steppe).
Positioned at the edge of the East Asian monsoon and continental climate zones, Inner Mongolia experiences cold, dry winters and hot, rainy summers, resulting in precipitation that is highly variable annually and unevenly distributed spatially. Under these combined effects, drought is the primary threat to the local grassland ecosystem. Over 80% of the temperate steppe area lies within arid and semi-arid regions, facing frequent, intense, and prolonged droughts. The region has seen an increase in the frequency and severity of droughts in recent years, including a continuous 10-year drought period since 2000. This makes the Inner Mongolia Grassland an ideal field site for studying the impacts of actual drought events.
2.2. Data Sources
This study quantitatively evaluates the impact of drought on grassland productivity in Inner Mongolia using an ecological process model and the SPI drought monitoring index. The required data are detailed in Table 1.
Table 1.
The data used in this study.
The daily meteorological inputs for the ecological process model (e.g., Biome-BGC) include Tmax, Tmin, Prcp, VPD, Srad, and Daylen. Monthly precipitation is used for SPI (Standardized Precipitation Index) calculation. The SPI developed by McKee et al. [61] was adopted for drought identification. The SPI is more sensitive to short-term rainfall than the Palmer Drought Severity Index (PDSI), making it better suited for monitoring changes in soil moisture. It offers a prompt response to the onset of drought, allowing for earlier drought detection, and exhibits good spatial standardization.
This study utilizes daily meteorological data from 40 qualified sites in Inner Mongolia (1960–2009), sourced from the China Meteorological Data Sharing Service Network. Missing shortwave radiation flux density (Srad) and day length (Daylen) are estimated using the MT–CLIM (Mountain Microclimate Simulation Model) embedded in Biome-BGC, which requires only daily Prcp, Tmax, and Tmin inputs. Temperature influences physiological rates; precipitation determines soil water potential; and vapor pressure deficit (VPD) affects stomatal conductance and carbon uptake. Additionally, the CN05.1 gridded meteorological dataset (0.25° × 0.25°, 1961–2012) is employed.
Soil attribute data (sand, silt, clay content, and depth) are derived from the China Soil Dataset (v1.1, FAO-90 classification). Vegetation type data are extracted from the highly accurate 1:1,000,000 Vegetation Atlas of China. For model calibration and validation, flux observation data and literature-based biomass data from the China Flux Observation Network (ChinaFLUX and COIRAS) are utilized. Key flux sites include the Tongyu Station (meadow steppe), Xilinhot Station (typical steppe), and Sunite Left Banner Station (desert steppe), representing the major grassland types in Inner Mongolia.
2.3. Methodology
This study focuses on two newly developed/optimized core methods; existing methods (e.g., Biome-BGC basic simulation, SPI basic calculation) are briefly described:
2.3.1. Localization Optimization of Biome-BGC Model Parameters
The Biome-BGC model simulates the daily carbon, water, and nitrogen cycling processes in grassland ecosystems. The formula for calculating net primary productivity is as follows:
In the formula: represents the total primary productivity; represents autotrophic respiration.
To enhance the model’s simulation accuracy for the temperate grasslands of Inner Mongolia, this study conducted localized calibration and validation of model parameters using field measurement data and flux observation data. Key physiological and ecological parameters were optimized for meadow grasslands, typical grasslands, and desert grasslands, including the leaf carbon-to-nitrogen ratio, specific leaf area (SLA), maximum stomatal conductance, fine root turnover rate, and the proportions of easily decomposable carbon, cellulose, and lignin in litter.
2.3.2. Model Calibration and Validation
This study utilized three representative grassland vortex correlation observation stations from the ChinaFLUX network, each representing one of the three major grassland types in the study area, to conduct model calibration and validation.
- Tunyu Station (Grassland Plain)
- Xilinhot Station (Typical grassland)
- Sunit Left Banner Station (Desert Grassland)
Calibration data: Total Primary Productivity (GPP), Net Ecosystem Exchange (NEE), Evapotranspiration (ET), and Annual Net Primary Productivity (NPP) for the period 2000–2010.
Validation data: Independent biomass and NPP values derived from publicly available literature and field measurements.
Calibration procedure:
- The parameters were iteratively adjusted with the objective of minimizing the root mean square error (RMSE) between simulated and observed values while maximizing the coefficient of determination.
- First, the model was run using the default parameters, then the key parameters were gradually optimized.
- The calibrated parameters were then fixed for spatial simulation across the entire Inner Mongolia region.
Verification result:
- The simulated annual NPP showed good agreement with the observed values .
- The relative errors between simulated NPP and observed values for all grassland types were below 9%.
- The simulated evapotranspiration (ET) and total primary productivity (GPP) were consistent with observed data, demonstrating reliable model performance.
2.3.3. Calculation of the Standardized Precipitation Index (SPI)
Using monthly precipitation data from the CN05.1 gridded meteorological dataset (0.25° × 0.25°, 1961–2012), standardized precipitation indices were calculated for both the 3-month scale (SPI_3) and the 12-month scale (SPI_12).
The Gamma distribution was used to fit the precipitation series, converting the cumulative probability into a standard normal distribution to obtain the SPI value (McKee et al., 1993) [61].
SPI_3 was used to determine the frequency, intensity, duration, and typical characteristics of drought events.
SPI_12 was used to analyze the long-term relationship between drought and annual NPP.
2.3.4. Quantitative Chain Assessment Model for Drought Losses
Establish a quantitative assessment framework for drought-related losses:
Step 1: Convert NPP to standard hay yield
The aboveground biomass ratio is drought-severity dependent, the carbon-biomass conversion coefficient (0.45), and a standard hay moisture content of 15%, using the following formula:
where: = 0.12 (under drought conditions), = 0.15 (under normal conditions), = 0.17 (under wet conditions).
Step 2: Loss of edible forage
The grassland utilization rate and digestibility coefficient are derived from the national standard NY/T 635-2015:
Step 3: Standard Sheep Unit (SSU) Loss
In the formula: represents the change in hay yield; = grassland-type-specific utilization rate; = grassland-type-specific digestibility coefficient; represents the daily forage requirement per sheep unit; represents the number of grazing days.
- where: Meadow steppe: Utilization rate = 0.55; Digestibility coefficient = 0.65; typical steppe: Utilization rate = 0.50; Digestibility coefficient = 0.53; desert steppe: Utilization rate = 0.35; Digestibility coefficient = 0.45.
Step 4: Economic Loss
The economic losses were calculated at a constant price of 700 yuan per standard sheep unit in 1980 and verified against the historical disaster records in China Water and Drought Disasters.
To verify the temporal stability and spatial trend of annual precipitation in the Inner Mongolia grassland from 1961 to 2012, the Mann–Kendall trend test and the Theil–Sen slope method were used to analyze the regional average precipitation series and the 0.25° × 0.25° gridded precipitation series. The results show that the regional average annual precipitation had no significant temporal trend (M–K test Z = 0.18, p = 0.856), with a Theil–Sen slope of 0.06 mm yr−1, indicating a weak change over 52 years. The spatial trends exhibited obvious differentiation: the eastern meadow steppe was dominated by a slightly increasing trend, with significant increases in eastern Hulunbuir; the central typical steppe showed a widespread decreasing trend, with significant decreases in core areas such as central Xilingol League; the western desert steppe was dominated by a slightly increasing trend overall. The Sen slope ranged from −1.5 to +1.2 mm yr−1. The central typical steppe had the largest rate of decrease (−0.8 to −1.5 mm yr−1), the eastern meadow steppe had an increasing rate of +0.5 to +1.2 mm yr−1, and the western desert steppe had an increasing rate of 0 to +0.6 mm yr−1. Among all grids, 11% showed a significant increasing trend, 9% showed a significant decreasing trend, and the remaining 80% showed no significant change.(Table 2) And more detailed data are shown in Table 3. The spatial pattern of precipitation trends is highly consistent with the east–west gradient of drought frequency, further confirming that the spatiotemporal characteristics of drought in the study area are dominated by the long-term climatological east–west precipitation gradient.
Table 2.
Spatial statistical characteristics of annual precipitation trends in Inner Mongolia grasslands, 1961–2012.
Table 3.
Station-wise Result Statistics (1961–2012).
2.3.5. Calculation of the Standardized Precipitation Index
SPI_3 was computed using a discrete 1-month sliding window. At individual meteorological stations or grid cells, drought duration was defined as the number of consecutive months with SPI_3 below the corresponding severity threshold. The fractional-month durations reported in the results (e.g., 1.67 months, 8.67 months) are areal mean values averaged across all stations/grids within each grassland type, calculated as:
where: represents the regional average drought duration (fractional-month output), N represents the number of stations/grids in the grassland type region, and represents the integer duration at a given site.
This explains why the regional average duration appears as a fractional month, even though the underlying sliding window and single-site duration are integer-valued.
3. Results and Analysis
3.1. Temporal and Spatial Distribution Characteristics of Different Drought Levels
The drought identification results based on the 3-month standardized precipitation index (SPI_3), indicate that from 1961 to 2012, the frequency of drought events in the Inner Mongolia grasslands decreased as the drought severity increased.
In this study, we performed a systematic analysis of the temporal evolution and intensity characteristics of drought events based on the observed drought data covering the period from 1960 to 2012. The generalized results are listed below, while the complete and detailed analytical outcomes are documented in Table 4.
Table 4.
Basic Parameters and Drought Event Statistics.
Figure S1 shows that moderate droughts primarily occurred in southeastern meadow grasslands, the eastern typical grasslands, and the northeastern desert grasslands. They occurred 12–41 times, with a recurrence interval of 1.26–4.33 years, an intensity ranging from −1.35 to −1.14, and a duration of 1.67–3.48 months.
Figure S2 indicates that severe droughts were concentrated in the central–northern meadow grasslands, the typical grasslands of the central and southern regions (high-risk areas), and the eastern desert grasslands, occurring 5–30 times with a recurrence interval of 1.73–10.2 years, an intensity ranging from −1.80 to −1.55, and durations of 2.37–6 months.
Figure S3 demonstrates that the extreme droughts were primarily concentrated in the central meadow grasslands, the typical grasslands of the central and western regions, and the desert grasslands of the southwestern area. They occurred 1–14 times, with a recurrence interval of 3.71–52 years, an intensity ranging from −2.88 to −2.01, and a duration of 1–8.67 months.
The collective analysis of Figures S1–S3 reveals significant regional differentiation in Inner Mongolia’s steppe droughts over the 1961–2012 study period, where concurrent occurrences of different drought grades across regions result in cumulative event counts exceeding the 52-year timeframe. Notably, the typical steppe experienced higher drought frequency than the meadow or the desert steppe, with spatial patterns generally following precipitation gradients (east > west) as shown in Figure S4. Furthermore, multi-scale SPI–NPP correlation analysis with lags of 0–12 months revealed distinct lag characteristics: grassland, 1–2 months; typical grassland, 2–3 months; and desert steppe, no significant lag. In general, the drought frequency was higher in the central and western regions than in the eastern regions, exhibiting the characteristic pattern of “nine droughts in ten years” [62]. These findings align with Smith’s observations of maximum drought frequency in the northeastern Hulunbuir League and minimum frequency in the western Alxa League [63].
3.2. Quantifying Drought Impacts on Grassland NPP
Prior to the quantitative analysis of drought’s impact on NPP, we first established the drought–NPP relationship using the 12-month Standardized Precipitation Index (SPI_12). As shown in Figure 3, the analysis revealed a strong positive correlation between NPP and SPI_12, with 80% of the study area showing high correlation (R > 0.5) and only 20% exhibiting weak correlations—primarily in western desert steppes (characterized by a low NPP of 44–100 g C/m2/yr) and northeastern typical grasslands (likely temperature-influenced). Steppe-type comparisons showed meadow steppes had the highest NPP-SPI_12 correlation (95.2% of areas with R > 0.5), followed by typical steppes (91.4%), while desert steppes demonstrated significantly lower correlation (36.8%), indicating greater drought tolerance that aligns with field observations. This resilience stems from adaptive traits developed under chronic water stress, including deeper root systems that enhance soil water acquisition in low-precipitation environments, allowing desert steppe vegetation to maintain growth despite moisture limitations (Müller and Bahn, 2022) [33].
Figure 3.
Spatial distribution of correlation coefficients between NPP and SPI_12 across different steppe types in Inner Mongolia: (a) all steppe types combined, (b) meadow steppe, (c) typical steppe, and (d) desert steppe.
The coefficient of determination (R2) of annual precipitation deficit for NPP was generally high, peaking at 0.84 (Figure 4). Overall, 67% of the study area exhibited R2 > 0.5, indicating that drought is the primary driver of regional NPP anomalies. Among steppe types, meadow steppe exhibited the highest maximum R2 (0.84), with 77.1% of its area showing R2 > 0.5. Typical steppe followed closely with a maximum R2 of 0.81 and 77.3% coverage of R2 > 0.5 areas. In contrast, the desert steppe showed lower drought sensitivity, with a maximum R2 of 0.79 and only 26.1% of its area exceeding R2 > 0.5. These results confirm that drought is a critical stress factor for grassland NPP, consistent with findings reported by Zhang et al. (2014) [64].
Figure 4.
Spatial distribution of determination coefficients between NPP and SPI_12 across different steppe types in Inner Mongolia: (a) all steppe types combined, (b) meadow steppe, (c) typical steppe, and (d) desert steppe.
The statistical analysis of the significance levels for the correlation and the coefficients of determination (Figure 5) revealed that all steppe types exhibited statistically significant drought–NPP relationships at p < 0.05, with meadow steppe demonstrating the strongest significance (p < 0.001), typical steppe showing high significance (p < 0.003), and desert steppe exhibiting comparable significance to meadow steppe (p < 0.001), collectively confirming that drought is a scientifically validated determinant of NPP variation across Inner Mongolia’s steppe ecosystems.
Figure 5.
Spatial distribution of correlation significance test between NPP and SPI_12 across different steppe types in Inner Mongolia: (a) all steppe types combined, (b) meadow steppe, (c) typical steppe, and (d) desert steppe.
In conclusion, drought constitutes a critical determinant of NPP variations across Inner Mongolia’s steppe ecosystems, with differential impacts observed among meadow steppe, typical steppe, and desert steppe communities.
3.3. Anomalies in Grassland NPP Estimation During Representative Drought Events
This study identified drought events in Inner Mongolia’s steppes over the past 50 years using the SPI_3, with representative drought events selected based on affected area, intensity, and duration: the moderate drought of 1974, the severe drought of 1986, and the extreme drought of 1965. The 1974 moderate drought affected 75% of the study area with durations of 3–9 months (mean = 3 months) and peak intensity of SPI_3 = −1.50 (Figure S5a,b). NPP losses during this event averaged 11.37 ± 8.98 g C/m2/yr (max = 50.55; Figure S6) across all steppes, with meadow steppe showing intermediate average losses (11.40 ± 9.22 g C/m2/yr) concentrated in southeastern and western regions where the drought was most severe. Typical steppe exhibited lower average losses (10.12 ± 9.47 g C/m2/yr), with minimal impacts occurring predominantly in the northern parts of the central regions and southeastern areas, corresponding to milder drought conditions. The desert steppe exhibited the highest variability (13.18 ± 11.03 g C/m2/yr), with NPP increasing in eastern sectors where precipitation was relatively abundant, contrasting with significant declines in severely drought-affected western and southern zones. The spatial patterns of maximum NPP reductions showed strong correspondence with areas of the most intense drought stress, demonstrating that drought was the primary driver of productivity anomalies.
The 1986 severe drought event exhibited extensive spatial coverage across Inner Mongolia’s steppes, primarily affecting meadow and typical steppe regions along with southern desert steppe areas (Figure S7a,b), and persisted for 2–11 months (mean duration = 4 months) with most impacted areas reaching the severe drought threshold (SPI_3 = −2.0). NPP losses during this event averaged 23.13 ± 16.98 g C/m2/yr (max = 89.42; Figure S8) across all steppes, with desert steppe showing highest average losses (32.98 ± 21.87 g C/m2/yr), followed by typical steppe (22.69 ± 16.99) and meadow steppe (21.86 ± 16.47), demonstrating strong spatial correspondence between drought severity and NPP declines particularly in the midwestern meadow/typical steppe and northwestern desert steppe, while NPP increases occurred in eastern typical steppe and southern desert steppe areas, where growing season precipitation was relatively higher.
The 1965 extreme drought event exhibited extensive impacts across Inner Mongolia’s steppes, primarily affecting the western and southern meadow steppe, the central and southwestern typical steppe, and the southern desert steppe regions (Figure S9a,b), persisting for up to 11 months (mean duration = 6 months) with intensity meeting extreme drought criteria (SPI_3 ≤ −2.0). Productivity impacts included regional average NPP losses of 31.44 ± 16.67 g C/m2/yr (max = 105.41; Figure S10), with steppe-type variations showing that desert steppe experienced the highest mean losses (27.54 ± 23.26), followed by typical steppe (16.38 ± 14.24) and meadow steppe (15.11 ± 11.82). Spatial analysis revealed the strongest NPP declines in the central and southwestern typical steppe and the southern desert steppe, while NPP increases occurred in the northern meadow steppe, northwestern typical steppe, and the western desert steppe, corresponding to areas with relatively higher precipitation during the drought period.
A comparison of the three typical drought events demonstrates that the impact of drought increases linearly with its severity level:
The 1974 mid-year drought resulted in an average NPP loss of 11.37 g C·m−2·yr−1 across the region.
The severe drought of 1986 resulted in an average loss of 23.13 g C·m−2·yr−1.
The 1965 extreme drought resulted in an average loss of 31.44 g C·m−2·yr−1.
Geographically, the high-value areas of NPP loss closely align with the drought centers identified by SPI_3. The desert steppe exhibited the highest absolute loss under severe and extreme drought conditions, while the meadow steppe showed the greatest sensitivity to relative drought changes.
3.4. Hay Yield Anomaly Analysis Across Drought Severity Levels
The biomass (dry matter content) of grassland aboveground components equals the hay yield minus the moisture content of air-dried grass. This study adopted a 15% moisture content as the standard hay yield reference [65], where standard hay denotes warm temperate steppe or mountain meadow vegetation (predominantly graminoids) harvested at peak monthly productivity with 15% moisture content. Plant biomass (g/m2) was converted to NPP expressed as carbon mass (g C/m2) using the 0.45 conversion coefficient for aboveground biomass established by Fang et al. (2001) [65]. Furthermore, we applied the mean ratio of for aboveground biomass to NPP across temperate meadow steppe, warm steppe, and warm desert steppe ecosystems [66]. Consequently, drought-induced standard hay yield variations were calculated from NPP changes using the following formula:
Since the coefficients derived from the literature all correspond to hay standardized at 15% moisture content, while the model outputs represent dry matter weight, we incorporated a dry matter-to-hay conversion into our calculations. The grassland utilization rate () and edible yield coefficient () were derived from Technical Specifications for Calculating Reasonable Livestock Carrying Capacity in Natural Grasslands (NY/T 635-2015) and published literature, with values averaged across temperate meadow steppe, warm steppe, and warm desert steppe ecosystems (Table 5).
Table 5.
Key coefficients for pasture grass productivity calculations across grassland types.
Therefore, the drought-induced forage loss is calculated as:
The 1974 drought event in Inner Mongolia resulted in spatially heterogeneous forage losses ranging from −76.93 to 198.27 kg/hm2/yr (negative values indicating localized productivity increases), with maximum losses occurring in the central typical steppe and southeastern/northeastern meadow steppe regions. This spring-to-early-summer drought (March–May) was characterized by less than 30 mm precipitation (2–90% below historical averages) across western Hulunbuir pastoral areas, southern Xing’an League, northern Tongliao City, northeastern Chifeng City, and Xilingol League regions west of the Second Tier, causing severe spring drought conditions. While summer rainfall partially alleviated drought in most areas, persistent precipitation deficits (6–90% below average) persisted through August in western Second Tier regions, including Ulanqab, Hohhot, Baotou, Ordos, and Bayannur, with Hohhot, Ordos’ Dongsheng District, and Wushen Banner experiencing their lowest rainfall on record and consequent severe summer–autumn drought impacts on forage production (Figure 6a).
Figure 6.
Spatial distribution of drought-induced available forage loss: (a) 1974 moderate drought event, amd (b) 1986 severe drought event.
The 1986 drought event in Inner Mongolia resulted in forage losses ranging from −49.52 to 350.68 kg/hm2/yr, with maximum losses concentrated in the northeastern desert steppe, western typical steppe, and southeastern/northeastern meadow steppe regions. This large-scale drought emerged in spring 1986, with April–May precipitation deficits exceeding 80% across most regions except for partial areas of Xing’an League and eastern Hulunbuir, creating critical soil moisture shortages during the grass-greening period that severely constrained vegetation growth (Figure 6b).
The 1965 extreme drought event in Inner Mongolia resulted in substantial forage losses averaging 225 ± 0.65 kg/hm2/yr (range: −48.74 to 413.4 kg/hm2/yr), with maximum reductions concentrated in southeastern desert steppe, southwestern typical steppe, and southeastern meadow steppe regions, affecting a total area of 30 million hectares (450 million mu; Figure 7). These spatial patterns of forage loss align with established precipitation–biomass relationships demonstrated in prior studies, confirming the dominant control of moisture availability on grassland productivity variation across the region.
Figure 7.
Spatial distribution of available forage loss during the 1965 extreme drought event.
The standardized hay yield results (15% moisture content) converted according to the NPP anomaly standard show:
The 1974 mid-year drought: Loss of forageable grassland ranged from −76.93 to 198.27 kg·hm−2;
The severe drought in 1986: losses ranged from −49.52 to 350.68 kg·hm−2.
The 1965 extreme drought resulted in an average loss of approximately 225 kg·hm−2, with the highest loss reaching 413.4 kg·hm−2.
The spatial pattern of forage loss closely correlates with drought intensity and the spatial pattern of NPP loss, illustrating the cascading effect:
3.5. Sheep Unit Loss Estimation Across Drought Severity Levels
Standard sheep unit (SSU) losses were calculated following the Technical Specifications for Calculating Reasonable Livestock Carrying Capacity in Natural Grasslands (NY/T 635-2015) and published literature, with two primary calculation methods:
- (1)
- The calculation expressed in livestock units is given by the formula:
Among them, ΔN represents the annual change in the reasonable livestock carrying capacity of the grassland (in standard sheep units); ΔYt denotes grassland standard hay yield (15% moisture content hay, kg/ha); Et indicates the grassland utilization rate (the proportion of grazing that can be fully and rationally utilized without causing grassland degradation, 47%); Ut is the yield coefficient of available forage for herbivores (54%); At stands for standard hay requirement per sheep unit (1.8 kg/sheep·day); D represents the number of grazing days per year (365 days); and t specifies the grassland type.
- (2)
- The calculation expressed in grassland area is given by the formula:
This study employed the livestock-unit-based calculation method to quantify SSU losses caused by the 1974 moderate drought (Figure 8a). The moderate drought event resulted in SSU losses ranging from −0.16 to 1.03 N/hm2/yr, with maximum reductions concentrated in the central typical steppe and southeastern/northeastern meadow steppe regions of Inner Mongolia. The 1974 spring-to-early-summer drought primarily affected Ordos City (three consecutive drought years), Kailu County (April–August precipitation: 139.6 mm, 66% below average), Horqin Left Wing Middle Banner (50% precipitation reduction), and Naiman Banner (no rainfall until August 11, causing complete crop failure and grassland desiccation). Northern Ulanqab City, Xilin Gol League’s Sunit Right Banner, and Abaga Banner received <30 mm precipitation (March–June), severely impairing grassland productivity. Winter snow deficits (November–February) reached 70% in Siziwang Banner, 38% in Damao Banner, and 40–60% across Xilin Gol League, where black disasters affected 2.385 million hectares (Sunit banners: 1.3% livestock mortality; >27,900 dead livestock in Sunit Right Banner; >64,000 in East Uzhumuqin Banner). Hulunbuir and Tongliao Cities experienced 1.35 million hectares of affected pastureland with 8% livestock mortality.
Figure 8.
Spatial distribution of SSU losses: (a) 1974 moderate drought, and (b) 1986 severe drought.
As shown in Figure 8b, the 1986 severe drought caused SSU losses ranging from −0.18 to 1.05 N/hm2/yr, with maximum reductions concentrated in the northeastern desert steppe, western typical steppe, and the southeastern/northeastern meadow steppe regions of Inner Mongolia. Following spring 1986, large-scale drought conditions developed across the region, characterized by: (1) Ulanqab City’s 15–20 cm dry soil layer, groundwater depletion, and drinking water shortages; (2) Huade County and Shangdu County experiencing near-zero precipitation during April–May; (3) Chifeng City recording 76% below-average precipitation from April to mid-June, exacerbated by high winds accelerating soil moisture loss; and (4) Bayannur City’s Urat grassland receiving 80% less March–May rainfall, affecting 3.8 million hectares and 1.3 million livestock. Although June rainfall temporarily alleviated drought in central-western regions through four precipitation events (June 9–26) in Xilin Gol League, subsequent July–August precipitation west of the Second Tier measured 40–70% below normal, creating compound spring–summer drought effects. Severe impacts included: Bayannur’s Urat grassland vegetation withering post-greening, causing 1.59 million livestock to face critical forage shortages with 51,200 deaths by August’s end; Wulanqab’s Shangdu County, Xinghe County, and Chahar Right Wing Rear Banner reporting 8600 drought-related livestock deaths; Damao Banner recording 29,000 deaths by June; and Siziwang Banner losing 35,000 livestock. Western Hulunbuir City’s Great Khingan Mountains region experienced sustained drought with monthly precipitation deficits of 30–80% (annual precipitation 50–65% below normal), desiccating lakes and rivers, and creating critical water shortages for both vegetation and livestock.
As shown in Figure 9, the 1965 extreme drought caused SSU losses ranging from −0.63 to 1.82 SSU/ha/yr, with maximum reductions concentrated in the southeastern desert steppe, southwestern typical steppe, and southeastern meadow steppe regions of Inner Mongolia. During spring–summer 1965, pastoral areas experienced widespread drought conditions, particularly affecting: (1) northern and western Chifeng City (severe spring drought); (2) western regions beyond the Second Tier (severe summer drought); (3) southern Xilin Gol League (delayed grass green-up by 10–15 days); (4) Ordos City (vegetation withering post-green-up); and (5) Otog Banner (year-round drought with complete grassland desiccation and well depletion). The drought impacts included: 2 million livestock deaths across 16 banner counties west of the Second Tier; 112,000 deaths in Ar Horqin Banner (300-day drought causing pasture depletion and disease outbreaks); and regional totals of 8.853 million affected livestock, including 4.763 million drought-related deaths.
Figure 9.
Spatial distribution of SSU losses during the 1965 extreme drought events.
Based on the national standard for livestock carrying capacity of natural grasslands (NY/T 635-2015), the calculation yields:
The 1974 mid-year drought caused a yield loss of—0.16 to 1.03 SSU·hm−2 per unit area.
Severe drought in 1986: loss of 18 to 1.05 SSU·hm−2;
The 1965 extreme drought caused losses ranging from −0.63 to 1.82 SSU·hm−2.
The high-value loss zones in sheep production areas coincide with the centers of severe and extreme drought, indicating that drought directly reduces livestock carrying capacity by decreasing forage availability.
3.6. Quantitative Assessment of Livestock Economic Losses Across Drought Severity Levels
According to historical data from “Flood and Drought Disasters in China”, the pastoral areas of Inner Mongolia experienced the most severe drought losses during the 1960s–1970s, with an average annual drought loss of 140 million yuan. The year with the highest drought loss rate was 1965, when the losses accounted for nearly half of that year’s total pastoral output value, reaching a drought loss rate of 49.32%. During the 1970s–1980s, the average annual drought loss was 138 million yuan. By the 1980s–1990s, the average annual drought loss had declined to 107.4 million yuan, with the drought loss rate in 1986 reaching 5.83%.
Based on a valuation of 700 yuan per sheep unit (calculated at constant 1980 prices) and Formula (6), the drought-induced livestock economic losses were calculated. The comparison between simulated losses and actual values is shown in Table 6. The simulated economic loss due to pastoral drought in 1974 was 67 million yuan, 50 million yuan lower than the 72 million yuan recorded in Inner Mongolia’s flood and drought disaster statistics, with a relative error of 6.94%. In 1986, the simulated loss was 135.1 million yuan, 13.3 million yuan lower than the 148.4 million yuan in official statistics, with a relative error of 8.78%. In 1965, the simulated loss was 590 million yuan, slightly higher than the 566 million yuan in official records, with a relative error of 4.24%. The simulation results demonstrate that the assessment findings of this study are relatively reliable and consistent with historical disaster records. The spatial distribution of estimated livestock economic losses caused by different drought severity levels is illustrated in Figure 8b, Figure 10a and Figure 11.
Table 6.
Comparison between simulated value and real value of livestock drought loss.
Figure 10.
Spatial distribution of drought-induced livestock economic losses in Inner Mongolia: (a) 1974 moderate drought, and (b) 1986 severe drought.
Figure 11.
Spatial distribution of livestock economic losses during the 1965 extreme drought events.
The economic loss was calculated at a constant price of 700 yuan per standard sheep unit in 1980, and compared with the actual situation described in China’s Water and Drought Disasters:
In 1974, the simulated loss amounted to RMB 67 million, with a relative error of 6.94%.
In 1986, the simulated loss amounted to 135 million yuan, with a relative error of 8.78%.
In 1965, the simulated loss amounted to 590 million yuan, with a relative error of 4.24%.
All errors were below 9%, demonstrating the reliability and accuracy of the evaluation chain established in this study:
The references are specific to the research topic and probably include more recent works in the field of remote sensing.
The figures and tables are clear, but some could benefit from clearer explanations, for example, in the legends and units.
In this study, livestock economic losses were calculated using a constant 1980 price of 700 yuan per standard sheep unit (SSU), with inflation adjustment based on the Consumer Price Index (CPI, 1980 = 100).
The inflation coefficient is defined as:
The inflation-adjusted economic loss formula is:
where () is the loss of standard sheep units caused by drought, and () is the inflation coefficient for the corresponding year (Table S2).
Ten-Year Model Validation
This study validates a dynamic, data-driven model against historical disaster records (e.g., “Flood and Drought Disasters in China”), achieving relative errors < 9% (Table 7).
Table 7.
Simulation and Error Results (10 Years).
Average relative error: 6.82%. The statistical results provide strong support for the reliability and robustness of the evaluation framework.
Data source: China Water and Drought Disasters, Statistical Yearbook of Historical Disasters in Inner Mongolia Autonomous Region.
The model quantifies causal relationships between drought intensity and economic losses, providing a reliable tool for policymakers—an advancement over purely descriptive or unvalidated impact assessments.
4. Discussion
4.1. Improvements and Expanded Knowledge Compared with Existing Literature
This study addresses critical shortcomings in current drought impact research by advancing methodological frameworks, deepening mechanistic understanding, and enhancing the practicality of its findings. Below are the key improvements and expanded knowledge:
- Integrated Multi-Level Impact Assessment (Novel Chain Framework)
Most existing studies focus on single endpoints (e.g., vegetation productivity or crop yield) but fail to link drought drivers to multi-scale pastoral impacts. This study develops a novel quantitative chain framework that connects meteorological drought (SPI) → ecological response (NPP) → pastoral production (hay yield, sheep units) → economic loss. This integration fills a key research gap by providing a systematic pathway from drought onset to livelihood consequences, which was missing in previous semi-arid grassland research.
- Grassland Type-Specific Drought Response Mechanisms
Prior research often generalizes drought impacts across grasslands without considering type-specific vulnerabilities. This study reveals clear differentiation:
Meadow steppe: Most sensitive to drought (95.2% of the area with R > 0.5 between NPP and SPI12), with NPP explaining up to 84% of productivity variation.
Typical steppe: Highest drought frequency, with economic losses dominating during extreme events (60% of the regional total).
Desert steppe: Highest NPP loss during severe drought (32.98 g C/m2/yr) due to adaptive traits, but lower overall economic impact due to lower carrying capacity.
This type-specific analysis advances understanding of ecosystem resilience, moving beyond generic drought impact models to context-specific insights.
- Validated Dynamic Loss Assessment Model
Previous livestock drought loss estimates rely on static, non-validated models. The model quantifies causal relationships between drought intensity and economic losses, providing a reliable tool for policymakers—an advancement over purely descriptive or unvalidated impact assessments.
- Quantification of Drought Severity Thresholds
While existing literature acknowledges the harm caused by drought, few studies quantify critical thresholds. This study identifies:
Extreme drought thresholds: SPI3 ≤ −2.0, duration ≥ 6 months, causing average NPP loss of 31.44 g C/m2/yr and economic losses of 590 million yuan (1980 prices).
Grassland type-specific vulnerabilities: Desert steppe shows the highest NPP sensitivity to severe drought, while the typical steppe shows the highest economic sensitivity to extreme drought.
These thresholds provide actionable benchmarks for early warning and risk management, addressing the lack of precise, quantifiable criteria in current research.
- Limitations and Uncertainties
Despite its contributions, this study has inherent limitations that warrant careful interpretation:
4.2. Limitation
Meteorological data gaps: Some remote regions have incomplete historical records (1960–2012), potentially introducing biases in SPI calculations and NPP simulations. Meanwhile, the grassland utilization rate, availability coefficient, and biomass conversion coefficient employed in this study were all derived from regional averages specified in national standards and the published literature. Given the extensive spatiotemporal coverage (1961–2012) and the large number of counties/districts involved, direct annual measurements for each individual county were not feasible. Validation confirmed that this coefficient set yielded a relative error of <9% in final economic loss simulations, placing the results within a reliable margin.
Grazing intensity data limitations: Long-term, high-resolution grazing intensity data are scarce, so the model uses average utilization rates (47%) rather than site-specific values, which may underestimate variability in loss estimates.
4.3. Model Assumptions and Simplifications
Biome-BGC simplifications: The model assumes steady-state soil properties and constant microbial activity, which may not capture short-term drought-induced shifts in soil carbon dynamics or microbial communities.
Economic valuation assumptions: Livestock economic loss uses a fixed price (700 yuan/SSU, 1980 prices) without adjusting for inflation or regional price differences, potentially limiting accuracy for modern economic analysis.
4.4. Spatial Scale Limitations
Upscaling uncertainty: Simulations are driven by point-scale meteorological data, which may not fully capture sub-grid-scale variability (e.g., topography, land-use changes) in complex terrain.
Land-use change exclusion: The study does not explicitly account for recent grassland degradation or restoration projects, which may alter drought impacts in contemporary landscapes.
- Compound Drought–High Stress Exclusion
While the study analyzes single drought events, compound drought–heat events (a growing threat in semi-arid regions) are not included. Future research should integrate heat stress to better reflect real-world climate change impacts.
- Recovery Trajectory Uncertainty
The model focuses on drought-induced losses but does not quantify post-drought recovery trajectories. Future work could incorporate vegetation recovery dynamics to assess long-term ecosystem resilience and adaptive capacity.
4.5. Implications for Future Research and Practice
To address these limitations, future research should:
- Integrate high-resolution remote sensing and in situ observations to reduce data biases.
- Refine models to include land-use change, microbial processes, and compound stressors.
- Validate findings with long-term (post-2012) monitoring data to assess climate change impacts.
- Develop context-specific adaptation strategies (e.g., grazing intensity adjustments) based on grassland type and drought severity.
This study provides a robust foundation for evidence-based drought risk management in Inner Mongolia’s grasslands, with expanded applicability to other semi-arid pastoral regions globally.
5. Conclusions
From 1961 to 2012, drought events in the Inner Mongolia grasslands exhibited a distinct spatiotemporal gradient: occurrence frequency was higher in the east than in the west, while intensity was greater in the west than in the east. Higher drought severity levels were associated with lower frequency and longer duration, making these grasslands typical high-drought-risk regions.
Drought is the dominant factor controlling the net primary productivity (NPP) in the Inner Mongolia grasslands, accounting for up to 84% of interannual variability. The sensitivity rankings are as follows: meadow grassland > typical grassland > desert grassland.
The impact of drought exhibits a significant linear amplification as severity increases: extreme drought results in 2.8 times greater NPP loss, 1.1 times greater forage loss, and up to 4.4 times higher economic losses compared to moderate drought, with the effects propagating and intensifying progressively across severity levels.
Significant differences were observed across different grassland types: meadow grasslands exhibited the highest sensitivity to water deficit; typical grasslands had the highest drought frequency and the largest proportion of economic losses; desert grasslands demonstrated strong drought resistance and minimal productivity fluctuations.
The chain assessment model developed in this study for meteorological drought–ecological productivity–pastoral production–economic loss demonstrates high accuracy (relative error < 9%), enabling reliable quantitative evaluation of drought-induced losses in pastoral regions. It is suitable for drought monitoring, risk assessment, and adaptive management in arid and semi-arid grassland areas.
Supplementary Materials
The following supporting information can be downloaded at: https://www.mdpi.com/article/10.3390/rs18111841/s1, Figure S1: Spatiotemporal characteristics of moderate drought events (−1.5 < SPI_3 ≤ −1.0) across Inner Mongolia’s grasslands over the past 50 years: (a) occurrence frequency, (b) average drought intensity, (c) average event duration (months), and (d) total drought duration (months); Figure S2: Spatiotemporal characteristics of severe drought events (−2.0 < SPI_3 ≤ −1.5) across Inner Mongolia′s grasslands over the past 50 years: (a) occurrence frequency, (b) average drought intensity, (c) average event duration (months), and (d) total drought duration (months); Figure S3: Spatiotemporal characteristics of extreme drought events (SPI_3 ≤ -2.0) across Inner Mongolia’s grasslands over the past 50 years: (a) occurrence frequency, (b) average drought intensity, (c) average event duration (months), and (d) total drought duration (months); Figure S4: Spatial distribution of precipitation contour in Inner Mongolia grassland; Figure S5: Spatial characteristics of the 1974 moderate drought event in Inner Mongolia’s steppes: (a) drought duration (months), and (b) drought intensity (SPI_3 values); Figure S6: Impacts of the 1974 moderate drought events on NPP across different steppe types in Inner Mongolia: (a) all steppe types combined, (b) meadow steppe, (c) typical steppe, and (d) desert steppe. Color gradients represent NPP anomalies (g C/m2/yr), with positive values indicating productivity declines and negative values showing enhancement effects; Figure S7: Spatial characteristics of the 1986 severe drought event in Inner Mongolia′s steppes: (a) drought duration (months), and (b) drought intensity (SPI_3 values); Figure S8: Impacts of the 1986 severe drought events on NPP across different steppe types in Inner Mongolia: (a) all steppe types combined, (b) meadow steppe, (c) typical steppe, and (d) desert steppe. Color gradients represent NPP anomalies (g C/m2/yr), with positive values indicating productivity declines and negative values showing enhancement effects; Figure S9: Spatial characteristics of the 1965 extreme drought event in Inner Mongolia’s steppes: (a) drought duration (months), and (b) drought intensity (SPI_3 values); Figure S10: Impacts of the 1965 extreme drought events on NPP across different steppe types in Inner Mongolia: (a) all steppe types combined, (b) meadow steppe, (c) typical steppe, and (d) desert steppe. Color gradients represent NPP anomalies (g C/m2/yr), with positive values indicating productivity declines and negative values showing enhancement effects; Table S1: Preview of Core SDF Curve Data; Table S2: CPI and Inflation Coefficients (1960–2012, Base Year: 1980 = 100); Table S3: Simulation and Error Results (2024 constant prices).
Author Contributions
Z.X.: Writing—original draft preparation. J.W.: conceptualization, investigation. D.C.: formal analysis, visualization. T.L.: conceptualization, methodology, resources, writing—original draft preparation, supervision. W.S.: writing—review and editing. W.X.: supervision. Y.X.: writing—review and editing. All authors have read and agreed to the published version of the manuscript.
Funding
This work is funded by the Agricultural Talent Project of the Chinese Academy of Agricultural Sciences (Project Number: Y2026YC55) and the National Key Research and Development Program (Project Numbers: 2023YFF0805900).
Data Availability Statement
The original contributions presented in this study are included in the article/Supplementary Material. Further inquiries can be directed to the corresponding author.
Conflicts of Interest
The authors declare that they have no known competing financial interests or personal relationships that could have appeared to influence the work reported in this paper.
References
- Kang, W.; Wang, T.; Liu, S. The response of vegetation phenology and productivity to drought in semi-arid regions of northern China. Remote Sens. 2018, 10, 727. [Google Scholar] [CrossRef] [Scilit]
- Piao, S.; Ciais, P.; Huang, Y.; Shen, Z.; Peng, S.; Li, J.; Zhou, L.; Liu, H.; Ma, Y.; Ding, Y.; et al. The impacts of climate change on water resources and agriculture in China. Nature 2010, 467, 43–51. [Google Scholar] [CrossRef] [Scilit] [PubMed]
- Xu, F.; Luo, M. Changes of concurrent drought and heat extremes in the arid and semi-arid regions of China during 1961–2014. Atmos. Sci. Lett. 2019, 20, e947. [Google Scholar] [CrossRef] [Scilit]
- Zou, R.; Yin, Y.; Wang, X.; Zhang, Z.; Ma, X.; Liu, M.; Ullah, I. Characteristics and propagation of meteorological and hydrological droughts in eastern gansu, a typical semi-arid region, China. Int. J. Climatol. 2023, 43, 5327–5347. [Google Scholar] [CrossRef] [Scilit]
- Van Der Molen, M.K.; Dolman, A.J.; Ciais, P.; Eglin, T.; Gobron, N.; Law, B.E.; Meir, P.; Peters, W.; Phillips, O.L.; Reichstein, M.; et al. Drought and ecosystem carbon cycling. Agric. For. Meteorol. 2011, 151, 765–773. [Google Scholar] [CrossRef] [Scilit]
- Wu, Y.; Li, H.; Cui, J.; Han, Y.; Li, H.; Miao, B.; Tang, Y.; Li, Z.; Zhang, J.; Wang, L.; et al. Precipitation variation: A key factor regulating plant diversity in semi-arid livestock grazing lands. Front. Plant Sci. 2024, 15, 1294895. [Google Scholar] [CrossRef] [Scilit] [PubMed]
- Reichstein, M.; Bahn, M.; Ciais, P.; Frank, D.; Mahecha, M.D.; Seneviratne, S.I.; Zscheischler, J.; Beer, C.; Buchmann, N.; Frank, D.C.; et al. Climate extremes and the carbon cycle. Nature 2013, 500, 287–295. [Google Scholar] [CrossRef] [Scilit]
- Bai, Y.; Cotrufo, M.F. Grassland soil carbon sequestration: Current understanding, challenges, and solutions. Science 2022, 377, 603–608. [Google Scholar] [CrossRef] [Scilit]
- Chen, J.; Gao, Y.; Zeng, Y.; Huang, M.; Yang, X.; Ochoa-Hueso, R.; Sun, W.; Yang, T. Reduced precipitation frequency decreases the stability of the soil organic carbon pool by altering microbial communities in degraded grasslands. Agronomy 2025, 15, 977. [Google Scholar] [CrossRef] [Scilit]
- Hoover, D.L.; Rogers, B.M. Not all droughts are created equal: The impacts of interannual drought pattern and magnitude on grassland carbon cycling. Glob. Change Biol. 2016, 22, 1809–1820. [Google Scholar] [CrossRef] [Scilit]
- Shinoda, M.; Nachinshonhor, G.U.; Nemoto, M. Impact of drought on vegetation dynamics of the mongolian steppe: A field experiment. J. Arid Environ. 2010, 74, 63–69. [Google Scholar] [CrossRef] [Scilit]
- Xiao, J.; Zhuang, Q.; Liang, E.; Shao, X.; McGuire, A.D.; Moody, A.; Kicklighter, D.W.; Melillo, J.M. Twentieth-century droughts and their impacts on terrestrial carbon cycling in China. Earth Interact. 2009, 13, 1–31. [Google Scholar] [CrossRef] [Scilit]
- Hossain, M.L.; Li, J.; Lai, Y.; Beierkuhnlein, C. Long-term evidence of differential resistance and resilience of grassland ecosystems to extreme climate events. Environ. Monit. Assess. 2023, 195, 734. [Google Scholar] [CrossRef] [Scilit] [PubMed]
- Jentsch, A.; Kreyling, J.; Beierkuhnlein, C. A new generation of climate-change experiments: Events, not trends. Front. Ecol. Environ. 2007, 5, 365–374. [Google Scholar] [CrossRef] [Scilit]
- Zhao, A.; Yu, Q.; Feng, L.; Zhang, A.; Pei, T. Evaluating the cumulative and time-lag effects of drought on grassland vegetation: A case study in the Chinese loess plateau. J. Environ. Manag. 2020, 261, 110214. [Google Scholar] [CrossRef] [Scilit]
- Li, H.; Hu, Y.; Ao, Z. Identification of critical drought thresholds affecting vegetation on the mongolian plateau. Ecol. Indic. 2024, 166, 112507. [Google Scholar] [CrossRef] [Scilit]
- Li, X.; Piao, S.; Huntingford, C.; Peñuelas, J.; Yang, H.; Xu, H.; Chen, A.; Friedlingstein, P.; Keenan, T.F.; Sitch, S.; et al. Global variations in critical drought thresholds that impact vegetation. Natl. Sci. Rev. 2023, 10, nwad049. [Google Scholar] [CrossRef] [Scilit]
- Jiao, W.; Wang, L.; Smith, W.K.; Chang, Q.; Wang, H.; D’Odorico, P. Observed increasing water constraint on vegetation growth over the last three decades. Nat. Commun. 2021, 12, 3777. [Google Scholar] [CrossRef] [Scilit]
- Lobell, D.B.; Roberts, M.J.; Schlenker, W.; Braun, N.; Little, B.B.; Rejesus, R.M.; Hammer, G.L. Greater sensitivity to drought accompanies maize yield increase in the U.S. midwest. Science 2014, 344, 516–519. [Google Scholar] [CrossRef] [Scilit]
- Jentsch, A.; Beierkuhnlein, C. Research frontiers in climate change: Effects of extreme meteorological events on ecosystems. Comptes Rendus Géosci. 2008, 340, 621–628. [Google Scholar] [CrossRef] [Scilit]
- Kreyling, J.; Beierkuhnlein, C.; Elmer, M.; Pritsch, K.; Radovski, M.; Schloter, M.; Wöllecke, J.; Jentsch, A. Soil biotic processes remain remarkably stable after 100-year extreme weather events in experimental grassland and heath. Plant Soil 2008, 308, 175–188. [Google Scholar] [CrossRef] [Scilit]
- Pendall, E.; Heisler-White, J.L.; Williams, D.G.; Dijkstra, F.A.; Carrillo, Y.; Morgan, J.A.; LeCain, D.R. Warming reduces carbon losses from grassland exposed to elevated atmospheric carbon dioxide. PLoS ONE 2013, 8, e71921. [Google Scholar] [CrossRef] [Scilit]
- Xu, Z.; Zhou, G. Responses of leaf stomatal density to water status and its relationship with photosynthesis in a grass. J. Exp. Bot. 2008, 59, 3317–3325. [Google Scholar] [CrossRef] [Scilit] [PubMed]
- Fay, P.A.; Carlisle, J.D.; Knapp, A.K.; Blair, J.M.; Collins, S.L. Altering rainfall timing and quantity in a mesic grassland ecosystem: Design and performance of rainfall manipulation shelters. Ecosystems 2000, 3, 308–319. [Google Scholar] [CrossRef] [Scilit]
- Abberton, M.T.; Batello, C.; Conant, R.T.; Food and Agriculture Organization of the United Nations (Eds.) Grassland carbon sequestration: Management, policy and economics: Proceedings of the workshop on the role of grassland carbon sequestration in the mitigation of climate change, Rome, April 2009. In Integrated Crop Management; Food and Agriculture Organization of the United Nations: Rome, Italy, 2010. [Google Scholar]
- Schuman, G.E.; Janzen, H.H.; Herrick, J.E. Soil carbon dynamics and potential carbon sequestration by rangelands. Environ. Pollut. 2002, 116, 391–396. [Google Scholar] [CrossRef] [Scilit]
- Bloor, J.M.G.; Bardgett, R.D. Stability of above-ground and below-ground processes to extreme drought in model grassland ecosystems: Interactions with plant species diversity and soil nitrogen availability. Perspect. Plant Ecol. Evol. Syst. 2012, 14, 193–204. [Google Scholar] [CrossRef] [Scilit]
- Gilgen, A.K.; Buchmann, N. Response of temperate grasslands at different altitudes to simulated summer drought differed but scaled with annual precipitation. Biogeosciences 2009, 6, 2525–2539. [Google Scholar] [CrossRef] [Scilit]
- Mirzaei, H.; Kreyling, J.; Zaman Hussain, M.; Li, Y.; Tenhunen, J.; Beierkuhnlein, C.; Jentsch, A. A single drought event of 100-year recurrence enhances subsequent carbon uptake and changes carbon allocation in experimental grassland communities. J. Plant Nutr. Soil Sci. 2008, 171, 681–689. [Google Scholar] [CrossRef] [Scilit]
- Signarbieux, C.; Feller, U. Effects of an extended drought period on physiological properties of grassland species in the field. J. Plant Res. 2012, 125, 251–261. [Google Scholar] [CrossRef] [Scilit]
- Soussana, J.; Lüscher, A. Temperate grasslands and global atmospheric change: A review. Grass Forage Sci. 2007, 62, 127–134. [Google Scholar] [CrossRef] [Scilit]
- Backhaus, S.; Kreyling, J.; Grant, K.; Beierkuhnlein, C.; Walter, J.; Jentsch, A. Recurrent mild drought events increase resistance toward extreme drought stress. Ecosystems 2014, 17, 1068–1081. [Google Scholar] [CrossRef] [Scilit]
- Müller, L.M.; Bahn, M. Drought legacies and ecosystem responses to subsequent drought. Glob. Change Biol. 2022, 28, 5086–5103. [Google Scholar] [CrossRef] [Scilit]
- Gallopín, G.C. Linkages between vulnerability, resilience, and adaptive capacity. Glob. Environ. Change 2006, 16, 293–303. [Google Scholar] [CrossRef] [Scilit]
- Afrin, R.; Sultana, R.; Alam, M.S. A comprehensive analysis of drought vulnerability in the barind region of bangladesh: A socio-ecological systems approach. Ecol. Indic. 2024, 160, 111863. [Google Scholar] [CrossRef] [Scilit]
- Tanarhte, M.; De Vries, A.J.; Zittis, G.; Chfadi, T. Severe droughts in north africa: A review of drivers, impacts and management. Earth-Sci. Rev. 2024, 250, 104701. [Google Scholar] [CrossRef] [Scilit]
- Zhang, X.; Hao, Z.; Singh, V.P.; Zhang, Y.; Feng, S.; Xu, Y.; Hao, F. Drought propagation under global warming: Characteristics, approaches, processes, and controlling factors. Sci. Total Environ. 2022, 838, 156021. [Google Scholar] [CrossRef] [Scilit] [PubMed]
- Bibi, F.; Rahman, A. An overview of climate change impacts on agriculture and their mitigation strategies. Agriculture 2023, 13, 1508. [Google Scholar] [CrossRef] [Scilit]
- Hussain, A.; Jadoon, K.Z.; Rahman, K.U.; Shang, S.; Shahid, M.; Ejaz, N.; Khan, H. Analyzing the impact of drought on agriculture: Evidence from pakistan using standardized precipitation evapotranspiration index. Nat. Hazards 2023, 115, 389–408. [Google Scholar] [CrossRef] [Scilit]
- Sun, H.; Sun, X.; Chen, J.; Deng, X.; Yang, Y.; Qin, H.; Chen, F.; Zhang, W. Different types of meteorological drought and their impact on agriculture in central China. J. Hydrol. 2023, 627, 130423. [Google Scholar] [CrossRef] [Scilit]
- Alotaibi, M. Climate change, its impact on crop production, challenges, and possible solutions. Not. Bot. Horti Agrobot. 2023, 51, 13020. [Google Scholar] [CrossRef] [Scilit]
- Nguyen, H.; Thompson, A.; Costello, C. Impacts of historical droughts on maize and soybean production in the southeastern united states. Agric. Water Manag. 2023, 281, 108237. [Google Scholar] [CrossRef] [Scilit]
- Xiang, K.; Wang, B.; Liu, D.L.; Chen, C.; Waters, C.; Huete, A.; Yu, Q. Probabilistic assessment of drought impacts on wheat yield in south-eastern australia. Agric. Water Manag. 2023, 284, 108359. [Google Scholar] [CrossRef] [Scilit]
- Yaddanapudi, R.; Mishra, A.K. Compound impact of drought and COVID-19 on agriculture yield in the USA. Sci. Total Environ. 2022, 807, 150801. [Google Scholar] [CrossRef] [Scilit]
- Abdela, U. Assessment of community-driven drought risk management strategies in pastoral and agro-pastoral district of bale zones south east ethiopia. Front. Environ. Sci. 2024, 12, 1411138. [Google Scholar] [CrossRef] [Scilit]
- Ahmad, M.M.; Yaseen, M.; Saqib, S.E. Climate change impacts of drought on the livelihood of dryland smallholders: Implications of adaptation challenges. Int. J. Disaster Risk Reduct. 2022, 80, 103210. [Google Scholar] [CrossRef] [Scilit]
- Bogale, G.A.; Erena, Z.B. Drought vulnerability and impacts of climate change on livestock production and productivity in different agro-ecological zones of ethiopia. J. Appl. Anim. Res. 2022, 50, 471–489. [Google Scholar] [CrossRef] [Scilit]
- Ghazali, S.; Zibaei, M.; Keshavarz, M. The effectiveness of livelihood management strategies in mitigating drought impacts and improving livability of pastoralist households. Int. J. Disaster Risk Reduct. 2022, 77, 103063. [Google Scholar] [CrossRef] [Scilit]
- Orimoloye, I.R. Agricultural drought and its potential impacts: Enabling decision-support for food security in vulnerable regions. Front. Sustain. Food Syst. 2022, 6, 838824. [Google Scholar] [CrossRef] [Scilit]
- Mohammed, S.; Alsafadi, K.; Enaruvbe, G.O.; Bashir, B.; Elbeltagi, A.; Széles, A.; Alsalman, A.; Harsanyi, E. Assessing the impacts of agricultural drought (SPI/SPEI) on maize and wheat yields across hungary. Sci. Rep. 2022, 12, 8838. [Google Scholar] [CrossRef] [Scilit]
- Qin, N.; Lu, Q.; Fu, G.; Wang, J.; Fei, K.; Gao, L. Assessing the drought impact on sugarcane yield based on crop water requirements and standardized precipitation evapotranspiration index. Agric. Water Manag. 2023, 275, 108037. [Google Scholar] [CrossRef] [Scilit]
- Liu, C.; Siri, M.; Li, H.; Ren, C.; Huang, J.; Feng, C.; Liu, K. Drought is threatening plant growth and soil nutrients of grassland ecosystems: A meta-analysis. Ecol. Evol. 2023, 13, e10092. [Google Scholar] [CrossRef] [Scilit] [PubMed]
- Chandregowda, M.H.; Tjoelker, M.G.; Power, S.A.; Pendall, E. Drought and warming alter gross primary production allocation and reduce productivity in a widespread pasture grass. Plant Cell Environ. 2022, 45, 2271–2291. [Google Scholar] [CrossRef] [Scilit] [PubMed]
- Smith, M.D.; Wilkins, K.D.; Holdrege, M.C.; Wilfahrt, P.; Collins, S.L.; Knapp, A.K.; Sala, O.E.; Dukes, J.S.; Phillips, R.P.; Yahdjian, L.; et al. Extreme drought impacts have been underestimated in grasslands and shrublands globally. Proc. Natl. Acad. Sci. USA 2024, 121, e2309881120. [Google Scholar] [CrossRef] [Scilit]
- Lei, T.; Wu, J.; Li, X.; Geng, G.; Shao, C.; Zhou, H.; Wang, Q.; Liu, L. A new framework for evaluating the impacts of drought on net primary productivity of grassland. Sci. Total Environ. 2015, 536, 161–172. [Google Scholar] [CrossRef] [Scilit] [PubMed]
- Felton, A.J.; Goldsmith, G.R. Timing and magnitude of drought impacts on carbon uptake across a grassland biome. Glob. Change Biol. 2023, 29, 2790–2803. [Google Scholar] [CrossRef] [Scilit]
- Gao, Z.; Liu, J.; Cao, M.; Li, K.; Tao, B. Impacts of land-use and climate changes on ecosystem productivity and carbon cycle in the cropping-grazing transitional zone in China. Sci. China Ser. D Earth Sci. 2005, 48, 1479–1491. [Google Scholar] [CrossRef] [Scilit]
- Doun, G.; Darwish, O.; Patel, N.; Mhawish, A.; Sharba, H. Identifying the pockets most affected by temperature rise and evaluating the repercussions on urban communities and their agricultural lands. Remote Sens. 2025, 17, 1601. [Google Scholar] [CrossRef] [Scilit]
- Ferreira, M.B.; Ferreira, R.L.C.; Silva, J.A.A.D.; Lima, R.B.D.; Sousa, A.N.D.; Silva, M.V.D. Space–time dynamics of mortality and recruitment of stems and trees in a seasonally dry tropical forest: Effect of the 2012–2021 droughts. Remote Sens. 2025, 17, 1491. [Google Scholar] [CrossRef] [Scilit]
- Mai, J.; Feng, Q.; Fu, S.; Wang, R.; Zhang, S.; Zhang, R.; Liang, T. Enhancing crop type mapping in data-scarce regions through transfer learning: A case study of the hexi corridor. Remote Sens. 2025, 17, 1494. [Google Scholar] [CrossRef] [Scilit]
- Mckee, T.B.; Doesken, N.J.; Kleist, J.R. The Relationship of Drought Frequency and Duration to Time Scales. 1993. Available online: https://api.semanticscholar.org/CorpusID:129950974 (accessed on 24 March 2026).
- Giardino, M.; Perotti, L.; Lanfranco, M.; Perrone, G. GIS and geomatics for disaster management and emergency relief: A proactive response to natural hazards. Appl. Geomat. 2012, 4, 33–46. [Google Scholar] [CrossRef] [Scilit]
- Smith, K.; Fearnley, C.J.; Dixon, D.; Bird, D.K.; Kelman, I. Environmental Hazards: Assessing Risk and Reducing Disaster, 7th ed.; Routledge: London, UK, 2023. [Google Scholar]
- Zhang, L.; Guo, H.; Jia, G.; Wylie, B.; Gilmanov, T.; Howard, D.; Ji, L.; Xiao, J.; Li, J.; Yuan, W.; et al. Net ecosystem productivity of temperate grasslands in northern China: An upscaling study. Agric. For. Meteorol. 2014, 184, 71–81. [Google Scholar] [CrossRef] [Scilit]
- Fang, J.; Ke, J.; Tang, Z.; Chen, A. The “4P” concept of biological productivity, estimation and correlation. Chin. J. Plant Ecol. 2001, 25, 414–419. [Google Scholar]
- Zhang, F. Inventory of Chinese Grasslands Carbon Storage and Greenhouse Gases Emission. Ph.D. Thesis, Lanzhou University, Lanzhou, China, 2010. [Google Scholar]
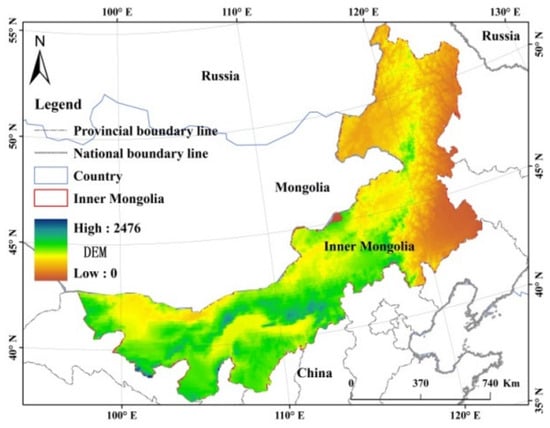
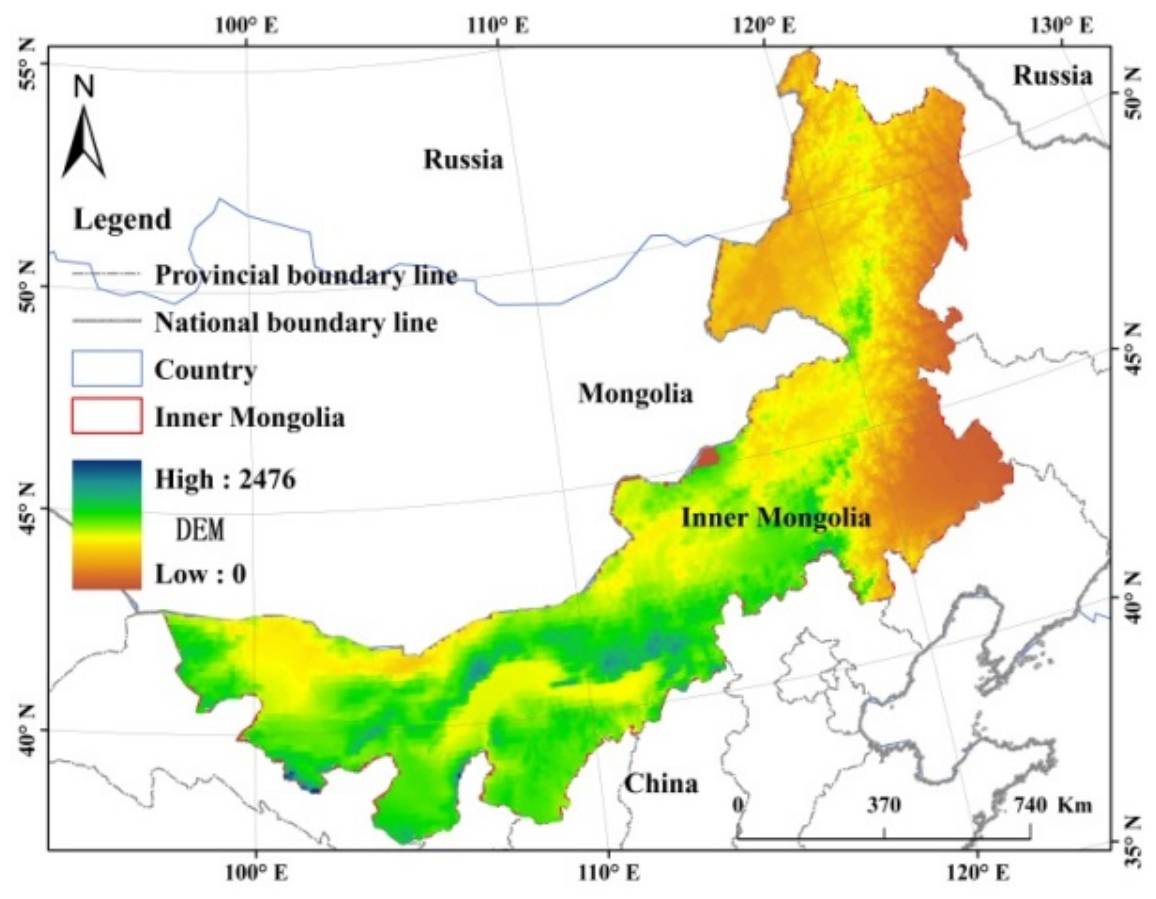
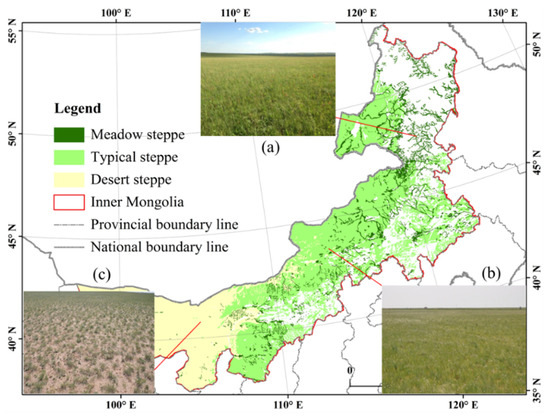
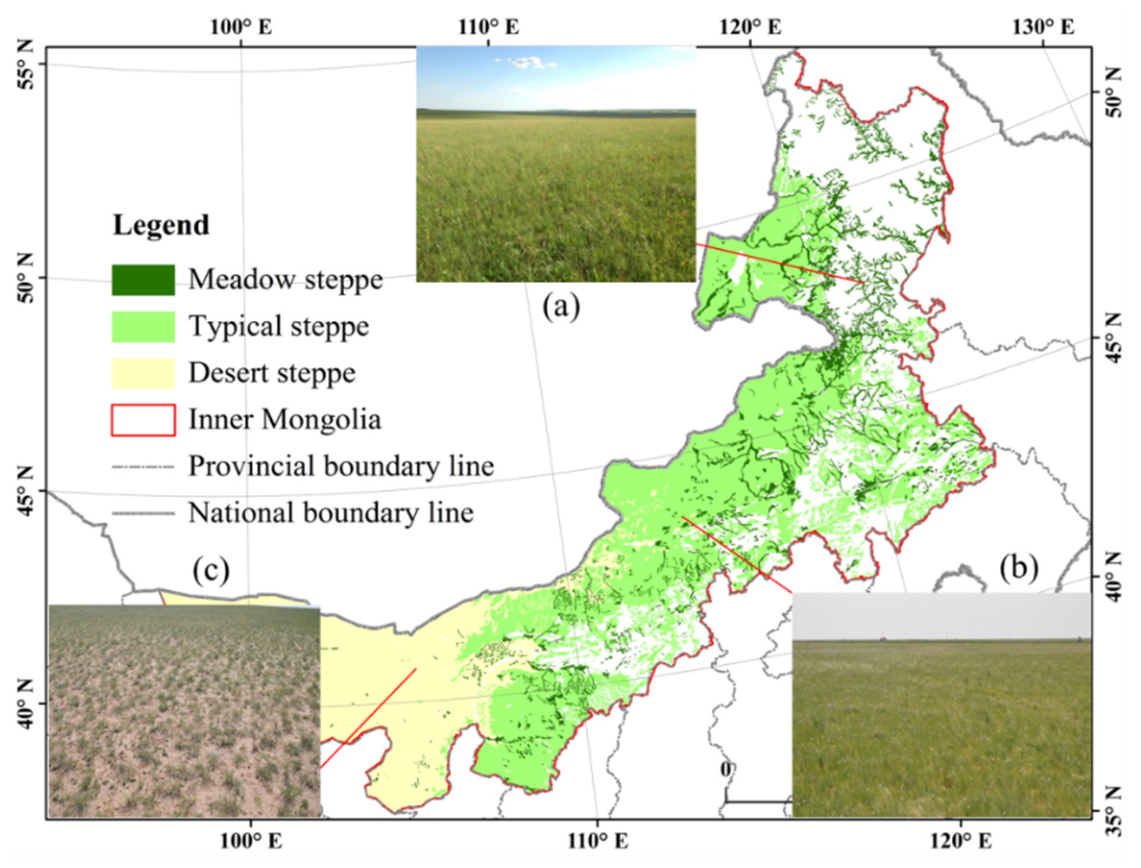
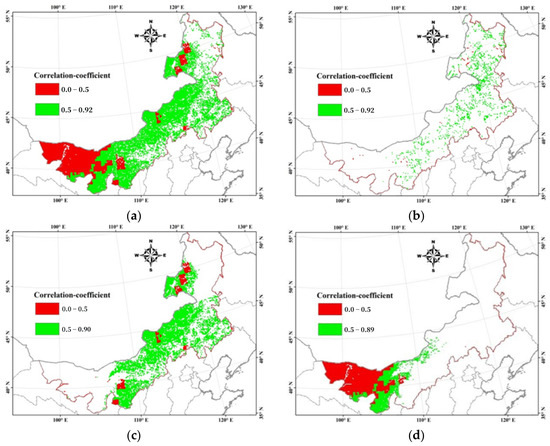
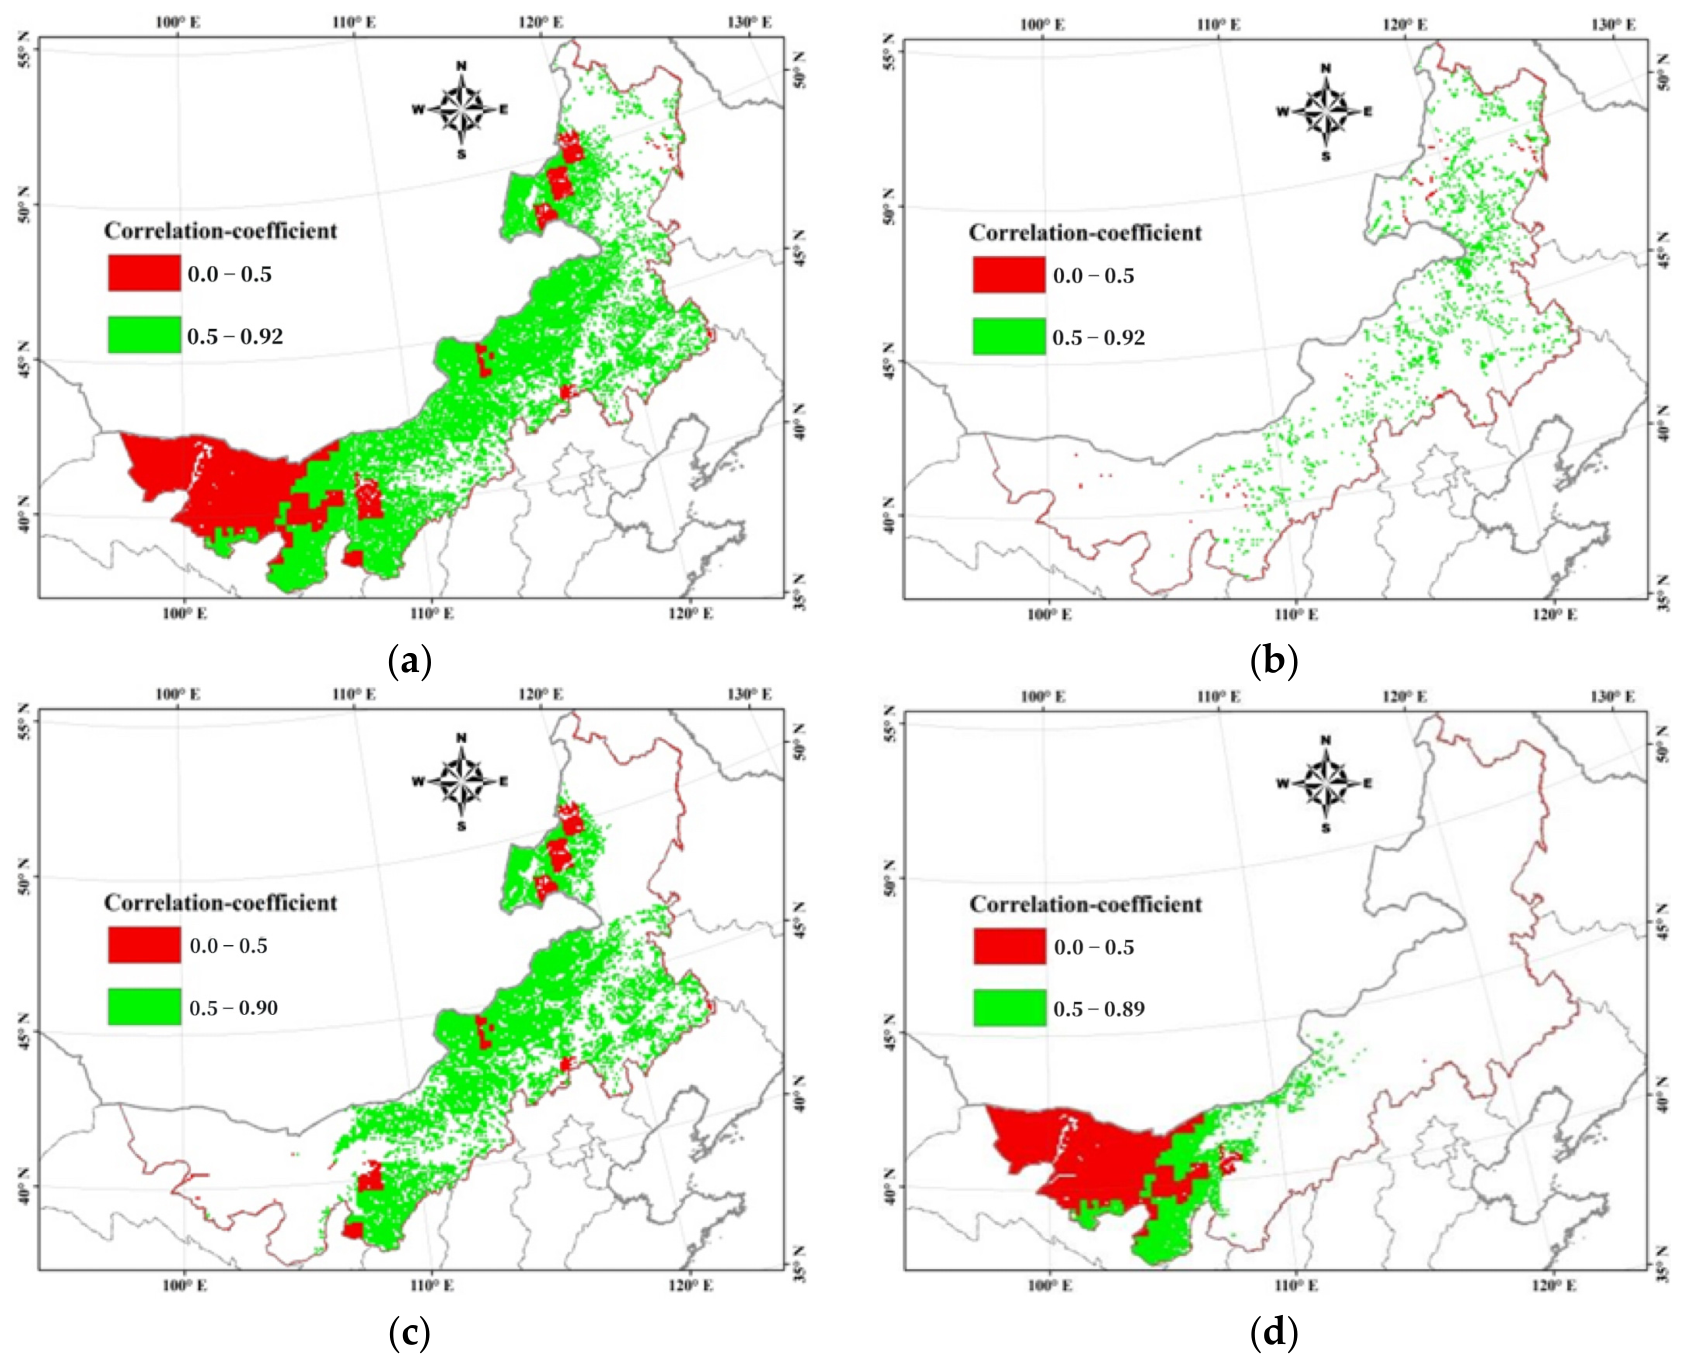
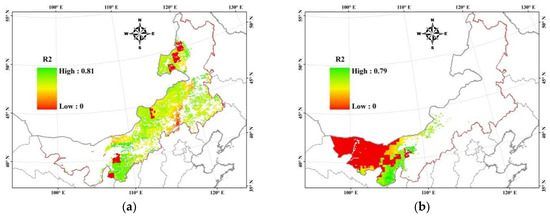
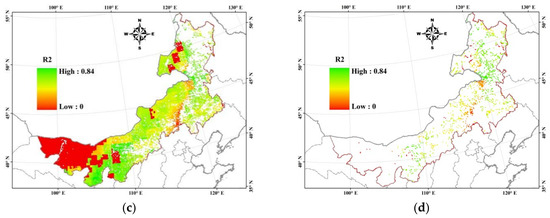
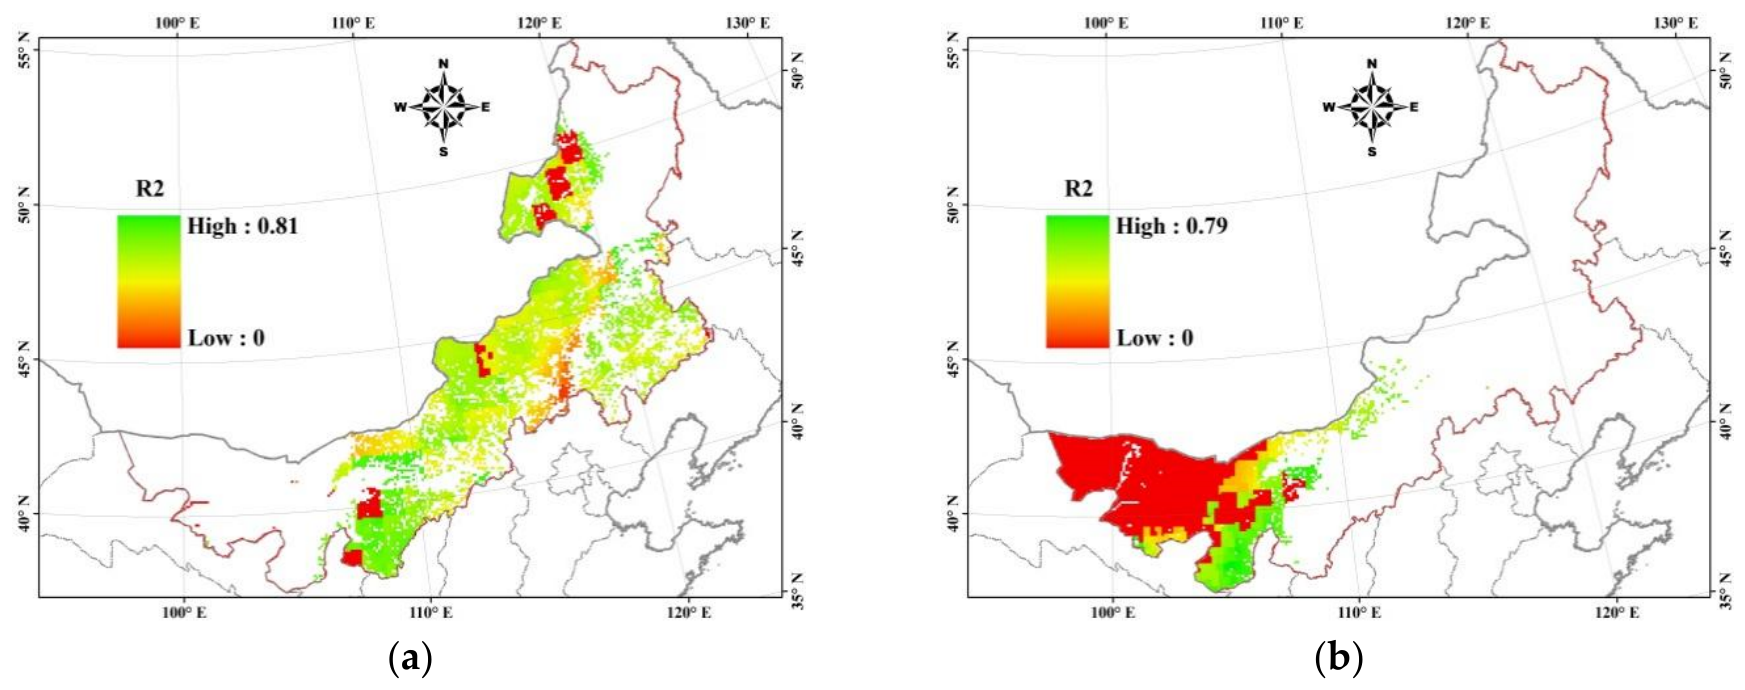
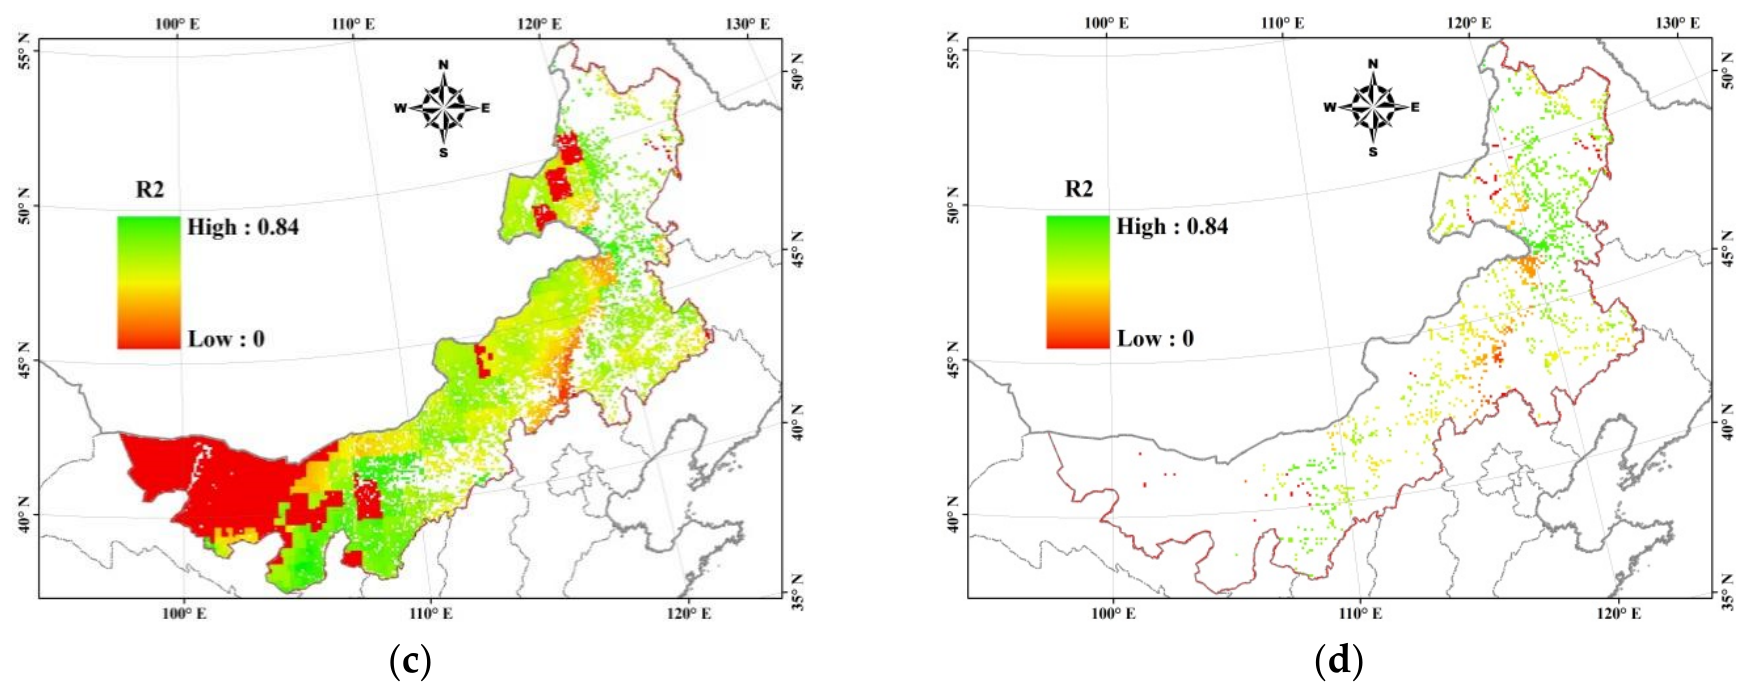
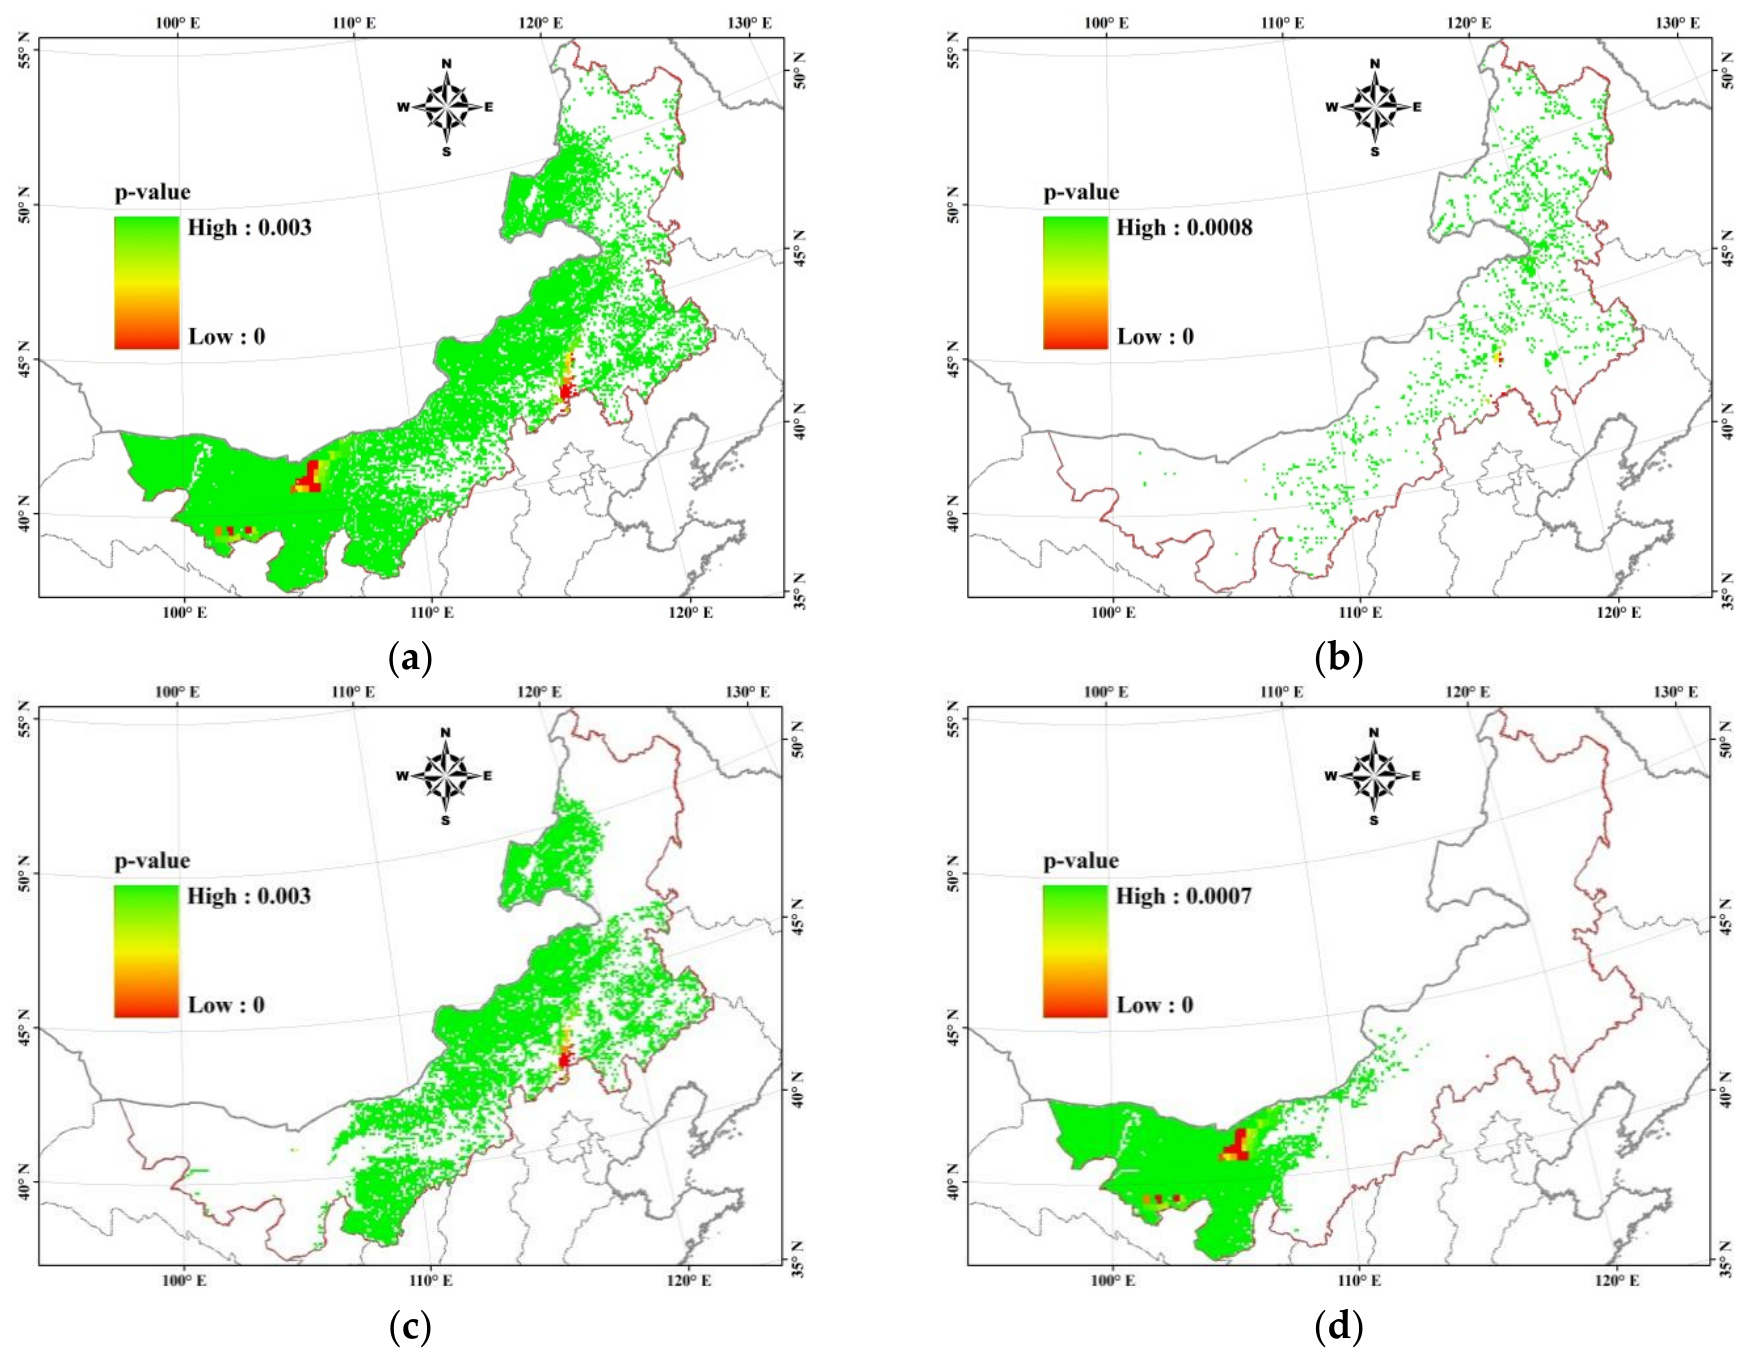
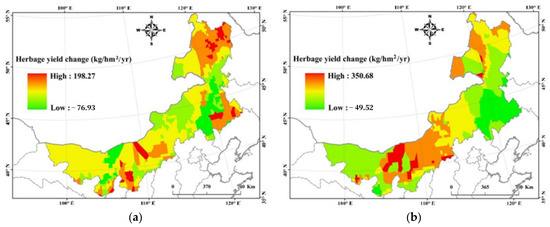
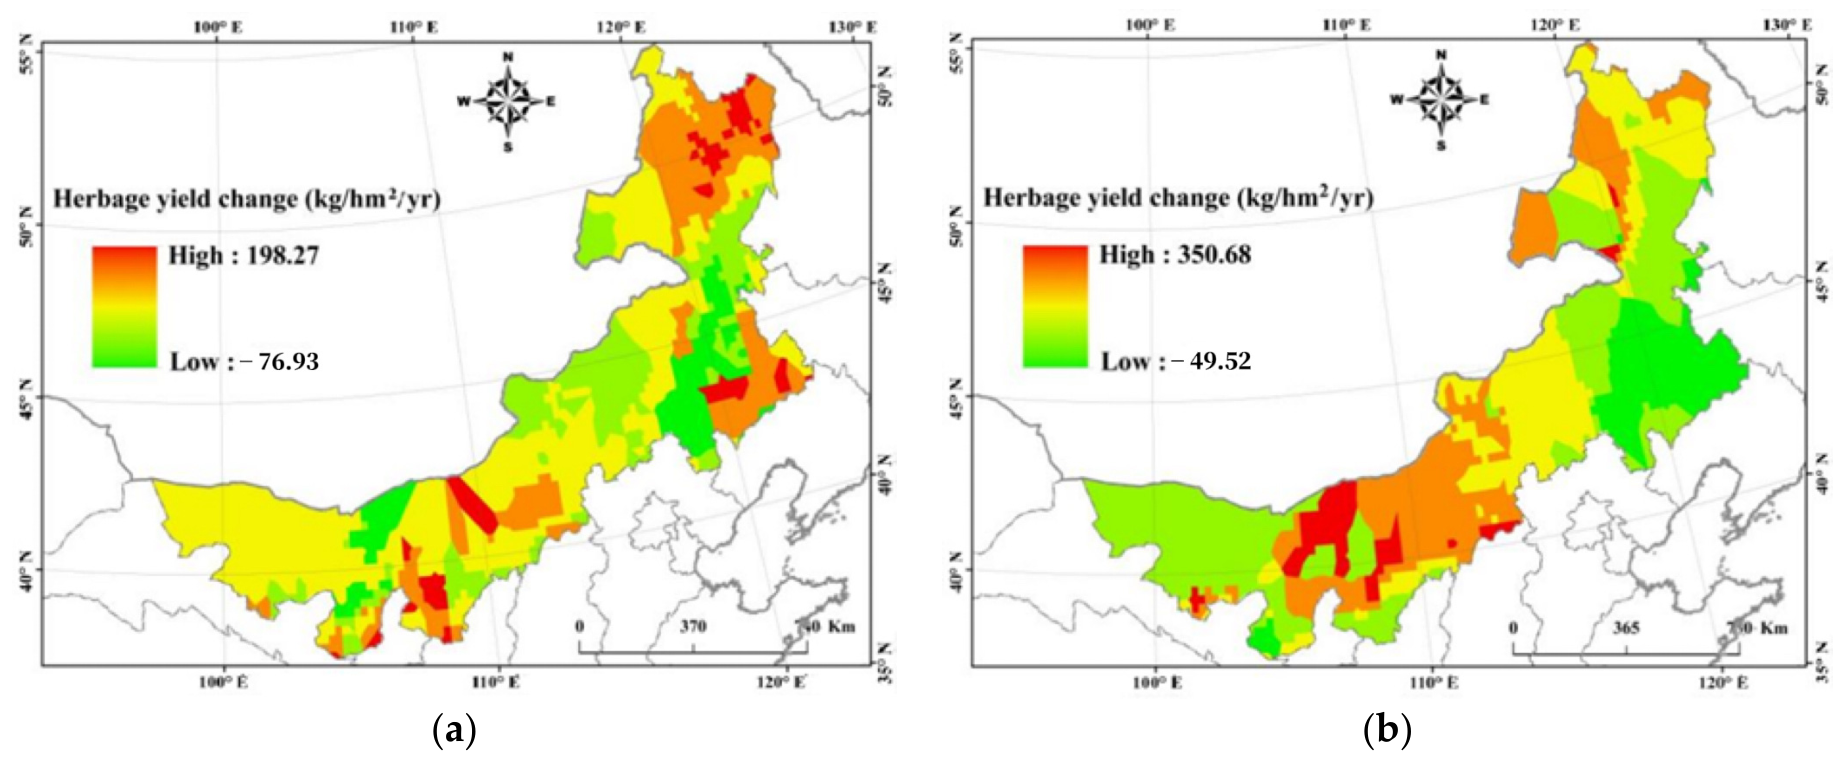
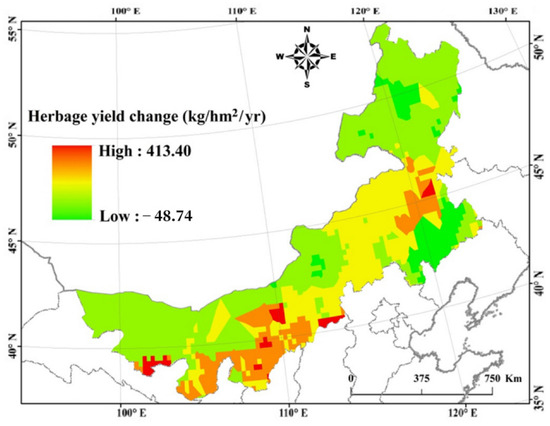
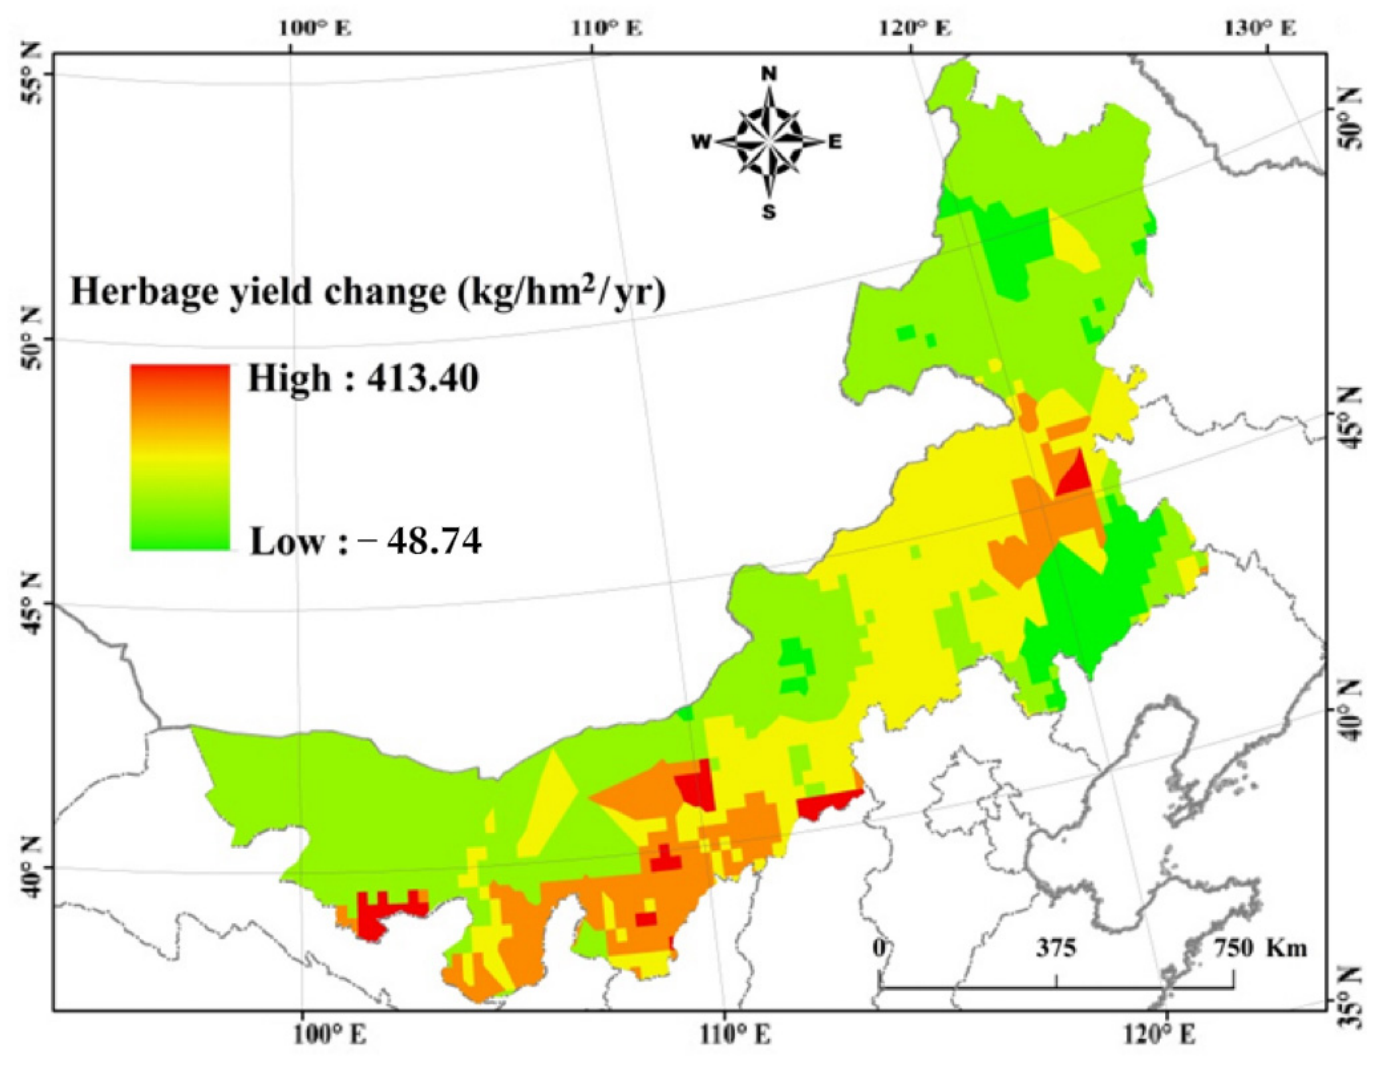
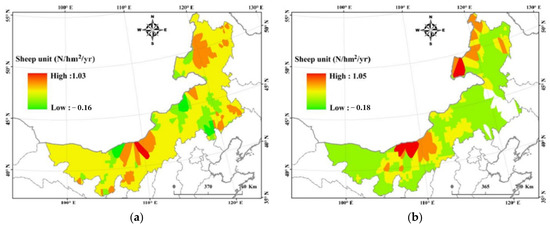
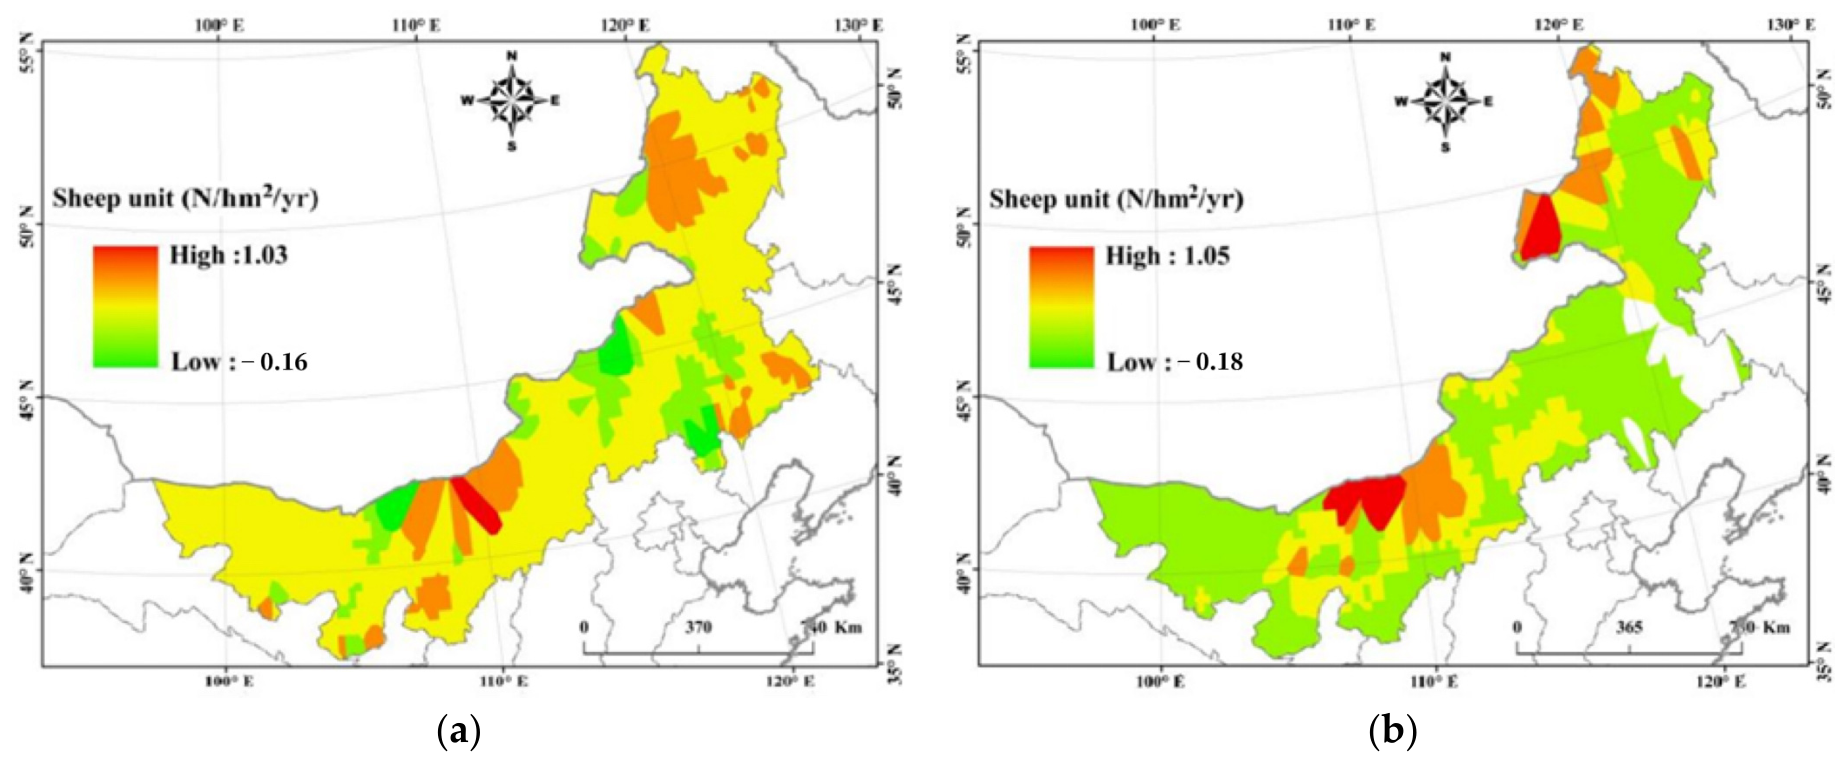
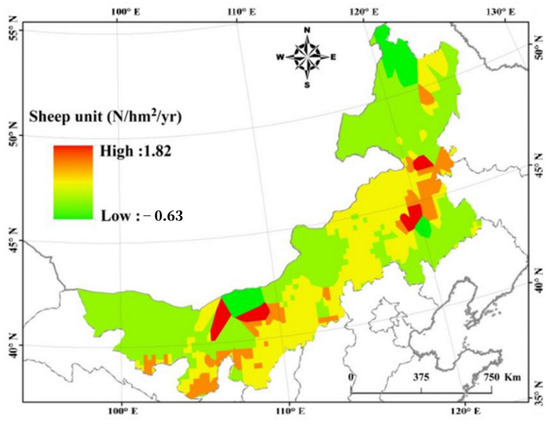
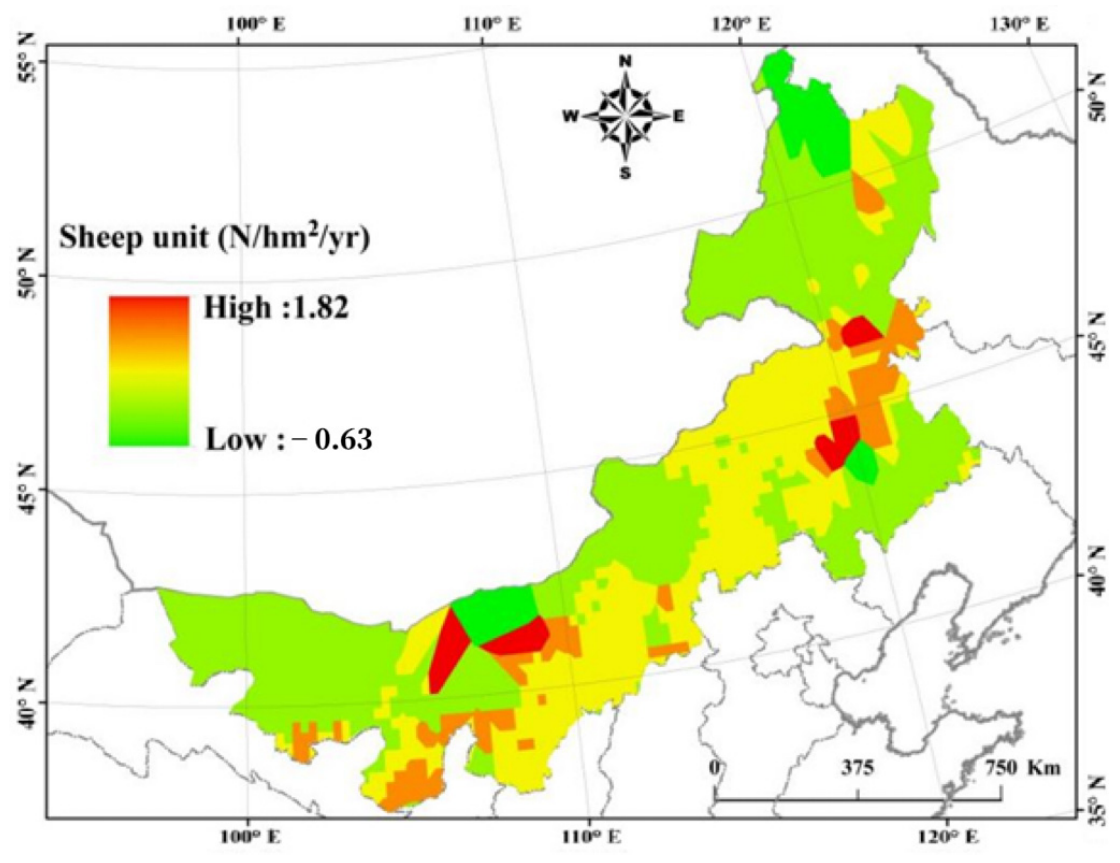
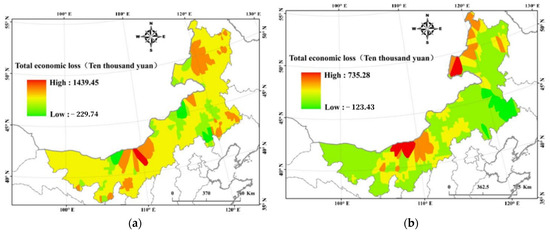
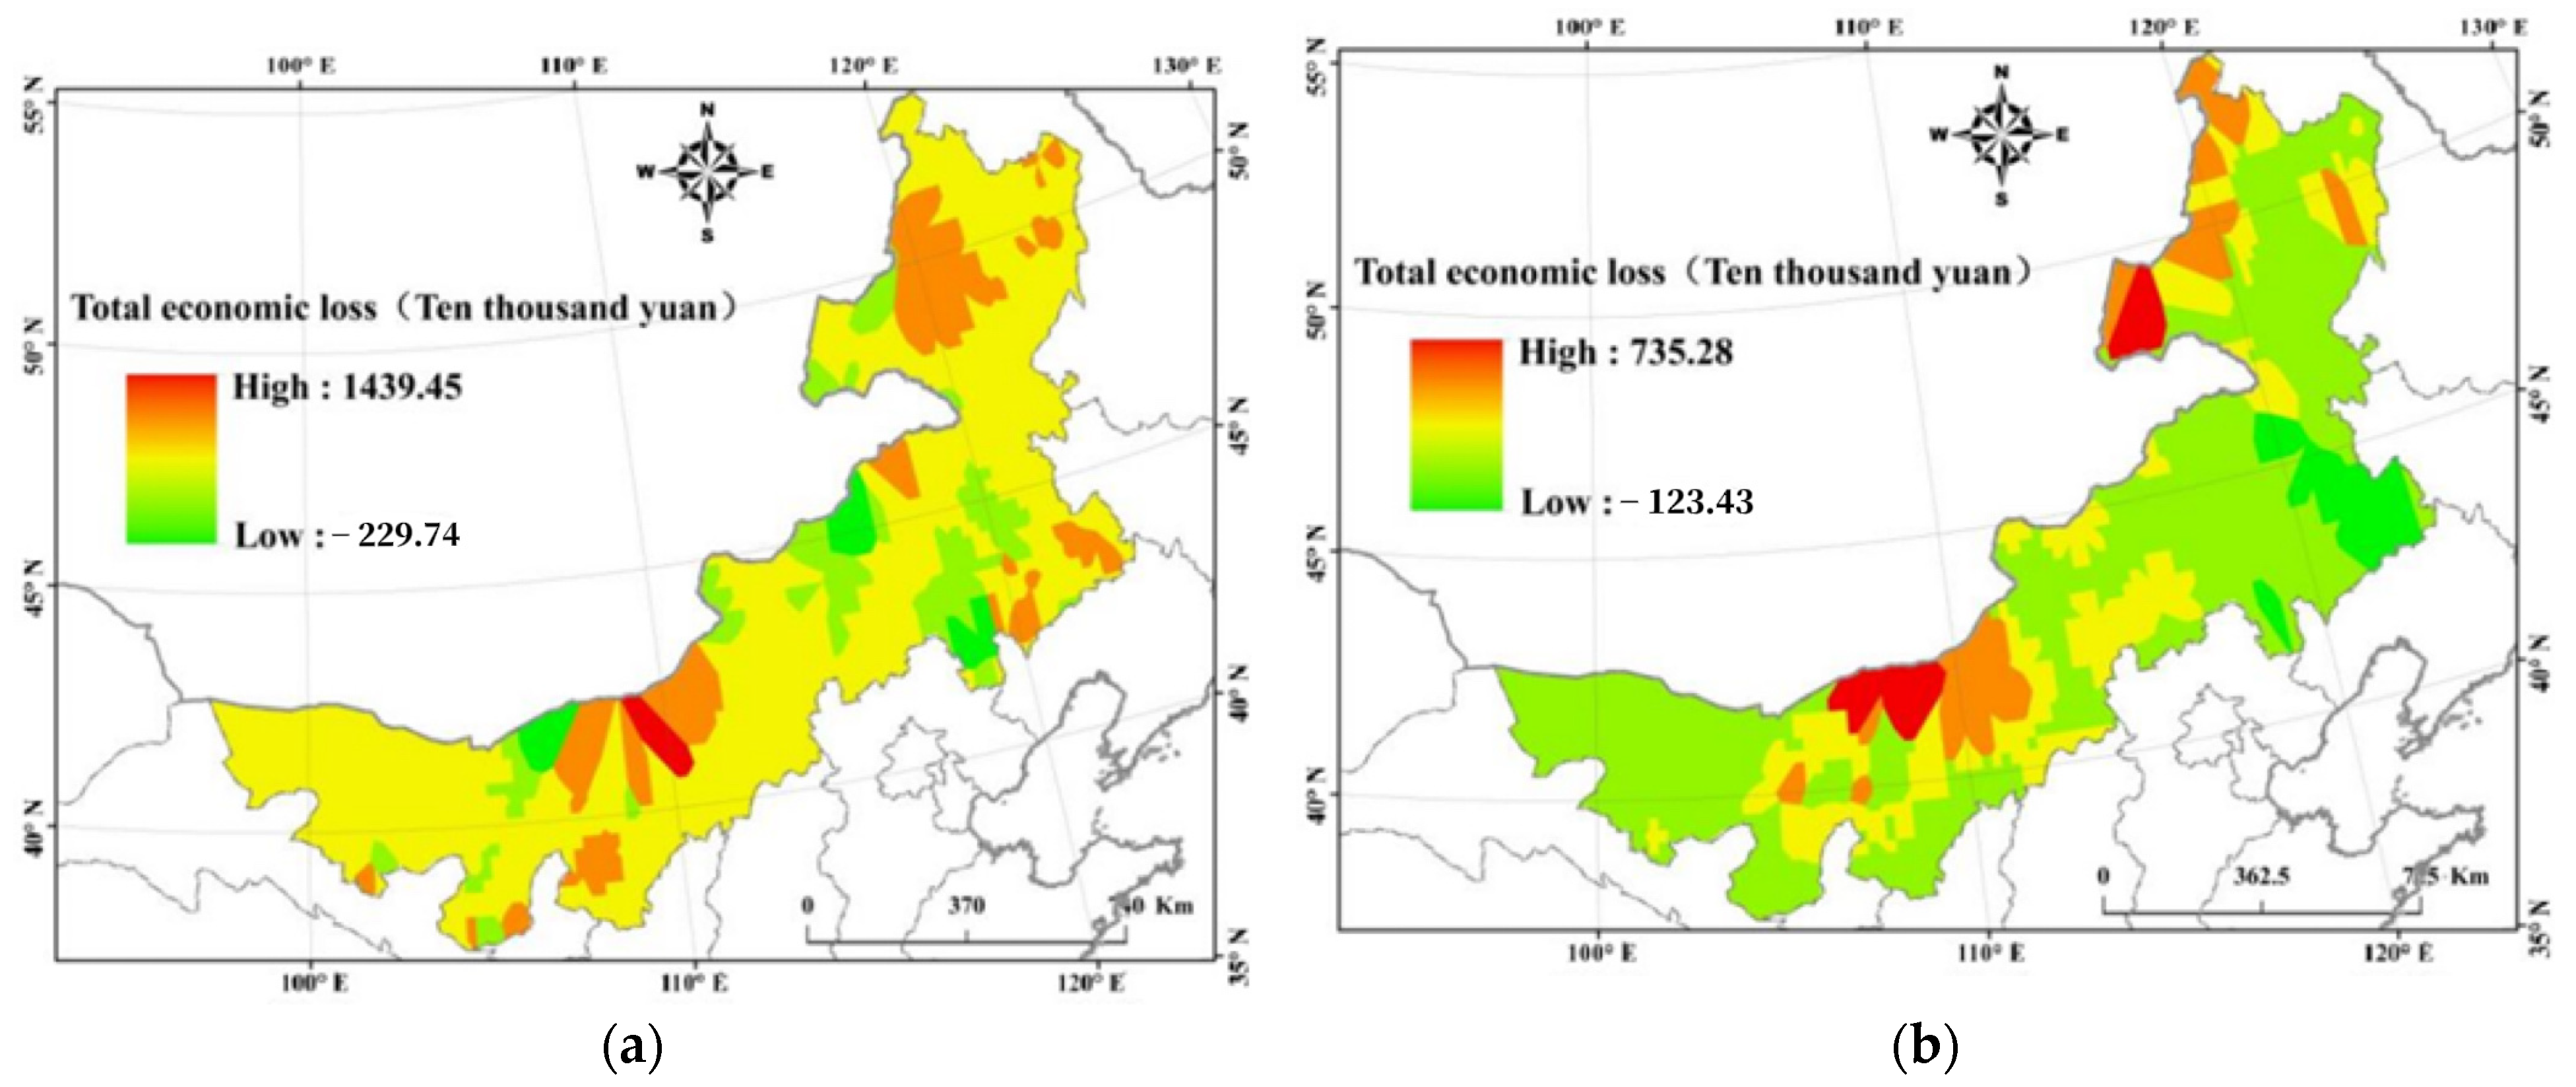
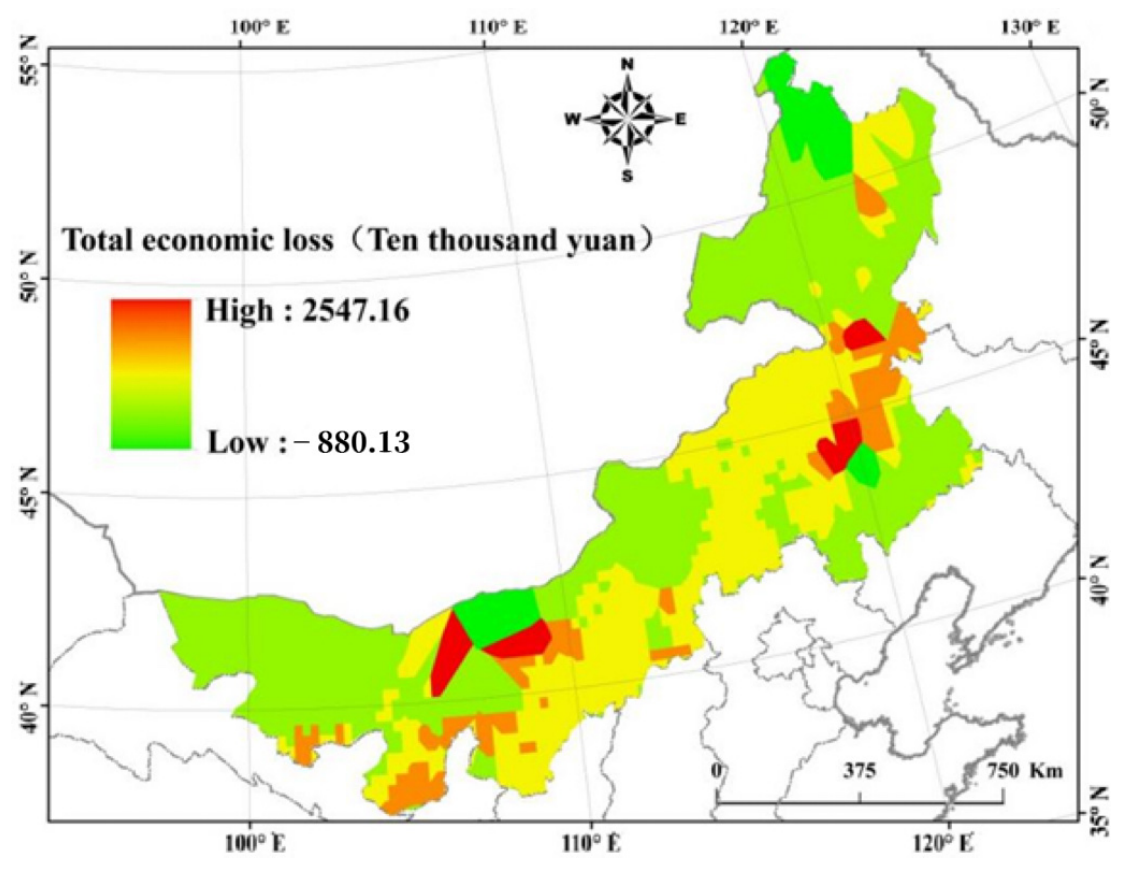

Disclaimer/Publisher’s Note: The statements, opinions and data contained in all publications are solely those of the individual author(s) and contributor(s) and not of MDPI and/or the editor(s). MDPI and/or the editor(s) disclaim responsibility for any injury to people or property resulting from any ideas, methods, instructions or products referred to in the content. |
© 2026 by the authors. Licensee MDPI, Basel, Switzerland. This article is an open access article distributed under the terms and conditions of the Creative Commons Attribution (CC BY) license.