


Highlights
What are the main findings?
- Ecological quality from 2000 to 2025 remained predominantly at a medium level but exhibited an overall declining trend, characterized by degradation exceeding improvement and pronounced spatial clustering.
- Elevation, air temperature, and surface radiation constitute the dominant terrain–thermal control mechanism, exhibiting significant nonlinear interactions and spatial heterogeneity.
What are the implications of the main findings?
- Process-oriented index reconstruction substantially improves ecological assessment reliability in sparsely vegetated alpine–arid regions.
- The findings provide a robust scientific foundation and monitoring framework for the long-term protection of fragile alpine ecosystems and the strategic development of Qiangtang National Park.
Abstract
The Northern Tibetan Plateau is among the most climate-sensitive alpine regions globally. To address the limited applicability of the traditional Remote Sensing Ecological Index (RSEI) in sparsely vegetated areas, this study developed a Soil-Adjusted Remote Sensing Ecological Index (SRSEI) tailored to cold and arid environments. The ecological quality of the Northern Tibetan Plateau from 2000 to 2025 was systematically evaluated and analyzed. The results indicate that: (1) The improved SRSEI achieved a first principal component (PC1) contribution of 72.76%, a significant enhancement over traditional models that effectively mitigates noise from soil backgrounds and anthropogenic features. (2) Between 2000 and 2025, ecological quality was predominantly moderate, following a characterized east-to-west declining spatial gradient. Overall mean SRSEI values fluctuated between 0.420 and 0.476, exhibiting a marginal downward trend. (3) Ecological degradation affected 50.17% of the region, with 26.14% facing risks of sustained decline. Conversely, 40.11% of the area displayed potential recovery trends, suggesting potential spatial divergence in future ecological trajectories. (4) Regional ecological dynamics are governed by a topographic-thermal compound driving mechanism. Elevation (DEM), temperature (TEMP), and surface shortwave radiation (SRAD) emerged as the dominant explanatory variables. Furthermore, dual-factor interactions exhibited significant enhancement effects, while the influence of anthropogenic factors was comparatively weak at the regional scale. These findings provide a scientific basis for the long-term monitoring of fragile alpine ecosystems and the strategic development of the Qiangtang National Park.
1. Introduction
Ecological environmental quality (EEQ) is a critical metric for assessing ecosystem stability, resilience, and adaptability and is fundamentally linked to human survival and regional development [1]. Against the backdrop of accelerating global climate change and intensified anthropogenic pressures, ecosystem structures and functions are undergoing profound transformations [2,3]. Long-term and dynamic monitoring of typical ecologically fragile regions has therefore become a central concern in contemporary geography and ecology [4]. The evolution of ecological environmental quality results from the interplay of diverse natural processes and anthropogenic activities [5]. Systematic assessments are therefore essential for identifying degradation thresholds and elucidating driving mechanisms, providing a scientific foundation for regional ecological conservation and sustainable development [6,7].
The Qinghai–Tibet Plateau (QTP), known as the “Third Pole” and the “Water Tower of Asia” [8,9], serves as a critical ecological security barrier, playing a vital role in global climate regulation and water supply [10,11]. The northern Tibetan Plateau, located in the core hinterland of the Qinghai–Tibet Plateau, is characterized by extensive alpine meadow, steppe, and desert ecosystems. It represents one of the highest and most environmentally severe regions on Earth [12,13]. The climate is cold and arid, characterized by limited precipitation and strong evaporation. The ecosystem structure is relatively simple, and its overall stability and resistance to disturbance are inherently weak [14,15]. Recently, under the broader ‘warming and wetting’ trend of the QTP, the Northern Tibetan Plateau has undergone significant environmental shifts [16,17]. While numerous studies leveraging the Normalized Difference Vegetation Index (NDVI) have identified an overall ‘greening’ trend in this region, this phenomenon remains a subject of intense academic controversy. Whether increased greenness truly reflects a holistic improvement in eco-environmental quality is uncertain, as it may be offset by accompanying processes such as glacial retreat, permafrost degradation, and intensified surface desiccation [18,19]. These shifts introduce new complexities regarding ecosystem stability. Systematically clarifying the spatiotemporal dynamics and driving mechanisms of ecological environmental quality in this region is therefore of substantial practical importance for safeguarding ecological security and advancing the development of Qiangtang National Park [20,21].
A critical deficiency in existing research is the over–reliance on single–variable indicators, particularly NDVI, which may provide a fragmented or even misleading picture of ecological health [22]. In high-altitude, cold-arid environments like the Northern Tibetan Plateau, vegetation greenness is only one dimension of ecosystem function. A ‘greener’ landscape can coexist with rising land surface temperatures and declining soil moisture—factors that could signal underlying ecological stress rather than recovery [23,24]. Therefore, assessing ecological environmental quality (EEQ) solely through vegetation productivity often fails to capture the antagonistic effects between hydrothermal changes and biological responses. This underscores the urgent necessity for a comprehensive assessment framework that integrates multiple ecological dimensions to reconcile these apparent contradictions [25].
Ecosystems are complex, coupled systems [26], and single variable indicators often fail to capture their comprehensive state [27]. To enhance objectivity, researchers have developed various composite models leveraging multi-source remote sensing data [28], such as the Ecological Index (EI) [29] and the Watershed Ecological Security Index (WESI) [30]. Among these, the Remote Sensing Ecological Index (RSEI), originally proposed by Xu, has been widely applied across urban areas [31], mining regions [32], and nature reserves [33] due to its structural simplicity, objective weighting scheme, and accessible data requirements. By integrating greenness (NDVI), wetness (WET), dryness (NDBSI), and heat (LST), and employing principal component analysis (PCA) for objective weighting, the RSEI effectively reduces subjective interference [34]. However, subsequent research has demonstrated that universal models may not be universally applicable. Indicator reconstruction tailored to specific environmental contexts has therefore emerged as an important approach to improving assessment accuracy [35,36]. Modified frameworks such as the ERSEI for arid regions [37] and the TRSEI incorporating three-dimensional information [38] illustrate ongoing efforts to refine ecological evaluation in complex environments.
Despite its broad applicability, the conventional RSEI framework exhibits notable limitations in alpine–arid environments such as the Northern Tibetan Plateau [39]. First, under sparse vegetation conditions, the NDVI is highly susceptible to soil background effects, reducing its sensitivity to subtle greenness variations [40]. Second, the dryness component (NDBSI), typically derived from a combination of the Bare Soil Index (SI) and the Index-based Built-up Index (IBI) [41], may introduce unnecessary noise in sparsely populated regions where built-up land is minimal and lacks ecological relevance [42,43]. More importantly, few studies have systematically optimized the RSEI framework to accommodate the biophysical characteristics of high-altitude cold–arid ecosystems. Consequently, a region-specific modification of the RSEI is required to enhance its applicability and interpretability in the Northern Tibetan Plateau.
To address these limitations, this study develops a Soil-Adjusted Remote Sensing Ecological Index (SRSEI) tailored to alpine–arid conditions. Specifically, the NDVI is replaced with the Soil Adjusted Vegetation Index (SAVI), which improves sensitivity under low vegetation cover [44,45], and the Bare Soil Index is isolated to more accurately characterize surface exposure. Based on long-term MODIS time-series data (2000–2025) processed on the Google Earth Engine (GEE) platform, the SRSEI is constructed to evaluate the spatiotemporal evolution of EEQ across the Northern Tibetan Plateau. Theil–Sen trend analysis, Mann–Kendall significance testing, and the Hurst exponent are employed to quantify ecological trends and persistence. Furthermore, an Optimal Parameters-based Geographical Detector (OPGD) model combined with a Multiscale Geographically Weighted Regression (MGWR) model is applied to identify dominant driving factors and reveal spatial heterogeneity. By integrating methodological refinement with multi-scale driver analysis, this study provides a robust ecological assessment framework for high-altitude fragile regions and offers scientific support for long-term environmental governance in the Northern Tibetan Plateau.
2. Materials and Methods
2.1. Study Area
Located in the northwestern hinterland of the Qinghai–Tibet Plateau (QTP), the study area encompasses the Northern Tibetan Plateau (NTP). In this paper, we define the NTP based on the administrative boundaries of Nagqu City and Ngari Prefecture (29°39′–36°30′ N, 78°22′–95°30′ E; Figure 1). This region is geographically and ecologically consistent with the Qiangtang Plateau, a term often used to describe this high-altitude endorheic basin. To ensure clarity for the reader, ‘Northern Tibetan Plateau’ will be used hereafter to refer to the specific administrative scope of this study, which also encompasses the core areas of the Qiangtang National Park.
Figure 1.
Geographical location of the study area.
Covering approximately 662.59 × 10³ km2 with a mean elevation exceeding 4900 m above sea level, the region is characterized by a cold arid to semi-arid continental climate. Due to its extreme altitude and topographical isolation, it experiences hypoxia (thin air), low temperatures, and distinct seasonal moisture fluctuations, frequently accompanied by strong winds. The annual sunshine duration ranges from 2800 to 3400 h, while mean annual precipitation varies between 50 and 300 mm, following a pronounced southeast-to-northwest decreasing gradient. According to the MODIS MCD12Q1 product, alpine desert and barren land dominate the region (49.07%), followed by alpine grasslands (steppe and meadow, 46.46%), while other types (e.g., glaciers, water, and wetlands) account for 4.47%. This landscape, characterized by sparse vegetation and extensive bare soil, is highly sensitive to climate change [46].
2.2. Data Sources and Preprocessing
For this study, a comprehensive spatial-temporal database was established covering the 2000–2025 period. Crucially, to ensure statistical robustness for trend analysis and to capture fine-grained interannual variability, the SRSEI was derived as a continuous annual sequence (n = 26) rather than relying on discrete multi-year intervals. The SRSEI was constructed using MODIS growing-season composites processed via the Google Earth Engine (GEE) platform (Google, Mountain View, CA, USA). Natural drivers include topographic variables derived from SRTM-DEM, meteorological factors from ERA5-LAND, precipitation data from CHIRPS, and drought and radiation variables from TerraClimate. Anthropogenic drivers comprise MODIS land-use data, LandScan population density, and harmonized nighttime light (NTL) data.
To harmonize the heterogeneous data across disparate spatial scales and projections, all raster datasets underwent standardized preprocessing [47]. This included cloud and water body masking, pixel-wise mean compositing for the growing season, coordinate system unification, and spatial resampling. All spatial analysis and preprocessing steps were performed using ArcMap 10.8 (Esri, Redlands, CA, USA), and statistical coding and model implementation were conducted using PyCharm Community Edition 2024.3 (JetBrains, Prague, Czech Republic). Detailed parameters for these datasets are summarized in Table 1 [48].
Table 1.
Data information and sources.
2.3. Methods
As illustrated in Figure 2, the methodological framework consists of three main steps. (1) Principal component analysis was applied to integrate greenness (SAVI), wetness (WET), dryness (SI), and heat (LST) into a Soil-Adjusted Remote Sensing Ecological Index (SRSEI) to assess ecological environmental quality from 2000 to 2025. (2) The long-term SRSEI dataset was quantitatively evaluated for spatiotemporal dynamics and prospective trajectories through the integrated application of the Theil–Sen trend estimator, the Mann–Kendall significance test, and the Hurst exponent. (3) The Optimal Parameters-based Geographical Detector (OPGD) and Multiscale Geographically Weighted Regression (MGWR) models were introduced to elucidate the response mechanisms of ecological quality to natural and anthropogenic drivers from the perspectives of global interaction and local spatial heterogeneity.
Figure 2.
Research technical framework.
2.3.1. Construction of the SRSEI Model
Based on the improved Soil-Adjusted Remote Sensing Ecological Index (SRSEI), four component indicators—greenness (SAVI), wetness (WET), dryness (SI), and heat (LST)—were derived [44,49,50,51]. To ensure methodological transparency, reproducibility, and temporal comparability, the construction of the SRSEI followed a rigorous four-stage protocol:
(1) Indicator Derivation and Parameter Setting: The indicators were calculated according to the formulas summarized in Table 2. Specifically, for the Soil Adjusted Vegetation Index (SAVI), the soil adjustment factor L was set to 0.5. This configuration is optimal for the Northern Tibetan Plateau, where nearly 50% of the landscape is composed of bare soil or alpine desert, as it effectively minimizes soil background noise while maintaining high sensitivity to sparse vegetation dynamics.
Table 2.
Index calculation formula.
(2) Dimensional Normalization: To eliminate inconsistencies in units and scales, all four initial indicators were normalized to a range of [0, 1] using Min–Max scaling [52]. This step ensures that each indicator contributes equitably to the subsequent multivariate analysis.
(3) Information Integration via Annual PCA: Principal Component Analysis (PCA) was performed separately for each year using the covariance matrix of the standardized indicators. This annual PCA approach allows the model to dynamically capture the dominant environmental variance and the specific ecological baseline of each target year, which is more representative than a static global weight in a rapidly changing alpine environment [53].
(4) Directional Correction and Comparability Standardization: To ensure interannual comparability and eliminate potential directional bias, two post-processing steps were strictly executed. First, the loading direction of the first principal component (PC1) was unified: if the SAVI loading was positive, PC1 was directly extracted as the initial index ( [54]; if negative, an inverse transformation ( was applied to restore ecological interpretability. Second, was normalized to a standard [0, 1] range based on annual extreme values. As verified by the loading structures in Table 3, the contribution directions and magnitudes of all indicators remained highly stable throughout the 2000–2025 series, confirming that temporal comparability was effectively preserved [55].
Table 3.
Principal component analysis (PCA) results and loading structures for RSEI and SRSEI.
ranges from 0 to 1, with higher values indicating better ecological environmental quality and lower values reflecting poorer conditions.
2.3.2. Theil–Sen Slope Estimator and Mann–Kendall Test
To quantify the long-term dynamics of the SRSEI, the Theil–Sen slope estimator and Mann–Kendall test were applied to the pixel-wise annual time series from 2000 to 2025 (n = 26). This full-sequence approach allows for the detection of statistically significant trends while capturing interannual ecological variability [56]. The Theil–Sen approach derives trend magnitude as the median of slopes calculated between all pairwise temporal observations, providing robust resistance to outliers and non-normality [57]. The Mann–Kendall test evaluates trend significance by constructing the test statistic S and its standardized form Z, thereby determining whether the detected trend is statistically significant [58].
where denotes the trend slope, and and represent the ecological index in year and year , respectively. A positive indicates an improving trend in ecological conditions, whereas a negative signifies a declining trend.
where denotes the Mann–Kendall test statistic, is the standardized statistic, represents the variance of , and is the number of observations in the time series. When || > 1.96, the trend in the SRSEI is statistically significant at the 95% confidence level.
2.3.3. Hurst Exponent Analysis
In addition to identifying trend direction, the Hurst exponent based on rescaled range (R/S) analysis was employed to assess the persistence of the SRSEI time series [59,60]. The value of H is obtained through least-squares regression. An H value > 0.5 indicates positive persistence, while H < 0.5 suggests anti-persistence, as expressed by the following formulation.
Define a time series (t = 1, 2, …, n). For any , the mean sequence is calculated:
Calculate the cumulative deviation:
Define the range and the standard deviation:
H is derived from the following power-law relationship:
where denotes the mean ecological index over the time interval , represents the cumulative deviation from the mean, indicates the range of cumulative deviations, represents the standard deviation of the series, is the Hurst exponent, and is a constant.
2.3.4. Optimal Parameter-Based Geographical Detector (OPGD)
To analyze the underlying mechanisms of ecological change, 15 driving factors were selected across topographic, meteorological, soil, and anthropogenic dimensions. Topographic factors (DEM, Slope, Aspect) define the environmental template by regulating water and energy redistribution. Meteorological variables (TEMP, PRE, SRAD, ETP, WIND, and PDSI) impose direct hydrothermal constraints on alpine vegetation. Crucially, in the fragile alpine environment of the Northern Tibetan Plateau, soil temperature (ST) and soil moisture (SM) serve as fundamental drivers; they regulate permafrost active layer dynamics and soil nutrient availability, which are vital for plant survival in extreme cold-arid conditions. Anthropogenic factors (LUCC, POP, and NightLight) represent human pressures such as grazing and infrastructure.
The OPGD enhances the stability and reliability of factor detection by automatically optimizing discretization schemes and the number of classes for continuous variables [61]. Continuous variables were stratified into 3–10 categories, with discretization optimized to maximize the q-statistic. The q value ranges from 0 to 1, and higher values indicate stronger explanatory power of the driving factor [62]. In addition to single-factor detection, OPGD facilitates interaction detection to evaluate synergistic or nonlinear effects between pairs of driving variables [63], as expressed by the following formulation.
where denotes the q-statistic of the Geographical Detector, represents the category, is the number of strata, and are the number of units in stratum and in the entire study area, respectively, and denote the variance of the dependent variable within stratum and across the whole study area, respectively.
2.3.5. Multiscale Geographically Weighted Regression (MGWR)
MGWR is a local regression framework designed to capture spatially non-stationary relationships [64,65]. The model employs an adaptive bi-square kernel, and bandwidths are independently optimized for each explanatory variable using the corrected Akaike Information Criterion (AICc). Unlike conventional GWR, MGWR allows each predictor to operate at its own spatial scale, thereby providing a more precise characterization of how different drivers influence the SRSEI across varying spatial extents [66].
where denotes the dependent variable SRSEI, represents the -th explanatory variable for sample , are the spatial coordinates of the -th sample, is the regression coefficient, denotes the optimal bandwidth for variable , and is the random error term.
3. Results
3.1. Applicability and Validity of the Improved SRSEI
A comparison of the PCA results for the RSEI and SRSEI from 2000 to 2025 (Table 3) demonstrates that the SRSEI exhibits stronger information integration capacity than the conventional RSEI. The mean contribution of PC1 in the traditional RSEI is approximately 65.76% (ranging from 60.67% to 70.01%), whereas the SRSEI increases this value to 72.76% (69.24–75.96%), representing an improvement of about seven percentage points. This indicates that the refined index achieves substantially greater efficiency in information extraction and comprehensive representation.
Both models maintain ecological consistency in their loading structures: greenness (NDVI/SAVI) and wetness (WET) contribute positively, while heat (LST) and dryness (NDBSI/SI) exert negative effects. In the traditional RSEI, NDBSI loadings approach zero (−0.0003 to −0.0016), indicating a negligible contribution to the composite index in this region. Conversely, the SRSEI replaces the NDBSI with SI, whose loading magnitudes increase significantly (−0.0716 to −0.3788), markedly enhancing sensitivity to bare soil and surface degradation. Furthermore, the stabilized loading patterns of SAVI and WET bolster the index’s responsiveness under sparsely vegetated conditions. LST consistently exhibits a pronounced negative loading in both models, confirming that thermal conditions remain a critical determinant of ecological environmental quality.
To independently validate the ecological significance of the improved index, we performed a pixel-wise correlation analysis against Fractional Vegetation Cover (FVC). As shown in Figure 3a,b, the multi-year mean SRSEI (2000–2025) exhibits a stronger spatial alignment with FVC (r = 0.242, p < 0.001) than the traditional RSEI (r = 0.229, p < 0.001) based on 1000 random samples. This long-term average comparison confirms that the structural reconstruction of the SRSEI successfully captures the fundamental ecological patterns of the Northern Tibetan Plateau. Furthermore, the interannual trajectory (Figure 3c) reveals that the SRSEI consistently outperforms the RSEI in 23 out of 26 years. The SRSEI outperformed the RSEI in the vast majority of the study period (23 out of 26 years). Although the traditional RSEI exhibited slightly higher correlation coefficients in a few climatically extreme years (e.g., 2007 and 2025), the SRSEI provided a more stable and consistently positive representation of ecological quality. The mean correlation coefficient of the SRSEI (r = 0.292) remained higher than that of the RSEI (r = 0.231), confirming its overall structural superiority.
Figure 3.
Validation of SRSEI and RSEI against FVC. (a,b) Validation of the 26-year mean (2000–2025) SRSEI (a) and RSEI (b) against FVC (n = 1000); (c) interannual correlation coefficients (r) from 2000 to 2025 (n = 26). The red dashed lines in (a,b) represent the linear regression fits.
3.2. Spatiotemporal Evolution of Ecological Environmental Quality
To quantitatively evaluate and compare the spatial distribution of ecological quality, SRSEI values were categorized into five grades based on the equal interval method with a step of 0.2: Poor (0–0.2), Fair (0.2–0.4), Moderate (0.4–0.6), Good (0.6–0.8), and Excellent (0.8–1.0) [67]. This classification standard is consistent with established practices in Remote Sensing Ecological Index research. Unlike relative classification methods (e.g., Natural Breaks), the equal interval approach provides a consistent and absolute benchmark, ensuring that changes in class proportions across the 2000–2025 period reflect actual ecological shifts rather than relative statistical redistributions.
The spatial distribution shown in Figure 4 reveals a pronounced east–west gradient in the SRSEI, characterized by higher values in the east and lower values in the west. This pattern closely corresponds to the regional hydrothermal gradient. Areas classified as “good” and “excellent” are predominantly concentrated in eastern Nagqu (e.g., Jiali and Biru), where relatively abundant precipitation supports alpine meadow ecosystems with high vegetation cover, sustaining comparatively favorable ecological conditions over time. In contrast, low-value areas are widely distributed across western Ngari and southwestern Nagqu (e.g., Nyima and Shuanghu). These inland regions are characterized by harsh hydrothermal conditions, extensive alpine desert and bare land surfaces, and a fragile ecological foundation. Long-term dynamics indicate that the boundaries of high-quality ecological cores in the east remain relatively stable, whereas substantial spatial fluctuations occur in the western alpine desert and central transitional zones. Patches classified as “poor” show a tendency to expand eastward, suggesting a gradual degradation of the regional ecological structure.
Figure 4.
Spatial Distribution Pattern of SRSEI in the Northern Tibetan Plateau from 2000 to 2025.
The classification results (Figure 5a) indicate that the medium category has consistently dominated, accounting for 42.93% to 57.83% of the total area and forming the structural backbone of the regional ecological pattern. The combined proportion of “poor” and “fair” classes increased markedly from 24.69% in 2000 to 41.25% in 2025. Meanwhile, the share of “good” and “excellent” areas declined from 17.48% to 10.55%, with the “Excellent” class remaining marginal (<2%). These results suggest that high-quality ecological zones remain limited in extent and that the overall ecological structure has progressively shifted toward lower grades.
Figure 5.
Multi-dimensional spatiotemporal dynamics of SRSEI in the Northern Tibetan Plateau (2000–2025). (a) Annual proportions of the five ecological quality grades; (b) Interannual variation trends of mean SRSEI and its four component indicators (SAVI, WET, LST, SI); (c) Empirical Cumulative Distribution Function (ECDF) curves of SRSEI for six representative years; (d) County-level spatial distribution of mean SRSEI; (e) Comparative circular heatmap illustrating the relative ecological status of Nagqu (NQ) and Ngari (AL) counties.
As illustrated in Figure 5b, the interannual trend of the mean SRSEI exhibited distinct phased characteristics. From 2000 to 2015, the region underwent a significant ecological decline, with the mean SRSEI dropping from 0.476 to 0.428. However, after 2015, this downward trajectory visibly slowed, entering a period of relative stabilization and local recovery (2015–2025), with the index fluctuating around 0.420–0.435. This inflection point suggests a shift in the balance between environmental stress and ecosystem resilience. Examining the component indices separately, LST, representing surface thermal conditions, increased steadily from 0.579 to 0.642 over the study period. In contrast, WET and SAVI, which reflect surface moisture status and vegetation greenness, showed declining tendencies, reaching values of 0.181 and 0.530, respectively. The soil index (SI) remained at comparatively high levels throughout the period. These internal component variations describe the structural evolution of the SRSEI over time. The ECDF (Figure 5c) further quantifies these pixel-scale probability shifts. The ECDF curves for all years follow a smooth S-shape, with SRSEI values concentrated primarily between 0.3 and 0.7. The 2000 curve is positioned further to the right, reflecting a higher frequency of mid-to-high value pixels. Conversely, the 2015 and 2025 curves exhibit a pronounced leftward shift, particularly in the 0.2–0.4 interval, signifying an increased prevalence of low-value pixels and intensifying local degradation risks.
Spatial patterns (Figure 5d,e) underscore a persistent “east–west dichotomy,” with Nagqu (NQ) consistently outperforming Ngari (AL). The mean SRSEI in Nagqu (0.49–0.53) remains significantly higher than in Ngari (0.38–0.45). Regionally, the SRSEI follows a pronounced southeast–northwest decreasing gradient: high-value clusters—including Jiali (0.6748) and Biru (0.6153)—are concentrated in eastern alpine meadows, whereas northwestern Ngari counties like Zanda (0.3540) and Gar (0.3586) persistently remain below the 0.40 threshold. This distribution further highlights pronounced administrative heterogeneity across the plateau.
The spatial distribution of the SRSEI demonstrates strong coupling with land-cover types (Figure 6a–c). Quantitative analysis reveals a clear hierarchical pattern in mean ecological quality across land-use categories: forest (0.6462) > moss (0.6110) > grassland (0.4837) > bare land (0.4389). This gradient closely reflects the natural decline in vegetation biomass and the increasing degree of desertification from southeast to northwest across the alpine semi-arid region.
Figure 6.
Relationship between land cover and SRSEI. (a) Spatial distribution of land cover types. (b) Mean SRSEI values for different land covers. (c) Texture and spatial details of typical regions (I–IV).
To further decode the spatial-temporal heterogeneity of ecological quality, we conducted a stratified analysis based on frozen ground types (Figure 7). The results reveal a profound “ecological disparity” governed by the cryospheric template. Spatially, the high-value SRSEI clusters (Figure 7b) exhibit a high degree of overlap with the continuous permafrost zones (Figure 7a), primarily distributed in the high-altitude hinterland. Quantitatively, the mean SRSEI of permafrost regions (0.533) is significantly higher than that of seasonally frozen ground (0.362), establishing permafrost as the foundational support for high-quality habitats on the Northern Tibetan Plateau.
Figure 7.
Relationship between frozen ground types and SRSEI. (a) Spatial distribution of permafrost and seasonally frozen ground; (b) spatial distribution of the annual mean SRSEI; (c) interannual variation in mean SRSEI for different frozen ground categories from 2000 to 2025.
The temporal trajectories (Figure 7c) show that both frozen ground types underwent synchronized fluctuations throughout 2000–2025, but with distinct “resilience signatures.” During the extreme dry/hot period around 2015, the SRSEI in seasonally frozen areas plummeted to its lowest point (~0.29), whereas permafrost regions maintained a higher ecological trough (~0.49). This indicates that permafrost acts as a critical ecological buffer, mitigating the impact of climatic extremes. However, the observable downward trend in permafrost SRSEI toward 2025 suggests a weakening of this buffering capacity, likely due to the accelerating degradation of the cryospheric system under regional warming.
The Sankey diagram (Figure 8) illustrates the transition pathways governing changes in ecological quality classes. Transitions exhibit marked asymmetry, with degradation flows consistently exceeding improvements, resulting in a predominantly downward trajectory. Throughout 2000–2025, inter-class shifts were largely characterized by downward conversions. In particular, environmental pressures during 2000–2015 triggered substantial Medium-to-Fair transitions, reaching a peak in 2010–2015. Consequently, by 2015, the Fair class expanded to 312.85 × 10³ km2, while medium coverage declined to 36.69%. Although partial recovery was observed during 2015–2025—with 41.77 × 10³ km2 reverting from Fair to Medium—the overall structural imbalance persisted. The contraction of high-quality zones (Good and Excellent) alongside the expansion of lower-quality classes (Fair and Poor) defines this two-decade trajectory, highlighting escalating risks to ecosystem stability under ongoing climate warming.
Figure 8.
Sankey diagram of SRSEI level transfer matrix from 2000 to 2025.
3.3. Spatiotemporal Trend and Persistence Analysis
3.3.1. Sen’s Slope Estimation and Mann–Kendall Test
Based on Theil–Sen slope estimation and Mann–Kendall significance testing derived from the complete 26-year annual time series (n = 26) (Table 4), ecological environmental quality on the Northern Tibetan Plateau exhibits an overall declining trend from 2000 to 2025. Areas experiencing degradation cover 332.42 × 10³ km2, accounting for 50.17% of the study area. Among these, 9.32% show significant degradation, while 40.85% display non-significant decline. As illustrated in Figure 9, degradation is spatially concentrated in the southeastern and northwestern sectors, forming contiguous clusters.
Table 4.
Spatial distribution of SRSEI trend from 2000 to 2025.
Figure 9.
Trend dynamics of SRSEI in the Northern Tibetan Plateau (2000–2025). (a) Theil-Sen Median slope; (b) spatial classification of SRSEI trends; (c) spatial distribution of individual trend categories.
Areas exhibiting ecological improvement account for 162.67 × 10³ km2 (24.55%), of which 19.65% show non-significant increases and 4.90% significant increases. These improvement areas are primarily concentrated in the northern sector of the region. Approximately 25.28% of the study area exhibits no significant trend, largely distributed between zones of contrasting change and serving as transitional buffers.
3.3.2. Spatiotemporal Persistence Patterns
To assess the persistence of ecological quality, the Hurst exponent was calculated for each pixel using the continuous annual SRSEI sequence from 2000 to 2025 (n = 26). By overlaying this robust persistence indicator with the long-term Theil–Sen trend results derived from the same 26-year period, six categories of future evolutionary scenarios were identified (Figure 10, Table 5). Areas facing potential future degradation account for 33.61% of the study area. Of these, 26.14% are characterized by persistent degradation, spatially coinciding with the current southeastern degradation core and demonstrating strong trend continuity, while 7.47% are classified as likely future degradation, indicating latent risk.
Figure 10.
Future evolutionary scenarios of SRSEI in the Northern Tibetan Plateau. (a) Mann–Kendall significance test; (b) integrated spatial distribution of future trends; (c) spatial details of six future change categories.
Table 5.
Spatial distribution of SRSEI future change trend.
Areas projected to improve constitute 41.11% of the region. Persistent improvement is observed in 17.08% of the area, predominantly concentrated in the north, whereas 24.03% is categorized as likely future improvement, suggesting considerable ecological recovery potential. The remaining areas exhibit either stochastic dynamics (14.72%) or sustained stability (10.56%), reflecting substantial uncertainty in their future trajectories.
3.4. Driving Mechanisms of Ecological Environmental Change
3.4.1. Analysis of Driving Factors
The OPGD model was applied to quantitatively assess 15 natural and anthropogenic driving factors. As shown in Table 6, single-factor detection indicates that spatial differentiation in ecological quality is predominantly governed by natural variables. Between 2000 and 2025, elevation (DEM), air temperature (TEMP), and surface shortwave radiation (SRAD) consistently ranked among the most influential factors.
Table 6.
OPGD Detection Results of Driving Factors of SRSEI (2000–2025).
DEM remained the principal determinant throughout most of the study period, yielding the highest q values in 2000 (0.3795), 2005 (0.3337), and 2025 (0.5187). TEMP emerged as the leading factor in 2010 (0.3946) and 2015 (0.4743). However, the explanatory power of dominant factors exhibited pronounced temporal evolution over the 26-year study period. In particular, SRAD demonstrated the most significant upward trend, with its ranking increasing from sixth place in 2000 (q = 0.1179) to first place in 2020 (q = 0.3297) and second place in 2025 (q = 0.3718). Meanwhile, the relative importance of TEMP declined after 2015, indicating a gradual shift in ecological constraints under long-term climate change. It reflects a shift in limiting factors: as absolute cold stress is partially relaxed by ongoing regional warming, the ecosystem’s sensitivity moves from a pure temperature constraint toward energy partitioning (SRAD) and moisture availability (SM).
In contrast, anthropogenic indicators, including population density and nighttime light intensity, consistently produced q-values below 0.01, indicating that socioeconomic factors exerted relatively weak explanatory power at the regional scale compared with natural environmental drivers.
Interaction detection results (Figure 11) demonstrate that all combinations of environmental factors exhibit either bivariate or nonlinear enhancement, with no evidence of antagonistic or independent effects. This interaction pattern remained remarkably stable throughout the 2000–2025 study period. Notably, the synergistic influence of topography and thermal conditions is particularly pronounced, forming a distinct high-value cluster (red regions) in the interaction matrices. For instance, in 2025, the explanatory power (q-values) of the interaction terms DEM∩TEMP and DEM∩SRAD reached 0.6620 and 0.6134, respectively, significantly exceeding the impact of any single factor. Furthermore, the interactions between soil moisture (SM) and both topographic and thermal factors maintained consistently high levels. In contrast, interactions involving anthropogenic drivers, such as population density (POP) and nighttime lights (NTL), yielded generally lower q-values (indicated by blue regions). Overall, the spatial configuration of ecological quality on the Northern Tibetan Plateau is not governed by a single dominant factor but is the result of long-term, stable, and intensive synergies among multiple natural drivers—most notably topography, heat, and moisture.
Figure 11.
Heatmap of Interaction Effects among Driving Factors.
3.4.2. Spatial Heterogeneity of Driving Forces (MGWR)
To capture the spatial non-stationarity of the driving forces, we employed an MGWR model using a two-stage variable selection strategy. First, we identified the top six influential variables from the OPGD analysis (DEM, TEMP, SRAD, SM, ST, and ETP). Second, to ensure model stability and avoid multicollinearity, we applied a Variance Inflation Factor (VIF) diagnostic. Through this process, DEM, TEMP, and SM were selected as the optimal combination, satisfying the VIF < 10 criterion while balancing model parsimony and explanatory power.
The MGWR results (Figure 12) reveal pronounced spatial heterogeneity in the effects of the selected driving factors across the Northern Tibetan Plateau. DEM generally exhibited positive coefficients across most regions, indicating that elevation plays a fundamental role in regulating ecological spatial differentiation. Areas with relatively high positive DEM coefficients were mainly distributed in the central and southwestern high-altitude regions, suggesting that topographic conditions contribute substantially to maintaining ecological stability in alpine environments. In contrast, TEMP displayed predominantly negative coefficients in the central and northwestern regions, indicating that intensified thermal stress adversely affected ecological quality in environmentally fragile alpine areas. The negative influence of temperature was particularly evident in regions characterized by sparse vegetation cover and limited moisture availability, where warming may further intensify evapotranspiration and ecosystem vulnerability.
Figure 12.
Spatial Distribution of MGWR Coefficients for Core Driving Factors.
The spatial influence of SM exhibited strong regional variability. Positive coefficients were mainly concentrated in arid and ecologically sensitive regions, highlighting the critical role of moisture availability in maintaining ecosystem stability under dry conditions. In several northwestern regions, the coefficients of SM were substantially higher than those of other drivers, suggesting that soil moisture acts as a dominant ecological limiting factor under water-deficient conditions. Moreover, the spatial extent and intensity of these coefficient clusters varied across different years, reflecting dynamic ecosystem responses to interannual hydrothermal fluctuations. Overall, the MGWR model effectively captured the localized and scale-dependent relationships between ecological quality and environmental drivers, further confirming the strong spatial non-stationarity of ecological processes across the Northern Tibetan Plateau.
4. Discussion
4.1. Physical Mechanisms and Applicability of the Improved SRSEI
While the traditional RSEI has been widely applied in urban and humid environments [39], its direct application to the alpine–arid environment of the Northern Tibetan Plateau remains limited [68]. In this study, the Improved Built-up Index (IBI) was removed and the Soil-Adjusted Vegetation Index (SAVI) replaced NDVI, resulting in a structurally improved SRSEI framework better suited to sparsely vegetated regions. Compared with the traditional RSEI, the improved SRSEI exhibits stronger sensitivity to surface dryness and better stability of greenness and moisture signals under conditions of high soil exposure and intense solar radiation.
From a process-based perspective, IBI has limited physical relevance in sparsely populated alpine regions, while the equal-weight formulation of the NDBSI may weaken the representation of exposed soil and introduce environmental noise [69]. By retaining only the Soil Index (SI) [20], the improved SRSEI more directly characterizes surface desiccation and degradation processes. In addition, SAVI reduces the influence of soil background reflectance under low vegetation cover, thereby improving the stability of ecological monitoring in alpine–arid environments. These modifications enhance the physical consistency and regional adaptability of the SRSEI framework for ecological assessment on the Northern Tibetan Plateau.
Although PCA loadings exhibited interannual fluctuations, the directional relationships among indicators remained highly stable throughout the study period, with SAVI and WET contributing positively and LST and SI contributing negatively to ecological quality. Combined with annual normalization and independent validation against FVC, these results indicate that the improved SRSEI maintains reliable temporal comparability while effectively capturing dynamic environmental stressors under changing climatic conditions [70].
4.2. Attribution of Ecological Quality Changes to Independent Environmental Drivers
To avoid the circularity of explaining SRSEI dynamics through its own internal components, this study focused on independent environmental variables identified by the OPGD and MGWR models to interpret the underlying mechanisms of ecological change.
The temporal evolution of dominant driving factors reflects a gradual transition in ecological constraints under intensified climate change. Earlier ecosystem dynamics were primarily controlled by baseline thermal and topographic conditions, whereas hydrothermal and energy-related processes became increasingly important during the later study period [71]. This transition suggests that ecological systems on the Northern Tibetan Plateau are becoming more sensitive to changes in energy redistribution and moisture balance under ongoing warming conditions [72]. In particular, the increasing importance of radiation- and moisture-related processes indicates that alpine ecosystems are shifting from predominantly temperature-limited systems toward more complex hydrothermal regulation regimes. Such transitions are especially significant in high-altitude environments, where small changes in energy balance can substantially influence evapotranspiration, vegetation activity, and soil moisture dynamics.
The MGWR results further demonstrate strong spatial non-stationarity in ecological responses to environmental drivers. Different regions exhibit varying sensitivities to elevation, thermal stress, and soil moisture conditions, indicating substantial spatial heterogeneity in ecosystem vulnerability and resilience. Areas dominated by thermal stress are more prone to ecological degradation under continued warming, whereas moisture-sensitive regions exhibit stronger dependence on local hydrological conditions [73]. In addition, elevation indirectly regulates ecological processes by controlling temperature gradients, freeze–thaw intensity, and moisture redistribution across the plateau. These findings imply that uniform ecological management strategies may be insufficient for alpine–arid environments. Instead, future ecological protection and restoration efforts should consider localized hydrothermal and topographic constraints to improve regional ecological sustainability under continued climate change. Furthermore, the strong interaction among temperature, moisture, and topography highlights the necessity of integrated ecological management frameworks that account for coupled climate–terrain processes rather than isolated environmental factors [74].
4.3. Multi-Dimensional Mechanisms and Drivers of Ecological Quality Evolution
A major finding of this study is that the overall decline in the SRSEI contrasts with the widely reported vegetation greening trend derived from NDVI-based assessments. This discrepancy arises because the NDVI primarily reflects vegetation productivity, whereas the SRSEI captures broader ecosystem conditions by integrating hydrothermal stress, surface dryness, and moisture status [75]. Although localized increases in vegetation greenness were observed during certain periods, these positive responses were accompanied by rising thermal stress and declining surface wetness, indicating that vegetation greening alone does not necessarily imply overall ecological improvement [76]. Therefore, the improved SRSEI provides a more comprehensive framework for detecting ecological degradation processes that may be overlooked by single vegetation indices, particularly in alpine–arid environments characterized by strong hydrothermal constraints.
The phased ecological trajectory observed after 2015 further suggests that ecological evolution on the Northern Tibetan Plateau is jointly influenced by climate variability, ecological restoration policies, and cryospheric processes. The slowing decline of ecological quality after 2015 may be associated with increased regional precipitation following the 2015–2016 El Niño event, together with the implementation of ecological protection measures such as grazing control and conservation programs [77,78]. In addition, permafrost dynamics play a critical role in regulating ecosystem stability through soil hydrological processes. Permafrost regions generally exhibited higher SRSEI values than seasonally frozen ground areas, indicating that frozen layers can function as subsurface water-retention barriers that help maintain soil moisture and alpine meadow ecosystems [79]. However, continued warming and active-layer thickening may gradually weaken this hydrological buffering effect, promoting soil desiccation and accelerating the transition from alpine meadows to drought-tolerant grasslands. These findings highlight the importance of incorporating permafrost dynamics into future ecological assessments and long-term environmental management on the Northern Tibetan Plateau.
4.4. Ecological Evolution Trends and Persistence Mechanisms
The ecological evolution pattern across the Northern Tibetan Plateau is characterized by widespread degradation, with degraded areas (50.17%) significantly exceeding improved areas (24.55%). Spatially, degradation was mainly concentrated in ecologically fragile alpine meadow and transition zones, indicating that these regions are highly sensitive to long-term hydrothermal stress under climate warming [80]. In contrast, ecological improvements were relatively limited and scattered, suggesting that ecosystem recovery remains spatially uneven across the plateau. The dominance of slight degradation further indicates that many areas remain in a relatively fragile ecological state and may be vulnerable to additional environmental disturbances.
Hurst exponent analysis further suggests that some degraded regions exhibit persistence characteristics, indicating that current ecological trends may continue in the near future under similar environmental conditions. These persistent degradation areas largely coincide with existing ecological stress zones, reflecting the potential continuity of current hydrothermal and climatic pressures. Meanwhile, several regions also displayed recovery tendencies, implying that local ecological resilience and restoration effects still exist in certain areas [81]. However, it should be emphasized that Hurst-based persistence analysis assumes relative stationarity in environmental processes, whereas future climate change and ecological management interventions may alter these trajectories. Therefore, future ecological protection efforts—such as grazing regulation, wetland conservation, and alpine grassland restoration—may help alleviate ecological degradation and improve ecosystem resilience across vulnerable regions of the Northern Tibetan Plateau [82].
4.5. Limitations and Future Perspectives
Despite integrating multi-source datasets and combining statistical and spatial models to investigate ecological dynamics, several limitations remain. First, although moderate-resolution remote sensing products are suitable for regional-scale analysis, mixed-pixel effects may smooth fine-scale environmental heterogeneity [83]. In highly fragmented alpine ecosystems, particularly permafrost regions, this limitation may obscure subtle ecological transitions and micro-topographic changes [84]. In addition, although validation against Fractional Vegetation Cover (FVC) confirmed the reliability of the improved SRSEI, ecological quality is inherently multidimensional. Future studies should incorporate additional independent indicators, such as Gross Primary Productivity (GPP), field-measured biomass, and biodiversity observations, to further improve ecological validation across different alpine ecosystem types.
Second, the relatively weak explanatory power of anthropogenic factors should be interpreted cautiously [85]. Population density and nighttime light data mainly reflect permanent settlements and infrastructure distribution, but may not adequately capture the spatial variability of grazing intensity, which is a key human disturbance on the Northern Tibetan Plateau [86]. Therefore, future research should integrate high-resolution livestock distribution data and field observations to better quantify the impacts of pastoral activities on fragile alpine ecosystems [87].
Finally, although PCA-based weighting improves objectivity, interannual variations in component loadings may still influence temporal comparability to some extent. Moreover, the Hurst exponent provides only a trend persistence assessment under relatively stationary assumptions and cannot fully account for abrupt climatic changes or future policy interventions [88]. Future work should integrate higher-resolution remote sensing products, long-term permafrost monitoring, and climate projection datasets (e.g., CMIP6) to improve ecological risk assessment and long-term prediction under changing environmental conditions [89].
5. Conclusions
Based on the improved SRSEI and spatial statistical models, this study systematically elucidated the spatiotemporal evolution and driving mechanisms of ecological quality (EEQ) in the Northern Tibetan Plateau from 2000 to 2025. The primary conclusions are:
- (1)
- Structural optimization enhances ecological representativeness. By replacing the NDVI with the SAVI and removing the IBI, the SRSEI achieved improved physical consistency in sparsely vegetated regions. Compared with the traditional RSEI, the SRSEI exhibited a higher PC1 contribution rate and demonstrated stronger long-term alignment with independent FVC data across the full 26-year annual time series, confirming its improved ecological relevance and temporal robustness.
- (2)
- Spatial Pattern and Temporal Decline. Throughout the study period, EEQ remained predominantly at a moderate level (43–58%), characterized by a pronounced southeast-to-northwest declining gradient. The mean SRSEI exhibited a fluctuating decline (0.420 to 0.476), driven by a synergistic rise in land surface temperature (LST) and a concurrent decrease in surface wetness (WET) and greenness (SAVI), which signifies a systemic ecological downturn rather than localized fluctuations.
- (3)
- Spatial Asymmetry and Evolutionary Inertia. Trend diagnostics reveal a marked spatial asymmetry, with degradation (50.17%) significantly outpacing recovery (24.55%). Persistence analysis confirms that 26.14% of the region is locked in a trajectory of “Continuous Degradation,” spatially coinciding with current degradation cores. This suggests a strong “evolutionary inertia” where local stressors propagate through hydrological connectivity, pushing the landscape toward a “fragile equilibrium.” Conversely, the 40.11% of the area showing recovery potential indicates that resilience remains, albeit spatially fragmented.
- (4)
- Driving-force analysis demonstrates that spatial heterogeneity in EEQ is primarily governed by natural factors, while anthropogenic influences, as assessed by current proxy indicators, remain limited at the regional scale. Elevation, temperature, and shortwave radiation are the core variables shaping the regional ecological gradient. Multi-factor interactions consistently manifest as synergistic enhancements, indicating that the ecological pattern emerges from coupled regulatory mechanisms rather than single-factor dominance. Ultimately, topography serves as the fundamental constraint by modulating energy and moisture redistribution across the plateau.
Overall, this study demonstrates that ecological assessment in alpine–arid environments should move beyond vegetation greenness alone and incorporate comprehensive hydrothermal and surface condition indicators. The improved SRSEI framework provides a more regionally adaptive approach for monitoring ecological quality in sparsely vegetated cold regions and offers useful support for ecological conservation and sustainable management on the Northern Tibetan Plateau. Future research should further integrate dynamic permafrost observations, grazing intensity datasets, and higher-resolution ecological indicators to improve the understanding of ecosystem responses under ongoing climate change.
Author Contributions
Conceptualization, S.Z. and X.L.; methodology, S.Z. and X.L.; software, X.L.; formal analysis, X.L.; resources, S.Z.; writing—original draft preparation, X.L.; visualization, X.L.; supervision, S.Z.; project administration, S.Z.; funding acquisition, S.Z. All authors have read and agreed to the published version of the manuscript.
Funding
This research was funded by the National Natural Science Foundation of China (42271432) and the Natural Science Foundation of Shanxi Province (202403021211007).
Data Availability Statement
The processed SRSEI datasets and trend analysis results generated during this study are available from the corresponding author upon reasonable request. We are committed to depositing the key result datasets into a public repository upon the completion and publication of our follow-up research, ensuring full transparency and accessibility for the scientific community.
Conflicts of Interest
The authors declare no conflicts of interest.
References
- An, M.; Xie, P.; He, W.J.; Wang, B.; Huang, J.; Khanal, R. Spatiotemporal change of ecologic environment quality and human interaction factors in three gorges ecologic economic corridor, based on RSEI. Ecol. Indic. 2022, 141, 109090. [Google Scholar] [CrossRef] [Scilit]
- Deeksha; Shukla, A.K. Ecosystem services: A systematic literature review and future dimension in freshwater ecosystems. Appl. Sci. 2022, 12, 8518. [Google Scholar] [CrossRef] [Scilit]
- Niu, S.L.; Chen, W.N. Global change and ecosystems research progress and prospect. Chin. J. Plant Ecol. 2020, 44, 449–460. (In Chinese) [Google Scholar] [CrossRef] [Scilit]
- Zhang, F.; Zhou, Z.F.; Huang, D.H.; Du, X.D.; Deng, F.F.; Yang, Y.; Du, S.L. Dynamic Monitoring and Analysis of Factors Influencing Ecological Quality in Rapidly Urbanizing Areas Based on the Google Earth Engine. Geocarto Int. 2023, 38, 2256299. [Google Scholar] [CrossRef] [Scilit]
- He, J.; Shi, X.Y. Detection of social-ecological drivers and impact thresholds of ecological degradation and ecological restoration in the last three decades. J. Environ. Manag. 2022, 318, 115513. [Google Scholar] [CrossRef] [Scilit]
- Xie, Y.H. Spatiotemporal change detection of ecological quality and the associated affecting factors in Dongting Lake Basin, based on RSEI. J. Clean. Prod. 2021, 302, 126995. [Google Scholar] [CrossRef] [Scilit]
- Gong, J.Y.; Ma, Z.Y.; Hu, C.; He, L.X.; Li, T.; Lei, J.P. Research progress of ecological threshold theory for integrated ecosystem management. Acta Ecol. Sin. 2024, 44, 10499–10511. (In Chinese) [Google Scholar] [CrossRef]
- Immerzeel, W.W.; Van Beek, L.P.H.; Bierkens, M.F.P. Climate change will affect the Asian water towers. Science 2010, 328, 1382–1385. [Google Scholar] [CrossRef] [Scilit] [PubMed]
- Yao, T.D.; Wu, G.J.; Xu, B.Q.; Wang, W.C.; Gao, J.; An, B.S. Asian water tower: Change and impacts. Bull. Chin. Acad. Sci. 2019, 34, 1203–1209. (In Chinese) [Google Scholar] [CrossRef]
- Sun, H.L.; Zheng, D.; Yao, T.D.; Zhang, Y.L. Protection and Construction of the National Ecological Security Shelter Zone on Tibetan Plateau. Acta Geogr. Sin. 2012, 67, 3–12. (In Chinese) [Google Scholar] [CrossRef]
- Li, Y.H.; Wang, X.F.; Chu, B.Y.; Niu, Z.P.; Fu, X.X.; Yan, Y. Spatiotemporal ecosystem evolution and driving mechanism in the Qinghai-Tibet Plateau ecological barrier area. Acta Ecol. Sin. 2022, 42, 8581–8593. (In Chinese) [Google Scholar] [CrossRef] [Scilit]
- Li, M.; Weng, B.S.; Yan, D.H.; Bi, W.X.; Wang, H. Variation trends and attribution analysis of lakes in the Qiangtang Plateau, the Endorheic Basin of the Tibetan Plateau. Sci. Total Environ. 2022, 837, 155595. [Google Scholar] [CrossRef] [Scilit] [PubMed]
- Chen, L.; Zhang, W.; Li, W.J.; Zhang, H.X.; Luo, S.J.; Ran, Q.H.; Qin, J.X. Landscape changes of alpine grasslands in the Zhari Namco basin of the central-southern Qiangtang plateau, 2001–2021. Conserv. Sci. Pract. 2024, 6, e13211. [Google Scholar] [CrossRef] [Scilit]
- Geng, Y.X.; Yi, G.H.; Zhang, T.B.; Bie, X.J.; Li, J.J.; Wang, G.Y.; Lin, M.N. Impacts of climate change on grassland carbon sink/source patterns in the Qinghai-Tibet Plateau. J. Nat. Resour. 2024, 39, 1208–1221. (In Chinese) [Google Scholar] [CrossRef] [Scilit]
- Zheng, D.; Zhao, D.S. Characteristics of natural environment of the Tibetan Plateau. Sci. Technol. Rev. 2017, 35, 13–22. (In Chinese) [Google Scholar] [CrossRef]
- Fu, Z.T.; Wu, Q.B.; Chen, A.P.; Wang, L.Y.; Jiang, G.L.; Gao, S.R.; Yun, H.B.; Chen, J. Non-temperature environmental drivers modulate warming-induced 21st-century permafrost degradation on the Tibetan Plateau. Nat. Commun. 2025, 16, 7556. [Google Scholar] [CrossRef] [Scilit]
- Zhang, G.F.; Nan, Z.T.; Zhao, L.; Liang, Y.J.; Cheng, G.D. Qinghai-Tibet Plateau wetting reduces permafrost thermal responses to climate warming. Earth Planet. Sci. Lett. 2021, 562, 116858. [Google Scholar] [CrossRef] [Scilit]
- Wang, H.; Zhan, J.; Wang, C.; Liu, W.; Yang, Z.; Liu, H.; Bai, C. Greening or browning? The macro variation and drivers of different vegetation types on the Qinghai-Tibetan Plateau from 2000 to 2021. Front. Plant Sci. 2022, 13, 1045290. [Google Scholar] [CrossRef] [Scilit] [PubMed]
- Wang, Z.; Cui, G.; Liu, X.; Zheng, K.; Lu, Z.; Li, H.; Wang, G.; An, Z. Greening of the Qinghai–Tibet Plateau and Its Response to Climate Variations along Elevation Gradients. Remote Sens. 2021, 13, 3712. [Google Scholar] [CrossRef] [Scilit]
- Peng, X.F.; Zhang, S.Q.; Peng, P.H.; Chen, A.L.; Li, Y.; Wang, J.; Bai, M.Y. Unraveling the Ecological Tapestry: A Comprehensive Assessment of Chang tang Nature Reserve’s Ecological and Environmental Using RSEI and GEE. Land 2023, 12, 1581. [Google Scholar] [CrossRef] [Scilit]
- Xu, Z.R.; Zou, X.P. Evaluation of social-ecological effectiveness of protected areas on the Chang tang plateau. Acta Ecol. Sin. 2020, 40, 8743–8752. (In Chinese) [Google Scholar] [CrossRef]
- Chen, A.; Yang, X.; Guo, J.; Xing, X.; Yang, D.; Xu, B. Synthesized remote sensing-based desertification index reveals ecological restoration and its driving forces in the northern sand-prevention belt of China. Ecol. Indic. 2021, 131, 108230. [Google Scholar] [CrossRef] [Scilit]
- Gao, Q.; Guo, Y.; Xu, H.; Ganjurjav, H.; Li, Y.; Wan, Y.; Qin, X.; Ma, X.; Liu, S. Climate change and its impacts on vegetation distribution and net primary productivity of the alpine ecosystem in the Qinghai-Tibetan Plateau. Sci. Total Environ. 2016, 554, 34–41. [Google Scholar] [CrossRef] [Scilit] [PubMed]
- Chen, B.; Zhang, X.; Tao, J.; Wu, J.; Wang, J.; Shi, P.; Zhang, Y.; Yu, C. The impact of climate change and anthropogenic activities on alpine grassland over the Qinghai-Tibet Plateau. Agric. For. Meteorol. 2014, 189, 11–18. [Google Scholar] [CrossRef] [Scilit]
- Liu, Y.; Xiang, W.; Hu, P.; Gao, P.; Zhang, A. Evaluation of ecological environment quality using an improved remote sensing ecological index model. Remote Sens. 2024, 16, 3485. [Google Scholar] [CrossRef] [Scilit]
- Xia, J.Y.; Ren, D.; Wang, X.H.; Xu, B.; Zhong, X.Y.; Fan, Y.J. Ecosystem Quality Assessment and Ecological Restoration in Fragile Zone of Loess Plateau: A Case Study of Suide County, China. Land 2023, 12, 1131. [Google Scholar] [CrossRef] [Scilit]
- Wang, X.L.; Huang, Y.L. Ecological environment quality evaluation of Qinghai Province based on Google Earth Engine and modified remote sensing ecological index for drought. Acta Ecol. Sin. 2025, 45, 10008–10020. (In Chinese) [Google Scholar] [CrossRef]
- Xu, H.Q.; Chen, J.H.; He, G.J.; Lin, Z.L.; Bai, Y.F.; Ren, M.J.; Zhang, H.; Yin, H.M.; Liu, F.F. Immediate assessment of forest fire using a novel vegetation index and machine learning based on multi-platform, high temporal resolution remote sensing images. Int. J. Appl. Earth Obs. Geoinf. 2024, 134, 104210. [Google Scholar] [CrossRef] [Scilit]
- Li, Y.C.; Yuan, J.G.; Liu, B.H.; Guo, H. Ecological Environment Dynamical Evaluation of Hutuo River Basin Using Remote Sensing. Environ. Sci. 2024, 45, 2757–2766. (In Chinese) [Google Scholar] [CrossRef] [Scilit]
- Qiu, M.; Zuo, Q.T.; Wu, Q.S.; Yang, Z.L.; Zhang, J.W. Water ecological security assessment and spatial autocorrelation analysis of prefectural regions involved in the Yellow River Basin. Sci. Rep. 2022, 12, 5105. [Google Scholar] [CrossRef] [Scilit]
- Zhang, T.; Yang, R.Q.; Yang, Y.B.; Li, L.; Chen, L.Q. Assessing the Urban Eco-Environmental Quality by the Remote-Sensing Ecological Index: Application to Tianjin, North China. ISPRS Int. J. Geo-Inf. 2021, 10, 475. [Google Scholar] [CrossRef] [Scilit]
- Zhu, D.Y.; Chen, T.; Niu, R.Q.; Zhen, N. Analyzing the Ecological Environment of Mining Area by Using Moving Window Remote Sensing Ecological Index. Geomat. Inf. Sci. Wuhan Univ. 2021, 46, 341–347. (In Chinese) [Google Scholar] [CrossRef]
- Wang, X.X.; Zhang, X.X.; Li, W.P.; Cheng, X.Q.; Ling, Q.; Zhou, Z.Y.; Hao, J.M.; Lin, Q.R.; Chen, L. Assessment of Ecological Environment Quality in Qilian Mountain National Nature Reserve Based on Improved RSEI Model. J. Ecol. Rural Environ. 2023, 39, 853–863. (In Chinese) [Google Scholar] [CrossRef]
- Xu, H.Q. A remote sensing index for regional ecological change assessment. China Environ. Sci. 2013, 33, 889–897. (In Chinese) [Google Scholar] [CrossRef]
- Guo, J.; Kang, R.; Xu, T.H.; Deng, C.Y.; Zhang, L.; Yang, S.Q.; Si, L.L.; Kaufmann, H. A time-series-based remote sensing ecological index model for sustainable long-term ecological monitoring of desertification. Int. J. Appl. Earth Obs. Geoinf. 2025, 143, 104758. [Google Scholar] [CrossRef] [Scilit]
- Wei, Z.F.; Guan, Y.L.; Wang, S.T.; Hu, Y.C. Spatiotemporal evolution and driving analysis of ecological environment quality in North China Plain based on IRSEI. Environ. Sci. 2025, 1–19. (In Chinese) [Google Scholar] [CrossRef]
- Yang, X.W.; Tian, H.Y.; Wang, Y.; Xue, Y.M.; Lv, J.K.; Wen, T.J. Karst remote sensing ecological index KRSEI for monitoring ecological quality in Southwest China. Sci. Rep. 2025, 15, 36382. [Google Scholar] [CrossRef] [Scilit] [PubMed]
- Guo, Z.; Xu, H.; Ma, J.C.; Ning, H.S.; Shen, J.W.; Zhang, Z.W. Construction of three-dimensional remote sensing ecological index (TRSEI) based on stereopair images: A case study of Miaodao Archipelago in China. Ecol. Indic. 2024, 159, 111737. [Google Scholar] [CrossRef] [Scilit]
- Xu, H.Q.; Wang, Y.F.; Guan, H.D.; Shi, T.T.; Hu, X.S. Detecting Ecological Changes with a Remote Sensing Based Ecological Index (RSEI) Produced Time Series and Change Vector Analysis. Remote Sens. 2019, 11, 2345. [Google Scholar] [CrossRef] [Scilit]
- Shen, Z.X.; Sun, W.; Li, S.W.; He, Y.T.; Fu, G.; Zhang, X.Z.; Wang, J.W. Relationships between Vegetation Indices and Environmental Temperature and Moisture in an alpine meadow along an elevation Gradient in the Northern Tibet. Ecol. Environ. Sci. 2015, 24, 1591–1598. (In Chinese) [Google Scholar] [CrossRef]
- Liu, Y.; Meng, Q.Y.; Zhang, L.L.; Wu, C.Y. NDBSI: A normalized difference bare soil index for remote sensing to improve bare soil mapping accuracy in urban and rural areas. Catena 2022, 214, 106265. [Google Scholar] [CrossRef] [Scilit]
- Zhang, H.B.; Wang, W.; Song, Y.J.; Miao, L.G.; Ma, C. Ecological quality evaluation in arid inland areas based on improved remote sensing ecological index: A case study of the Tabu River Basin at the northern foot of Yinshan Mountains. Acta Ecol. Sin. 2024, 44, 523–543. (In Chinese) [Google Scholar] [CrossRef]
- Zhang, X.X.; Wang, X.X.; Li, W.P.; Wu, X.D.; Cheng, X.Q.; Zhou, Z.Y.; Ling, Q.; Liu, Y.D.; Liu, X.J.; Hao, J.M.; et al. Dynamic Monitoring and Analysis of Ecological Environment Quality in Arid and Semi-Arid Areas Based on a Modified Remote Sensing Ecological Index (MRSEI): A Case Study of the Qilian Mountain National Nature Reserve. Remote Sens. 2024, 16, 3530. [Google Scholar] [CrossRef] [Scilit]
- Huete, A.R. A soil-adjusted vegetation index (SAVI). Remote Sens. Environ. 1988, 25, 295–309. [Google Scholar] [CrossRef] [Scilit]
- Zhao, Y.H.; Hou, P.; Jiang, J.B.; Jiang, Y.; Zhang, B.; Bai, J.J.; Xu, H.T. Progress in quantitative retrieval of vegetation ecological remote sensing parameters. J. Remote Sens. 2021, 25, 2173–2197. (In Chinese) [Google Scholar] [CrossRef] [Scilit]
- Feng, H.; Squires, V.R. Socio-Environmental Dynamics of Alpine Grasslands, Steppes and Meadows of the Qinghai–Tibetan Plateau, China: A Commentary. Appl. Sci. 2020, 10, 6488. [Google Scholar] [CrossRef] [Scilit]
- Shi, J.; Gong, J.; Zhang, Y.X.; Kan, G.B. Spatiotemporal change in ecological quality of the Qinghai-Tibetan Plateau based on an improved remote sensing ecological index and Google Earth Engine platform. Environ. Monit. Assess. 2025, 197, 355. [Google Scholar] [CrossRef] [Scilit] [PubMed]
- Miao, W.N.; Chen, Y.; Kou, W.L.; Lai, H.Y.; Sazal, A.; Wang, J.; Li, Y.L.; Hu, J.J.; Wu, Y.; Zhao, T.F. The HANTS-fitted RSEI constructed in the vegetation growing season reveals the spatiotemporal patterns of ecological quality. Sci. Rep. 2024, 14, 14686. [Google Scholar] [CrossRef] [Scilit]
- Baig, M.H.A.; Zhang, L.F.; Shuai, T.; Tong, Q.X. Derivation of a tasselled cap transformation based on Landsat 8 at-satellite reflectance. Remote Sens. Lett. 2014, 5, 423–431. [Google Scholar] [CrossRef] [Scilit]
- Li, J.N.; Liu, J.H.; Liu, M.X.; Lv, X.Q.; Dong, Z.Y.; Yan, X.Y. Urban ecological environment evaluation and influencing factors analysis at the residential quarter-level in Xi’an, China. Ecol. Indic. 2024, 158, 111348. [Google Scholar] [CrossRef] [Scilit]
- Duan, S.B.; Ru, C.; Li, Z.L.; Wang, M.M.; Xu, H.Q.; Li, H.; Wu, P.H.; Zhan, W.F.; Zhou, J.; Zhao, W.; et al. Reviews of methods for land surface temperature retrieval from Landsat thermal infrared data. Natl. Remote Sens. Bull. 2021, 25, 1591–1617. (In Chinese) [Google Scholar] [CrossRef] [Scilit]
- Lu, F.; Zhang, C.; Cao, H.; Wang, X.; Zheng, T.; Huang, Z. Assessment of ecological environment quality and their drivers in urban agglomeration based on a novel remote sensing ecological index. Ecol. Indic. 2025, 170, 113104. [Google Scholar] [CrossRef] [Scilit]
- Lever, J.; Krzywinski, M.; Altman, N. Points of significance: Principal component analysis. Nat. Methods 2017, 14, 641–643. [Google Scholar] [CrossRef] [Scilit]
- Wang, Y.X.; Xu, Y.Y.; Yang, J.J.; Chen, Y.X.; Wei, J.X.; Zhou, J.; Zhang, W.L.; Cheng, W.X. Dynamic monitoring and spatiotemporal pattern evolution of ecological environment quality in Chongqing based on Landsat. Acta Ecol. Sin. 2023, 43, 6278–6292. (In Chinese) [Google Scholar] [CrossRef]
- Xu, H.Q. A Remote Sensing Urban Ecological Index and Its Application. Acta Ecol. Sin. 2013, 33, 7853–7862. (In Chinese) [Google Scholar] [CrossRef]
- Fensholt, R.; Langanke, T.; Rasmussen, K.; Reenberg, A.; Prince, S.D.; Tucker, C.; Scholes, R.J.; Le, Q.B.; Bondeau, A.; Eastman, R.; et al. Greenness in Semi-Arid Areas across the Globe 1981–2007—An Earth Observing Satellite Based Analysis of Trends and Drivers. Remote Sens. Environ. 2012, 121, 144–158. [Google Scholar] [CrossRef] [Scilit]
- Sen, P.K. Estimates of the Regression Coefficient Based on Kendall’s Tau. J. Am. Stat. Assoc. 1968, 63, 1379–1389. [Google Scholar] [CrossRef]
- Mann, H.B. Nonparametric tests against trend. Econometrica 1945, 13, 245–259. [Google Scholar] [CrossRef] [Scilit]
- Hurst, H.E. Long-term storage capacity of reservoirs. Trans. Am. Soc. Civ. Eng. 1951, 116, 770–799. [Google Scholar] [CrossRef] [Scilit]
- Mandelbrot, B.B.; Wallis, J.R. Robustness of the rescaled range R/S in the measurement of noncyclic long run statistical dependence. Water Resour. Res. 1969, 5, 967–988. [Google Scholar] [CrossRef] [Scilit]
- Song, Y.Z.; Wang, J.F.; Ge, Y.; Xu, C.D. An optimal parameters-based geographical detector model enhances geographic characteristics of explanatory variables for spatial heterogeneity analysis: Cases with different types of spatial data. GISci. Remote Sens. 2020, 57, 593–610. [Google Scholar] [CrossRef] [Scilit]
- Chen, Y.L.; Jiao, J.Y.; Tian, H.W.; Xu, Q.; Feng, L.Q.; Wang, N. Spatial correlation analysis between vegetation NDVI and natural environmental factors based on geographical detector on the Loess Plateau. Acta Ecol. Sin. 2022, 42, 4513–4524. (In Chinese) [Google Scholar] [CrossRef] [Scilit]
- Wang, J.F.; Li, X.H.; Christakos, G.; Liao, Y.L.; Zhang, T.; Gu, X.; Zheng, X.Y. Geographical Detectors-Based Health Risk Assessment and its Application in the Neural Tube Defects Study of the Heshun Region, China. Int. J. Geogr. Inf. Sci. 2010, 24, 107–127. [Google Scholar] [CrossRef] [Scilit]
- Oshan, T.M.; Li, Z.Q.; Kang, W.; Wolf, L.J.; Fotheringham, A.S. mgwr: A Python Implementation of Multiscale Geographically Weighted Regression for Investigating Process Spatial Heterogeneity and Scale. ISPRS Int. J. Geo-Inf. 2019, 8, 269. [Google Scholar] [CrossRef] [Scilit]
- Lu, B.B.; Ge, Y.; Qin, K.; Zheng, J.H. A Review on Geographically Weighted Regression. Geomat. Inf. Sci. Wuhan Univ. 2020, 45, 1356–1366. (In Chinese) [Google Scholar] [CrossRef]
- Yu, H.C.; Fotheringham, A.S.; Li, Z.Q.; Oshan, T.; Kang, W.; Wolf, L.J. Inference in multiscale geographically weighted regression. Geogr. Anal. 2020, 52, 87–106. [Google Scholar] [CrossRef] [Scilit]
- HJ/T 192-2006; Technical Criterion for Ecosystem Status Evaluation. China Environmental Science Press: Beijing, China, 2015.
- Fu, K.X.; Jia, G.D.; Yu, X.X.; Wang, X. Ecological environment assessment and driving mechanism analysis of the Naqu-Anduo section of the Qinghai-Tibet Highway based on an improved remote sensing ecological index. Environ. Sci. 2024, 45, 1586–1597. (In Chinese) [Google Scholar] [CrossRef] [Scilit]
- Zheng, C.Z.; Bian, Z.; Sang, G.Q. Dynamic monitoring of ecological environment quality in Jinan based on remote sensing ecological index. Ecol. Sci. 2024, 43, 175–182. (In Chinese) [Google Scholar] [CrossRef]
- Xiong, Y.; Xu, W.; Lu, N.; Huang, S.; Wu, C.; Wang, L.; Dai, F.; Kou, W. Assessment of spatial–temporal changes of ecological environment quality based on RSEI and GEE: A case study in Erhai Lake Basin, Yunnan province, China. Ecol. Indic. 2021, 125, 107518. [Google Scholar] [CrossRef] [Scilit]
- You, Q.L.; Chen, D.L.; Wu, F.Y.; Pepin, N.; Cai, Z.Y.; Ahrens, B.; Jiang, Z.H.; Wu, Z.W.; Kang, S.C.; AghaKouchak, A. Elevation dependent warming over the Tibetan Plateau: Patterns, mechanisms and perspectives. Earth-Sci. Rev. 2020, 210, 103349. [Google Scholar] [CrossRef] [Scilit]
- Sun, Y.X.; Liu, S.L.; Liu, C.; Sun, J.; Liu, Y.X.; Wang, F.F. Interactive response and spatial heterogeneity of alpine grassland biodiversity to soil, topography, climate, and human factors on the Qinghai-Tibet Plateau. Land Degrad. Dev. 2023, 34, 4488–4502. [Google Scholar] [CrossRef] [Scilit]
- Mountain Research Initiative EDW Working Group. Elevation-dependent warming in mountain regions of the world. Nat. Clim. Change 2015, 5, 424–430. [Google Scholar] [CrossRef] [Scilit]
- Airiken, M.; Li, S.C. The Dynamic Monitoring and Driving Forces Analysis of Ecological Environment Quality in the Tibetan Plateau Based on the Google Earth Engine. Remote Sens. 2024, 16, 682. [Google Scholar] [CrossRef] [Scilit]
- Lv, J.; Zhao, W. Observed decoupling of vegetation greenness and productivity despite regional coupling patterns across the Tibetan Plateau. Int. J. Digit. Earth 2025, 18, 2585569. [Google Scholar] [CrossRef] [Scilit]
- Piao, S.; Wang, X.; Park, T.; Chen, C.; Lian, X.U.; He, Y.; Bjerke, J.W.; Chen, A.; Ciais, P.; Tømmervik, H.; et al. Characteristics, drivers and feedbacks of global greening. Nat. Rev. Earth Environ. 2020, 1, 14–27. [Google Scholar] [CrossRef] [Scilit]
- Dong, G.; Jiang, F.; Ju, W.; Peñuelas, J.; Ciais, P.; Zhang, Y.; Xiao, J.; Wang, X.; Yuan, W.; Huang, Y.; et al. Dramatic increase in ecosystem respiration causes record-breaking atmospheric CO2 growth rate in 2024. Nat. Commun. 2026, 17, 72189. [Google Scholar] [CrossRef] [Scilit] [PubMed]
- Zhou, K.; Du, J.; Shen, X.; Pu, G.; Zhang, D.; Dang, X. Spatial and temporal variability of vegetation net primary productivity in Qiangtang National Nature Reserve under climate change. Chin. J. Agrometeorol. 2021, 42, 627–641. [Google Scholar] [CrossRef]
- Jin, X.; Jin, H.; Luo, D.; Sheng, Y.; Wu, Q.; Wu, J.; Wang, W.; Huang, S.; Li, X.; Liang, S.; et al. Impacts of permafrost degradation on hydrology and vegetation in the source area of the Yellow River on northeastern Qinghai-Tibet Plateau, Southwest China. Front. Earth Sci. 2022, 10, 845824. [Google Scholar] [CrossRef] [Scilit]
- Wang, C.; Gao, Q.; Yu, M. Quantifying trends of land change in Qinghai-Tibet Plateau during 2001–2015. Remote Sens. 2019, 11, 2435. [Google Scholar] [CrossRef] [Scilit]
- Hua, T.; Zhao, W.; Cherubini, F.; Hu, X.; Pereira, P. Upgrading protected areas can improve or reverse the decline in conservation effectiveness: Evidence from the Tibetan Plateau, China. Sci. Total Environ. 2023, 873, 162345. [Google Scholar] [CrossRef] [Scilit]
- Zhao, C.; Su, S.; Gong, Z.; Lv, C.; Li, N.; Luo, Q.; Zhou, X.; Li, S. Effectiveness of protected areas in the Three-river Source Region of the Tibetan Plateau for biodiversity and ecosystem services. Ecol. Indic. 2023, 154, 110861. [Google Scholar] [CrossRef] [Scilit]
- Wang, Q. Progress of environmental remote sensing monitoring technology in China and some related frontier issues. Natl. Remote Sens. Bull. 2021, 25, 25–36. (In Chinese) [Google Scholar] [CrossRef] [Scilit]
- Wang, Z.Q.; Zhang, Y.Z.; Yang, Y.; Zhou, W.; Gang, C.C.; Zhang, Y.; Li, J.; An, R.; Wang, K.; Odeh, I.; et al. Quantitative assess the driving forces on the grassland degradation in the Qinghai–Tibet Plateau, in China. Ecol. Inform. 2016, 33, 32–44. [Google Scholar] [CrossRef] [Scilit]
- Zhu, B.; Zhang, Z.; Tian, J.; Kong, R.; Chen, X. Increasing negative impacts of climatic change and anthropogenic activities on vegetation variation on the Qinghai–Tibet Plateau during 1982–2019. Remote Sens. 2022, 14, 4735. [Google Scholar] [CrossRef] [Scilit]
- Alkemade, R.; Reid, R.S.; Van Den Berg, M.; De Leeuw, J.; Jeuken, M. Assessing the impacts of livestock production on biodiversity in rangeland ecosystems. Proc. Natl. Acad. Sci. USA 2013, 110, 20900–20905. [Google Scholar] [CrossRef] [Scilit] [PubMed]
- Pelosi, C.; Goulard, M.; Balent, G. The spatial scale mismatch between ecological processes and agricultural management: Do difficulties come from underlying theoretical frameworks? Agric. Ecosyst. Environ. 2010, 139, 455–462. [Google Scholar] [CrossRef] [Scilit]
- Crane-Droesch, A. Machine learning methods for crop yield prediction and climate change impact assessment in agriculture. Environ. Res. Lett. 2018, 13, 114003. [Google Scholar] [CrossRef] [Scilit]
- Lalande, M.; Ménégoz, M.; Krinner, G.; Naegeli, K.; Wunderle, S. Climate change in the High Mountain Asia in CMIP6. Earth Syst. Dyn. 2021, 12, 1061–1098. [Google Scholar] [CrossRef] [Scilit]
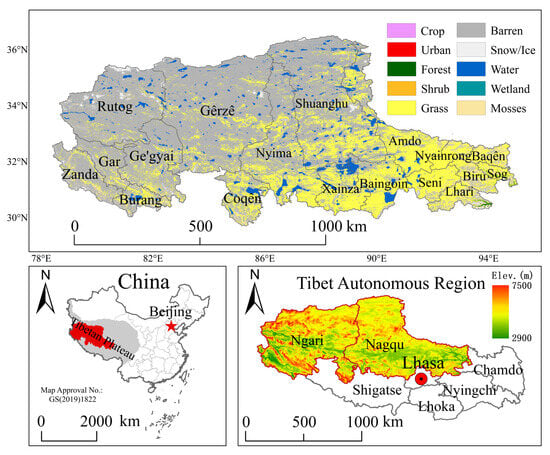
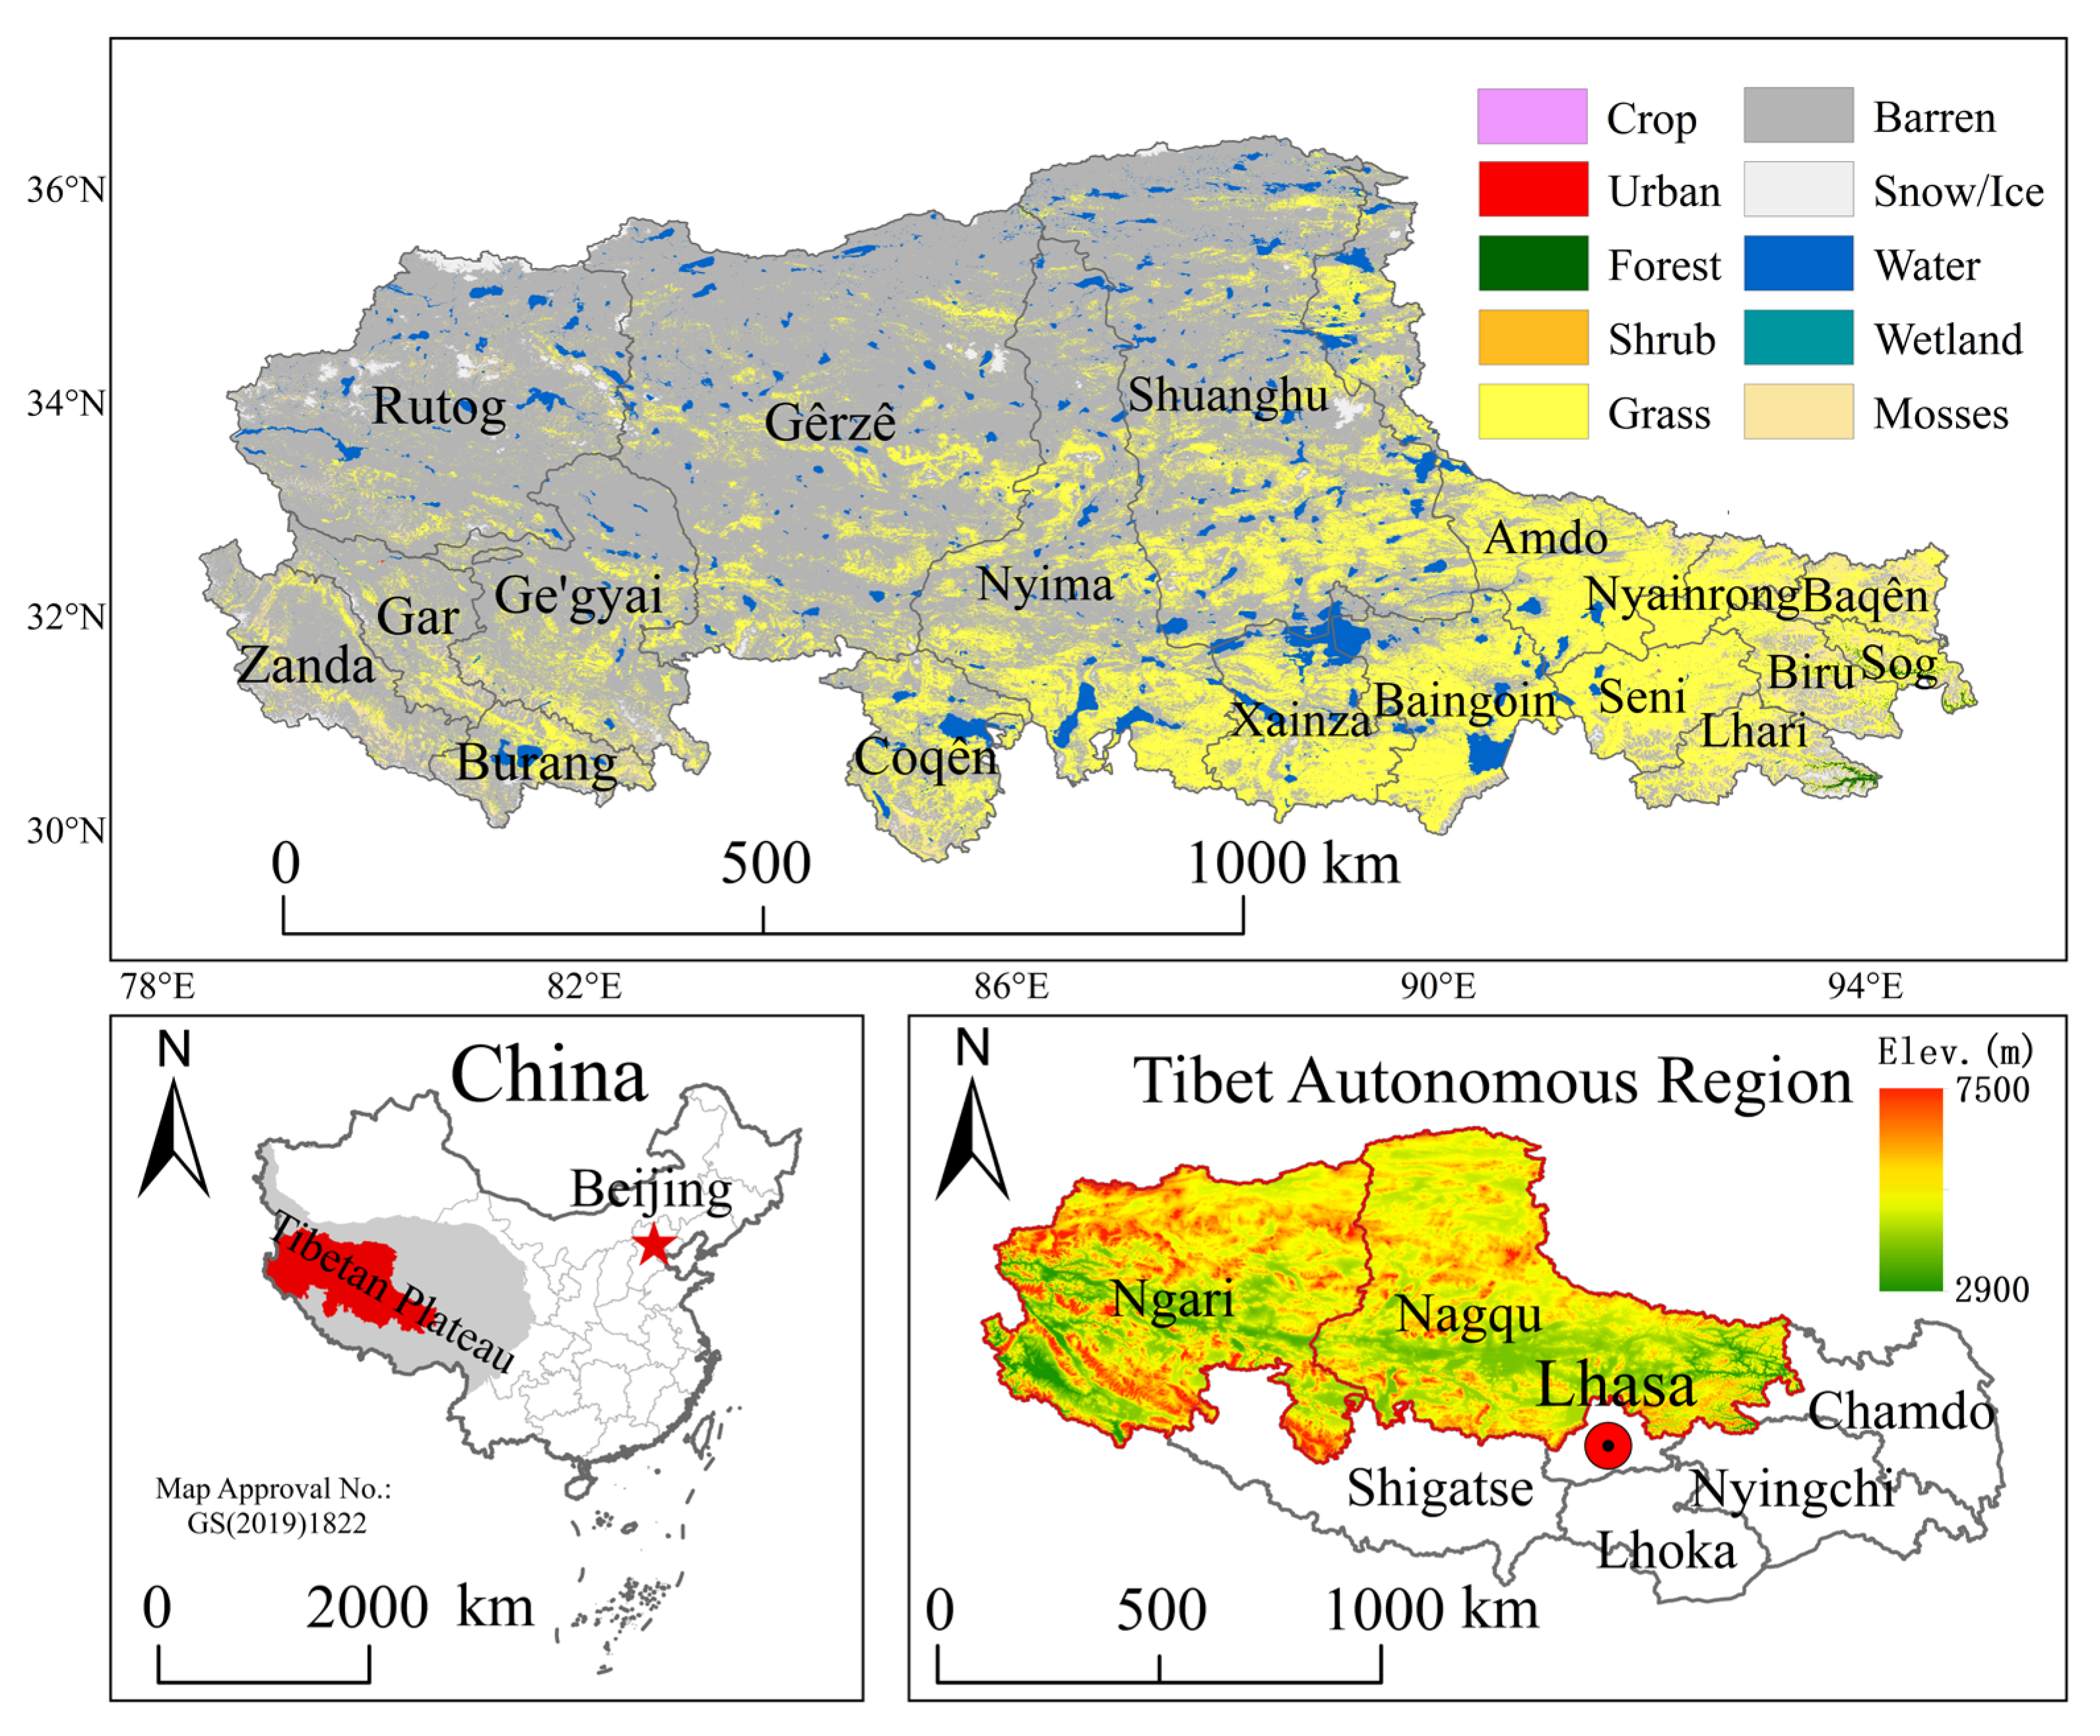
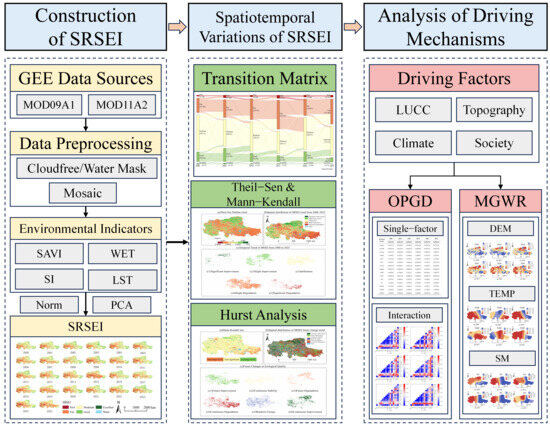
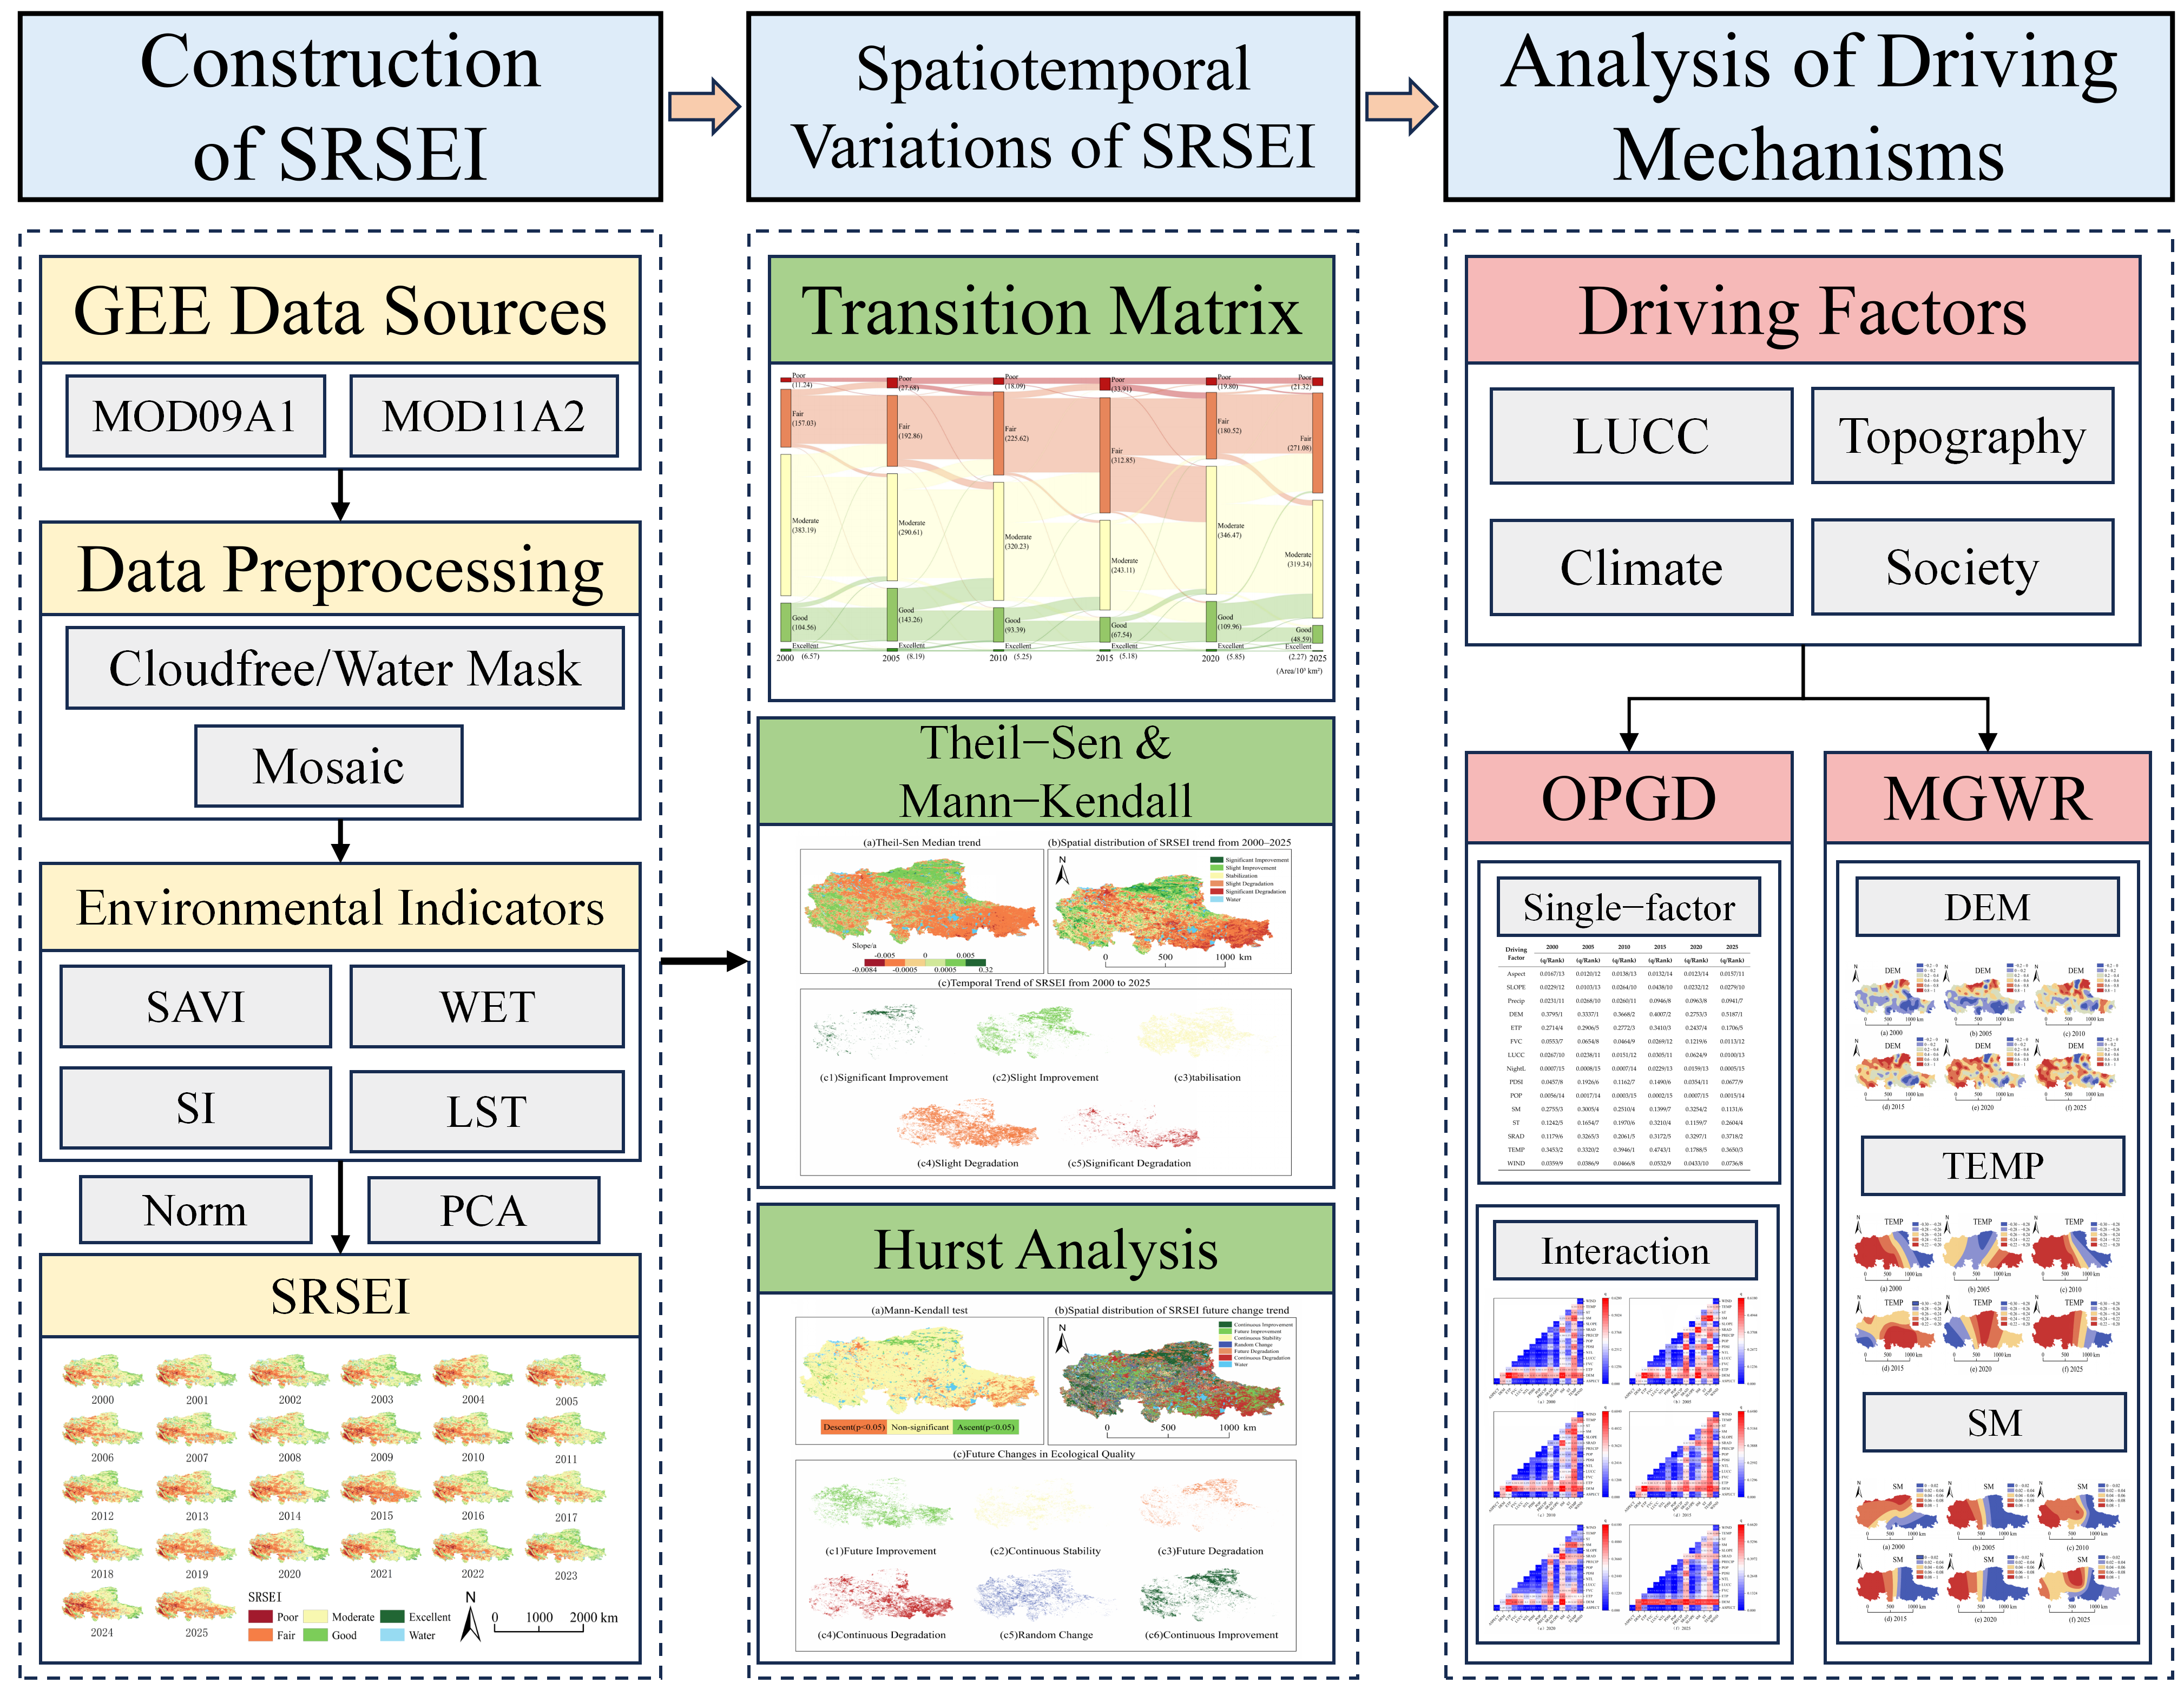
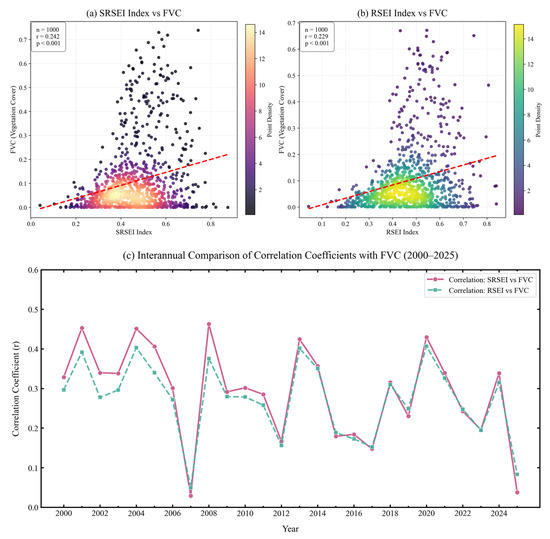
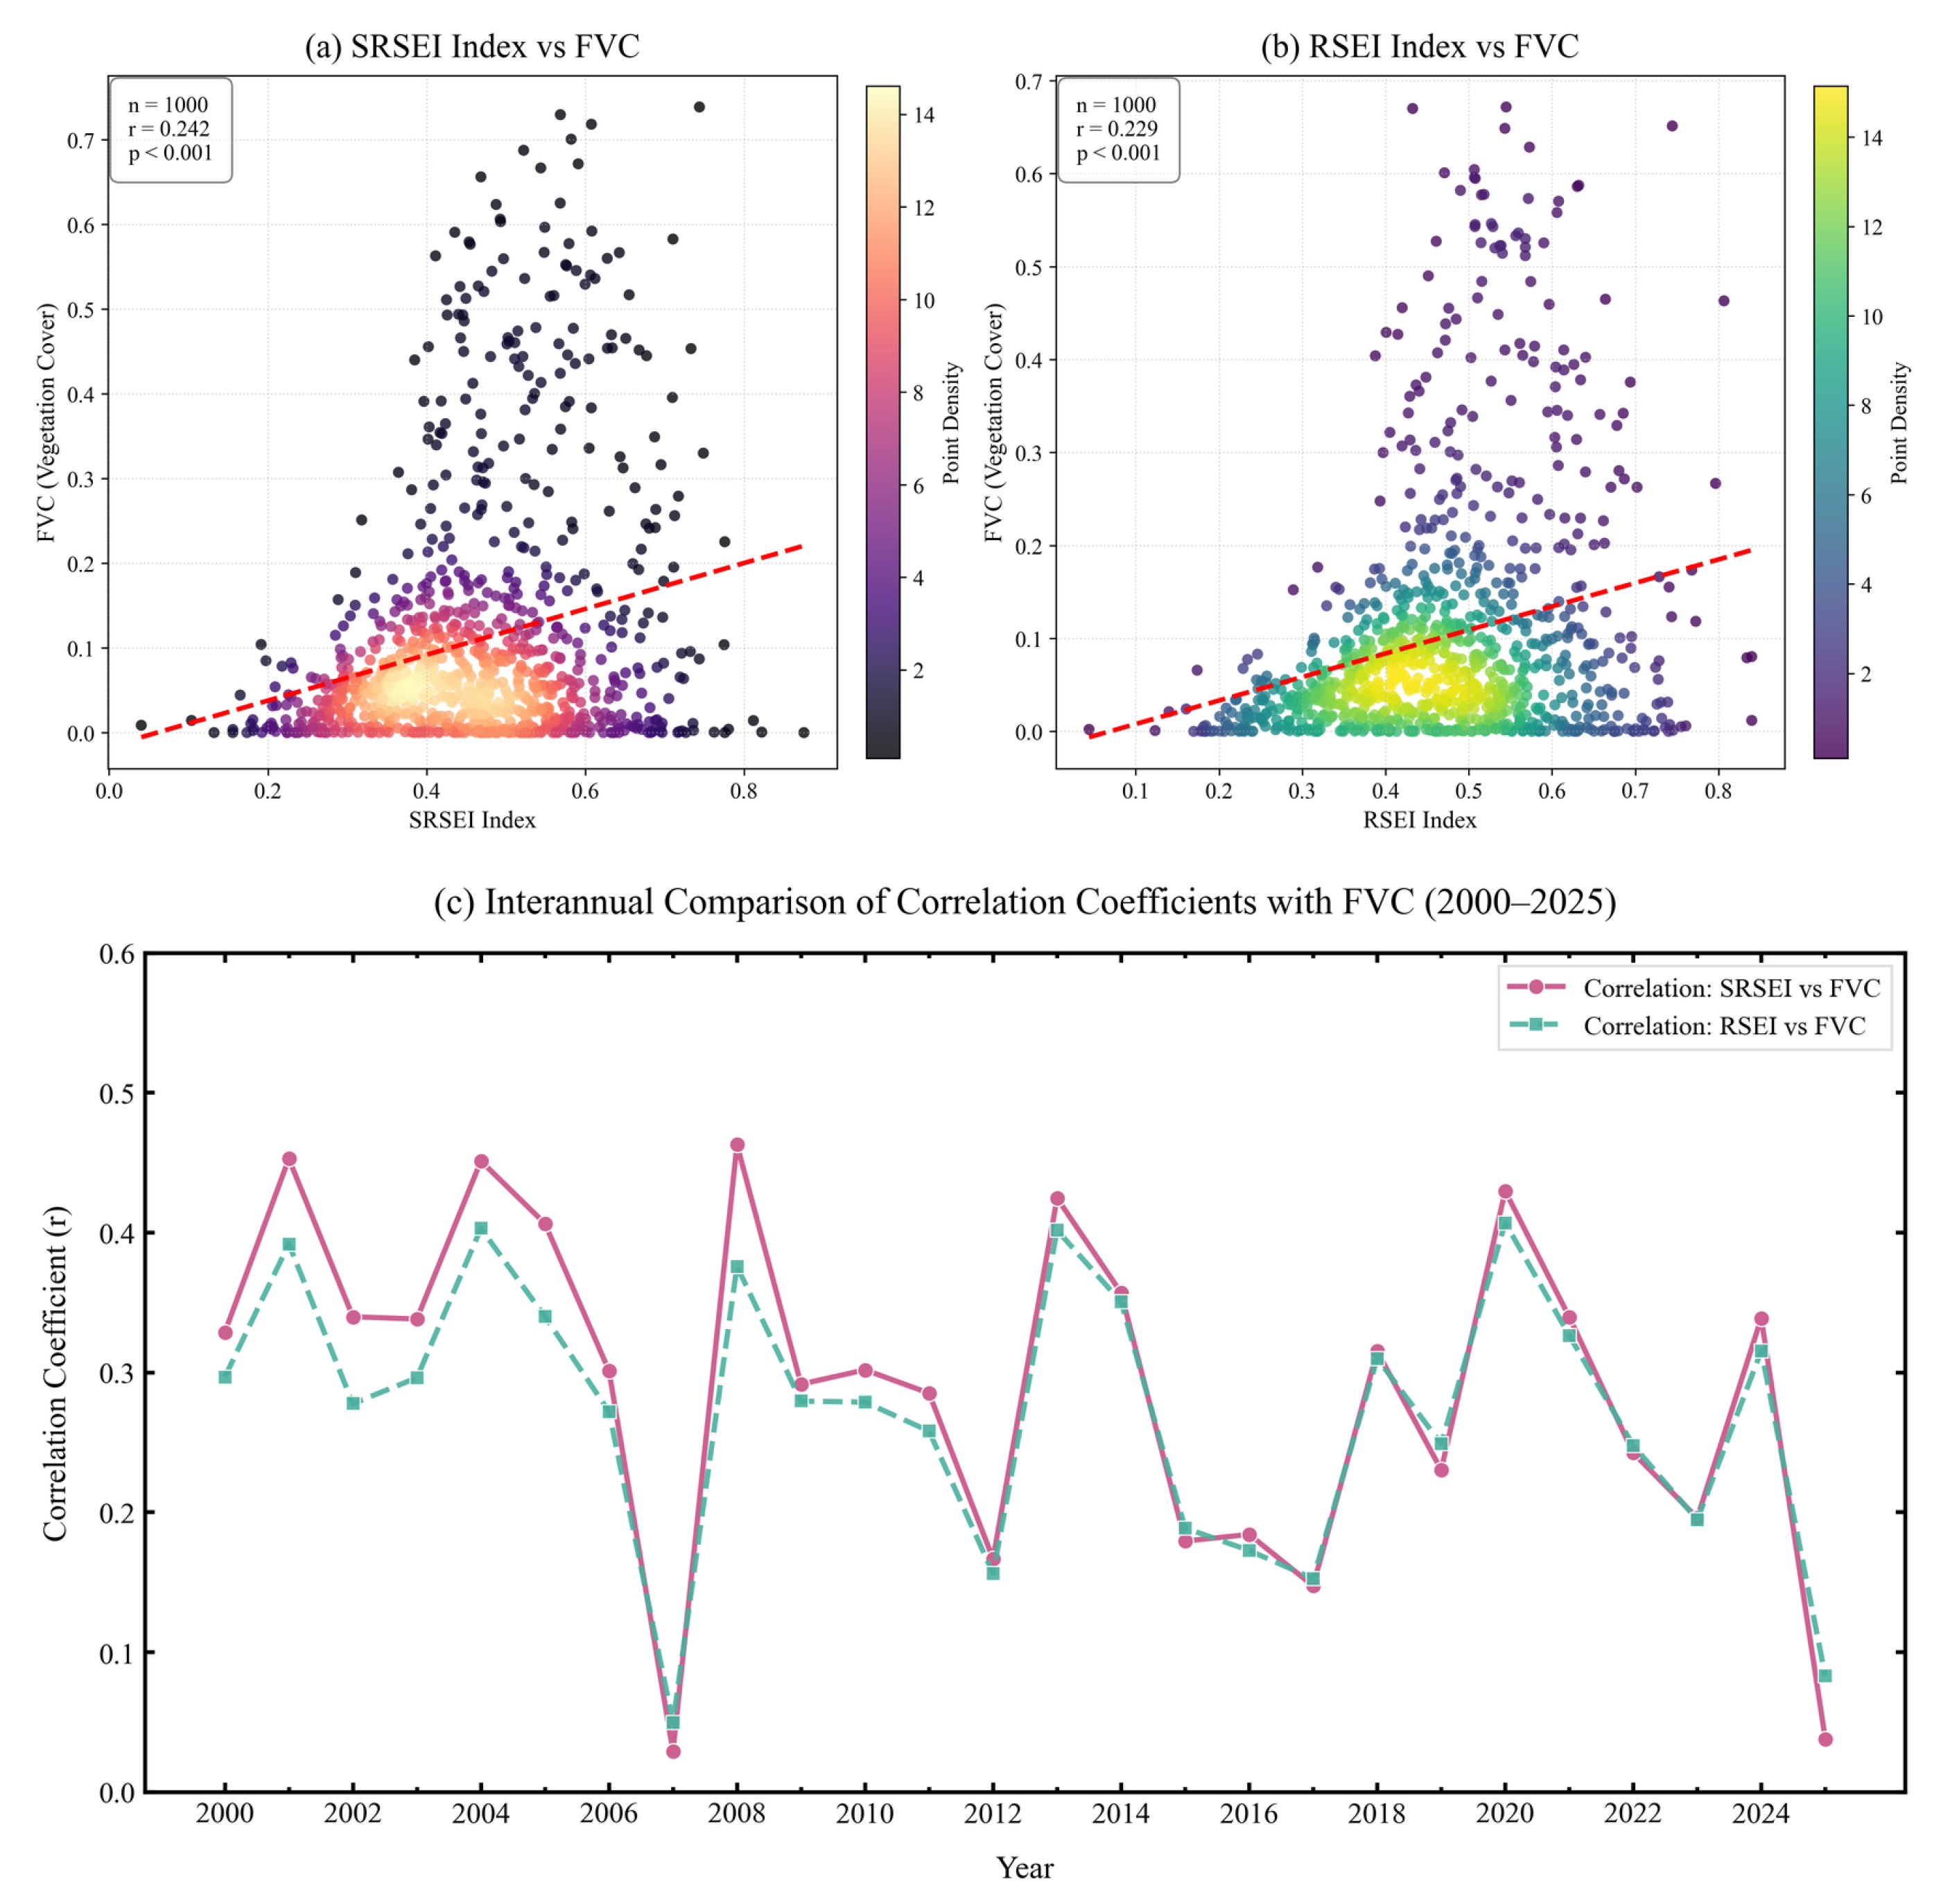
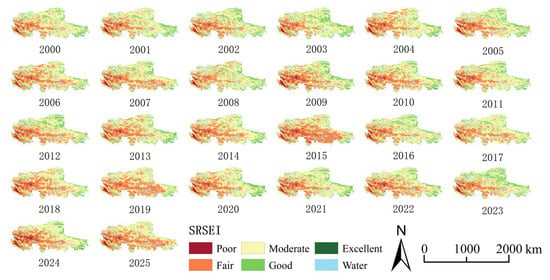
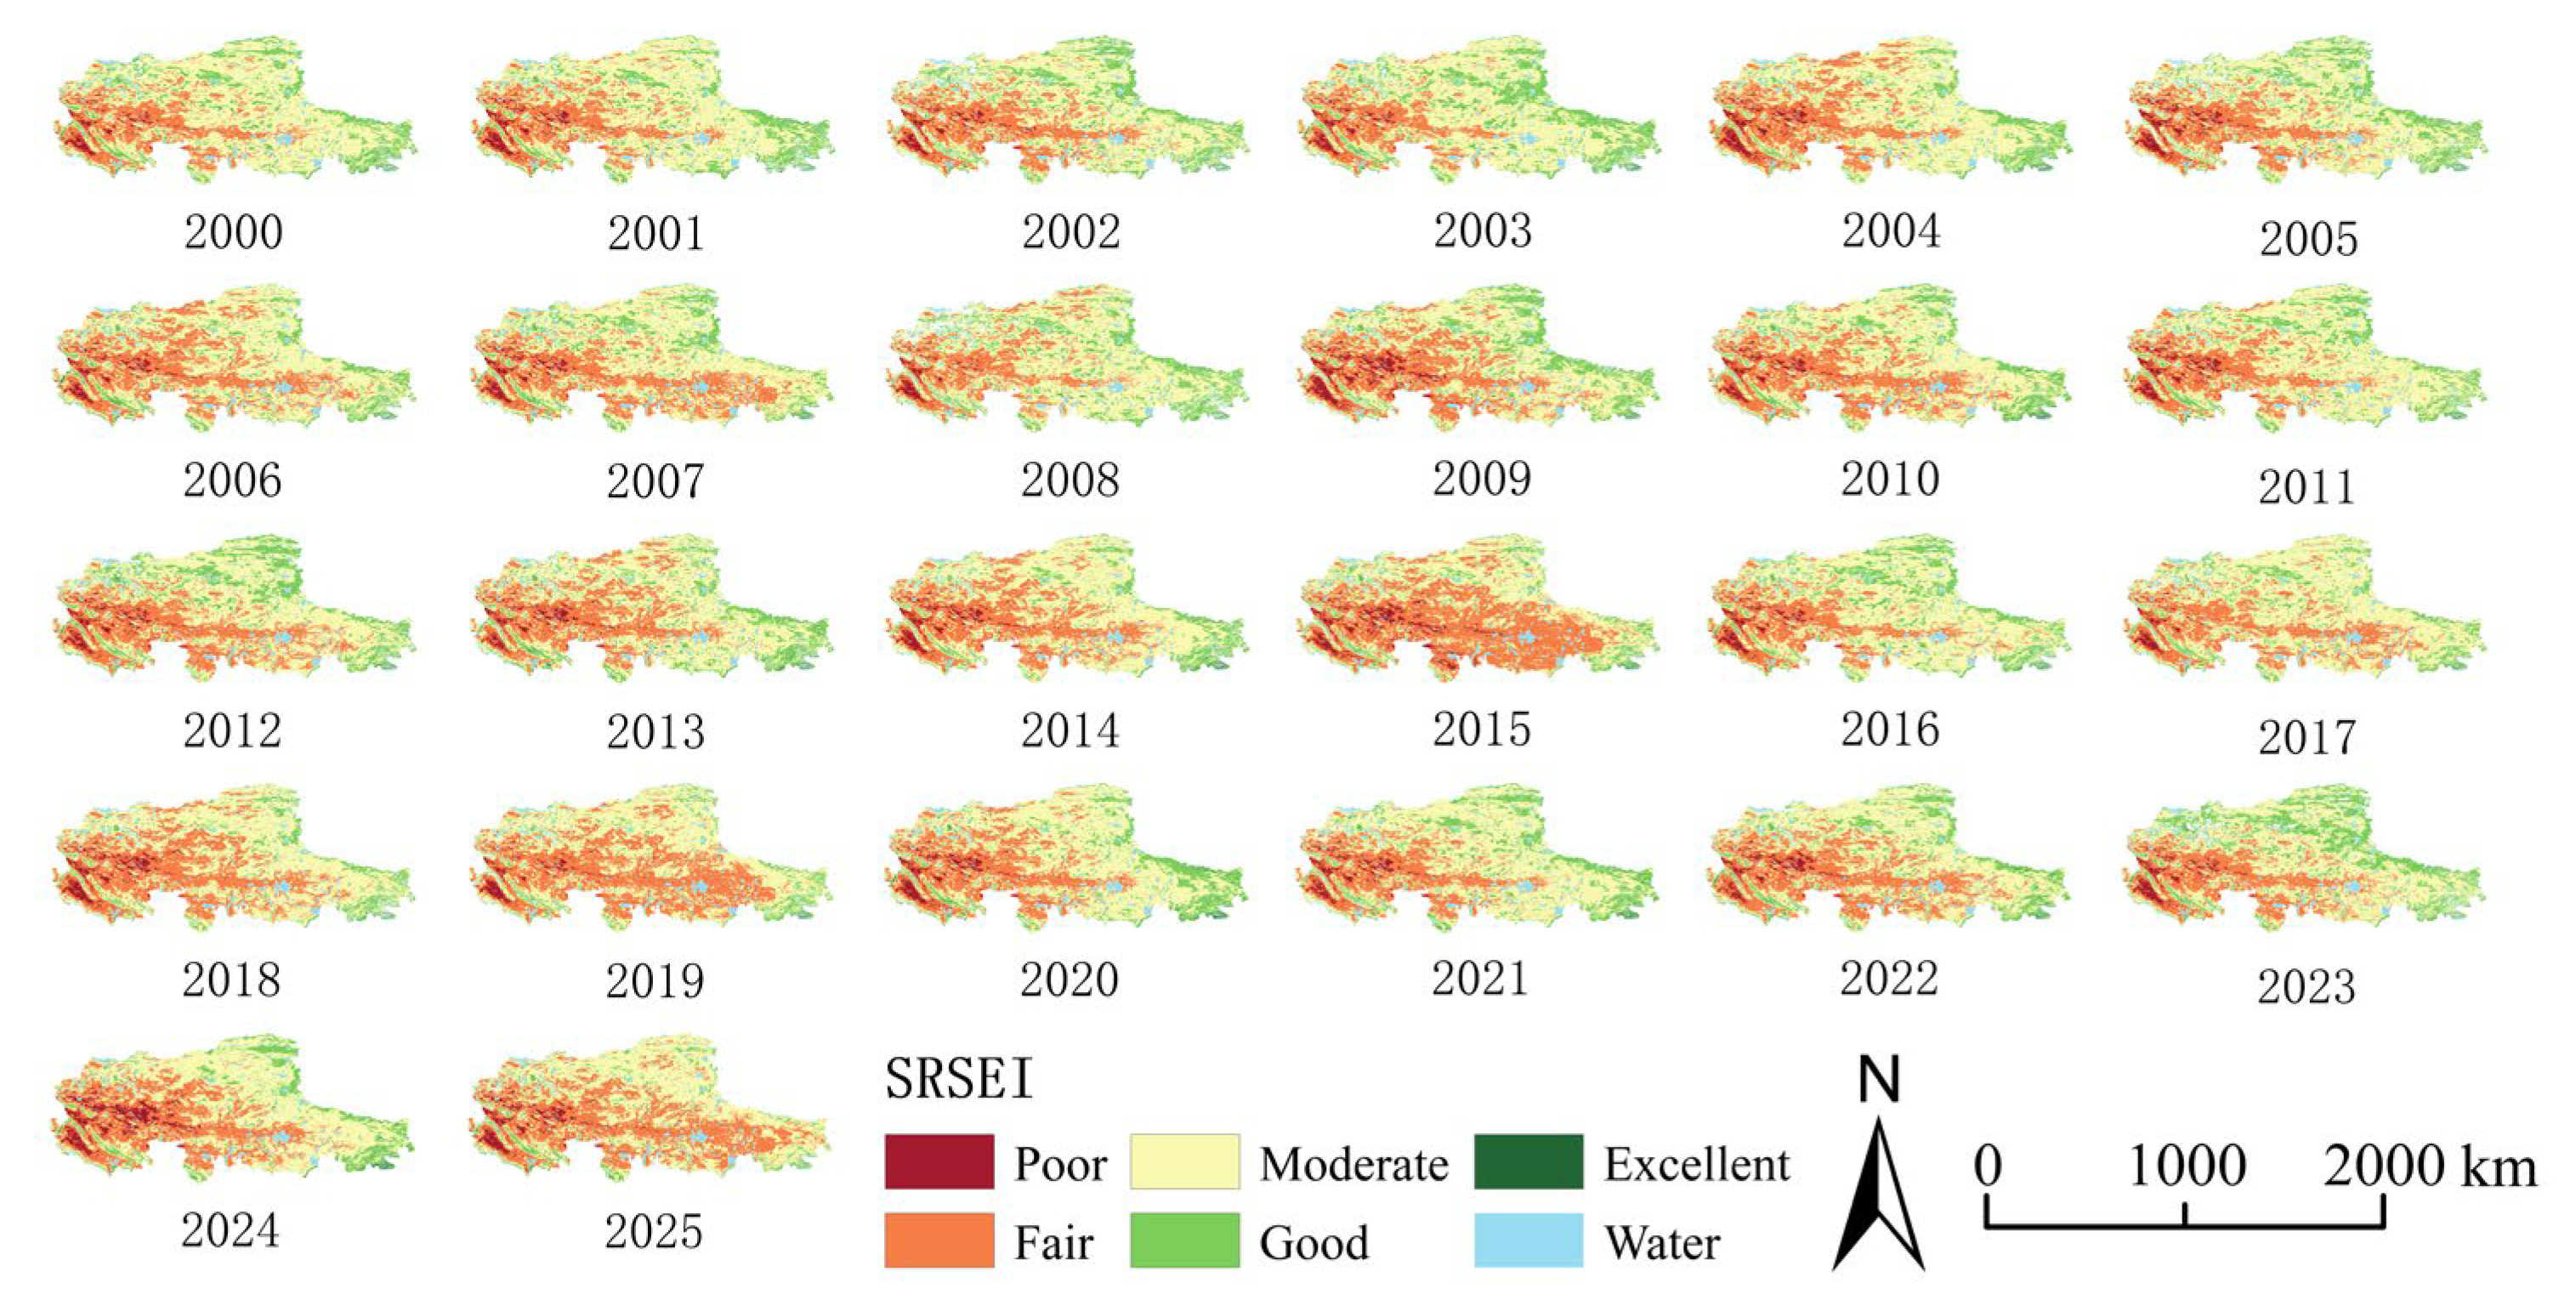
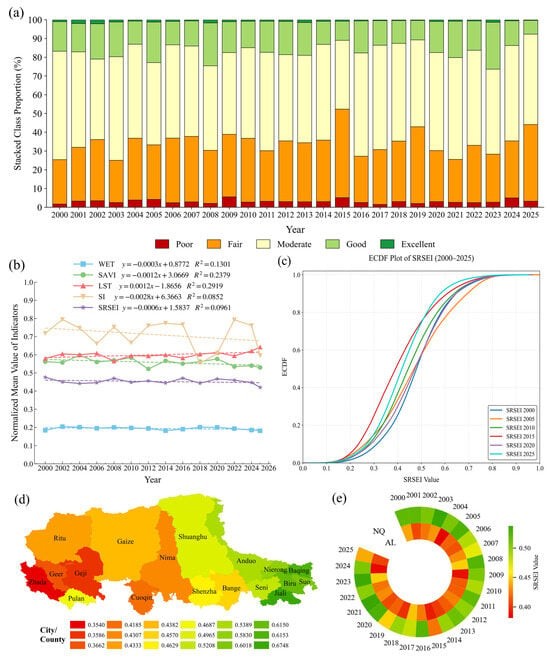
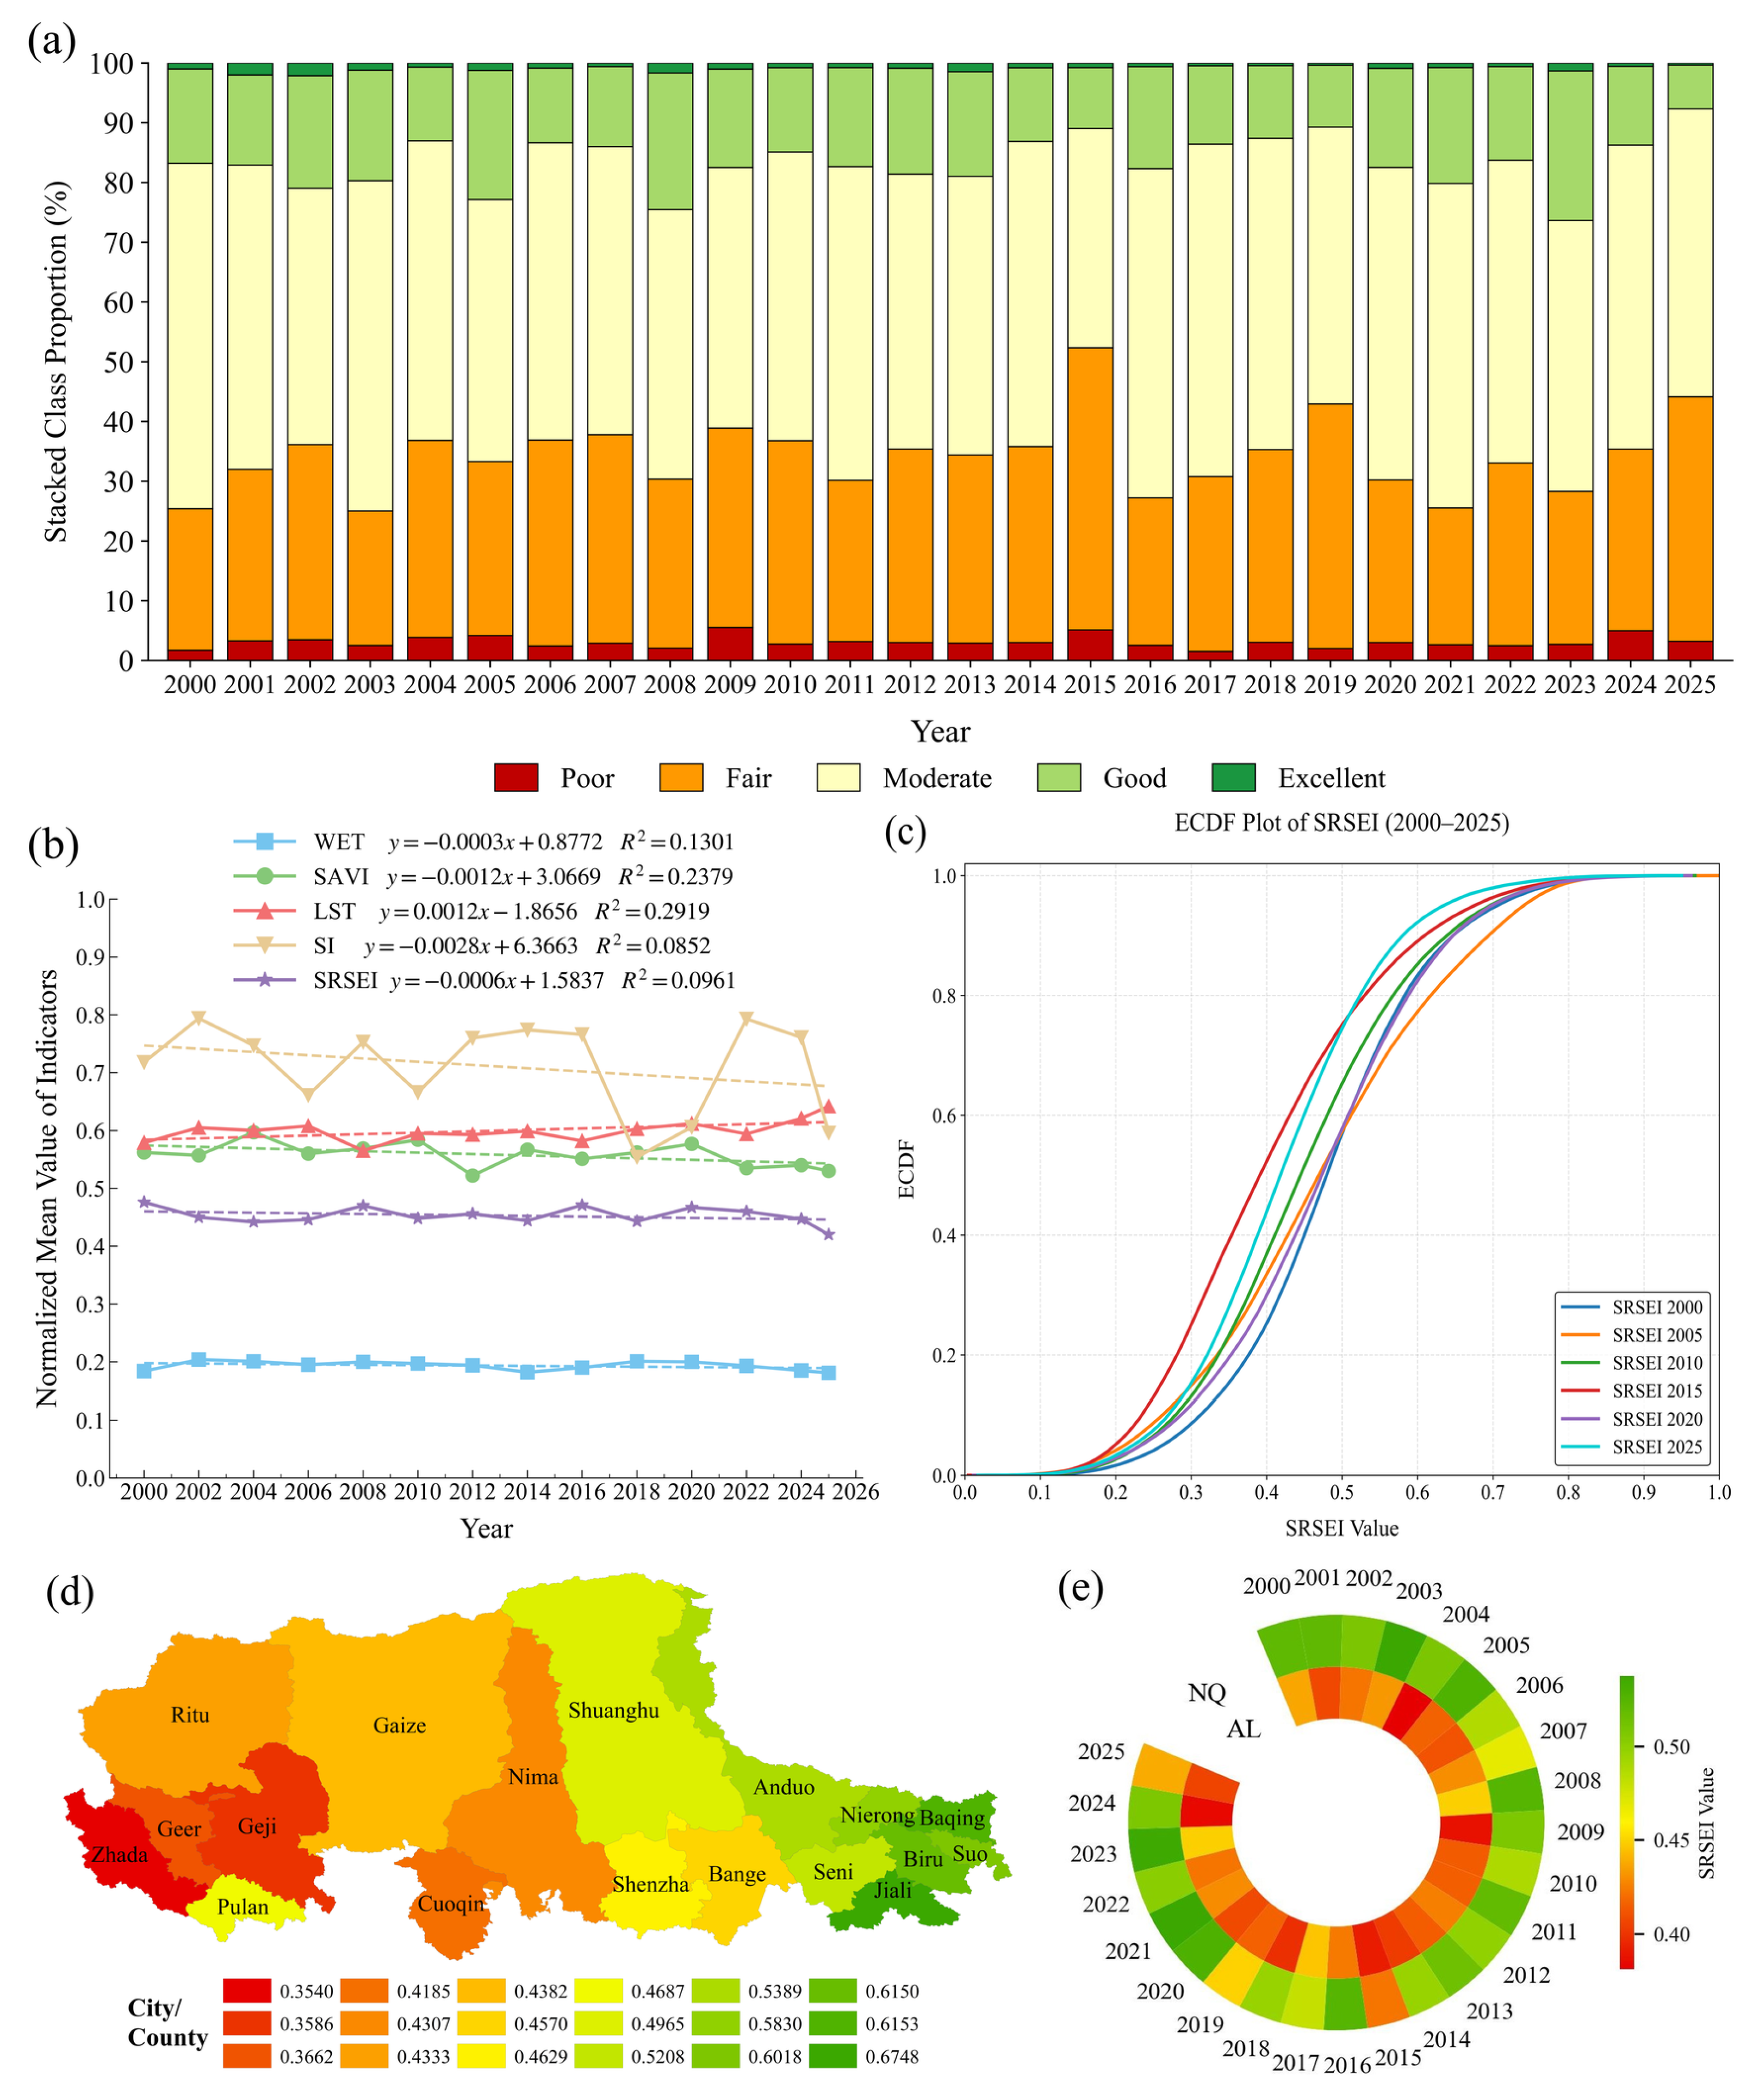
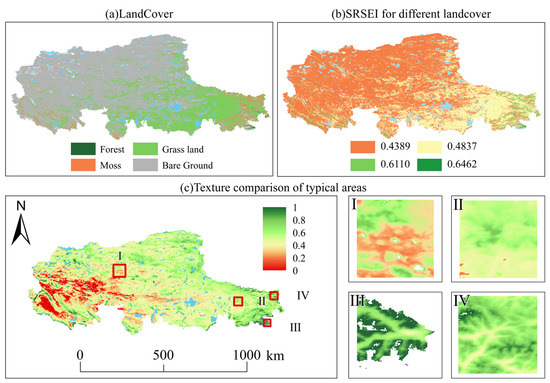
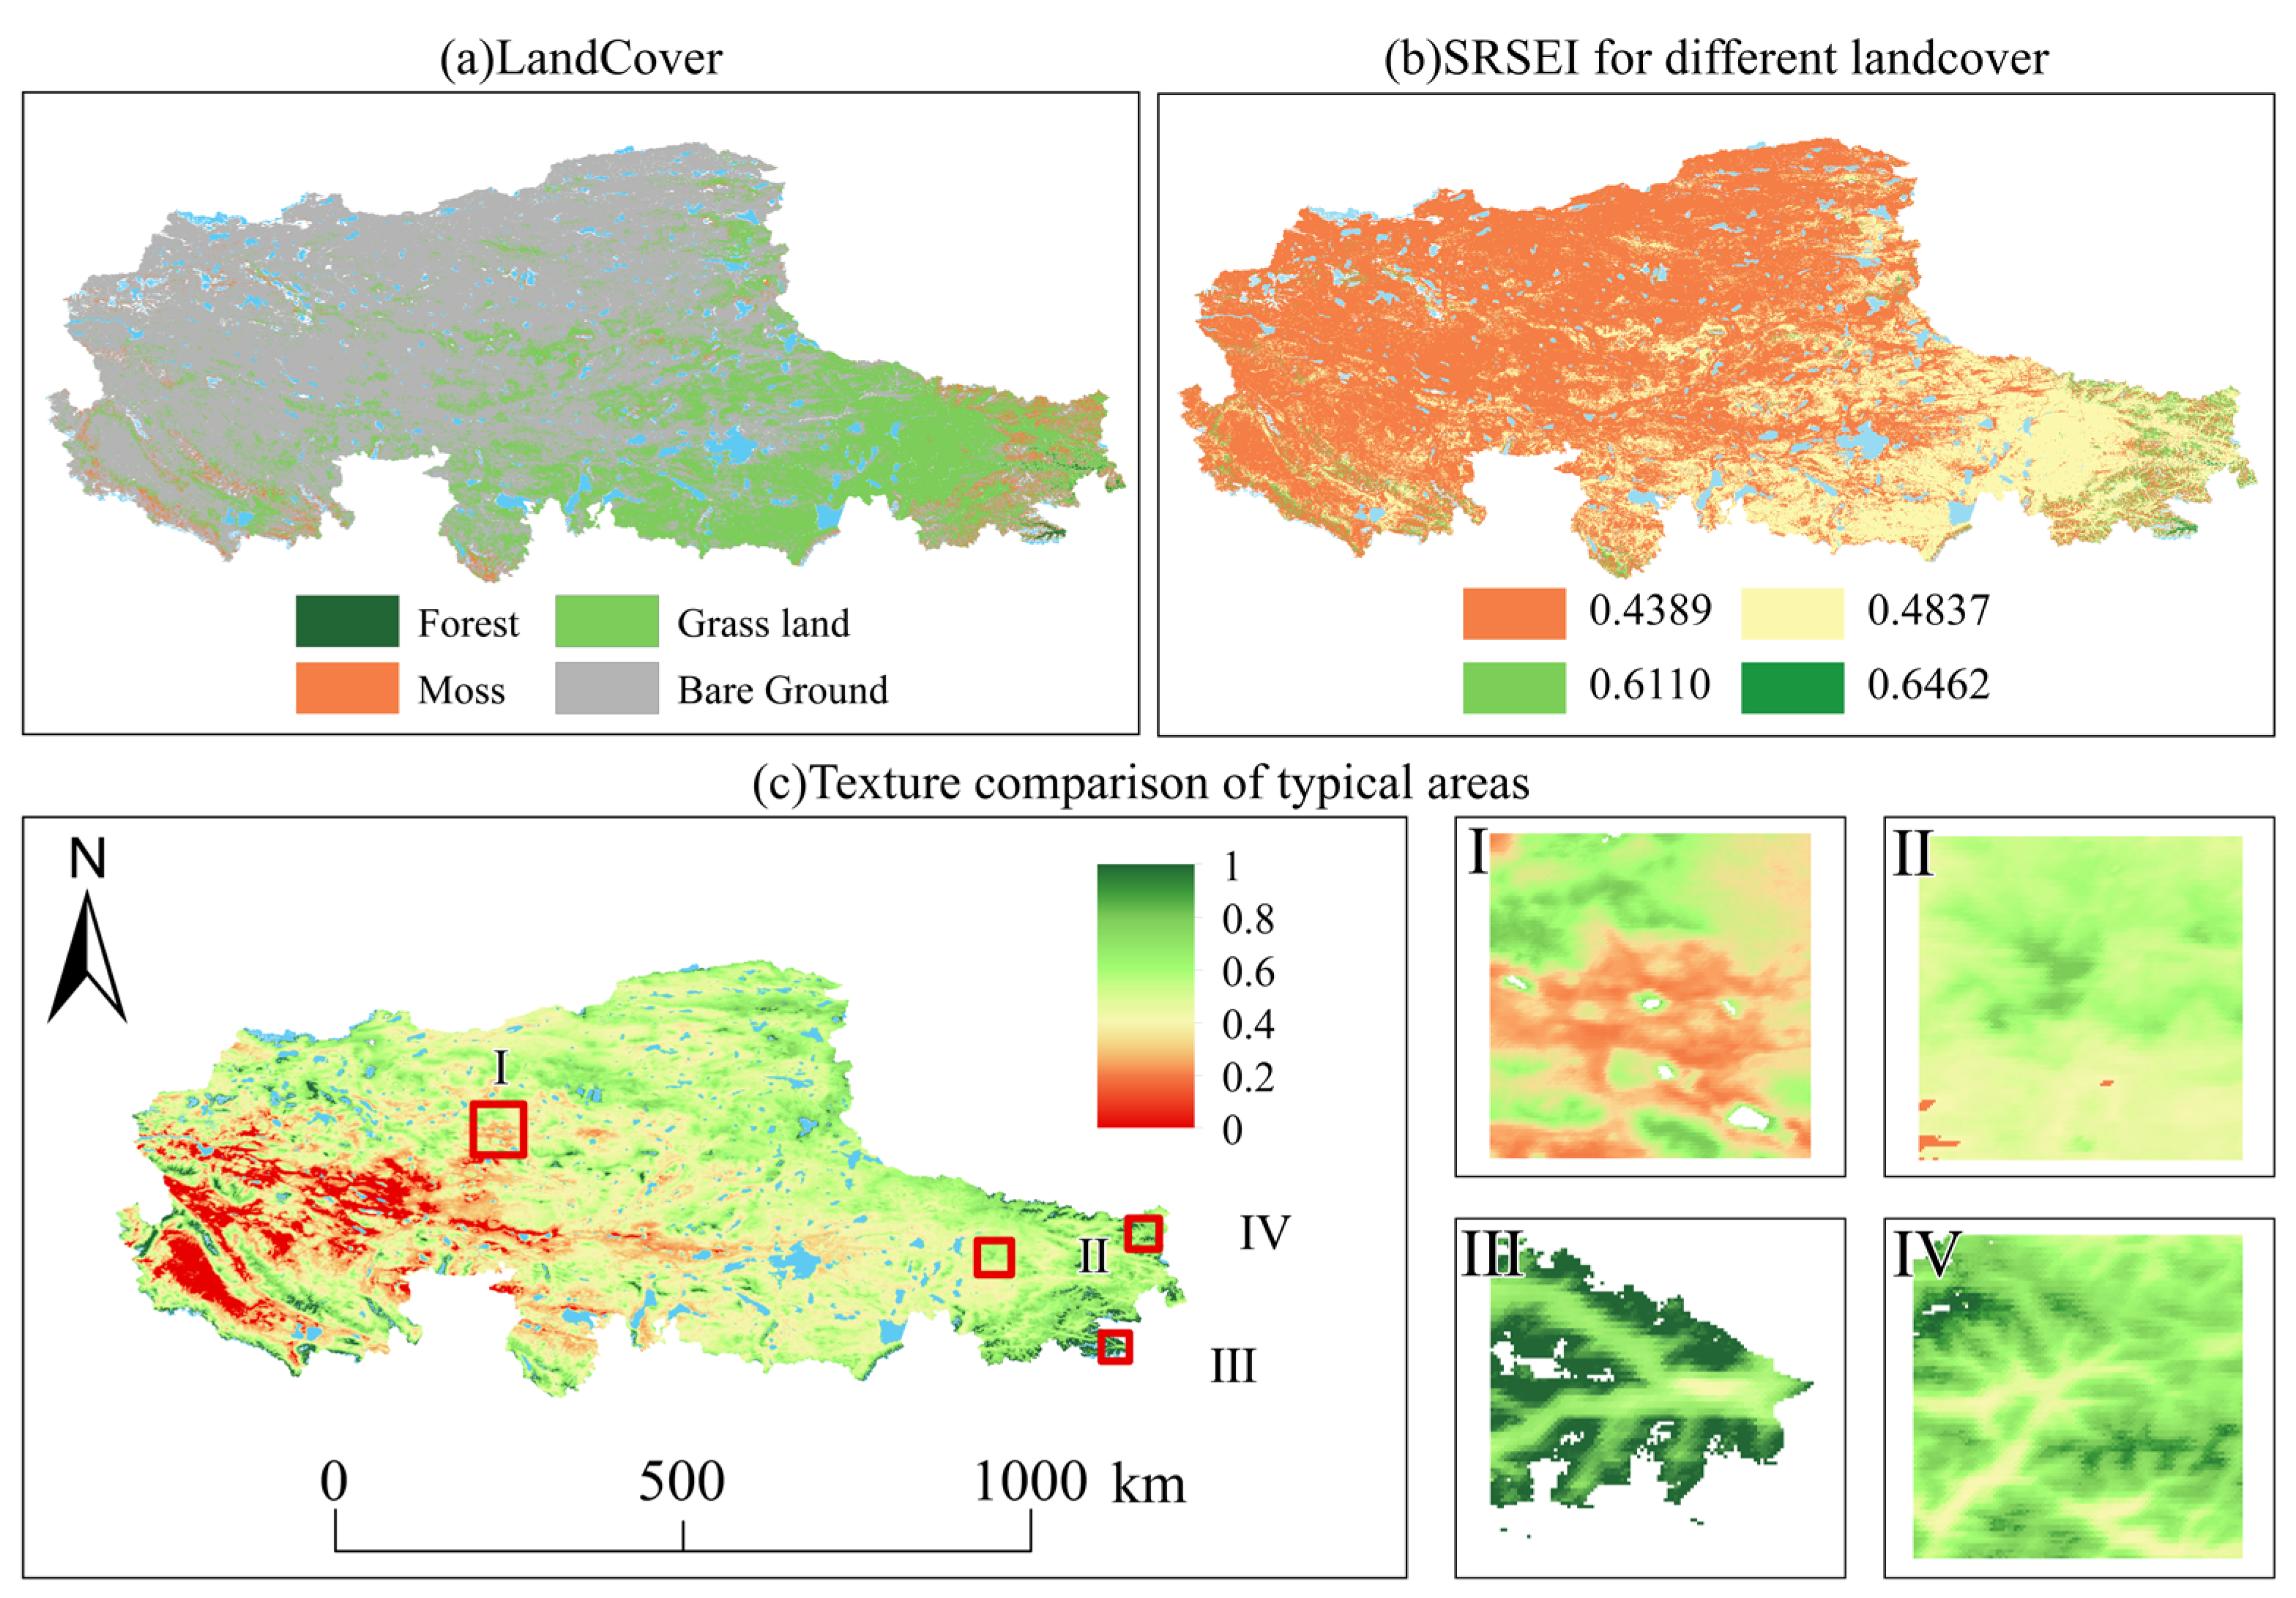
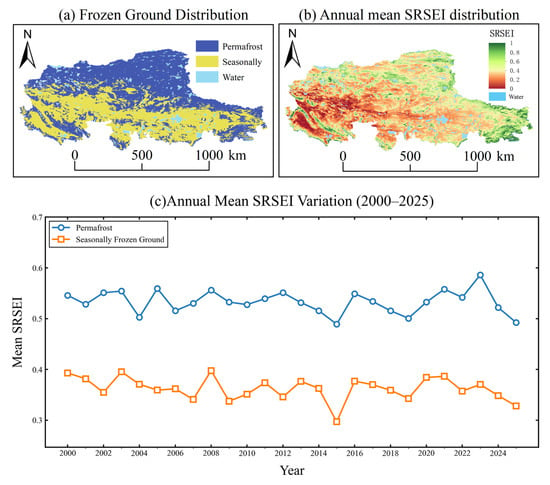
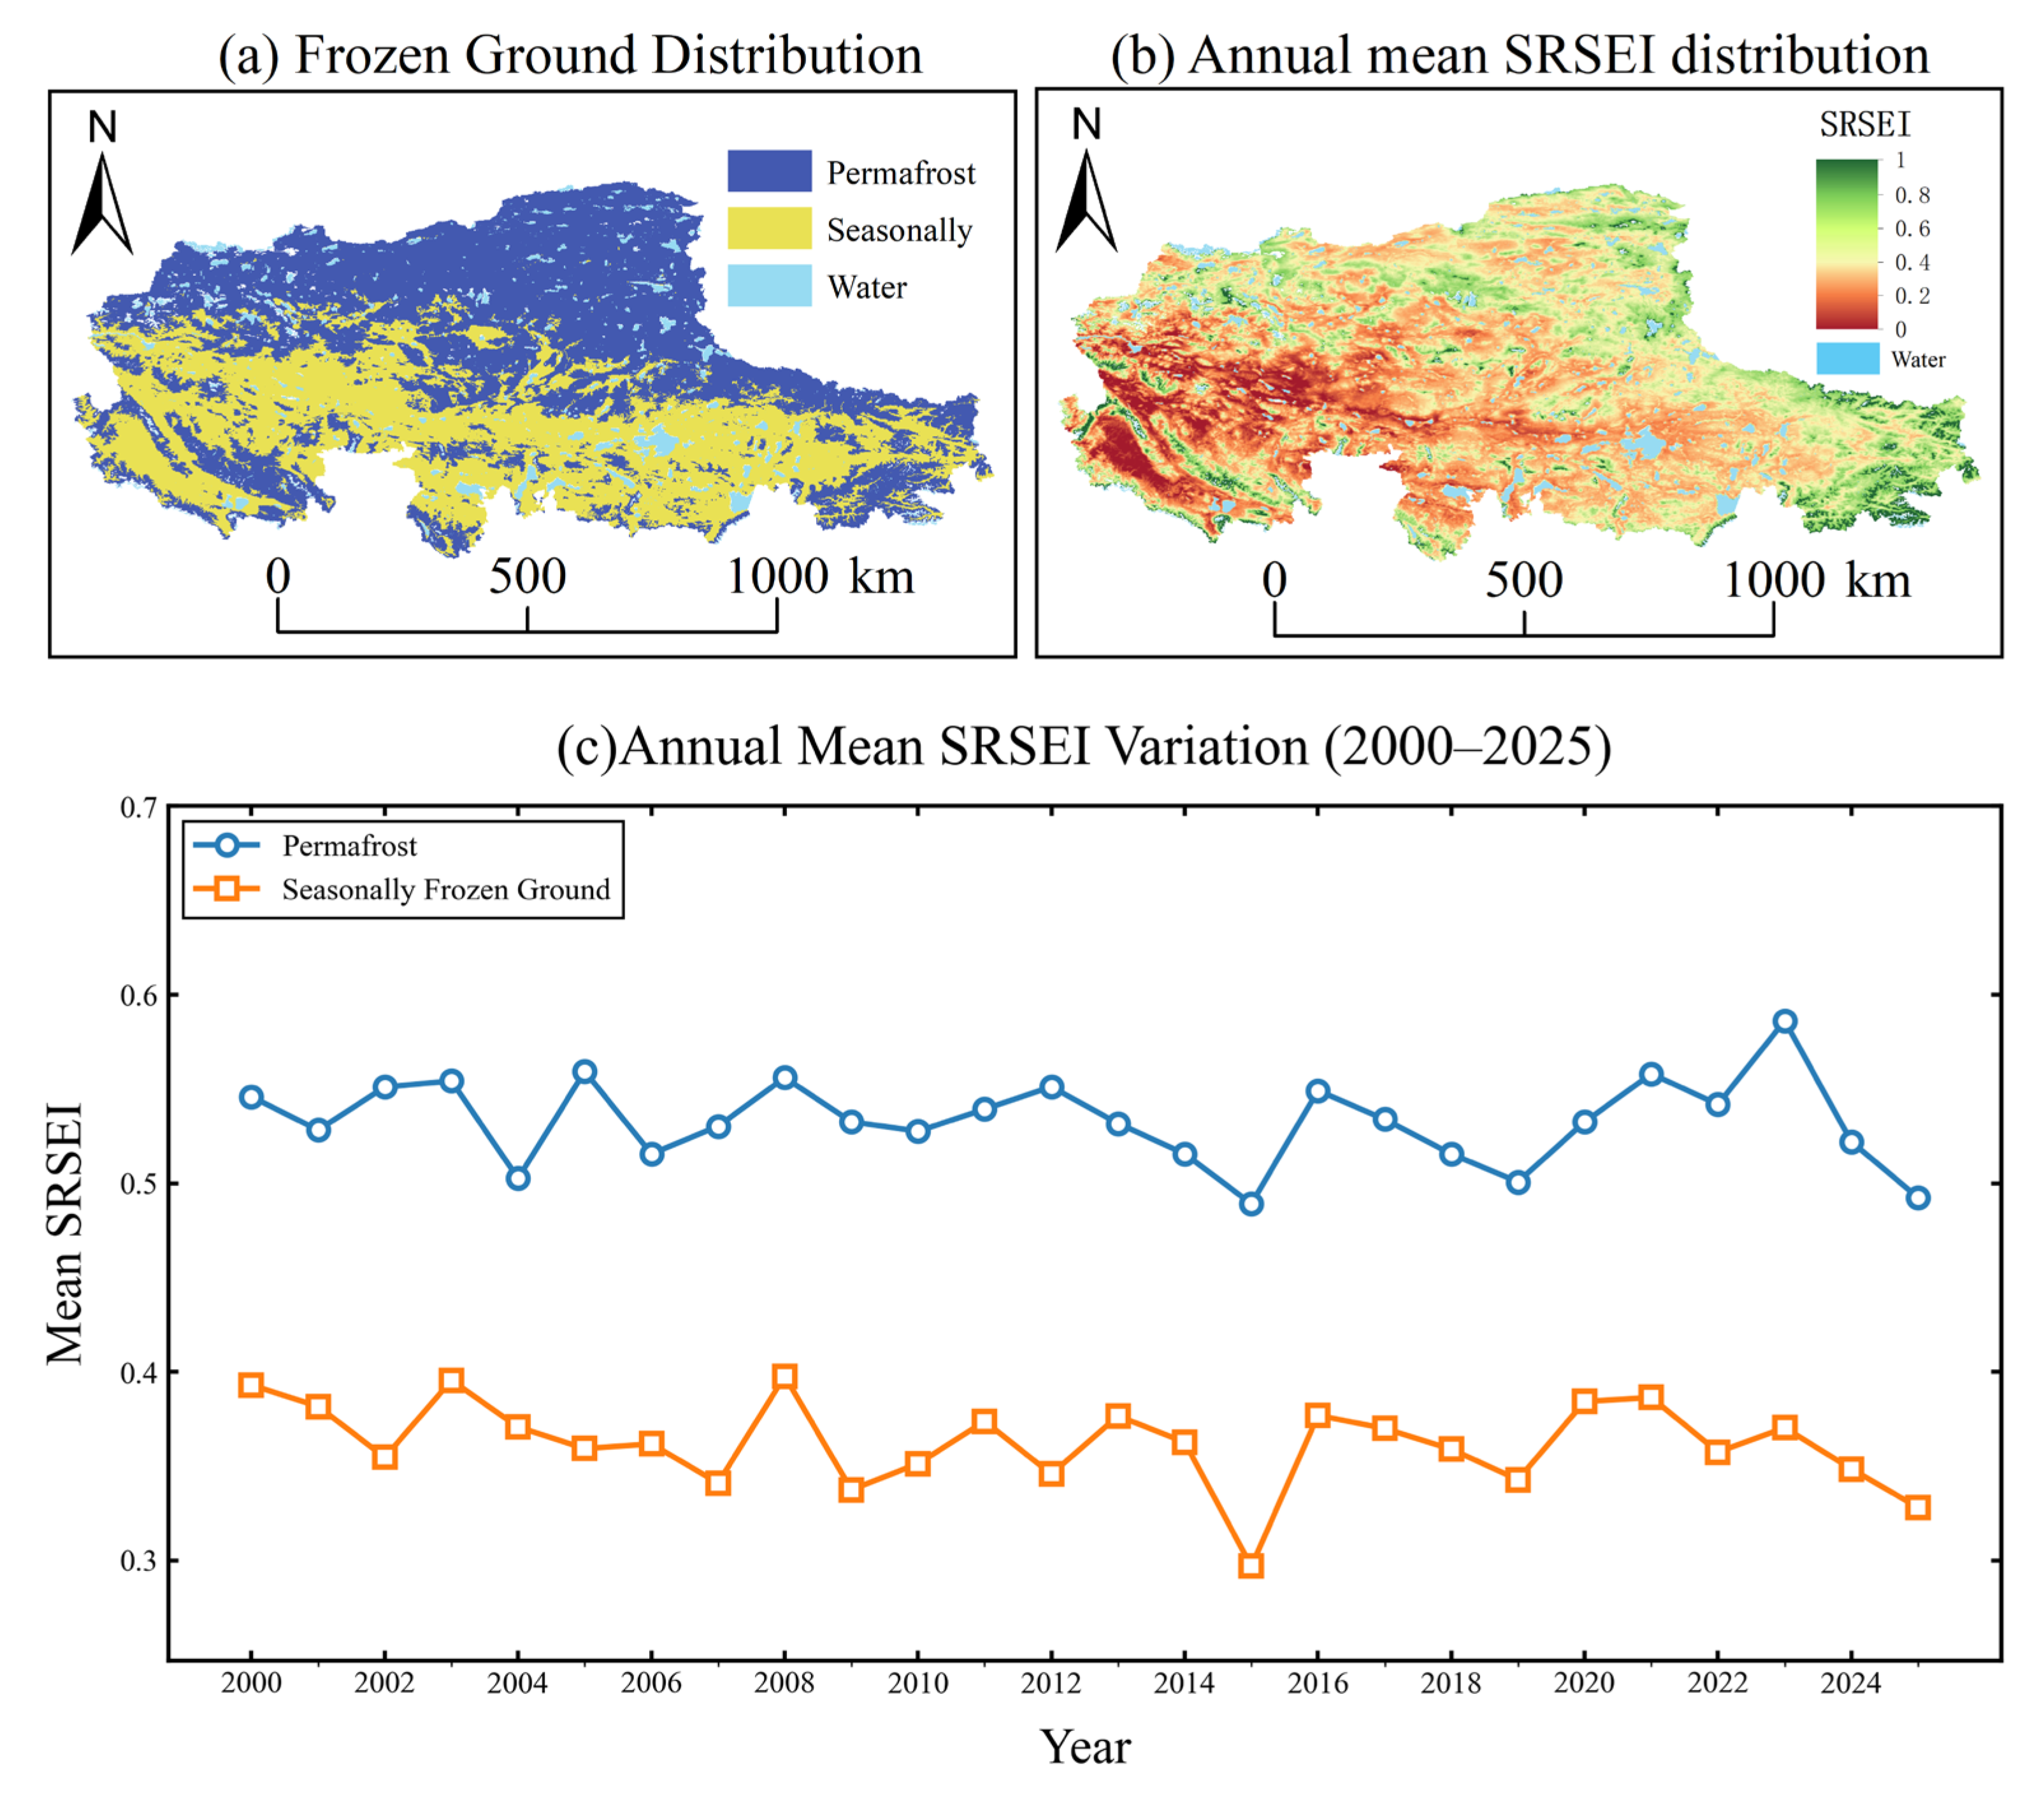
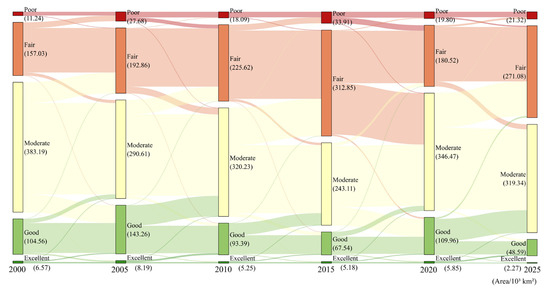
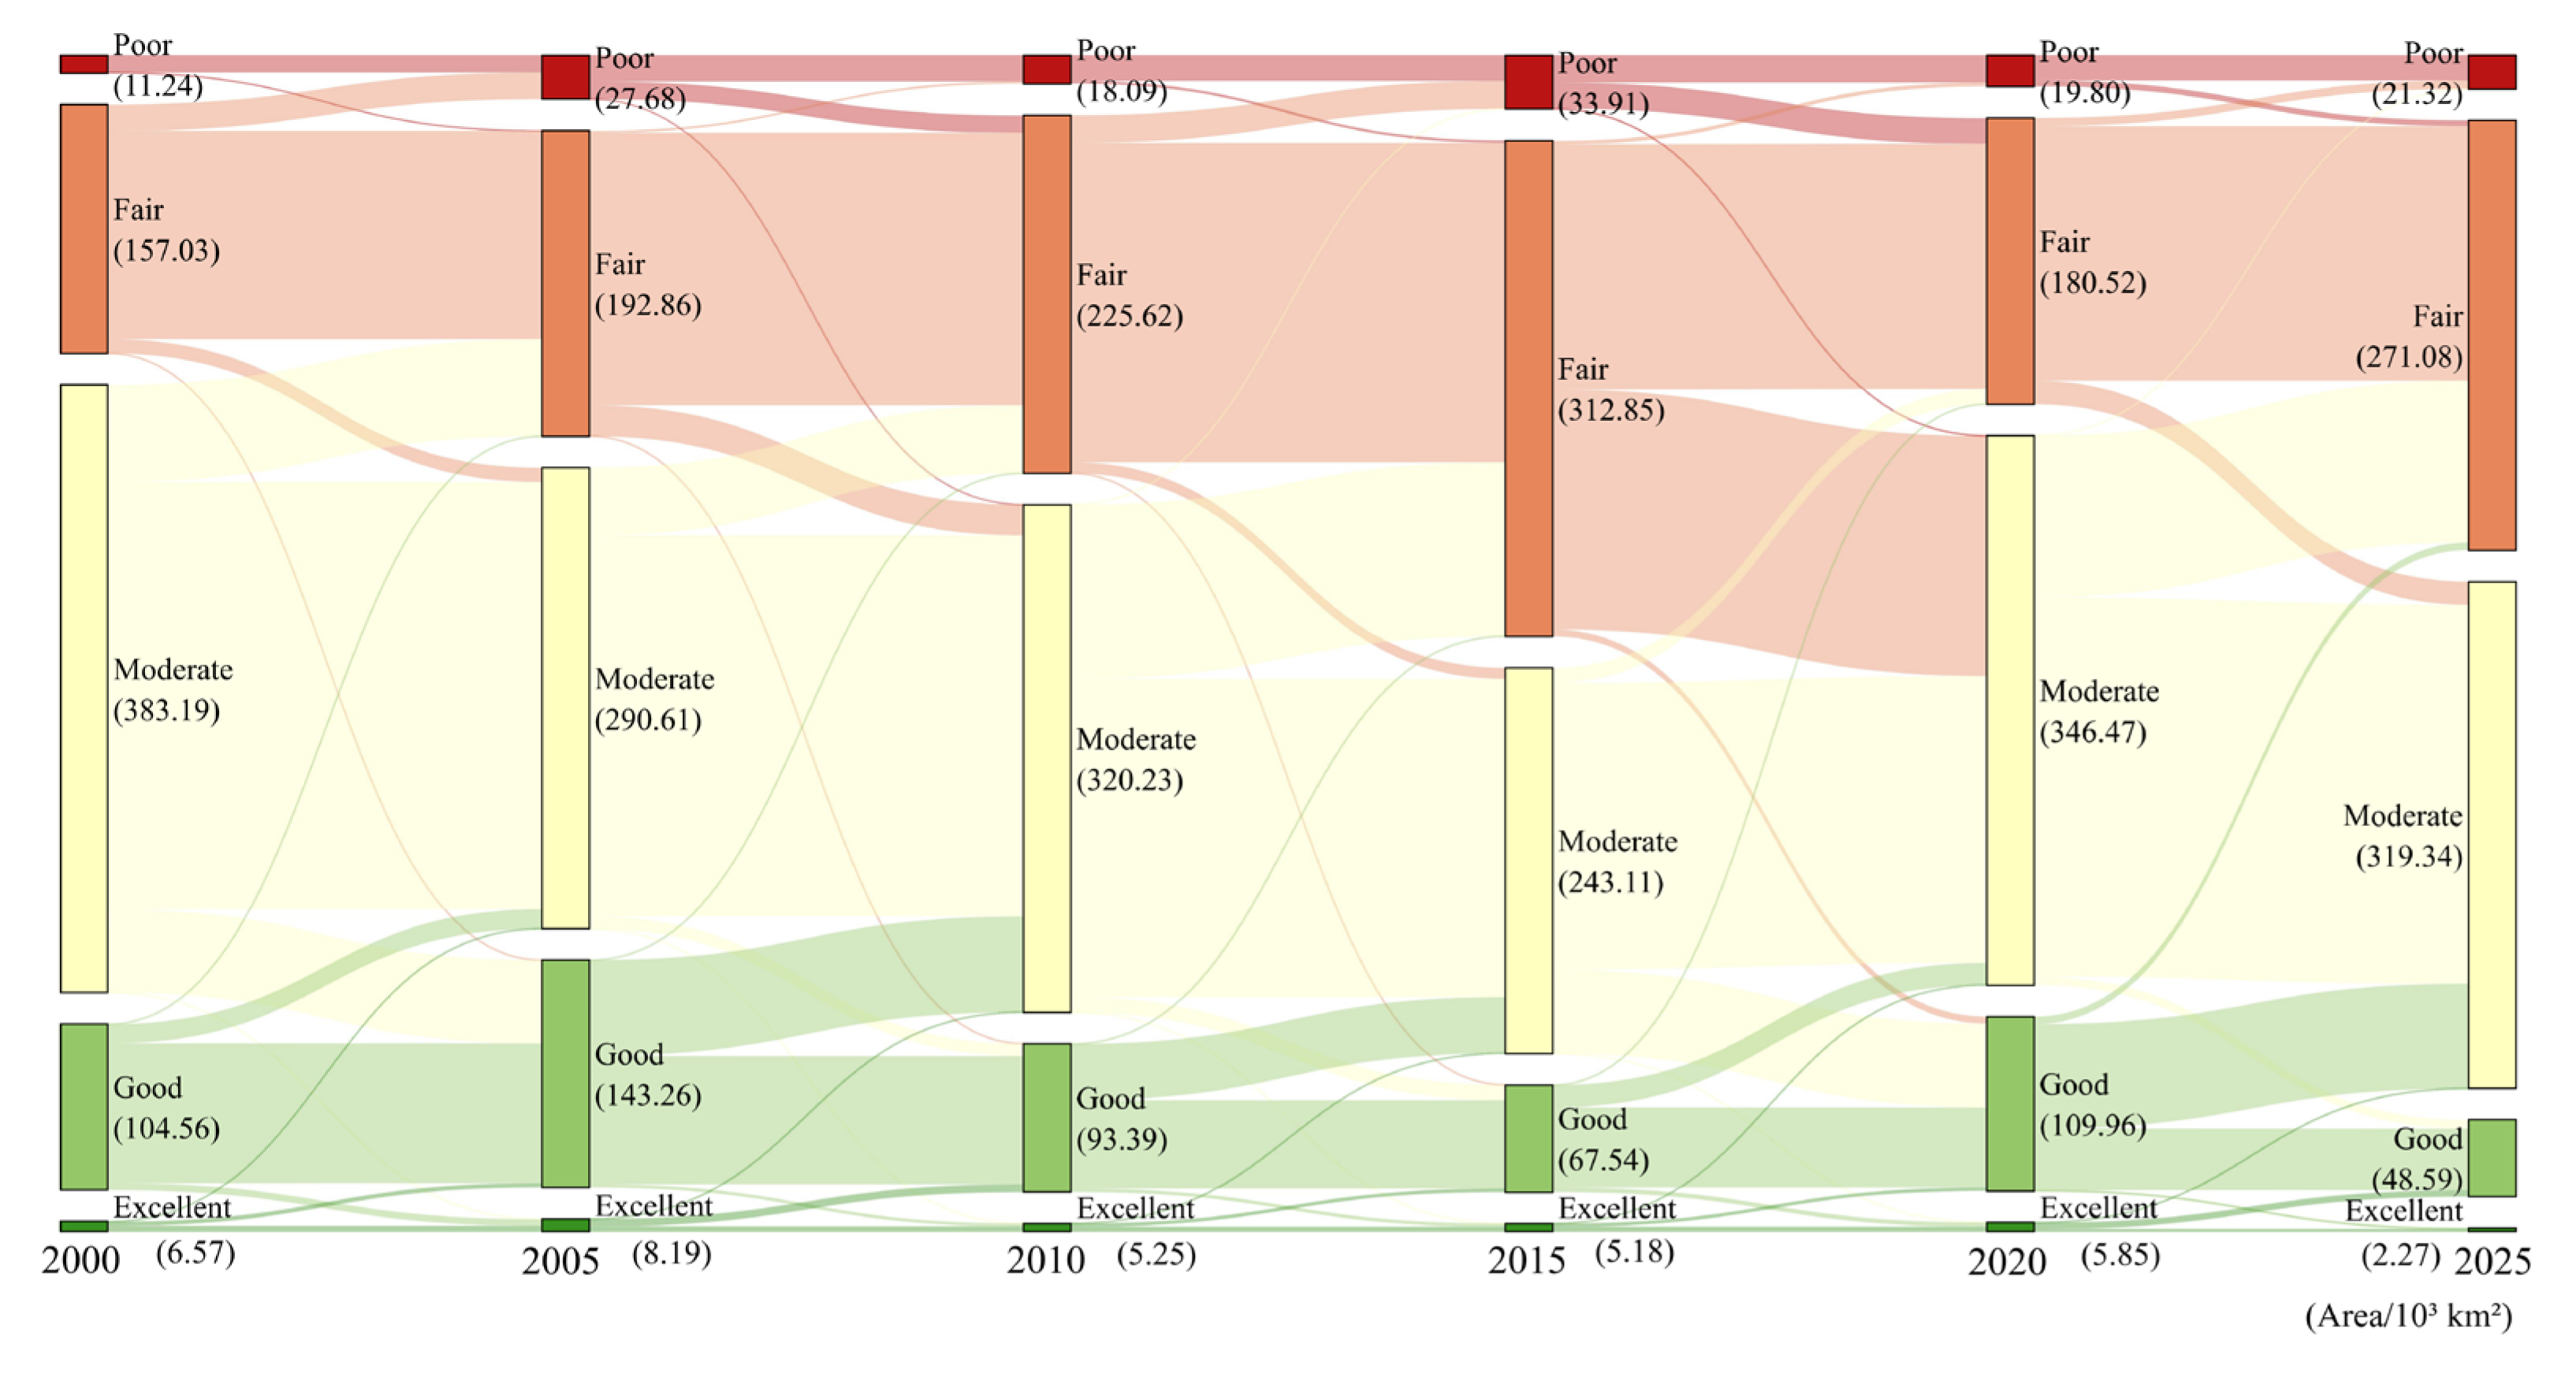
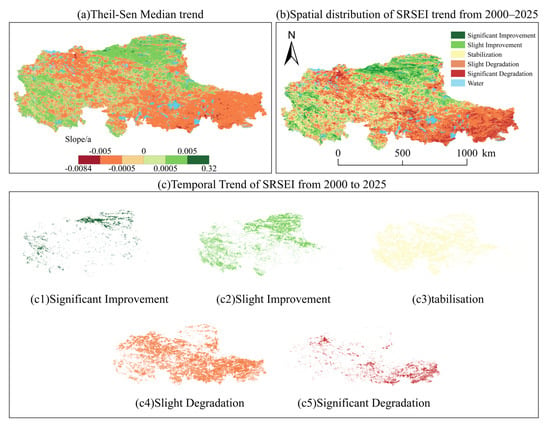
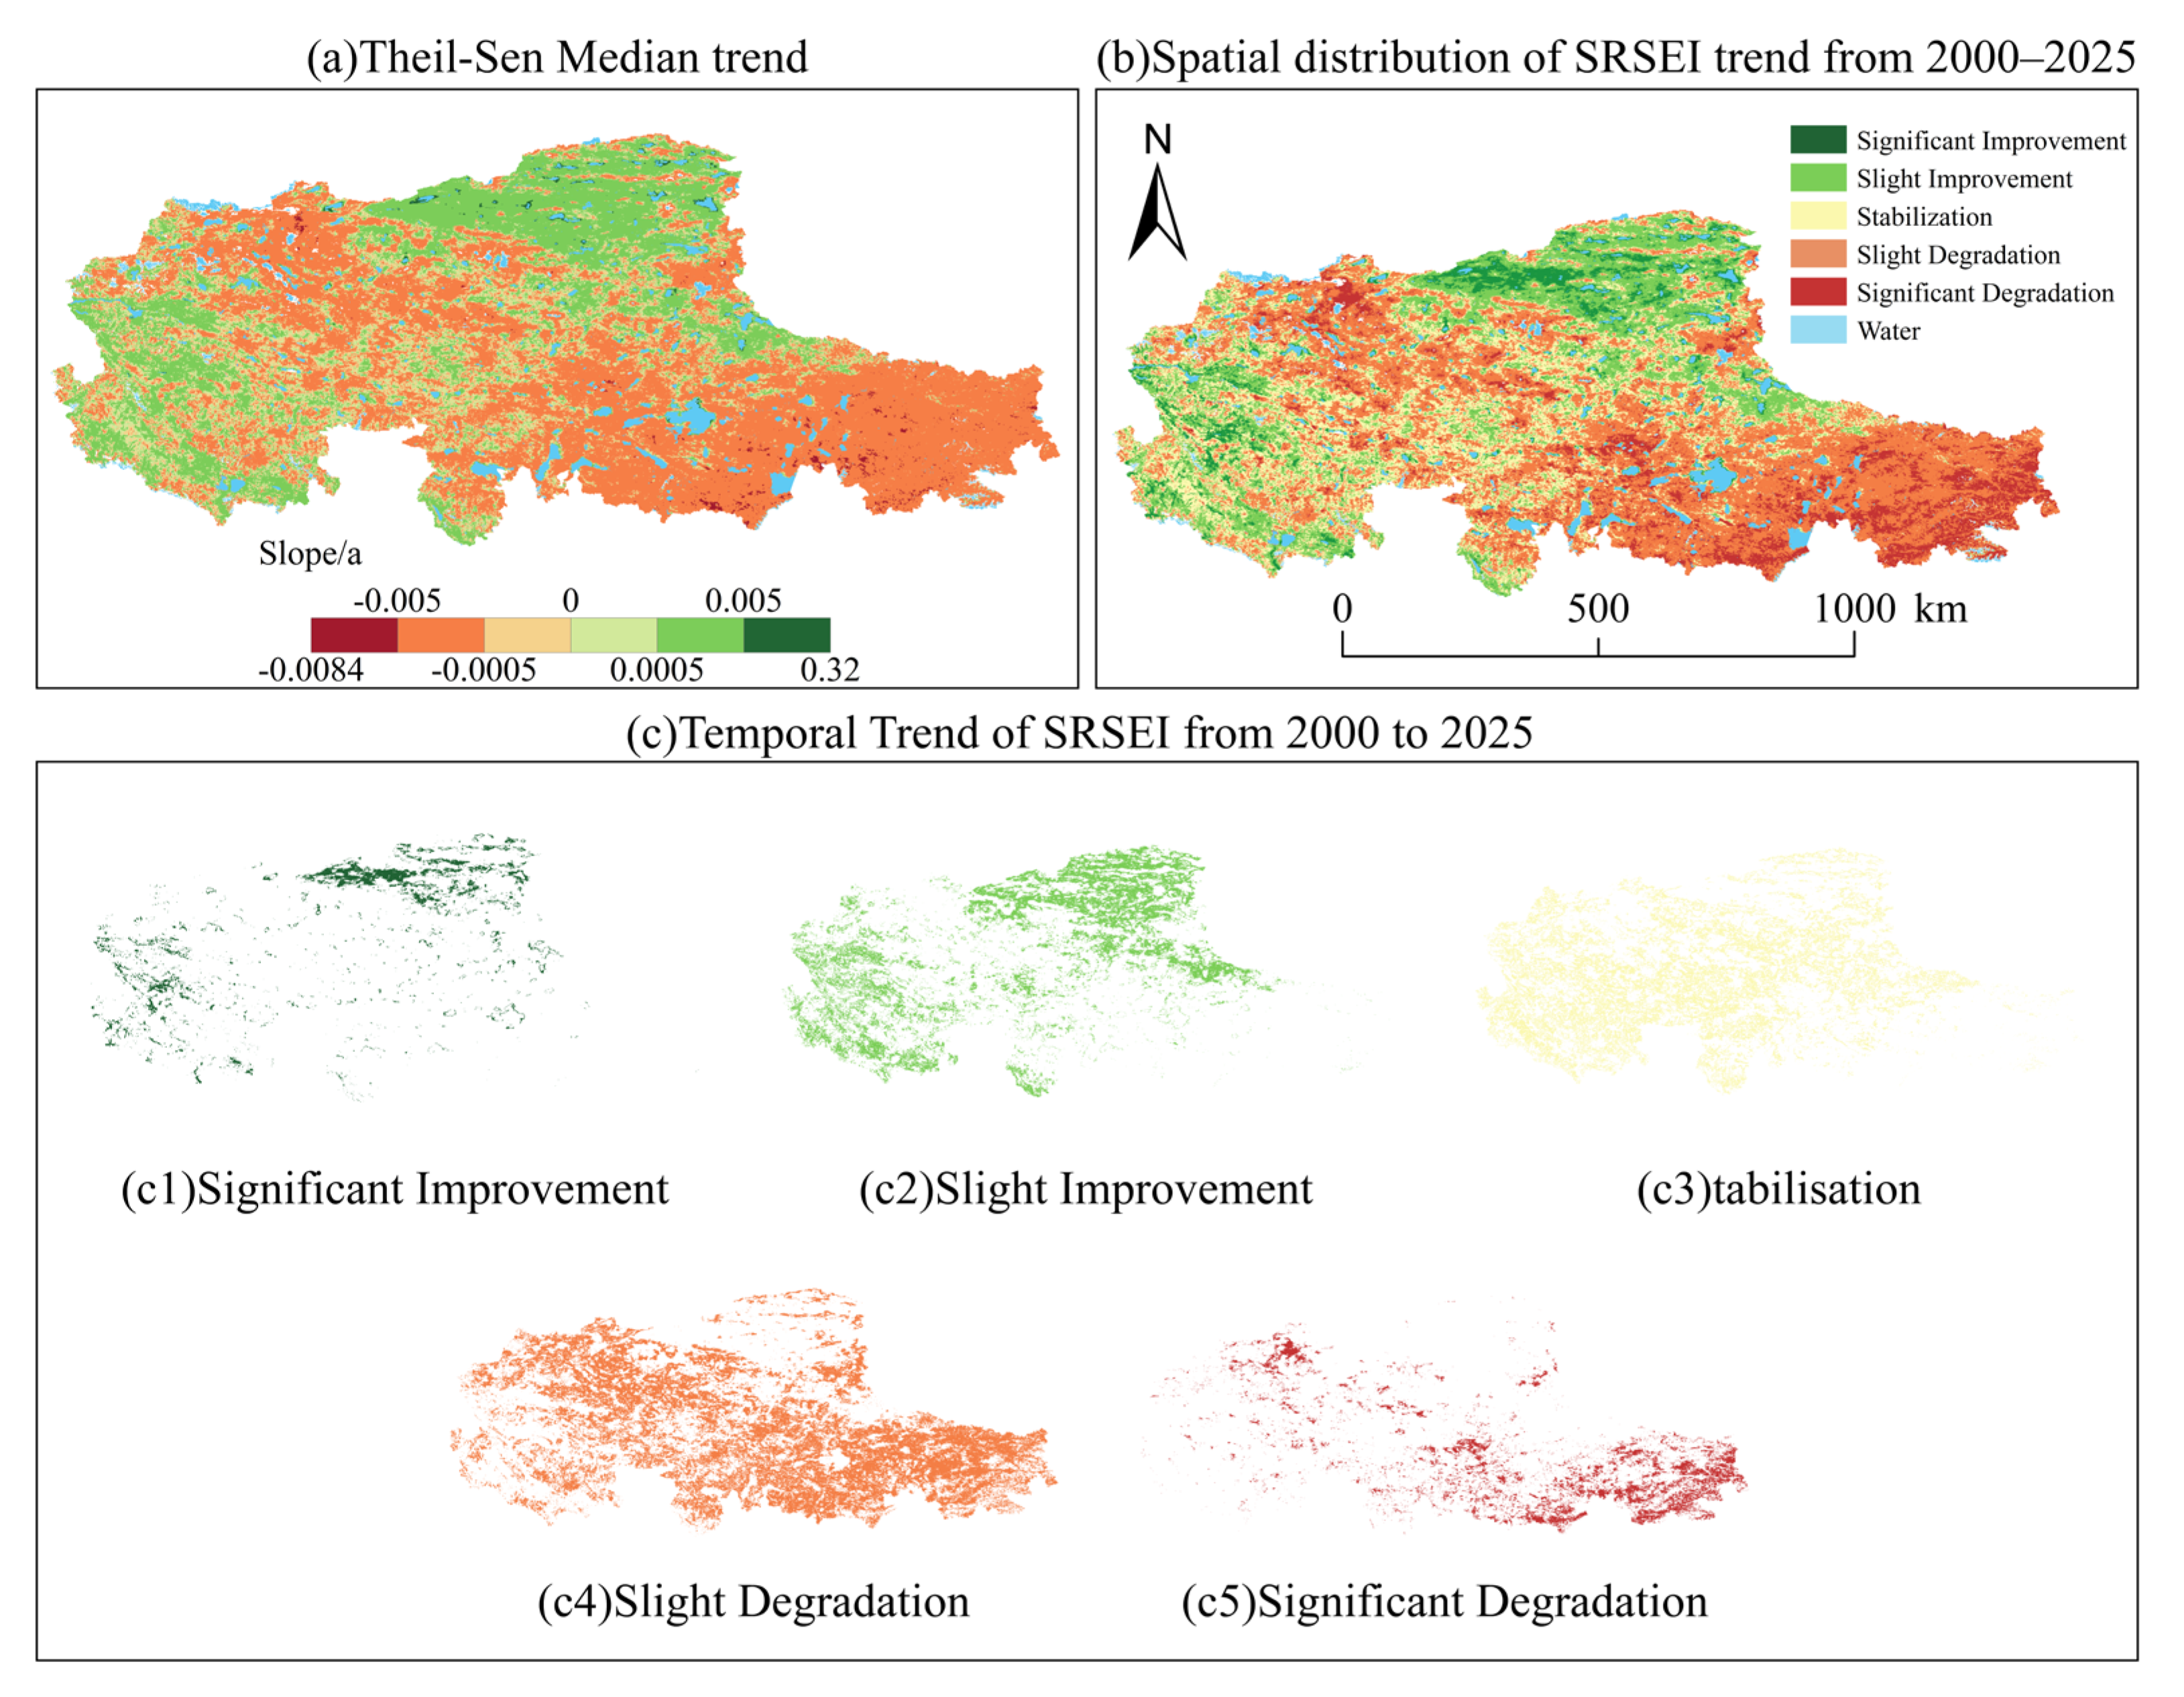
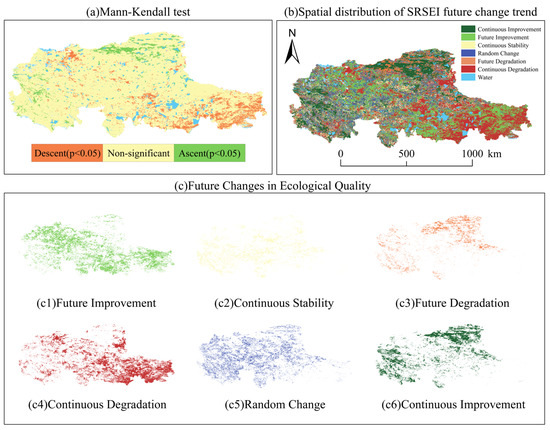
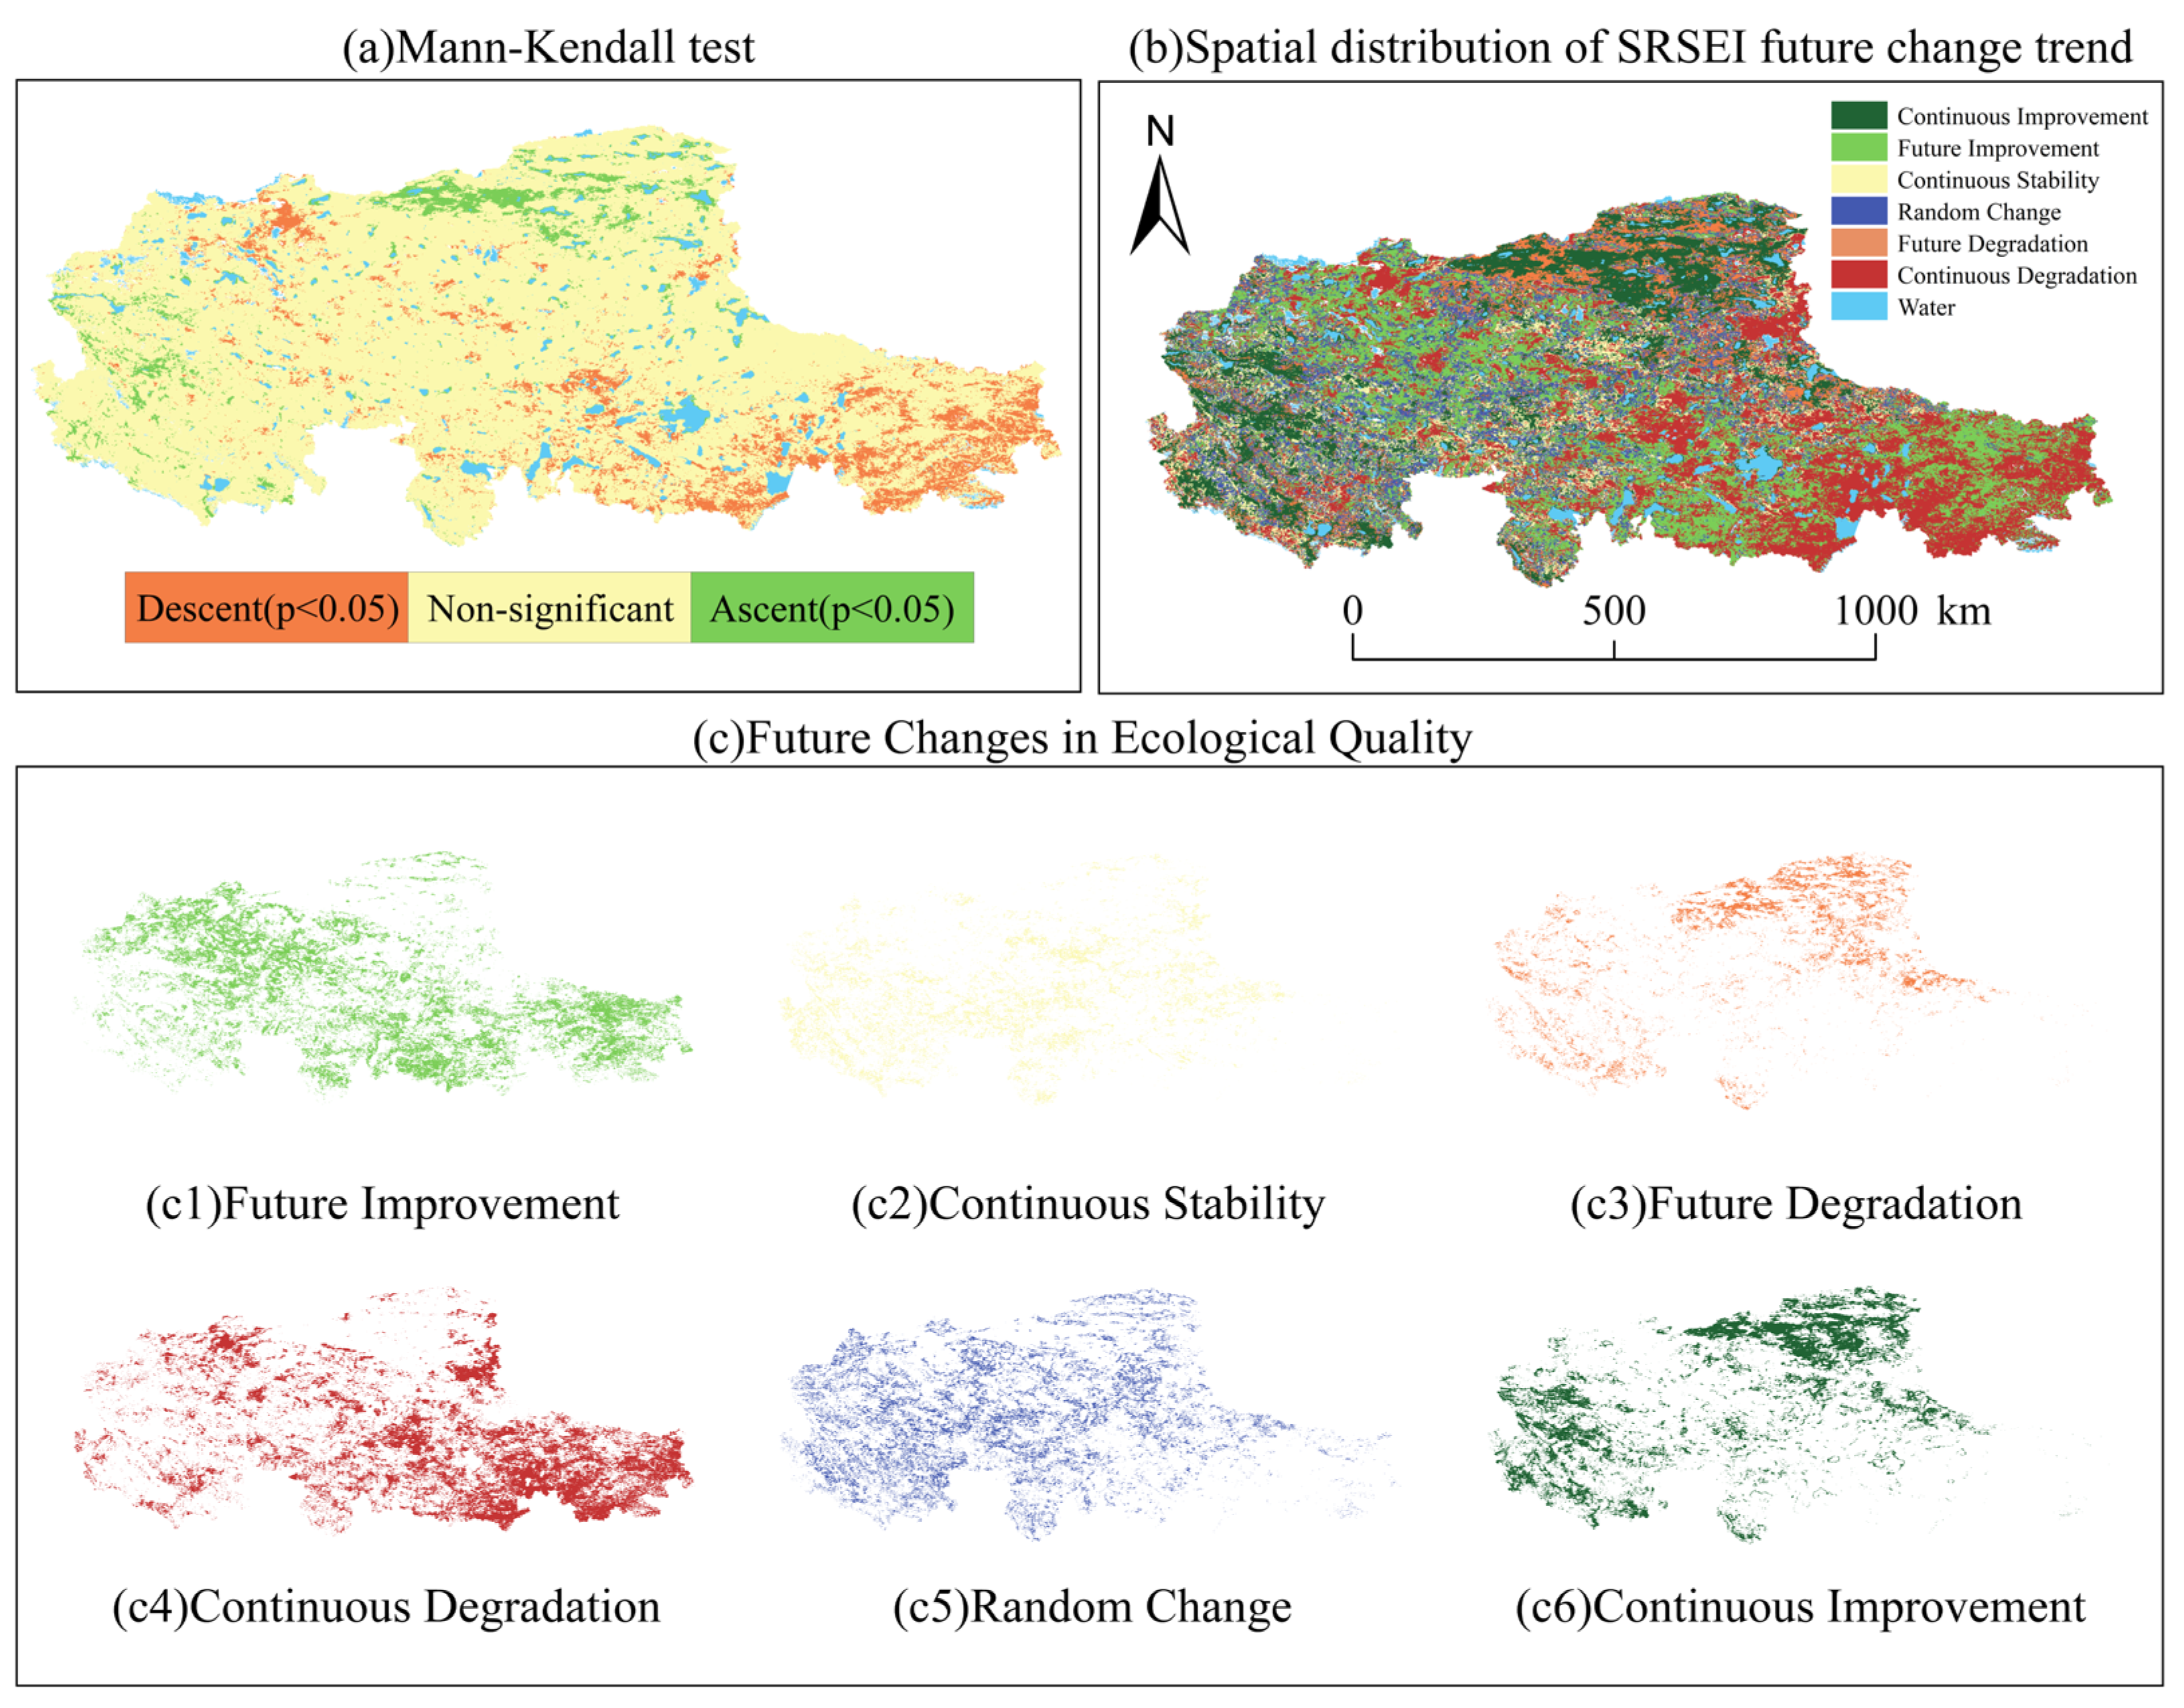
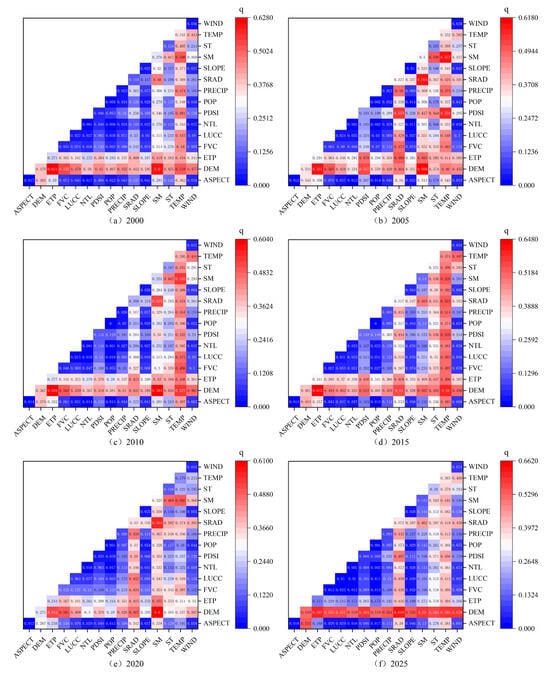
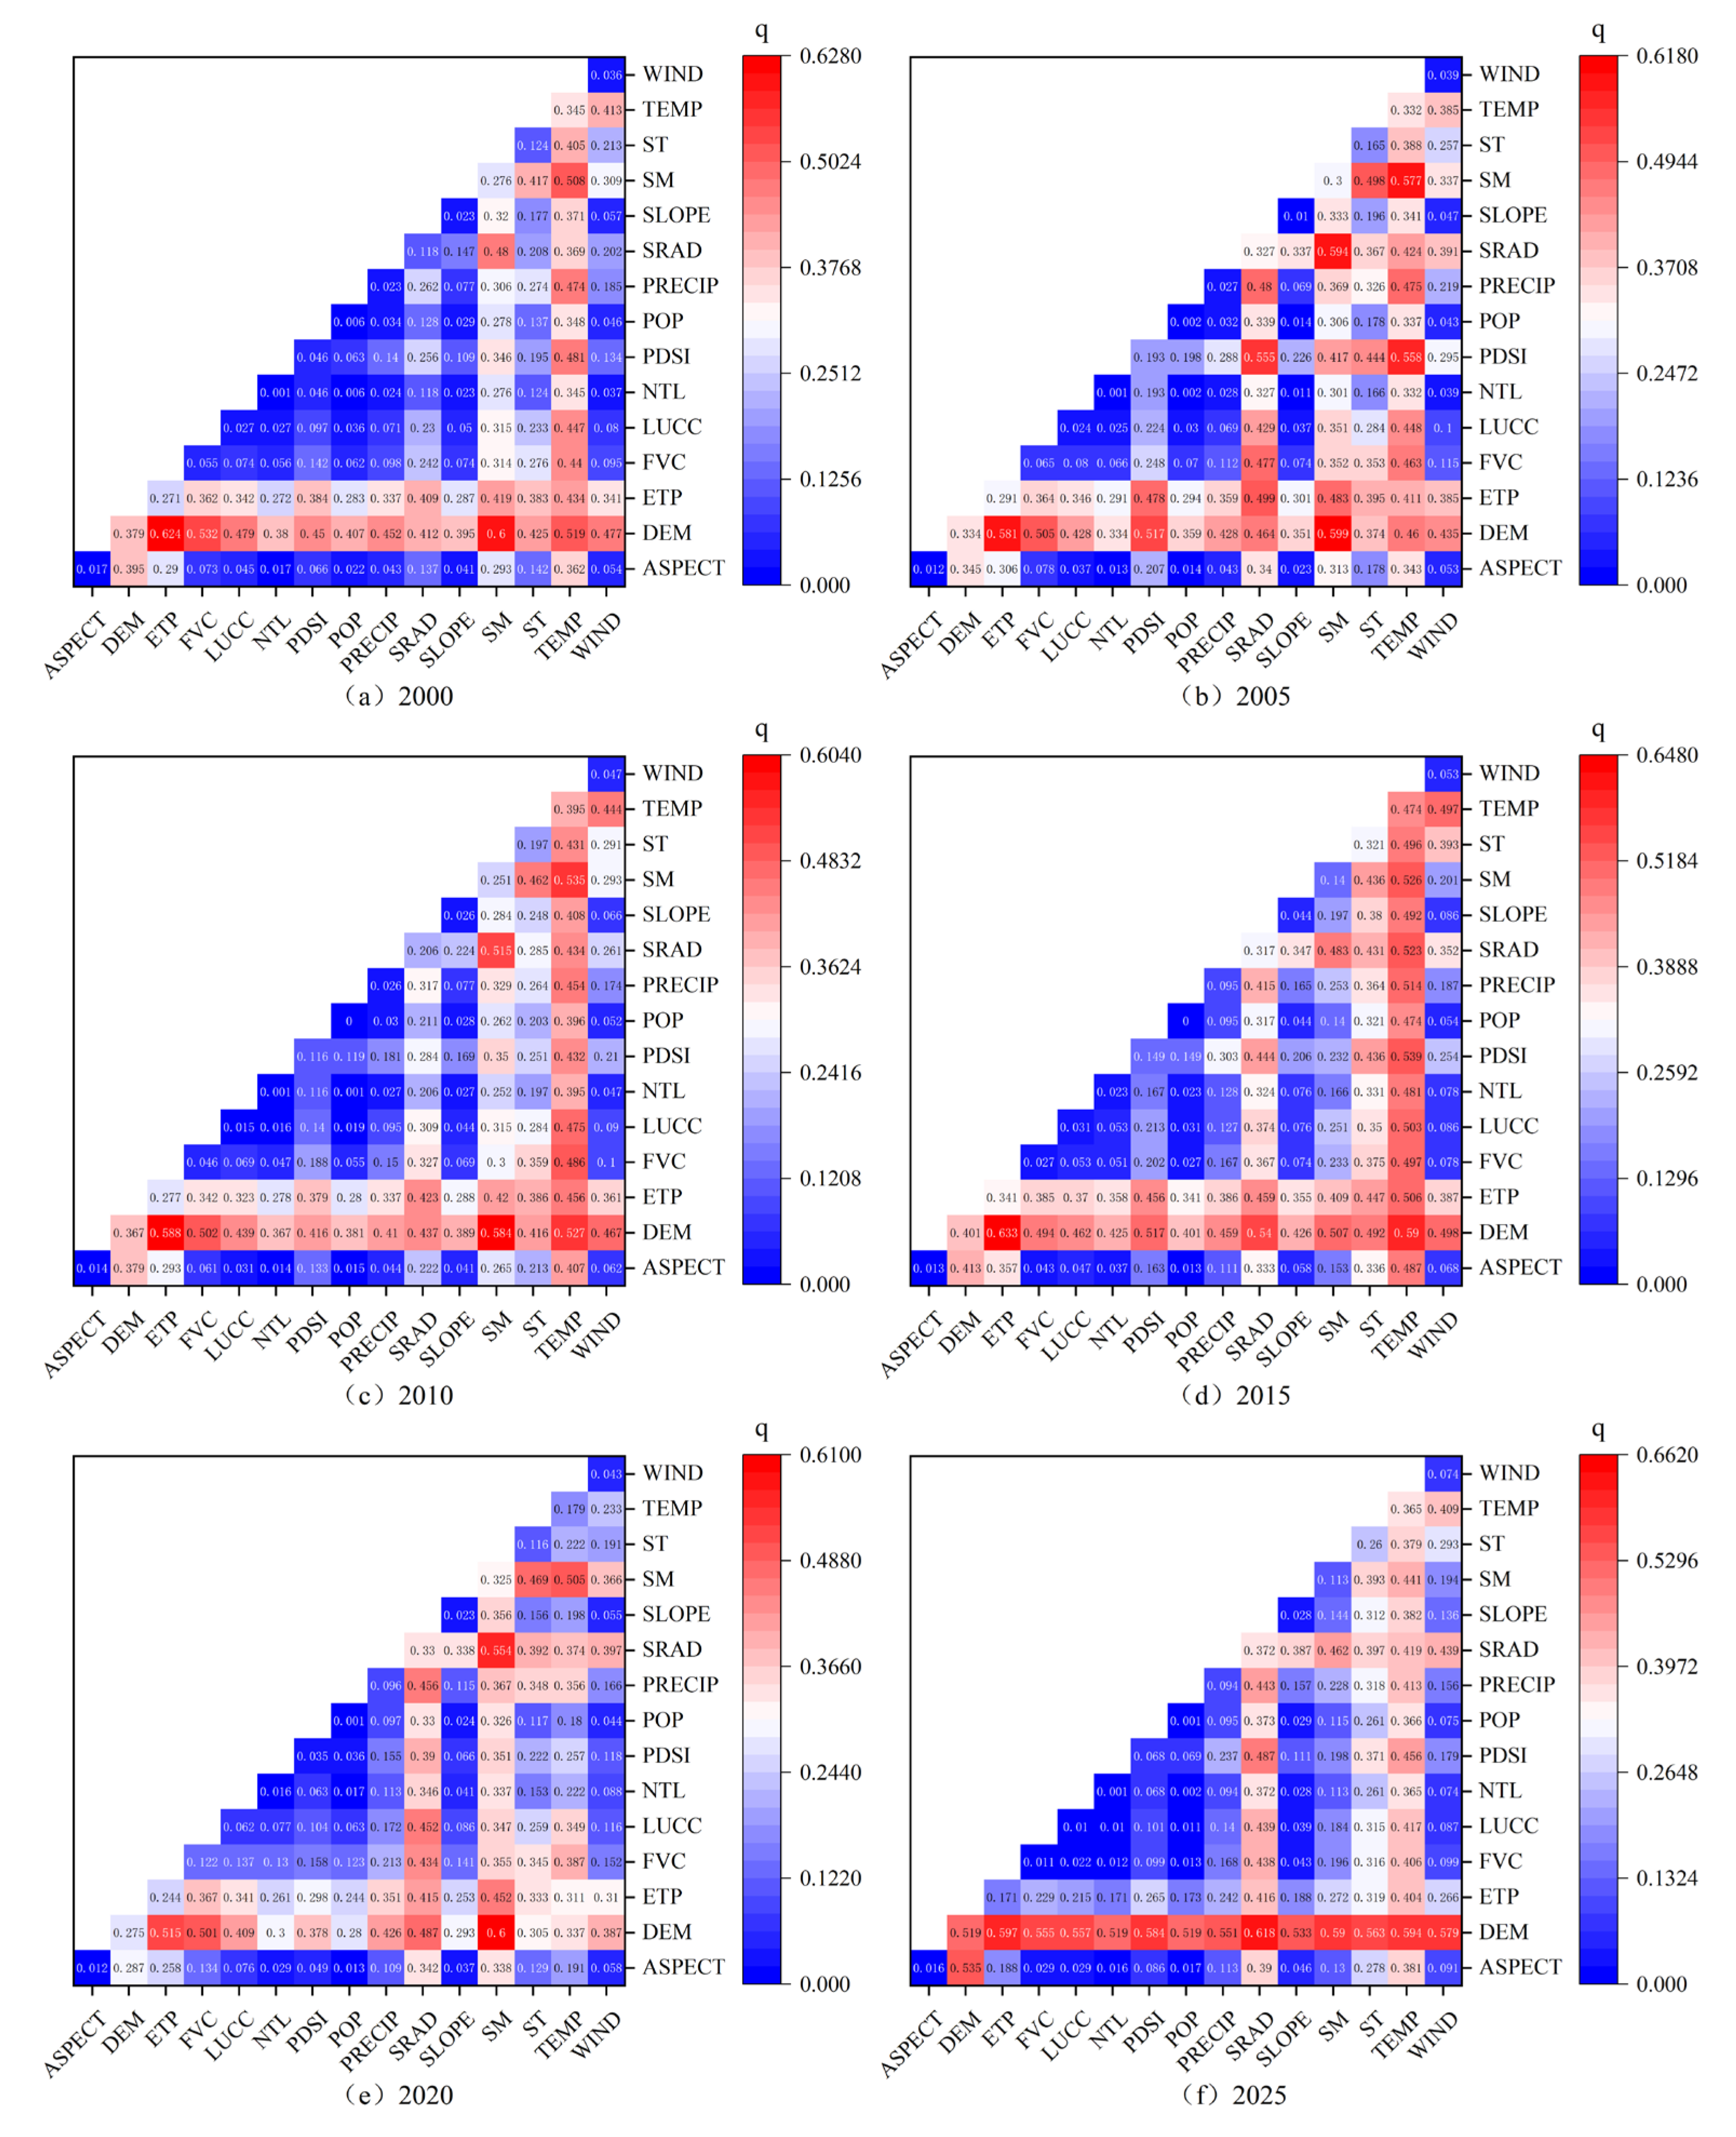
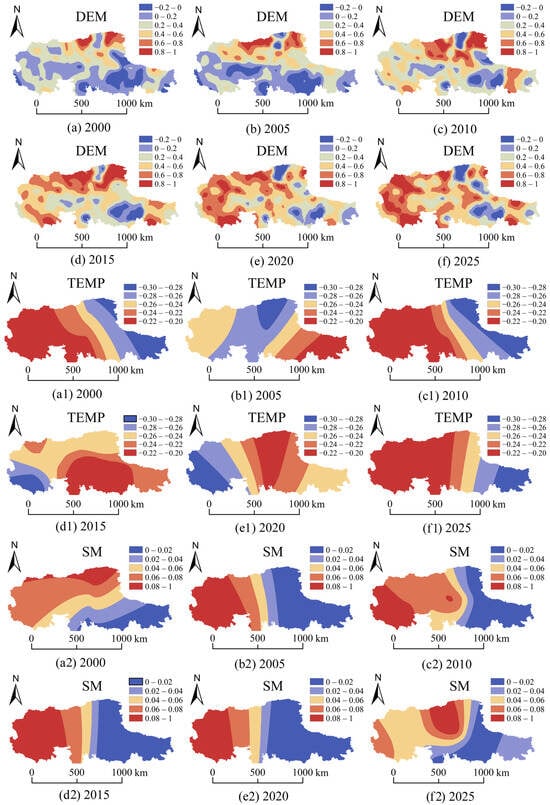
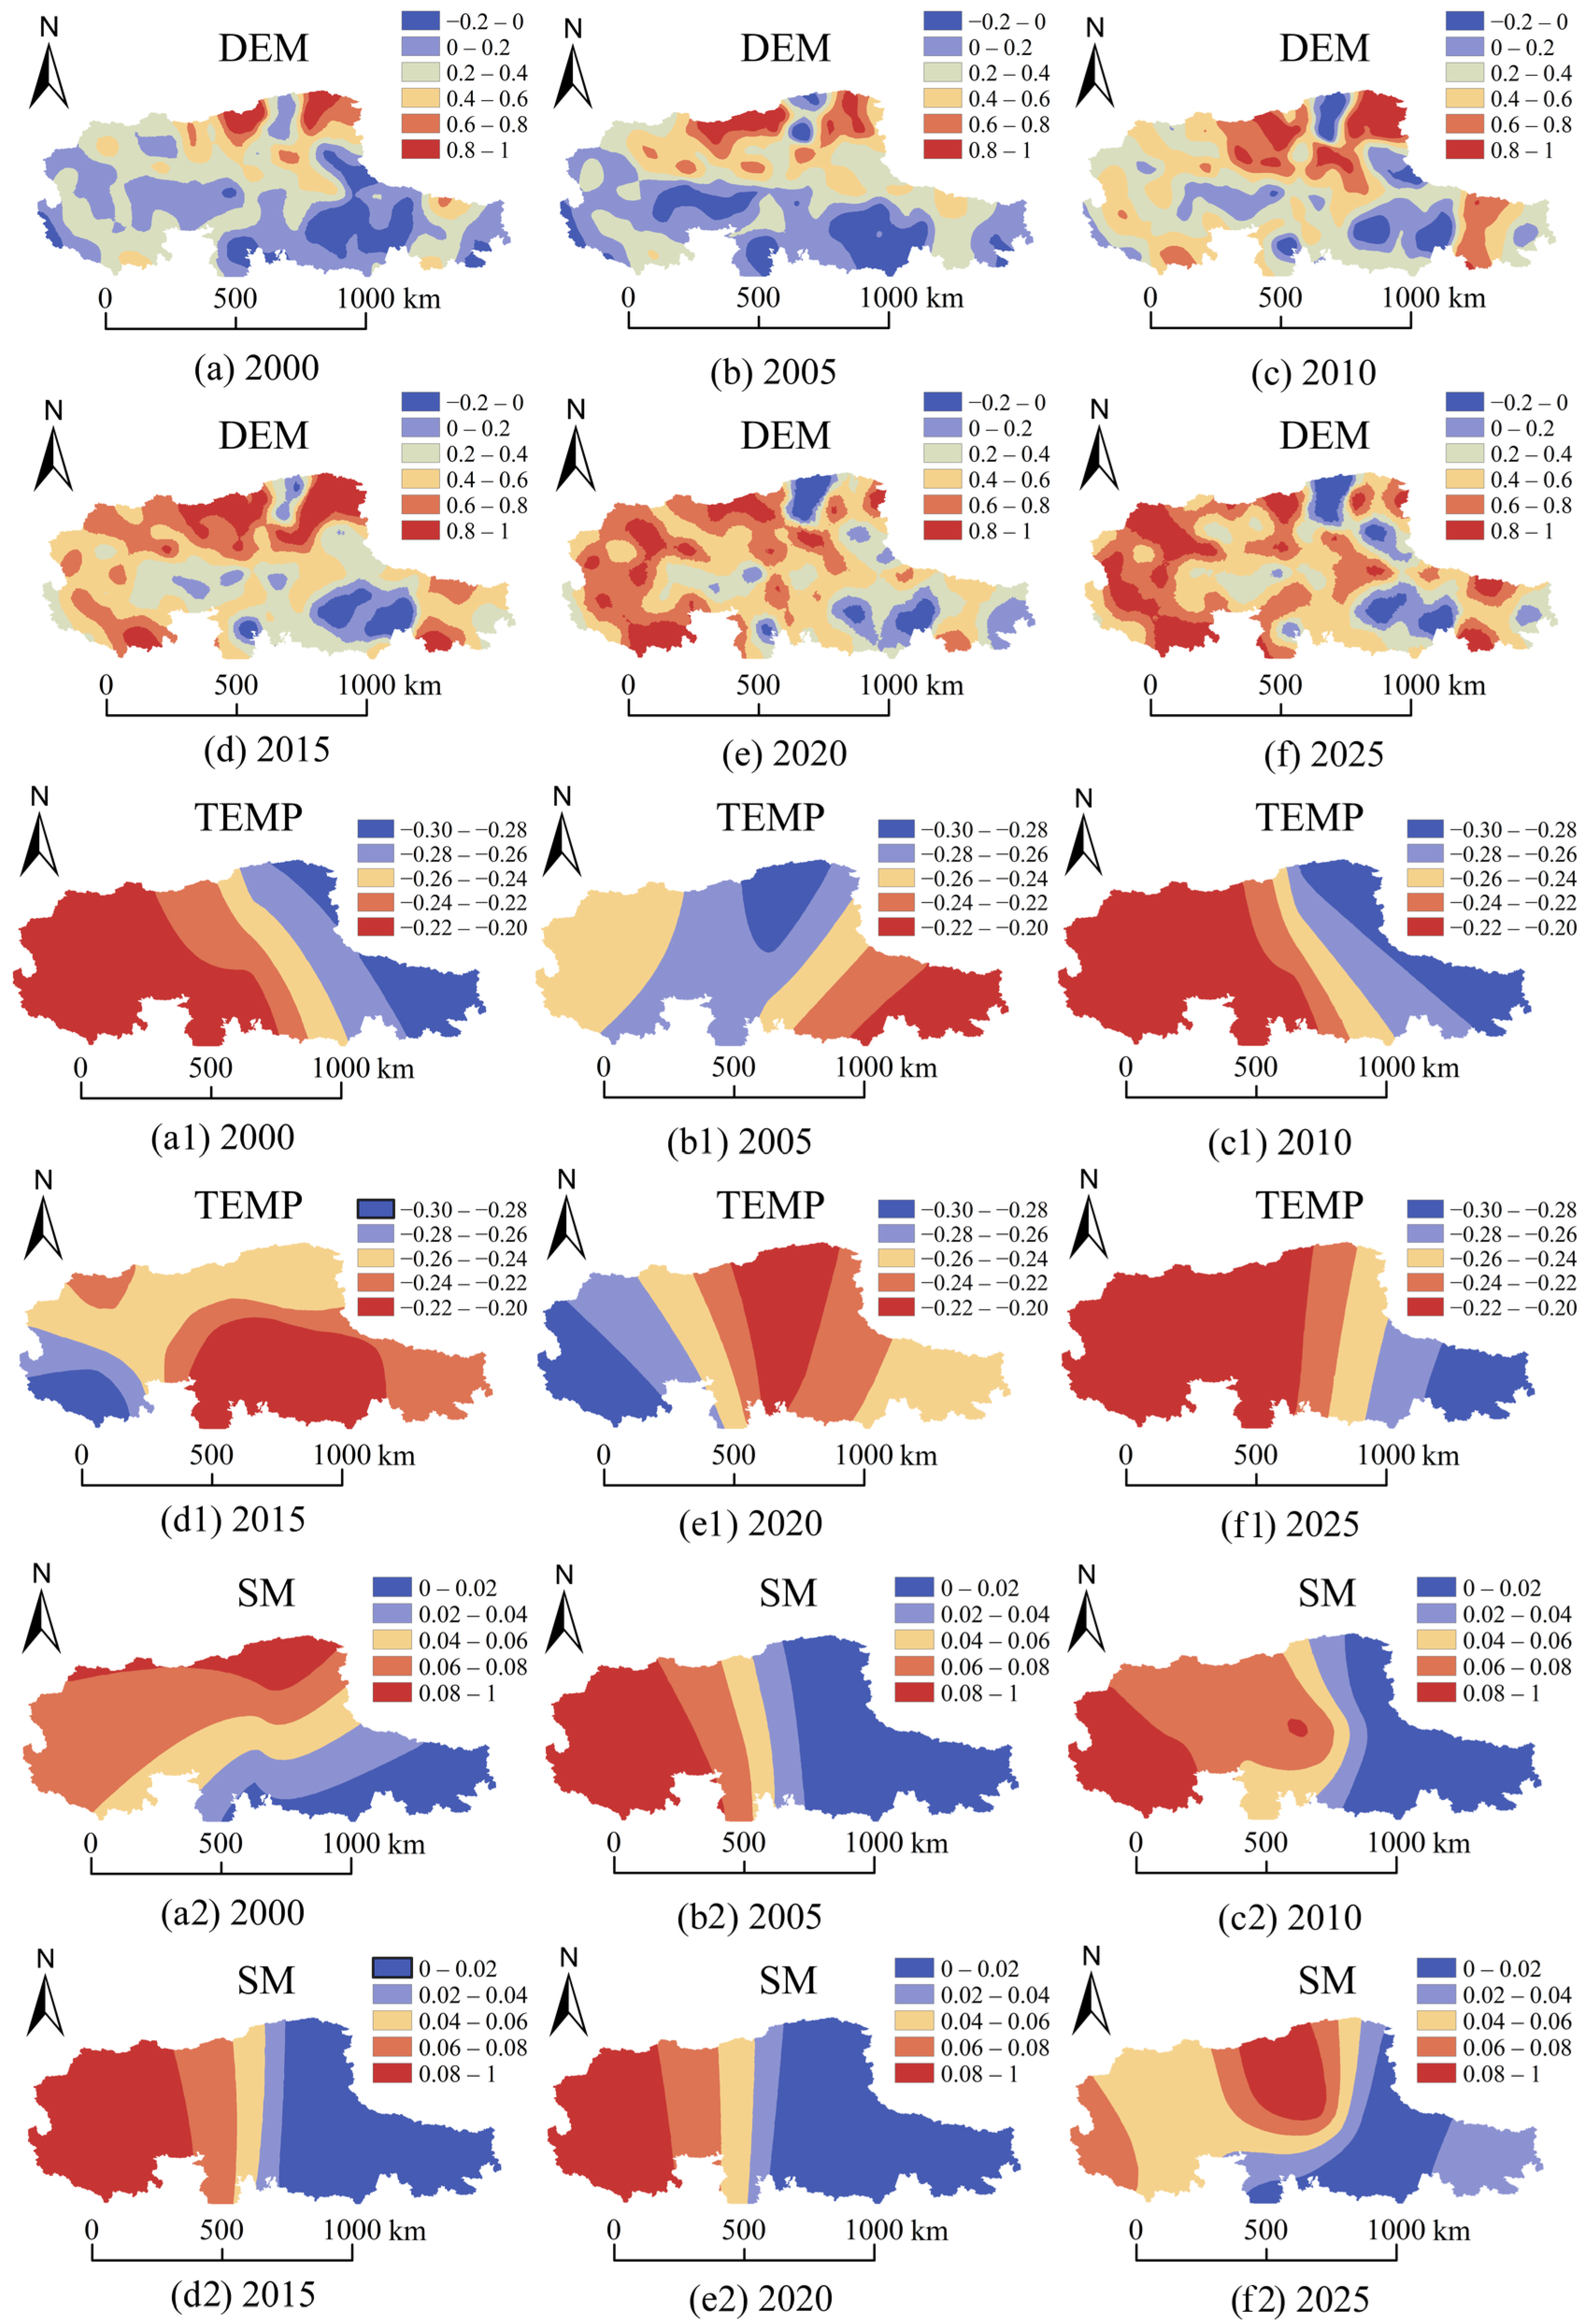

Disclaimer/Publisher’s Note: The statements, opinions and data contained in all publications are solely those of the individual author(s) and contributor(s) and not of MDPI and/or the editor(s). MDPI and/or the editor(s) disclaim responsibility for any injury to people or property resulting from any ideas, methods, instructions or products referred to in the content. |
© 2026 by the authors. Licensee MDPI, Basel, Switzerland. This article is an open access article distributed under the terms and conditions of the Creative Commons Attribution (CC BY) license.