


Highlights
What are the main findings?
- Global shrub encroachment expanded continuously during 2002–2022, with a structural transition detected between 2010 and 2014, showing pronounced aridity gradient dependence.
- Shrub encroachment enhanced vegetation greenness and productivity, with concurrent LAI+GPP+ responses dominating (~70%), though decoupling persisted at high latitudes and in humid regions.
What are the implications of the main findings?
- Moisture gradients fundamentally regulate the spatiotemporal dynamics and ecological consequences of shrub encroachment, necessitating spatially differentiated grassland management strategies.
- The moisture-dependent enhancement of vegetation greenness and productivity under shrub encroachment has important implications for grassland carbon sink assessment and ecosystem management under increasing aridity.
Abstract
Shrub encroachment represents a widespread shift in vegetation structure, yet its influence on the relationship between vegetation greening and ecosystem productivity across global aridity gradients remains poorly understood. Focusing on global grasslands as the study domain, we systematically examined shrub-encroached areas across diverse climatic zones spanning aridity gradients from arid to humid regions. Here, we integrated multi-source remote sensing datasets, including MODIS land cover, leaf area index (LAI), and gross primary productivity (GPP), with a global aridity index to systematically detect shrub encroachment. By combining trend analysis, Pettitt change-point detection, and a moving-window pairwise comparison approach, we characterized the spatiotemporal dynamics of encroachment and quantified its differential effects on vegetation dynamics. Our results showed that the global extent of shrub encroachment expanded continuously from 2002 to 2022, with an abrupt change detected between 2010 and 2014. Relative to comparable non-encroached coverage pixels (NSEC), comparable shrub-encroached coverage pixels (CSEC) exhibited generally increasing trends in LAI, fractional vegetation cover (FVC), and GPP, with enhancement magnitudes showing strong aridity gradient dependence, peaking in semi-arid and dry sub-humid regions, indicating that shrub encroachment is substantially regulated by water limitation. Furthermore, joint trend analysis revealed that the concurrent increase in both LAI and GPP (LAI+GPP+) was the dominant pattern, observed in approximately 70% of encroached areas, although decoupling persisted at high latitudes and in certain humid regions (LAI+GPP−). These findings demonstrate that shrub encroachment is fundamentally regulated by moisture gradients and exhibits pronounced spatial heterogeneity, providing new evidence for understanding carbon cycling dynamics and informing grassland ecosystem management under increasing aridity.
1. Introduction
Grassland ecosystems cover approximately 40% of the global terrestrial land surface and play indispensable roles in maintaining biodiversity, regulating climate and sustaining livestock-based livelihoods [1,2,3]. Over recent decades, the increasing frequency and intensity of drought associated with global warming have driven profound changes in the structure and function of grassland ecosystems [4,5,6]. Against this backdrop, shrub encroachment, the expansion of woody plants into herbaceous-dominated landscapes, has emerged as one of the most consequential mechanisms of ecosystem-level change [7]. Shrub encroachment refers to the expansion of shrubs within grassland and savanna ecosystems, characterized by sustained increases in shrub abundance, biomass, cover, or density, resulting in a transition in vegetation structure from herbaceous-dominated to woody-dominated states [8,9]. This phenomenon is most prevalent in the western United States, eastern Australia, southern Africa, the temperate grasslands of northern China, and other temperate regions of the Northern Hemisphere [10,11,12,13,14]. The drivers of shrub encroachment involve complex interactions between global and regional factors, whereby climate change, including rising atmospheric CO2 concentrations, increasing temperatures, and shifting precipitation regimes, and anthropogenic disturbances, such as grazing intensity, fire frequency, and land management practices, interact across multiple spatiotemporal scales to collectively shape the spatial heterogeneity of shrub encroachment [11,15].
Shrub expansion not only alters vegetation structure but also exerts significant effects on carbon cycling and ecosystem functioning. Structurally, shrub encroachment is generally accompanied by increases in leaf area index, reflecting more complex canopy architecture and a trend toward vegetation greening [16], a pattern that has been observed across diverse climatic regions [17,18]. Its effects on carbon cycling, however, are more variable. In the northern Chihuahuan Desert of the United States and the temperate semi-arid grasslands of Inner Mongolia, shrub invasion can increase net ecosystem carbon exchange, indicating enhanced carbon sequestration, generally accompanied by higher gross primary productivity and aboveground biomass [19,20,21,22]. Similarly, across the Arctic tundra, semi-arid grasslands, and North American prairies, shrubification is often associated with increases in gross primary productivity [16,17,23]. Nevertheless, despite gains in plant biomass and carbon inputs, changes in organic matter quality and decomposition dynamics mean that soil organic carbon stocks and stability do not necessarily rise in parallel, partially offsetting carbon sink effects [24]. At regional scales, for example, in the southern United States, woody plant invasion can enhance primary productivity but also ecosystem respiration, leading to a reduction in net ecosystem exchange [25]. Collectively, these findings indicate that the carbon cycle responses to shrub encroachment are highly spatially heterogeneous, and the lack of cross-scale integration and global assessments currently limits a comprehensive understanding of its ecological and climatic consequences.
The ecological effects of shrub encroachment are strongly dependent on climatic context, exhibiting pronounced regional variability [26,27]. In the Arctic, shrubification alters surface energy balance and soil thermal regimes, suppressing permafrost thaw during summer while enhancing soil warming in winter, thereby exerting a seasonally dual influence on permafrost stability [28]. In the temperate semi-arid regions of the Northern Hemisphere, shrub encroachment is typically associated with increased bare soil and reduced evapotranspiration, amplifying surface warming, whereas in relatively mesic regions such as the southwestern United States, it can lower surface temperature by increasing vegetation cover and evapotranspiration, producing a cooling effect [12]. Likewise, shrub encroachment promotes vegetation greening in semi-arid regions by enhancing leaf area index and water use efficiency, but in arid regions, reductions in leaf area index, gross primary productivity, and evapotranspiration result in negative effects on greening [16]. Moreover, in Mediterranean semi-arid grasslands, shrub establishment can mitigate land degradation, indicating a potential role in ecosystem recovery [29]. Taken together, these observations highlight that the ecological effects of shrub encroachment are highly context-dependent and spatially heterogeneous, varying with local climate, soil, and vegetation conditions. However, its global distribution and responses along aridity gradients remain poorly characterized, limiting a comprehensive understanding of its ecosystem and climatic consequences.
Although prior research has illuminated multiple facets of shrub encroachment, from its proximate drivers to its functional consequences, critical knowledge gaps remain. Accurate detection and quantification of the spatiotemporal dynamics of woody plant expansion are fundamental to understanding its ecological consequences and formulating evidence-based management strategies. High-spatial-resolution remote sensing offers fine-grained characterization of shrub cover at local scales [30,31], but prohibitive data acquisition costs, limited historical archives, and spatially fragmented coverage render this approach ill-suited for long-term global monitoring [32]. By contrast, the MODIS land cover product (MCD12Q1) provides global spatial consistency, a continuous time series since 2001, and annual temporal resolution, offering a robust framework for tracking shrub encroachment dynamics across regions and decades [11,12,16]. Nevertheless, existing studies have largely focused on local or regional scales and lack a systematic assessment framework that spans aridity gradients, limiting a comprehensive understanding of global shrub encroachment patterns and their ecological consequences. In particular, few studies have systematically linked aridity gradients, shrub encroachment dynamics, and the structural–functional relationship between LAI and GPP. Consequently, the mechanisms by which shrub encroachment drives coordinated or decoupled responses in vegetation greening and carbon accumulation across moisture regimes remain poorly characterized.
To address these gaps, this study examines global grasslands over the period 2002–2022 by integrating MODIS land cover, LAI, and GPP data with a global aridity index to construct a spatially explicit, aridity-stratified framework for detecting and evaluating shrub encroachment dynamics. Our specific objectives are threefold: (1) to map and characterize the spatiotemporal evolution of shrub-encroached areas in global grasslands from 2002 to 2022, and to quantify aridity-dependent expansion rates and structural change points; (2) to compare LAI, FVC and GPP responses between CSEC and NSEC across aridity gradients, and to quantify the moisture-dependent magnitudes of change; and (3) to conduct joint LAI-GPP trend analysis to disentangle spatial patterns of LAI-GPP coordination and decoupling across encroached regions. This study reveals the spatiotemporal expansion patterns of global shrub encroachment along aridity gradients and its differential effects on vegetation structure and carbon cycling. It also provides a remote sensing-based basis for grassland management, grazing regulation, and vegetation restoration in arid and semi-arid regions, while offering quantitative global-scale evidence for understanding the co-evolution of grassland ecosystem structure and function under climate change.
2. Materials and Methods
2.1. Datasets and Processing
2.1.1. Land Use Data
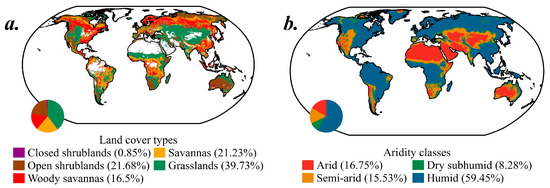
Annual global land cover was characterized using the MODIS MCD12Q1 product (Version 6.1) at 500 m spatial resolution, from which vegetation cover information was extracted according to the 17-class International Geosphere–Biosphere Programme (IGBP) classification scheme (Figure 1a). The product spanned 2001–2022 and offered globally consistent, annually updated land cover designations, making it well suited for large-scale vegetation dynamics monitoring. Within the IGBP framework, shrub encroachment fundamentally reflects a progressive structural transition from herbaceous- to woody-dominated vegetation. To systematically capture this transition, we focused on five land cover types—Grasslands, Savannas, Woody Savannas, and Open Shrublands and Closed Shrublands—and tracked their interannual dynamics to identify regions undergoing shrub encroachment globally.
Figure 1.
Global land cover distribution based on the IGBP classification scheme (a) and spatial pattern of the global aridity index (b).
2.1.2. Vegetation Data
To characterize vegetation structure and ecosystem function in encroached and non-encroached areas, we utilized a suite of MODIS products spanning 2001–2022. For vegetation structure, LAI was obtained from the MOD15A2H dataset (Version 6.1), which employed an 8-day compositing algorithm to select optimal observations and provided globally consistent canopy characterization at 500 m resolution. FVC was derived from the normalized difference vegetation index (NDVI) obtained from the MOD13A1 product (Version 6.1) at 500 m resolution using a pixel dichotomy model in conjunction with the maximum and minimum NDVI values. To quantify the effect of shrub encroachment on carbon fixation capacity, GPP was obtained from the MOD17A2H product (Version 6.1) at 500 m resolution. LAI and NDVI were processed using maximum value compositing to ensure robustness across the long time series. For GPP, we used the MOD17A2H product (8-day composites). We first summed the 8-day values to obtain monthly totals and then accumulated the 12 monthly totals to derive annual GPP (unit: g C m−2 yr−1). To ensure spatial comparability among multi-source datasets, all variables were resampled to a common 0.1° × 0.1° grid using bilinear interpolation. The MODIS products (MCD12Q1, MOD15A2H, MOD13A1, and MOD17A2H) were obtained from the NASA Land Processes Distributed Active Archive Center (LP DAAC).
2.1.3. Aridity Index
Regional moisture conditions were characterized using the Global Aridity Index (AI) dataset produced by the Food and Agriculture Organization of the United Nations (FAO). This dataset, provided at 10 arc-minute spatial resolution, quantified surface water balance as the ratio of mean annual precipitation to mean annual potential evapotranspiration (PET). Following the classification framework established by the United Nations Environment Programme (UNEP), the study area was stratified into four aridity zones: arid (AI < 0.20), semi-arid (0.20 ≤ AI < 0.50), dry subhumid (0.50 ≤ AI < 0.65), and humid (AI ≥ 0.65) (Figure 1b). This four-tier classification served as the spatial analytical framework for the study. Integration of this gridded dataset enabled assessment of how aridity gradients modulated the rate of shrub encroachment and the associated responses of vegetation indicators. The aridity index data were resampled to a spatial resolution of 0.1° × 0.1° using bilinear interpolation. Detailed information for all datasets is presented in Table 1. The Global Aridity Index dataset was provided by the Food and Agriculture Organization of the United Nations (FAO), Rome, Italy.
Table 1.
Summary of datasets.
2.2. Methods
2.2.1. Identification of Shrub Encroachment
Shrub encroachment was defined as the progressive transition from herbaceous-dominated to woody-dominated vegetation, characterized by an increase in woody plant cover. Using the MODIS MCD12Q1 land cover product and five IGBP land cover classes associated with grassland ecosystems, namely closed shrublands (L6), open shrublands (L7), woody savannas (L8), savannas (L9), and grasslands (L10), we constructed a herbaceous-to-woody vegetation structural gradient. These five classes collectively represent a continuum from herbaceous to woody dominance, providing a unified classification basis for the identification and quantitative assessment of shrub encroachment at the global scale.
Encroachment was identified when a pixel transitioned toward a higher woody-dominance class along this gradient during the study period. Using 2001 as the reference year, land cover transitions were recorded annually from 2002 to 2022. Specific encroachment transitions included: grasslands (L10) to savannas (L9); grasslands (L10) or savannas (L9) to woody savannas (L8); grasslands (L10), savannas (L9), or woody savannas (L8) to open shrublands (L7); and grasslands (L10), savannas (L9), woody savannas (L8), or open shrublands (L7) to closed shrublands (L6). All such transitions were considered to indicate a directional shift toward greater woody dominance and were therefore classified as encroachment pixels and assigned a value of 1; all remaining pixels were assigned a value of 0. To identify grassland pixels that remained unencroached throughout the study period, pixels from 2001 were used as the initial sample. Pixels that exhibited no transition toward a higher woody-dominance class and maintained a stable land cover type throughout the study period—including grasslands (L10), savannas (L9), woody savannas (L8), and open shrublands (L7)—were designated as non-encroachment pixels (value = 1), while all other pixels were assigned a value of 0 [16,33].
To reduce the influence of single-pixel classification errors inherent in 500 m resolution data and improve consistency with the spatial scale of climate and ecological variables, the binary encroachment results were aggregated to a 0.1° spatial resolution. Within each 0.1° grid cell, the proportions of encroachment and non-encroachment pixels were calculated to characterize the spatial extent of structural transition. Given that annual land cover products are subject to classification uncertainty and interannual variability, the 22 annual layers spanning 2001–2022 were overlaid and summarized at the 0.1° scale to reduce the influence of short-term algorithmic noise.
2.2.2. Moving Window Analysis and Paired Comparison Strategy
To quantitatively assess the effects of shrub encroachment on vegetation dynamics, three indicators were extracted: LAI, GPP, and FVC. LAI served as an indicator of canopy greenness, GPP reflected ecosystem productivity, and FVC characterized the extent of vegetation cover. Given the substantial variation in climatic conditions, topographic settings, and ecological environments across regions, a moving-window-based paired comparison approach was employed to contrast these indicators between shrub-encroached and non-encroached grasslands. Pixels were classified into two categories based on the following criteria: a 0.1° pixel was designated as a comparable shrub-encroached coverage pixel (CSEC) if the shrub-encroached fraction exceeded 10% and the combined fraction of shrub-encroached and non-encroached grassland exceeded 50%. Conversely, a pixel was designated as a comparable non-encroached coverage pixel (NSEC) if the non-encroached grassland fraction exceeded 90% of the total grassland fraction. Furthermore, an 11 × 11 pixel window centered on each CSEC pixel was constructed to ensure environmental similarity while maintaining an adequate sample size [16]. A minimum of 10 NSEC pixels was required within each window to ensure data reliability. This design balanced local environmental comparability with sample robustness.
Based on these criteria, all globally identified shrub encroachment pixels were traversed pixel by pixel to construct a paired dataset of shrub-encroached and non-encroached grasslands. For each moving window, annual mean values of LAI, GPP, and FVC were calculated separately for encroachment and non-encroachment pixels. Differences between the two pixel types were then quantified to characterize the ecological effects of shrub encroachment relative to unencroached grasslands. Furthermore, vegetation structural and carbon fixation attributes of encroached and non-encroached grasslands were synthesized across multiple years and along aridity gradients, providing a quantitative basis for evaluating the moisture-dependency of encroachment-driven ecological effects.
2.2.3. Calculation of FVC
FVC was derived from NDVI using the dimidiate pixel model. The calculation formula is as follows:
where NDVIsoil and NDVIveg represent the NDVI values of bare soil and full vegetation cover, respectively. To reduce the influence of extreme values and interannual variability, NDVIsoil and NDVIveg were dynamically determined using the 5th and 95th percentiles of the annual NDVI distribution, respectively. This percentile-based approach ensures that the thresholds reflect the actual range of vegetation and bare soil conditions in each given year, thereby avoiding the systematic biases introduced by globally or temporally fixed threshold values and improving the accuracy of FVC estimation across different years and land surface conditions [34]. To quantify the effect of shrub encroachment on carbon fixation capacity, annual GPP was obtained by summing all 8-day GPP retrievals within each year from the MOD17A2H product (Version 6.1) at 500 m spatial resolution. To ensure spatial comparability among multi-source datasets, all variables were resampled to a common 0.1° × 0.1° grid using bilinear interpolation.
2.2.4. Trend Analysis
To characterize the long-term trends of shrub encroachment and vegetation indices, this study applied ordinary least squares (OLS) linear regression at the pixel level. OLS regression is a classical statistical technique that estimates the linear relationship between a dependent variable and one or more independent variables by minimizing the sum of squared residuals between observed values and model-fitted values. In the context of time-series remote sensing analysis, pixel-level linear regression treats each year as an independent observation, with time serving as the explanatory variable and the target variable (e.g., shrub encroachment coverage or vegetation index) as the response variable. For each pixel, the regression slope was computed using the following formula:
where Slope denotes the regression slope representing the average annual rate of change; n is the total number of years in the study period; xi is the value of shrub encroachment coverage (or vegetation index) in year i; and i represents the corresponding year sequence number within the study period (i = 1, 2, …, n). A positive Slope indicates an increasing trend, while a negative Slope indicates a decreasing trend. The statistical significance of each trend was evaluated using an F-test, which assesses whether the linear regression model explains a statistically meaningful proportion of the total variance in the time series. The F-statistic was calculated as follows:
where U represents the regression sum of squares; Q denotes the residual sum of squares; n is the total number of years; is the fitted value in the i-th year derived from the regression model; is the multi-year mean of the variable; and yi is the observed value in the i-th year. Based on the computed Slope and the corresponding p-value from the F-test, the direction and magnitude of change at each pixel were classified into six categories: extremely significant decrease (ESD, Slope < 0, p < 0.01); significant decrease (SD, Slope < 0, 0.01 ≤ p < 0.05); non-significant decrease (NSD, Slope < 0, p ≥ 0.05); non-significant increase (NSI, Slope > 0, p ≥ 0.05); significant increase (SI, Slope > 0, 0.01 ≤ p < 0.05); and extremely significant increase (ESI, Slope > 0, p < 0.01). This six-tier classification scheme allows for a nuanced, spatially explicit characterization of temporal dynamics. During the computation, the regression was conducted independently for each pixel across the entire study area using annual time-series data spanning the full study period. The resulting slope maps and significance maps were subsequently used for spatial pattern analysis.
2.2.5. Pettitt Test
To account for potential nonlinear characteristics in shrub encroachment and its associated ecological effects, we further employed the Pettitt non-parametric test to identify abrupt change points within the time series. This method requires no assumptions regarding the data distribution, making it particularly well-suited for detecting structural breaks in ecological time series. A change point was considered statistically significant when the corresponding significance level reached p < 0.05. The relevant statistics are defined as follows:
where sgn(·) denotes the sign function, t represents the candidate change year, and xt and xi are the respective time series values. Ut,N and P are the test statistics, and Kt,N is the maximum absolute value of the Ut,N sequence. When the p-value of the Pettitt test falls below the significance threshold (p < 0.05), the time series is considered to exhibit a statistically significant abrupt change point.
2.2.6. Coefficient of Variation
To characterize the interannual variability of shrub encroachment coverage over the study period, we calculated its coefficient of variation (CV). The CV is a dimensionless, normalized measure of dispersion defined as the ratio of the standard deviation to the mean of a dataset. By expressing variability (standard deviation) as a proportion of the mean, the CV eliminates the influence of data units and mean magnitude, making it particularly suitable for comparing the degree of fluctuation across datasets with different locations, time periods, or scales. In the context of land cover and ecological monitoring, the CV is widely used to quantify temporal stability. The CV for each pixel is calculated using the following formula:
where CV is the coefficient of variation; xi is the shrub encroachment coverage value in the i-th year; is the mean shrub encroachment coverage over the entire study period, calculated as ; and n is the total number of years. The numerator of Equation (9) is the population standard deviation of the annual coverage values, which quantifies the average magnitude of deviation from the long-term mean. Dividing by normalizes this dispersion relative to the mean level of coverage, yielding a unitless ratio that facilitates direct spatial comparison across pixels regardless of their absolute coverage magnitude. The magnitude of CV provides a direct measure of the temporal stability of shrub encroachment coverage: a higher CV indicates greater interannual variability and lower system stability, whereas a lower CV suggests a more stable shrub encroachment coverage state.
2.2.7. Temporal Persistence Threshold
To ensure that the analyzed pixels represent sustained shrub encroachment rather than transient or sporadic transitions, we applied a temporal persistence threshold. Specifically, shrub-encroached pixels were retained for analysis only if encroachment was detected for at least a certain proportion of the study period (2002–2022). Three thresholds were defined: approximately one-third (≥7 years), two-thirds (≥14 years), and the full period (≥21 years) of the study duration [35,36]. These three thresholds were applied separately to examine the consistency of the observed LAI and GPP coupling patterns across different encroachment durations.
2.2.8. Analysis of Divergent Vegetation Trends
This study constructed a multidimensional assessment framework by analyzing the interannual trends of LAI and GPP from 2001 to 2022, with the aim of identifying co-evolutionary patterns between vegetation greening and productivity changes at the global scale. Based on pixel-wise trend analysis and the directional consistency between LAI and GPP, global shrub encroachment pixels were classified into four dominant types. Specifically, the LAI+GPP+ pattern represented concurrent increases in vegetation greening and ecosystem productivity; the LAI+GPP– pattern reflected a decoupling between enhanced greening and declining productivity; the LAI–GPP+ pattern indicated that ecosystem productivity continued to increase under browning conditions; whereas the LAI–GPP– pattern characterized simultaneous declines in both greening and productivity. By disentangling the synergies and trade-offs between vegetation LAI and GPP, this framework provides observational evidence for understanding ecosystem state transitions under global shrub encroachment. All data processing and calculations were performed in RStudio (R version 4.2.2).
3. Results
3.1. Spatial Distribution and Area Dynamics of Global Shrub Encroachment
3.1.1. Cumulative Occurrence Frequency of Shrub Encroachment
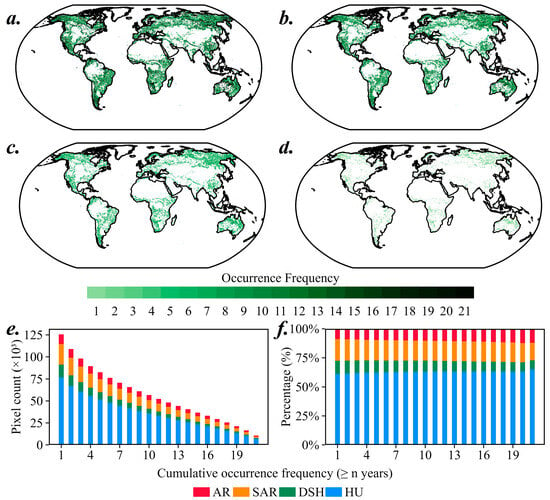
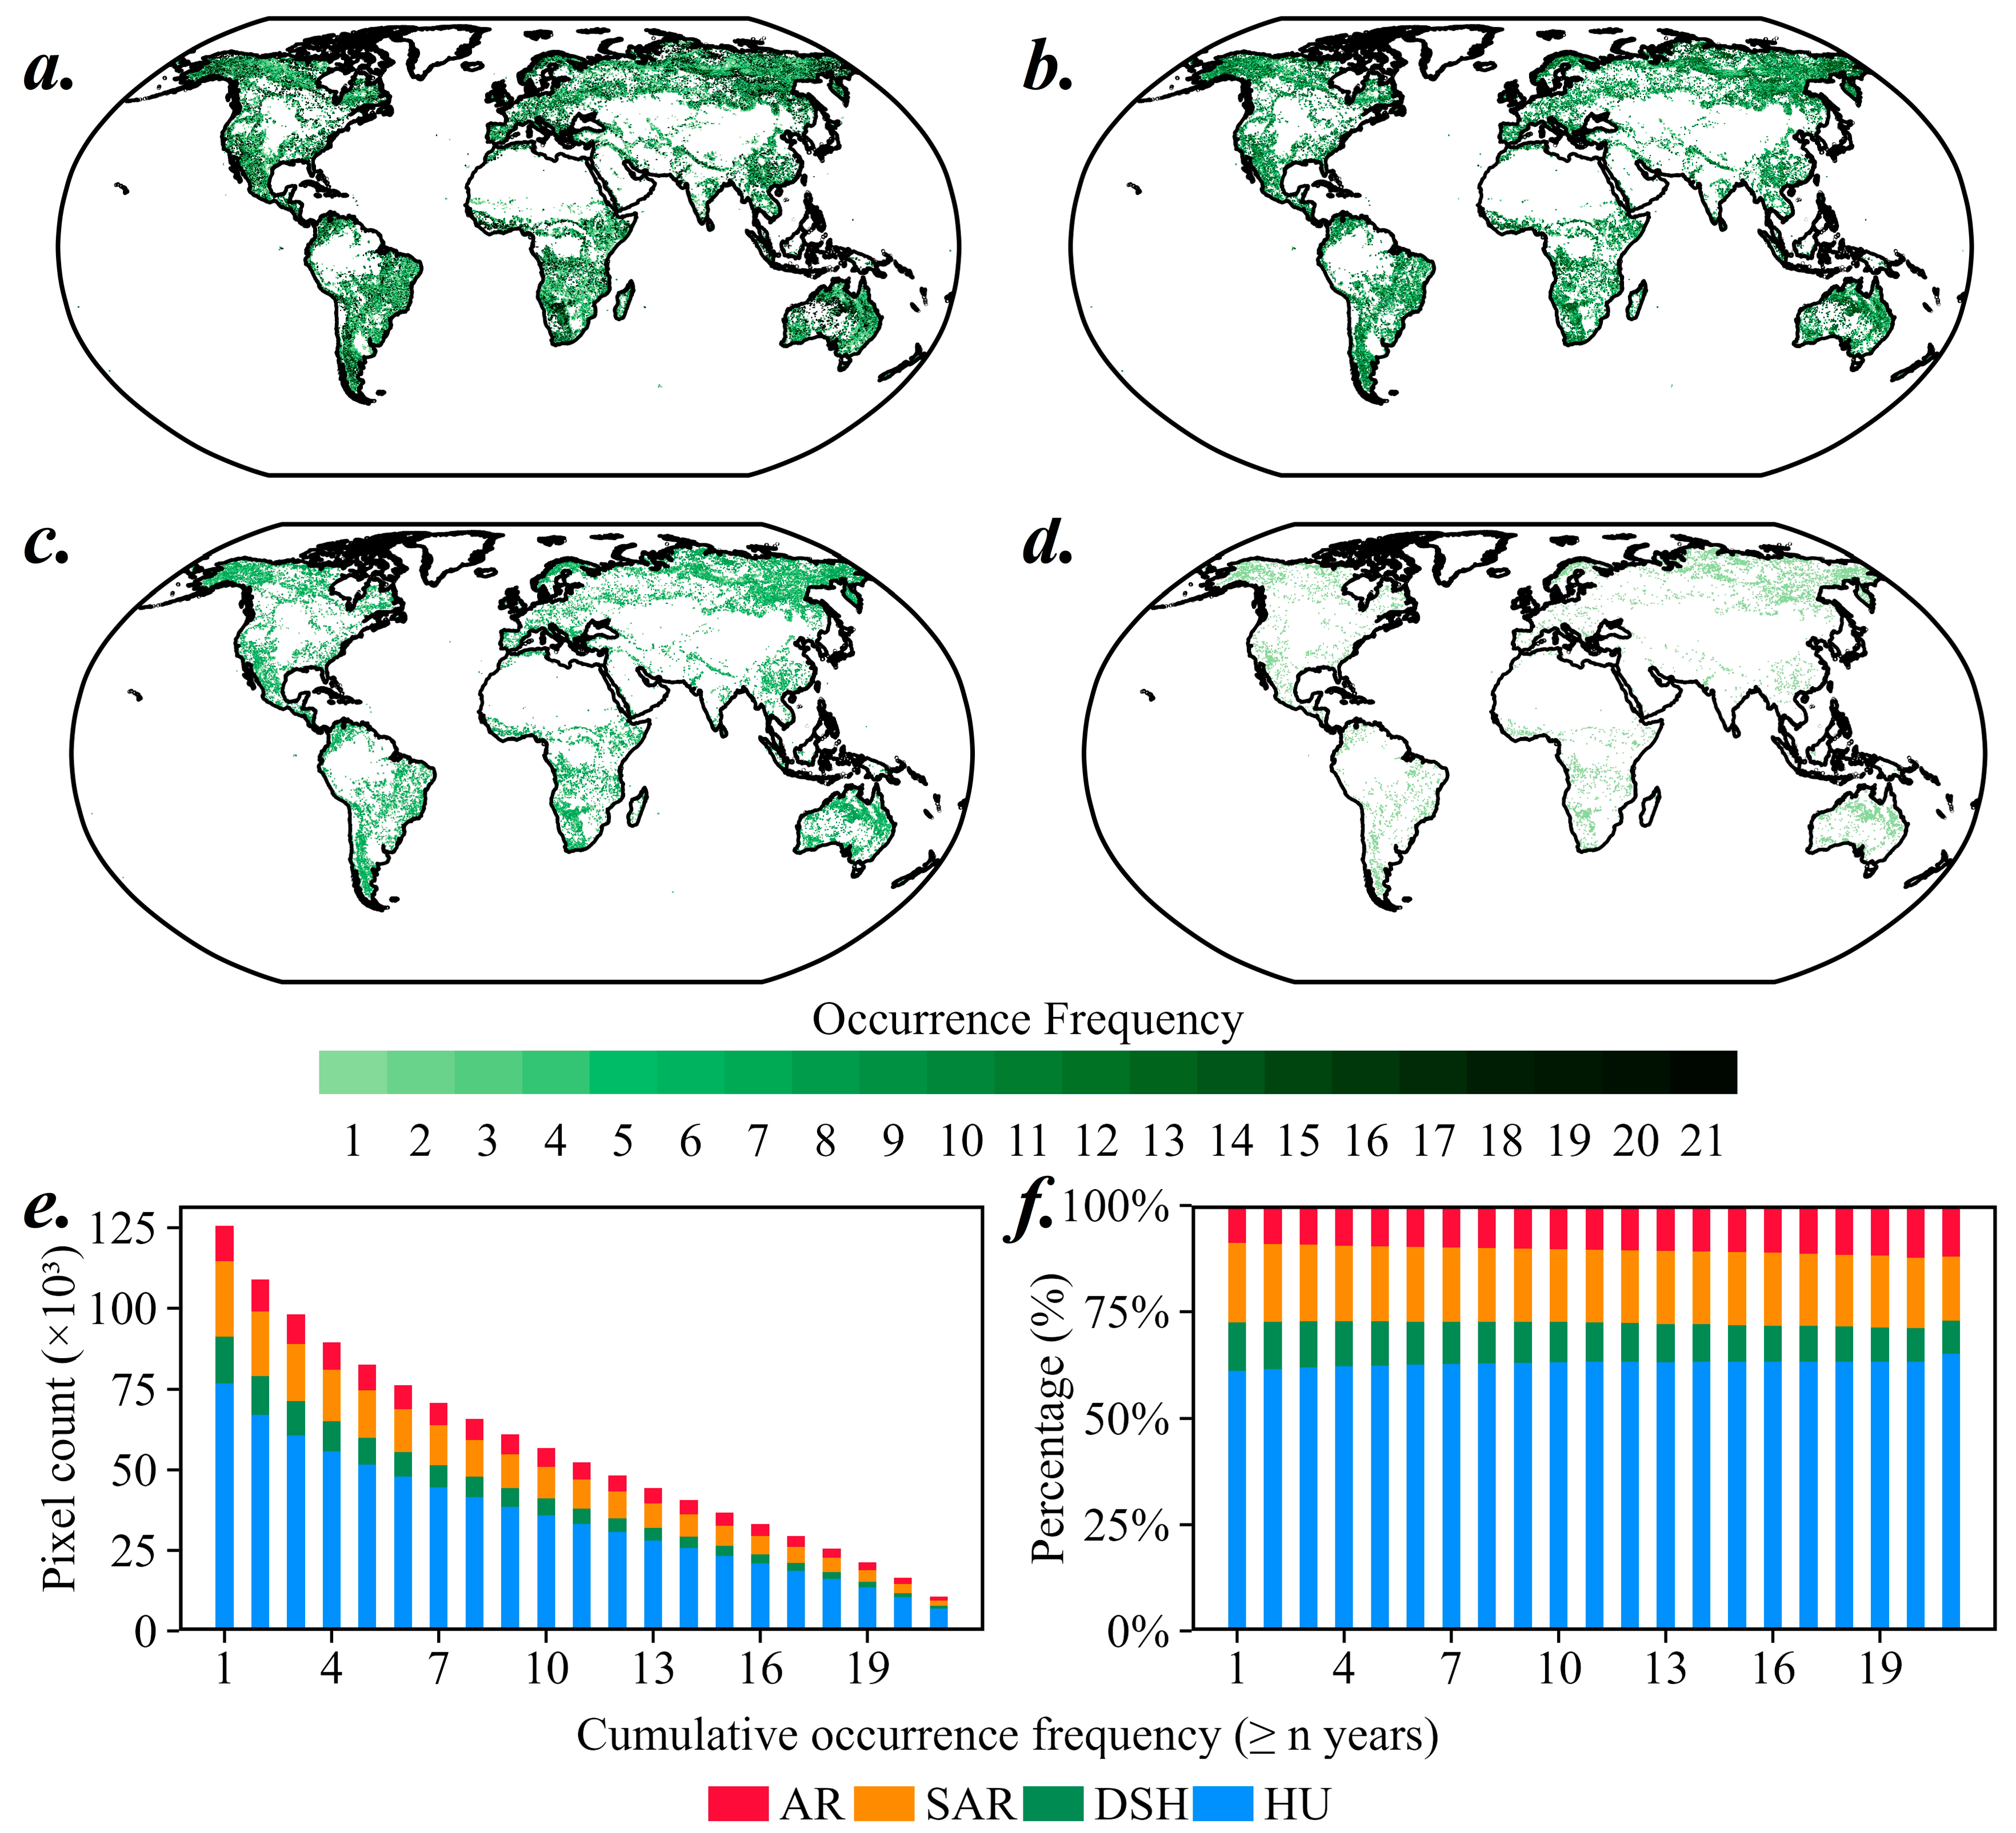
Analysis based on 21 years of remote sensing data from 2002 to 2022 revealed that global shrub encroachment exhibited pronounced spatial accumulation and temporal persistence (Figure 2). A cumulative occurrence frequency series was constructed by overlaying annual encroachment results year by year, and encroachment was subsequently classified into discrete frequency categories to characterize its global spatial accumulation patterns and persistence.
Figure 2.
Spatial distribution of cumulative shrub encroachment occurrence years and its variation across aridity gradients during 2002–2022. (a–d) Spatial distribution of shrub encroachment with cumulative occurrences of ≥1, ≥7, ≥14, and ≥21 years, respectively; (e) Number of shrub encroachment pixels across different aridity zones by cumulative occurrence years; (f) Relative proportional changes in shrub encroachment pixel counts across different aridity zones. AR, SAR, DSH and HU represent arid, semi-arid, dry subhumid, and humid regions, respectively.
In terms of spatial distribution, areas with the highest cumulative occurrence frequencies were predominantly located in western North America, southern South America, southern Africa, northern Australia, and the mid-to-high-latitudes of Eurasia (Figure 2a–d). With increasing cumulative encroachment years, the proportional contribution of shrub encroachment across different aridity zones showed marked divergence (Figure 2e,f). Humid regions consistently maintained the highest proportion of shrub encroachment throughout all cumulative occurrence periods, accounting for approximately 61.2% of total encroachment pixels with 1 year of cumulative occurrence and increasing to 65.1% among pixels with 21 years of cumulative occurrence. In contrast, arid regions exhibited a gradual increase in proportional contribution, from 8.8% to 12.0%, indicating that sustained shrub encroachment became increasingly concentrated in arid environments over time. Semi-arid regions showed an overall declining trend, with their proportional contribution decreasing from 18.7% in pixels with 1 year of cumulative occurrence to 15.1% in pixels with 21 years of cumulative occurrence. Similarly, dry subhumid regions declined from 11.4% to 7.9%.
3.1.2. Trends in Global Shrub Encroachment Area
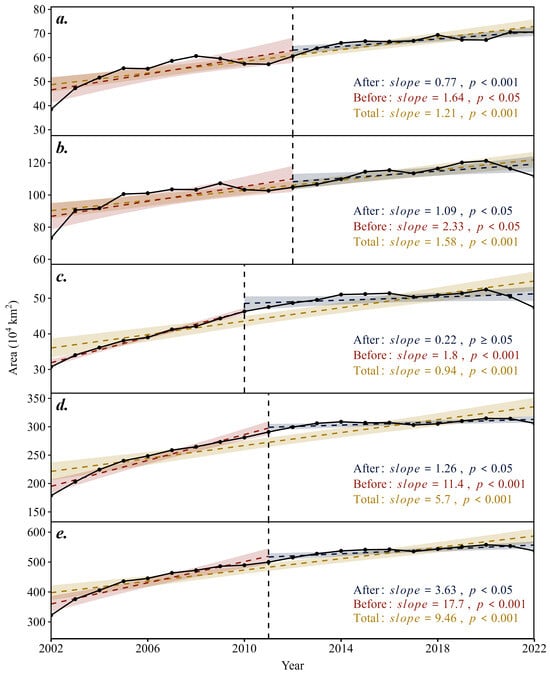
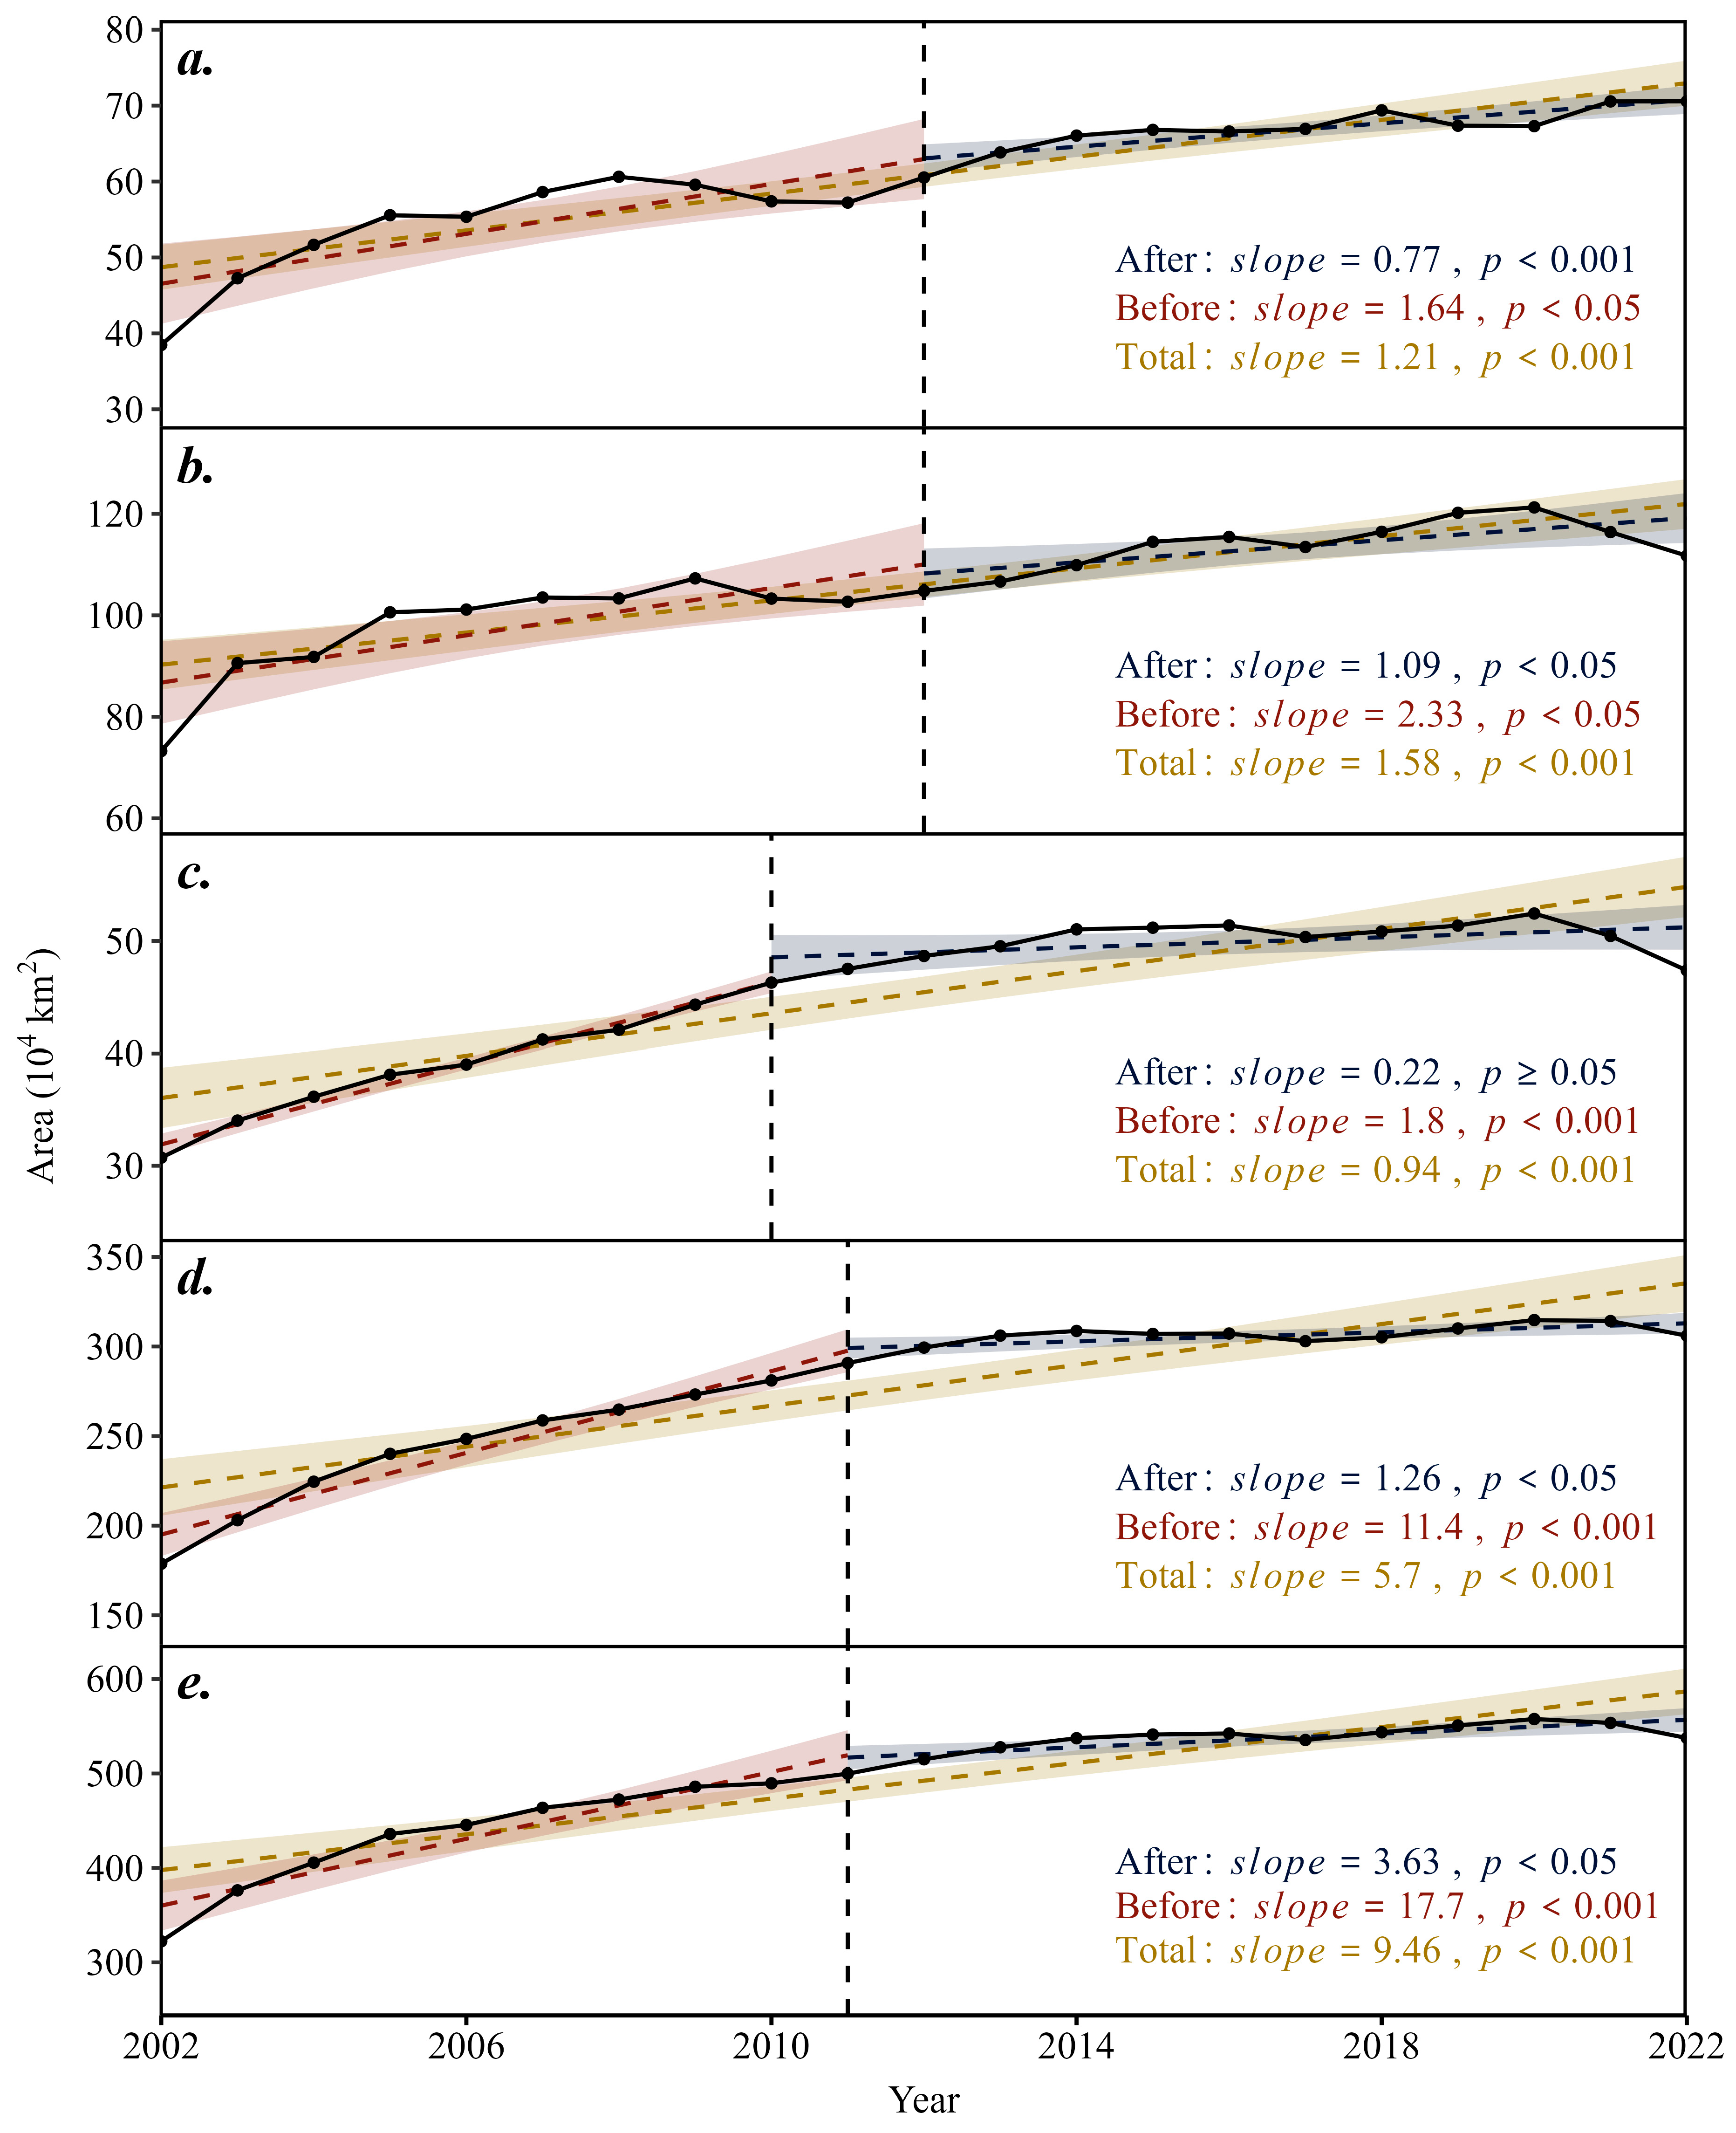
During 2002–2022, the extent and trajectory of shrub encroachment varied markedly across aridity gradients (Figure 3). In arid regions, shrub encroachment area ranged from approximately 40–70 × 104 km2, with a relatively low expansion rate. Semi-arid regions exhibited shrub encroachment extents of approximately 80–120 × 104 km2, with expansion rates substantially exceeding those of arid regions. Despite comparatively favorable moisture conditions, dry subhumid regions showed shrub encroachment extents of approximately 30–50 × 104 km2, with expansion rates lower than those in semi-arid regions. Humid regions recorded the largest shrub encroachment extents, reaching approximately 150–350 × 104 km2, along with the highest expansion rate (5.70 × 10⁴ km2 yr−1, p < 0.001). At the global scale, total shrub encroachment area ranged from approximately 300–350 × 104 km2, exhibiting a significant increasing trend at a rate of 9.46 × 10⁴ km2 yr−1 (p < 0.001).
Figure 3.
Temporal dynamics of shrub encroachment area across different aridity gradients from 2002 to 2022. (a) Arid regions; (b) Semi-arid regions; (c) Dry subhumid regions; (d) Humid regions; (e) Global scale. The solid line represents the annual shrub encroachment area, the dashed line indicates the linear trend, the shaded area denotes the 95% confidence interval, and the vertical dashed line marks the breakpoint identified by the Pettitt test. Before and After refer to the linear trends before and after the breakpoint, respectively, and Total represents the trend across the entire study period.
Segmented trend analysis based on the Pettitt test revealed a significant abrupt change in shrub encroachment during 2010–2014. Following the breakpoint, expansion rates decreased across all aridity zones, declining from 1.64 × 10⁴ km2 yr−1 to 0.77 × 10⁴ km2 yr−1 in arid regions, from 2.33 × 10⁴ km2 yr−1 to 1.09 × 10⁴ km2 yr−1 in semi-arid regions, from 1.80 × 10⁴ km2 yr−1 to 0.22 × 10⁴ km2 yr−1 in dry subhumid regions, and from 11.40 × 10⁴ km2 yr−1 to 1.26 × 10⁴ km2 yr−1 in humid regions. At the global scale, the expansion rate decreased from 17.70 × 10⁴ km2 yr−1 to 3.63 × 10⁴ km2 yr−1. Overall, these results indicate a widespread decline in expansion rates of shrub encroachment across all aridity gradients since the early 2010s, with more pronounced reductions observed in regions with relatively higher moisture availability.
3.2. Spatial Patterns of Shrub Encroachment Coverage Across Aridity Gradients
3.2.1. Spatial Pattern and Latitudinal Distribution of Shrub Encroachment Coverage
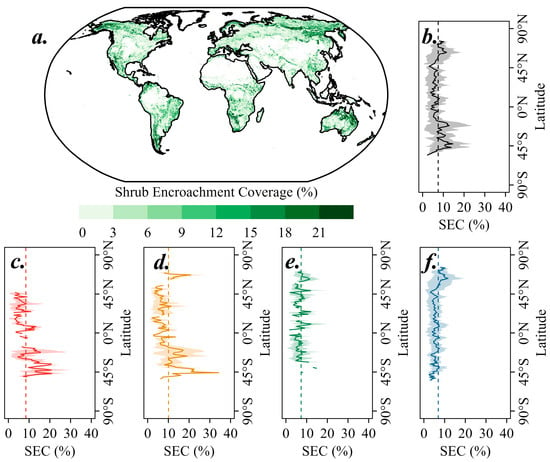
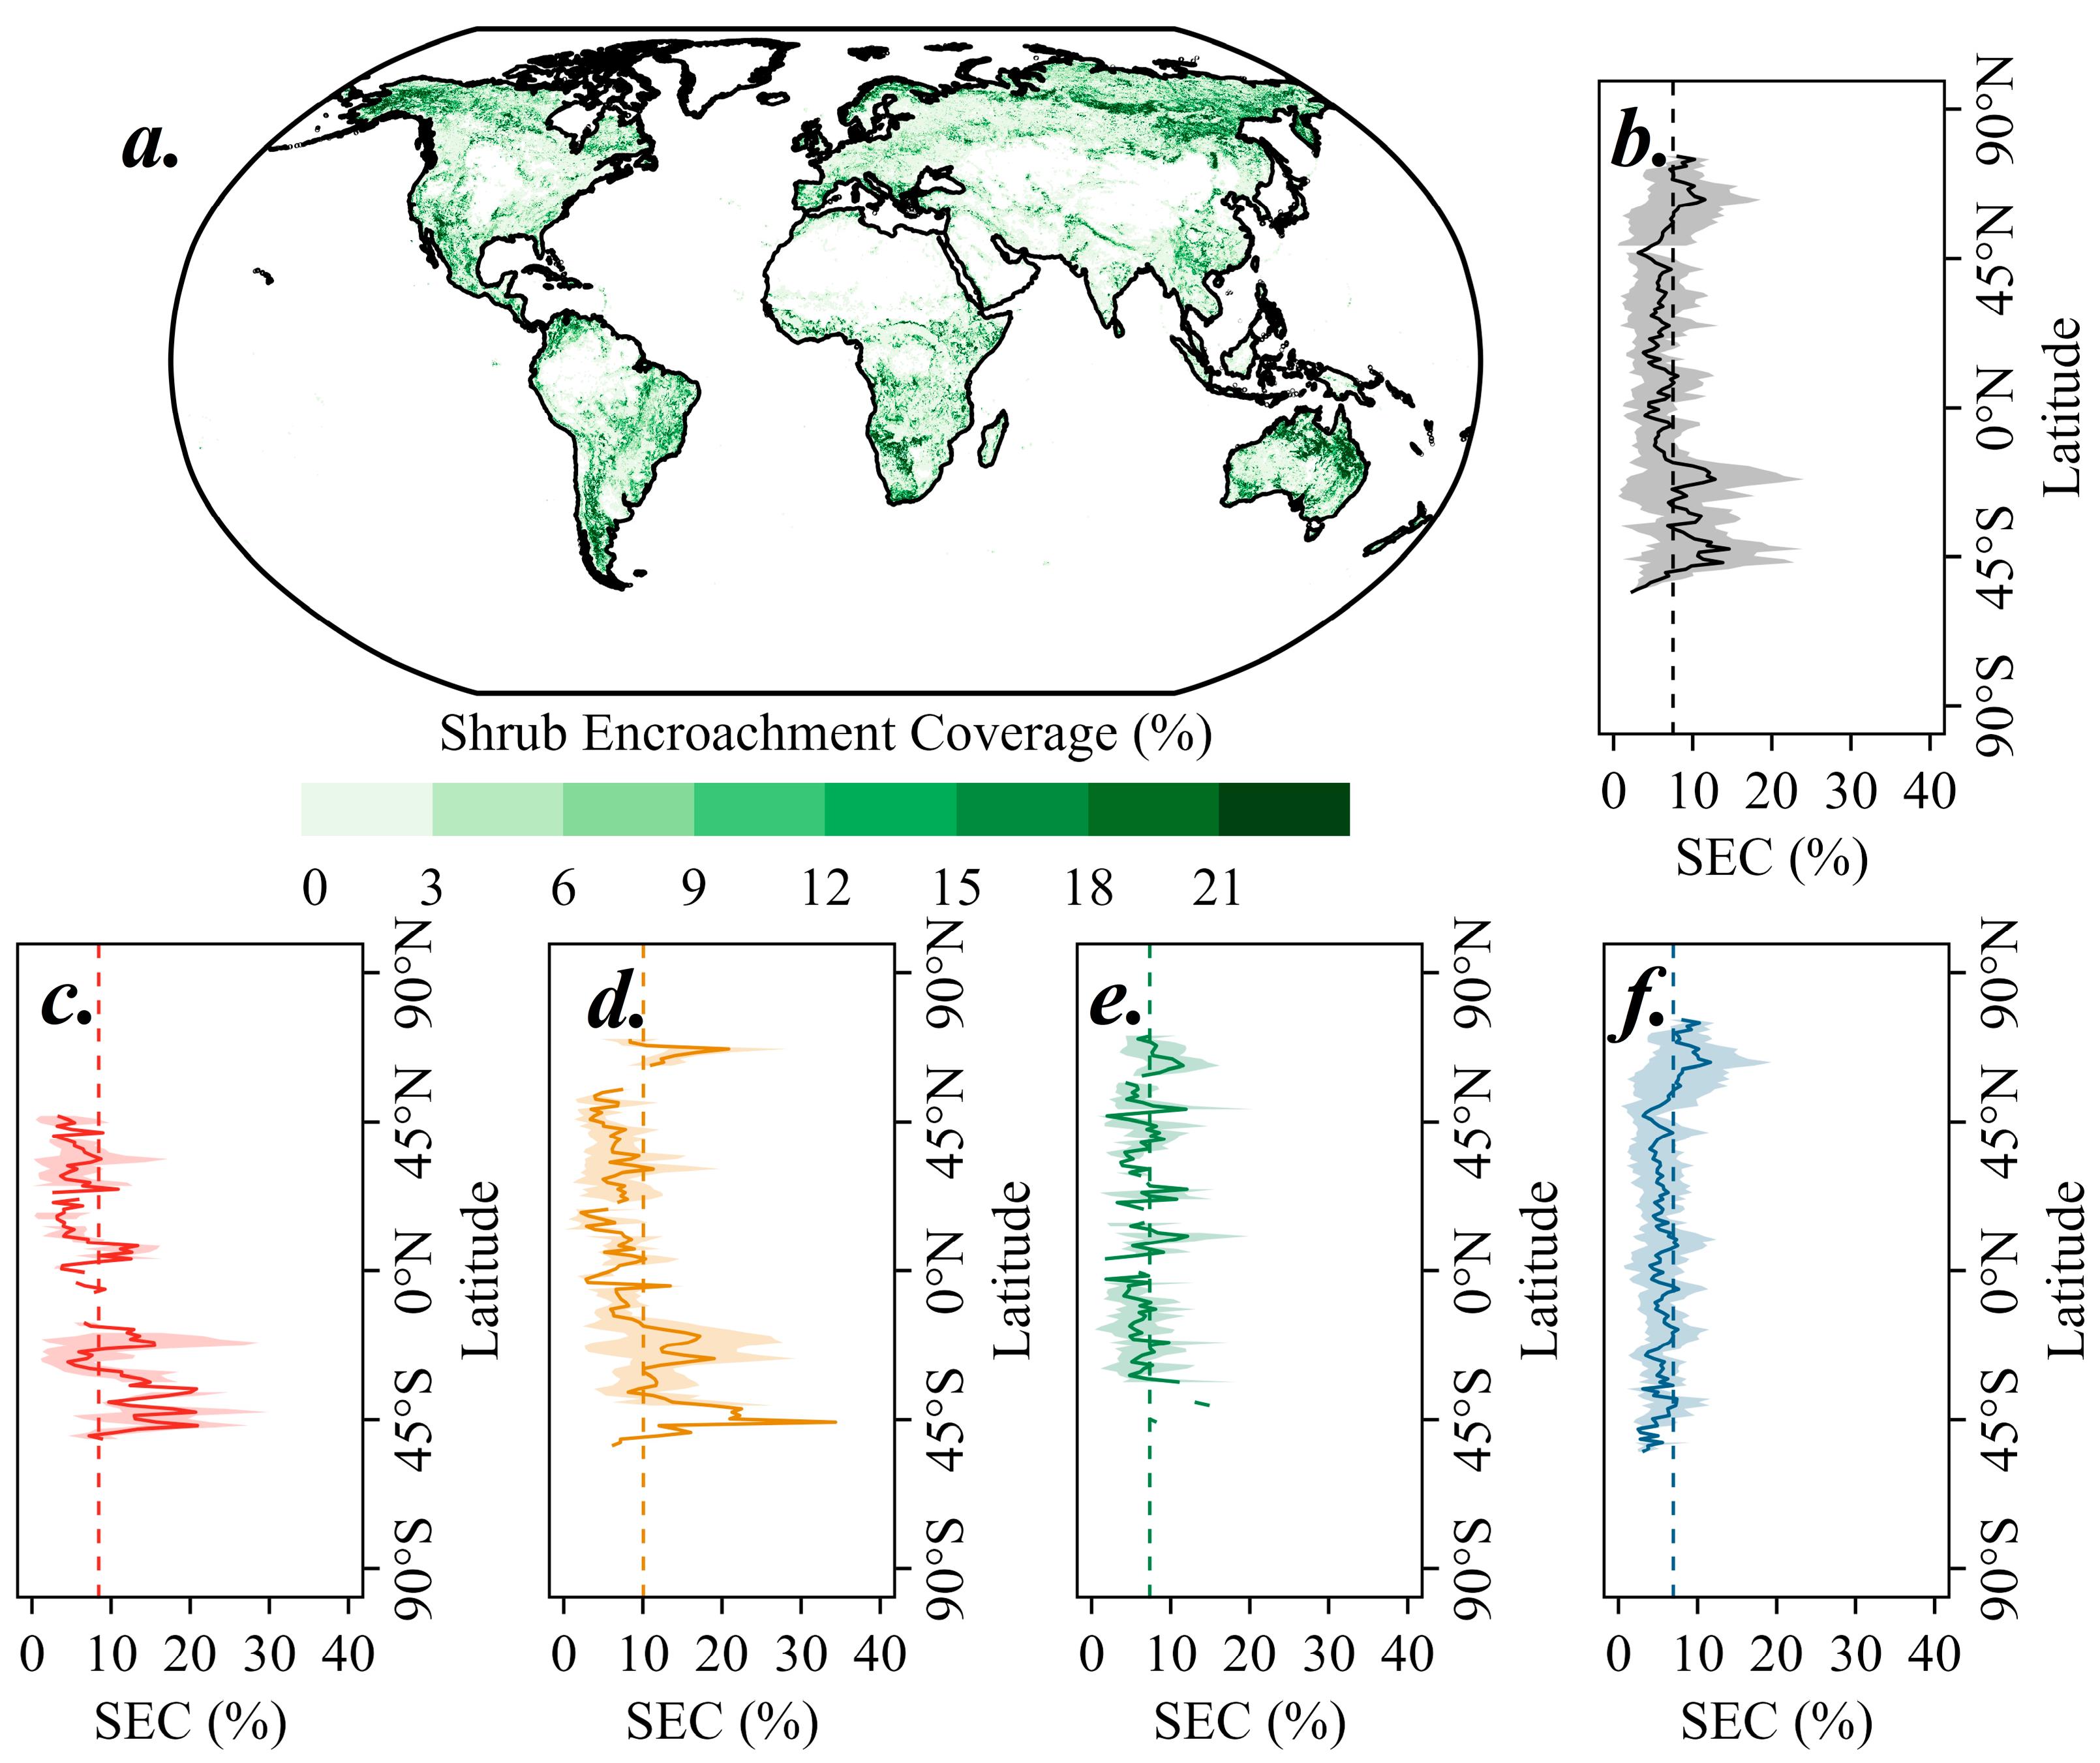
The spatial pattern of global shrub encroachment coverage exhibited pronounced regional heterogeneity (Figure 4). During 2002–2022, the spatial distribution of shrub encroachment cover showed distinct regional clustering characteristics. High-cover areas were predominantly concentrated in western North America, southern South America, southern Africa, northern Australia, and the mid-to-high-latitude zones of Eurasia (Figure 4a).
Figure 4.
Spatial pattern and latitudinal distribution of shrub encroachment coverage across global grasslands. (a) Spatial distribution of shrub encroachment coverage; (b–f) Latitudinal distribution of shrub encroachment coverage globally and across aridity gradients. The solid line represents the mean shrub encroachment coverage, the dashed line indicates the overall latitudinal mean of shrub encroachment coverage, and the shaded area denotes the mean ± 1 standard deviation. AR, SAR, DSH and HU represent arid, semi-arid, dry subhumid, and humid regions, respectively.
Latitudinal gradient analysis revealed that mid-latitude regions of the Southern Hemisphere (30°S–45°S) exhibited relatively high shrub encroachment coverage, while high-latitude regions of the Northern Hemisphere (60–65°N) likewise displayed elevated encroachment levels (Figure 4b). Across aridity gradients, the latitudinal distribution of shrub encroachment cover differed substantially. In arid regions, encroachment levels were higher in the Southern Hemisphere than in the Northern Hemisphere, with concentrations primarily between 30 and 60°S (Figure 4c). This pattern was more pronounced in semi-arid regions, where Southern Hemisphere peak cover values reached up to 35%, and Northern Hemisphere high-latitude zones (60–65°N) also exhibited cover exceeding 20% (Figure 4d). In contrast, dry subhumid regions showed comparatively weak latitudinal variation in shrub encroachment cover, with values generally maintained at approximately 5–10% (Figure 4e). In humid regions, high-latitude areas of the Northern Hemisphere exhibited substantially greater shrub encroachment cover than their Southern Hemisphere counterparts, with notable high-value concentrations also occurring at 60–65°N (Figure 4f). Regarding the latitudinal mean of shrub encroachment coverage, semi-arid regions recorded the highest value (9.46%), followed by arid regions (8.50%). Collectively, these results indicated that shrub encroachment coverage was not only characterized by significant spatial clustering but was also jointly regulated by latitude and aridity gradient, manifesting in a marked north–south hemispheric asymmetry in its distributional pattern.
3.2.2. Stability and Trend of Shrub Encroachment Coverage
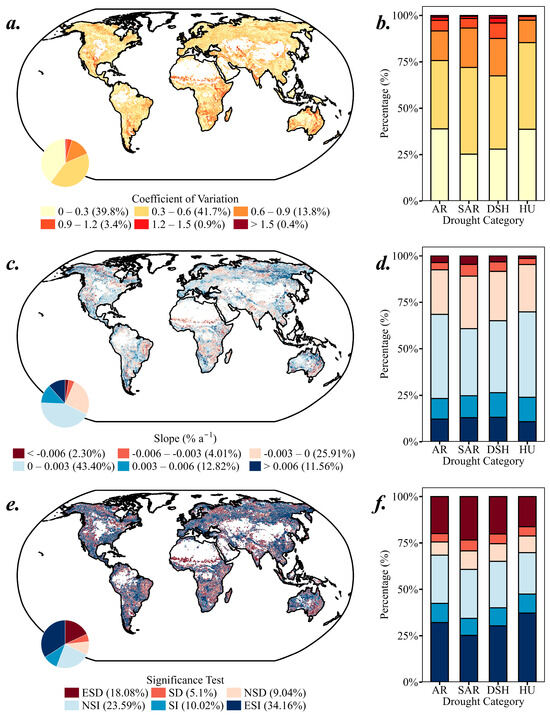
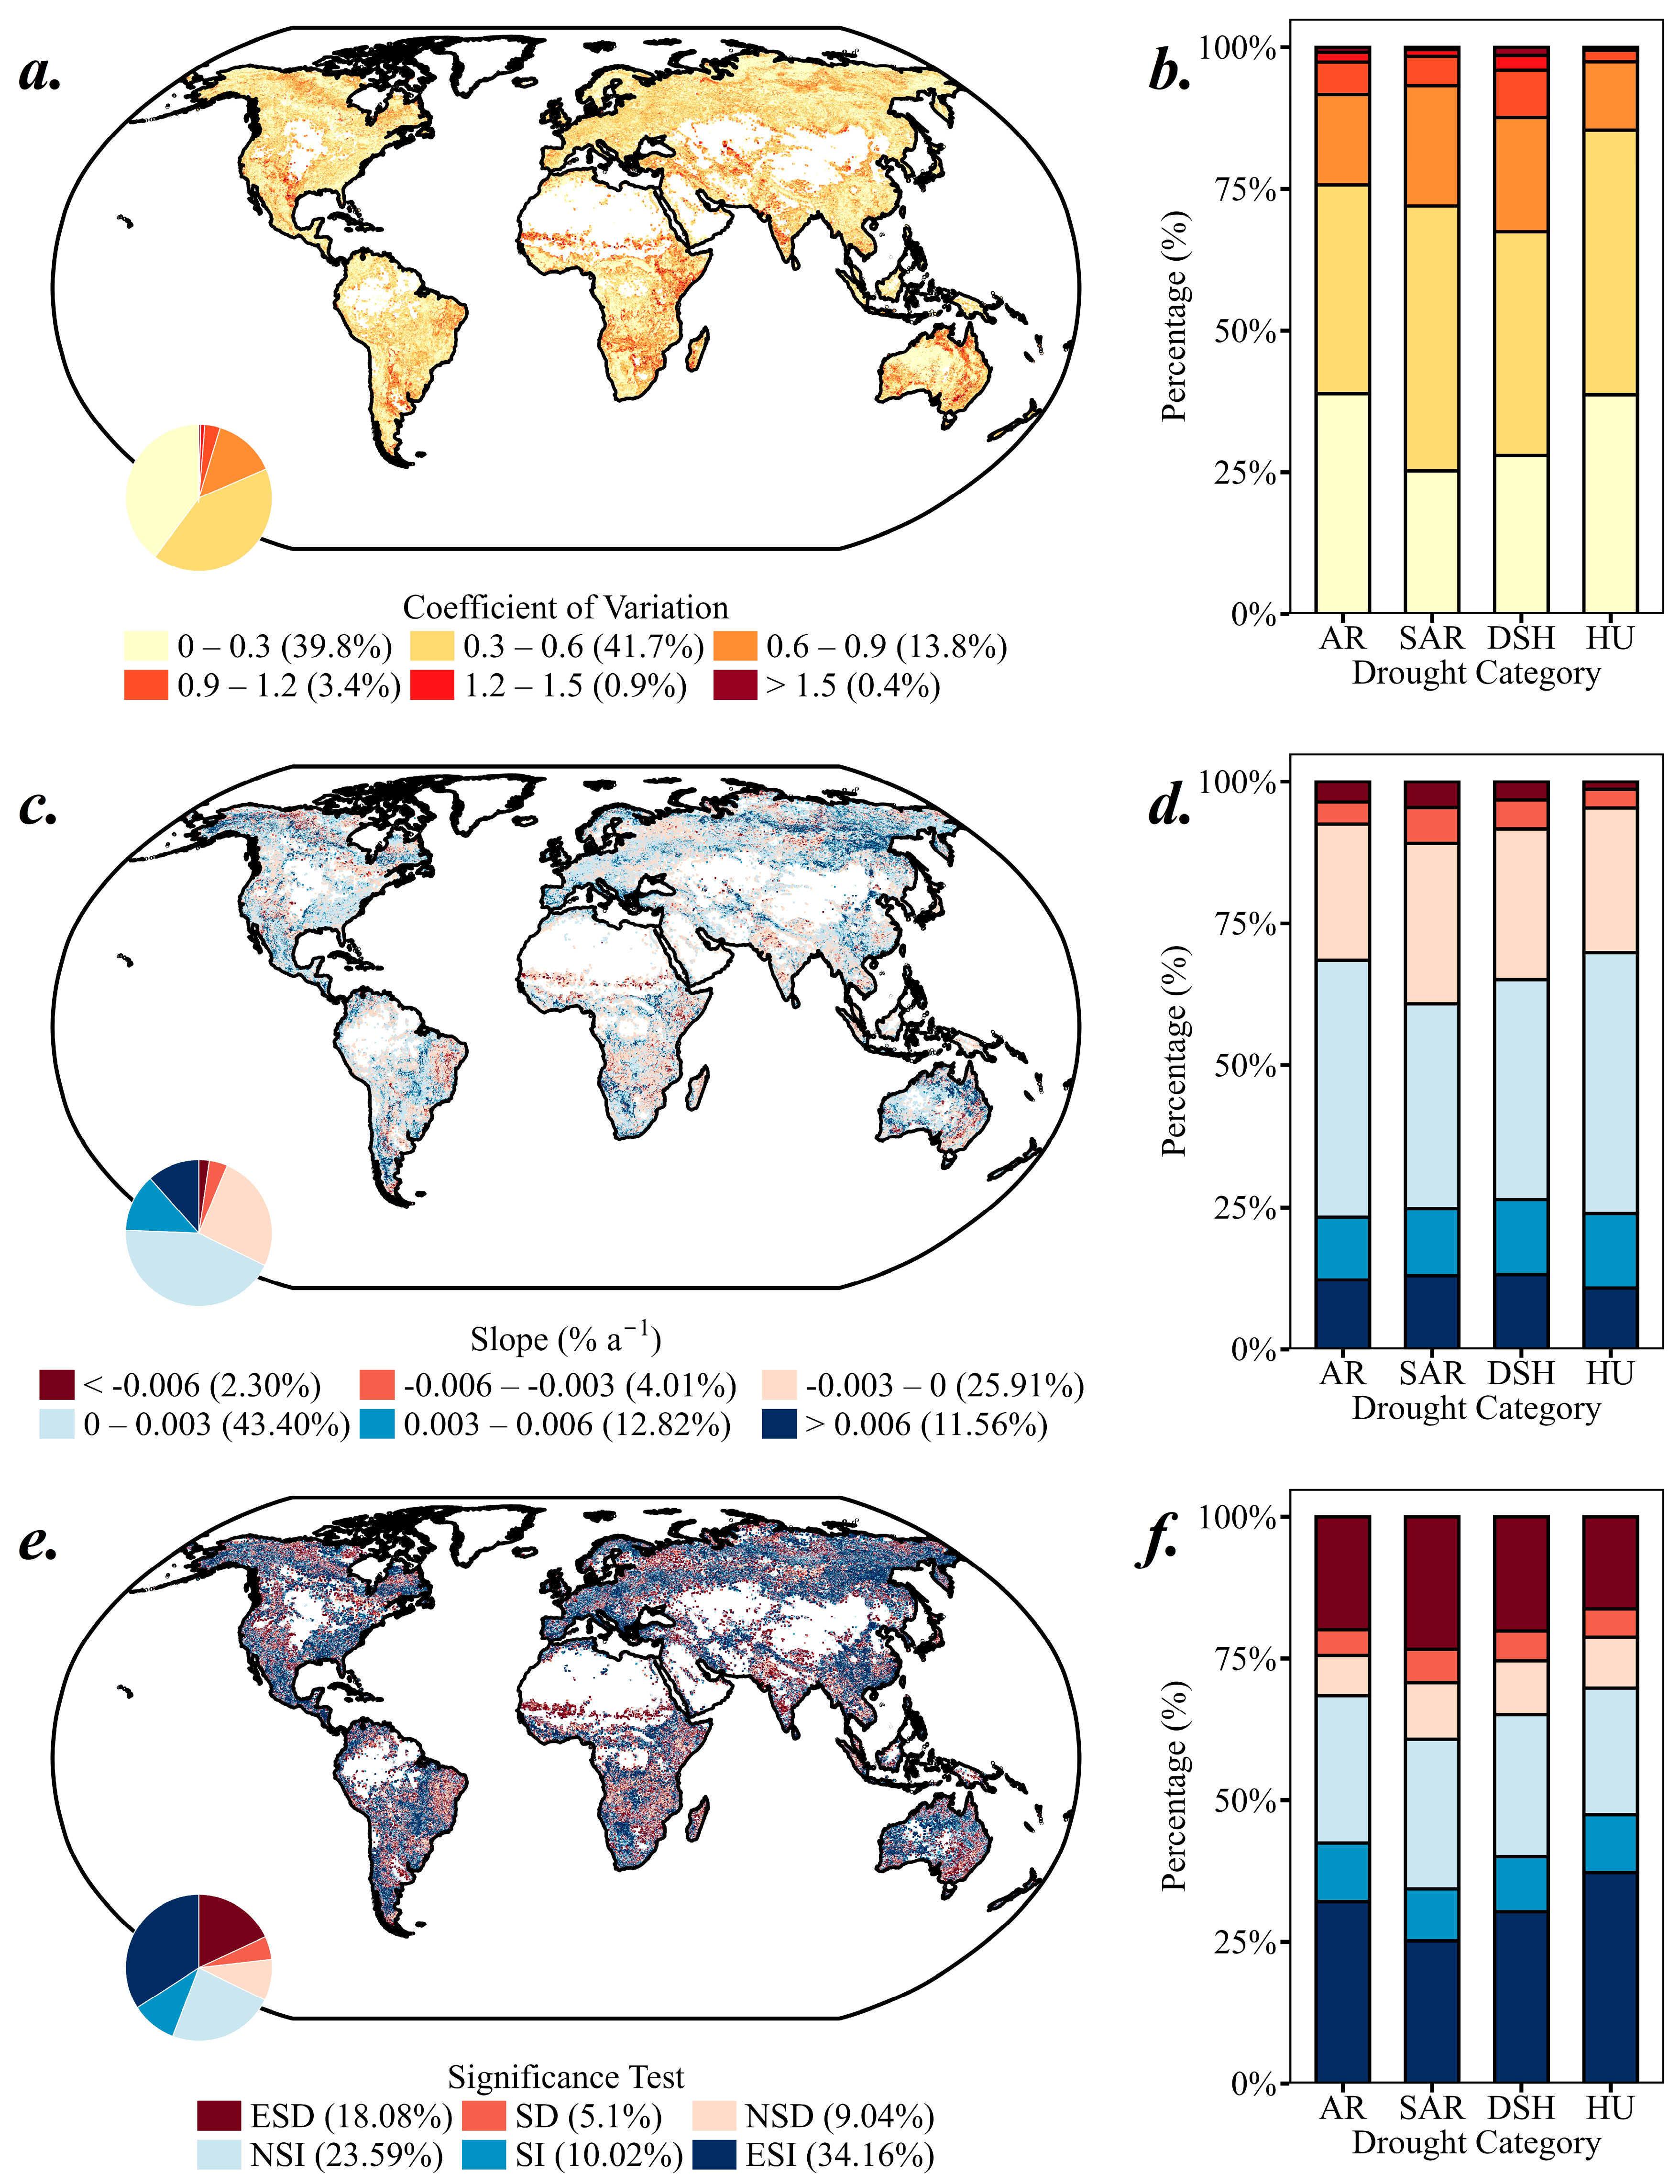
The temporal stability of shrub encroachment coverage varied markedly across aridity gradients (Figure 5). CV analysis revealed that pixels in arid and semi-arid regions were predominantly concentrated in the low-variability interval (CV < 0.6), accounting for 78% and 80% of total pixels, respectively, indicating relatively stable shrub encroachment coverage in these zones. By contrast, the proportion of high-variability pixels (CV > 0.6) increased markedly in semi-arid and dry subhumid regions, reaching 32% and 36%, respectively, suggesting pronounced interannual fluctuation in shrub encroachment coverage across the arid-to-humid transitional zone.
Figure 5.
Spatial distribution and aridity-gradient differentiation of the coefficient of variation, trend magnitude, and trend significance of global shrub encroachment cover during 2002–2022. (a) Spatial distribution of the CV; (b) Proportional area of CV intervals across aridity gradients; (c) Spatial distribution of trend magnitude; (d) Proportional area of trend magnitude intervals across aridity gradients; (e) Spatial distribution of trend significance; (f) Proportional area of significance categories across aridity gradients. Pie charts in (a,c,e) show the overall percentage of each category. AR, SAR, DSH, and HU represent arid, semi-arid, dry subhumid, and humid regions, respectively. ESD: Extremely Significant Decrease; SD: Significant Decrease; NSD: Not Significant Decrease; NSI: Not Significant Increase; SI: Significant Increase; ESI: Extremely Significant Increase.
Trend analysis revealed clear differentiation in the direction and magnitude of shrub encroachment cover change across aridity gradients (Figure 5). Increasing trends dominated across aridity gradients, indicating that global shrub encroachment maintained an overall expanding trajectory throughout the study period. Among these, the slow increase category (0–0.003% yr−1) accounted for the largest proportion in each zone, reaching 45.25% and 45.92% in arid and humid regions, respectively, and 36.00% and 38.66% in semi-arid and dry subhumid regions, respectively, confirming that slow expansion represented the dominant mode of change in global shrub encroachment. Significance testing further revealed that the proportion of significantly increasing pixels varied along the aridity gradient, being highest in humid regions (47.45%), followed by arid (42.50%), dry subhumid (40.02%), and semi-arid regions (34.37%).
Notably, the extremely significant increase category accounted for the largest proportion across all aridity gradients, reaching 37.22% in humid regions and substantially exceeding those of the other zones, consistent with a facilitating role of humid conditions on shrub encroachment expansion. The proportion of significantly decreasing pixels remained low across all aridity zones, being highest in semi-arid regions (29.24%) and lowest in humid regions (21.19%). Overall, the proportion of significantly increasing pixels followed an increasing gradient from semi-arid to humid regions.
3.3. Effects of Shrub Encroachment on Vegetation Indicators Across Aridity Gradients
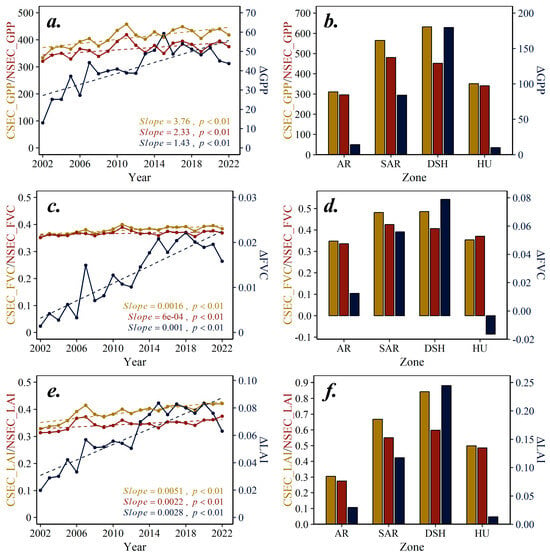
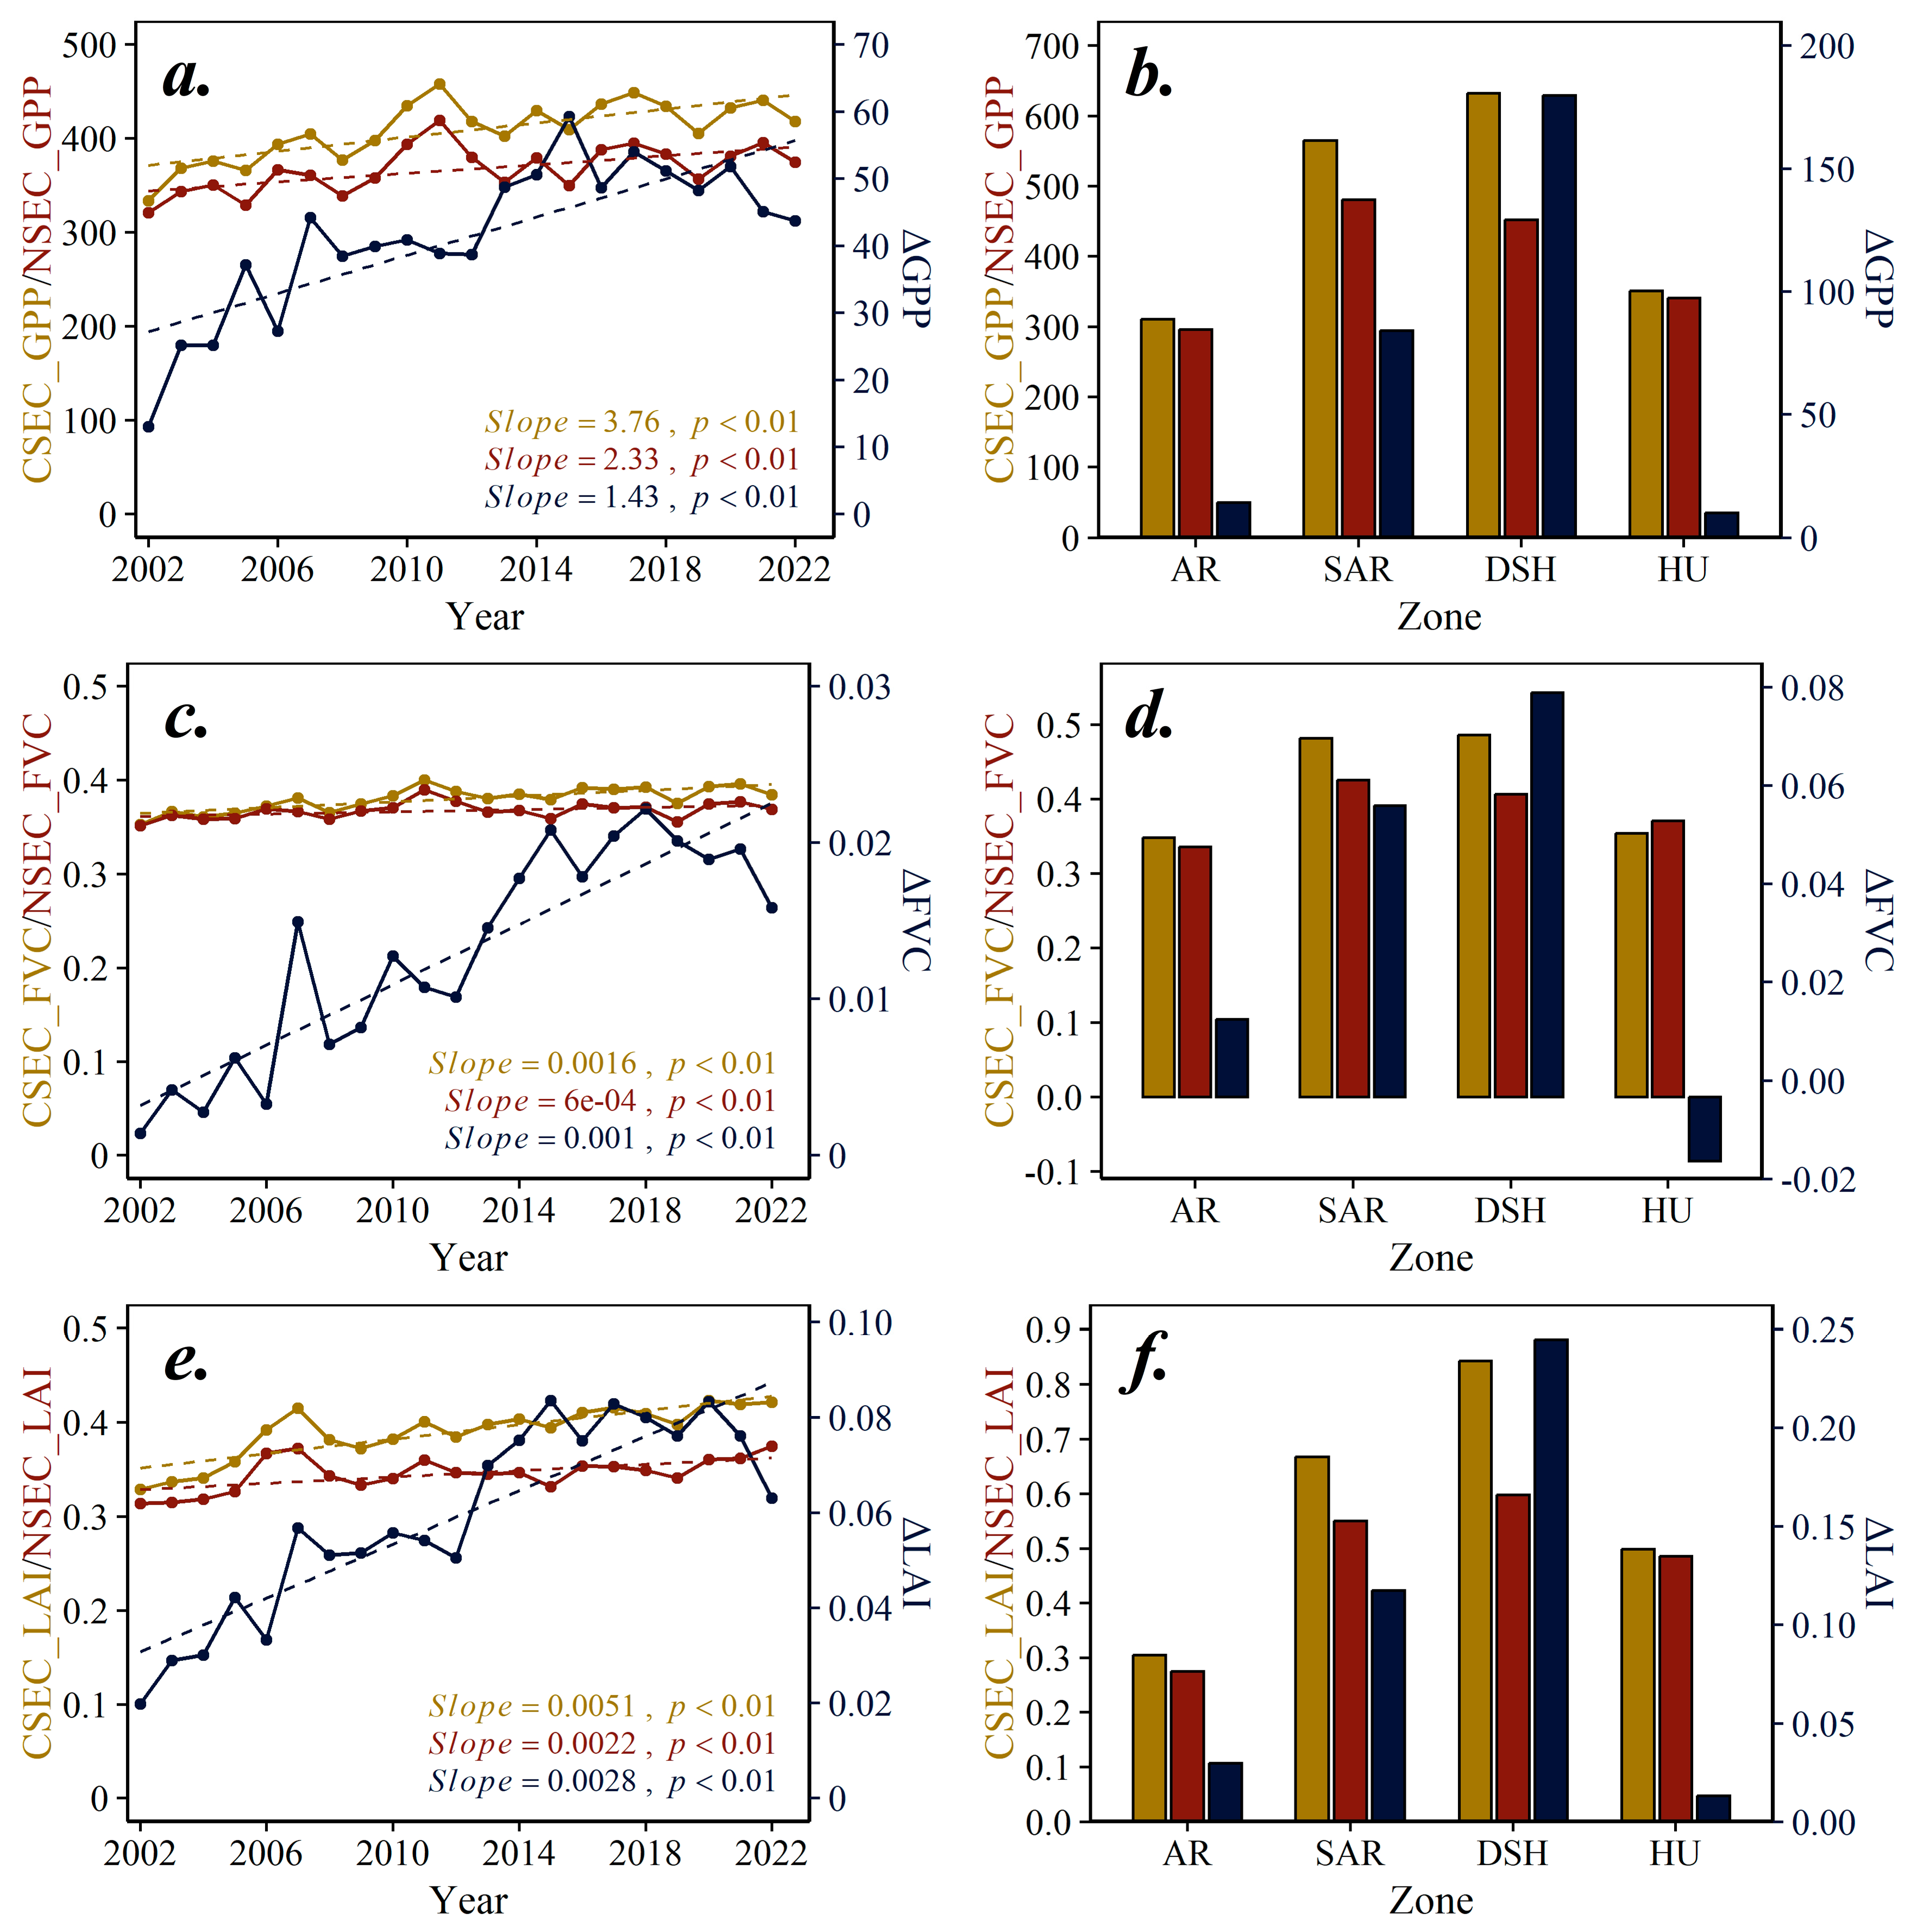
During 2002–2022, LAI, FVC, and GPP in both CSEC and NSEC areas showed significant overall upward trends globally (p < 0.01) (Figure 6). The rates of change in GPP, FVC, and LAI were consistently greater in CSEC than in NSEC areas, indicating that shrub encroachment substantially enhanced vegetation GPP, FVC, and LAI. The magnitude of these effects varied markedly across aridity gradients. With respect to GPP, NSEC areas in arid and semi-arid regions averaged approximately 300 and 580 gC m−2 yr−1, respectively, exceeding the corresponding values of 280 and 450 gC m−2 yr−1 in NSEC areas.
Figure 6.
Temporal trends of greening (LAI), vegetation coverage (FVC), and productivity (GPP) in SEC and NSEC, and their differences across aridity gradients. Panels (a,b) show GPP, (c,d) show FVC, and (e,f) show LAI. Panels (a,c,e) present interannual trends with dashed lines indicating linear fits, while panels (b,d,f) show mean values across aridity gradients. Δ indicates the difference between SEC and NSEC. AR, SAR, DSH, and HU represent arid, semi-arid, dry subhumid, and humid regions, respectively. GPP (g C m−2 yr−1); LAI (m2 m−2); FVC (dimensionless).
Along the transition from arid to dry sub-humid regions, the GPP difference between CSEC and NSEC widened progressively, peaking in dry subhumid regions before diminishing in humid regions (Figure 6b). The response pattern of LAI closely mirrored that of GPP, with the divergence between CSEC and NSEC progressively intensifying from arid to dry subhumid regions (Figure 6f). The influence of shrub encroachment on FVC also exhibited clear aridity gradient dependence: across arid to dry subhumid regions, FVC was markedly higher in CSEC than in NSEC, with the difference expanding as moisture availability improved. However, in humid regions, this difference reversed to negative, meaning that CSEC exhibited lower FVC than NSEC (Figure 6d). Overall, shrub encroachment significantly enhanced grassland vegetation greenness, fractional cover, and productivity, with this effect being most pronounced in semi-arid and dry sub-humid regions.
3.4. Divergent Trends in Greening and Productivity of Shrub Encroachment
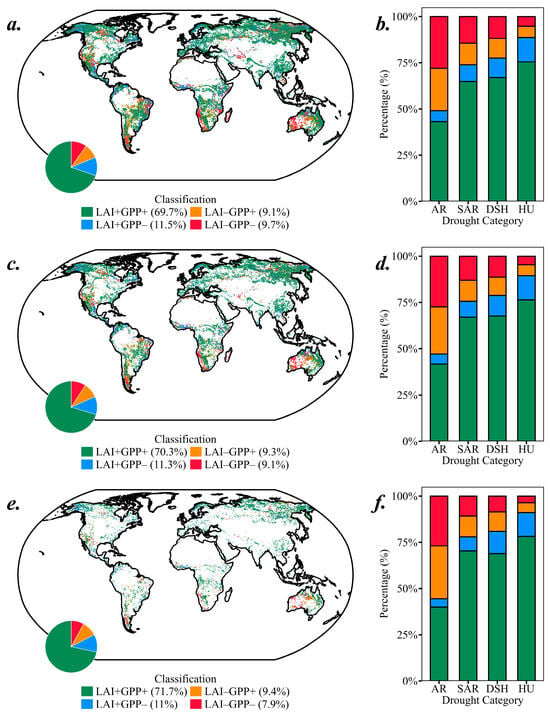
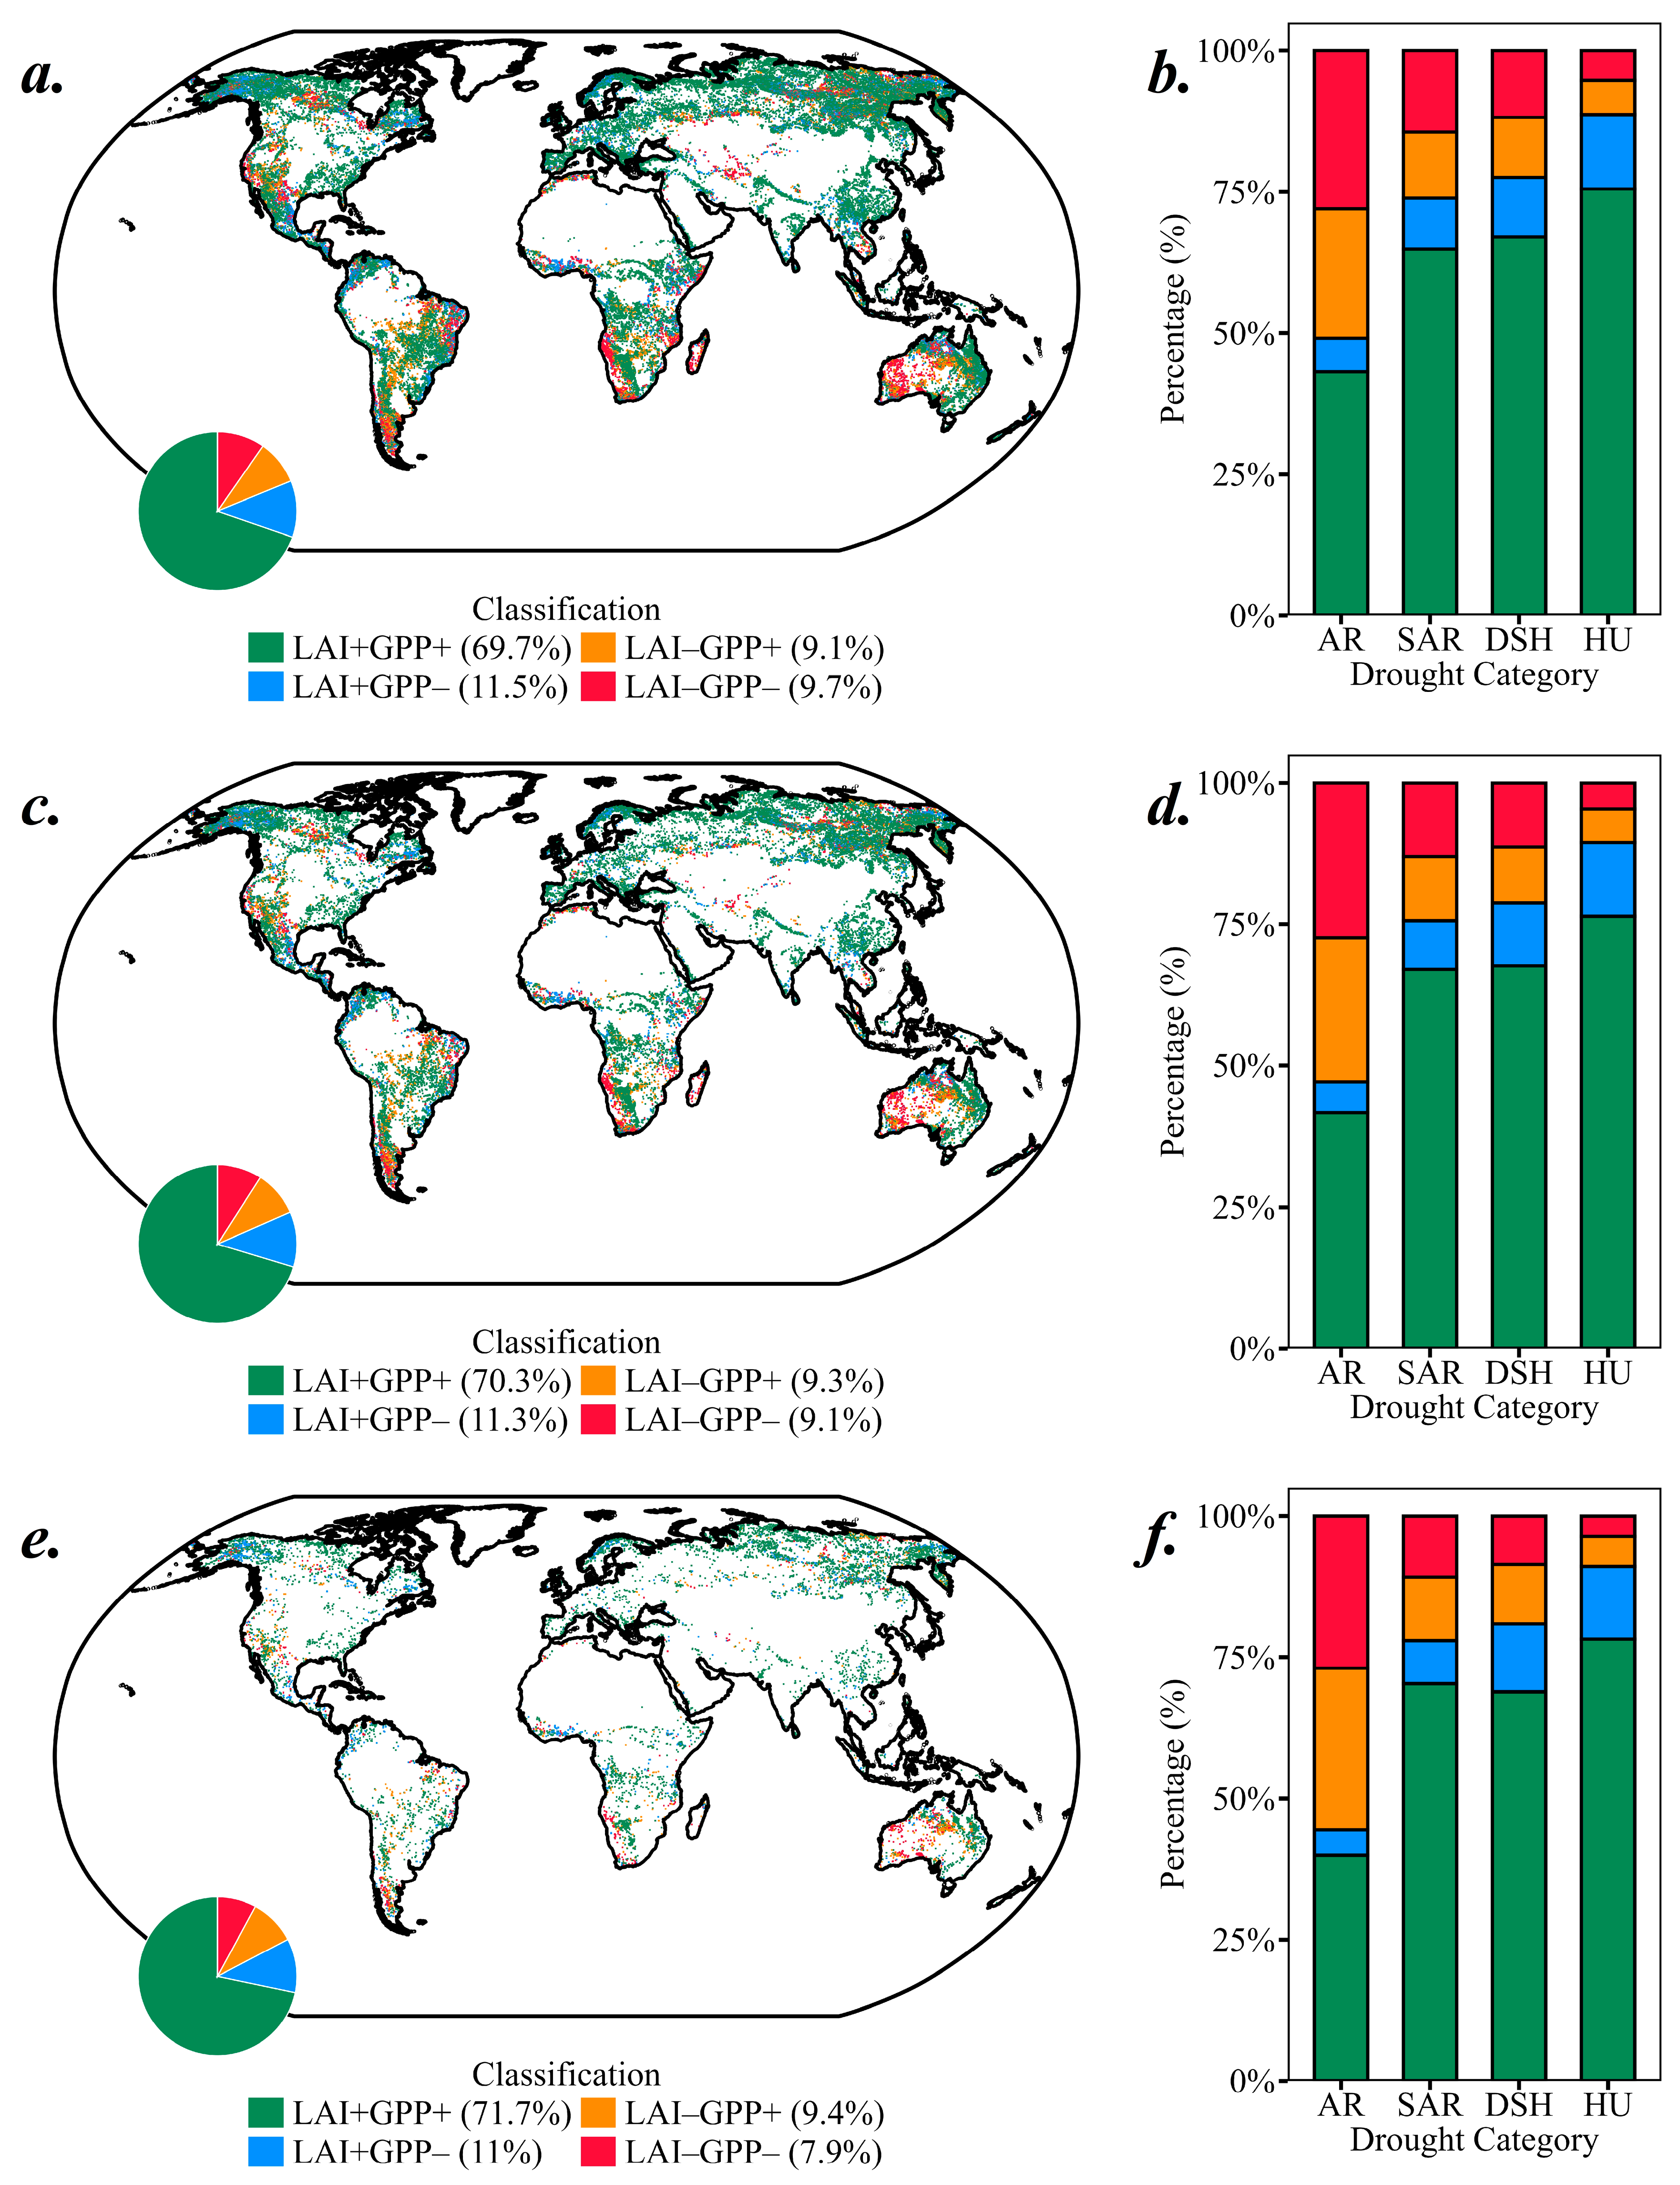
Based on the combined long-term trends of LAI and GPP in shrub encroachment, four trend combination types were constructed (Figure 7). Across three persistence duration thresholds (≥7, ≥14, and ≥21 years), the LAI+GPP+ type consistently dominated, accounting for 69.7%, 70.3%, and 71.7% of pixels, respectively, indicating that concurrent improvements in vegetation greenness and productivity represent the prevailing response across different stages of shrub encroachment. The LAI+GPP−, LAI−GPP+, and LAI−GPP− types each accounted for relatively low and broadly consistent proportions across all thresholds (Figure 7a,c,e).
Figure 7.
Spatial distribution and aridity gradient characteristics of joint trends in greening (LAI) and productivity (GPP) in shrub-encroached grasslands under different duration thresholds. Four trend combinations (LAI+GPP+, LAI+GPP−, LAI−GPP+, LAI−GPP−) are shown spatially, with pie charts indicating overall proportions and bar charts showing area proportions across aridity gradients. Three duration thresholds correspond to shrub encroachment persisting for ≥7, ≥14, and ≥21 years. AR, SAR, DSH, and HU represent arid, semi-arid, dry subhumid, and humid regions, respectively. (a,c,e) Spatial distribution of joint LAI–GPP trend combinations under duration thresholds of ≥7, ≥14, and ≥21 years, respectively. (b,d,f) Area proportions of the four trend combinations across aridity gradients corresponding to ≥7, ≥14, and ≥21 years, respectively.
Spatially, the LAI+GPP+ type was widely distributed across most shrub encroachment regions globally, whereas the LAI+GPP− type exhibited pronounced regional clustering, predominantly in high-latitude regions of the Northern Hemisphere, northern Australia, southern North America, eastern South America, and northern Amazonia, where increasing LAI trends were accompanied by declining GPP. By contrast, the LAI−GPP+ and LAI−GPP− types were spatially fragmented, occurring primarily in localized arid or transitional zones.
Along the aridity gradient, the four trend combination types showed marked divergence (Figure 7b,d,f). Under all threshold conditions, the proportion of LAI+GPP+ increased with rising moisture availability, reaching its maximum in humid regions and its minimum in arid regions. The proportion of LAI+GPP− similarly increased toward more humid conditions, with relatively higher values in humid regions. In contrast, the LAI−GPP+ and LAI−GPP− types both exhibited a decreasing gradient from arid to humid regions, with the lowest proportions recorded in humid zones. The LAI−GPP+ type was disproportionately concentrated in arid and semi-arid regions, suggesting that this decoupling pattern is more prevalent under water-limited conditions.
4. Discussion
4.1. Spatiotemporal Heterogeneity of Shrub Encroachment Across Regions
This study identified significant shrub encroachment expansion at the global scale, revealing pronounced regional heterogeneity and stage-dependent dynamics. Shrub encroachment area increased continuously from 2002 to 2022, yet with marked differentiation across aridity gradients. A significant abrupt change in expansion rates was detected around 2010–2014 (Figure 3), suggesting that this period may represent a critical transition in global grassland vegetation structure. Spatially, high-coverage shrub encroachment was predominantly concentrated in western North America, southern South America, southern Africa, northern Australia, and the mid-to-high-latitudes of Eurasia (Figure 4), patterns that likely reflect the combined influence of climatic moisture variability and herbaceous–woody plant competition [10,37].
Shrub encroachment was also widespread in humid grasslands, where both total encroachment area and expansion rates were the highest, followed by semi-arid regions (Figure 3). This indicates that humid grasslands are equally susceptible to woody plant invasion and should not be overlooked in global encroachment assessments. Furthermore, shrub encroachment coverage exhibited a clear hemispheric asymmetry, with the Southern Hemisphere generally exceeding the Northern Hemisphere. This divergence was most pronounced in semi-arid regions, where coverage in the semi-arid regions of the Southern Hemisphere reached up to 35%, while Northern Hemisphere high-latitude zones (60–65°N) also recorded values exceeding 20% (Figure 4), suggesting that the underlying drivers of encroachment differ substantially across climatic zones.
In high-latitude permafrost regions, climate warming may facilitate woody plant expansion by extending the growing season and promoting permafrost thaw, whereas in savanna ecosystems, increased precipitation tends to favor shrub establishment [38]. The most pronounced increases in woody plant cover were observed in savanna systems, with a notable concentration of high encroachment values at 60–65°N in the Northern Hemisphere [33], a pattern likely associated with warming-induced growing season extension and permafrost degradation. In semi-arid regions, woody plant expansion was particularly prominent, which can be attributed to the proximity of these environments to the critical moisture threshold governing herbaceous–woody competition—a transitional zone where even modest shifts in water availability can tip competitive dynamics in favor of woody plants [15,16]. In particular, deep-rooted woody plants are able to access deep soil water reserves and thereby progressively displace shallow-rooted grasses under drought conditions [9].
CV analysis further revealed that interannual variability in shrub encroachment coverage was most pronounced in the semi-arid to dry sub-humid transitional zone (Figure 5), indicating heightened sensitivity of herbaceous–woody competition to moisture fluctuations in climatic transition zones where water availability is inherently variable. By contrast, interannual variability was comparatively subdued in regions with more consistently arid or humid conditions. These patterns are consistent with previous findings that vegetation structural dynamics in semi-arid grassland ecosystems respond strongly to climate variability [12,16], and that vegetation dynamics in arid-to-humid transitional zones are particularly sensitive to precipitation variability [31]. Collectively, these results demonstrate that the spatiotemporal evolution of global shrub encroachment is fundamentally regulated by moisture gradients and regional climate, manifesting in substantial differentiation across climatic zones.
4.2. Effects of Shrub Encroachment on Vegetation LAI and GPP
Shrub encroachment consistently enhanced LAI, FVC, and GPP in encroached grasslands relative to non-encroached counterparts, with greater rates of increase observed across all aridity zones (Figure 6). Critically, the magnitude of these effects was strongly moisture-dependent, peaking in semi-arid and dry subhumid regions and diminishing progressively toward humid zones. This aridity gradient dependence represents a key finding of this study, demonstrating that the ecological consequences of shrub encroachment are not spatially uniform but are fundamentally regulated by water availability. The divergence between CSEC and NSEC in both LAI and GPP widened progressively from arid to dry subhumid regions before narrowing in humid zones, with FVC differences even reversing to negative in the most humid environments.
The pronounced enhancement of LAI and GPP in semi-arid and dry subhumid regions may be attributed to the physiological advantages of woody plants under water-limited conditions. Deep-rooted shrubs are capable of accessing subsoil moisture reserves inaccessible to shallow-rooted grasses, enabling sustained photosynthetic activity and higher LAI maintenance during drought periods [16,39]. In mid-to-high-latitude ecosystems, woody plant expansion has similarly been shown to enhance GPP and evapotranspiration through both direct and indirect climatic pathways [40], further corroborating the generality of encroachment-driven productivity enhancement across climatic contexts. Furthermore, semi-arid and dry sub-humid regions lie near the critical moisture threshold governing herbaceous–woody competition, where even modest increases in woody cover can substantially alter canopy structure and water use efficiency, thereby enhancing the positive effect of shrub encroachment on GPP [15,16]. In humid regions, by contrast, herbaceous vegetation already maintains high intrinsic productivity, leaving limited room for shrub encroachment to further enhance GPP, and the competitive suppression of grasses by shrubs may instead reduce overall fractional cover [39].
Joint trend analysis of LAI and GPP revealed a globally dominant pattern of concurrent LAI and GPP enhancement (LAI+GPP+), accounting for approximately 70% of encroached pixels, with its prevalence increasing progressively with moisture availability (Figure 7). This finding demonstrates that shrub encroachment broadly promotes coordinated improvements in vegetation greening and carbon fixation, particularly under favorable moisture conditions, consistent with evidence that adequate water supply is a prerequisite for coordinated improvements in LAI and GPP [16,41]. However, a spatially coherent decoupling pattern (LAI+GPP−) persisted in high-latitude regions of the Northern Hemisphere and parts of humid zones, where increasing LAI trends were accompanied by declining GPP, consistent with findings from both local and regional studies [42,43]. Previous studies have noted that vegetation greening is most pronounced in humid regions [35,44], whereas productivity peaks tend to occur in arid regions [45], reflecting the fact that enhanced greening does not necessarily translate into a corresponding increase in productivity [42,43]. The mechanistic basis for this divergence likely lies in the differential sensitivity of LAI and GPP to environmental constraints: while shrub expansion can rapidly increase LAI and vegetation cover, GPP gains are simultaneously limited by soil moisture, nutrient availability, and soil respiration [22,24]. In water-limited environments, soil moisture and nitrogen availability have been identified as the dominant controls on GPP variability, with LAI playing a comparatively secondary role, implying that even substantial increases in LAI may fail to generate proportional gains in GPP under moisture stress [46]. These results collectively highlight that the relationship between LAI and GPP under shrub encroachment is inherently context-dependent, varying systematically across aridity gradients in ways that cannot be captured by globally uniform assessments.
4.3. Limitations and Future Research Directions
This study systematically revealed the spatiotemporal expansion of shrub encroachment and its effects on vegetation structure and ecosystem function at the global scale, providing new remote sensing evidence for understanding grassland ecosystem transitions under global change. Nevertheless, several limitations warrant consideration.
First, shrub encroachment was identified based on the MODIS land cover product (MCD12Q1, 500 m spatial resolution), which offers good temporal continuity and global consistency [16,47]. However, this product retains uncertainties in mixed herbaceous–woody areas, particularly in the detection of low-cover shrubs [48]. It should be noted that the spatial resampling from 500 m resolution to a 0.1° grid, while necessary for computational consistency, may introduce a smoothing effect that obscures fine-scale spatial heterogeneity. The aggregation process may homogenize mixed land surface conditions within individual grid cells, potentially attenuating the detection of localized vegetation dynamics in transitional zones. Future studies could integrate higher-resolution, multi-scale and multi-sensor remote sensing data to develop a cross-scale shrub encroachment monitoring framework that maintains global spatiotemporal continuity while improving local detection accuracy, and cross-validation with high-spatial-resolution imagery and existing woody cover dynamic products would further enhance the credibility of global shrub encroachment mapping.
Second, this study did not quantitatively assess the role of anthropogenic disturbances, including grazing, fire, and land use change. Disentangling climatic from anthropogenic drivers of shrub encroachment at the global scale remains a substantial challenge [9,26]. Future research could incorporate global grazing intensity datasets, satellite-derived fire frequency products, and land use data to establish a quantitative attribution framework for the drivers of shrub encroachment.
Third, the NSEC reference group, as defined in this study, may include stable semi-woody systems such as woody savannas and open shrublands, rather than consisting exclusively of herbaceous grasslands. This compositional heterogeneity could introduce uncertainty into the interpretation of paired comparison results, and future studies should consider applying stricter filtering criteria to restrict the reference group to purely herbaceous pixels to enable more unambiguous attribution of ecological changes to shrub encroachment.
Overall, the ecological effects of shrub encroachment on carbon cycling are strongly regulated by moisture gradients, implying that management strategies should be adapted to local hydroclimatic conditions across aridity zones. In arid and semi-arid grasslands, differentiated management practices such as targeted grazing and prescribed burning may help mitigate excessive shrub expansion while sustaining ecosystem carbon storage and productivity. Regarding targeted grazing, intensively managed rotational grazing with short stocking cycles and resting periods has been shown to suppress early woody plant establishment by maintaining sufficient herbaceous biomass to outcompete shrub recruits, while avoiding overgrazing-induced bare ground expansion that would otherwise facilitate shrub colonization [49]. Regarding prescribed burning, fire return intervals of 2–3 years effectively control shrub cover by top-killing juvenile woody plants before they develop fire-resistant bark, whereas intervals exceeding 5 years allow shrub density to increase substantially [50]. Notably, optimal burning frequency varies with moisture availability, with shorter intervals required in humid regions to counteract rapid shrub regrowth and longer intervals sufficient in semi-arid regions [51]. This moisture-gradient dependence demonstrates that the ecological consequences of shrub encroachment vary systematically across aridity zones, reinforcing the need for spatially differentiated management prescriptions.
5. Conclusions
This study focused on global grasslands across aridity gradients, systematically characterizing the spatiotemporal dynamics of shrub encroachment during 2002–2022 and quantifying its differentiated effects on vegetation structure (LAI and FVC) and ecosystem productivity (GPP) using multi-source remote sensing data in conjunction with pixel-level trend analysis, breakpoint detection, and LAI–GPP coupling assessment. Global shrub encroachment expanded continuously over the study period, with a total extent of approximately 300–350 × 104 km2, and a significant structural transition was detected between 2010 and 2014, after which expansion rates declined across all aridity zones while the overall trajectory remained one of persistent growth, with both extent and rate showing pronounced aridity gradient dependence and the highest expansion rates recorded in humid regions. LAI, FVC, and GPP in continuously shrub-encroached cells were consistently higher than in non-encroached cells, with greater rates of increase, indicating that shrub encroachment broadly promoted vegetation greening and productivity enhancement at the global scale, though this positive effect was most pronounced in semi-arid and dry subhumid regions and weakened in humid regions where FVC differences even reversed to negative. Joint trend analysis revealed that concurrent enhancement of vegetation greenness and productivity (LAI+GPP+) was the dominant pattern, accounting for approximately 70% of shrub-encroached pixels, while a non-negligible decoupling (LAI+GPP–) persisted in high-latitude regions of the Northern Hemisphere and parts of humid zones. Collectively, these findings demonstrate that the spatiotemporal dynamics and ecological consequences of global shrub encroachment are fundamentally regulated by moisture gradients and exhibit pronounced spatial heterogeneity, providing global-scale quantitative evidence linking shrub encroachment to coordinated shifts in ecosystem structure and function and offering a remote sensing foundation for adaptive grassland management and carbon sink assessment under increasing aridity.
Author Contributions
P.D.: Formal analysis, Data curation, Writing—original draft; C.J.: Supervision, Project administration, Writing—review and editing, Funding acquisition; G.W.: Methodology, Software, Visualization, Writing—review and editing; Y.S.: Validation, Resources, Writing—review and editing. All authors have read and agreed to the published version of the manuscript.
Funding
This work was supported by the Outstanding Youth Science Fund Project of Xinjiang Uygur Autonomous Region (2026), the Central Financial Forestry and Grassland Science and Technology Extension Demonstration Project (Grant No. Xin [2025] TG 09), and the Xinjiang Agricultural University Graduate Research Innovation Project (XJAUGRI2026010).
Data Availability Statement
The MODIS LAI product can be obtained from https://www.earthdata.nasa.gov/data/catalog/lpcloud-mod15a2h-061 (20 September 2025). The MODIS GPP product can be obtained from https://www.earthdata.nasa.gov/data/catalog/lpcloud-mod17a2h-061 (18 November 2025). The MODIS NDVI can be obtained from https://www.earthdata.nasa.gov/data/catalog/lpcloud-mod13a1-061 (15 October 2025). MCD12Q1 land use product can be obtained from https://www.earthdata.nasa.gov/data/catalog/lpcloud-mcd12q1-061 (27 December 2025). Aridity Index dataset can be obtained from https://data.apps.fao.org/catalog/dataset/221072ae-2090-48a1-be6f-5a88f061431a (11 December 2025).
Conflicts of Interest
The authors declare no competing interests.
References
- Fay, P.A.; Gherardi, L.A.; Yahdjian, L.; Adler, P.B.; Bakker, J.D.; Bharath, S.; Borer, E.T.; Harpole, W.S.; Hersch-Green, E.; Huxman, T.E. Interactions among nutrients govern the global grassland biomass–precipitation relationship. Proc. Natl. Acad. Sci. USA 2025, 122, e2410748122. [Google Scholar] [CrossRef] [Scilit]
- Gherardi, L.A.; Sala, O.E. Global patterns and climatic controls of belowground net carbon fixation. Proc. Natl. Acad. Sci. USA 2020, 117, 20038–20043. [Google Scholar] [CrossRef] [Scilit]
- O’Mara, F.P. The role of grasslands in food security and climate change. Ann. Bot. 2012, 110, 1263–1270. [Google Scholar] [CrossRef] [Scilit] [PubMed]
- Wang, G.; Yuan, X.; Jing, C.; Hamdi, R.; Ochege, F.U.; Dong, P.; Shao, Y.; Qin, X. The decreased cloud cover dominated the rapid spring temperature rise in arid Central Asia over the period 1980–2014. Geophys. Res. Lett. 2024, 51, e2023GL107523. [Google Scholar] [CrossRef] [Scilit]
- Smith, M.D.; Wilkins, K.D.; Holdrege, M.C.; Wilfahrt, P.; Collins, S.L.; Knapp, A.K.; Sala, O.E.; Dukes, J.S.; Phillips, R.P.; Yahdjian, L. Extreme drought impacts have been underestimated in grasslands and shrublands globally. Proc. Natl. Acad. Sci. USA 2024, 121, e2309881120. [Google Scholar] [CrossRef] [Scilit]
- Wang, G.; Jing, C.; Dong, P.; Qin, B.; Cheng, Y. Spatiotemporal dynamics of aboveground biomass and its influencing factors in Xinjiang’s desert grasslands. Sustainability 2022, 14, 14884. [Google Scholar] [CrossRef] [Scilit]
- Hou, H.; Yan, H.; Bai, X.; Zhang, Y.; Guo, Y.; Zhou, J.; Gao, S. A Synthetic Review of Feedbacks and Drivers of Shrub–Grass Interaction in the Process of Grassland Shrub Encroachment. Plants 2025, 14, 605. [Google Scholar] [CrossRef] [Scilit] [PubMed]
- Van Auken, O.W. Causes and consequences of woody plant encroachment into western North American grasslands. J. Environ. Manag. 2009, 90, 2931–2942. [Google Scholar] [CrossRef] [Scilit] [PubMed]
- Archer, S.R.; Andersen, E.M.; Predick, K.I.; Schwinning, S.; Steidl, R.J.; Woods, S.R. Woody plant encroachment: Causes and consequences. In Rangeland Systems: Processes, Management and Challenges; Springer: Berlin/Heidelberg, Germany, 2017; pp. 25–84. [Google Scholar]
- Eldridge, D.J.; Bowker, M.A.; Maestre, F.T.; Roger, E.; Reynolds, J.F.; Whitford, W.G. Impacts of shrub encroachment on ecosystem structure and functioning: Towards a global synthesis. Ecol. Lett. 2011, 14, 709–722. [Google Scholar] [CrossRef] [Scilit]
- Venter, Z.; Cramer, M.; Hawkins, H.-J. Drivers of woody plant encroachment over Africa. Nat. Commun. 2018, 9, 2272. [Google Scholar] [CrossRef] [Scilit]
- Shen, X.; Liu, Y.; Liu, B.; Zhang, J.; Wang, L.; Lu, X.; Jiang, M. Effect of shrub encroachment on land surface temperature in semi-arid areas of temperate regions of the Northern Hemisphere. Agric. For. Meteorol. 2022, 320, 108943. [Google Scholar] [CrossRef] [Scilit]
- Huang, J.; Yu, H.; Guan, X.; Wang, G.; Guo, R. Accelerated dryland expansion under climate change. Nat. Clim. Change 2016, 6, 166–171. [Google Scholar] [CrossRef] [Scilit]
- Gan, L.; Hu, X. Woody plant encroachment allocated more photosynthetic carbon belowground through soil pores in grasslands. Catena 2025, 258, 109303. [Google Scholar] [CrossRef] [Scilit]
- Stevens, N.; Lehmann, C.E.; Murphy, B.P.; Durigan, G. Savanna woody encroachment is widespread across three continents. Glob. Change Biol. 2017, 23, 235–244. [Google Scholar] [CrossRef] [Scilit]
- Deng, Y.; Li, X.; Shi, F.; Hu, X. Woody plant encroachment enhanced global vegetation greening and ecosystem water-use efficiency. Glob. Ecol. Biogeogr. 2021, 30, 2337–2353. [Google Scholar] [CrossRef] [Scilit]
- Forbes, B.C.; Fauria, M.M.; Zetterberg, P. Russian Arctic warming and ‘greening’ are closely tracked by tundra shrub willows. Glob. Change Biol. 2010, 16, 1542–1554. [Google Scholar] [CrossRef] [Scilit]
- Saha, M.; Scanlon, T.; D’odorico, P. Examining the linkage between shrub encroachment and recent greening in water-limited southern Africa. Ecosphere 2015, 6, 1–16. [Google Scholar] [CrossRef] [Scilit]
- Petrie, M.; Collins, S.; Swann, A.; Ford, P.; Litvak, M. Grassland to shrubland state transitions enhance carbon sequestration in the northern Chihuahuan Desert. Glob. Change Biol. 2015, 21, 1226–1235. [Google Scholar] [CrossRef] [Scilit] [PubMed]
- Zhu, J.; Wang, H.; Wang, H.; Pan, Y.; Bai, Y.; Li, W.; Zheng, S. Precipitation and nitrogen enrichment impact carbon exchange and stability: From antagonism to synergy with increasing shrub encroachment. Funct. Ecol. 2025, 39, 1001–1015. [Google Scholar] [CrossRef] [Scilit]
- Pacala, S.W.; Hurtt, G.C.; Baker, D.; Peylin, P.; Houghton, R.A.; Birdsey, R.A.; Heath, L.; Sundquist, E.T.; Stallard, R.; Ciais, P. Consistent land-and atmosphere-based US carbon sink estimates. Science 2001, 292, 2316–2320. [Google Scholar] [CrossRef] [Scilit]
- Ji-Shi, A.; Zhao, J.; Qu, G.; Wu, G. Divergent responses of above-and belowground ecosystem functioning to shrub encroachment in the Tibetan semi-arid alpine steppes. Land Degrad. Dev. 2024, 35, 3911–3920. [Google Scholar] [CrossRef] [Scilit]
- Ratajczak, Z.; Nippert, J.B.; Collins, S.L. Woody encroachment decreases diversity across North American grasslands and savannas. Ecology 2012, 93, 697–703. [Google Scholar] [CrossRef] [Scilit] [PubMed]
- Yin, Z.; Sun, X.; Cai, T.; Sun, X. Rare and abundant soil microbes coordinate C, N, P, and quorum sensing pathways to destabilize SOC in shrub-encroached marshes. Soil. Biol. Biochem. 2026, 215, 110086. [Google Scholar] [CrossRef] [Scilit]
- Zhang, T.; Zou, C.B.; Will, R.E.; Ferguson, B.; Yang, J. Maturation of encroaching juniper woodland elevates gross primary productivity and water use but reduces net ecosystem exchange relative to native tallgrass prairie. Agric. For. Meteorol. 2026, 378, 111009. [Google Scholar] [CrossRef] [Scilit]
- Ding, J.; Eldridge, D.J. Woody encroachment: Social–ecological impacts and sustainable management. Biol. Rev. 2024, 99, 1909–1926. [Google Scholar] [CrossRef] [Scilit]
- Ding, J.; Eldridge, D. The success of woody plant removal depends on encroachment stage and plant traits. Nat. Plants 2023, 9, 58–67. [Google Scholar] [CrossRef] [Scilit]
- Heijmans, M.M.; Magnússon, R.Í.; Lara, M.J.; Frost, G.V.; Myers-Smith, I.H.; van Huissteden, J.; Jorgenson, M.T.; Fedorov, A.N.; Epstein, H.E.; Lawrence, D.M. Tundra vegetation change and impacts on permafrost. Nat. Rev. Earth. Environ. 2022, 3, 68–84. [Google Scholar] [CrossRef] [Scilit]
- Maestre, F.T.; Bowker, M.A.; Puche, M.D.; Belén Hinojosa, M.; Martínez, I.; García-Palacios, P.; Castillo, A.P.; Soliveres, S.; Luzuriaga, A.L.; Sánchez, A.M. Shrub encroachment can reverse desertification in semi-arid Mediterranean grasslands. Ecol. Lett. 2009, 12, 930–941. [Google Scholar] [CrossRef] [Scilit] [PubMed]
- Hellesen, T.; Matikainen, L. An object-based approach for mapping shrub and tree cover on grassland habitats by use of LiDAR and CIR orthoimages. Remote Sens. 2013, 5, 558–583. [Google Scholar] [CrossRef] [Scilit]
- Chen, A.; Zhang, M.; Xu, C.; Xing, X.; Yang, D.; Xu, B.; Yang, X. Remote sensing assessment of shrub encroachment and its driving mechanisms in semi-arid grasslands. GISci. Remote Sens. 2025, 62, 2555073. [Google Scholar] [CrossRef] [Scilit]
- Madsen, B.; Treier, U.A.; Zlinszky, A.; Lucieer, A.; Normand, S. Detecting shrub encroachment in seminatural grasslands using UAS LiDAR. Ecol. Evol. 2020, 10, 4876–4902. [Google Scholar] [CrossRef] [Scilit] [PubMed]
- Yu, M.; Zheng, Y.; Zhu, Z. Warming and Rising Atmospheric CO2 Concentration Drive Global Woody Encroachment from 2001 to 2020. Ecosyst. Health Sustain. 2024, 10, 0272. [Google Scholar] [CrossRef] [Scilit]
- Zeng, X.; Dickinson, R.E.; Walker, A.; Shaikh, M.; DeFries, R.S.; Qi, J. Derivation and evaluation of global 1-km fractional vegetation cover data for land modeling. J. Appl. Meteorol. Clim. 2000, 39, 826–839. [Google Scholar] [CrossRef] [Scilit]
- Wang, G.; Jing, C.; Yuan, X.; Van de Voorde, T.; Shao, Y.; Dong, T.; Dong, P. Temperature and water limitation exhibit divergent controls on grassland greening across global aridity gradients. Int. J. Appl. Earth Obs. Geoinf. 2025, 143, 104806. [Google Scholar] [CrossRef] [Scilit]
- He, P.; Ma, X.; Meng, X.; Han, Z.; Liu, H.; Sun, Z. Spatiotemporal evolutionary and mechanism analysis of grassland GPP in China. Ecol. Indic. 2022, 143, 109323. [Google Scholar] [CrossRef] [Scilit]
- Eldridge, D.J.; Maestre, F.T.; Maltez-Mouro, S.; Bowker, M.A. A global database of shrub encroachment effects on ecosystem structure and functioning: Ecological Archives E093-234. Ecology 2012, 93, 2499. [Google Scholar] [CrossRef] [Scilit]
- García Criado, M.; Myers-Smith, I.H.; Bjorkman, A.D.; Lehmann, C.E.; Stevens, N. Woody plant encroachment intensifies under climate change across tundra and savanna biomes. Glob. Ecol. Biogeogr. 2020, 29, 925–943. [Google Scholar] [CrossRef] [Scilit]
- Scott, R.L.; Huxman, T.E.; Williams, D.G.; Goodrich, D.C. Ecohydrological impacts of woody-plant encroachment: Seasonal patterns of water and carbon dioxide exchange within a semiarid riparian environment. Glob. Change Biol. 2006, 12, 311–324. [Google Scholar] [CrossRef] [Scilit]
- Sun, H.; Wang, W.J.; Liu, Z.; Ballantyne, A.P.; Yu, K.; Bao, S.G.; Ba, S.; Wang, L.; Cong, Y.; He, H.S. Enhanced productivity and evapotranspiration dominated by woody plant encroachment-induced vegetation greening in boreal wetland ecosystems. GIScience Remote Sens. 2024, 61, 2391144. [Google Scholar] [CrossRef] [Scilit]
- Zhang, Y.; Yu, G.; Yang, J.; Wimberly, M.C.; Zhang, X.; Tao, J.; Jiang, Y.; Zhu, J. Climate-driven global changes in carbon use efficiency. Glob. Ecol. Biogeogr. 2014, 23, 144–155. [Google Scholar] [CrossRef] [Scilit]
- Hu, Z.; Piao, S.; Knapp, A.K.; Wang, X.; Peng, S.; Yuan, W.; Running, S.; Mao, J.; Shi, X.; Ciais, P. Decoupling of greenness and gross primary productivity as aridity decreases. Remote Sens. Environ. 2022, 279, 113120. [Google Scholar] [CrossRef] [Scilit]
- Zheng, L.; Lu, J.; Chen, X. Drought offsets the vegetation greenness-induced gross primary productivity from 1982 to 2018 in China. J. Hydrol. 2024, 632, 130881. [Google Scholar] [CrossRef] [Scilit]
- Wang, G.; Zhang, H.; Shao, Y.; Jing, C. Shifts in the Decoupling and Driving Mechanisms of Grassland Greening and Water Availability in the Northern Hemisphere. Remote Sens. 2026, 18, 829. [Google Scholar] [CrossRef] [Scilit]
- Wang, S.; Fu, B.; Wei, F.; Piao, S.; Maestre, F.T.; Wang, L.; Jiao, W.; Liu, Y.; Li, Y.; Li, C. Drylands contribute disproportionately to observed global productivity increases. Sci. Bull. 2023, 68, 224–232. [Google Scholar] [CrossRef] [Scilit]
- Liu, Z.; Chen, Z.; Yu, G.; Zhang, W.; Zhang, T.; Han, L. The role of climate, vegetation, and soil factors on carbon fluxes in Chinese drylands. Front. Plant Sci. 2023, 14, 1060066. [Google Scholar] [CrossRef] [Scilit]
- Friedl, M.A.; Sulla-Menashe, D.; Tan, B.; Schneider, A.; Ramankutty, N.; Sibley, A.; Huang, X. MODIS Collection 5 global land cover: Algorithm refinements and characterization of new datasets. Remote Sens. Environ. 2010, 114, 168–182. [Google Scholar] [CrossRef] [Scilit]
- Soubry, I.; Guo, X. Quantifying woody plant encroachment in grasslands: A review on remote sensing approaches. Can. J. Remote Sens. 2022, 48, 337–378. [Google Scholar] [CrossRef] [Scilit]
- Aranda, M.J.; Tognetti, P.M.; Mochi, L.S.; Mazía, N. Intensive rotational grazing in pastures reduces the early establishment of an invasive tree species. Biol. Invasions 2023, 25, 3137–3150. [Google Scholar] [CrossRef] [Scilit]
- Alfaro-Reyna, T.; Aguirre-Gutierrez, C.A.; de la Cruz Domínguez, J.C.; Luna Luna, M.; Flores-Rentería, D.; Delgado-Balbuena, J. Prescribed Burns Reduce Early-Stage Shrub Encroachment in Semi-arid Grassland. Fire 2025, 8, 71. [Google Scholar] [CrossRef] [Scilit]
- Sankaran, M.; Hanan, N.P.; Scholes, R.J.; Ratnam, J.; Augustine, D.J.; Cade, B.S.; Gignoux, J.; Higgins, S.I.; Le Roux, X.; Ludwig, F. Determinants of woody cover in African savannas. Nature 2005, 438, 846–849. [Google Scholar] [CrossRef] [Scilit] [PubMed]

Disclaimer/Publisher’s Note: The statements, opinions and data contained in all publications are solely those of the individual author(s) and contributor(s) and not of MDPI and/or the editor(s). MDPI and/or the editor(s) disclaim responsibility for any injury to people or property resulting from any ideas, methods, instructions or products referred to in the content. |
© 2026 by the authors. Licensee MDPI, Basel, Switzerland. This article is an open access article distributed under the terms and conditions of the Creative Commons Attribution (CC BY) license.