


Highlights
What are the main findings?
- The hazards of glacier debris flow in the Badswat Basin exhibit a recurring pattern, and this research is the first to examine the whole sequence of these events systematically.
- Using multi-source, multi-resolution remote sensing imagery, we conducted a thorough disaster investigation that involved reconstructing evolution processes, measuring impacts, and pinpointing drivers. The initially dammed lake in 2015 gradually expanded because of subsequent events.
What are the implications of the main findings?
- High temperatures accelerating glacier melting are the primary cause of debris flow hazards, while topography influences environmental vulnerability and glacier stability.
- Using multi-resolution remote sensing offers a flexible approach for comprehensive monitoring and assessing glacier hazards in high mountain regions with limited data, especially in the context of climate change.
Abstract
Glacier mass loss driven by climate change has increased glacier-related hazards, including glacier debris flows, and poses growing threats to downstream communities. The Badswat Basin in northern Karakoram has experienced repeated glacier debris flows in recent years but lacks systematic disaster analysis and detailed monitoring. This study reconstructs and analyzes three glacier debris flows from 2015, 2018, and 2021 using multi-source remote sensing data and high-resolution DEMs. Results show that three events were triggered by tributary glaciers, with the 2015 event creating the initial dammed lake, and the 2018 and 2021 events further enlarging it (up to 0.72 km2 and 40 million m3). These events transported glacier mass downstream, expanded alluvial fans, and caused net glacier erosion. The 2018 event was the most destructive, damaging 75 buildings, flooding 0.28 km2 of farmland, and destroying 4.95 km of roads. Analysis suggests that topography influences environmental vulnerability and glacier stability. High temperatures, which accelerate glacier melting, are the primary drivers of the hazard. The bidirectional link between glacier movement and debris flows is a key factor in triggering or intensifying events. Under future climate scenarios, both tributary and main glaciers are expected to continue losing mass, further increasing downstream risks. This study details the evolutionary process of recurring periodic debris flows in the Badswat Basin, providing scientific insights into glacier–landform interactions and hazard management in high-mountain socio-ecological systems.
1. Introduction
The rising temperatures have caused ongoing and irreversible loss of glacial mass in mountainous regions [1], fundamentally altering the stability of glacial systems and significantly increasing the risk of glacier-related hazards [2]. These hazards, primarily including glacier floods, debris flows, and glacial lake outburst floods (GLOFs), have become more frequent and severe in recent decades [3,4]. Glacial floods, driven by increased meltwater from retreating glaciers [5], often occur in conjunction with heavy rainfall, worsening downstream flooding impacts [6]. Meanwhile, glacier debris flows, which result from instability in glacial sediments and moraines as ice melts, pose serious threats to valley communities and infrastructure [7]. Currently, the gradual imbalance in glacier mass in the Karakoram [8] continues to heighten the risk of these hazards, posing long-term dangers to downstream societies and ecosystems [9,10].
The Karakoram is one of the most glacier-covered regions on Earth [11]. Unlike other areas where melting accelerates, the Karakoram glaciers exhibit minimal changes in mass balance, a phenomenon known as the “Karakoram anomaly” [8,12,13,14,15,16,17]. Despite this, the region remains a global hotspot for high-magnitude glacier-related hazards because of localized glacier instability [18]. Recently, multiple glaciers in the Badswat Glacier basin have shown unusually rapid movement. For example, Chilinji Glacier experienced a surge that ultimately blocked the river valley [3]. In this context, the Badswat catchment has experienced repeated, catastrophic glacial debris flows in recent years [19,20,21]. The key event occurred on 17 July 2018, flooding approximately 2 km2, blocking the river, and resulting in substantial socio-economic damage [19]. Although research by Shangguan et al. [19] and Hassan et al. [20] successfully reconstructed the 2018 incident, highlighting the cascade sequence and effects of rising temperatures and glacier flow. These studies primarily concentrated on this specific event.
Current disaster analysis frameworks mainly rely on single-case studies or GLOF-focused hydrological models, which lack the capability for systematic, multi-event analysis in complex glacier-debris flow systems. They often do not account for the long-term, cumulative impacts of successive disasters or the diverse responses of different glacier components (such as main versus tributary) within a single catchment. Despite the knowledge gained from the 2018 event, a comparable large debris-flow event occurred again in 2021; however, a detailed analysis of this most recent event is still lacking. As a result, critical insights into multi-event links, the measurable geomorphic changes across the disaster series (2015, 2018, 2021), and the interconnected physical processes behind these hazards remain to be developed.
This study combines multi-source satellite data to analyze glacier debris flow events in the Badswat catchment for 2015, 2018, and 2021. The research focuses on: (1) identifying the timing and sequence of major disaster events using remote sensing and multiple datasets; (2) measuring geomorphological changes caused by the disasters, including the development of downstream landslide-dammed lakes, glacier erosion features, surface elevation shifts, and sediment redistribution; and (3) predicting the future evolution of the glacier system and its possible effects on downstream areas. The results aim to improve understanding of how glacier debris flows shape geomorphology and to support studies on the dynamics of disaster chains and risk reduction in high-altitude regions.
2. Study Area
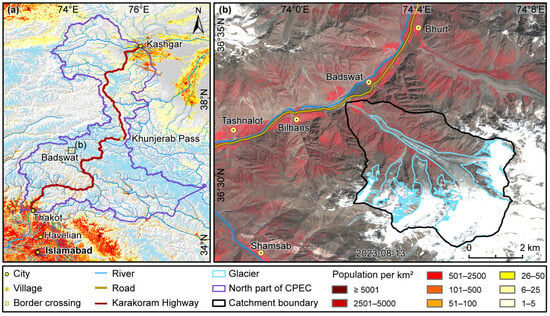
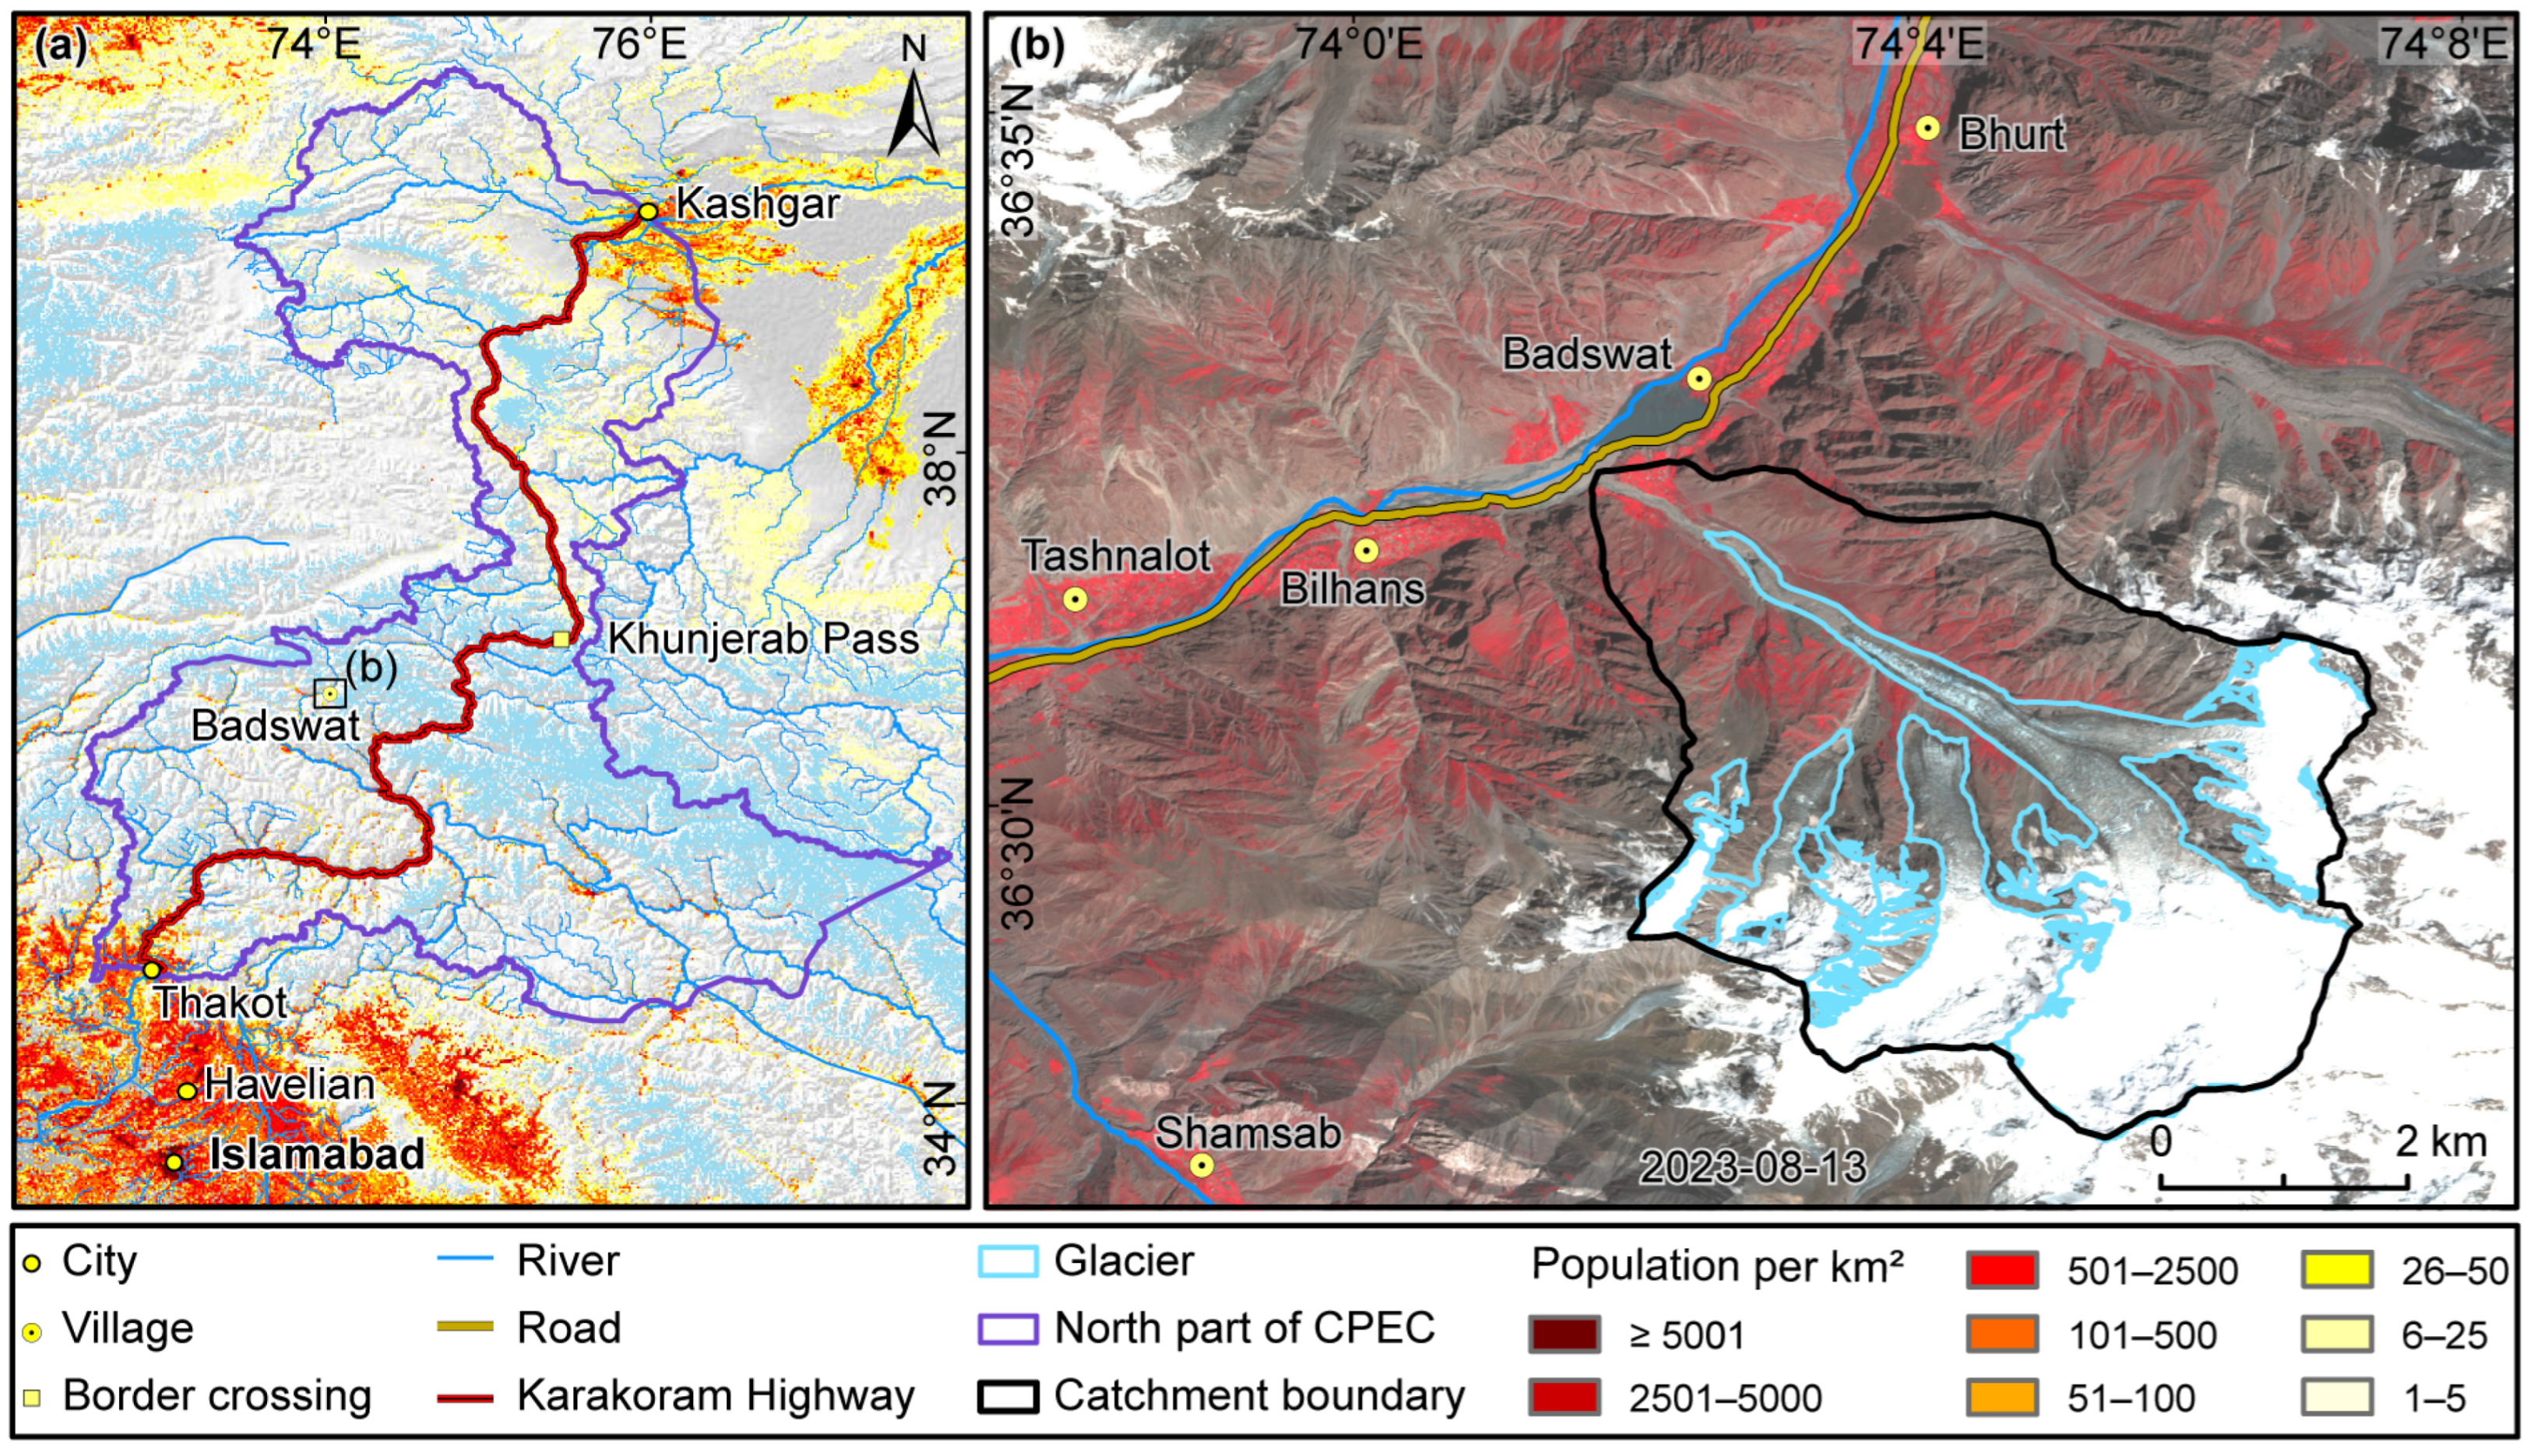
This study focuses on the Badswat Basin and its downstream areas (Figure 1). Situated near the Karakoram Highway, an essential part of the China-Pakistan Economic Corridor (CPEC) [22], the basin extends roughly between 73°8′E and 74°8′E, and 35°33′N and 36°35′N. The area encompasses the Badswat Glacier, which covers approximately 27.94 km2. The main glacier spans 18.03 km2, with an average elevation of 5327 m and a slope of 24.9°. A tributary glacier, about 3.56 km2 in size, features rugged terrain and an average slope of 31.3°. Downstream, several settlements are situated along the valley, with Badswat Village, primarily reliant on agriculture [21], being the largest. An upstream river and road traverse the valley, both of which are vulnerable to hazards posed by glaciers upstream [19]. The villages, including Badswat Village, generally have underdeveloped economies and are highly susceptible to infrastructure issues. Consequently, even minor to moderate events, such as glacier debris flows, can cause significant social and economic impacts, underscoring the importance of effective disaster monitoring and risk assessment in this region [23].
Figure 1.
(a) Location of the study area in northern CPEC related to glacier distribution [24] and population [25]; (b) distribution of villages around the Badswat basin.
3. Data and Methods
3.1. Data
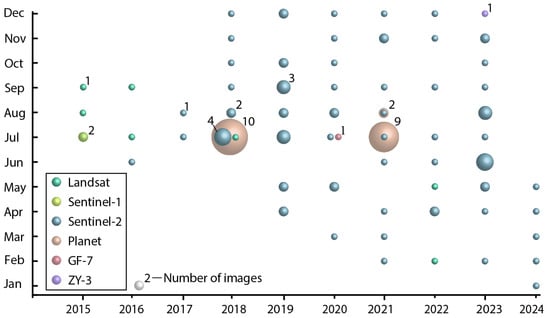
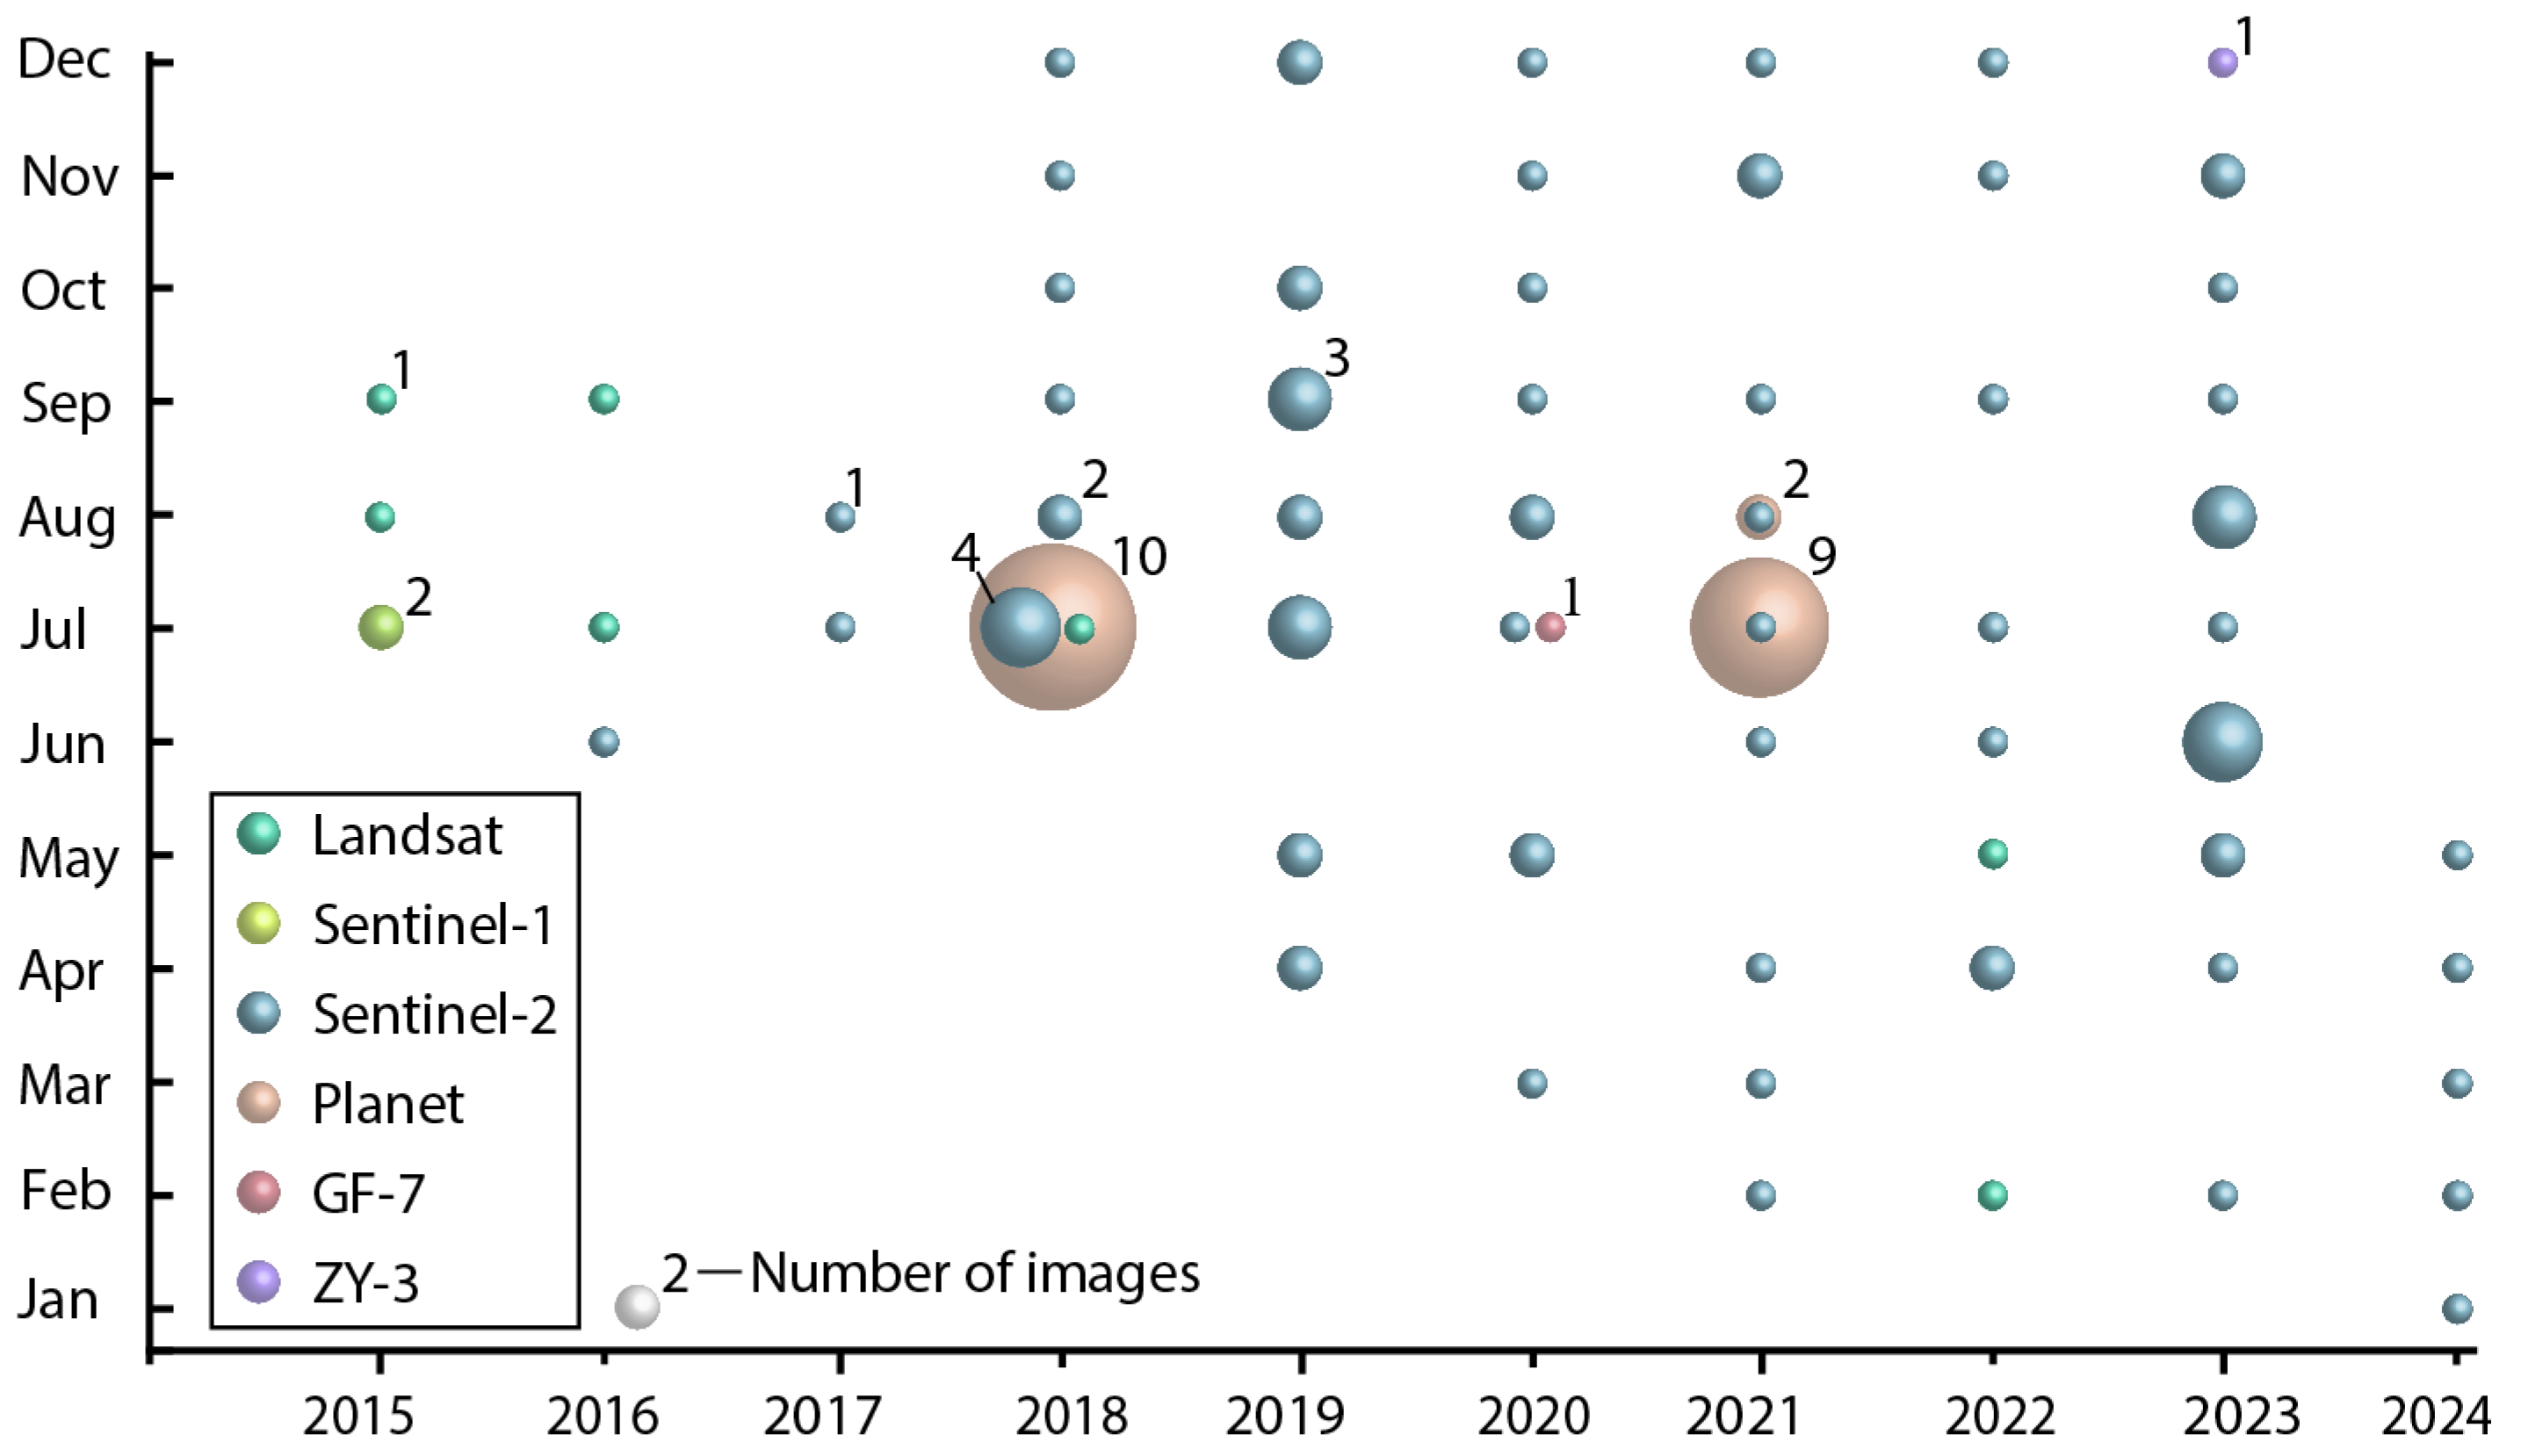
This study utilizes multiple sources of data for systematic disaster analysis [26], including satellite remote sensing imagery, DEMs [27], climate reanalysis data [28], and glacier projected data [24] (Figure 2).
Figure 2.
Acquisition of years and months of selected images, including Landsat and Sentinel-2, for long-term lake extent monitoring, Planet satellite imagery (Planet Labs) for detailed hazard surveys, and GF-7 and ZY-3 imagery for DEM creation. The size of the bubbles shows the number of high-quality images available.
For long-term monitoring and event-specific analysis of the dammed lake’s evolution, we combined various optical and SAR images with different spatial resolutions. Specifically, we used 7 scenes from Landsat 8 and 9 OLI imagery, obtained from the USGS (https://earthexplorer.usgs.gov/ (accessed on 6 April 2023)), and 77 scenes from Sentinel-2 optical imagery, accessed via the Copernicus Open Access Hub (https://browser.dataspace.copernicus.eu/ (accessed on 20 June 2024)), which served as the basis for our long-term lake extent inventory. To monitor critical events, we acquired 21 high-resolution PlanetScope images [29] that provided detailed observations of the areas immediately surrounding the 2018 and 2021 disaster events. Additionally, two Sentinel-1 SAR imagery scenes [30] served as reference data, and nine high-resolution images from Google Earth Pro (version 7.3.6) [22] captured before and after these events were used for land use classification in the study area.
GF-7 and ZY-3 images, ICESat-2 laser altimetry data, and the ALOS DEM with a 12.5 m spatial resolution are used to estimate surface elevation changes after the disaster. Specifically, GF-7 imagery from 6 July 2020 and ZY-3 imagery from 29 December 2023 generate digital surface models (DSMs), while ICESat-2 data support DSM calibration and accuracy checks. GF-7 data are available from the China High-Resolution Earth Observation System (CHEOS) official website [31]; ZY-3 data from the China Resources Satellite Application Center (CRESDA) [32]; ICESat-2 data from the NASA National Snow and Ice Data Center (NSIDC) [33]; and SRTM DEM from the USGS Earth Explorer platform [34].
To analyze the climatic role in those disaster events, we used ERA5 climate reanalysis data from the European Centre for Medium-Range Weather Forecasts (ECMWF) [35]. This dataset has a spatial resolution of approximately 0.25° × 0.25° with hourly data [36], which we utilized to evaluate temperature and precipitation trends throughout the entire study period. Additionally, the ITS-LIVE dataset, with a 120 m resolution [37], provided a detailed time series of glacier velocity changes to examine the flow dynamics affecting slope stability. Finally, to evaluate future hazard risks, we utilized PyGEM–OGGM projections of glacier area and volume from 2000 to 2100 under the SSP1-2.6, SSP2-4.5, and SSP5-8.5 climate scenarios [38].
3.2. Methods
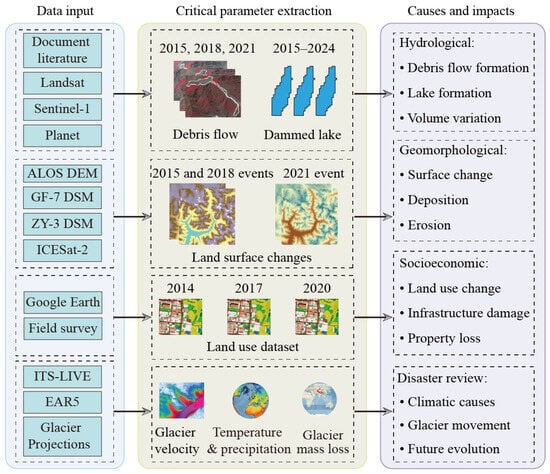
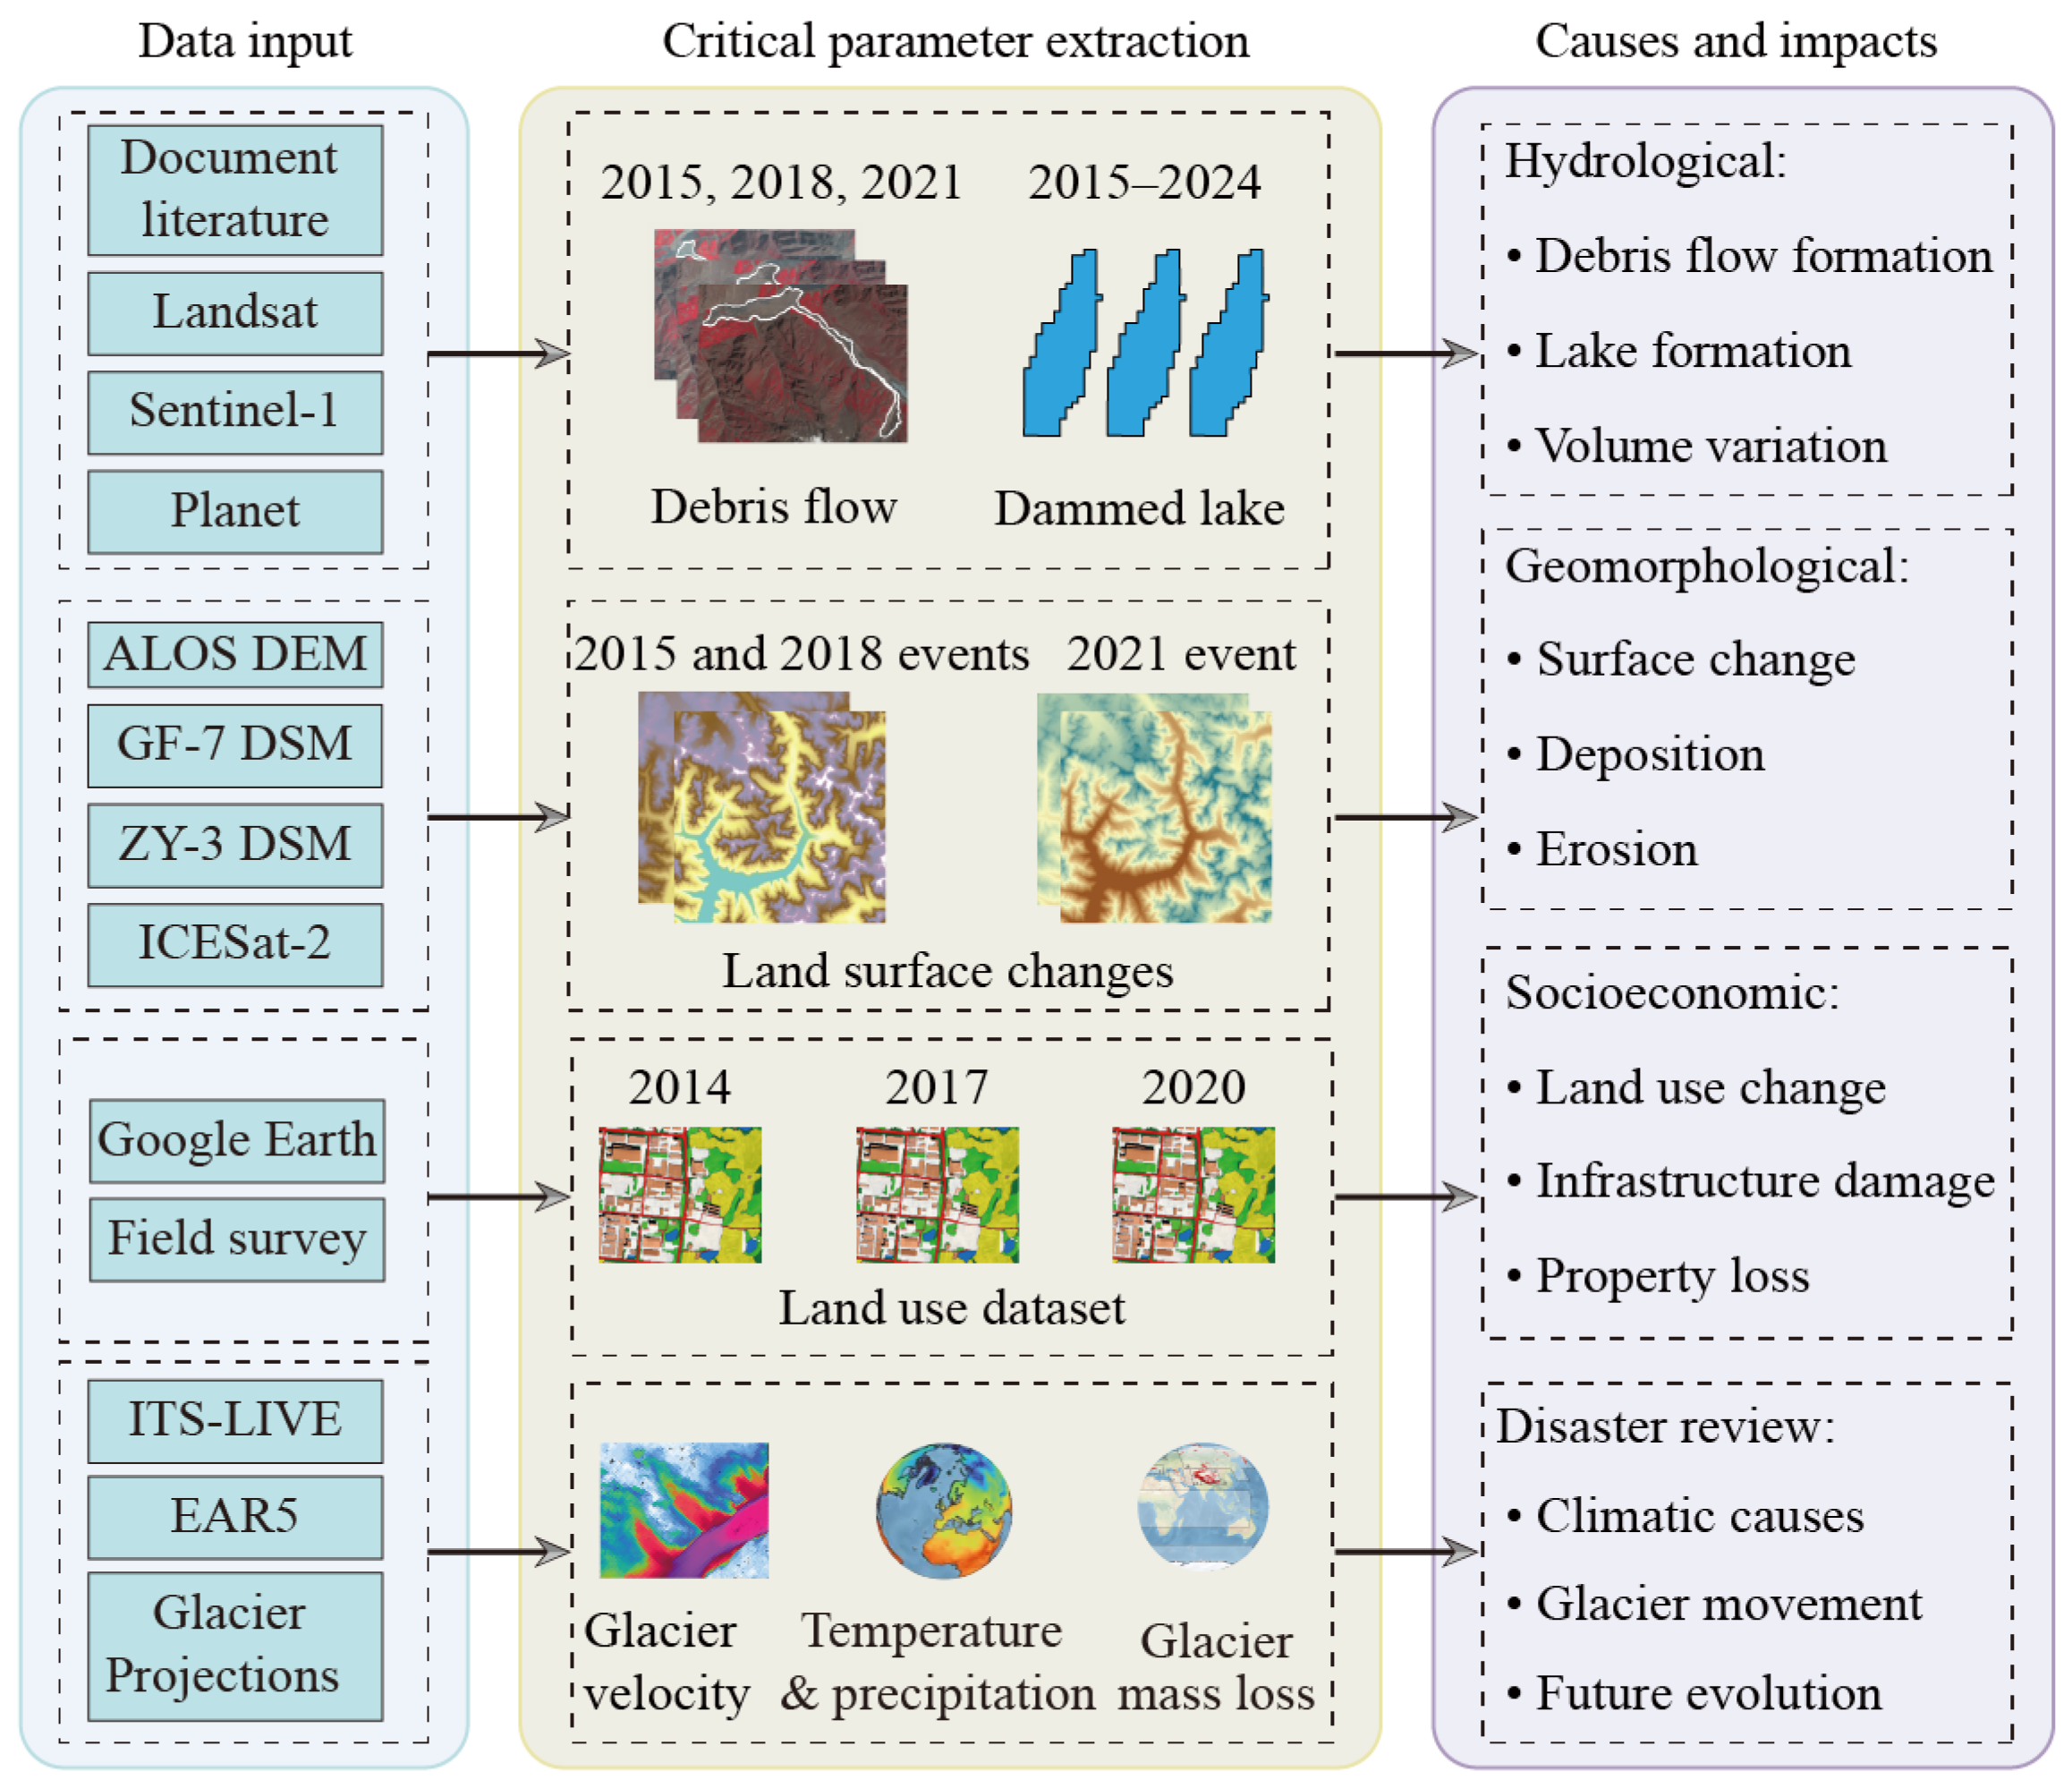
This study develops a systematic framework for studying and analyzing glacial debris-flow disasters in the Badswat region, combining multi-source remote sensing imagery with topographic data to examine the disaster chain and its driving factors (Figure 3). This framework involves the following stages: (1) Data input, (2) Critical parameters extraction, and (3) Causes and impacts. Specific processing includes mapping debris flows and dammed lakes, calculating land-surface changes and water volumes in dammed lakes, mapping land use in the affected area, and processing meteorological data.
Figure 3.
Workflow of this study.
3.2.1. Mapping Dammed Lake
Mapping dammed lakes aimed to create a foundational dataset to analyze their changes. A semi-automated tool [26,32,39] was used to delineate glacial lake boundaries from Landsat, Sentinel-2, and Planet images. This interactive tool enabled users to select a region and set an NDWI threshold to extract water bodies accurately. The process includes: (1) choosing the region of interest (ROI) and calculating the Normalized Difference Water Index (NDWI) within it [40]; (2) determining the best NDWI threshold by combining spectral and topographic data; (3) converting raster lake outlines into vector formats to define lake boundaries for each image. The NDWI calculation is as follows:
where refers to the green spectral band and refers to the near-infrared (NIR) band.
3.2.2. Calculating Land Surface Change and Water Volume in a Dammed Lake
The calibrated DSMs and estimated water volumes guided the assessment of the geomorphic impacts of the glacier debris flow. To verify the accuracy of the elevation data, photon-counting laser altimetry [41] from ICESat-2 (2018–2023, with <5 cm vertical precision) was used to validate DSMs [33] from GF-7, ZY-3, and the 12.5 m ALOS DEM (2000–2001 SRTM data) across the study area. Before validation, ICESat-2 data were preprocessed by removing points over glacier surfaces, slopes greater than 10°, and outliers to ensure consistency with the DSMs. Elevation accuracy was evaluated at 62 points using RMSE and MAE [42]. The GF-7 DSM (6 July 2020) and ZY-3 DSM (29 December 2023) had MAEs of 6.27 m and 5.98 m, respectively, with standard deviations of 2.98 m and 4.16 m, meeting the accuracy standards for further analysis.
After accuracy validation, multi-temporal elevation difference analyses [43] were conducted to assess topographical changes associated with various debris-flow events. The ALOS DEM and GF-7 DSM (as of 6 July 2020) were compared to identify land surface changes after the 2018 event. The GF-7 DSM (as of 6 July 2020) and ZY-3 DSM (as of 29 December 2023) were used to assess changes following the 2021 event. Each difference in DEMs showed spatial patterns of erosion and deposition, with negative elevation changes indicating erosion and positive ones signifying sediment build-up. Volume changes [44] were calculated by adding elevation differences within critical hazard zones, yielding direct estimates of material displacement and the severity of geomorphic impact.
Additionally, to determine the volume of water in glacial lakes, the lake boundaries obtained from satellite images were integrated with the 12.5 m ALOS DEM. The Surface Volume tool [45] in ArcGIS (version 10.6) 3D Analyst Toolbox was employed to calculate the water volume beneath each designated lake surface.
3.2.3. Mapping Land Use in the Affected Area
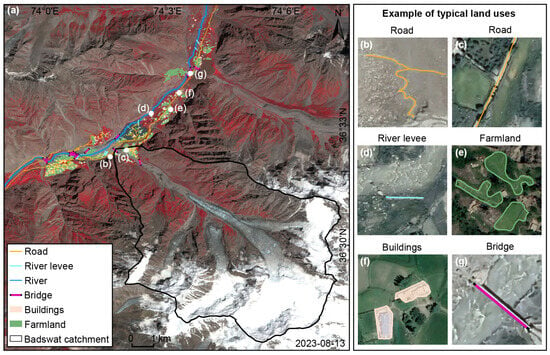
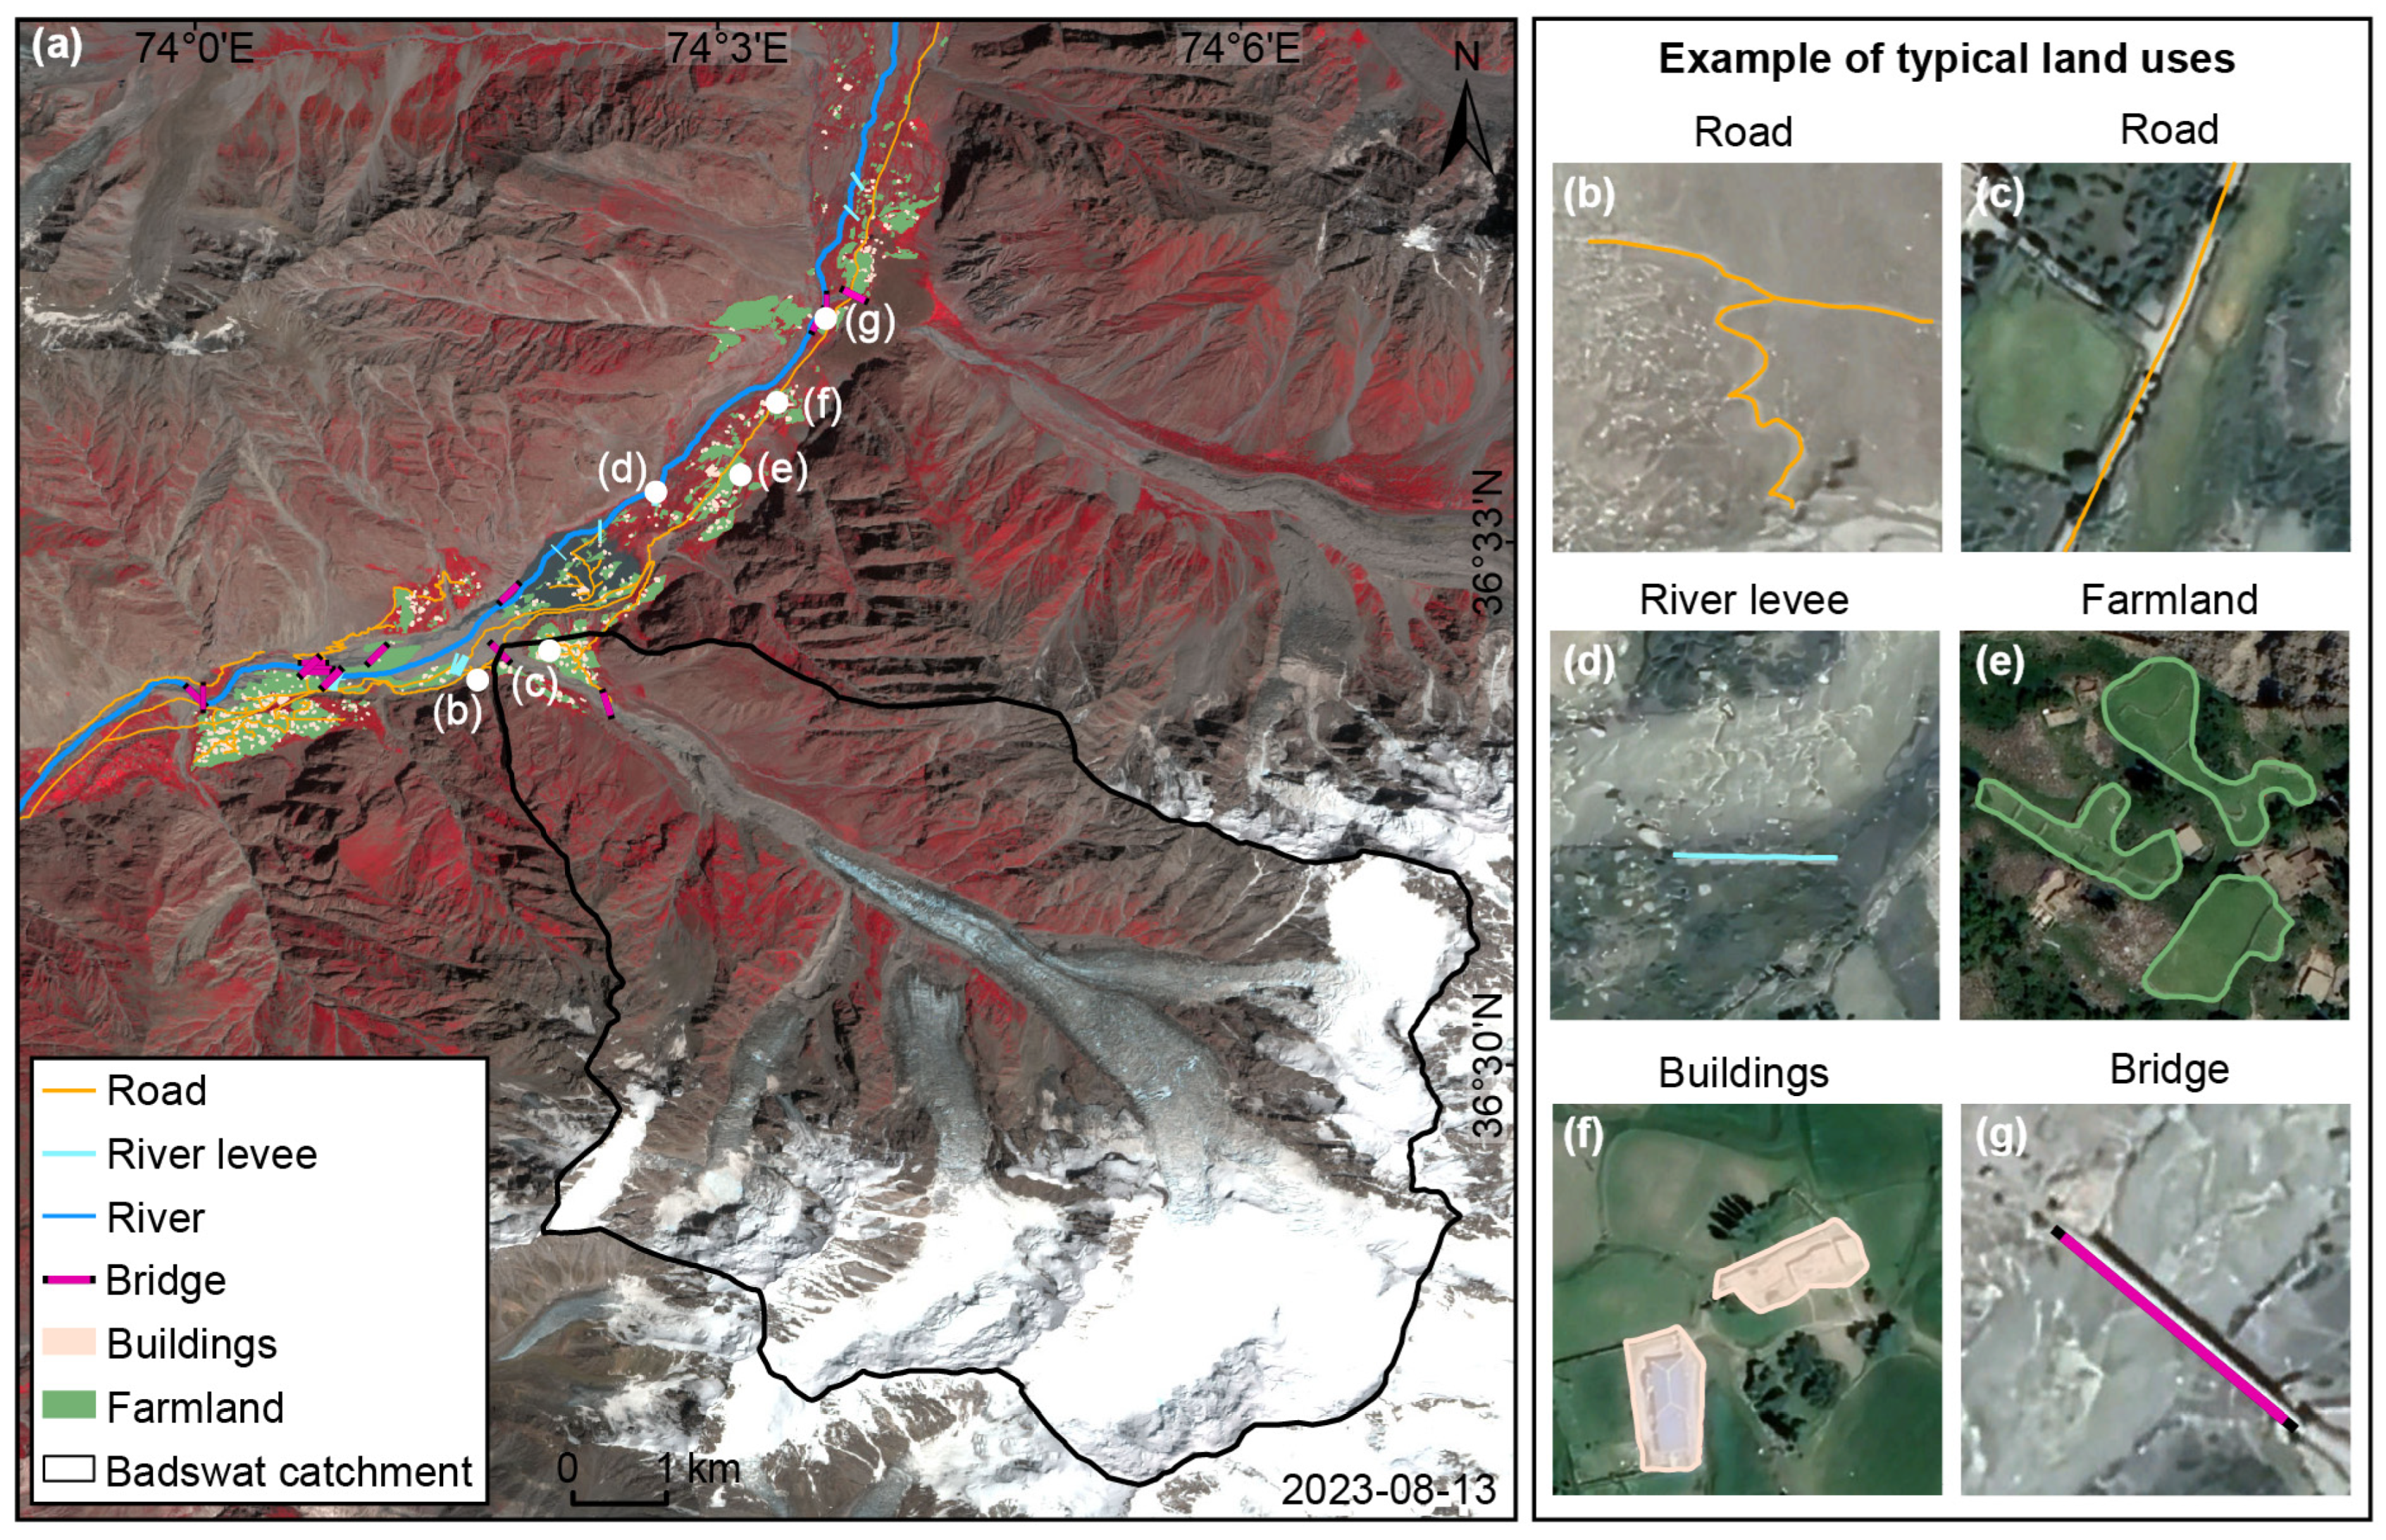
To overcome limitations in high-precision land use data and Planet imagery, particularly in detecting small, single-unit houses in economically disadvantaged regions, we used high-resolution Google Earth Pro imagery for visual interpretation. This approach provides detailed spatial resolution, extensive temporal coverage, and easy accessibility, enabling the identification of multi-temporal land use features [46], such as roads, river levees, farmland, buildings, and bridges (Figure 4), according to specific standards. This method depends on visual interpretation, supplemented by local field surveys and validation by multiple experts in relevant fields, effectively capturing the key features of the disaster-affected area [47]. The resulting land use dataset is crucial for examining the socioeconomic impacts of hazards such as GLOFs [48], and incorporating official reports and field investigations would enhance the transparency of this mapping method.
Figure 4.
Remote sensing interpretation of primary land use types. (a) Distribution of land use types in the study area before the disaster: Road (b,c), river levee (d), farmland (e), buildings (f), and bridge (g) on Google Earth Pro.
3.2.4. Processing of Meteorological Data
This study used the ERA5 reanalysis dataset to examine long-term climate change and its impact on glacial disasters in the region, focusing on 2 m temperature and precipitation data [35]. The original hourly precipitation and daily temperature data were combined and converted from UTC to local time to ensure consistency [49]. To reduce the influence of downstream valley climates, a glacier distribution mask [50] was applied, isolating meteorological data from glaciated areas and retaining only relevant data points within those regions. This method provides an accurate representation of high-altitude climate conditions.
4. Results
4.1. Timing of Glacier Debris Flow Events in Badswat
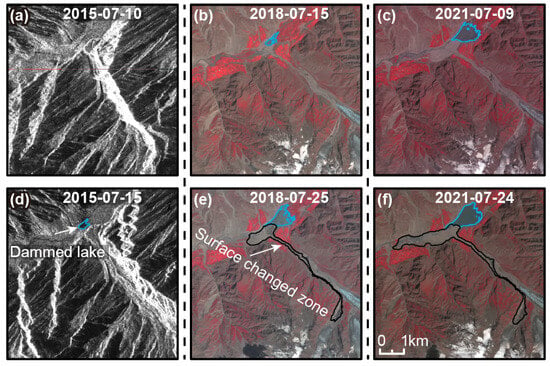
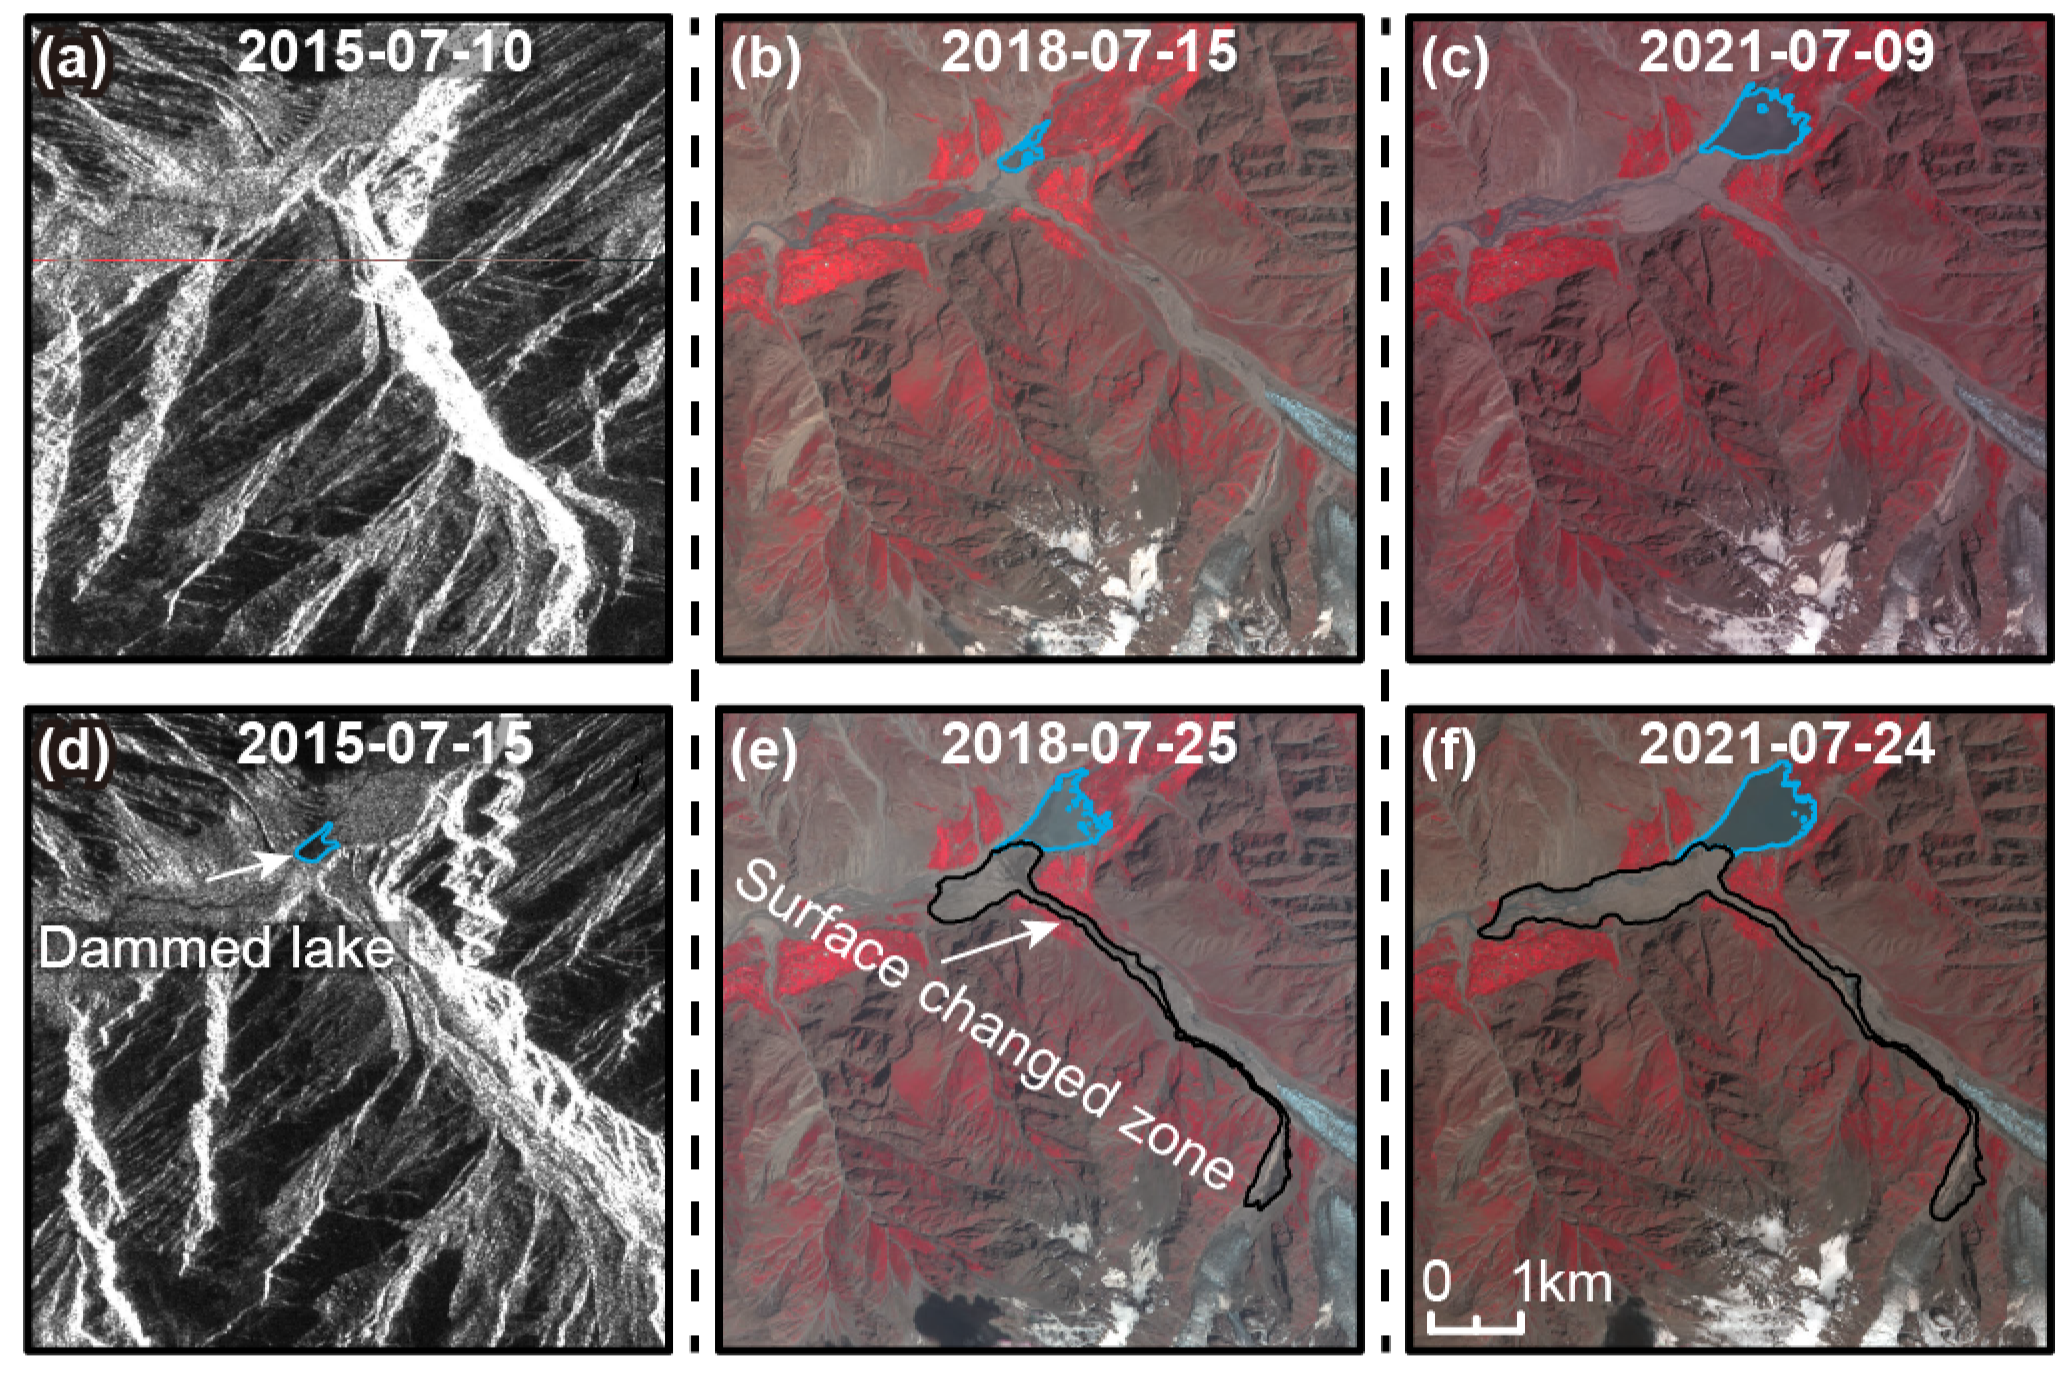
Satellite imagery confirms that glacier debris flows occurred in the Badswat Basin in 2015, 2018, and 2021, all in July and recurring every 3 years (Figure 5). For the first time, this study identified the specific month of the 2015 disaster and narrowed the occurrence to the 10th–15th of that month, using Sentinel-1 imagery. Cross-validation with government bulletins (Gilgit Baltistan Disaster Management Authority (GBDMA), Gilgit, Pakistan) and media reports further pinpoints the timing of the events: the 2018 debris flow occurred at 7:00 a.m. on 17 July, the 2021 debris flow took place between 8:30 p.m. on 16 July and 8:00 a.m. on 17 July, while the 2015 debris flow can only be dated to the period between 10 and 15 July. Systematic analysis further reveals that these events resulted in a continuous increase in the storage capacity of the dammed lake and a progressive expansion of the affected disaster area.
Figure 5.
Comparison of Sentinel-1 images before (a) and after (d) disasters in 2015, along with an overview of Sentinel-2 images taken before (b,c) and after (e,f) the disasters in 2018 and 2021, respectively.
4.1.1. Glacier Debris Flow in 2015
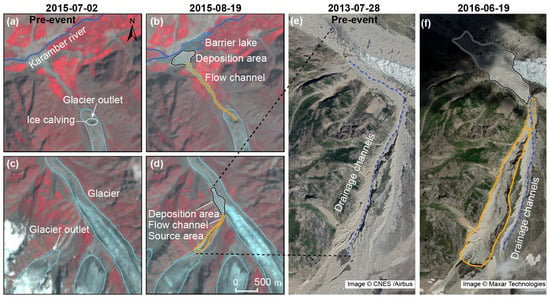
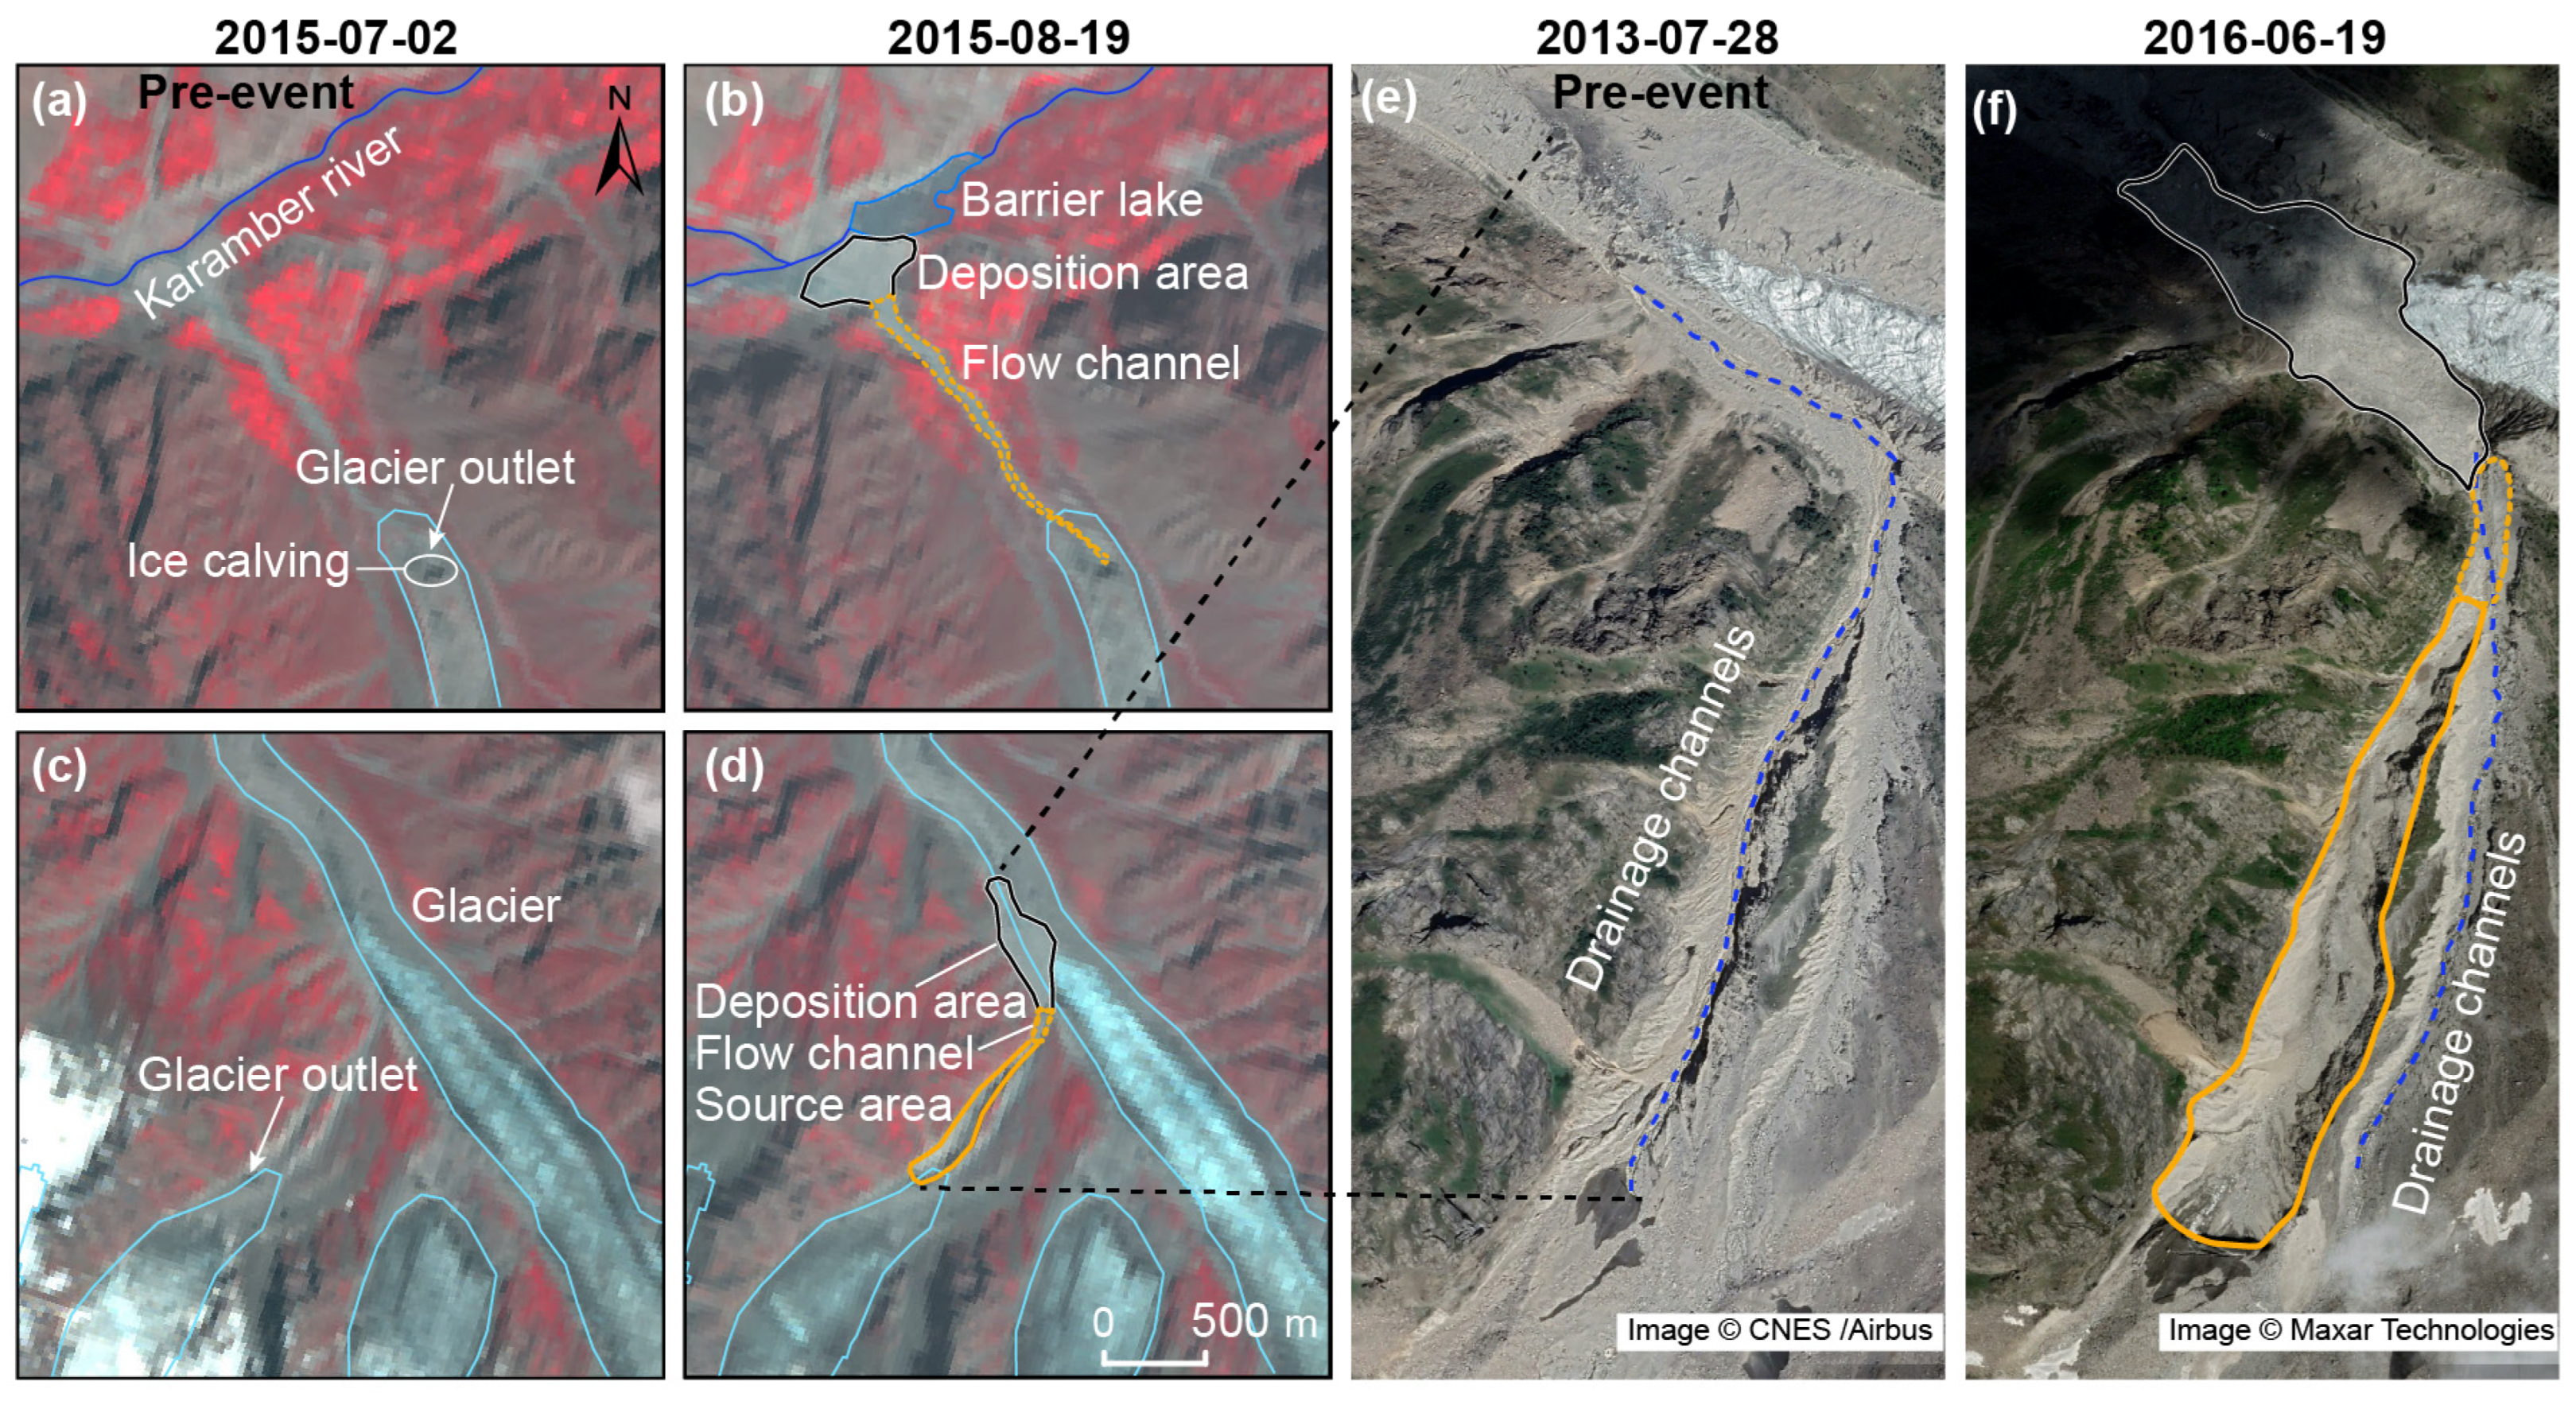
Between 10 and 15 August 2015, the Badswat Basin experienced a relatively small-magnitude yet mechanistically complex cascade debris-flow event (Figure 6). Triggered by a limited-volume surge of the tributary glacier (G074051E36491N [24]), the failure eroded the left-lateral moraine and partially discharged onto the surface of the main glacier (G074089E36504N [24]). However, the interaction between the two flows was limited, which constrained the event’s final reach and impact. High-resolution imagery taken after the event shows that the tributary’s subglacial drainage system was reconfigured: the existing left-bank outlet was abandoned, and discharge moved to a newly incised right-bank outlet (Figure 6e,f). Remobilized sediment built up into an alluvial fan covering roughly 0.13 km2, temporarily blocking the Karamber River and creating a dammed lake (Figure 6a,b). This event demonstrates how limited interaction between the tributary and main glaciers can limit cascade amplification, which was not observed during the more destructive events of 2018 and 2021.
Figure 6.
Comparison of Landsat images taken before (a,c) and after (b,d) the disaster in 2015, alongside Google Earth Pro images in 2013 (e) and in 2016 (f), respectively.
4.1.2. Glacier Debris Flow in 2018
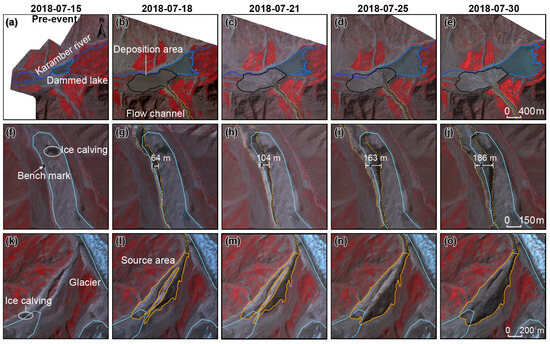
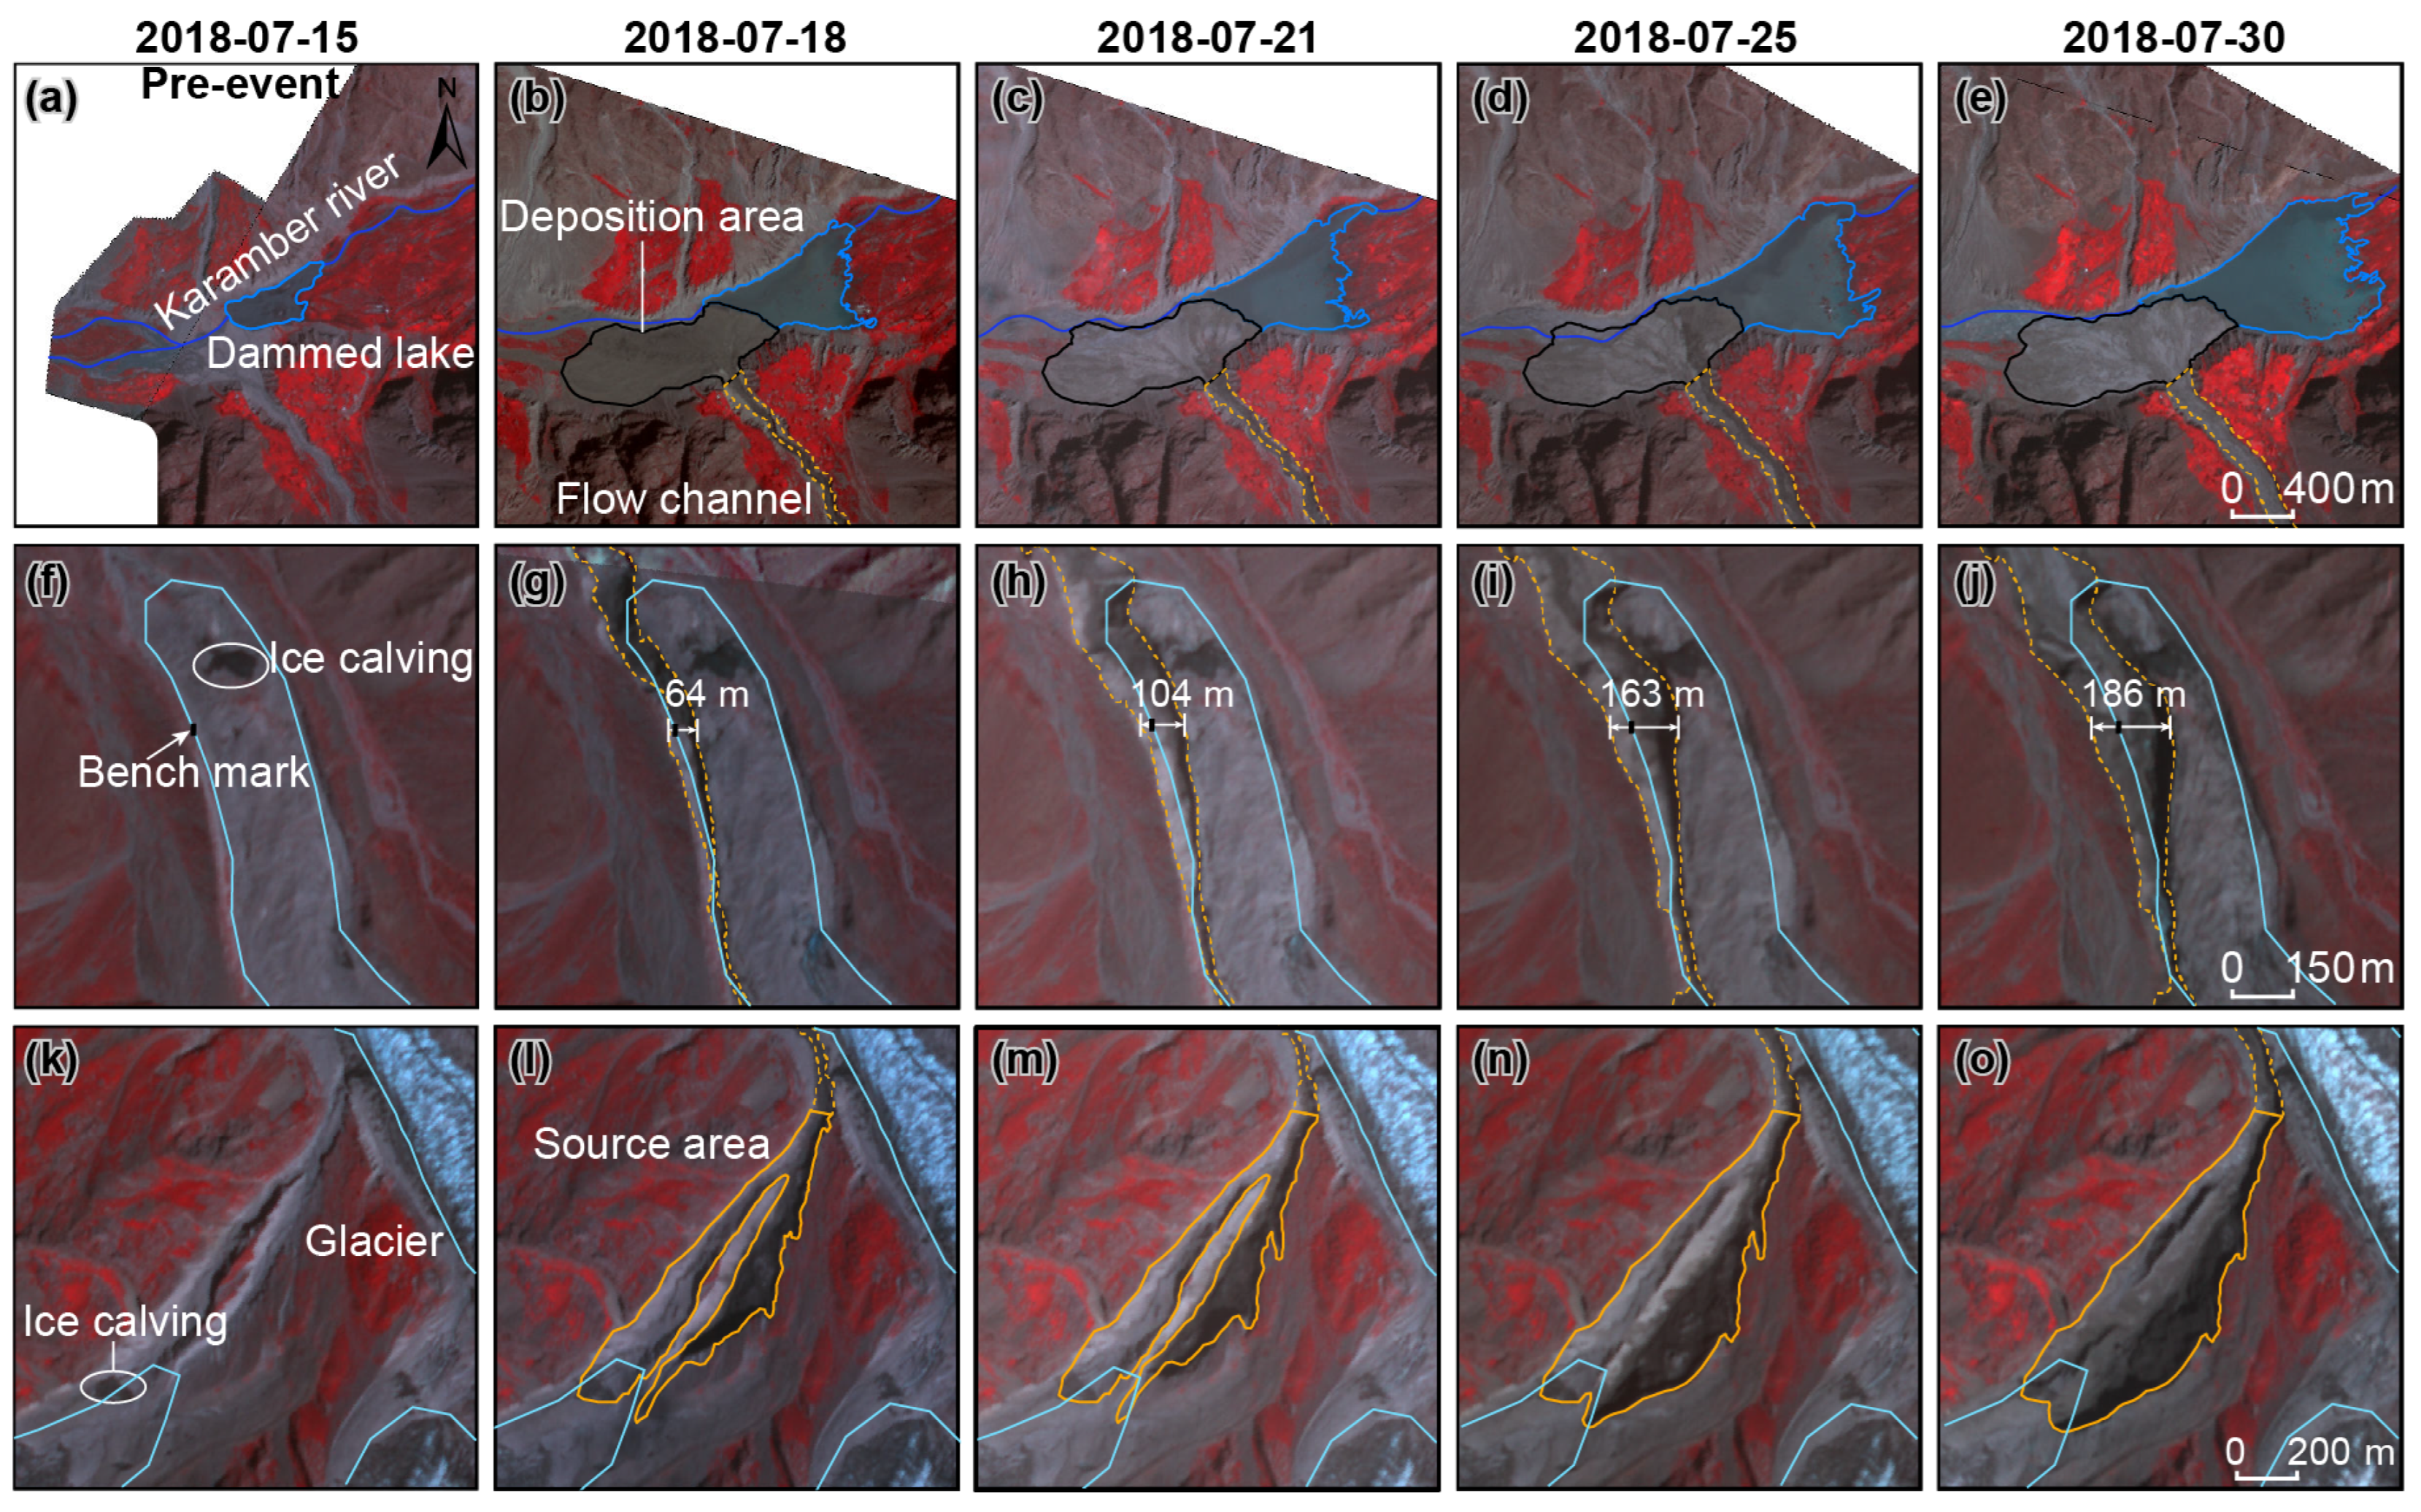
On 17 July 2018, a typical cascade debris-flow disaster occurred in the Badswat Basin. The event was initially triggered by runoff erosion from a tributary glacier, which led to an ice avalanche and the formation of the primary debris flow. As it moved downstream, the debris flow continually eroded the valley surface, affecting an area of about 1.05 km2 while carrying large amounts of ice, snow, and moraine material, thus increasing its volume and energy. At the basin outlet, substantial sediment deposition formed an alluvial fan of roughly 0.61 km2 and contributed to the expansion of a dammed lake. Subsequently, due to continuous rainfall from 21 to 25 July, debris flows continued to form, further enlarging the erosion zone. During this period, the collapse width of the main glacier increased rapidly from 64 m to 186 m (Figure 7g–i), thickening the alluvial fan and promoting additional lake expansion (Figure 7b–e). Although the tributary glacier stabilized after 25 July, the main glacier continued to collapse under sustained high temperatures, eventually reaching a collapse width of 186 m (Figure 7g–j).
Figure 7.
Cascading evolution of the July 2018 Badswat debris-flow event, highlighting dammed lake expansion, ice calving, and source area growth from 15 to 30 July. Panels (a–e) show the debris-flow deposition zone; panels (f–j) show the erosion zone; and panels (k–o) illustrate the source area.
4.1.3. Glacier Debris Flow in 2021
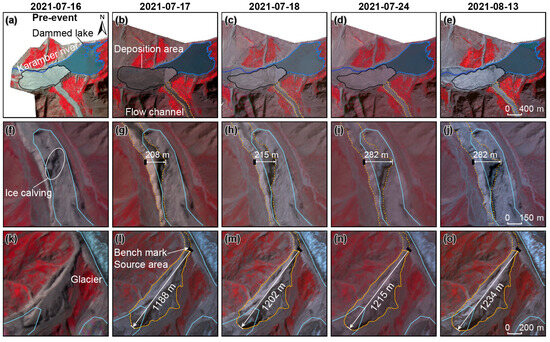
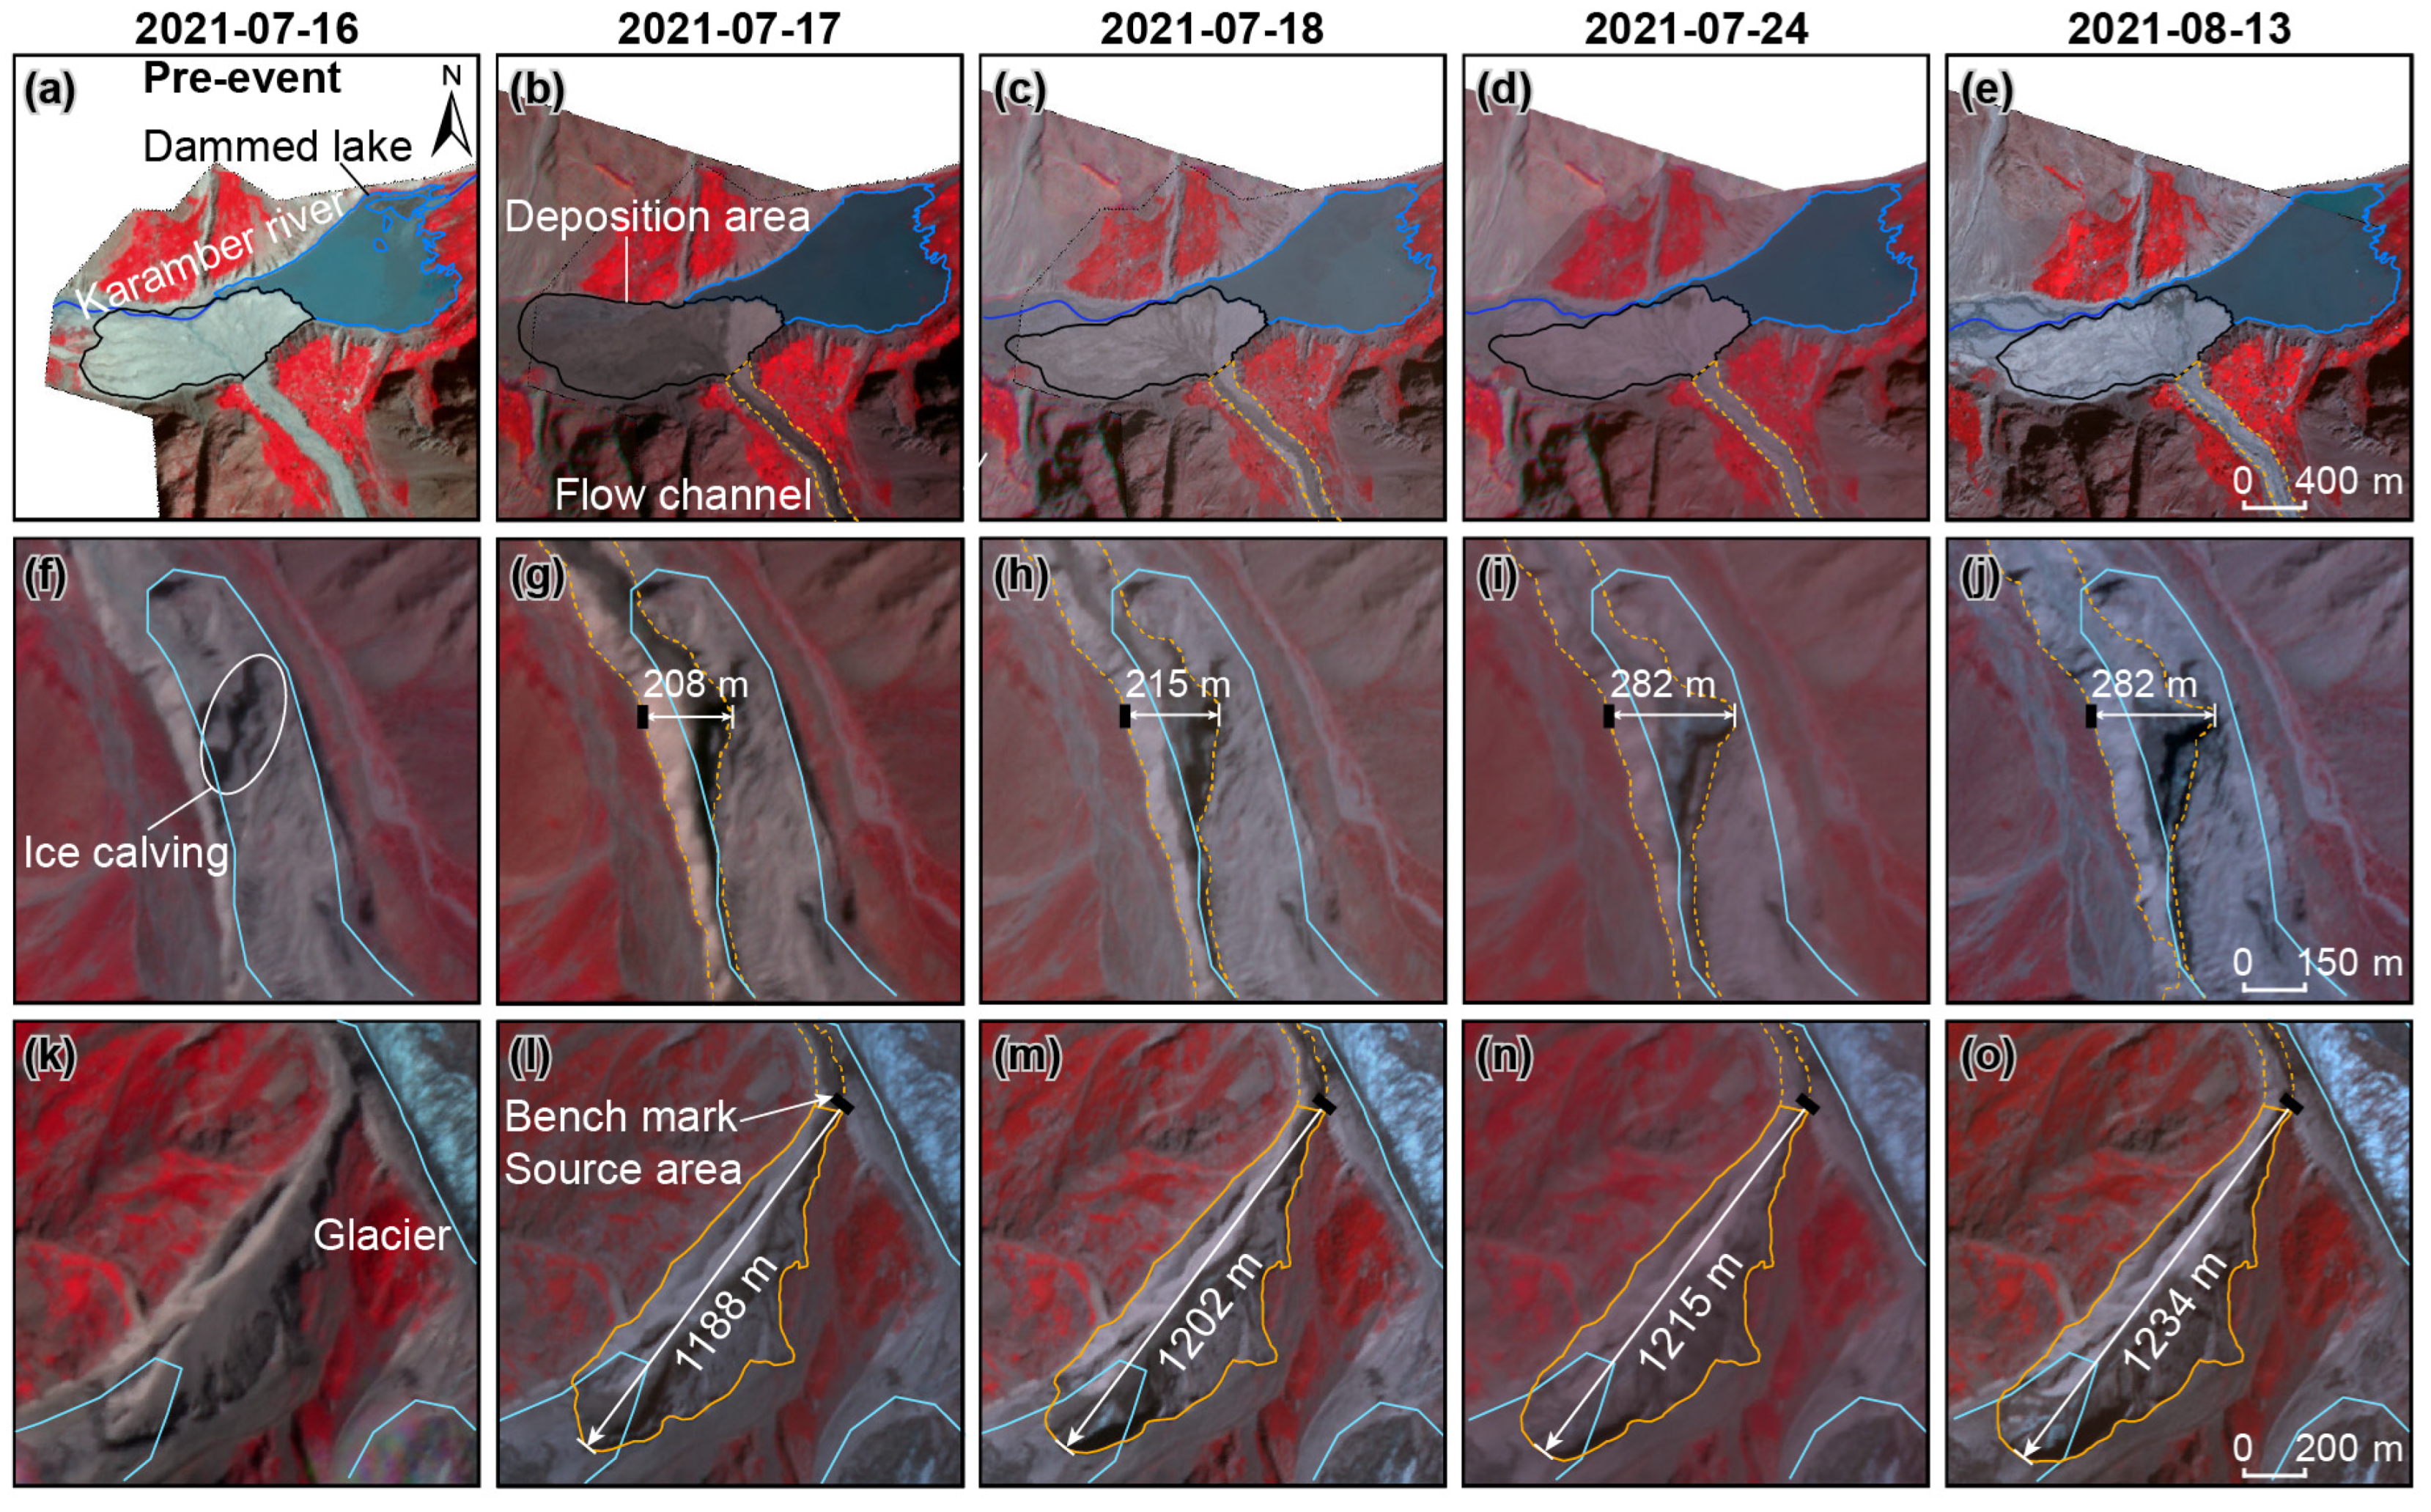
On 16 July 2021, a debris flow occurred in the Badswat Basin. While smaller than the 2018 event, it still demonstrated a distinct cascading process. Runoff-driven erosion and glacier collapses mobilized loose debris, altering the river channel and partially blocking drainage from the dammed lake (Figure 8a–e). In the tributary valley, debris buildup posed potential hazards, while erosion at the main glacier margin created marginal channels and redistributed material. Increased runoff from tributaries caused the collapse of buried ice. It transported valley-floor debris via fluvial processes, with thermal and gravitational forces from the debris flow inducing additional collapses along the glacier margin. These events created new channels and intensified the debris flow. Although the slopes in the initiation zone had stabilized after previous events, erosion continued primarily through vertical incision and headward retreat (Figure 8f–j), with the debris flow advancing about 46 m upstream after the outbreak. At the glacier’s terminus, ice collapsed, driven by debris-flow erosion and thermal effects, and persisted until stabilizing after 24 July (Figure 8k–o).
Figure 8.
Cascading evolution of the July 2021 Badswat debris-flow event, showing dammed lake expansion, ice calving, and source area growth from 16 July to 13 August. Panels (a–e) depict the area of debris-flow deposition. Panels (f–j) illustrate the debris-flow erosion zone, and panels (k–o) highlight the debris-flow source area.
4.2. Changes in Dammed Lakes
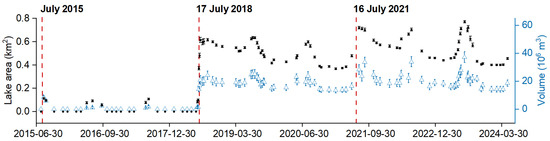
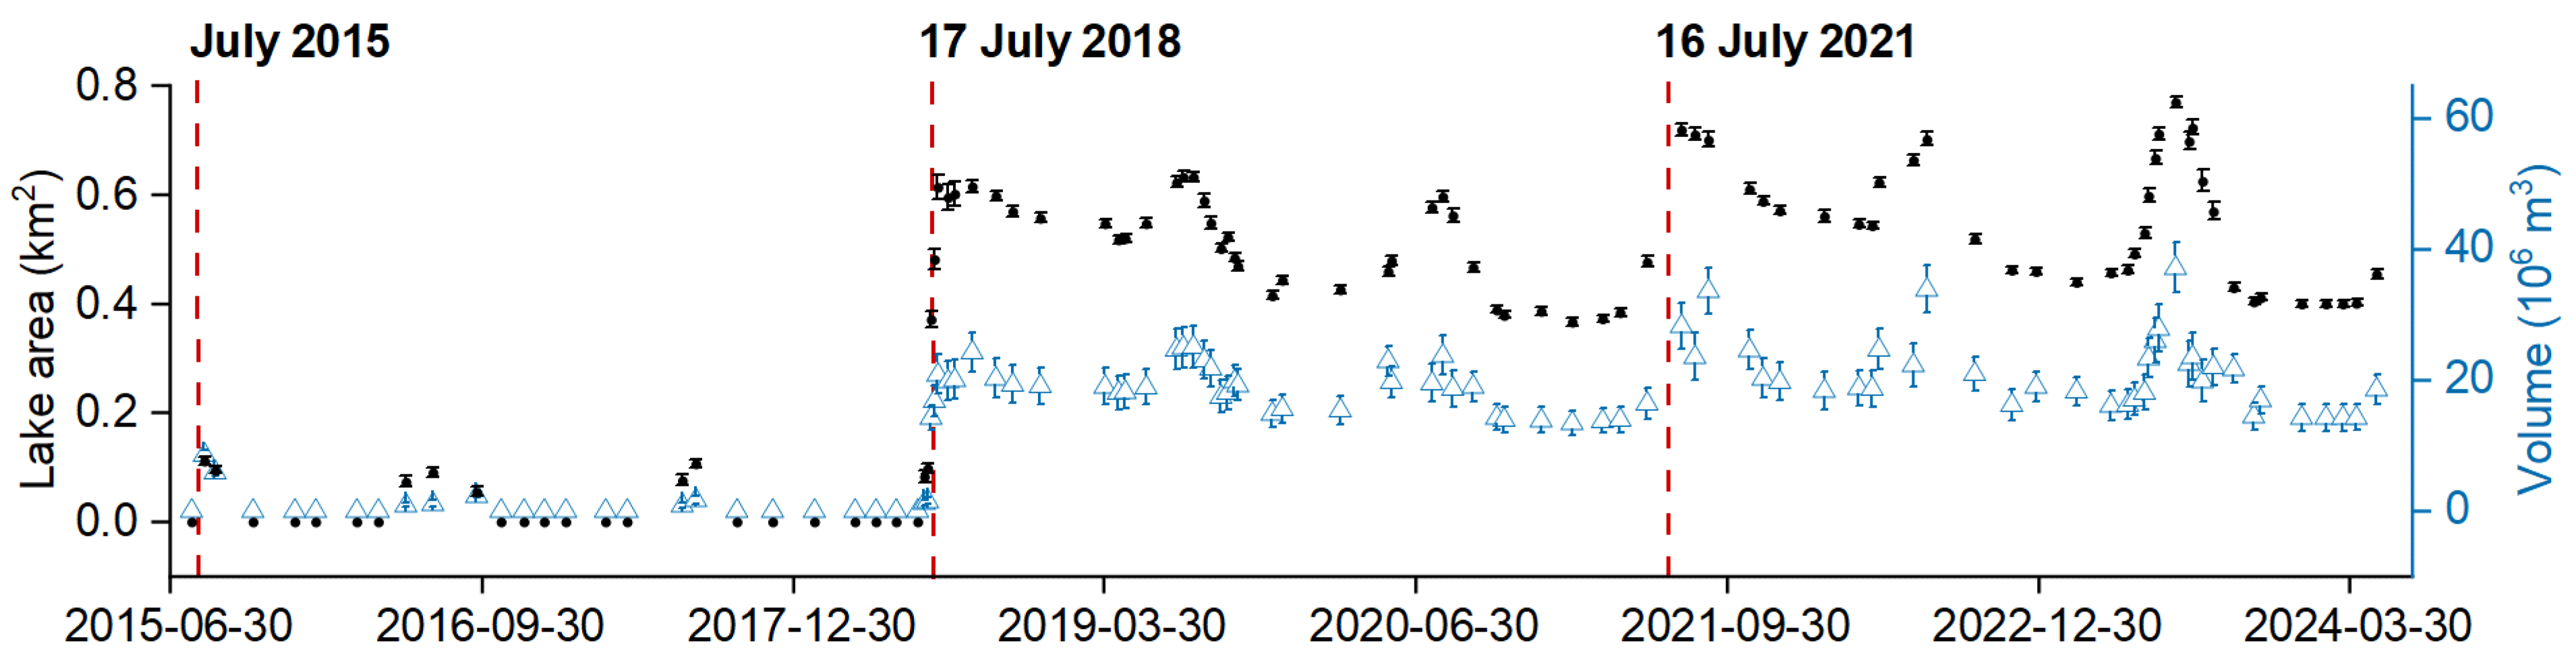
The three glacier debris flow events collectively contributed to the growth of the downstream landslide-dammed lake, which showed clear seasonal changes (Figure 9). The first event in 2015 created the initial impoundment, averaging about 0.08 km2 with a storage volume of 2.98 × 10⁶ m3, reaching a maximum area of 0.11 km2 and a volume of 8.5 × 10⁶ m3, effectively forming a stable valley blockage. The 2018 event caused a significant expansion, increasing the lake’s average area to 0.47 km2 and volume to 18 × 106 m3. With ongoing debris flow, the lake continued to grow, reaching 0.63 km2 in area and approximately 25 × 106 m3 in volume. Conversely, the 2021 event resulted in only a slight increase, with the lake’s average area reaching 0.55 km2 and a maximum of 0.72 km2; its average volume slightly decreased to 21 × 106 m3, peaking at 40 × 106 m3. These observations suggest that while the 2018 event caused substantial lake expansion, the 2021 event mainly contributed to stabilization rather than significant change. The lake also exhibited notable seasonal variations, especially during summer melt, when both area and volume increased, reflecting the impact of glacier meltwater on valley water flow and lake water levels.
Figure 9.
Seasonal changes in the Badswat dammed lake’s area (black) and volume (blue) from 2015 to 2024 are shown, with red dashed lines marking the debris-flow events in 2015, 2018, and 2021.
4.3. Geomorphological Change Caused by the Events
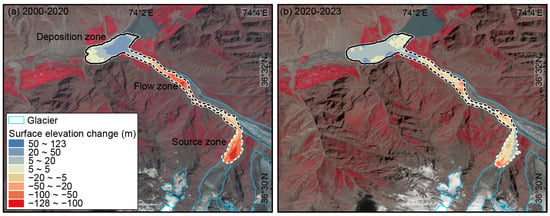
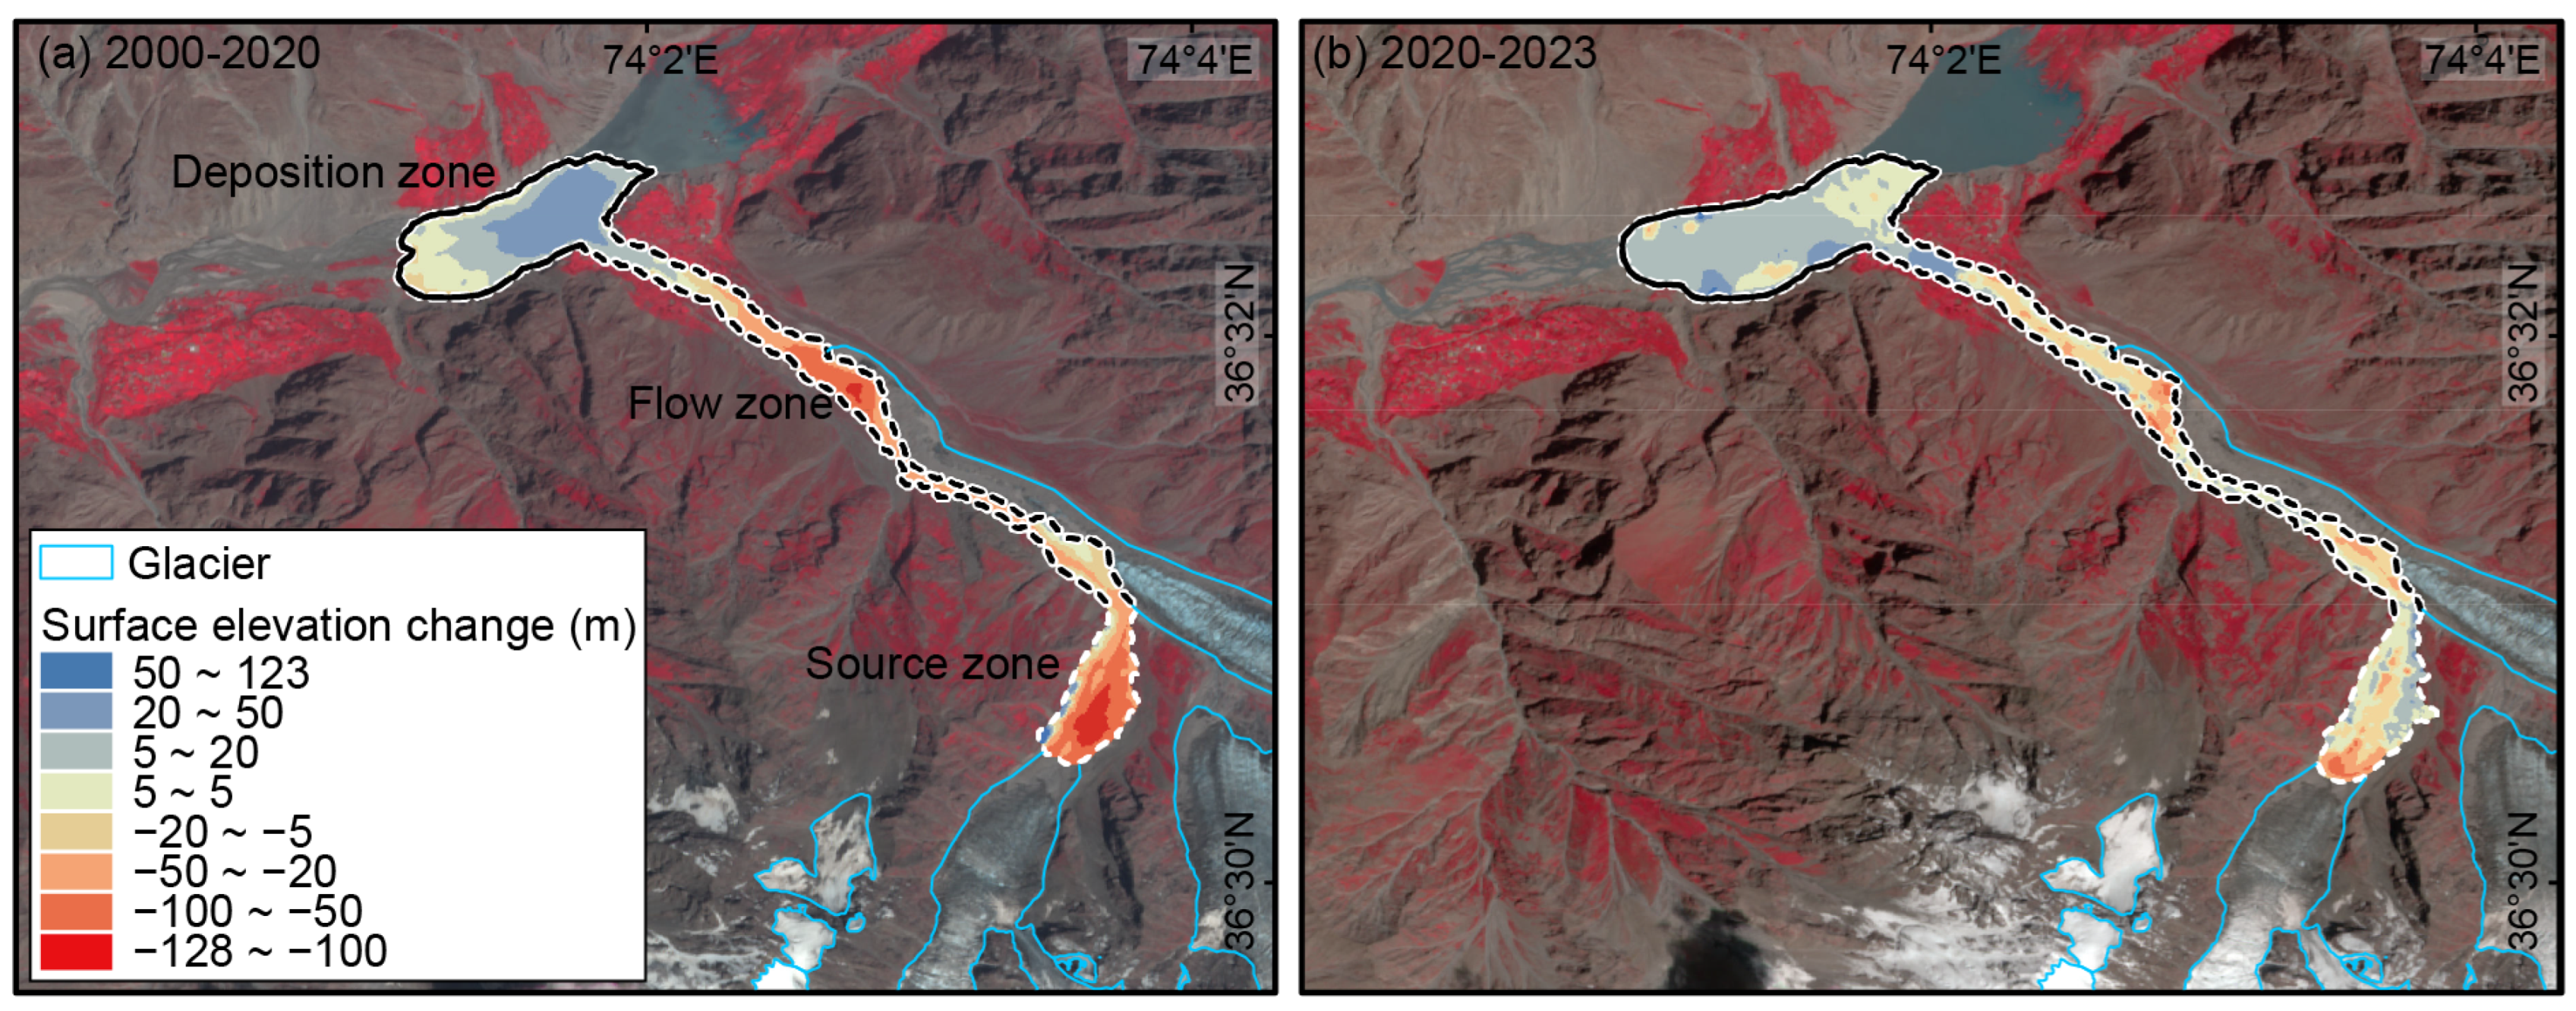
The three debris-flow events have significantly altered the geomorphology of the Badswat Basin, mainly through supraglacial mass redistribution and net erosion (Figure 10). Subtracting two independent DSMs involves error propagation, thereby increasing uncertainty. Using the validated DSM accuracies (GF-7 σ = 4.16 m, ZY-3 σ = 2.98 m) and the typical ALOS DEM accuracy (σ = 5.0 m), the combined elevation errors for each difference period were calculated: ±6.50 m between 2000 and 2020, and ±5.12 m between 20220 and 2024 ZY3-GF7. The extreme events in July 2015 and July 2018 caused an average erosion rate between 2000 and 2020 that was nearly four times higher than that observed between 2020 and 2023 (Table 1). Between 2000 and 2020, the largest volumetric losses occurred in the source area (18.33 × 10⁶ m3) and flow channel (14.40 × 10⁶ m3), with minor gains in these zones (0.46 × 10⁶ m3 and 0.89 × 10⁶ m3). Conversely, deposition zones accumulated 10.80 × 10⁶ m3, resulting in total erosion of 33.11 × 10⁶ m3 and total accumulation of 12.15 × 10⁶ m3. From 2020 to 2023, erosion decreased markedly, with only 3.53 × 10⁶ m3 lost in the source area and 4.85 × 10⁶ m3 in the flow channel. Meanwhile, accumulation slightly increased in the flow channel (2.18 × 10⁶ m3) and deposition zones (8.38 × 10⁶ m3), resulting in a total erosion of 8.69 × 10⁶ m3 and a total accumulation of 11.50 × 10⁶ m3.
Figure 10.
Surface elevation changes in the Badswat Glacier basin from 2000 to 2023. Panel (a) shows elevation differences between 2000 and 2020, relating to 2015 and 2018 debris-flow events; panel (b) covers 2020 to 2023, relating to the 2021 debris-flow event.
Table 1.
The change in surface elevation resulting from each disaster event.
Maximum incision (102.33 m) and volumetric loss (18.33 × 10⁶ m3) occurred at the confluence of the tributary and main glacier, with the adjacent channel contributing an additional 14.40 × 10⁶ m3. Despite noticeable differences in erosion between periods, depositional balances mainly remained stable. Channel variation between 2015 and 2018 enabled the efficient downstream transport of sediment and boulders by 2021, thereby concealing erosional deficits in depositional records and highlighting the complex interplay between erosion and deposition.
4.4. Socioeconomic Effects of Events
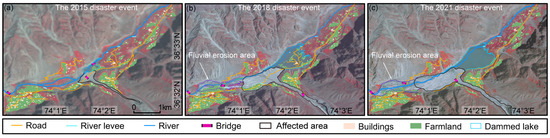
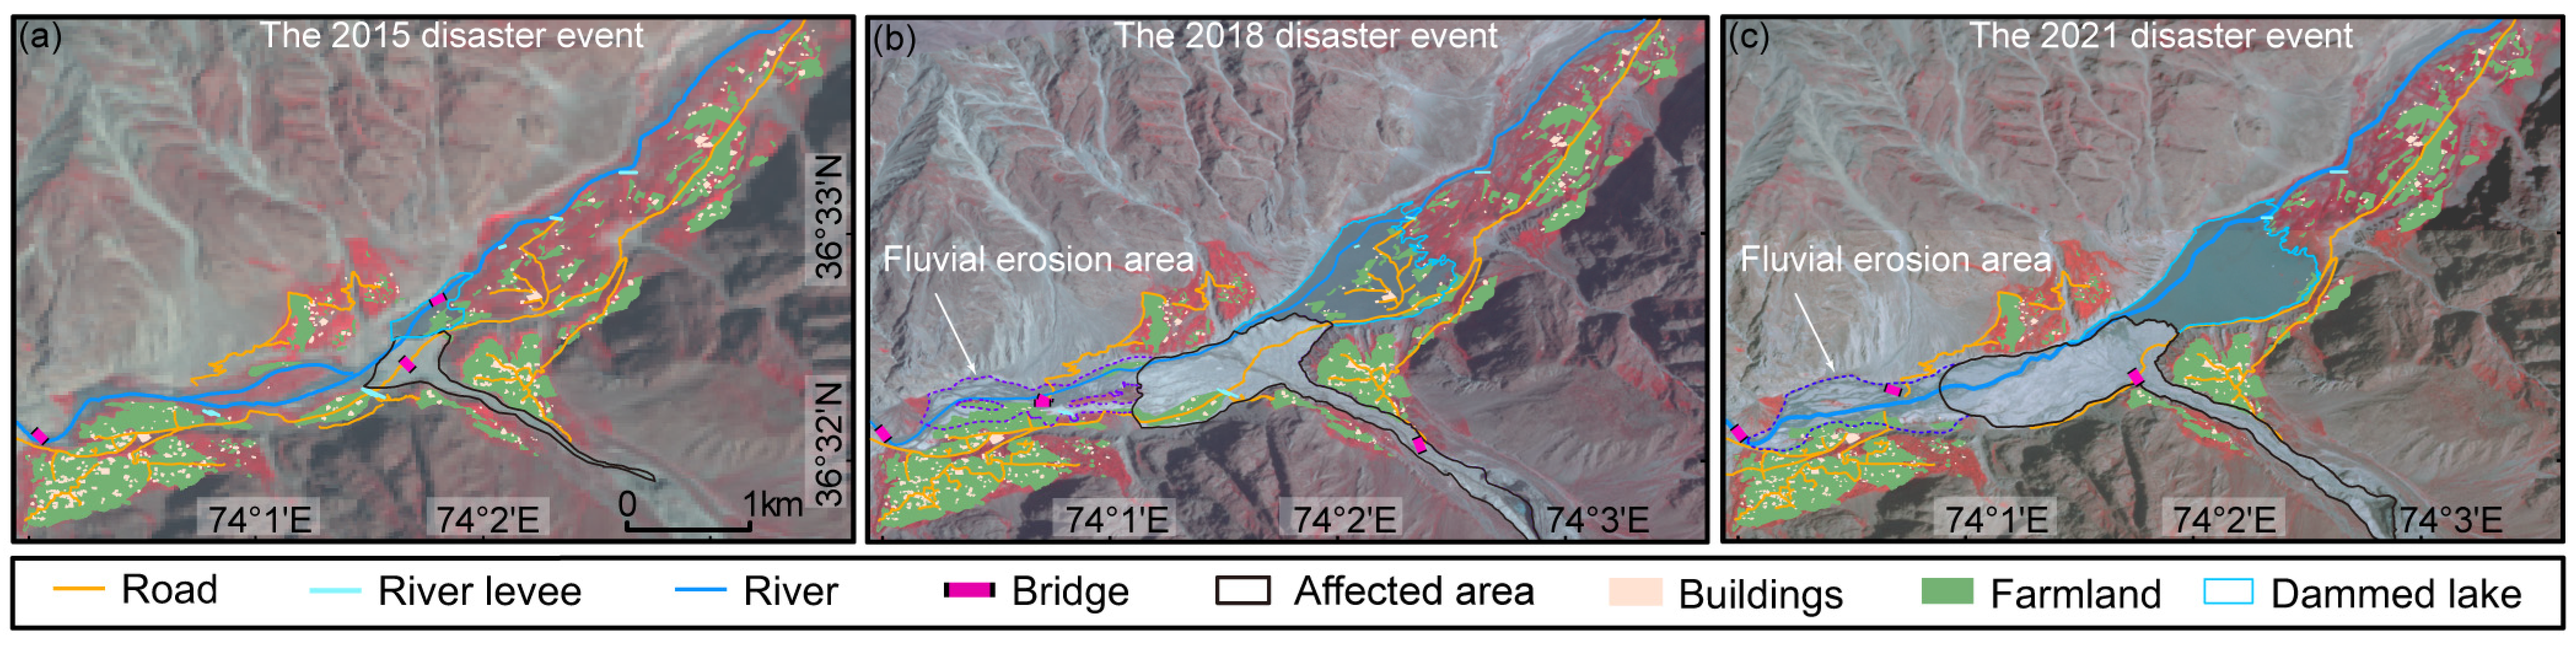
The three debris flow events resulted in severe impacts and significant losses in the downstream area (Table 2). The 2015 debris flow caused the least damage but created a dammed lake in the valley (Figure 11a). It damaged five buildings, inundated approximately 0.02 km2 of farmland, affected two bridges, and destroyed 0.78 km of roads. The 2018 disaster was the most devastating (Figure 11b), as it transported a large amount of glacial debris, forming an extensive alluvial fan that destroyed farmland, houses, irrigation channels, and downstream roads. The rise in the landslide dam led to the rapid expansion of the dammed lake, further flooding farmland and residential areas. During this event, 75 buildings were damaged, the flooded farmland area increased to 0.28 km2, three bridges were affected, 4.95 km of roads were destroyed, and one river levee was submerged. The 2021 event was relatively moderate but still caused notable damage (Figure 11c). The alluvial fan continued downstream, blocking the dammed lake outlet with newly deposited material, triggering a small-scale outburst flood. This flood transported sediments farther downstream, increasing its destructive power and expanding the affected area. It damaged eight buildings, flooded 0.11 km2 of farmland, damaged three bridges, destroyed 2.88 km of roads, and submerged one levee.
Table 2.
Damage and losses from 2015, 2018, and 2021 glacial debris-flow events and related dammed lake hazards in the Badswat Glacier basin.
Figure 11.
Impacts and damage caused by the glacial debris-flow events in 2015 (a), 2018 (b), and 2021 (c) within the Badswat Glacier basin.
5. Discussion
5.1. The Role of Topography in Glacier Debris Flows
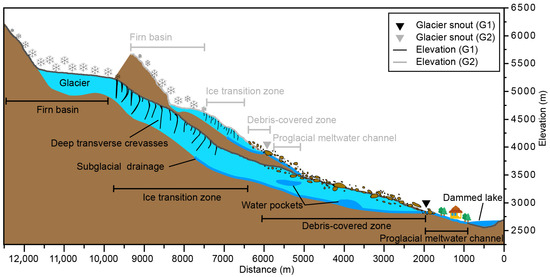
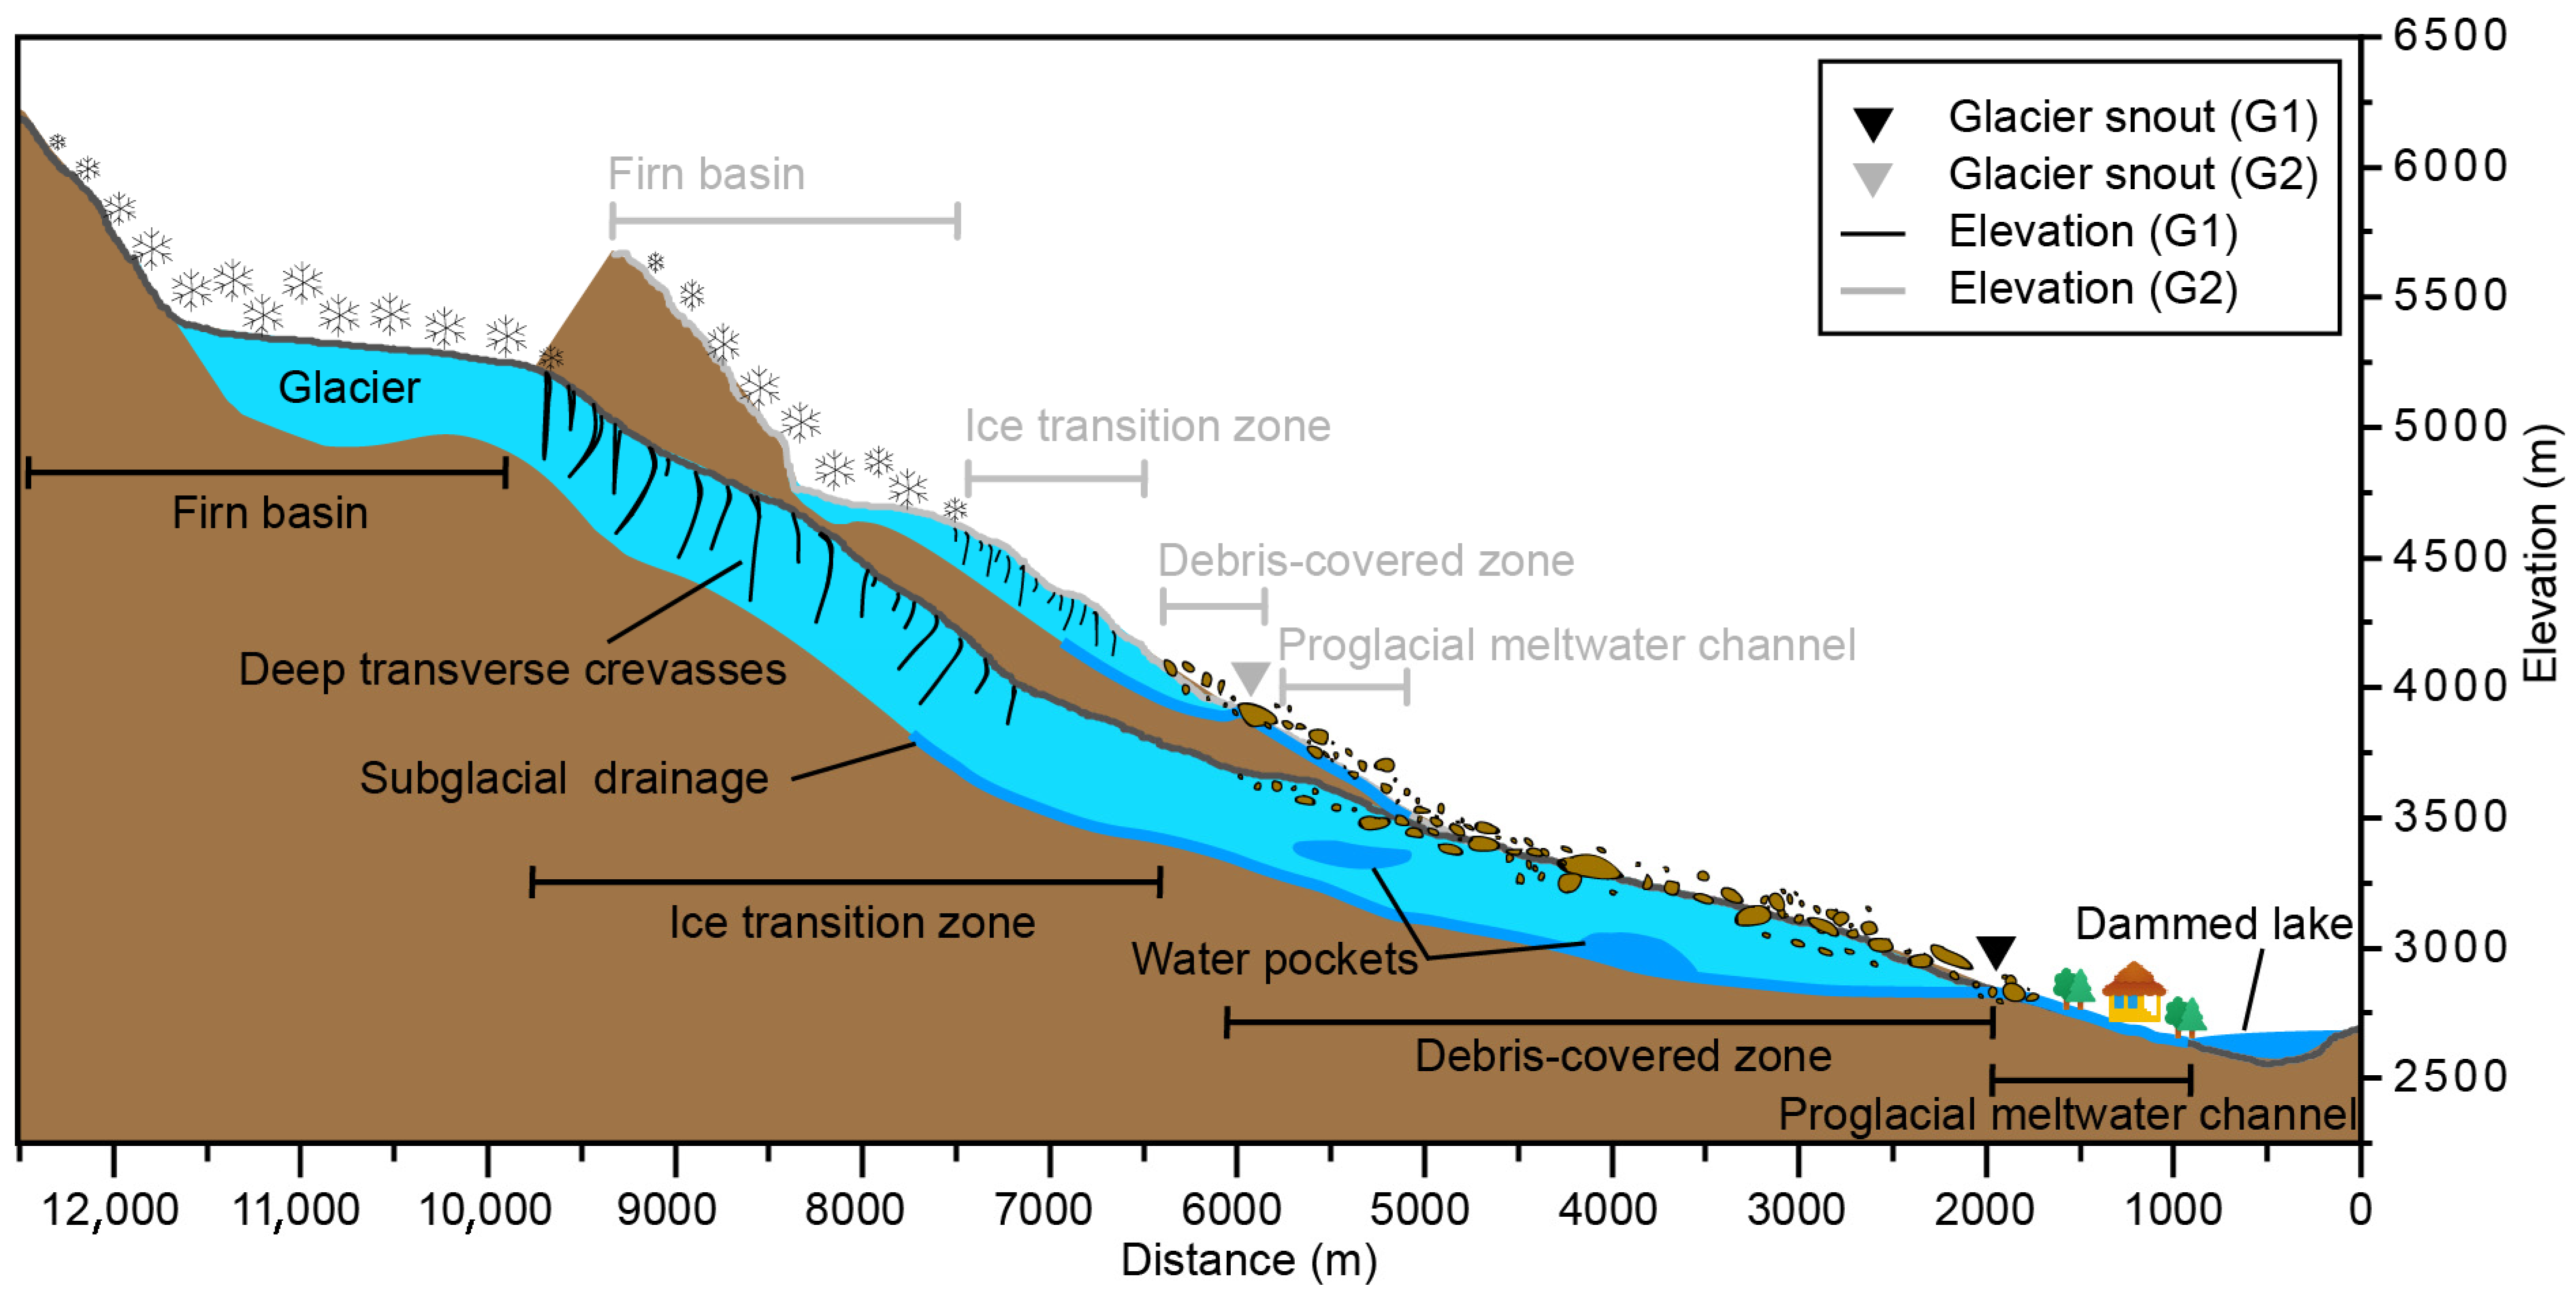
Topography plays a crucial role in triggering hazardous events, which originate more frequently on tributary glaciers than on the main trunk glacier (Figure 12). This influence occurs through two main mechanisms: physical stability and thermal exposure.
Figure 12.
Diagram illustrating topography, debris-covered regions, and meltwater channels that impact glacier-related hazards.
Firstly, physical morphology affects stability. Tributary glacier meltwater channels, filled with abundant glacial moraine, soil, and sands, are inherently less stable due to their steep slopes, which can exceed 43° and average around 17°. These steep inclines significantly increase fluidity and promote sediment erosion, aiding the formation of large debris flows [51]. Additionally, the supraglacial debris-covered areas on tributary glaciers, with an average slope of 16° and peaks reaching 45°, are highly vulnerable to collapse and sliding during ablation. In contrast, the main trunk glacier features a broad, gently sloping debris-covered zone that acts as a buffer, reducing peak discharge from rapid glacial drainage [52]. The complex, elongated intra-glacial channels support a steady, gradual flow of meltwater.
Secondly, orientation affects glaciers’ susceptibility to temperature changes. Topography impacts glacier mass balance by influencing solar radiation exposure [53]. Tributary glaciers run along a north–south axis, which makes them more exposed to intense solar radiation. In contrast, the main trunk glacier is oriented along a less-exposed east–west axis. This increased sunlight significantly enhances glacial meltwater production. Specifically, in June, the isotherm in the Badswat Basin coincides with the lower firn-basin elevation of the tributary glaciers [20], marking the onset of ablation. Consequently, the tributary glaciers fully enter the melting phase, and the extra meltwater raises hydrostatic pressure. Higher temperatures make the ice transition zone more susceptible to localized fracturing or calving, thereby increasing the risk of sudden glacier destabilization [54]. This thermal vulnerability, coupled with the lack of gentle debris-covered areas that could serve as buffers, dramatically increases the likelihood of disaster on the tributaries.
5.2. Climatic Causes of Glacier Debris Flows
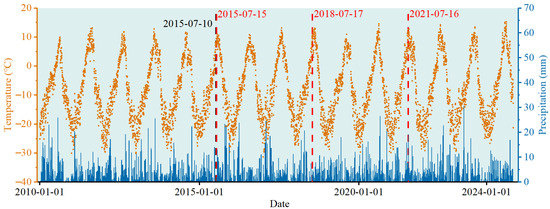
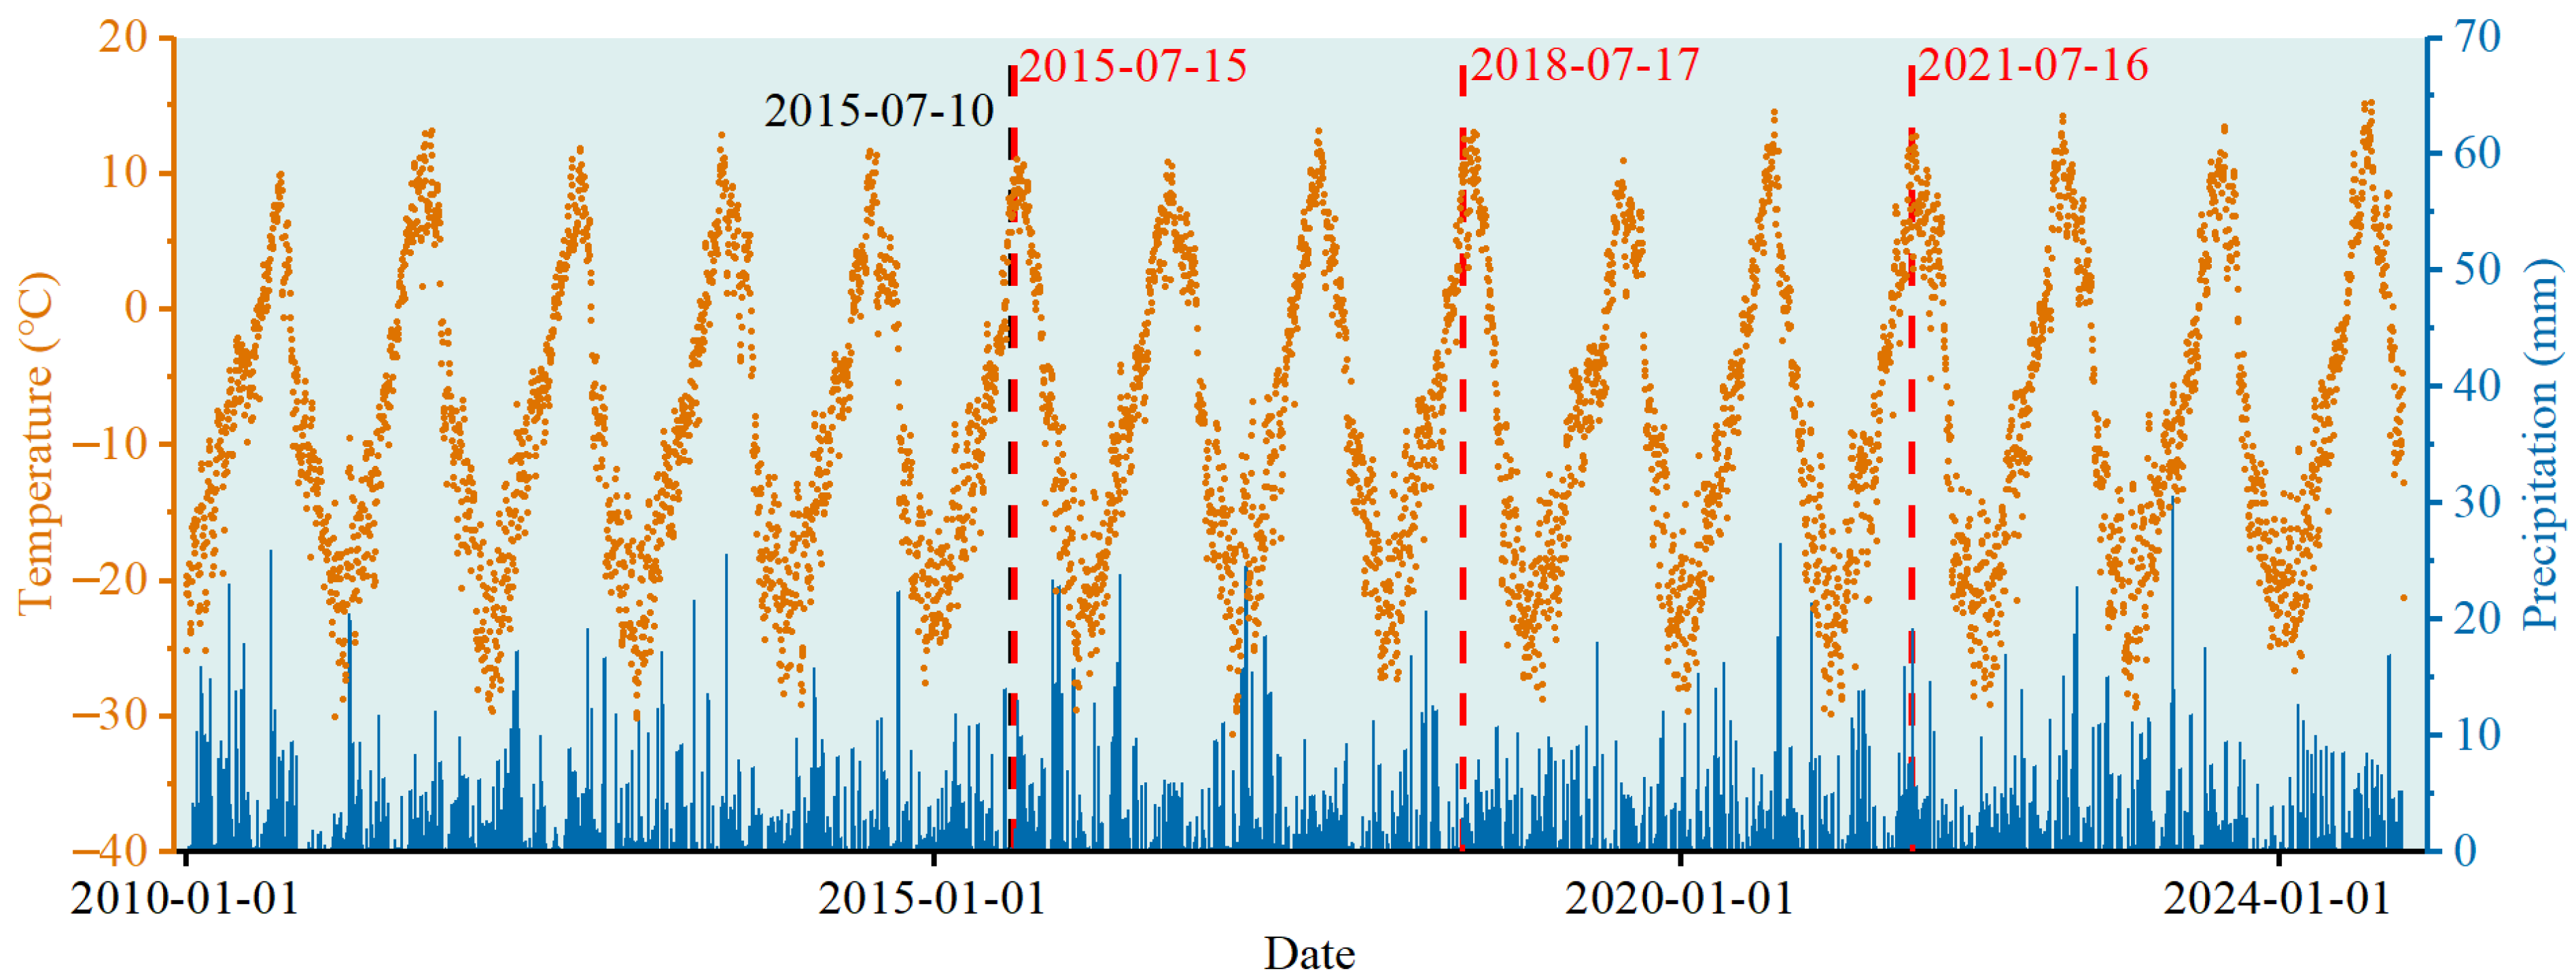
Glacier melting, driven by rising temperatures, was the primary factor behind the three debris-flow events (Figure 13). Climate data from 2010 to 2024 indicate that all three incidents occurred in July, the hottest month, highlighting the crucial role of higher temperatures in triggering these events [55]. Notably, the events occurred under highly variable rainfall circumstances: we examined precipitation levels in the week leading up to each debris flow. The 2015 event occurred under nearly dry conditions and was relatively minor; the 2018 event was triggered by a single 7.5 mm rainfall event, which is unlikely to be the primary cause. The 2021 event received 21.5 mm of rain in the previous week, including about 8 mm on 13 July, which may have served as a trigger. All debris flows occurred despite a wide range of precipitation levels, from almost none to moderate, indicating a common trigger: increased meltwater supply driven by temperature-induced ablation. Mann–Kendall tests conducted before all three events showed no sudden climate changes or anomalies, suggesting that extreme weather was unlikely to be the direct cause of the events. In summary, rising temperatures that accelerate glaciers’ melt mainly cause the debris flows [56], with precipitation playing a secondary or triggering role in specific cases. This supports previous research indicating that increasing temperatures accelerate glacier melting, increase runoff, and compromise the stability of moraines and ice masses [19,20].
Figure 13.
Temperature and precipitation in the Badswat catchment from 2010 to 2024, with red dashed lines indicating debris-flow events in 2015, 2018, and 2021.
5.3. Effects of Glacier Debris Flows on Glacial Movement
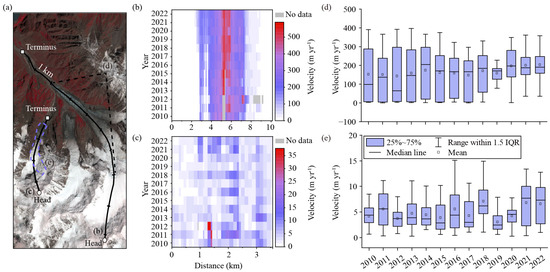
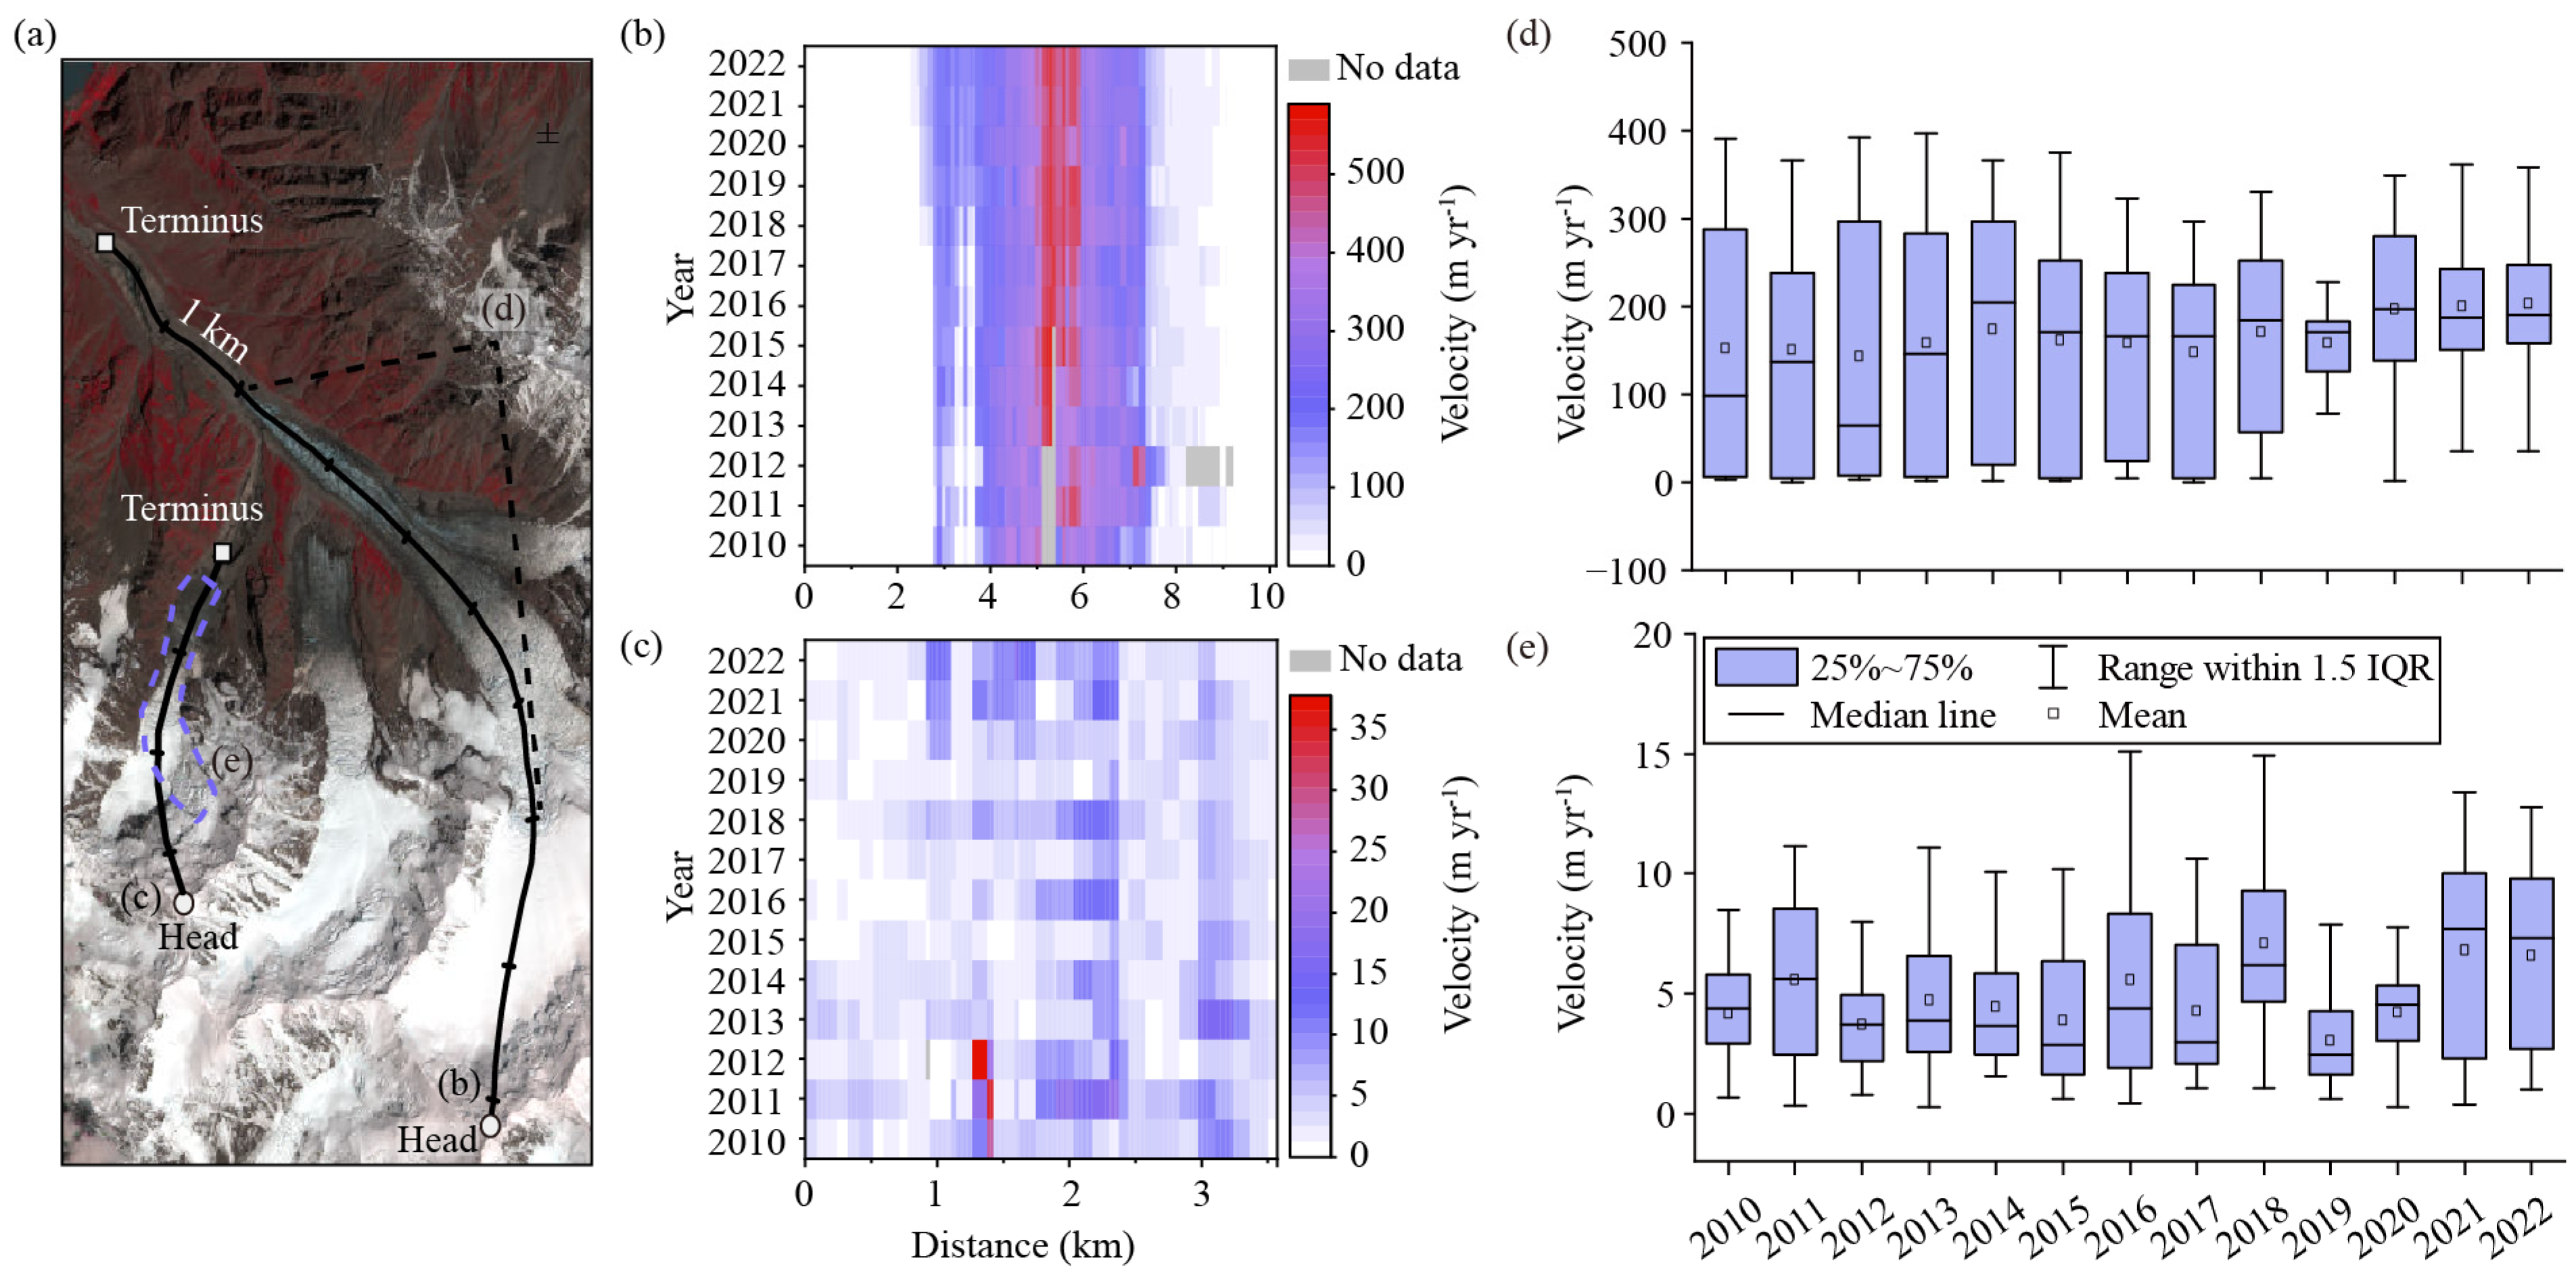
Glacial debris-flow disasters and glacier movement influence each other directionally: glacier motion can trigger debris flows, while debris-flow events can also affect glacier dynamics [57]. The trunk glacier (Figure 14a) consistently maintains a high velocity year-round, with core ice flow exceeding 500 m a−1, and its active area has expanded since 2018 (Figure 14b). As an area impacted by debris flows, the trunk glacier exhibits a clear response to these events. The 2015 disaster caused minimal erosion, resulting in no significant increase in ice flow velocity that year or in 2016. Conversely, the 2018 and 2021 events resulted in substantial material loss, leading to a notable increase in velocity. Since the velocity was already high in 2020, the acceleration in 2021 was relatively minor (Figure 14d). We propose that the glacier accelerates its flow to offset mass loss and then enters a more stable phase [58].
Figure 14.
Changes in glacier surface flow velocity between 2010 and 2022. Black lines (a) illustrate the center flowlines of Glacier 1 (G1) and Glacier 2 (G2). Black dashed lines mark the ice transition zone of G1, while the purple dashed box indicates the ice transition zone of G2. Panels (b) and (c) depict glacier velocities along G1 and G2’s center flowlines, respectively, from 2010 to 2022. Panel (d) shows year-to-year changes in glacier velocity within G1’s ice transition zone, and panel (e) presents interannual variations within G2’s transition zone.
Glacier movement also triggers debris flows. The tributary glacier, with a maximum annual velocity of less than 35 m a−1 from 2010 to 2022, exhibits significant temporal fluctuations. Its active area was larger in 2018, 2021, and 2022 (Figure 14c). Due to the small size of this glacier, velocity measurements along the main flowline were limited; thus, we used velocity data from the entire ice-flow zone for analysis. After removing outliers based on a 95% confidence interval, we obtained a representative multi-year velocity profile (Figure 14e). The average velocities in 2018 and 2021 increased significantly compared to previous years, coinciding with debris-flow events. In the steep, narrow tributary valleys, even minor changes in glacier drainage can trigger debris flows [6]. No significant increase in velocity was observed in 2015, consistent with the relatively small debris flow that year. As the velocity of glacier flow increases or more regions undergo active surging, the likelihood of instability and related hazards rises. Faster glacier movement can serve as an early warning indicator of potential future dangers. Nevertheless, accurately assessing these risks necessitates monitoring glacier motions at higher temporal resolutions.
5.4. Future Evolution of Glaciers
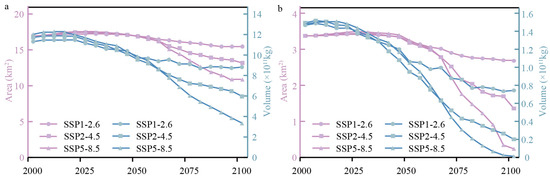
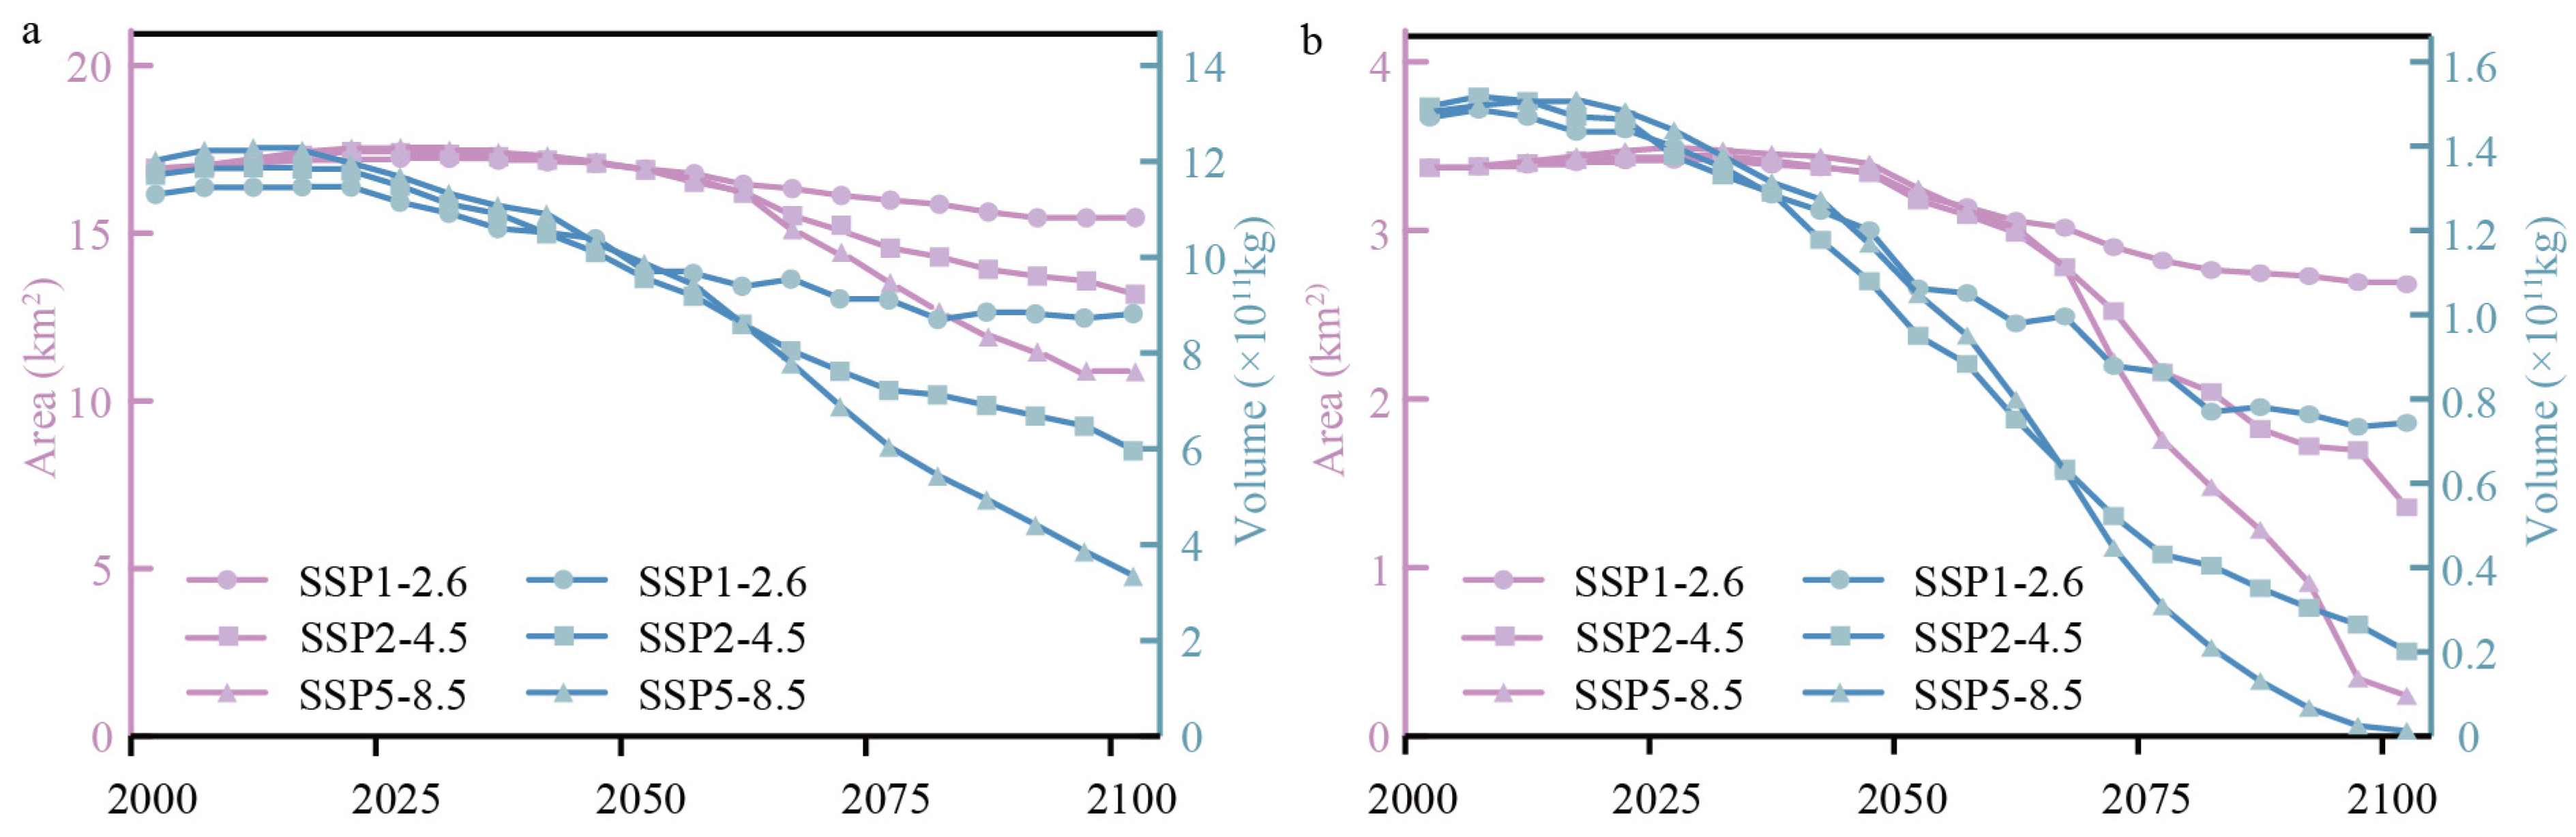
The future evolution of glaciers, as indicated by the Global PyGEM–OGGM Glacier Projections [38], shows steady mass loss for both the tributary glacier (G2) and the main glacier (G1) across different climate scenarios throughout the 21st century (Figure 15).
Figure 15.
Simulated changes in the area and volume of the Badswat parent glacier (a) and tributary glacier (b) across SSP1-2.6, SSP2-4.5, and SSP5-8.5 scenarios from 2000 to 2100.
Under the high-emission SSP5-8.5 scenario, the combined area of the two glaciers is expected to diminish from 20.31 km2 in 2000 to 11.11 km2 by 2100, representing a 45.30% decrease. Their total volume is projected to decrease from 1.35 × 10¹² m3 to 3.35 × 10¹¹ m3, roughly a 75.21% reduction. Conversely, under the low-emission SSP1-2.6 scenario, the reductions are less severe, with area and volume decreasing by 10.65% and 25.15%, respectively.
The two glaciers exhibit different future development patterns. From 2000 to 2100, the main glacier consistently experiences lower rates of area and volume loss than the tributary glacier. Under SSP5-8.5, the main glacier’s area is projected to shrink by 35.83%, while the tributary glacier’s area decreases by 92.88%. Similarly, the main glacier’s volume is expected to decline by 72.26%, whereas the tributary glacier’s volume drops by 99.14%.
This difference arises from multiple factors. Tributary glaciers are generally smaller, steeper, and have a higher surface-to-volume ratio compared to trunk glaciers, making them more susceptible to the effects of rising temperatures [59]. Their steep slopes and limited debris-covered areas decrease their ability to buffer against melting, while higher solar radiation and lower elevations of their ablation zones accelerate mass loss [60]. Conversely, trunk glaciers are larger, with gentler slopes and often extensive debris-covered areas that slow melting and help maintain stability, thereby reducing overall mass loss.
As climate change advances and glaciers melt faster, the threat of glacier-related disasters, such as debris flows and glacial lake outburst floods, will increase, particularly from rapidly retreating tributary glaciers.
5.5. Advantages and Limitations
This study’s strength lies in its detailed, systematic analysis of three glacial debris flow events in the Badswat catchment, combining multiple data sources and methods. It fills previous gaps by offering detailed monitoring and a well-structured disaster analysis. By combining remote sensing data from various sources with high-resolution topographic information, it provides a fresh perspective in disaster evaluation, moving beyond isolated case studies to consider the long-term, cumulative effects and development processes of the disaster chain. A key finding is the identification of the initiation points: all three events began from tributary glaciers. The study clearly shows that topography plays a vital role: steep slopes and north–south orientations of tributary glaciers diminish physical stability and heighten thermal vulnerability, making them the most likely sites for catastrophic failure.
While these contributions are valuable, the study is limited by the lack of in situ data for essential parameters. Dependence on the ITS-LIVE dataset for glacier velocity and ERA5 reanalysis for meteorology hindered a thorough investigation of key drivers—such as the detailed impacts of precipitation and the intricate interactions between glacier movement and debris flows—which could not be fully validated through field measurements. This lack of in situ data restricts a deeper understanding of the physical mechanisms involved and underscores the necessity for future enhancements. To extend research beyond primarily remote-sensing methods, future studies should incorporate dynamic models such as RAMMS [61] and FLO-2D [62]. Building on our inventory, these simulations will allow for quantitative analysis of flow processes and enhance hazard zoning.
6. Conclusions
This study used multi-temporal Sentinel-1/2 and Landsat OLI imagery, cross-validated with government bulletins and media reports, to accurately identify three consecutive July glacial debris-flow events (2015: 10–15 July; 2018: at 7:00 a.m. on 17 July; 2021: from 8:30 p.m. on 16 July to 8:00 a.m. on 17 July) in the Badswat basin. It confirms that combining multi-source remote sensing with ground data effectively detects such hazards, especially in unmonitored high-altitude areas.
The three events had overlapping socioeconomic impacts: the 2015 event (small-scale) damaged five buildings, flooded 0.01 km2 of farmland, and created the first barrier lake. The 2018 event (the most destructive) damaged 75 buildings, flooded 0.29 km2 of farmland, and expanded the barrier lake by developing an alluvial fan. The 2021 event (moderate) caused a minor outburst flood, damaging eight buildings and 2.02 km of roads. These repeated debris flows increase future risks by enlarging the dammed lake and building the alluvial fan, forming a cycle of escalating destruction.
These events also accelerated the basin’s geomorphological development by reorganizing subglacial drainage in 2015, eroding 0.97 km2, expanding the main glacier’s collapse width to 186 m in 2018, and causing a 46 m upstream debris flow through vertical incision in 2021. The average erosion rate from 2000 to 2020 was four times higher than from 2020 to 2023, indicating that glacier debris flows are key drivers of surface material redistribution and geomorphological change.
Future hazard risks in the basin will persist, as glacier meltwater mixing with precipitation could expand the 2021 dammed lake (up to 0.72 km2 and 40 million m3), raising the likelihood of an outburst from the dammed lake. Additionally, ongoing glacier collapse and channel widening will boost material transport.
Author Contributions
Conceptualization, M.L. and Y.N.; methodology, M.L.; validation, M.L., W.W. and M.H.; formal analysis, M.L.; investigation, M.L. and F.A.; writing—original draft preparation, M.L.; writing—review and editing, Y.N., H.Z., M.H., X.J., M.L., K.L. and Y.W.; visualization, M.L., W.W. and L.Z.; supervision, Y.N. All authors have read and agreed to the published version of the manuscript.
Funding
This study was supported by the National Natural Science Foundation of China (Grant Nos. 42171086, 41971153) and the Key Laboratory of Mountain Hazards and Engineering Resilience, Chinese Academy of Sciences (Grant number KLMHER-T04).
Data Availability Statement
The original data presented in the study are freely accessible at the Mountain Science Data Center (https://www.msdc.ac.cn; accessed on 17 December 2025).
Acknowledgments
We thank the U.S. Geological Survey (USGS) for providing Landsat 8 and 9 OLI imagery (https://earthexplorer.usgs.gov/ accessed on 6 April 2023), the Copernicus Open Access Hub for Sentinel-2 optical imagery (https://browser.dataspace.copernicus.eu/ accessed on 20 June 2024), Planet Labs for Planet Scope images (https://www.planet.com accessed on 23 November 2023), the European Space Agency (ESA) for Sentinel-1 SAR imagery, Google Earth Pro for high-resolution imagery used in land use classification, the Japan Aerospace Exploration Agency (JAXA) for the ALOS PALSAR-derived DEM (https://www.eorc.jaxa.jp/ALOS/ accessed on 10 August 2024), the USGS for SRTM DEM data (https://earthexplorer.usgs.gov/ accessed on 18 October 2024), the China Resources Satellite Application Center (CRESDA) for ZY-3 imagery (https://data.cresda.cn/ accessed on 19 October 2024), the China High-Resolution Earth Observation System (CHEOS) for GF-7 imagery (https://data.cresda.cn/ accessed on 19 October 2024), the NASA National Snow and Ice Data Center (NSIDC) for ICESat-2 laser altimetry data (https://nsidc.org/ accessed on 12 December 2024), the European Centre for Medium-Range Weather Forecasts (ECMWF) for ERA5 climate reanalysis data (https://www.ecmwf.int/ accessed on 17 December 2024), the ITS-LIVE project for glacier velocity data (https://its-live.jpl.nasa.gov/ accessed on 9 April 2025), and the Open Global Glacier Model (OGGM) community for PyGEM–OGGM glacier projection datasets under SSP scenarios (https://oggm.org/ accessed on 15 July 2025) used in this study.
Conflicts of Interest
The authors declare no conflicts of interest.
References
- Das, P.; Ghosh, S.; Reddy, N.G.; Rangarani, A. Evolution of glacier mass balance and surface velocity in response to climate change in Eastern Himalaya using Landsat imageries. Theor. Appl. Climatol. 2025, 156, 397. [Google Scholar] [CrossRef] [Scilit]
- Bazai, N.A.; Cui, P.; Liu, D.; Carling, P.A.; Wang, H.; Zhang, G.; Li, Y.; Hassan, J. Glacier surging controls glacier lake formation and outburst floods: The example of the Khurdopin Glacier, Karakoram. Glob. Planet. Change 2022, 208, 103710. [Google Scholar] [CrossRef] [Scilit]
- Bazai, N.A.; Cui, P.; Carling, P.A.; Wang, H.; Hassan, J.; Liu, D.; Zhang, G.; Jin, W. Increasing glacial lake outburst flood hazard in response to surge glaciers in the Karakoram. Earth-Sci. Rev. 2021, 212, 103432. [Google Scholar] [CrossRef] [Scilit]
- Zheng, G.; Allen, S.K.; Bao, A.; Ballesteros-Cánovas, J.A.; Huss, M.; Zhang, G.; Li, J.; Yuan, Y.; Jiang, L.; Yu, T.; et al. Increasing risk of glacial lake outburst floods from future Third Pole deglaciation. Nat. Clim. Change 2021, 11, 411–417. [Google Scholar] [CrossRef] [Scilit]
- Li, Y.; Cui, Y.; Hu, X.; Lu, Z.; Guo, J.; Wang, Y.; Wang, H.; Wang, S.; Zhou, X. Glacier Retreat in Eastern Himalaya Drives Catastrophic Glacier Hazard Chain. Geophys. Res. Lett. 2024, 51, e2024GL108202. [Google Scholar] [CrossRef] [Scilit]
- Allen, S.K.; Rastner, P.; Arora, M.; Huggel, C.; Stoffel, M. Lake outburst and debris flow disaster at Kedarnath, June 2013: Hydrometeorological triggering and topographic predisposition. Landslides 2016, 13, 1479–1491. [Google Scholar] [CrossRef] [Scilit]
- Dubey, S.; Goyal, M.K. Glacial Lake Outburst Flood Hazard, Downstream Impact, and Risk Over the Indian Himalayas. Water Resour. Res. 2020, 56, e2019WR26533. [Google Scholar] [CrossRef] [Scilit]
- Zhou, S.; Sun, Z.; Xie, J.; Zhao, F.; Huang, K.; Wang, H.; Yang, C. Investigating glacier mass balance and driving factors of the Karakoram Anomaly. J. Hydrol. Reg. Stud. 2025, 61, 102616. [Google Scholar] [CrossRef] [Scilit]
- Hewitt, K. Glaciers of the Karakoram Himalaya, 1st ed.; Springer: Dordrecht, The Netherlands, 2014; pp. 1–363. [Google Scholar]
- Hewitt, K. Glaciers and Climate Change in the Karakoram Himalaya Developments Affecting Water Resources and Environmental Hazards. 2009. Available online: https://docslib.org/doc/2818500/glaciers-and-climate-change-in-the-karakoram-himalaya-developments-affecting-water-resources-and-environmental-hazards (accessed on 17 December 2024).
- Bolch, T.; Kulkarni, A.; Kääb, A.; Huggel, C.; Paul, F.; Cogley, J.G.; Frey, H.; Kargel, J.S.; Fujita, K.; Scheel, M.; et al. The State and Fate of Himalayan Glaciers. Science 2012, 336, 310–314. [Google Scholar] [CrossRef] [Scilit]
- Hewitt, K. The Karakoram Anomaly? Glacier Expansion and the ‘Elevation Effect,’ Karakoram Himalaya. Mt. Res. Dev. 2005, 25, 332–340. [Google Scholar] [CrossRef] [Scilit]
- Bolch, T.; Pieczonka, T.; Mukherjee, K.; Shea, J. Brief communication: Glaciers in the Hunza catchment (Karakoram) have been nearly in balance since the 1970s. Cryosphere 2017, 11, 531–539. [Google Scholar] [CrossRef] [Scilit]
- Brun, F.; Berthier, E.; Wagnon, P.; Kääb, A.; Treichler, D. A spatially resolved estimate of High Mountain Asia glacier mass balances from 2000 to 2016. Nat. Geosci. 2018, 11, 543. [Google Scholar] [CrossRef] [Scilit]
- Shean, D.E.; Bhushan, S.; Montesano, P.; Rounce, D.R.; Arendt, A.; Osmanoglu, B. A Systematic, Regional Assessment of High Mountain Asia Glacier Mass Balance. Front. Earth Sci. 2020, 7, 363. [Google Scholar] [CrossRef] [Scilit]
- Nie, Y.; Pritchard, H.D.; Liu, Q.; Hennig, T.; Wang, W.; Wang, X.; Liu, S.; Nepal, S.; Samyn, D.; Hewitt, K.; et al. Glacial change and hydrological implications in the Himalaya and Karakoram. Nat. Rev. Earth Environ. 2021, 2, 91–106. [Google Scholar] [CrossRef] [Scilit]
- Kääb, A.; Berthier, E.; Nuth, C.; Gardelle, J.; Arnaud, Y. Contrasting patterns of early twenty-first-century glacier mass change in the Himalayas. Nature 2012, 488, 495–498. [Google Scholar] [CrossRef] [Scilit]
- Guillet, G.; King, O.; Lv, M.; Ghuffar, S.; Benn, D.; Quincey, D.; Bolch, T. A regionally resolved inventory of High Mountain Asia surge-type glaciers, derived from a multi-factor remote sensing approach. Cryosphere 2022, 16, 603–623. [Google Scholar] [CrossRef] [Scilit]
- Shangguan, D.; Li, D.; Ding, Y.; Liu, J.; Anjum, M.N.; Li, Y.; Guo, W. Determining the Events in a Glacial Disaster Chain at Badswat Glacier in the Karakoram Range Using Remote Sensing. Remote Sens. 2021, 13, 1165. [Google Scholar] [CrossRef] [Scilit]
- Hassan, W.; Su, F.; Liu, W.; Hassan, J.; Hassan, M.; Bazai, N.A.; Wang, H.; Yang, Z.; Ali, M.; Castellanos, D.G. Impact of glacier changes and permafrost distribution on debris flows in Badswat and Shishkat catchments, Northern Pakistan. J. Mt. Sci. 2023, 20, 3687–3702. [Google Scholar] [CrossRef] [Scilit]
- Anwar, W.; Barcha, D.; Wahab, U.; Din, K.; Gurung, D. Badswat lake outburst flood and debris dammed lake: A case study. In Debris Flows: Disasters, Risk, Forecast, Protection. Proceedings of the 6th International Conference (Dushanbe–Khorog, Tajikistan), 1st ed.; Chernomorets, S.S., Viskhadzhieka, K.S., Eds.; Promotion LLC: Dushanbe, Tajikistan, 2020; Volume 1, pp. 146–156. [Google Scholar]
- Lesi, M.; Nie, Y.; Shugar, D.H.; Wang, J.; Deng, Q.; Chen, H.; Fan, J. Landsat- and Sentinel-derived glacial lake dataset in the China-Pakistan Economic Corridor from 1990 to 2020. Earth Syst. Sci. Data 2022, 14, 5489–5512. [Google Scholar] [CrossRef] [Scilit]
- Wisner, B.; Blaikie, P.; Cannon, T.; Davis, I. At Risk: Natural Hazards, People’s Vulnerability and Disasters, 2nd ed.; Routledge: London, UK, 2003; pp. 1–496. [Google Scholar]
- RGI 7.0 Consortium. Randolph Glacier Inventory—A Dataset of Global Glacier Outlines, Version 7.0; NSIDC (National Snow and Ice Data Center): Boulder, CO, USA, 2023. [Google Scholar]
- Rose, A.; McKee, J.; Sims, K.; Bright, E.; Reith, A.; Urban, M. LandScan Global 2020; Oak Ridge National Laboratory: Oak Ridge, TN, USA, 2021.
- Nie, Y.; Sheng, Y.; Liu, Q.; Liu, L.; Liu, S.; Zhang, Y.; Song, C. A regional-scale assessment of Himalayan glacial lake changes using satellite observations from 1990 to 2015. Remote Sens. Environ. 2017, 189, 1–13. [Google Scholar] [CrossRef] [Scilit]
- EORC, J. ALOS Global Digital Surface Model (DSM). ALOS World 3D-30m (AW3D30). Version 3.1 (Product Description); Earth Observation Research Center, Japan Aerospace Exploration Agency (JAXA EORC): Chofu, Japan, 2020; pp. 1–16.
- Hersbach, H.; Bell, B.; Berrisford, P.; Hirahara, S.; Horányi, A.; Muñoz Sabater, J.; Nicolas, J.; Peubey, C.; Radu, R.; Schepers, D.; et al. The ERA5 global reanalysis. Q. J. R. Meteor. Soc. 2020, 146, 1999–2049. [Google Scholar] [CrossRef] [Scilit]
- Qayyum, N.; Ghuffar, S.; Ahmad, H.; Yousaf, A.; Shahid, I. Glacial Lakes Mapping Using Multi-Satellite PlanetScope Imagery and Deep Learning. ISPRS Int. J. Geo-Inf. 2020, 9, 560. [Google Scholar] [CrossRef] [Scilit]
- Wangchuk, S.; Bolch, T.; Robson, B.A. Monitoring glacial lake outburst flood susceptibility using Sentinel-1 SAR data, Google Earth Engine, and persistent scatterer interferometry. Remote Sens. Environ. 2022, 271, 112910. [Google Scholar] [CrossRef] [Scilit]
- Zhang, X.; Feng, M.; Li, T.; Chen, J.; Jiang, D.; Xu, J.; Yan, D.; Zhou, X.; Zhang, X.; Lu, J. High-Resolution Detection of Periglacial Landforms Deformation Using Radarsat-2 and GF-7 Stereo Optical Imagery. IEEE J. Sel. Top. Appl. Earth Obs. Remote. Sens. 2024, 17, 10862–10876. [Google Scholar] [CrossRef] [Scilit]
- Wang, J.; Sheng, Y.; Tong, T.S.D. Monitoring decadal lake dynamics across the Yangtze Basin downstream of Three Gorges Dam. Remote Sens. Environ. 2014, 152, 251–269. [Google Scholar] [CrossRef] [Scilit]
- Yuan, C.; Gong, P.; Bai, Y. Performance Assessment of ICESat-2 Laser Altimeter Data for Water-Level Measurement over Lakes and Reservoirs in China. Remote Sens. 2020, 12, 770. [Google Scholar] [CrossRef] [Scilit]
- NASA. The Shuttle Radar Topography Mission (SRTM) Collection User Guide; NASA: Washington, DC, USA, 2015; pp. 1–17.
- Liu, R.; Zhang, X.; Wang, W.; Wang, Y.; Liu, H.; Ma, M.; Tang, G. Global-scale ERA5 product precipitation and temperature evaluation. Ecol. Indic. 2024, 166, 112481. [Google Scholar] [CrossRef] [Scilit]
- Hersbach, H.; Bell, B.; Berrisford, P.; Biavati, G.; Horányi, A.; Muñoz Sabater, J.; Nicolas, J.; Peubey, C.; Radu, R.; Rozum, I. ERA5 Hourly Data on Single Levels from 1940 to Present. Copernicus Climate Change Service (C3S) Climate Data Store (CDS). 2023. Available online: https://cds.climate.copernicus.eu/datasets/reanalysis-era5-single-levels?tab=overview (accessed on 17 December 2024). [CrossRef]
- Gardner, A.S.; Fahnestock, M.A.; Scambos, T.A. MEaSUREs ITS_LIVE Landsat Image-Pair Glacier and Ice Sheet Surface Velocities: Version 1 [Data Set]; NASA National Snow and Ice Data Center: Boulder, CO, USA, 2019. [CrossRef] [Scilit]
- Rounce, D.; Hock, R.; Maussion, F. Global PyGEM-OGGM Glacier Projections with RCP and SSP Scenarios. (HMA2_GGP, Version 1) [Data Set]; NASA National Snow and Ice Data Center Distributed Active Archive Center: Boulder, CO, USA, 2022. [CrossRef]
- Nie, Y.; Liu, W.; Liu, Q.; Hu, X.; Westoby, M.J. Reconstructing the Chongbaxia Tsho glacial lake outburst flood in the Eastern Himalaya: Evolution, process and impacts. Geomorphology 2020, 370, 107393. [Google Scholar] [CrossRef] [Scilit]
- McFeeters, S.K. The use of the Normalized Difference Water Index (NDWI) in the delineation of open water features. Int. J. Remote Sens. 1996, 17, 1425–1432. [Google Scholar] [CrossRef] [Scilit]
- Zhang, G.; Chen, W.; Xie, H. Tibetan Plateau’s Lake Level and Volume Changes From NASA’s ICESat/ICESat-2 and Landsat Missions. Geophys. Res. Lett. 2019, 46, 13107–13118. [Google Scholar] [CrossRef] [Scilit]
- Zhou, B.; Zou, Q.; Jiang, H.; Yang, T.; Zhou, W.; Chen, S.; Yao, H. Process-driven susceptibility assessment of glacial lake outburst debris flow in the Himalayas under climate change. Adv. Clim. Change Res. 2024, 15, 500–514. [Google Scholar] [CrossRef] [Scilit]
- Andreassen, L.M.; Elvehøy, H.; Kjøllmoen, B.; Belart, J.M.C. Glacier change in Norway since the 1960s—An overview of mass balance, area, length and surface elevation changes. J. Glaciol. 2020, 66, 313–328. [Google Scholar] [CrossRef] [Scilit]
- Ambinakudige, S.; Intsiful, A. Estimation of area and volume change in the glaciers of the Columbia Icefield, Canada using machine learning algorithms and Landsat images. Remote Sens. Appl.-Soc. Environ. 2022, 26, 100732. [Google Scholar] [CrossRef] [Scilit]
- Kennedy, K. Introduction to 3D Data: Modeling with ArcGIS 3D Analyst and Google Earth, 1st ed.; John Wiley: Hoboken, NJ, USA, 2009; pp. 1–360. [Google Scholar]
- Zhang, T.; Wang, W.; An, B.; Wei, L. Enhanced glacial lake activity threatens numerous communities and infrastructure in the Third Pole. Nat. Commun. 2023, 14, 8250. [Google Scholar] [CrossRef] [Scilit] [PubMed]
- Zhang, S.; Nie, Y.; Zhang, H. Glacial lake changes and risk assessment in Rongxer Watershed of China-Nepal Economic Corridor. Remote Sens. 2024, 16, 725. [Google Scholar] [CrossRef] [Scilit]
- Chen, H.; Liang, Q.; Zhao, J.; Mahajan, S.B. Assessing national exposure to and impact of glacial lake outburst floods considering uncertainty under data sparsity. Hydrol. Earth Syst. Sc. 2025, 29, 733–752. [Google Scholar] [CrossRef] [Scilit]
- Subba, S.; Ma, Y.; Ma, W.; Han, C. Extreme precipitation detection ability of four high-resolution precipitation product datasets in hilly area: A case study in Nepal. Adv. Clim. Change Res. 2024, 15, 390–405. [Google Scholar] [CrossRef] [Scilit]
- Wu, Y.; Nie, Y.; Ahmed, F.; Gu, C.; Wang, W.; Zhang, H.; Lyu, Q.; Lesi, M.; Zhang, S. A new approach automatically calculating the outlet and upper catchment area of alpine glacial lakes. J. Hydrol. 2025, 651, 132591. [Google Scholar] [CrossRef] [Scilit]
- Chen, N.; Liu, M.; Allen, S.; Deng, M.; Khanal, N.R.; Peng, T.; Tian, S.; Huggel, C.; Wu, K.; Rahman, M.; et al. Small outbursts into big disasters: Earthquakes exacerbate climate-driven cascade processes of the glacial lakes failure in the Himalayas. Geomorphology 2023, 422, 108539. [Google Scholar] [CrossRef] [Scilit]
- Wang, X.; Zhang, G.; Veh, G.; Sattar, A.; Wang, W.; Allen, S.K.; Bolch, T.; Peng, M.; Xu, F. Reconstructing glacial lake outburst floods in the Poiqu River basin, central Himalaya. Geomorphology 2024, 449, 109063. [Google Scholar] [CrossRef] [Scilit]
- Arnold, N.S.; Rees, W.G.; Hodson, A.J.; Kohler, J. Topographic controls on the surface energy balance of a high Arctic valley glacier. J. Geophys. Res.-Earth Surf. 2006, 111, F02011. [Google Scholar] [CrossRef] [Scilit]
- Andersen, M.L.; Larsen, T.B.; Nettles, M.; Elosegui, P.; van As, D.; Hamilton, G.S.; Stearns, L.A.; Davis, J.L.; Ahlstrøm, A.P.; de Juan, J.; et al. Spatial and temporal melt variability at Helheim Glacier, East Greenland, and its effect on ice dynamics. J. Geophys. Res.-Earth Surf. 2010, 115, F04041. [Google Scholar] [CrossRef] [Scilit]
- Ponziani, M.; Pogliotti, P.; Stevenin, H.; Ratto, S.M. Debris-flow Indicator for an early warning system in the Aosta valley region. Nat. Hazards 2020, 104, 1819–1839. [Google Scholar] [CrossRef] [Scilit]
- Rowan, A.V.; Quincey, D.J.; Gibson, M.J.; Glasser, N.F.; Westoby, M.J.; Irvine-Fynn, T.D.L.; Porter, P.R.; Hambrey, M.J. The sustainability of water resources in High Mountain Asia in the context of recent and future glacier change. Geol. Soc. Lond. Spec. Publ. 2018, 462, 189–204. [Google Scholar] [CrossRef] [Scilit]
- Wang, T.; Huang, T.; Shen, P.; Peng, D.; Zhang, L. The mechanisms of high mobility of a glacial debris flow using the Pudasaini-Mergili multi-phase modeling. Eng. Geol. 2023, 322, 107186. [Google Scholar] [CrossRef] [Scilit]
- Marzeion, B.; Leclercq, P.W.; Cogley, J.G.; Jarosch, A.H. Brief Communication: Global glacier mass loss reconstructions during the 20th century are consistent. Cryosphere 2015, 9, 2399–2404. [Google Scholar] [CrossRef] [Scilit]
- Gardelle, J.; Arnaud, Y.; Berthier, E. Contrasted evolution of glacial lakes along the Hindu Kush Himalaya mountain range between 1990 and 2009. Glob. Planet. Change 2011, 75, 47–55. [Google Scholar] [CrossRef] [Scilit]
- Juen, M.; Mayer, C.; Lambrecht, A.; Han, H.; Liu, S. Impact of varying debris cover thickness on ablation: A case study for Koxkar Glacier in the Tien Shan. Cryosphere 2014, 8, 377–386. [Google Scholar] [CrossRef] [Scilit]
- Bartelt, P.; Bühler, Y.; Buser, O.; Christen, M.; Meier, L. Modeling mass-dependent flow regime transitions to predict the stopping and depositional behavior of snow avalanches. J. Geophys. Res.-Earth Surf. 2012, 117, F01015. [Google Scholar] [CrossRef] [Scilit]
- Brien, J.S.O. FLO-2D Reference Manual 2019; FLO-2D Software, Inc.: Nutrioso, AZ, USA, 2019. [Google Scholar]

Disclaimer/Publisher’s Note: The statements, opinions and data contained in all publications are solely those of the individual author(s) and contributor(s) and not of MDPI and/or the editor(s). MDPI and/or the editor(s) disclaim responsibility for any injury to people or property resulting from any ideas, methods, instructions or products referred to in the content. |
© 2025 by the authors. Licensee MDPI, Basel, Switzerland. This article is an open access article distributed under the terms and conditions of the Creative Commons Attribution (CC BY) license.