


Highlights
What are the main findings?
- North American savanna and forest fires typically last for 4–8 h, whereas those in East Asia generally peak within 2–4 h.
- Evening agricultural fires with low FRP significantly contribute to fire activity in East Asia.
What are the implications of the main findings?
- The diurnal variation of active fire FRP provides a more accurate dynamic constraint for updating fire emission inventories.
- Integrating regional dynamic diurnal cycles into fire models provides a more robust quantification of dry matter burned, particularly for intense fire seasons.
Abstract
Estimating biomass burning emissions remains challenging due to both the substantial spatiotemporal variability of fires and the inherent uncertainties associated with the limited overpass frequency of polar-orbiting satellites. Integrating geostationary (5–10 min, 2 km) and polar-orbiting (twice daily, 375 m) satellite observations provides a detailed characterization of active fire diurnal cycles. However, the conventional unimodal Gaussian approximation (Pol/Geo-Uni), commonly used in fire emission models, fails to accurately reproduce the diurnal patterns. This study systematically analyzed the seasonal and diurnal variation in different types of active fires (AFs) and fire radiative power (FRP) across North America (GOES-16, ABI) and East Asia (Himawari-8, AHI). In North America, forest and savanna fires exhibited high FRP and a pronounced bimodal diurnal cycle lasting 4–8 h, whereas the corresponding fire types in East Asia exhibited a shorter, unimodal pattern of 2–4 h. Agricultural fires in East Asia were predominantly small in scale with low FRP, and frequently occurred at night. We used a modified Gaussian function to estimate dry matter burned (DMB), quantitating regional emission impacts for different fire types. The fused product (VIIRS/ABI-Bi) yielded amounts of DMB in North America that was 1.22 and 1.24 times higher than that from VIIRS/ABI-Uni and GFASv1.2, respectively. In East Asia, VIIRS/AHI-Bi DMB exceeded those from VIIRS/AHI-Uni and GFASv1.2 by 1.08 and 0.94 times, with agricultural fire estimates during the fire season being 1.18–1.62 times higher. This increase was notably pronounced in eastern China, where VIIRS/AHI-Bi DMB reached 1.76 to 9.77 times higher than estimates from VIIRS/AHI-Uni, GFED5, GFED4.1s, and GFASv1.2. Overall, integrating high spatiotemporal resolution satellite fire products with regionally diurnal models can substantially improve emission estimates, particularly for frequent, small-scale fire events.
1. Introduction
Open biomass burning, including savanna fires, grassland fires, shrubland fires, managed forest fires, and agricultural biomass burning, poses a significant threat to global climate change and ecosystems [1]. Each year, widespread wildfires not only cause significant casualties and losses but also emit substantial amounts of greenhouse gases (e.g., carbon dioxide (CO2), carbon monoxide (CO), and methane (CH4)) and smoke particles, contributing to a large fraction of global organic carbon (OC) and black carbon (BC) [2]. The elevated dense fire smoke with large transport potential can be blown thousands of miles away, which not only harms air quality and public health, but also has intense interactions with radiative energy balance, cloud properties, and biogeochemistry cycles [3,4,5]. With wildfires intensifying, accurately capturing the diurnal variations in active fires is crucial for producing reliable emission estimates that enable quantitative assessments of biomass burning impacts on atmospheric chemistry and climate.
Satellite remote sensing provides a unique view of the earth, which offers the opportunity to study a large number of fires globally [6]. Satellite-based products, such as burned area (BA) and fire radiative power (FRP), have been widely used to construct fire emissions inventories. Traditional BA-based approaches, represented by the widely used Global Fire Emissions Database (GFED), are subject to considerable uncertainties primarily due to challenges in accurately estimating pre-fire fuel load, combustion completeness, and emission factors [7]. In contrast, FRP-based methods, such as those implemented in the Global Fire Assimilation System (GFAS), derive fire radiative energy (FRE) through temporal integration of instantaneous FRP observations and directly convert FRE to fuel consumption and carbon emissions using biome-specific conversion factors [8]. This approach significantly minimizes reliance on uncertain parameters, providing a more reliable alternative for emissions estimation [9]. However, both BA-based and FRP-based approaches rely primarily on polar-orbiting satellites that provide only 1–4 overpasses per day. This limited temporal sampling severely restricts their ability to capture strong and rapid diurnal variations in fire activity, resulting in substantial biases in estimated fuel consumption and emissions—particularly in regions with pronounced afternoon or evening fire peaks [10].
In contrast, geostationary (GEO) satellites, with their high temporal resolution, enable continuous monitoring of diurnal fire activity. Consequently, some studies have integrated fire products from polar-orbiting satellites such as Moderate-Resolution Imaging Spectroradiometer (MODIS) and Visible–Infrared Imaging Radiometer Suite (VIIRS) with GEO observations to provide dynamic quantitative constraints for the development and updating of fire emission inventories [11,12]. However, fire activity exhibits not only pronounced diurnal cycles but also significant regional variability, influenced by factors such as weather conditions, vegetation types, ignition sources, and human activities [13]. The specific mechanisms by which different ecosystems and land cover types influence fire activity patterns remain to be further explored, which to some extent limits the accuracy of current fire emission models. These diverse characteristics underscore the importance of considering both spatial and temporal variability in fire activity for improving emission estimates [7]. We selected GOES-16-ABI and Himawari-8-AHI, as they offer optimal spatial coverage for our target regions (North America/East Asia) and feature comparable, mature algorithms and high temporal resolution (10 min) data.
Therefore, this study utilizes fire products from GEO satellites (GOES-16-ABI and Himawari-8-AHI) and the polar-orbiting satellites (Suomi NPP-VIIRS), combined with 500 m resolution MODIS land cover data (MCD12Q1), to analyze the characteristics of the diurnal fire cycle across different land cover types in North America and East Asia. Based on a modified Gaussian function, we develop the region-specific diurnal emission models to estimate the amount of dry matter burned (DMB). Section 2 outlines the data. Section 3 details the methodological framework. Section 4 presents the spatiotemporal patterns of biomass burning and associated emission estimates, and Section 5 concludes the study.
2. Datasets
2.1. Description of the Study Area
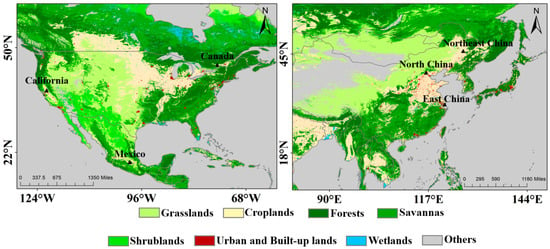
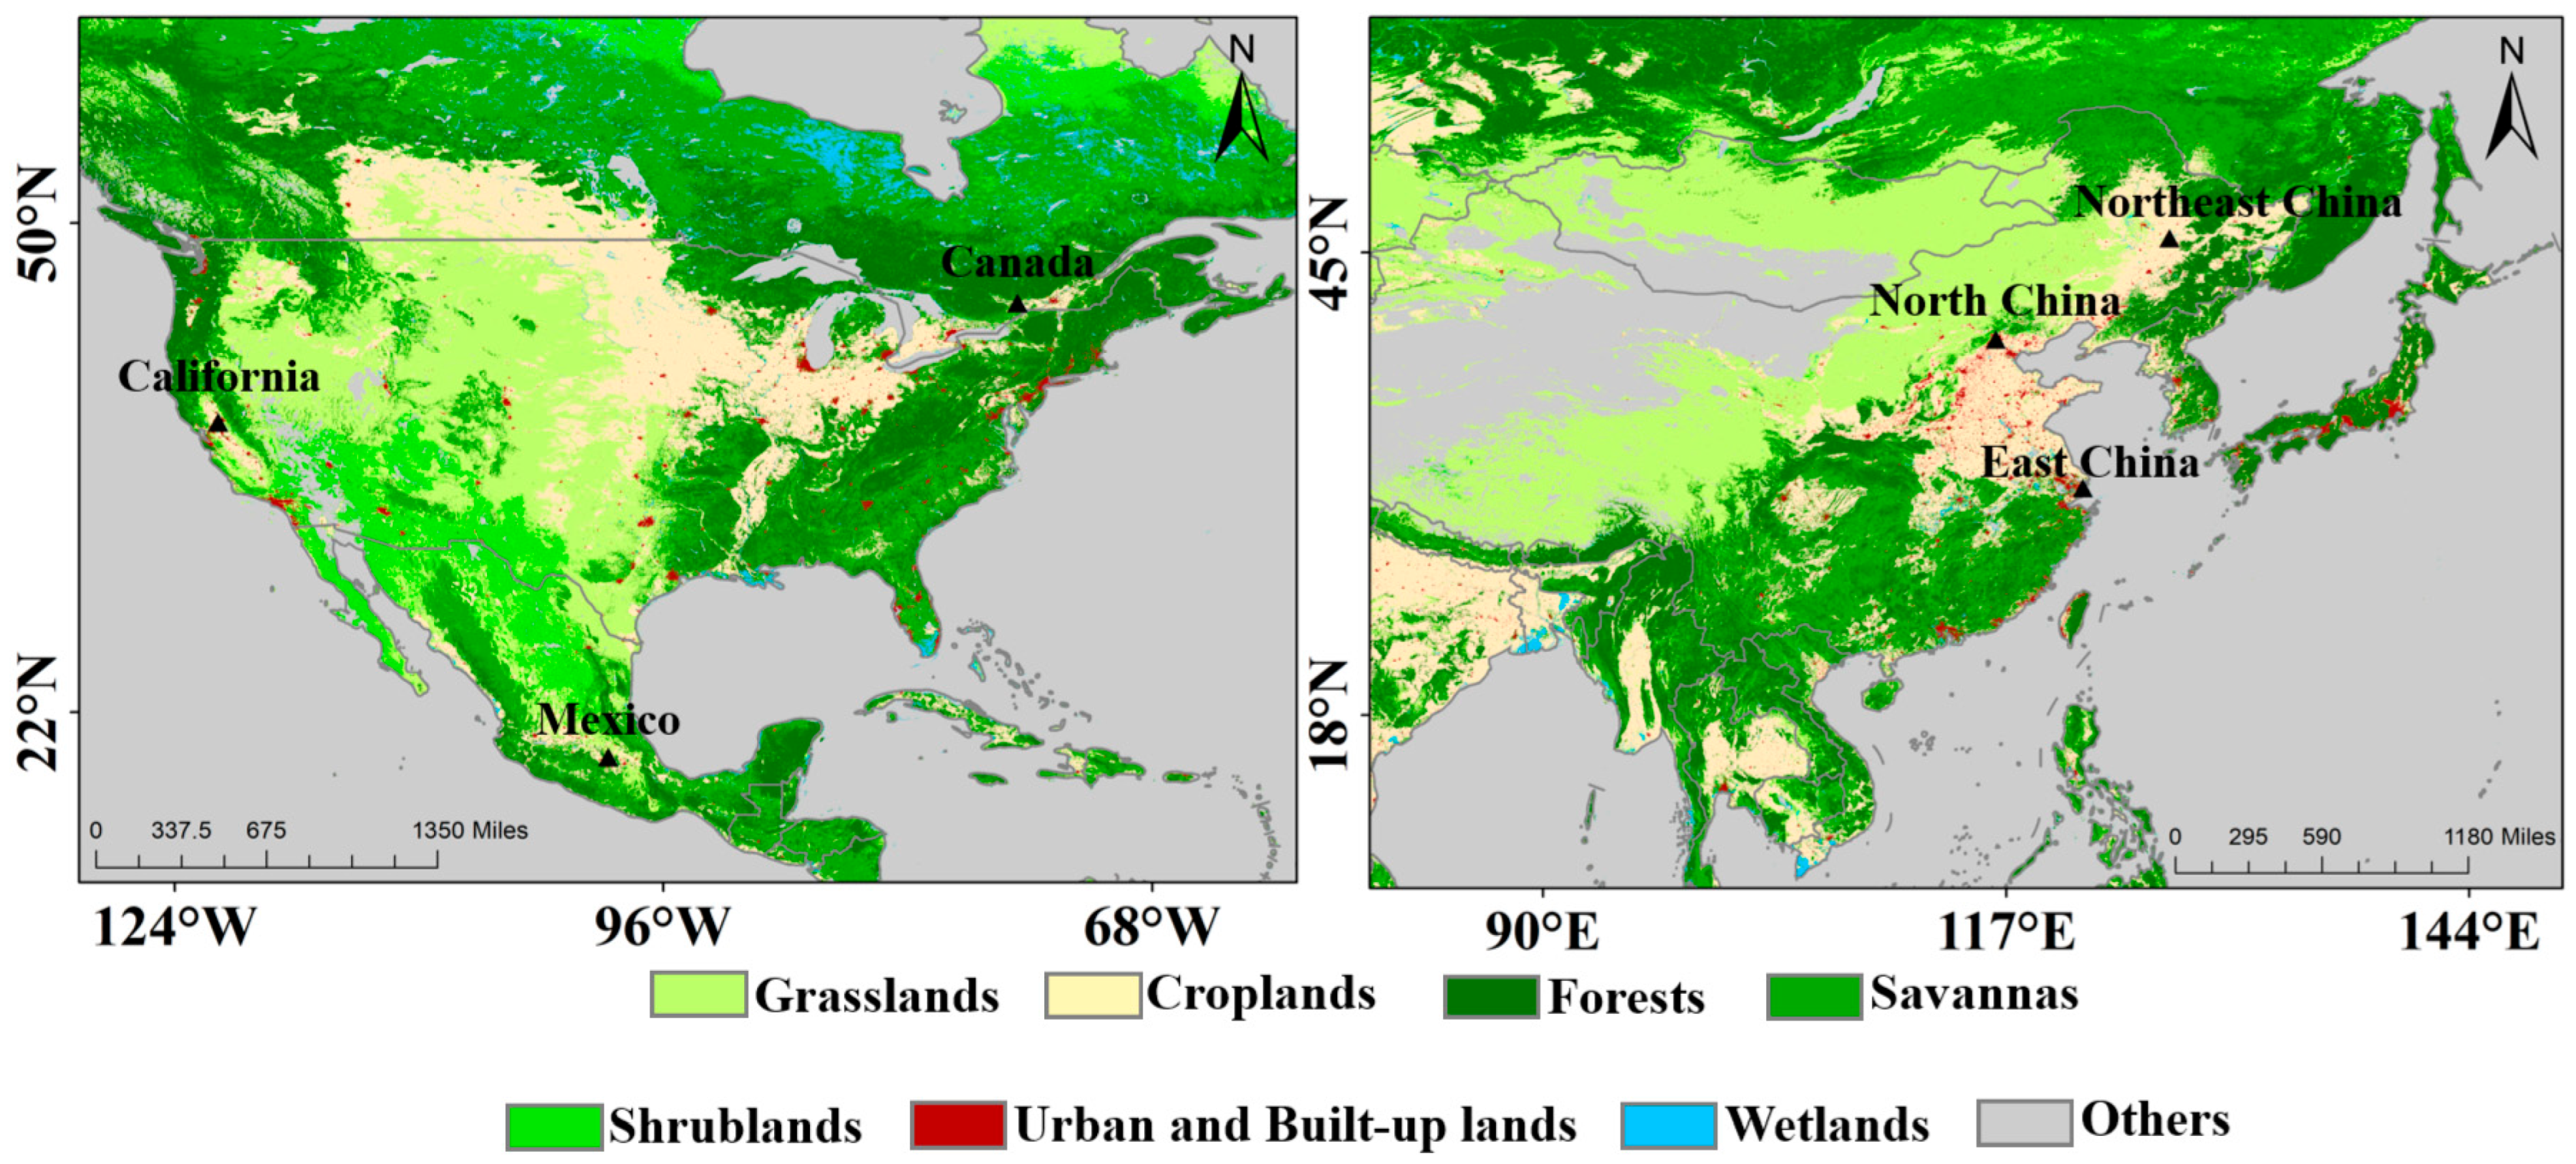
The study focuses on two northern mid-latitude regions: North America (12° N–62° N, 130° W–60° W) and East Asia (8° N–58° N, 80° E–150° E) (Figure 1). These domains fall within the optimal viewing ranges of the geostationary satellites employed in this study, namely GOES-16 ABI over North America and Himawari-8 AHI over East Asia. The selected latitudes minimize satellite viewing angle distortions while capturing climatically distinct fire drivers, from lightning-induced boreal burns to anthropogenic agricultural fires. Both regions encompass the dominant vegetation types in which most mid-latitude fires occur, including cropland, forest, savanna, and grassland.
Figure 1.
Land cover classification of the study areas across North America and East Asia.
2.2. Geostationary Himawari-8 AF Data
The geostationary meteorological satellite, Himawari-8, was launched by the Japan Meteorological Agency (JMA) in October 2014. The Advanced Himawari Imager (AHI) onboard Himawari-8 features 16 spectral channels that span from the visible to the infrared bands. Himawari-8 has a short observation cycle, providing full-disk coverage approximately every 10 min and regional coverage every 2.5 min, which enables the identification and tracking of rapidly changing biomass burning events. The fire detection algorithm utilizes the sensitivity of the 3.9 μm infrared band to high-temperature pixels, combined with the background brightness and temperature from the 11.2 μm mid-infrared band, and utilizes a contextual fire detection algorithm to accurately identify active fires [14]. Himawari-8 AF products provide fire pixel parameters such as fire time, fire location, fire radiative power (FRP), and confidence level. Only medium- and high-confidence fire pixels were used in this study. To avoid repetitive statistics on daily fire occurrences, we only counted the Himawari-8 fire events in the same location on the same day once (https://ftp.ptree.jaxa.jp/, accessed on 1 December 2023). Himawari-8’s high-frequency observations enable effective monitoring of diurnal fire variations, but its 2 km spatial resolution inevitably misses many small agricultural fires. Fires with FRP ≤ 40 MW are still underestimated because the AHI pixel area is four times larger than that of MODIS at nadir [15]. However, the satellite performs best in areas where fire activity is sufficiently dense to surpass its detection threshold.
2.3. Geostationary GOES-16 AF Data
The GOES-16 Advanced Baseline Imager (ABI) active fire product is based on the WildFire Automatic Biomass Monitoring Algorithm (WF_ABBA), a contextual fire monitoring algorithm used to detect and characterize active fires. The Full Disk Coverage product provides fire parameters including fire location, fire temperature, FRP, and a fire mask, each with a spatial resolution of 2 km and a temporal resolution of 5–10 min. The fire mask classifies ABI fire pixels into six categories: treated, saturated, cloud contamination, high probability, medium probability, and low probability. Additionally, the ABI active fire product identifies time-filtered pixels, meaning that a pixel and its surrounding pixels, within the last 12 h, are marked as time-filtered if fire detection is present. In this study, fire pixels with fire masks categorized as 0 and 3 were selected [16]. Specifically, 2 km resolution may limit the detection of small, low-FRP agricultural fires compared to finer-resolution polar-orbiting sensors.
2.4. Polar-Orbiting VIIRS AF Data
As the successor of Moderate-resolution Imaging Spectroradiometer (MODIS), the Visible–Infrared Imaging Radiometer Suite (VIIRS) instrument was launched aboard the Suomi National Polar-orbiting Partnership (S-NPP) satellite (1:30 p.m. overpass) in October 2011. VIIRS features 22 spectral channels spanning the visible-to-longwave infrared regions [17], including dedicated 4 μm bands optimized for fire detection. With higher spatial resolution (375 m), VIIRS can detect much smaller and cooler fires using a similar context detection algorithm as MODIS [18]. These products have been widely used to describe the spatial and temporal variability and trends in fire activities. A key improvement of VIIRS over MODIS is its unique “pixel aggregation” scheme, which significantly reduces the pixel area increase at the edge of the scan. However, limitations remain due to the satellite’s fixed overpass times (~13:30 p.m. and 01:30 a.m.), which may preclude the detection of short-lived fires occurring outside these windows [17].
2.5. GFED and GFAS Emissions Inventory Data
This study compared the combined VIIRS and ABI/AHI FRP-based emission datasets (VIIRS/ABI-Bi and VIIRS/AHI-Bi) with two widely used global fire emission inventories, the Global Fire Emissions Database (GFED) and the Global Fire Assimilation System (GFAS). GFED4.1s incorporates a “small fire boost” based on burned area (BA) detection data, aiming to compensate for the inability of MODIS BA products to detect numerous small fires. GFED5 further improves burned area estimates by fusing MODIS MCD64A1 BA data with high-resolution observations from Landsat and Sentinel-2, applying correction factors for commission and omission errors that vary by region, land cover, and tree cover fraction. As a result, GFED5 provides a more comprehensive record of global burned area, and aligning better with estimates from higher-resolution satellite products [19].
In contrast to GFED, the GFAS v1.2 fire emission database is based on AF detections and is integrated into the Copernicus Atmosphere Monitoring Service (CAMS) system for near-real-time atmospheric composition monitoring and forecasting. The GFAS incorporates global FRP observations from MODIS instruments on board the Terra and Aqua satellites. In GFAS, DMB is derived by regressing FRP observations against GFED-based DMB estimates, allowing daily emissions of 40 species to be calculated at a spatial resolution of 0.1° [8].
2.6. Land Cover Data
The 2019 MODIS global land cover product (MCD12Q1), with a spatial resolution of 500 m, was employed to classify land types and allocate thermal anomalies within the study area. The land cover product has been globally validated, with an overall accuracy of 73.6% [20]. The International Geosphere-Biosphere Program (IGBP) classifies land cover into 17 categories, which were further merged to yield eight surface types for this analysis. It is worth noting that the MCD12Q1 product exhibits reduced classification accuracy in parts of East Asia, where fragmented croplands can be misidentified as savannas. While this limitation may lead to a potential overestimation of savanna fires in the region, the impact on our analysis is mitigated by the study’s primary focus on relative diurnal patterns rather than absolute magnitudes. Future work could incorporate higher-resolution regional land cover datasets, such as FROM-GLC or the ESRI 10 m Land Cover, to further refine land cover assignment.
3. Methodology
3.1. Data Gridding
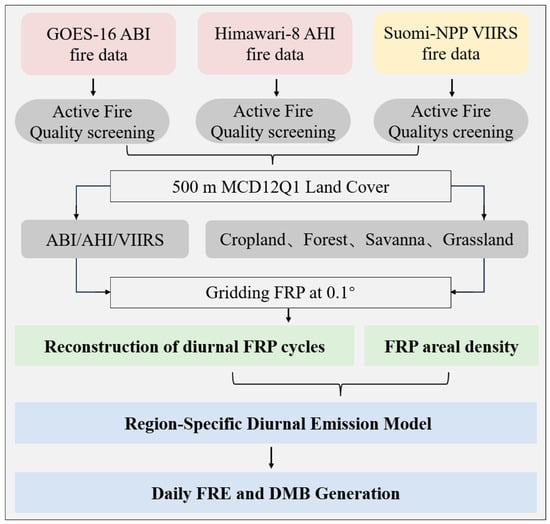
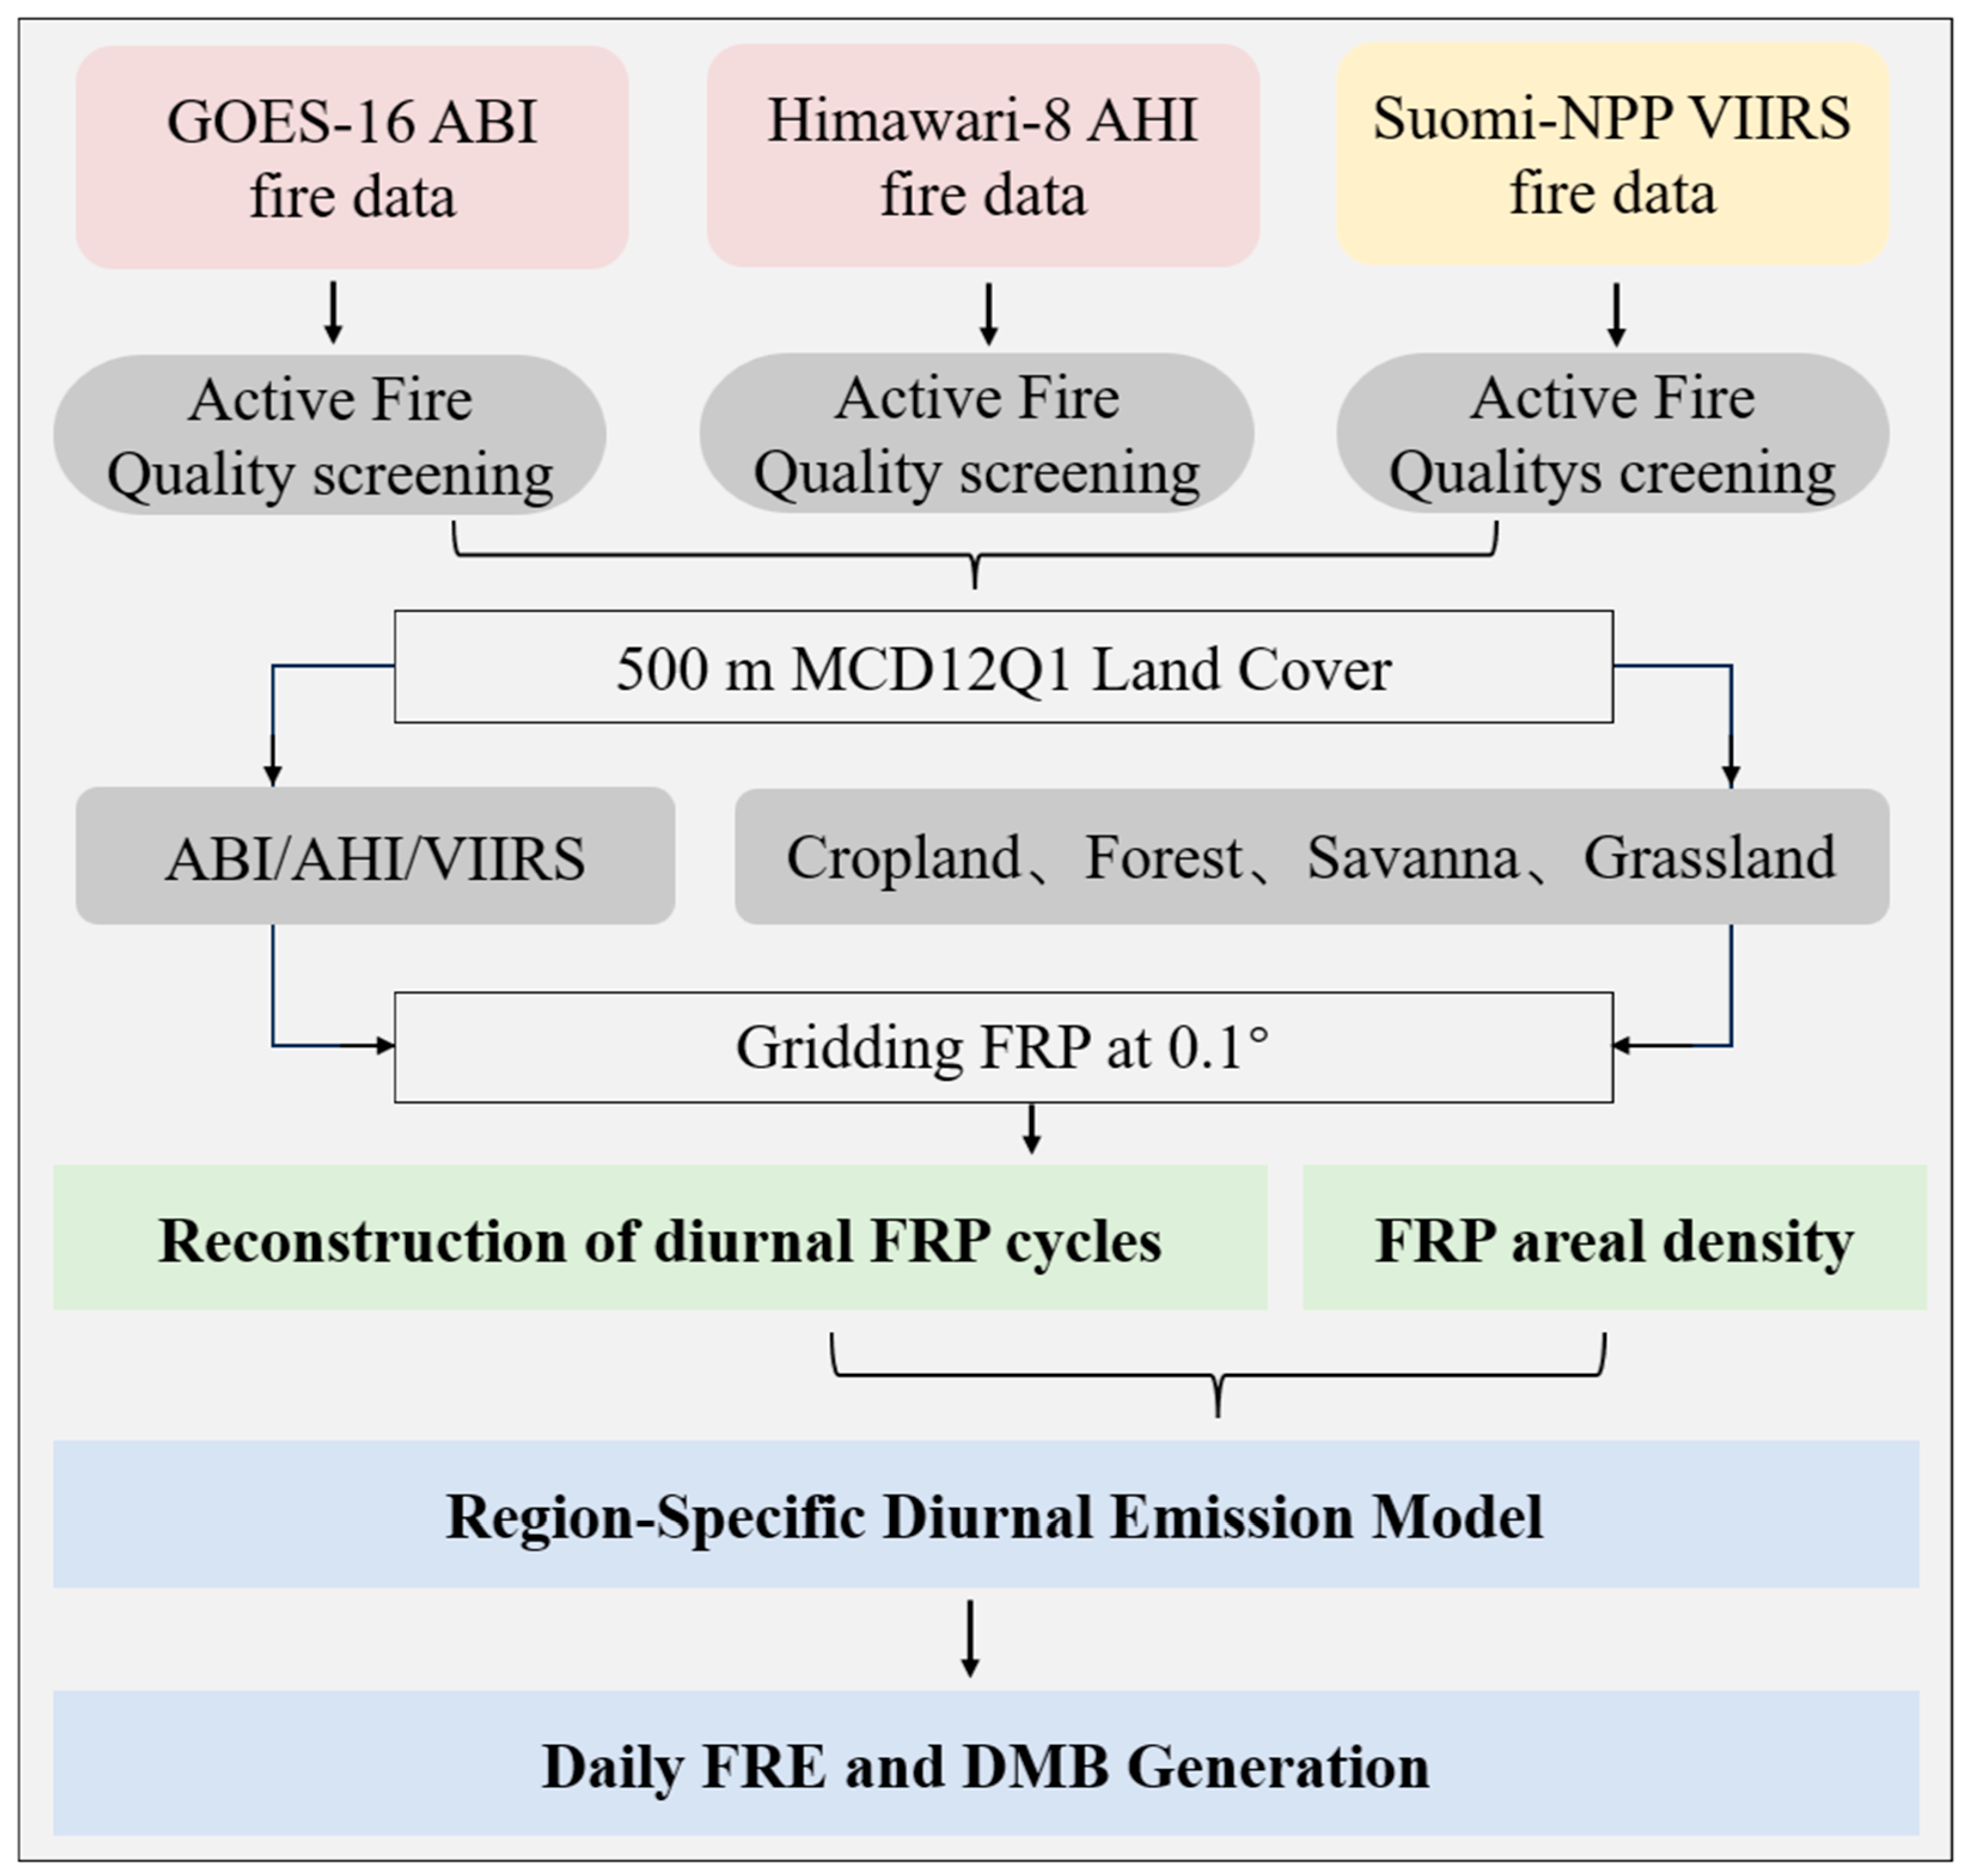
Building on the FRP method developed by Kaiser [8], this study integrates twice-daily VIIRS FRP observations with diurnal fire cycle information derived from Geostationary satellite (Figure 2) [8,12]. This integration explicitly accounts for differences in spatial resolution, saturation characteristics, and viewing geometry between sensors. For example, geostationary sensors’ large scan angles increase pixel area and reduce FRP, whereas VIIRS pixel aggregation limits this to a 4× increase. VIIRS is used for precise small-fire detection and FRP quantification, while ABI/AHI is used for capturing diurnal cycles via Gaussian blending of normalized FRP.
Figure 2.
Flowchart for fusing VIIRS, GOES-16, and Himawari-8 fire detections to generate fire emission inventory.
Data are presented separately or as normalized density to mitigate biases. First, VIIRS FRP data were aggregated into 0.1° grid cells, and the dominant land cover type within each grid was identified using MCD64A1 data, including grassland, cropland, forest, and savanna. Since the overall effect of cloud cover fractions in some grid cells was found to be relatively minor [12], it was not included as a correction factor, and the mean areal density (MW km−2) across the study area was directly calculated for each grid cell.
where and denote the day-time (~13:00 LST) and night-time (~01:00 LST) gridded areal density (MW km−2), respectively. The total observed present in each 0.1° grid cell was calculated from the cumulative of all native-resolution AF pixels within the grid cell. indicate that the area of different vegetation types observed within each 0.1° grid cell.
3.2. Reconstruction of Diurnal FRP Cycles
The real-time diurnal variation in provides the foundation for accurately estimating fire emissions. To extract representative diurnal fire cycles, hourly values were aggregated across all days and grid cells and subsequently normalized to minimize day-to-day variability in fire activity. Using ABI/AHI FRP observations from 2018 to 2020, we derived weighted mean diurnal for different land-cover types in North America and East Asia [12].
where denotes the normalized fire activity at hour . The term represents the total at hour aggregated across all days and grid cells within the study region. Note that is in local time (UTC-based), and the diurnal cycle spans 00:00–23:00.
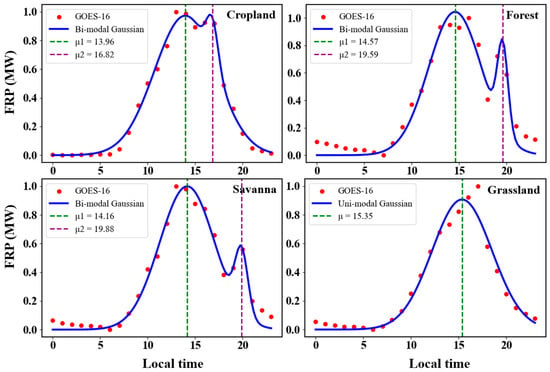
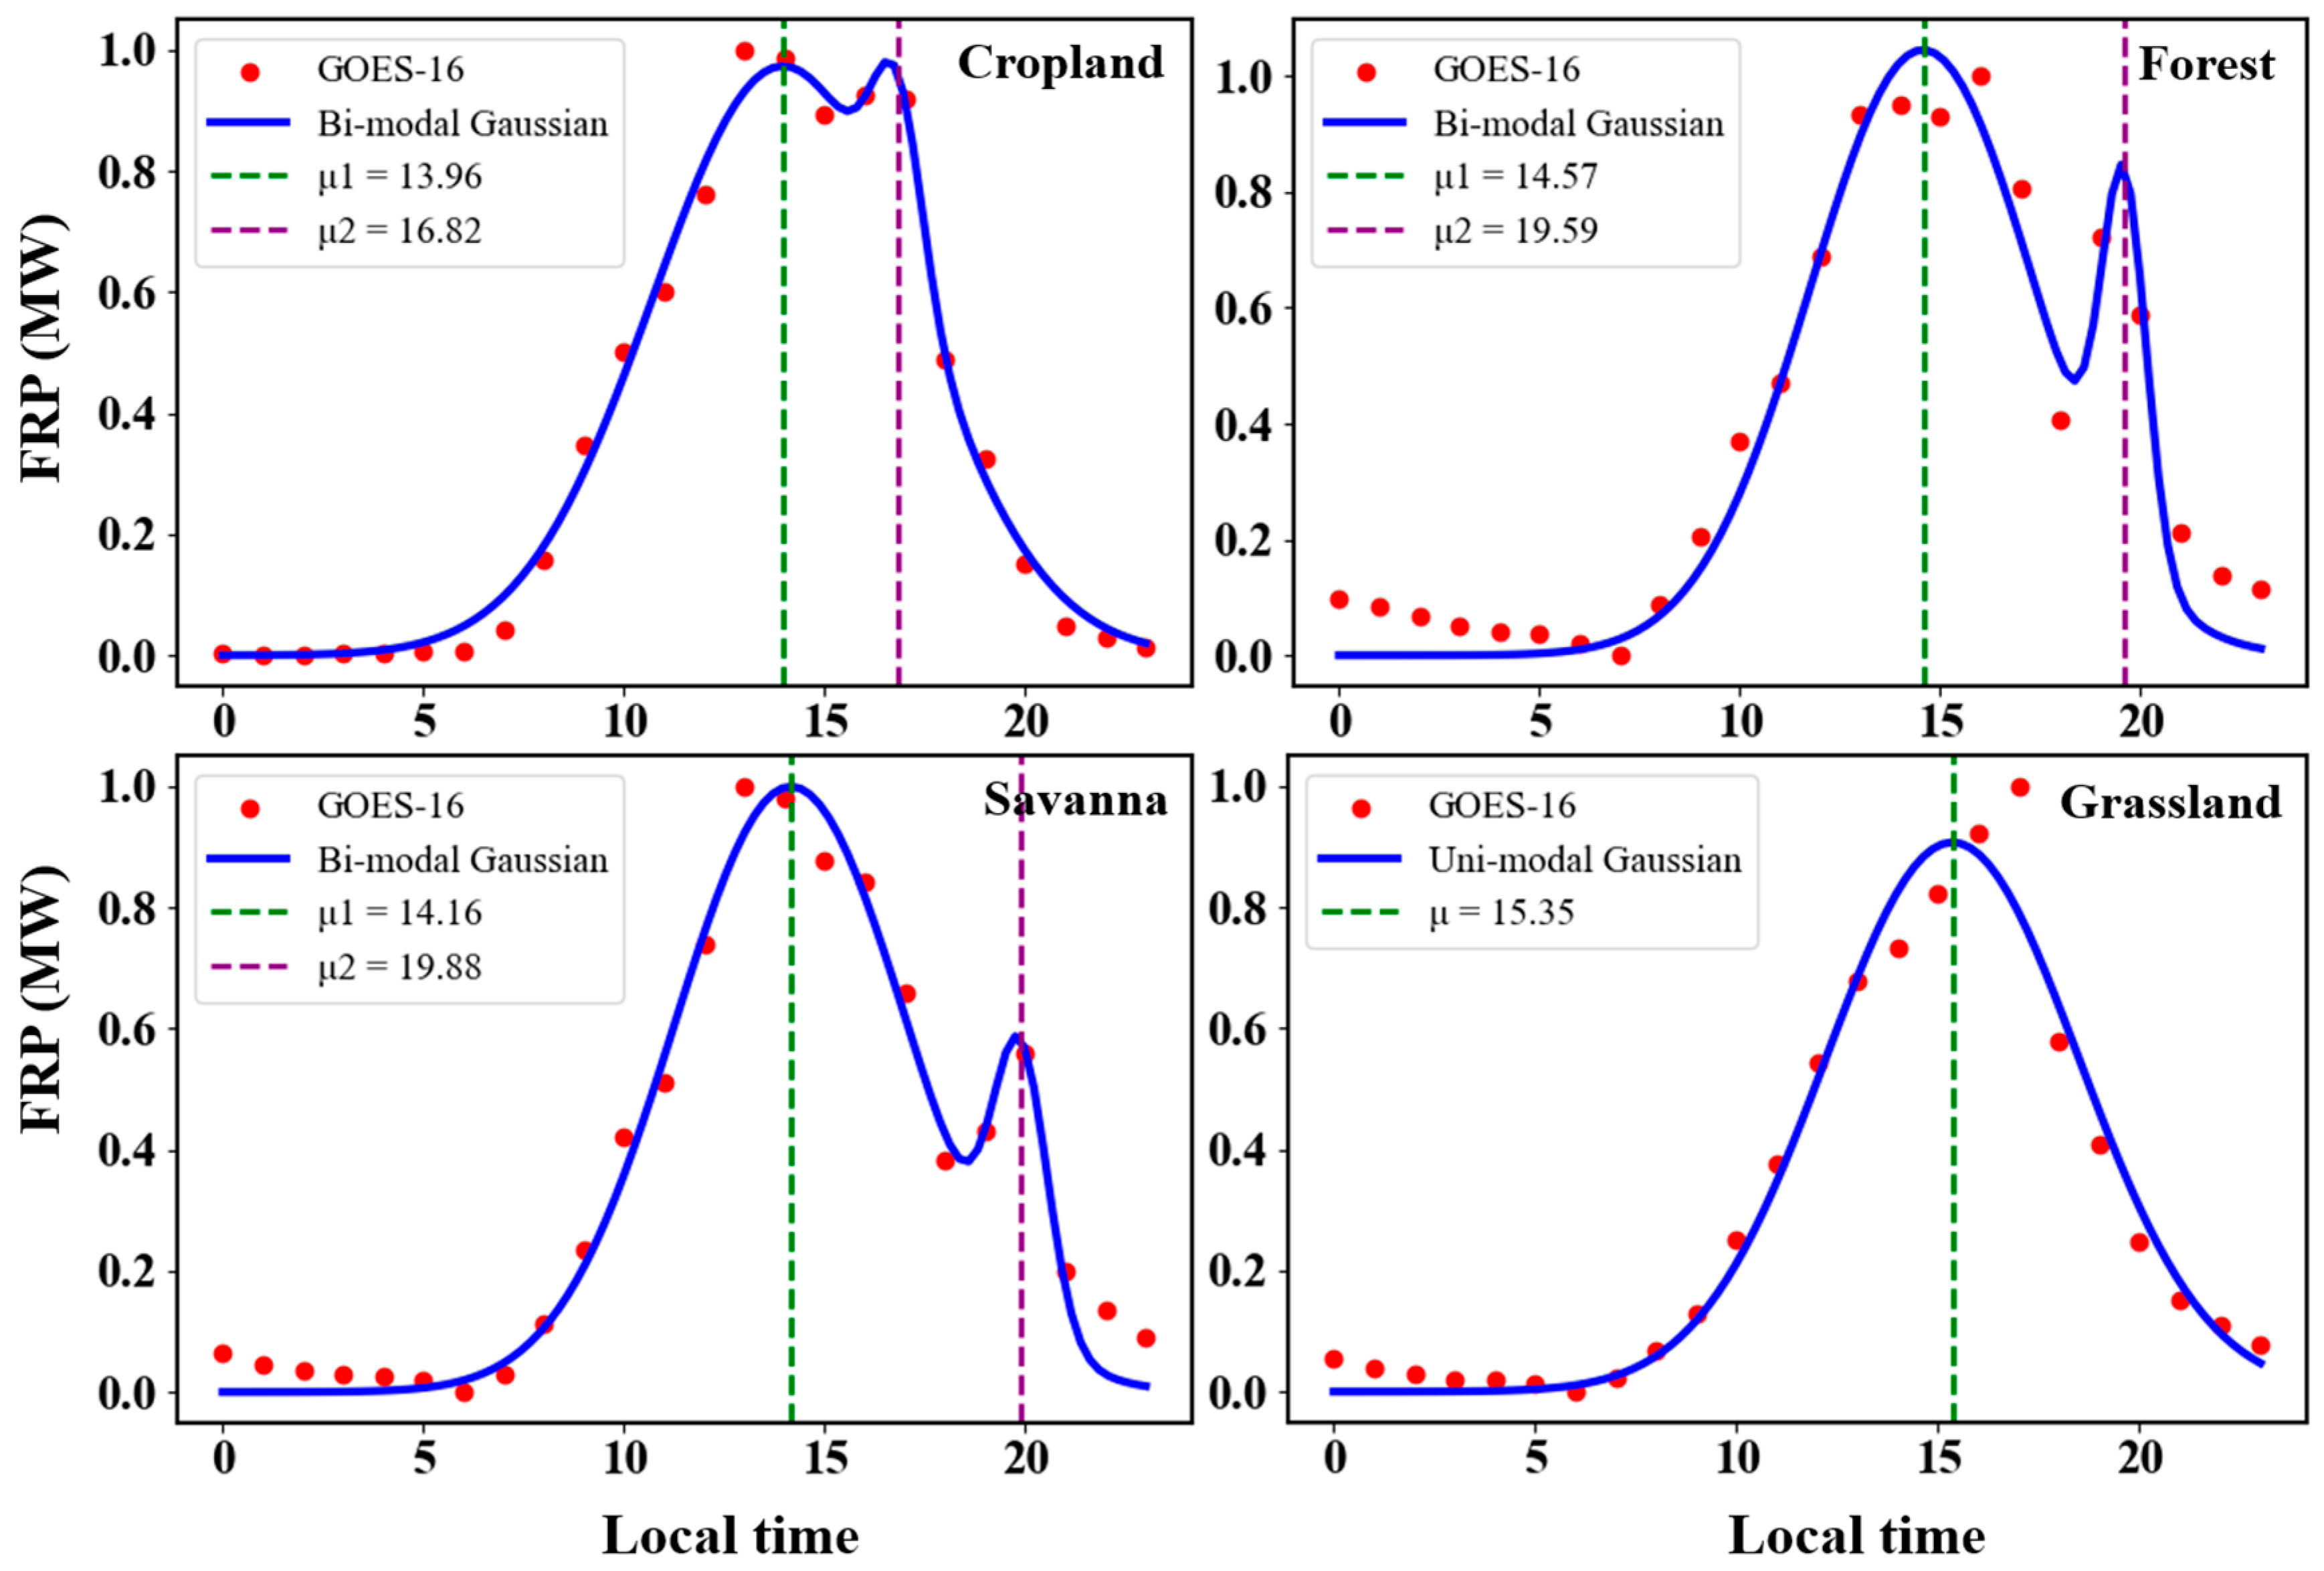
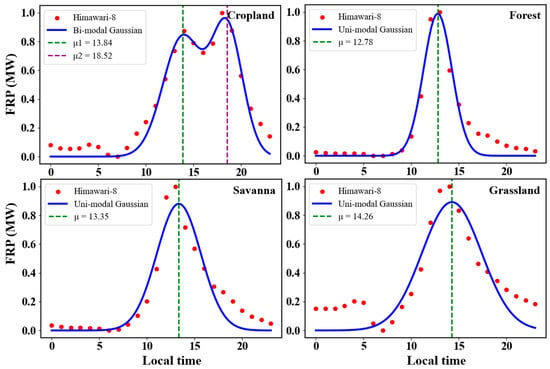
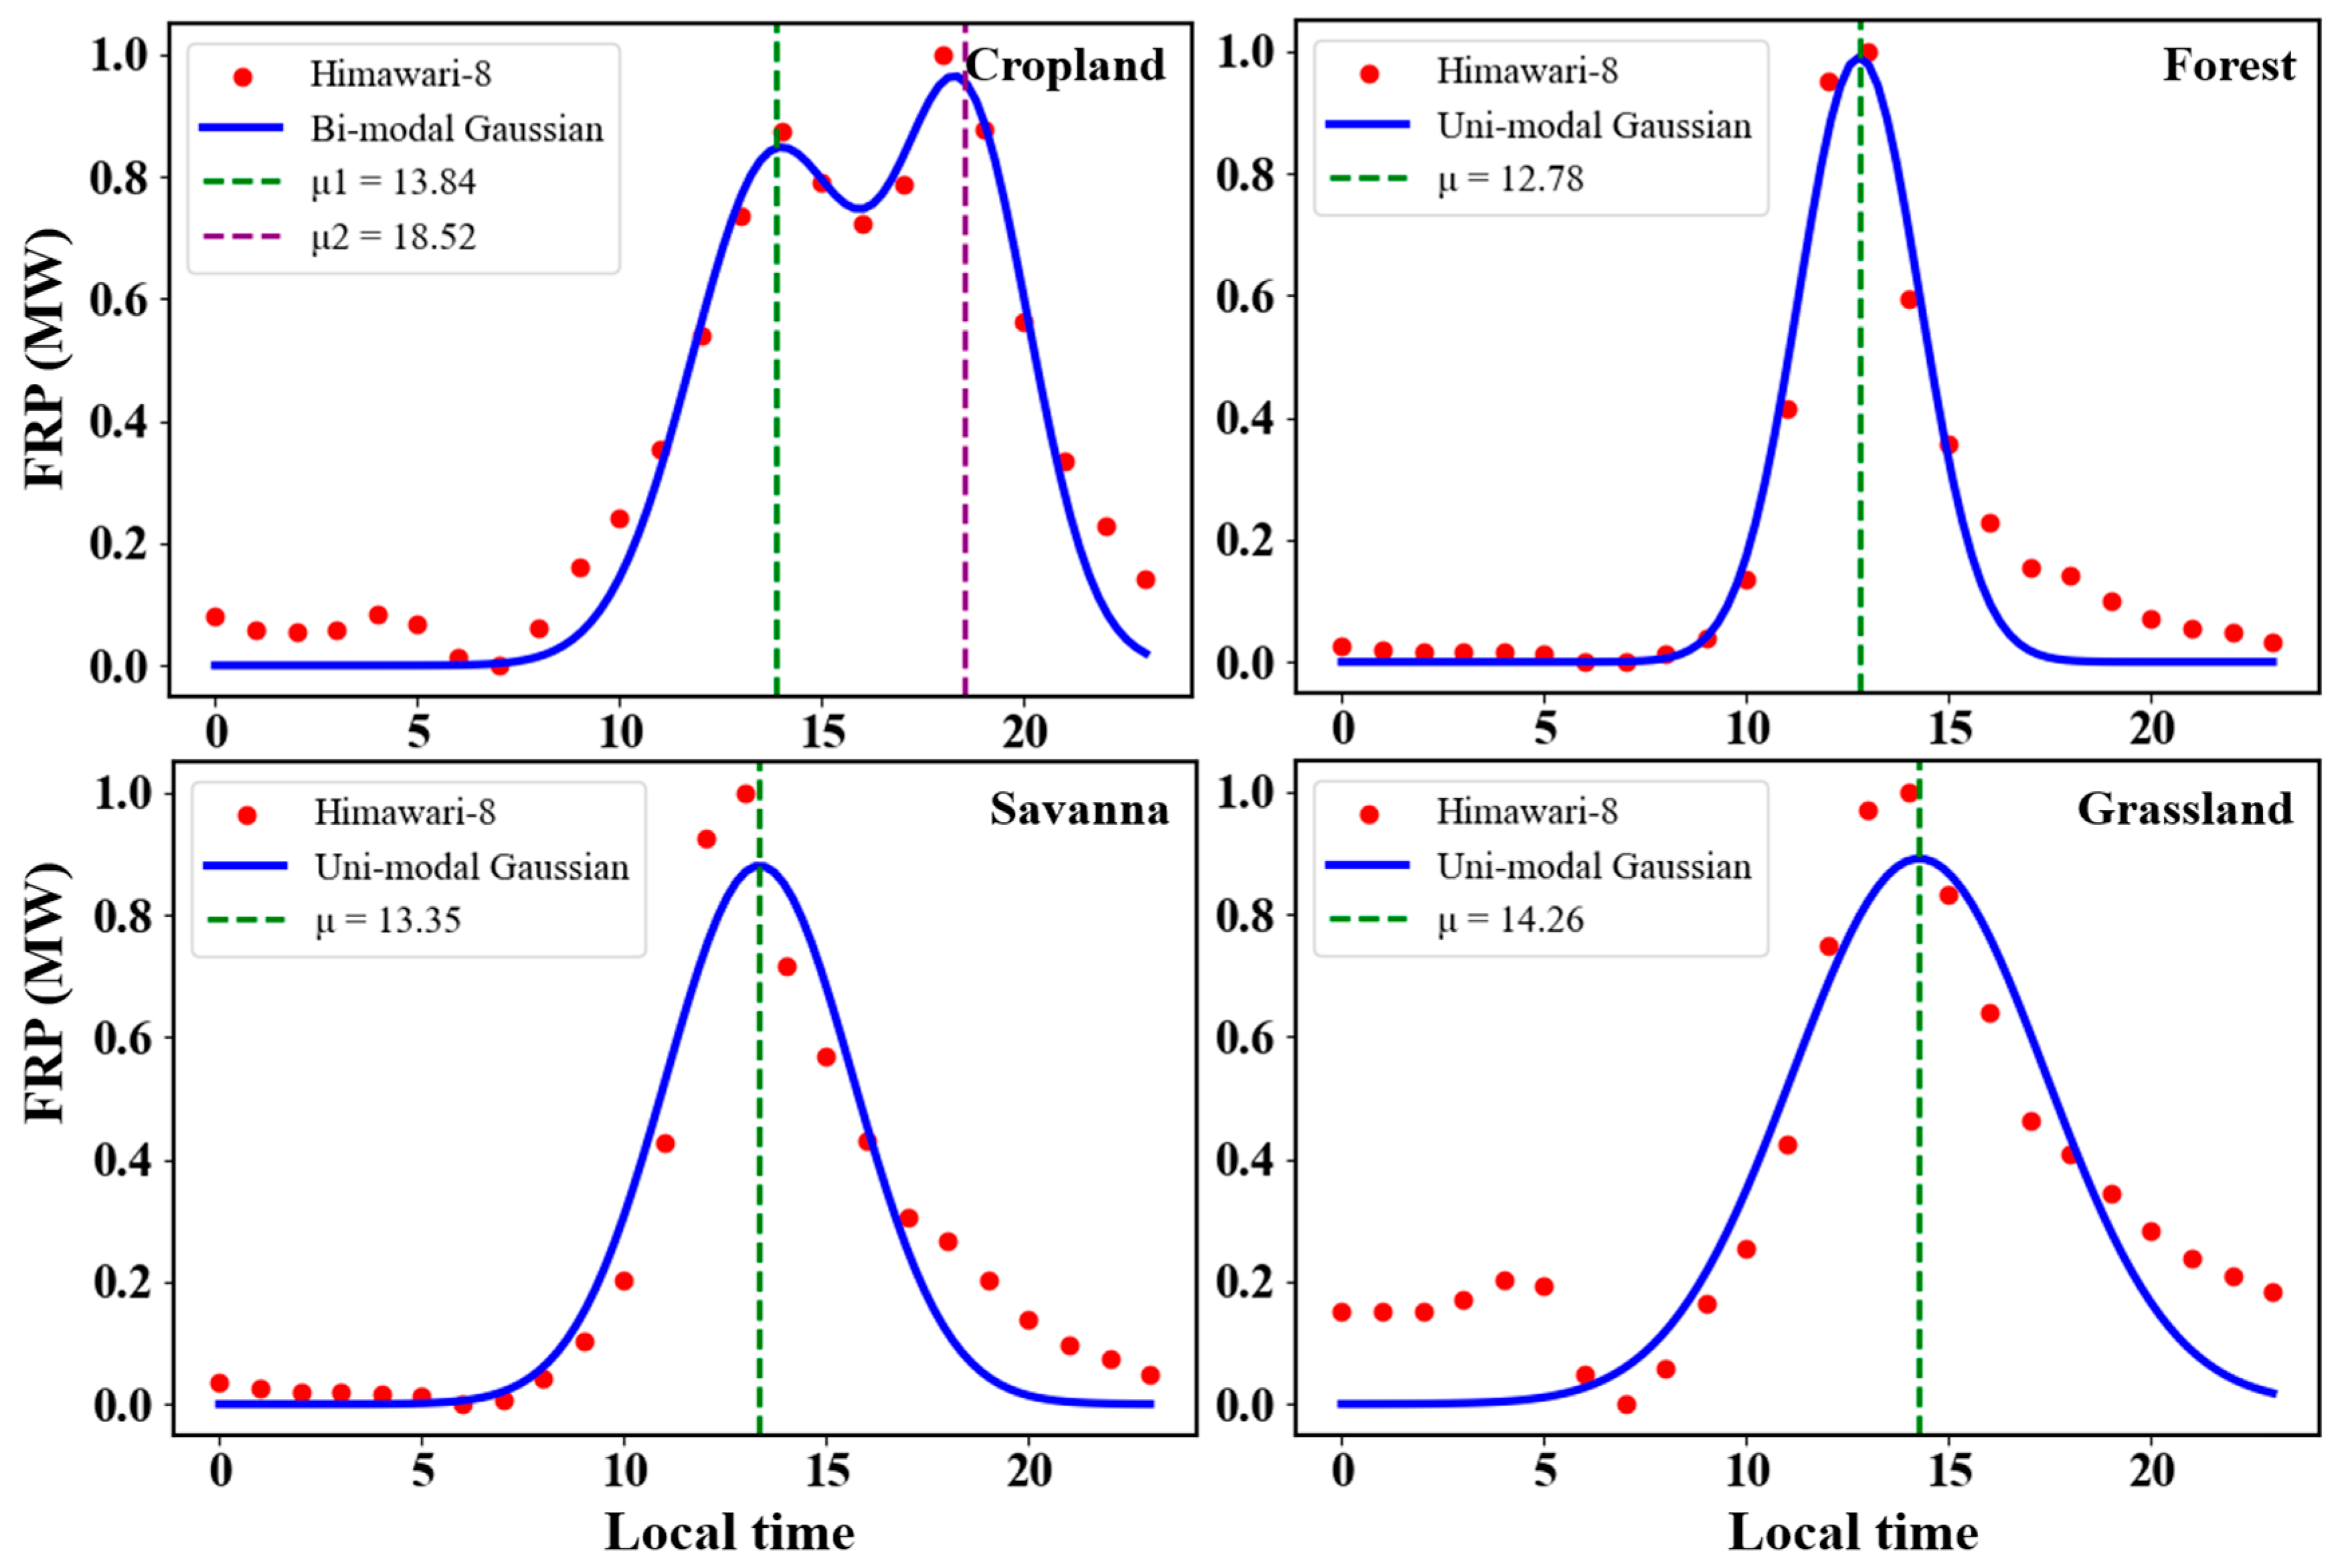
As shown in Figure 3 and Figure 4, in North America, fires in croplands, forests, and savanna exhibit a bimodal diurnal pattern, while in East Asia, cropland fires also show a bimodal distribution. In contrast, grassland fires in North America, as well as grassland, forest, and savanna fires in East Asia, display a unimodal, near-Gaussian diurnal distribution. Notably, the Gaussian functions fitted by Zhang et al. also reveal a bimodal structure; although the second peak contributes only about 20%, its influence was nonetheless overlooked in their analysis [12]. Table 1 summarizes the mean and standard deviation of the fitted Gaussian functions obtained using nonlinear least squares applied to the ABI and AHI FRP data (2018–2020), providing a quantitative characterization of the diurnal fire cycles.
Figure 3.
Time series of hourly normalized FRP derived from GOES-16 FRP data over North America at 0.1° for 2018–2020. The blue curve shows the best fit of the Gaussian distribution.
Figure 4.
Time series of hourly normalized FRP derived from Himawari-8 FRP data over East Asia at 0.1° for 2018–2020. The blue curve shows the best fit of the Gaussian distribution.
Table 1.
Gaussian fitting parameters of FRP diurnal variation.
Here, the observed diurnal fire cycle was modeled using a modified Gaussian function to develop a region-specific diurnal emission model. By integrating the diurnal cycle of ABI/AHI FRP with the twice-daily VIIRS FRP areal density data, we constructed the VIIRS-ABI/AHI dataset across different land-cover types in North America and East Asia.
For a given grid cell at instantaneous target time , VIIRS-ABI/AHI FRP areal density is calculated by:
where is the estimated instantaneous areal density (MW km−2) for grid cell at target time . and are the observed VIIRS areal densities from the nighttime and daytime overpasses, respectively; is an adjustment factor used to account for the discrepancy between the VIIRS daytime overpass time and the peak time of the fire diurnal cycle. is the peak hour of the i-th mode of the diurnal fire cycle derived from ABI/AHI observations (Table 1), and is the local time of the daytime VIIRS observation for grid cell . σi is the Gaussian parameter of the i-th mode, obtained by fitting a modified Gaussian function to the ABI/AHI FRP diurnal cycles.
To avoid double-counting contributions from both peaks, we identify the time t_k at which the fitted bimodal diurnal curve reaches its local minimum between the two peaks. For any target time ≥ t_k, the instantaneous is calculated using only the parameters of the second mode (i = 2).
3.3. Daily FRE and DMB Generation
Finally, we integrated the for each grid cell j to estimate the total daily value and applied a conversion factor (0.368 kg MJ−1) to compute the dry matter burned (DMB) [9]. To ensure comparability across different datasets, DMB was used as a standardized parameter and compared with the GFAS and GFED inventories.
DMB = FRE × 0.368 (±0.015)
4. Results
4.1. Comparison of Different Biomass Combustion Types
We used the 2019 500 m MCD12Q1 global land cover product for biomass community classification and thermal anomaly type differentiation. We identified reclassifications between different surface types, distinguishing thermal anomalies into eight categories. Those detected on urban and synthetic surfaces were identified as industrial heat sources [21], while anomalies on permanent snow and ice, barren, and water bodies were grouped into a minimal occurrence category. Thermal anomalies associated with other biomass communities were classified as biomass burning. Due to the different sizes of the two study areas, to visually compare the differences in the types of thermal anomalies between the North America and East Asia, we analyzed them from both horizontal and vertical perspectives. In North America, among the land-cover types where fires can occur, savannas cover the largest area, followed by grasslands (Figure S1).
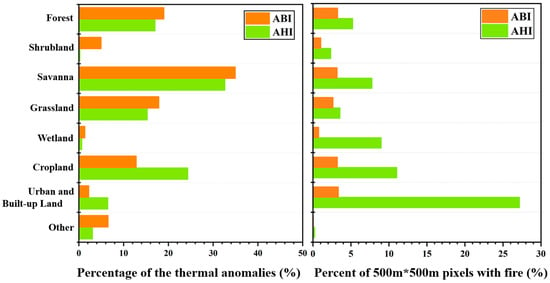
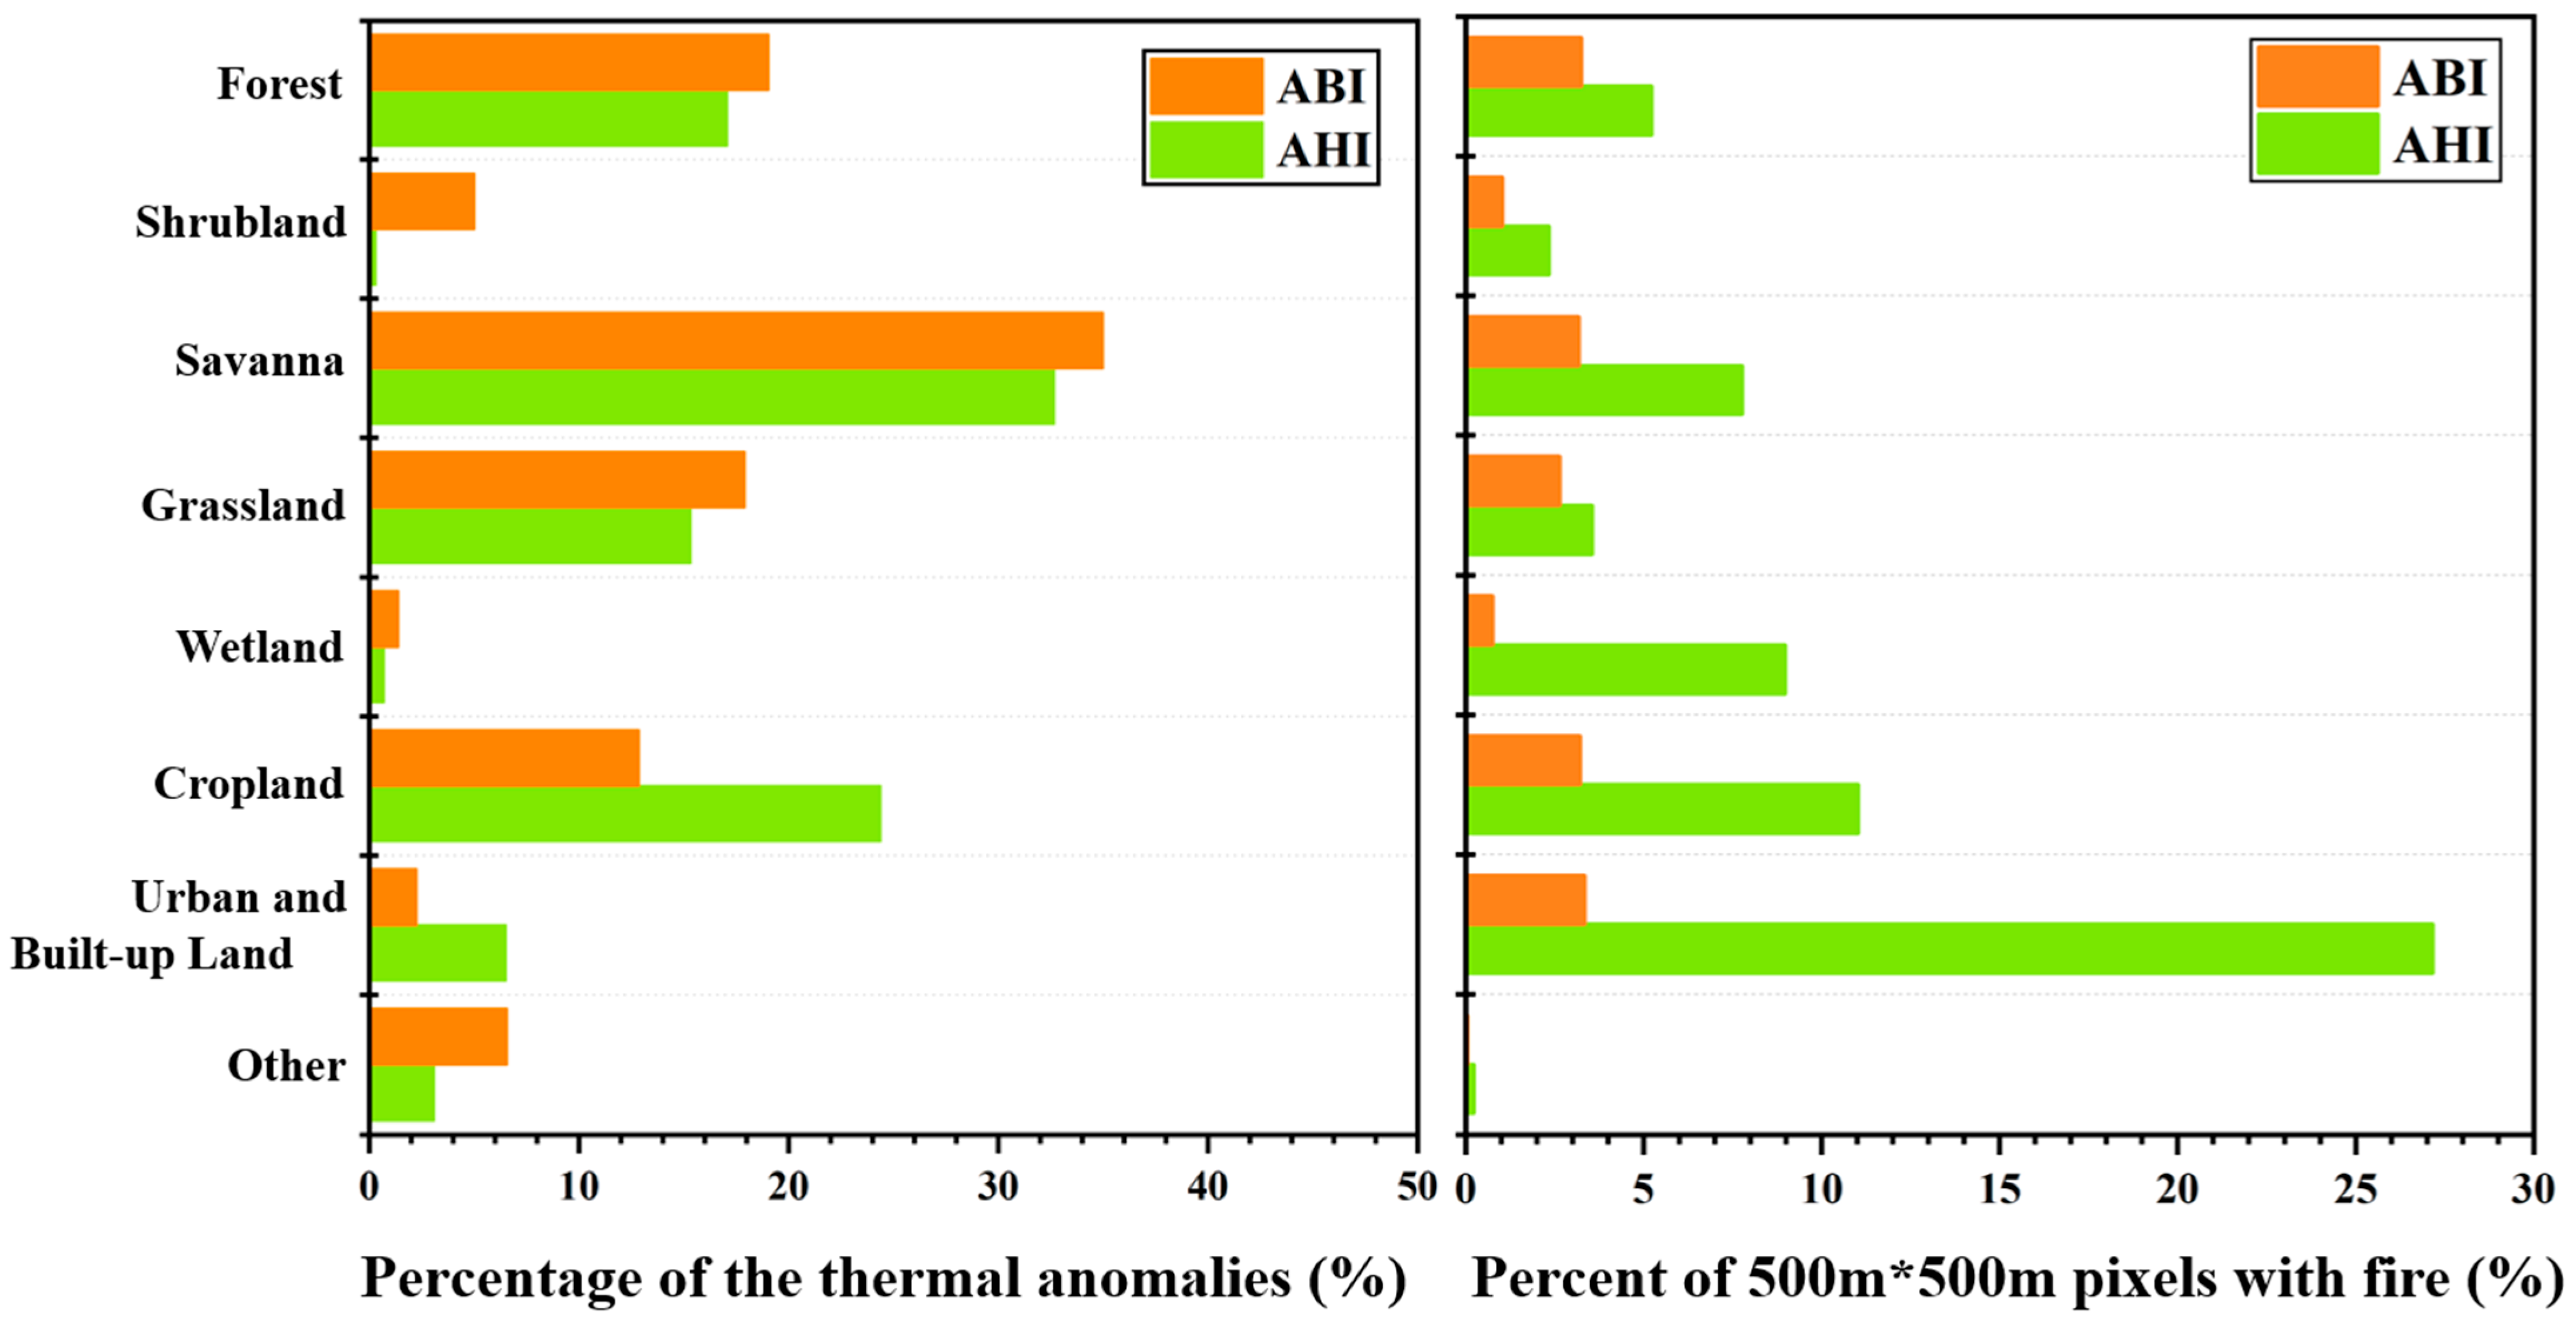
A separate longitudinal comparison of the two study areas (Figure 5) yielded that the dominant thermal anomaly type in North America was savanna (37.2%), followed by forest (21.4%), grassland (17.9%), and agricultural land (16.9%). Similarly, the highest percentage of thermal anomalies in East Asia was tropical savanna (30.9%), followed by agricultural land (25.1%), forest (18.6%), and grassland (15.6%). In East Asia, the land-cover type with the largest area of potential fire occurrence is grassland, followed by savannas (Figure S1).
Figure 5.
(left,right) percentage of satellite thermal anomalies over typical surface types and proportion of each surface type covered by thermal anomalies during 2018–2020. Others indicate the land cover type of Permanent Snow and Ice, Barren, and Water Bodies.
In comparing the thermal anomaly distribution between the two regions, we analyzed the proportion of each land cover type affected by thermal anomalies [22] and the thermal anomaly density per 500 m × 500 m pixel (Figure 5). The results reveal that East Asia exhibits a higher frequency density of thermal anomalies across all land cover types compared to North America. This disparity may be attributed to differences in human activities driven by economic factors. In East Asia, industrial heat sources contribute the most to the frequency density of thermal anomalies, followed by agricultural land, which is associated with frequent farming activities and residue burning. Conversely, North America demonstrates lower and more uniform thermal anomaly densities, primarily due to the widespread use of prescribed burns. A small proportion of thermal anomalies in North America are attributed to wildfires caused by lightning.
4.2. Spatial and Temporal Distribution of Vegetation Fire
To explore the diurnal pattern of fire activity, we used geostationary satellite data collected in North America and East Asia from 2018 to 2020. While cloud cover can affect the detection efficacy of active fire products, burning activity can still be identified under thin cloud conditions [23]. Further research indicates that many tropical regions are cloud-free for over six months of the year, whereas cloud cover in temperate and boreal regions is often prolonged [22]. This phenomenon is extremely common in the Northern Hemisphere and does not have a large impact on regular variability due to the large number of samples present.
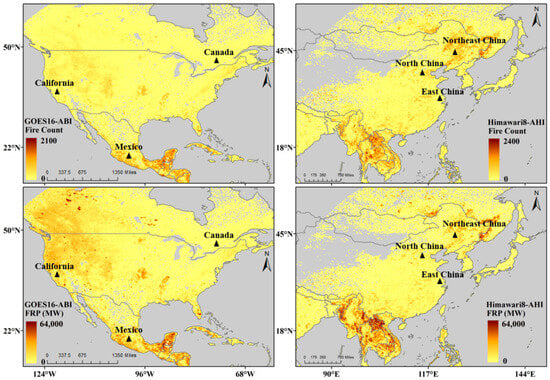
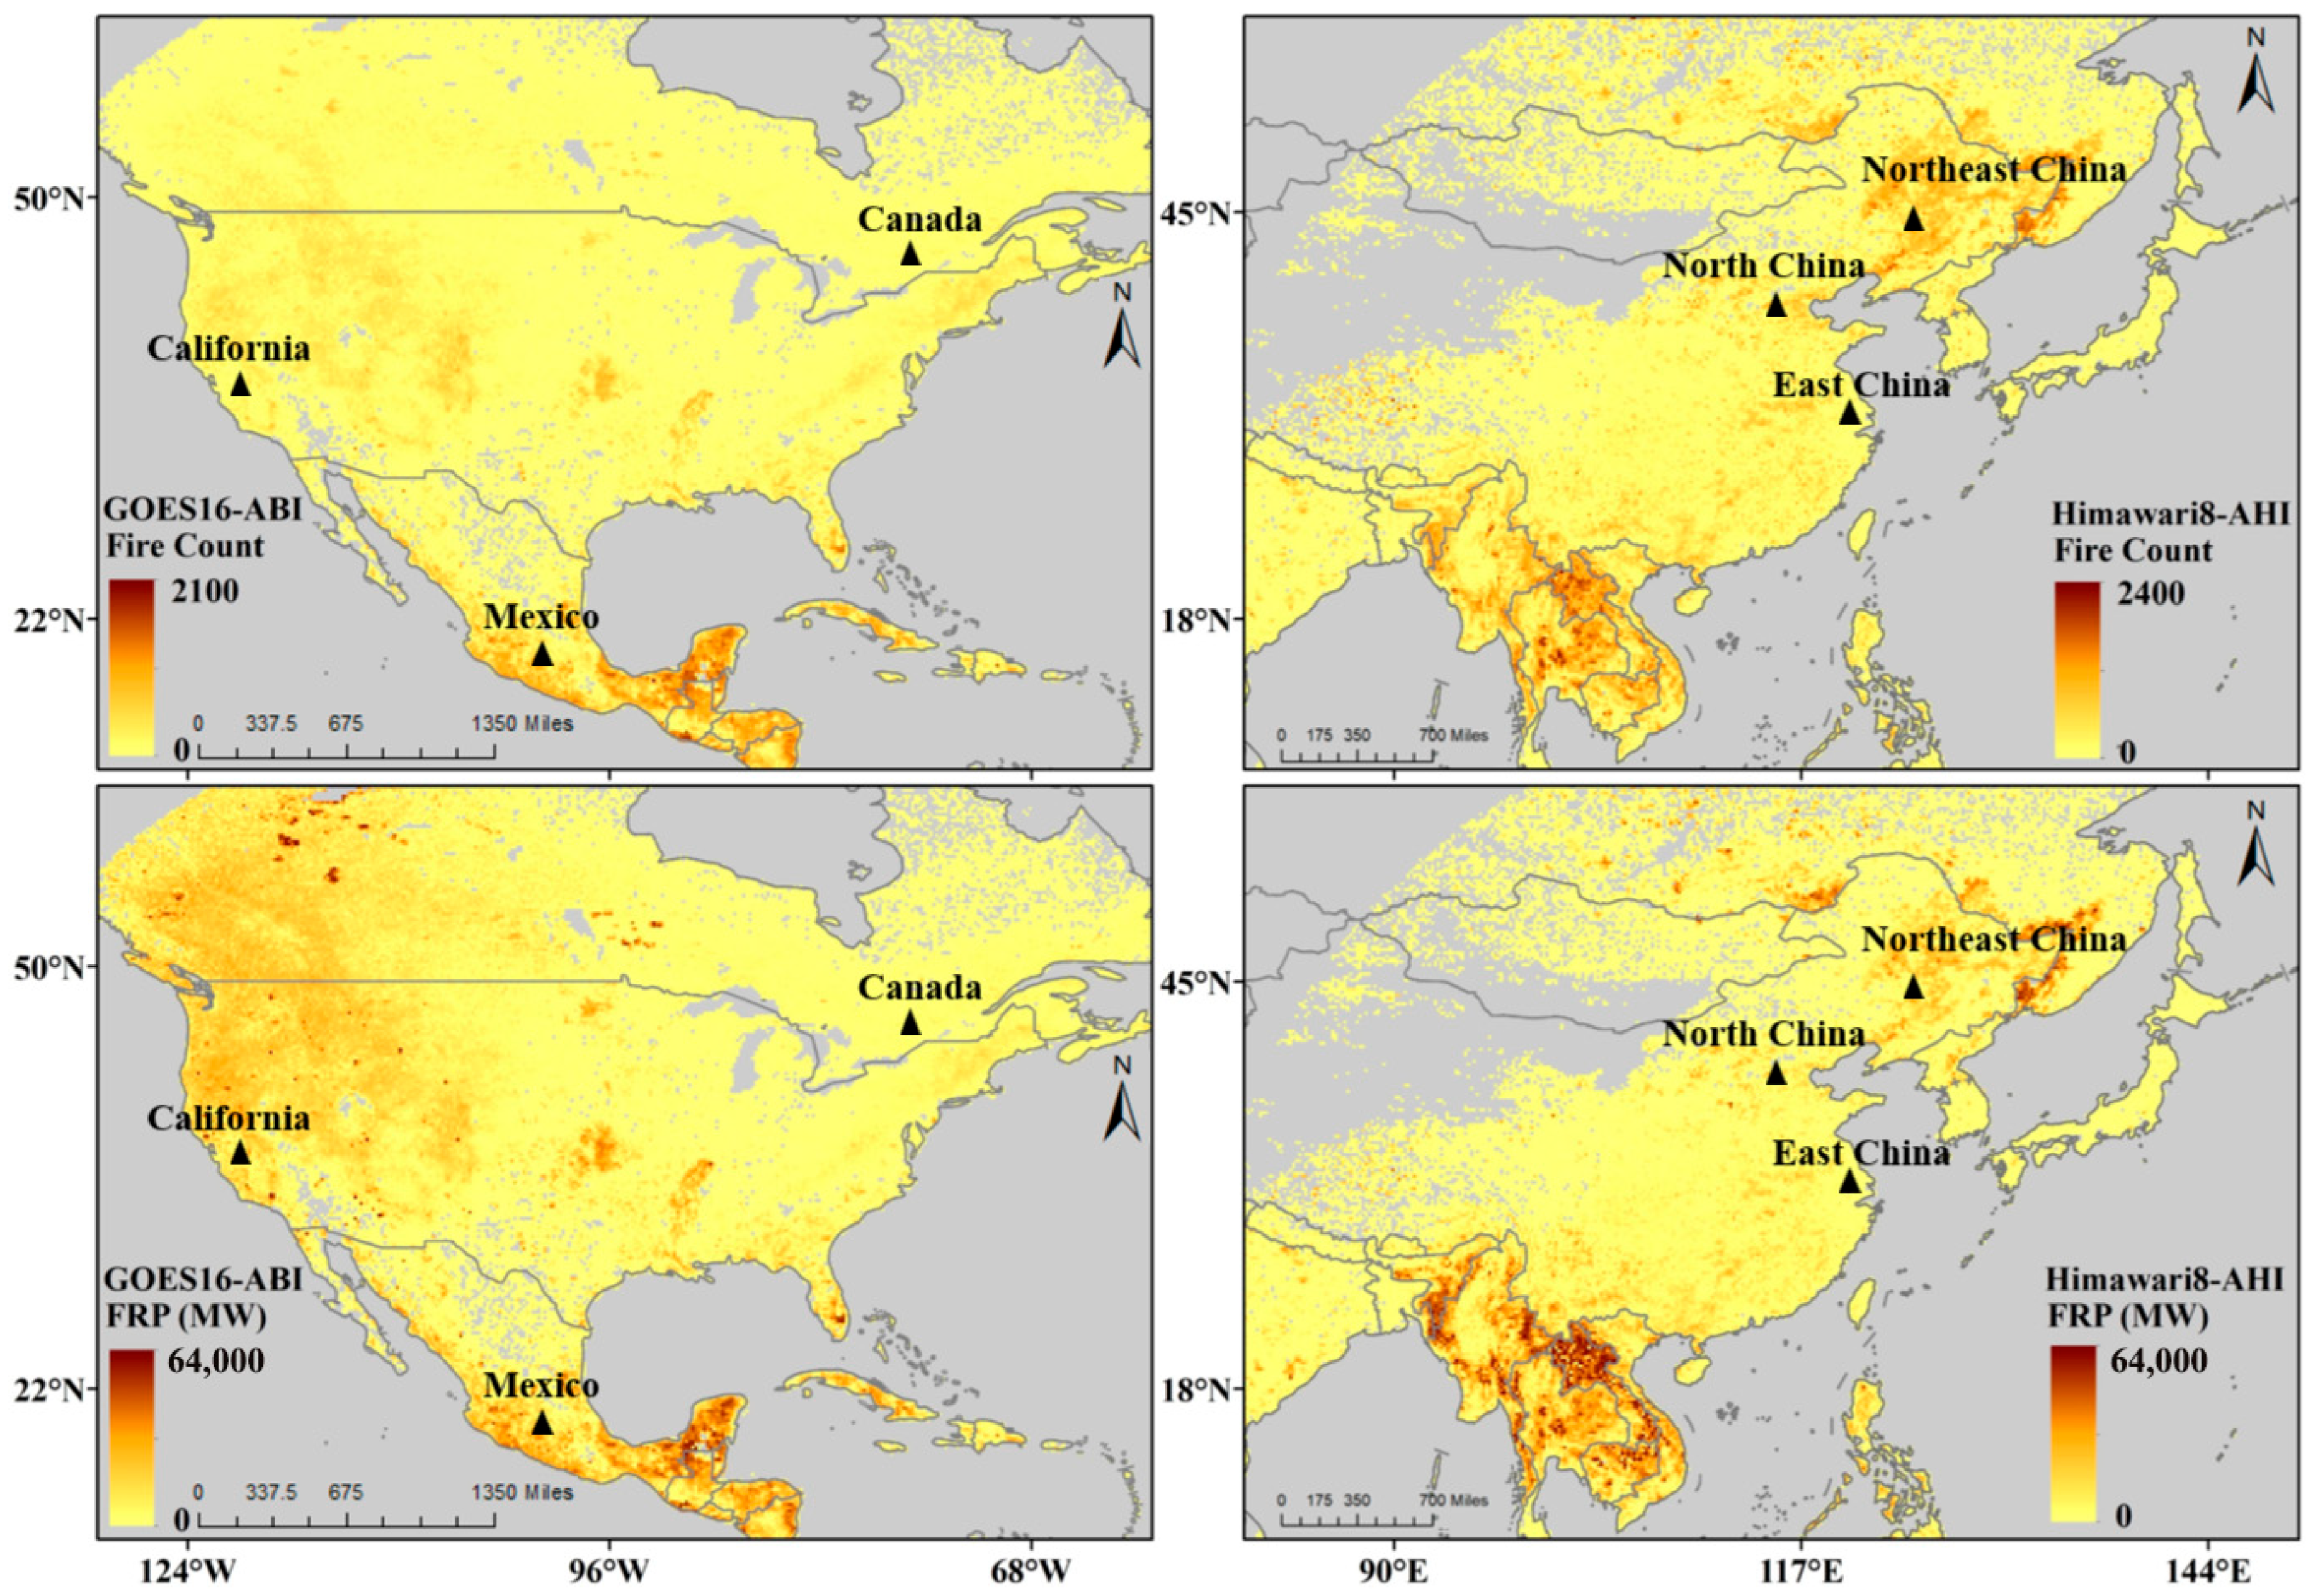
The spatial distribution of the average counts of vegetation fire and FRPs detected in North America and East Asia from 2018 to 2020 (Figure 6). The fire counts respond to the fact that most vegetation fires are located within or near the tropics, which are the most heavily burned areas, including southeastern Mexico, and Southeast Asia. The primary active burning zone in temperate regions includes the west coast of North America, stretching from British Columbia, Canada, through Washington state and down to California, as well as parts of central United States near Kansas and Arkansas. Meanwhile, heavily burned events are also found within Heilongjiang Province, along its borders, and in other areas of Northeast China. This spatial pattern may be related to climate, ecological regimes, and human activities. Due to the relatively dry climate and dense Forest and Savanna in the U.S. and western Canada, FRP is relatively high at lower fire frequency [24]. In contrast, individual fire events in northeastern and eastern China release lower fire radiative energy but have high fire frequency, which is often associated with agricultural activities [12,25].
Figure 6.
Spatial distribution of average annual fire frequency and FRP in North America (left) and East Asia (right) during 2018 to 2020.
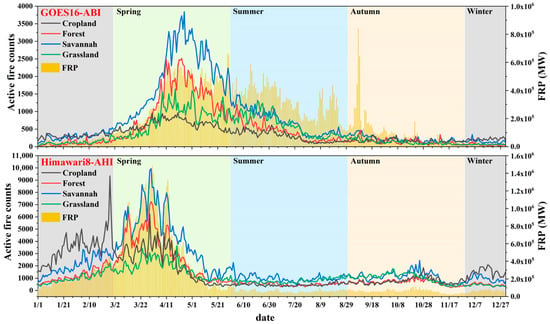
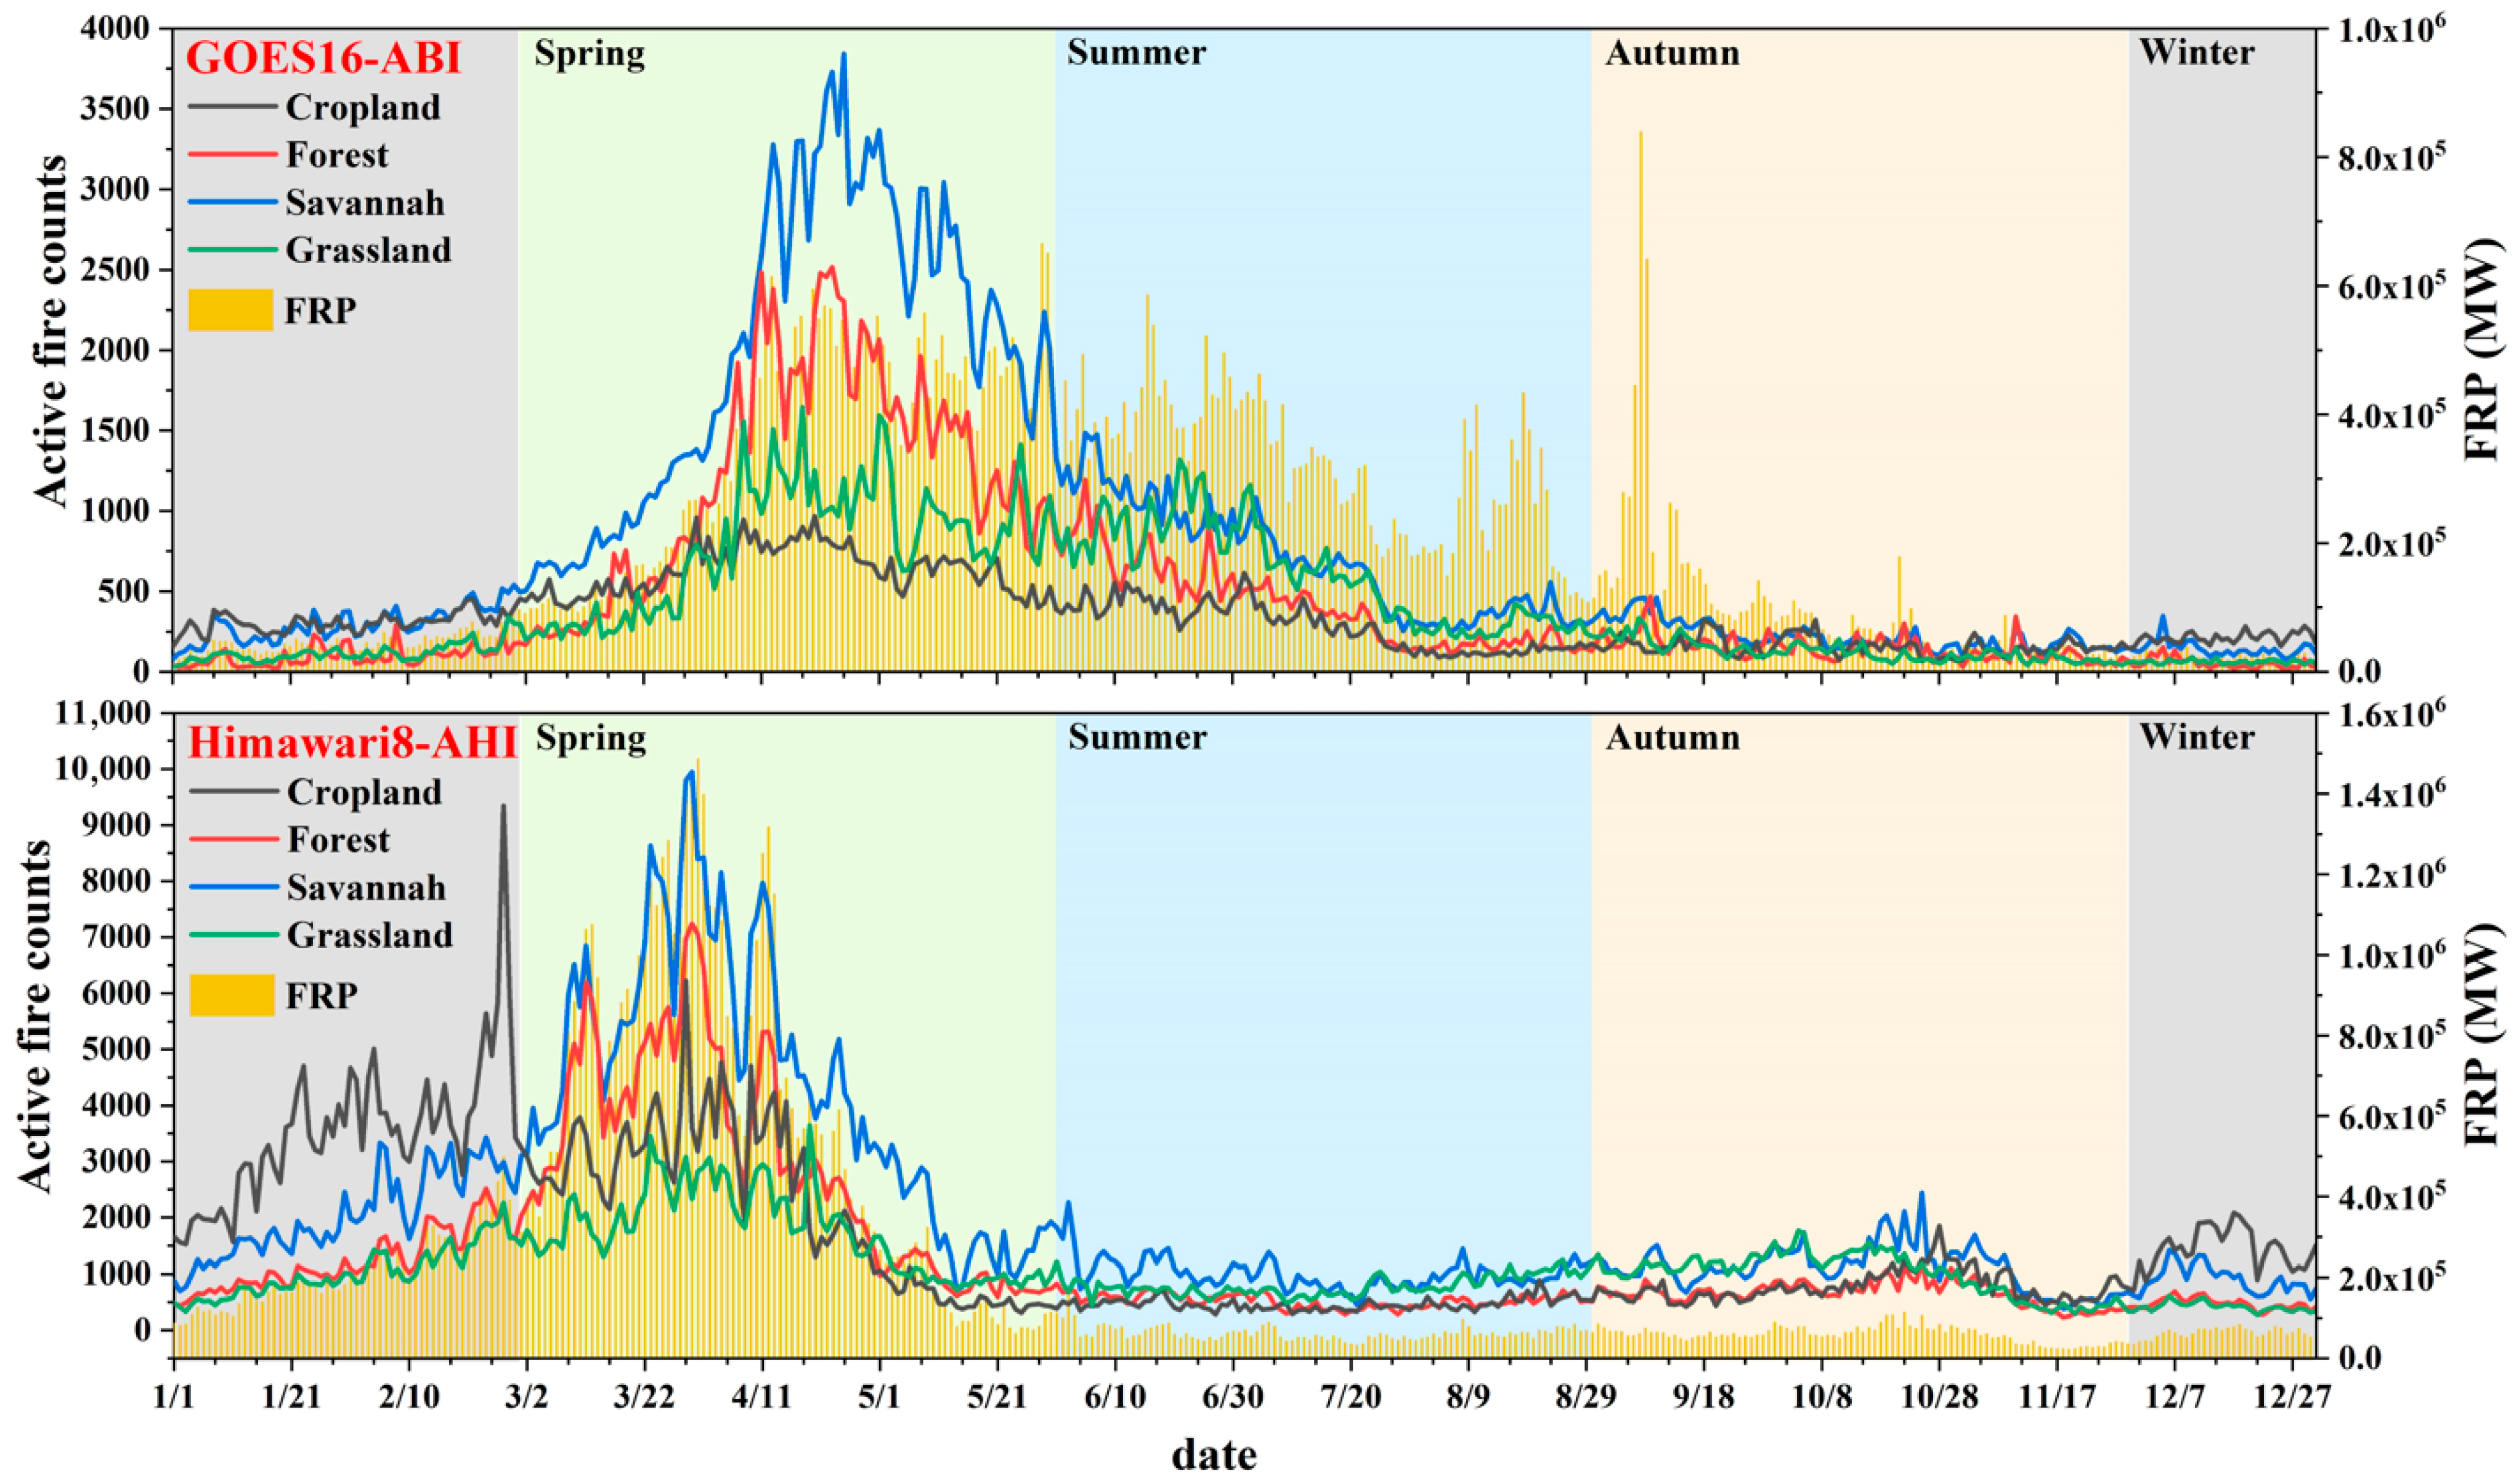
Figure 7 shows the annual average variations in AF and FRP across North America and East Asia during 2018–2020. There is a clear seasonal trend in the magnitude and number of biomass burning events. Burning in North America begins in mid-April, peaks in early May and then gradually declines. From April to early September, peak FRP activity remains nearly constant. The phenomenon of high FRP with a low number of AF during the summer, particularly in August, is often associated with large-scale vegetation burning caused by lightning-induced wildfires in the region [26,27]. The peak burning in East Asia was in late winter and spring (January to May), and the burning activity reached do much in early April, which is consistent with the results of Dwyer et al. [22]. The main source of burning contribution during winter is associated with agricultural fire, where residual straw is cleaned directly in the field after the autumn harvest of rice, wheat, maize and other crops. March to May is the main time of biomass burning, and most of this burning comes from savanna. Due to changes in farming practices and through the dry season, vegetation that has been cut or cleared is optimally burned after a long drying period.
Figure 7.
Time series of the daily average values of the number of different types of vegetation fires and total FRP derived from GOES-16 and Himawari-8 during 2018–2020.
4.3. Comparison of Diurnal Cycle of Vegetation Fire
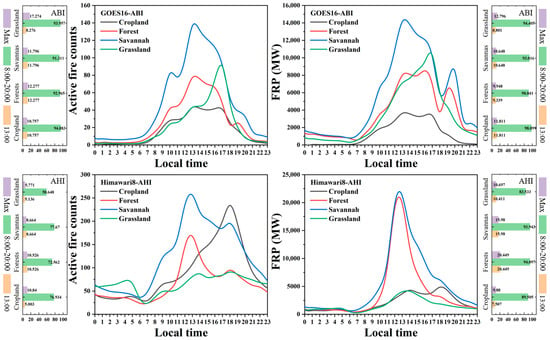
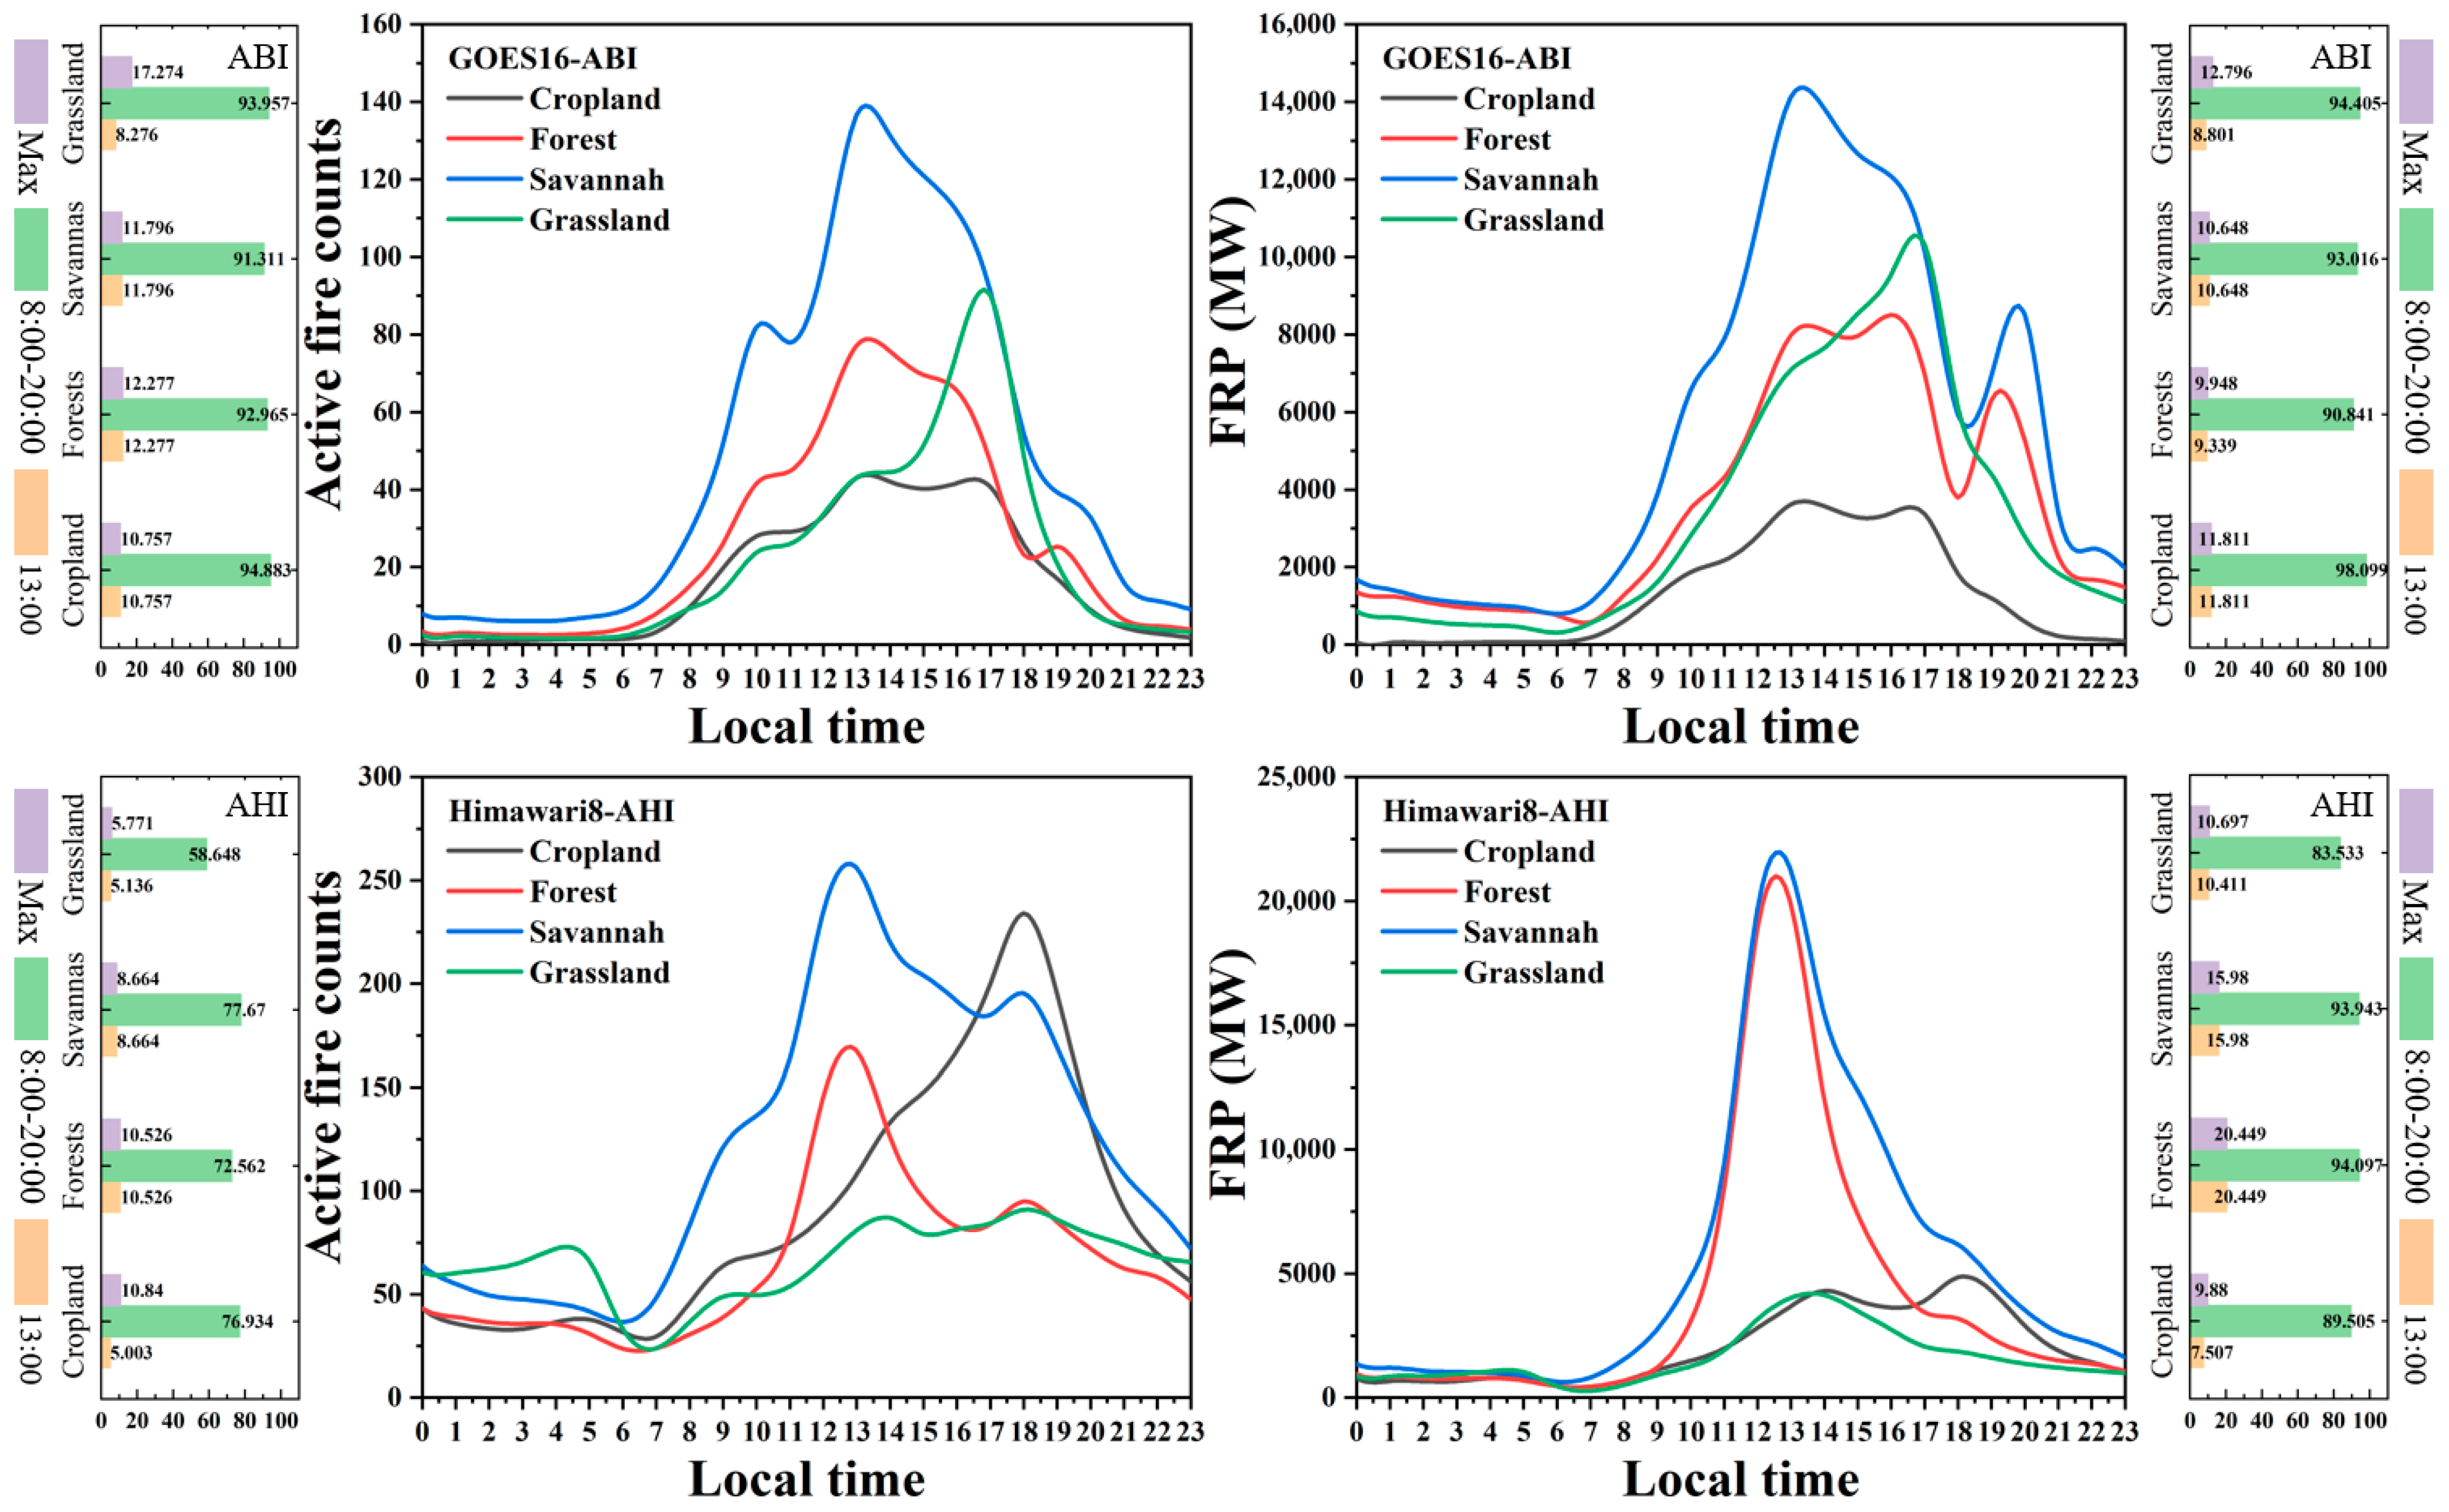
To explore the diurnal variation in the fire cycle across four major land cover types—cropland, forest, savanna, and grassland, we aggregated the same fires within the same hour to obtain the diurnal variation curves of fire numbers versus FRP, as shown in Figure 8. Local time is calculated using the time zone associated with longitude. While differences in burning activity were noted across land cover types, most fires occurred between 8:00 and 20:00 local time, representing over 90% of the daily total. Fire activity typically peaked around 13:00 local time, followed by a secondary peak between 18:00 and 20:00, which contributed 24.0% to 51.4% of total fire detections, with an average of 36.6%. The distribution of fire activity is generally skewed with a somewhat longer tail above the peak as fires continue burning into the evening [13]. The diurnal variation in biomass burning is not always a simple normal distribution, and may even exhibit a wavelike pattern. Therefore, assuming that biomass burning follows a normal distribution perhaps introduces potential errors into emission estimates. To improve the accuracy of fire emission, it is essential to adopt dynamic modeling approaches that capture the observed temporal heterogeneity of fire behavior.
Figure 8.
Diurnal variations in the daily average active fire counts and FRP during 2018–2020. Percentages labeled as Max correspond to the contributions at the diurnal peak hour, while 08:00–20:00 and 13:00 indicate the contributions within the daytime period and at 13:00 local time, respectively.
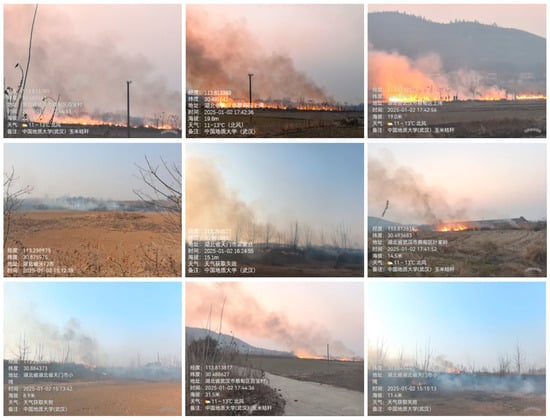
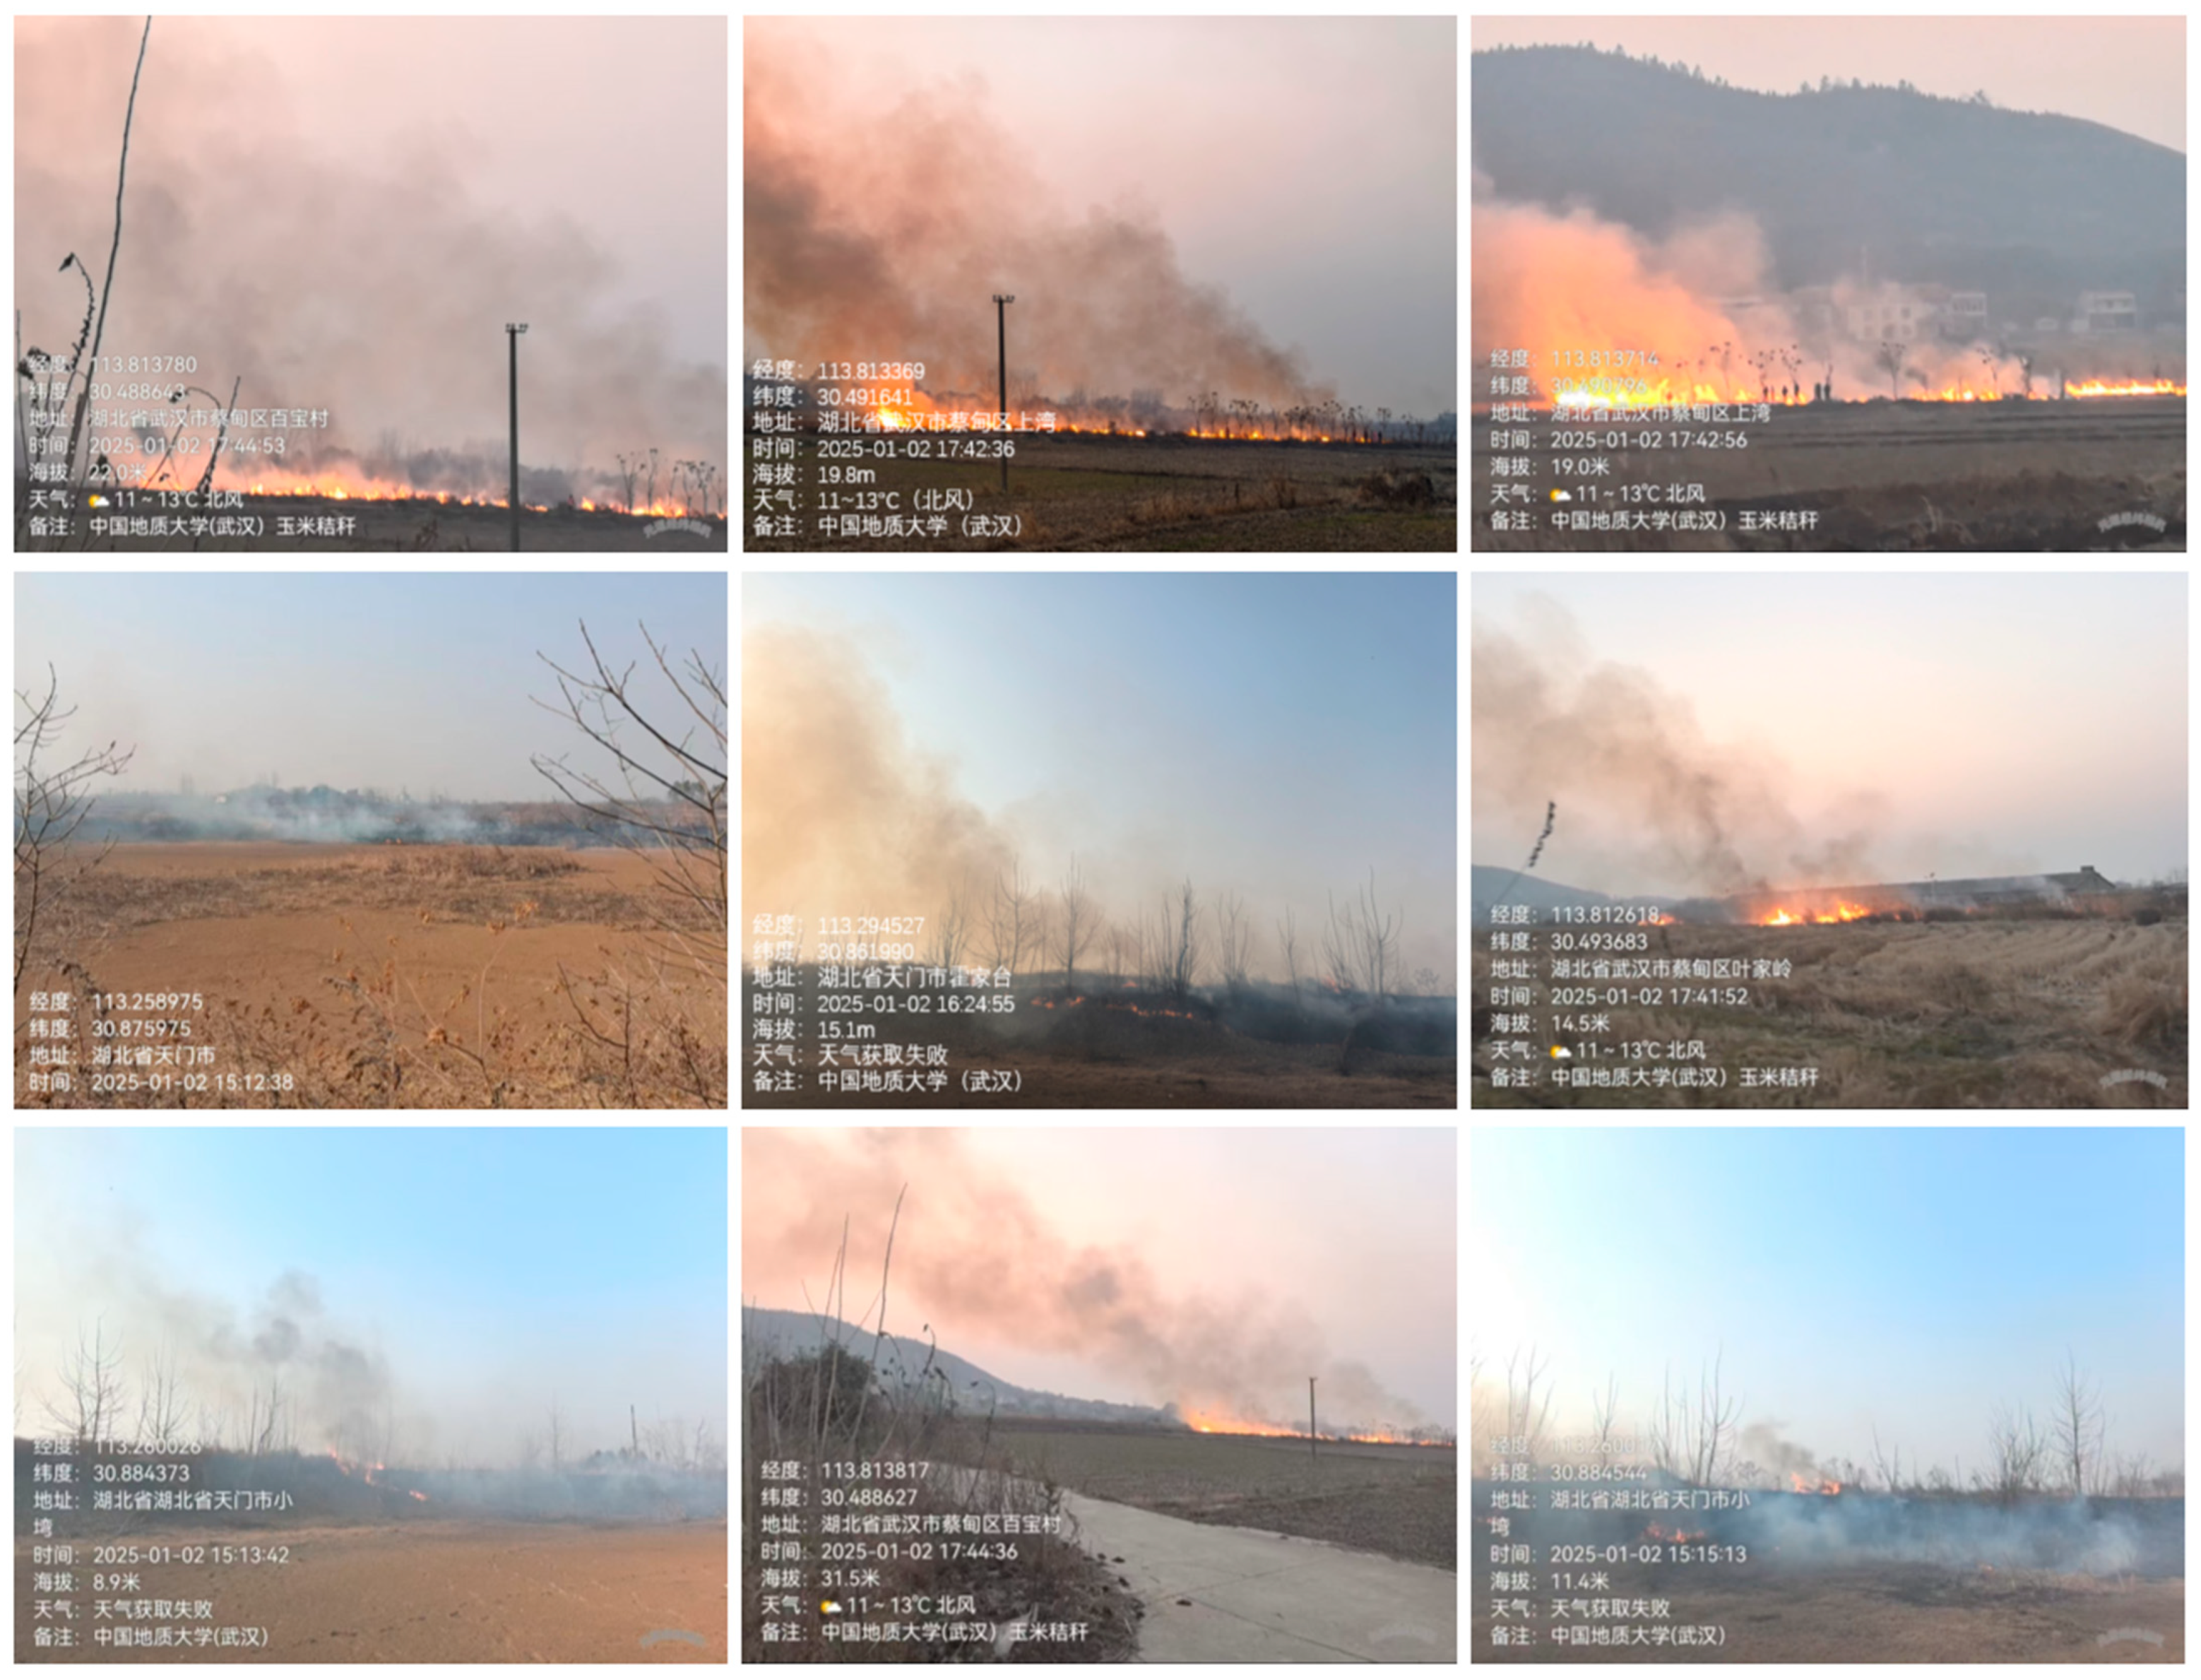
In particular, the duration of biomass burning is wider in North America than in East Asia, and differences in vegetation types result in varying daily variations in fire activity. The diurnal pattern of FRP in North America shows a band-like distribution, with hourly peaks of about 10%. The daily distribution of FRP for land cover types containing woody vegetation shows two peaks, possibly due to reduced anthropogenic active fires caused by controlled local burning following specific land management programs. In East Asia, the diurnal variation in FRP for forests and savanna generally follows a near-normal distribution, with a peak around 13:00 local time, contributing approximately 20% and 16% of the total daily radiative power, respectively. In contrast, the number of agricultural fires peaks at 18:00 local time, reaching a level twice as high as that at 13:00. Field surveys indicate that crop straw burning in Central China frequently occurs during the evening (Figure 9). Notably, the FRP of agricultural fires exhibits two comparable peaks at 13:00 and 18:00, despite the much higher fire count in the evening. This indicates that agriculture in East Asia is primarily dominated by a large number of small fires.
Figure 9.
Field surveys of crop straw burning in Central China. The Chinese text within the image consists of original metadata (geolocation, time, weather, etc.) recorded during the field survey and is retained as primary explanation of the research context.
4.4. DMB Fire Emissions Intercomparison
Building upon the preceding analyses of spatial–temporal patterns and diurnal variations, we evaluated the impact of diurnal cycles on fire emission estimates. We developed a dynamic emission model that integrates observed patterns to improve upon the conventional assumption of a unimodal, near-normal distribution. Based on this model, we calculated DMB and compared the results with those derived under the traditional normal distribution assumption, as well as with estimates from the GFASv1.2 inventory (Figure 10). DMB was used as a universal comparison metric, as this eliminates discrepancies arising from the use of different emission factors in inventories.
Figure 10.
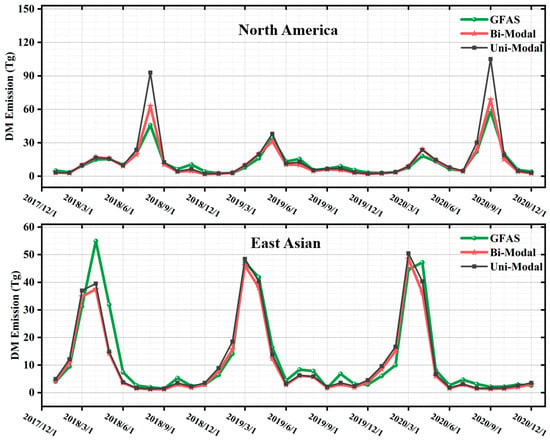
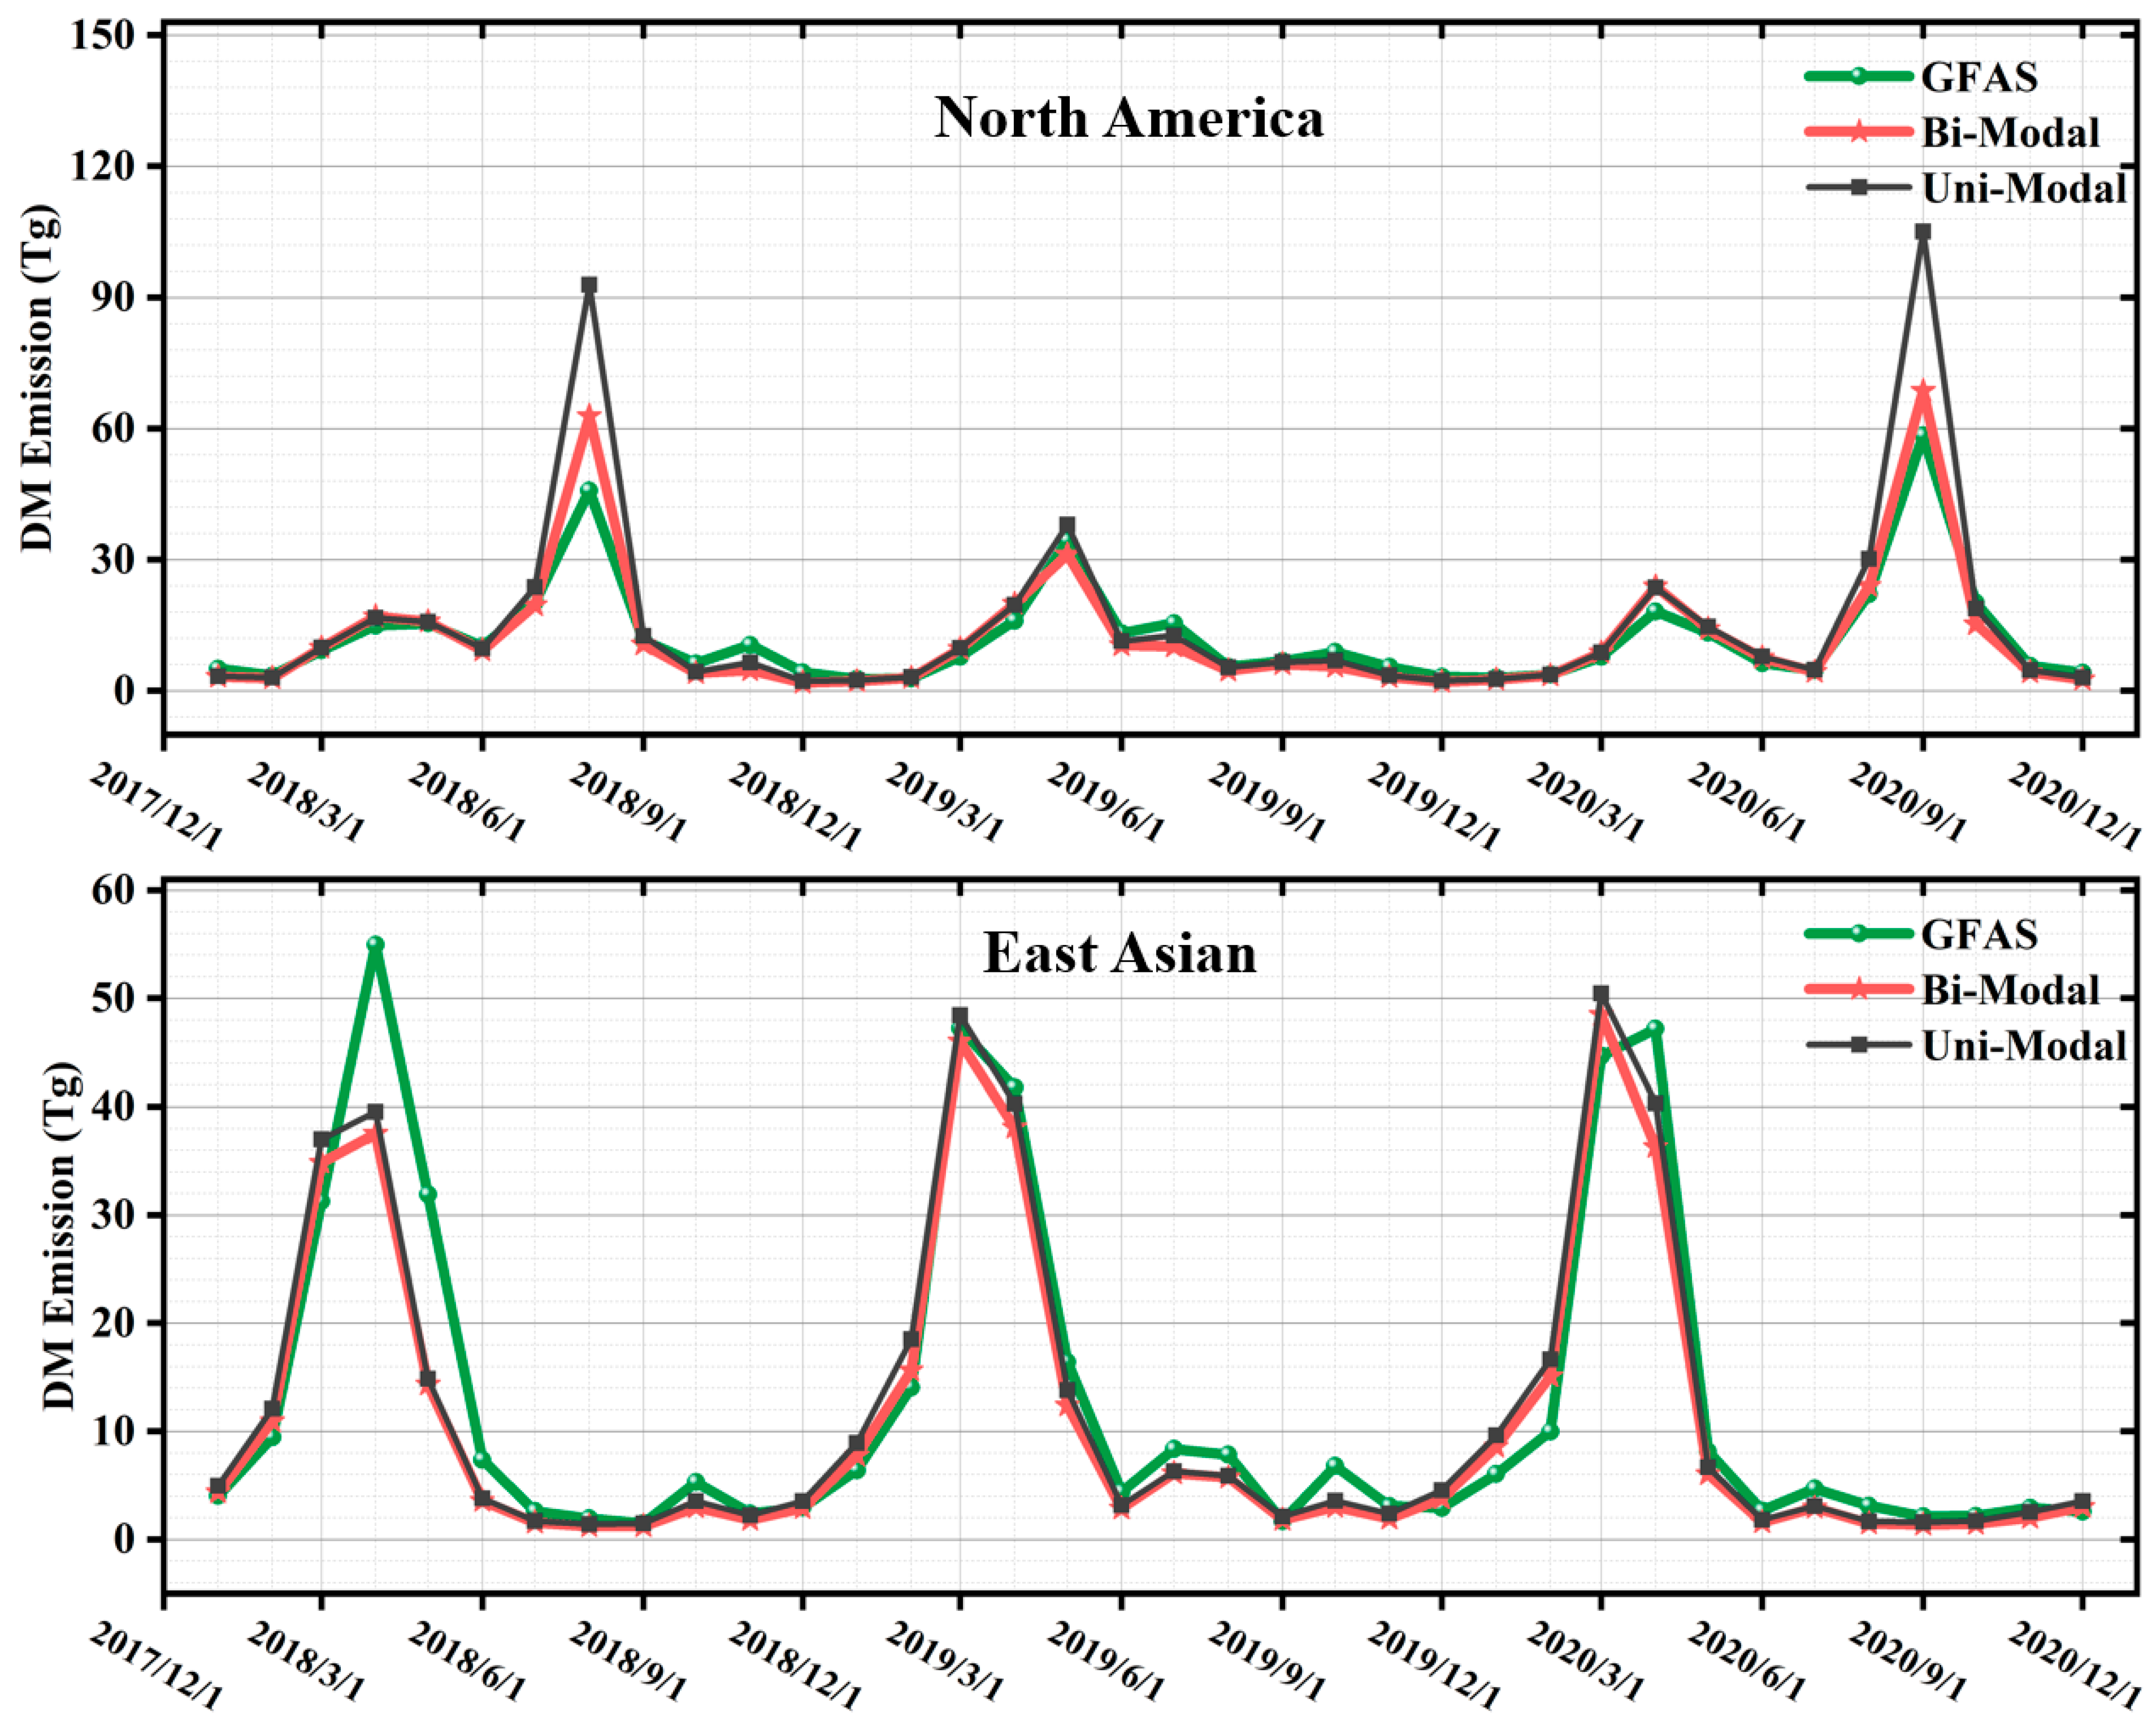
Monthly total dry matter burned (DMB) emissions in North America and East Asia during 2018–2020, derived from the GFAS and Bi-Modal and Uni-Modal estimates.
In North America, the DMB estimates based on the dynamic bimodal model (VIIRS/ABI-Bi) were up to 2.02 times higher than the monthly values reported by GFAS, with the largest difference occurring in August 2018. Compared to the DMB estimates using a unimodal assumption (VIIRS/ABI-Uni), the bimodal model yielded values which were up to 1.53 times higher, peaking in September 2020. From 2018 to 2020, fires in the continental U.S. were estimated to have resulted in approximately 200.92, 121.89, and 228.25 Tg of DMB, respectively (Table 2). In East Asia, GFAS DMB estimates were up to 2.14 times higher than those derived from VIIRS/AHI-Bi, with the maximum difference observed in May 2018. Nevertheless, applying the bimodal model still led to an increase in DMB estimates compared to the unimodal assumption—they were up to 1.25 times higher, peaking in November 2020 (Table 2). These results highlight the importance of incorporating realistic diurnal fire cycle patterns into emission models to improve the accuracy of biomass burning emission estimates.
Table 2.
Annual total mass of consumed dry matter for the four main land cover types in North America and East Asia (unit: Tg).
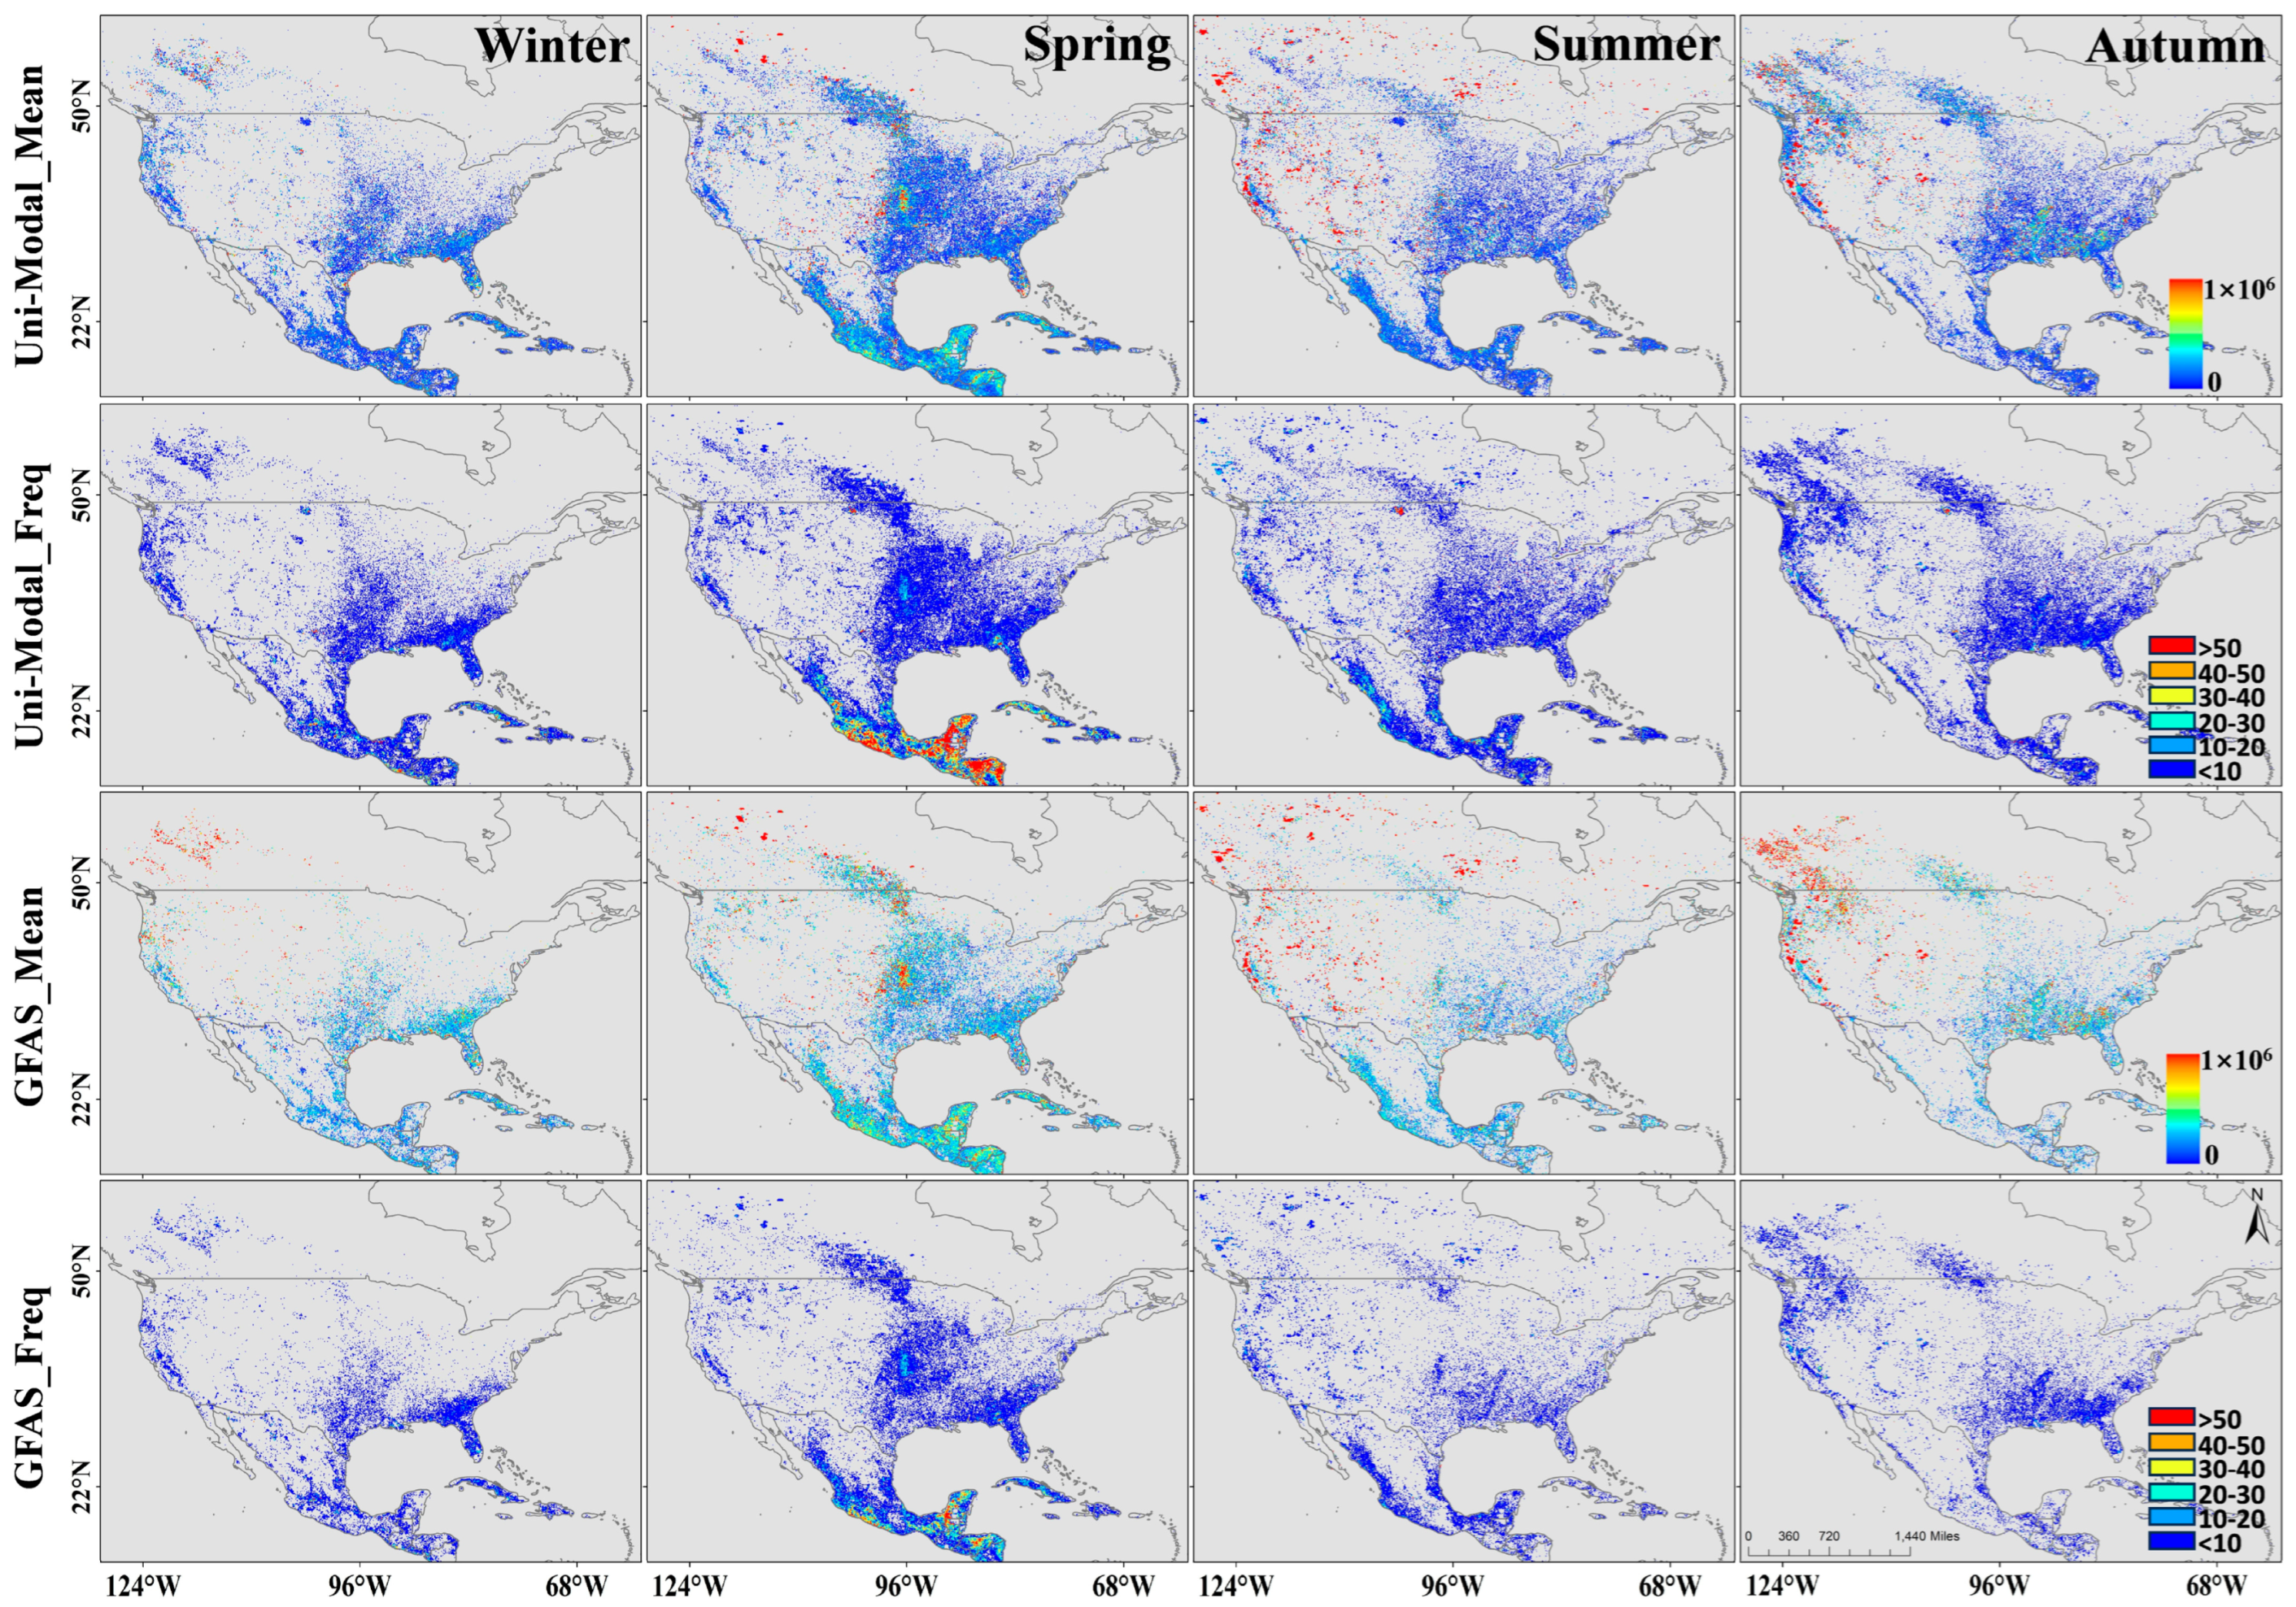
In North America, biomass consumption exhibits strong spatial heterogeneity. While highly variable and scattered across the western United States, it shows less variability and a more widespread distribution in the Great Plains and southeastern U.S. (Figure 11). The biomass burning displays high-emission hotspots during spring, summer, and autumn in North American. Spring hotspots correspond to agricultural fires in the central U.S. and forest fires in the north U.S. The high fire emissions from grassland and forest fires in summer and autumn. These spatial distributions of emissions generally align with the GFAS inventory. However, we observed that in the region south of Mexico, DMB emissions in spring were lower than those reported by GFAS, even though fire frequency was significantly higher than in the GFAS inventory.
Figure 11.
Seasonal mean and occurrence frequency of DMB over North America during 2018–2020, as estimated by GFAS and the Uni-Modal estimates.
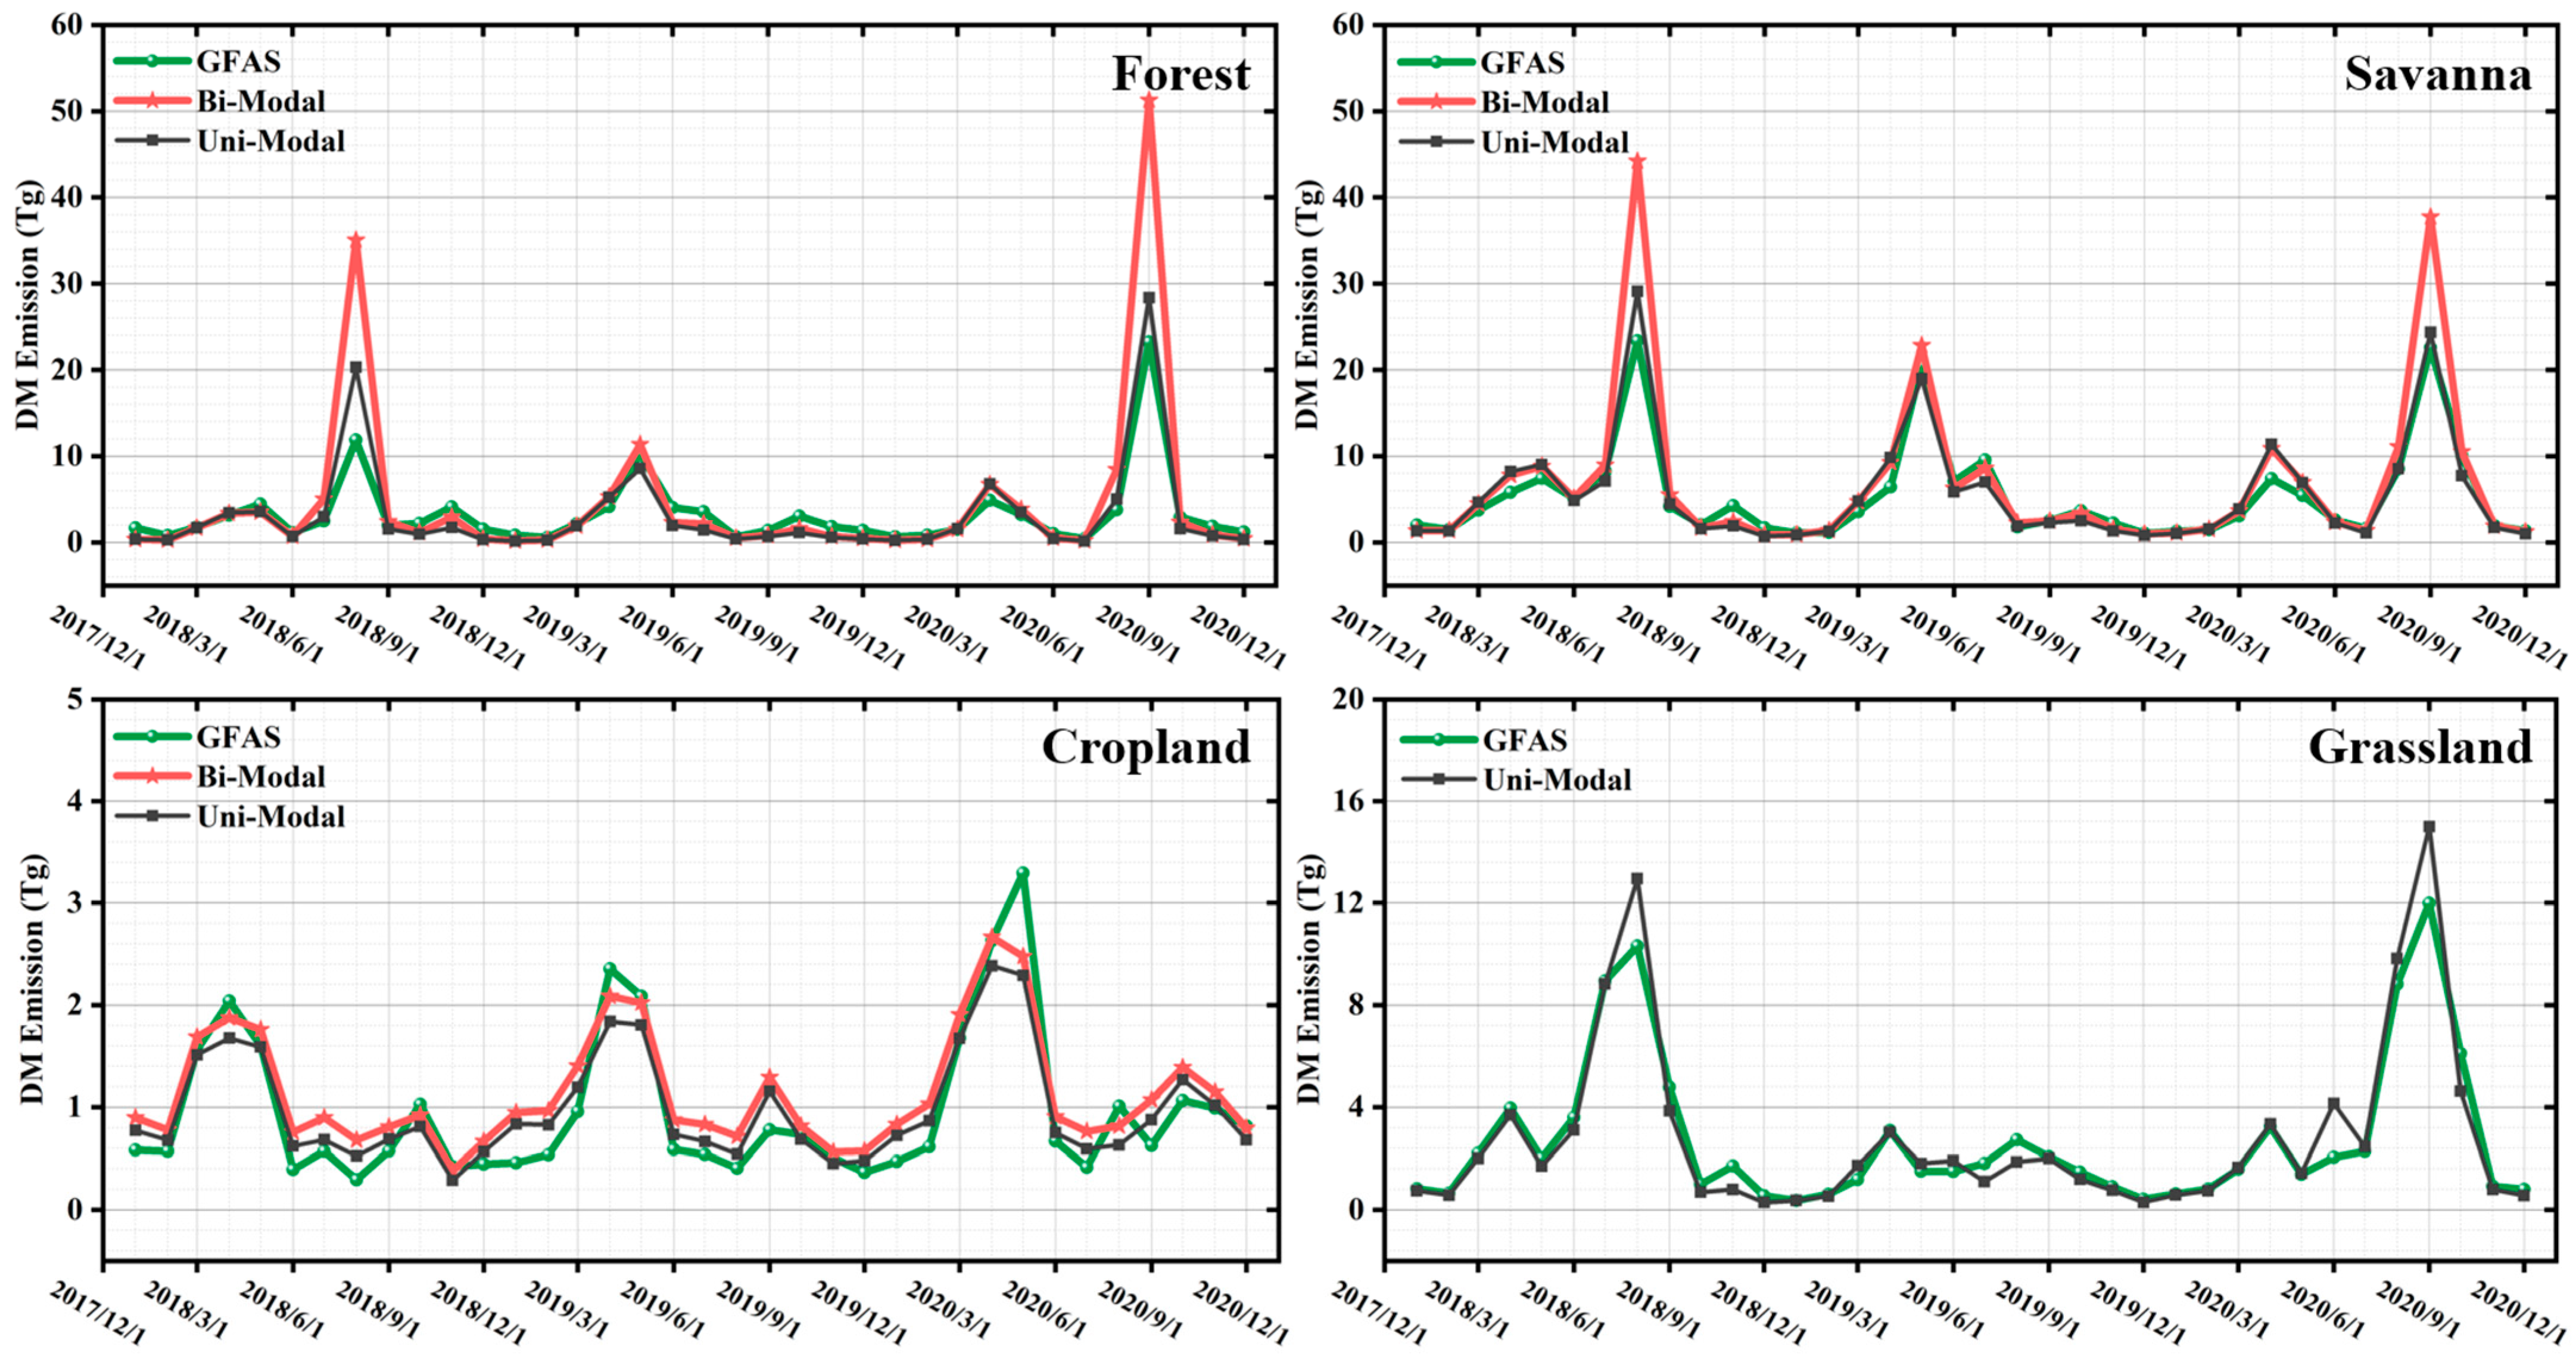
The monthly variations in biomass burning across four land cover types in North American are shown in Figure 12. In particular, forest, savanna, and grassland show higher DMB in summer and early autumn, with lower levels in winter and spring. For forest fires during August–September, VIIRS/ABI-Bi, VIIRS/ABI-Uni, and GFAS DMB exhibit a distinct peak. In contrast, croplands show relatively low emissions overall, with the highest emissions in spring (March to May) and a secondary peak in autumn each year. Notably, in August 2018, DMB from VIIRS/ABI-Bi was 2.31 times higher than that from GFAS, and the discrepancy was even greater than other fire seasons. This suggests that agricultural fires during the summer fire season may be smaller in average size and more spatially isolated than those in summer, making them more easily missed by the MODIS, especially compared to more intense fire periods. The croplands were the main source of DMB emissions during winter and spring.
Figure 12.
Monthly total DMB emissions for four land cover types in North America during 2018–2020, derived from GFAS and Bi-Modal and Uni-Modal estimates.
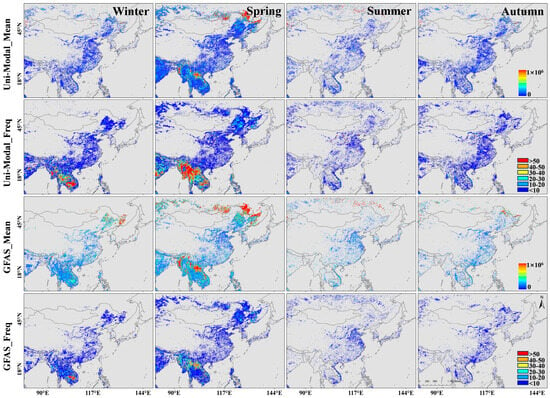
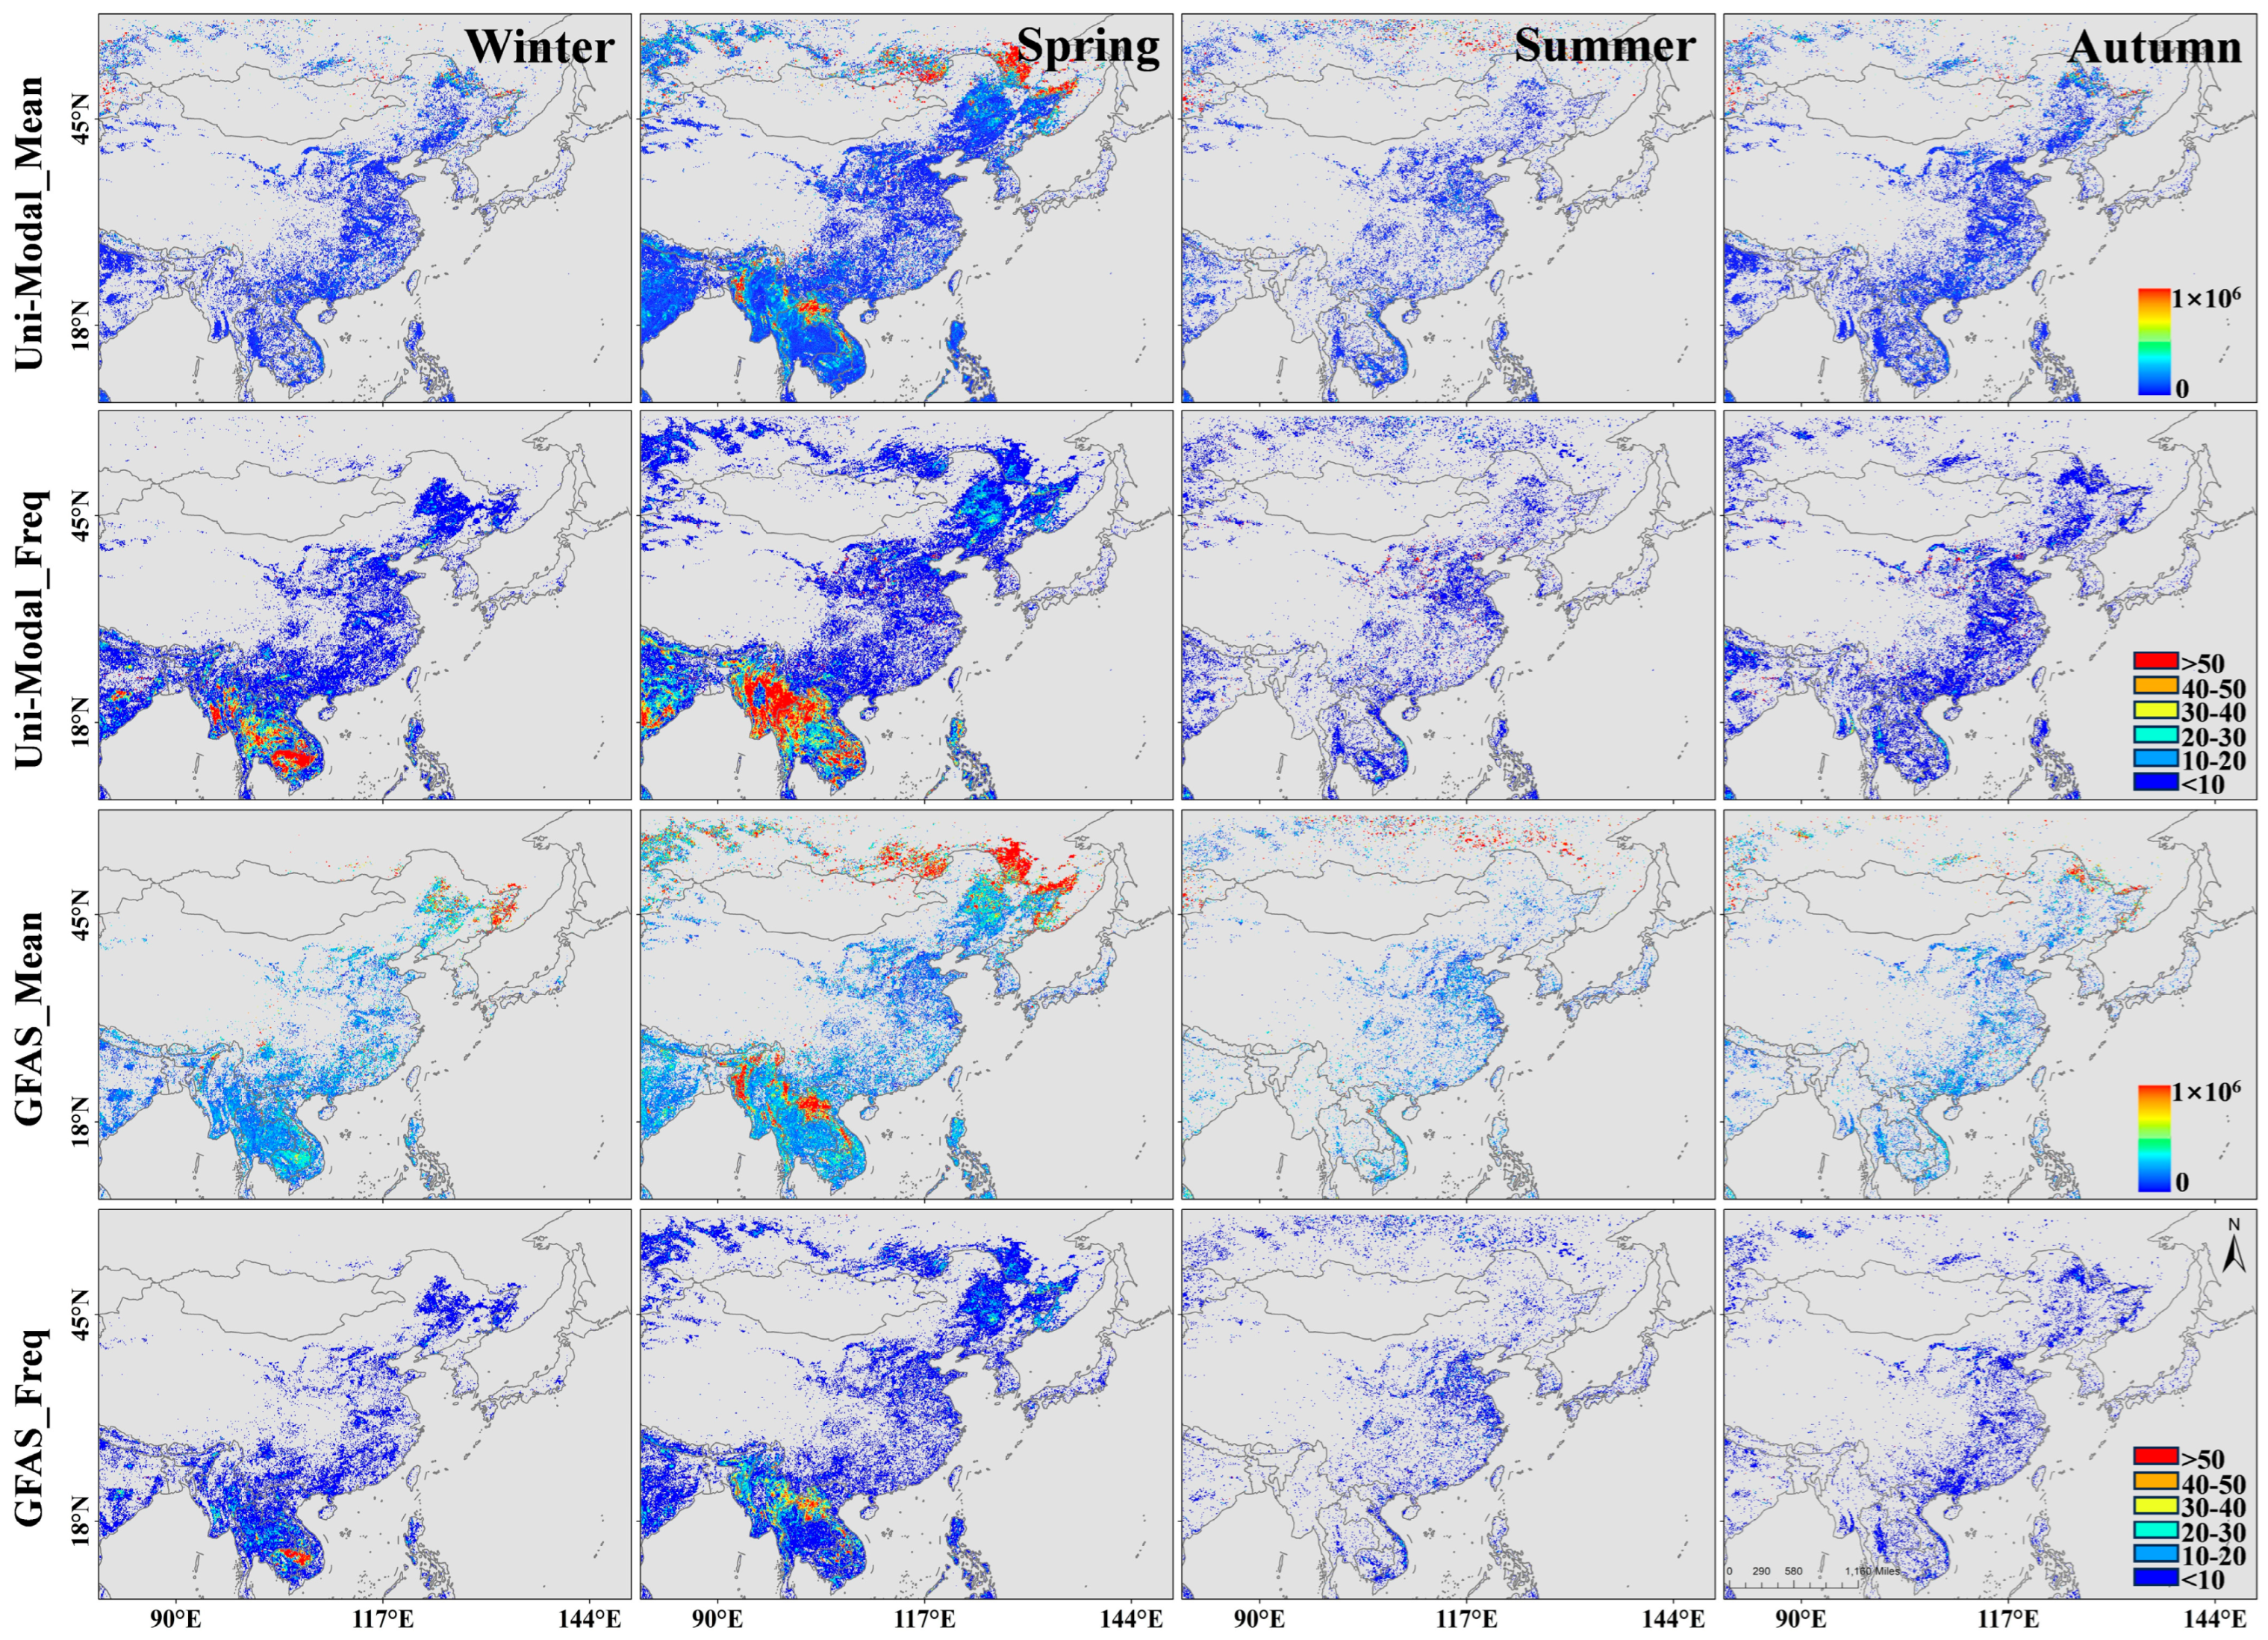
As shown in Figure 13, in East Asia, during the autumn and winter seasons, the DMB reported by the GFAS inventory was significantly higher than that from VIIRS/AHI-Uni, particularly in Heilongjiang Province, its border regions, and other parts of northeastern China. In spring, GFAS also reported much higher DMB emissions over northern forests compared to VIIRS/AHI-Uni. Specifically, for forest fires in East Asia, the March DMB peak estimated by GFAS was approximately 1.2 times greater than that of VIIRS/ABI-Uni. The GFAS estimates ranged from 13.063 to 20.045 Tg, compared to a range of 10.686 to 16.609 Tg for VIIRS/ABI-Uni (Figure S2). This discrepancy is partly due to the cloud correction algorithm applied in GFAS [8]. Additionally, in regions such as Southeast Asia, the GFAS tends to significantly underestimate DMB compared to VIIRS/AHI-Uni, primarily due to the high frequency of small agricultural fires, which are often missed by the MODIS detection.
Figure 13.
Seasonal mean and occurrence frequency of DMB over East Asia during 2018–2020, as estimated by GFAS and the Uni-Modal estimates.
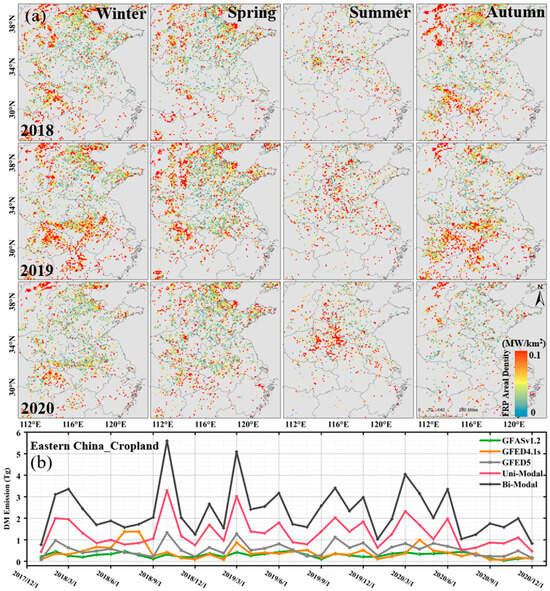
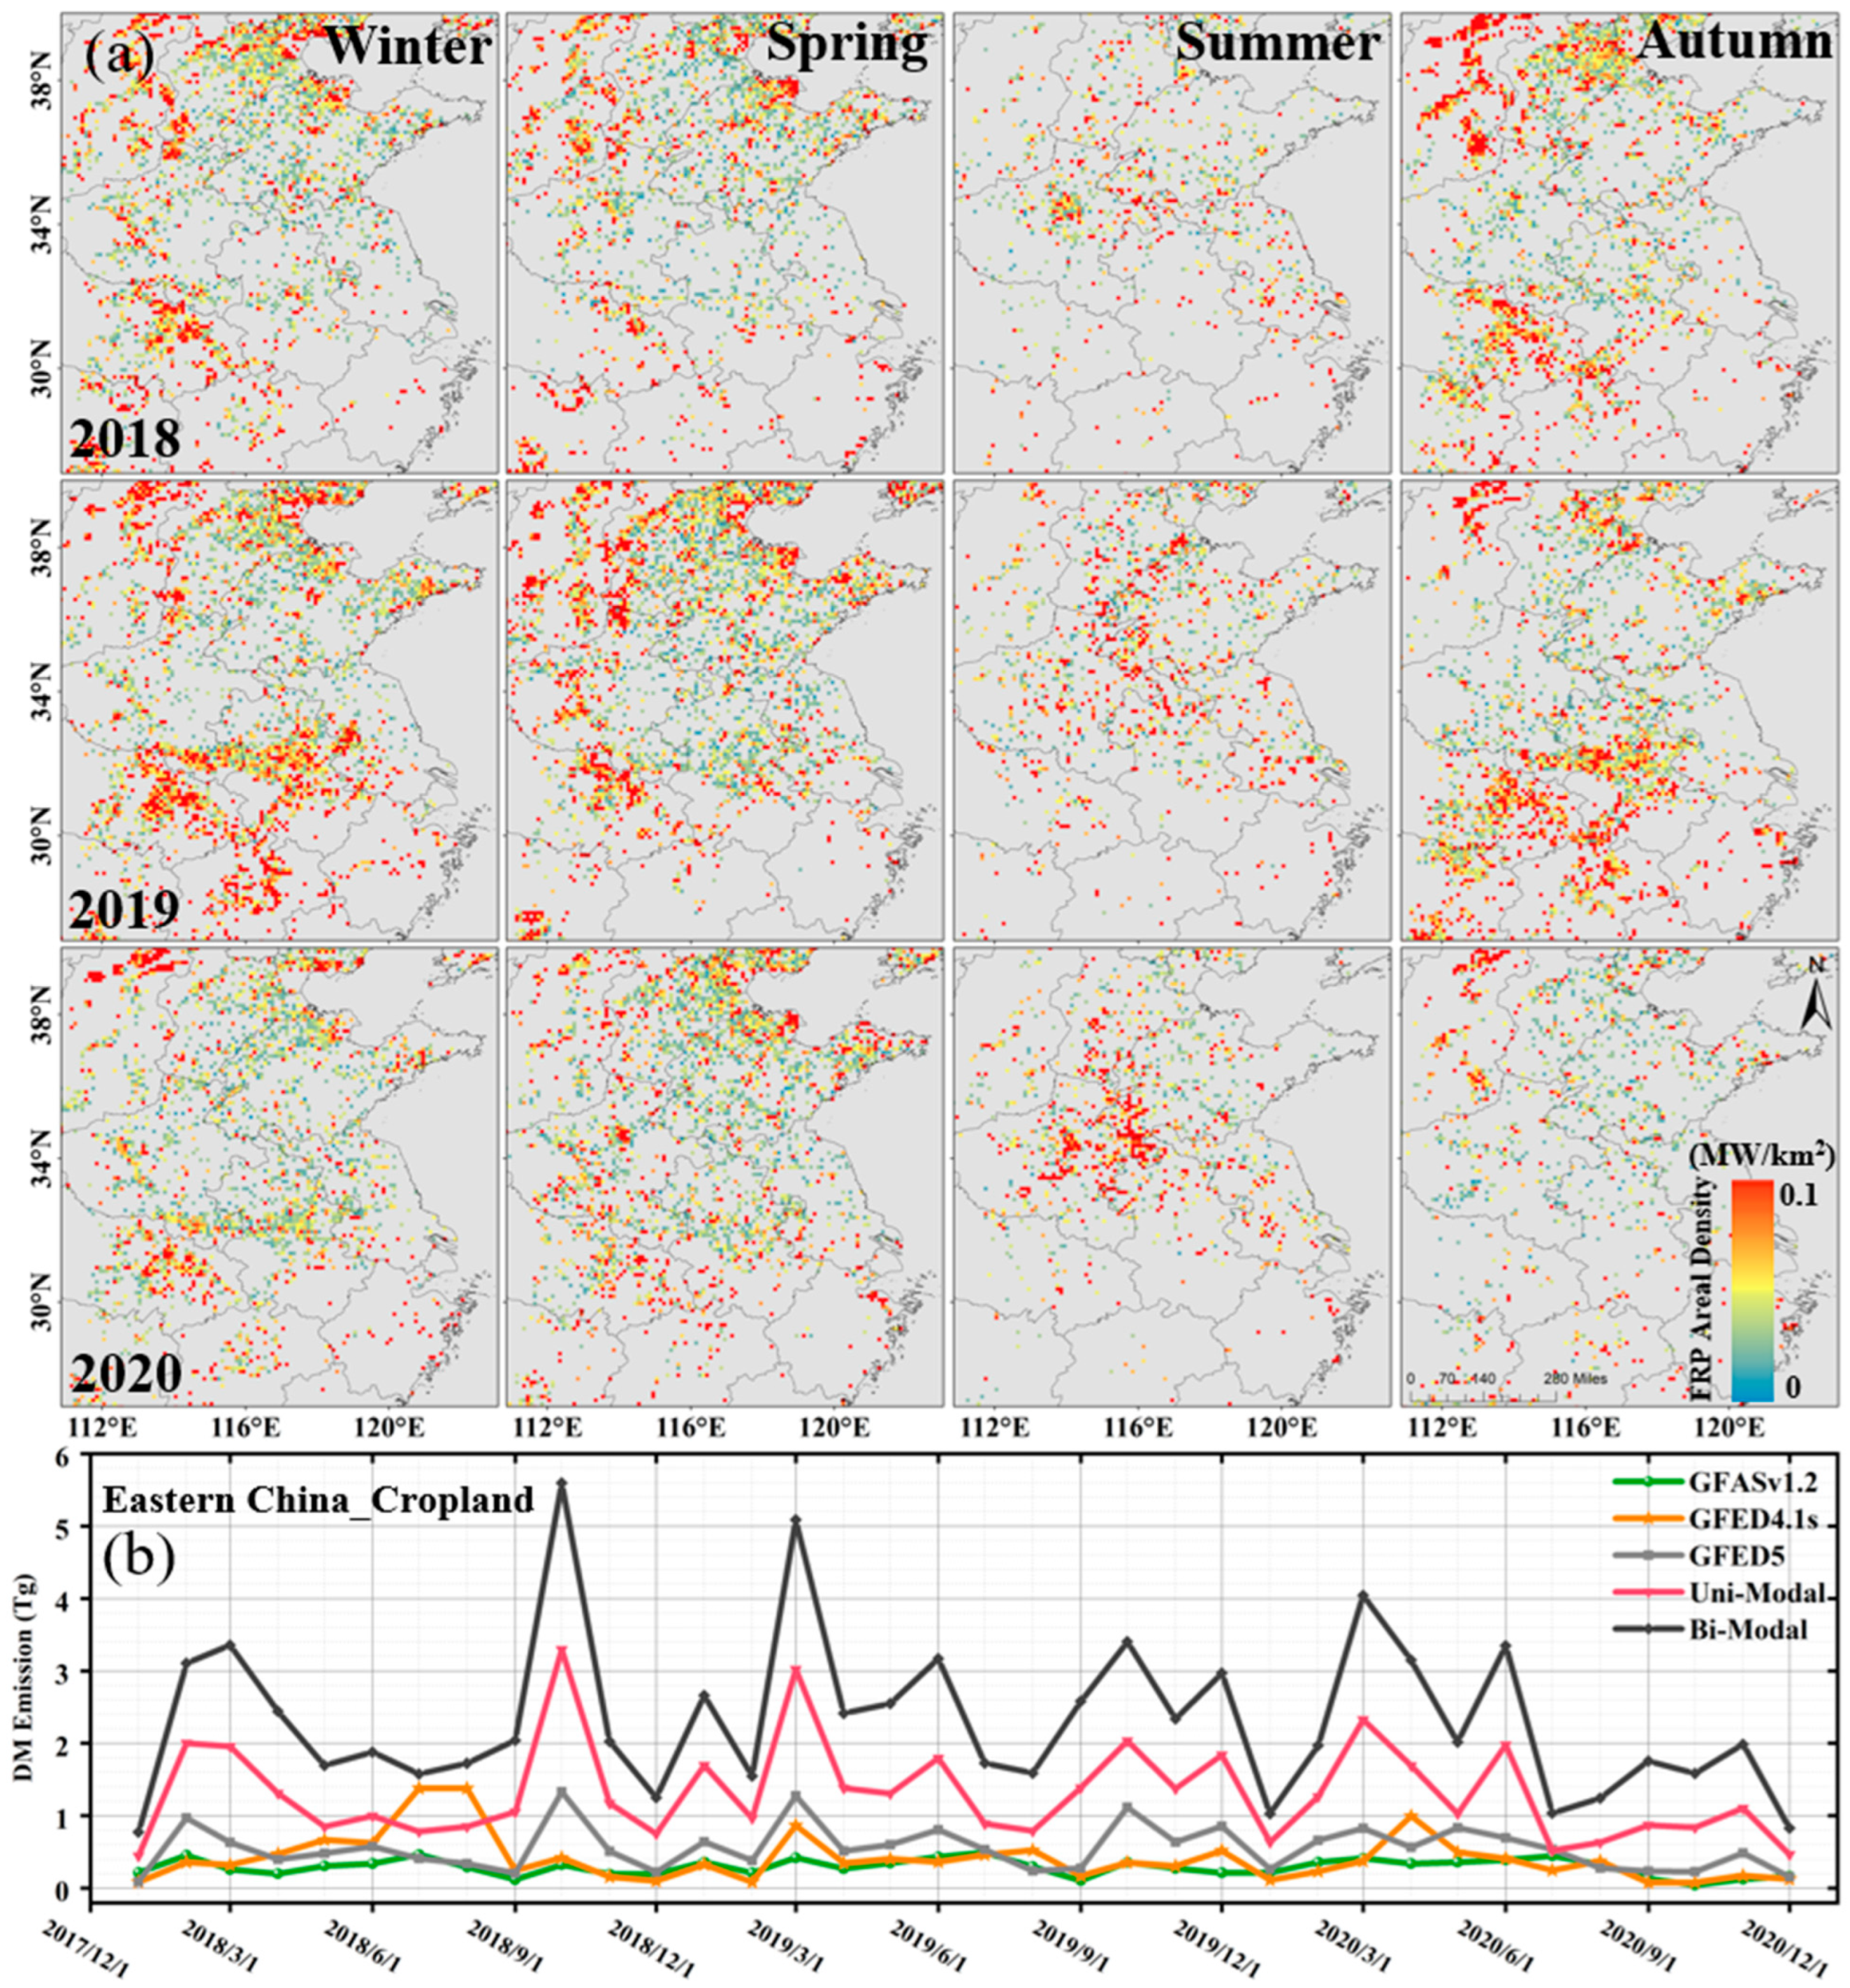
Considering the prevalence of small-scale agricultural fires caused by straw burning in eastern China, the GFED4.1s and GFED5 inventories, which incorporate small fires, were included for comparison. Figure 14a shows the spatial distribution of seasonal average FRP areal density over eastern China from January 2018 to December 2020. The results indicate that the intense agricultural fires that previously occurred in eastern China during the summer have been effectively controlled [25]. Biomass burning activity has shifted seasonally, with the peaks occurring in spring and autumn. The spring peak is primarily associated with the burning of wheat residues at night (Figure 8). The high temporal resolution of geostationary satellites is essential for accurately quantifying emissions from these short-lived late spring afternoon fires.
Figure 14.
(a) Seasonal patterns of FRP area density (MW km−2) associated with agricultural burning in eastern China during 2018–2020. (b) Monthly total dry matter burned (DMB) derived from the VIIRS/Him-Bi FRP dataset proposed in this work, in comparison with estimates from VIIRS/Him-Uni, GFASv1.2, GFED4.1s, and GFED5 DMB.
In contrast, a smaller secondary peak appears in autumn (Figure 14b), corresponding to the burning of corn and rice residues [12]. This shift may be attributed to differences in provincial regulations on crop residue burning. By distinguishing these seasonal behaviors, we can see that while summer bans have been effective, fire activity has displaced to the shoulder seasons, necessitating continuous monitoring beyond the traditional summer peak window [28,29].
Figure 14b shows that the VIIRS/AHI-Bi DMB emissions for 2018–2020 were 1.76 to 7.96 times higher than those from VIIRS/AHI-Uni, GFED5, GFED4.1s, and GFASv1.2 (Table S1). During spring, all five inventories captured a distinct peak in DMB. The VIIRS/AHI-Bi estimates (3.357–5.085 Tg) were consistently the highest, ranging from 1.71 to 11.43 times greater than the other inventories. In October 2018, during the peak of the autumn burning season, all inventories showed increased DMB. Yet, GFAS, GFED4.1s, and GFED5 remained far lower than VIIRS/AHI-Bi and VIIRS/AHI-Uni, with VIIRS/AHI-Bi estimates nearly double those of VIIRS/AHI-Uni and 3.96–14.58 times higher than the other inventories. The discrepancies in autumn were even more pronounced than those observed in spring. The inventories relying on MODIS data struggle to detect small fires with low FRP, especially those occurring outside of peak fire seasons, leading to systematic underestimation of emissions.
5. Discussions
5.1. Insights into Diurnal Fire Cycles and Regional Heterogeneity
This study reveals that the diurnal variability of active fires is substantially more complex than the conventional unimodal Gaussian approximation assumed in many current fire emission models. Our analysis demonstrates that fire activity in North America and East Asia exhibits distinct temporal fingerprints driven by different underlying mechanisms. In North America, the pronounced bimodal diurnal cycle observed in forests and savannas—typically lasting 4–8 h—likely reflects a combination of active flaming and the prolonged smoldering or residual combustion characteristic of heavy fuel loads in these ecosystems. In contrast, the shorter (2–4 h) and more intense peaks characterizing agricultural fires in East Asia strongly suggest anthropogenic modulation, where burning activities are closely constrained by farming schedules rather than meteorological drivers alone. The identification of this “wavelike” or bimodal diurnal pattern challenges the assumption of normality used in previous studies, highlighting that failing to account for secondary evening peaks can lead to a major source of uncertainty in regional fire emission estimates.
5.2. Discrepancies with Global Inventories and Implications for Emission Estimates
By integrating geostationary (ABI/AHI) and polar-orbiting (VIIRS) observations, this study identifies substantial underestimations in widely used global fire emission inventories (GFAS and GFED), particularly for small-scale anthropogenic fires. The most significant discrepancies are found in eastern China, where the fused VIIRS/AHI-Bi product yields DMB estimates several times higher than those from GFAS and GFED. This aligns with and extends previous findings suggesting that polar-orbiting sensors (MODIS/VIIRS), with their fixed overpass times, systematically miss short-lived crop residue burning events that often occur in the late afternoon or evening [30]. While GFED attempts to correct for small fires using burned area, our results indicate that these adjustments are still insufficient for the highly fragmented and temporally agricultural fires in East Asia. In North America, discrepancies are less pronounced but still significant, suggesting that even in regions dominated by larger wildfires, the improved temporal resolution of geostationary satellites captures fire dynamics that snapshot-based methods overlook.
5.3. Uncertainties and Limitations
Despite the improvements in emission estimation, several limitations remain in this framework. First, the detection of numerous small fires remains constrained by sensor resolution. While VIIRS (375 m) improves upon MODIS, it still has a detection limit (e.g., 100 m2 at 1000 K) that may exclude very small agricultural burns. Meanwhile, the coarser resolution of geostationary sensors (ABI/AHI, 2 km) can lead to omission of low-intensity fires (FRP < 40 MW), introducing uncertainty in the diurnal characterization of the smallest events. Second, reliance on the MODIS MCD12Q1 land cover product introduces classification uncertainty in heterogeneous landscapes. For instance, fragmented croplands in East Asia may be misclassified as savannas, potentially affecting the assignment of diurnal profiles. Finally, the conversion from FRE to DMB relies on biome-specific factors that carry inherent uncertainties, which propagate into the final emission estimates.
6. Conclusions
Biomass burning is a major source of atmospheric trace gases and aerosols, exerting significant impacts on air quality and climate. Accurate emission estimates require detailed characterization of both the spatial distribution and the diurnal cycle of fire activity. In this study, we integrated VIIRS FRP data with ABI and AHI observations to analyze the seasonal and diurnal dynamics of fires across North America and East Asia. By applying a region-specific modified Gaussian model, we quantified DMB across different land cover types and revealed substantial regional differences in fire duration, intensity, and temporal structure.
The fused VIIRS/ABI-Bi product produced higher DMB estimates in North America —1.22 and 1.24 times those from VIIRS/ABI-Uni and GFASv1.2—highlighting the importance of capturing bimodal diurnal cycles in forest- and savanna-dominated regions. In East Asia, VIIRS/AHI-Bi yielded DMB estimates 1.08 and 0.94 times higher than those from VIIRS/AHI-Uni and GFASv1.2, with the most pronounced improvements occurring in agricultural regions where conventional inventories often overlook small, short-lived nighttime fires. During the fire season, agricultural DMB increased by 1.18–1.62 times, and eastern China showed increases of more than five times compared with existing inventories. These results demonstrate that integrating geostationary measurements with high-resolution fire products enables more reliable detection of small and short-duration fires and supports improved temporal reconstruction of fire activity.
Remaining uncertainties stem from sensor resolution limitations, land cover misclassification, and biome-specific emission factors. Incorporating higher-resolution fire data (e.g., Sentinel-2 and Landsat 8/9) for reconstructing diurnal fire dynamics will further reduce uncertainties in regional emission estimates. Moreover, this fused product approach holds promise for extension to other major fire-prone regions (e.g., South America and Africa) using their respective GEO platforms (e.g., GOES-18 or MSG/SEVIRI), though region-specific model parameterization remains crucial. Future work could also integrate machine learning (ML) techniques to automate and refine the diurnal cycle characterization. The resulting improved diurnal emission estimates are readily interactable into real-time atmospheric composition services (e.g., CAMS), offering enhanced utility for global fire emission forecasting.
Supplementary Materials
The following supporting information can be downloaded at https://www.mdpi.com/article/10.3390/rs18010052/s1, Figure S1. Percentage of land-cover types in North America and East Asia; Figure S2: Monthly total DMB emissions for four land cover types in East Asia during 2018–2020, derived from GFAS and Bi-Modal and Uni-Modal estimates; Table S1: Monthly total mass of consumed dry matter in four main land cover types over East China (unit: Tg).
Author Contributions
Conceptualization, L.G. and R.L.; methodology, L.G.; software, L.G.; validation, M.T., Y.W. and L.F.; formal analysis, L.G.; investigation, Z.J.; resources, Z.J.; data curation, W.M.; writing—original draft preparation, L.G. and M.T.; writing—review and editing, Z.J.; visualization, L.G.; supervision, Z.J.; project administration, Z.J.; funding acquisition, Z.J. funding acquisition, Y.J.; data curation, Y.J. All authors have read and agreed to the published version of the manuscript.
Funding
This research was funded by CAS Project for Young Scientists in Basic Research (Grant No.YSBR-037), National Natural Science Foundation of China (Grant No. 42171354, 42271382, and 42577123), a grant from State Key Laboratory of Resources and Environmental Information System, and Key Laboratory of Atmosphere Sounding, China Meteorological Administration (Grant No. 2023KLAS04M).
Data Availability Statement
The data presented in this study are available in insert article.
Acknowledgments
We gratefully acknowledge the GOES-16, Himawari-8, and VIIRS fire teams, as well as their respective agencies (NOAA, JMA/JAXA, and NASA/NOAA), for the public availability of the fire products used in this work.
Conflicts of Interest
The authors declare that they have no known competing financial interest or personal relationship that could have appeared to influence the work reported in this paper.
References
- Urbanski, S.P.; Hao, W.M.; Nordgren, B. The wildland fire emission inventory: Western United States emission estimates and an evaluation of uncertainty. Atmos. Chem. Phys. 2011, 11, 12973–13000. [Google Scholar] [CrossRef] [Scilit]
- Wiedinmyer, C.; Akagi, S.K.; Yokelson, R.J.; Emmons, L.K.; Al-Saadi, J.A.; Orlando, J.J.; Soja, A.J. The Fire INventory from NCAR (FINN): A high resolution global model to estimate the emissions from open burning. Geosci. Model Dev. 2011, 4, 625–641. [Google Scholar] [CrossRef] [Scilit]
- Chen, J.; Li, C.; Ristovski, Z.; Milic, A.; Gu, Y.; Islam, M.; Wang, S.; Hao, J.; Zhang, H.; He, C.; et al. A review of biomass burning: Emissions and impacts on air quality, health and climate in China. Sci. Total Environ. 2017, 579, 1000–1034. [Google Scholar] [CrossRef] [Scilit]
- Crutzen, P.J.; Andreae, M.O. Biomass Burning in the Tropics: Impact on Atmospheric Chemistry and Biogeochemical Cycles. Science 1990, 250, 1669–1678. [Google Scholar] [CrossRef] [Scilit]
- Gupta, P.; Sahai, S.; Singh, N.; Dixit, C.; Singh, D.; Sharma, C.; Tiwari, M.; Gupta, R.; Garg, S. Residue burning in rice-wheat cropping system: Causes and implications. Curr. Sci. 2004, 87, 1713–1717. [Google Scholar]
- Jin, X.; Zhu, Q.; Cohen, R. Direct estimates of biomass burning NOx emissions and lifetime using daily observations from TROPOMI. Atmos. Chem. Phys. 2021, 21, 15569–15587. [Google Scholar] [CrossRef] [Scilit]
- Seiler, W.; Crutzen, P. Estimates of gross and net fluxes of carbon between the biosphere and the atmosphere from biomass burning. Clim. Chang. 1980, 2, 207–247. [Google Scholar] [CrossRef] [Scilit]
- Kaiser, J.W.; Heil, A.; Andreae, M.O.; Benedetti, A.; Chubarova, N.; Jones, L.; Morcrette, J.J.; Razinger, M.; Schultz, M.G.; Suttie, M.; et al. Biomass burning emissions estimated with a global fire assimilation system based on observed fire radiative power. Biogeosciences 2012, 9, 527–554. [Google Scholar] [CrossRef] [Scilit]
- Wooster, M.; Roberts, G.; Perry, G.; Perry, G.; Kaufman, Y. Retrieval of biomass combustion rates and totals from fire radiative power observations: FRP derivation and calibration relationships between biomass consumption and fire radiative energy release. J. Geophys. Res. 2005, 110, D24311. [Google Scholar] [CrossRef] [Scilit]
- Ellicott, E.; Vermote, E.; Giglio, L.; Roberts, G. Estimating biomass consumed from fire using MODIS FRE. Geophys. Res. Lett. 2009, 36, L13401. [Google Scholar] [CrossRef] [Scilit]
- Andela, N.; Kaiser, J.; Werf, G.; Wooster, M. New fire diurnal cycle characterizations to improve fire radiative energy assessments made from MODIS observations. Atmos. Chem. Phys. 2015, 15, 8831–8846. [Google Scholar] [CrossRef] [Scilit]
- Zhang, T.; De Jong, M.; Wooster, M.; Xu, W.; Wang, L. Trends in eastern China agricultural fire emissions derived from a combination of geostationary (Himawari) and polar (VIIRS) orbiter fire radiative power products. Atmos. Chem. Phys. 2020, 20, 10687–10705. [Google Scholar] [CrossRef] [Scilit]
- Giglio, L. Characterization of the tropical diurnal fire cycle using VIRS and MODIS observations. Remote Sens. Environ. 2007, 108, 407–421. [Google Scholar] [CrossRef] [Scilit]
- Li, F.; Zhang, X.; Kondragunta, S.; Schmidt, C.; Holmes, C. A preliminary evaluation of GOES-16 active fire product using Landsat-8 and VIIRS active fire data, and ground-based prescribed fire records. Remote Sens. Environ. 2020, 237, 111600. [Google Scholar] [CrossRef] [Scilit]
- Xu, W.; Wooster, M.J.; Kaneko, T.; He, J.; Zhang, T.; Fisher, D. Major advances in geostationary fire radiative power (FRP) retrieval over Asia and Australia stemming from use of Himarawi-8 AHI. Remote Sens. Environ. 2017, 193, 138–149. [Google Scholar] [CrossRef] [Scilit]
- Schmidt, C.C.; Hoffman, J.; Prins, E.; Lindstrom, S. GOES-R Advanced Baseline Imager (ABI) Algorithm Theoretical Basis Document for Fire/Hot Spot Characterization; NOAA NESDIS STAR: College Park, MD, USA, 2012; pp. 1–97. [Google Scholar]
- Wolfe, R.E.; Lin, G.; Nishihama, M.; Tewari, K.P.; Tilton, J.C.; Isaacman, A.R. Suomi NPP VIIRS prelaunch and on-orbit geometric calibration and characterization. J. Geophys. Res. Atmos. 2013, 118, 11508–11521. [Google Scholar] [CrossRef] [Scilit]
- Schroeder, W.; Oliva, P.; Giglio, L.; Csiszar, I.A. The New VIIRS 375m active fire detection data product: Algorithm description and initial assessment. Remote Sens. Environ. 2014, 143, 85–96. [Google Scholar] [CrossRef] [Scilit]
- Chen, Y.; Hall, J.; van Wees, D.; Andela, N.; Hantson, S.; Giglio, L.; van der Werf, G.R.; Morton, D.C.; Randerson, J.T. Multi-decadal trends and variability in burned area from the fifth version of the Global Fire Emissions Database (GFED5). Earth Syst. Sci. Data 2023, 15, 5227–5259. [Google Scholar] [CrossRef] [Scilit]
- Sulla-Menashe, D.; Gray, J.; Abercrombie, S.; Friedl, M. Hierarchical mapping of annual global land cover 2001 to present: The MODIS Collection 6 Land Cover product. Remote Sens. Environ. 2019, 222, 183–194. [Google Scholar] [CrossRef] [Scilit]
- Li, R.-R.; Tao, M.; Zhang, M.; Chen, L.; Wang, L.; Wang, Y.; He, X.; Wei, L.; Mei, X.; Wang, J. Application Potential of Satellite Thermal Anomaly Products in Updating Industrial Emission Inventory of China. Geophys. Res. Lett. 2021, 48, e2021GL092997. [Google Scholar] [CrossRef] [Scilit]
- Dwyer, E.; Pinnock, S.; Grégoire, J.; Pereira, J. Global spatial and temporal distribution of vegetation fire as determined from satellite observations. Int. J. Remote Sens. 2000, 21, 1289–1302. [Google Scholar] [CrossRef] [Scilit]
- Joel, S.L. Problems in Global Fire Evaluation: Is Remote Sensing the Solution? In Global Biomass Burning: Atmospheric, Climatic, and Biospheric Implications; MIT Press: Cambridge, MA, USA, 1991; pp. 67–73. [Google Scholar]
- Xu, W.; Wooster, M.; He, J.; Zhang, T. Improvements in high-temporal resolution active fire detection and FRP retrieval over the Americas using GOES-16 ABI with the geostationary Fire Thermal Anomaly (FTA) algorithm. Sci. Remote Sens. 2021, 3, 100016. [Google Scholar] [CrossRef] [Scilit]
- Chen, J.; Li, R.; Tao, M.; Wang, L.; Lin, C.; Wang, J.; Wang, L.; Wang, Y.; Chen, L. Overview of the performance of satellite fire products in China: Uncertainties and challenges. Atmos. Environ. 2022, 268, 118838. [Google Scholar] [CrossRef] [Scilit]
- Veraverbeke, S.; Rogers, B.M.; Goulden, M.L.; Jandt, R.R.; Miller, C.E.; Wiggins, E.B.; Randerson, J.T. Lightning as a major driver of recent large fire years in North American boreal forests. Nat. Clim. Chang. 2017, 7, 529–534. [Google Scholar] [CrossRef] [Scilit]
- Pérez-Invernón, F.J.; Gordillo-Vázquez, F.J.; Huntrieser, H.; Jöckel, P. Variation of lightning-ignited wildfire patterns under climate change. Nat. Commun. 2023, 14, 739. [Google Scholar] [CrossRef] [Scilit]
- Tao, M.; Chen, L.; Wang, Z.; Tao, J.; Su, L. Satellite observation of abnormal yellow haze clouds over East China during summer agricultural burning season. Atmos. Environ. 2013, 79, 632–640. [Google Scholar] [CrossRef] [Scilit]
- Huang, X.; Li, M.; Li, J.; Song, Y. A high-resolution emission inventory of crop burning in fields in China based on MODIS Thermal Anomalies/Fire products. Atmos. Environ. 2012, 50, 9–15. [Google Scholar] [CrossRef] [Scilit]
- Lv, Q.; Yang, Z.; Chen, Z.; Li, M.; Gao, B.; Yang, J.; Chen, X.; Xu, B. Crop residue burning in China (2019–2021): Spatiotemporal patterns, environmental impact, and emission dynamics. Environ. Sci. Ecotechnol. 2024, 21, 100394. [Google Scholar] [CrossRef] [Scilit] [PubMed]

Disclaimer/Publisher’s Note: The statements, opinions and data contained in all publications are solely those of the individual author(s) and contributor(s) and not of MDPI and/or the editor(s). MDPI and/or the editor(s) disclaim responsibility for any injury to people or property resulting from any ideas, methods, instructions or products referred to in the content. |
© 2025 by the authors. Licensee MDPI, Basel, Switzerland. This article is an open access article distributed under the terms and conditions of the Creative Commons Attribution (CC BY) license.