


Abstract
Research on glacier movement is helpful for comprehensively understanding the laws behind this movement and can also provide a scientific basis for glacier change and analyses of the dynamic mechanisms driving atmospheric circulation and glacier evolution. Sentinel-1 series data were used in this study to retrieve the three-dimensional (3D) surface motion displacement of the Muz Taw glacier from 22 August 2017, to 17 August 2018. The inversion method of the 3D surface motion displacement of glaciers has been verified by the field measurement data from Urumqi Glacier No. 1. The effects of topographic factors, glacier thickness, and climate factors on the 3D surface displacement of the Muz Taw glacier are discussed in this paper. The results show that, during the study period, the total 3D displacement of the Muz Taw glacier was between 0.52 and 13.19 m, the eastward displacement was 4.27 m, the northward displacement was 4.07 m, and the horizontal displacement was 5.90 m. Areas of high displacement were mainly distributed in the main glacier at altitudes of 3300–3350 and 3450–3600 m. There were significant differences in the total 3D displacement of the Muz Taw glacier in each season. The displacement was larger in summer, followed by spring, and it was similar in autumn and winter. The total 3D displacement during the whole study period and in spring, summer, and autumn fluctuated greatly along the glacier centerline, while the change in winter was relatively gentle. Various factors such as topography, glacier thickness, and climate had different influences on the surface motion displacement of the Muz Taw glacier.
1. Introduction
Glaciers are an essential part of the cryosphere. About 75% of the world’s freshwater is stored in glaciers, which are thus precious freshwater reservoirs [1,2]. Glaciers, especially mountain glaciers, are highly sensitive to climate change. Therefore, glaciers are considered to be an important indicator of climatic research [3,4,5,6]. Although mountain glacier reserves account for less than 1% of the total ice reserves on the planet, they have a significant impact on the change in global freshwater resources. Meanwhile, mountain glaciers known as alpine solid reservoirs are also closely related to the vast majority of freshwater resources that are extensively used by human beings [7,8,9]. At the same time, they are also a sensitive indicator of environmental change and climate warming, and the information on glacier changes can reflect the changing characteristics of the global climate [10,11,12,13,14].
Movement is one of the main signs that distinguish glaciers from other natural ice bodies [15]. Glacier movement not only changes the spatial distribution of material in the glacier area but also affects glacier geometry, such as their length, thickness, area, and volume [16,17,18]. It also affects the hydrothermal conditions of the glacier, increasing the complexity of the response of glaciers to climate change. At the same time, glacier movement may also trigger hazards such as glacial lake outburst floods, ice falls, and glacial mudflows [19,20,21,22,23,24]. The study of glacier movements and understanding glacier movement patterns can not only help humankind use these glacial freshwater resources more conveniently and rationally but also provide a scientific basis for the study of glacier changes and the analysis of the dynamical mechanisms driving atmospheric circulation. This is beneficial for the study of glacier evolution and for comprehensive scientific research on glaciers [25,26,27].
In recent years, various modern remote sensing techniques have been used for glacier movement monitoring, including optical imaging [28,29,30,31,32], global navigation satellite systems (GNSSs) [33,34], synthetic aperture radar (SAR) [35,36,37,38,39,40,41], and unmanned aerial vehicles [42]. In particular, synthetic aperture radar (SAR) is widely used in mountain glacier movement monitoring due to its advantages such as its applicability in all weathers, its all-day operation, and its high-resolution [40,43,44]. Methods to obtain 3D surface motion information of glaciers through remote sensing inversion mainly include D-InSAR technology combined with MAI technology, using the ascending and descending orbit data; D-InSAR technology combined with offset tracking method; D-InSAR technology combined with GNSS data; and PO-SBAS, which integrates pixel offset technology and small baselines subset [17,43,45,46,47,48,49,50,51,52,53,54,55,56]
Spatially, the glaciers are shrinking in the Himalayas, mainly under the influence of the westerlies and Indian monsoon, and the change in glaciers in the Karakorum and West Kunlun under the influence of the westerlies is abnormal [13,57,58,59,60,61,62,63]. In recent years, glaciers in eastern Pamir and Tibet have also experienced collapse [23,63,64,65,66,67,68]. Therefore, the study of glacier movement changes in the Sawir Mountains, as an area controlled by the north branch of the westerlies, is of great scientific importance for understanding the trend in mountain glacier movement in Western China. In terms of latitudinal position in China, the Sawir Mountains, located in the western part of the Junggar Basin in northern Xinjiang, are second only to the Altay Mountains in terms of latitudinal height and are more unique compared to the typical Tibetan Plateau region. Thus, the study of glacial movements in the Sawir Mountains can also help in understanding and grasping the trend of glacial movements in the high latitude mountains of Western China. The Muz Taw glacier is the main peak of the Sawir Mountains and is a typical glacier in the Sawir Mountains. Consequently, we took the representative Muz Taw glacier as the study area. Previous studies on the Muz Taw glacier have mainly focused on glacier thickness variations [69], area variations [70], and artificial snowfall to slow down glacier ablation [71], and there are still no relevant studies on the inversion of 3D surface motion displacement of this glacier.
In this study, based on data from Sentinel-1A ascending and Sentinel-1B descending tracks from 2017 to 2018, we used an optimized method of glacier 3D surface motion displacement, which was validated by field measurement data to demonstrate its feasibility [17], and we obtained the overall distribution, seasonal variation, and distribution characteristics along the streamlines and sections of the Muz Taw glacier in the study period. Finally, the effects of each factor on glacier surface motion displacement are discussed in the context of topography, glacier thickness, and climate data. This could provide a reference for comprehensively understanding the characteristics of the 3D surface motion displacement of mountain glaciers at high latitude in China.
2. Materials and Methods
2.1. Study Region
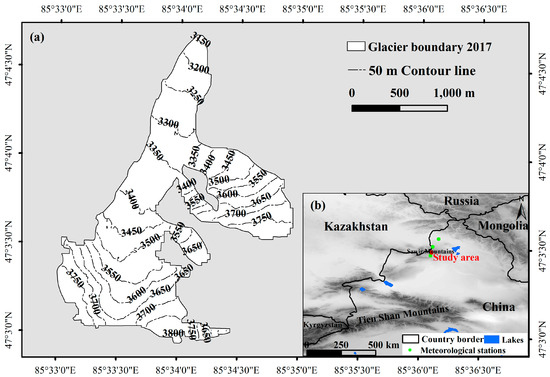
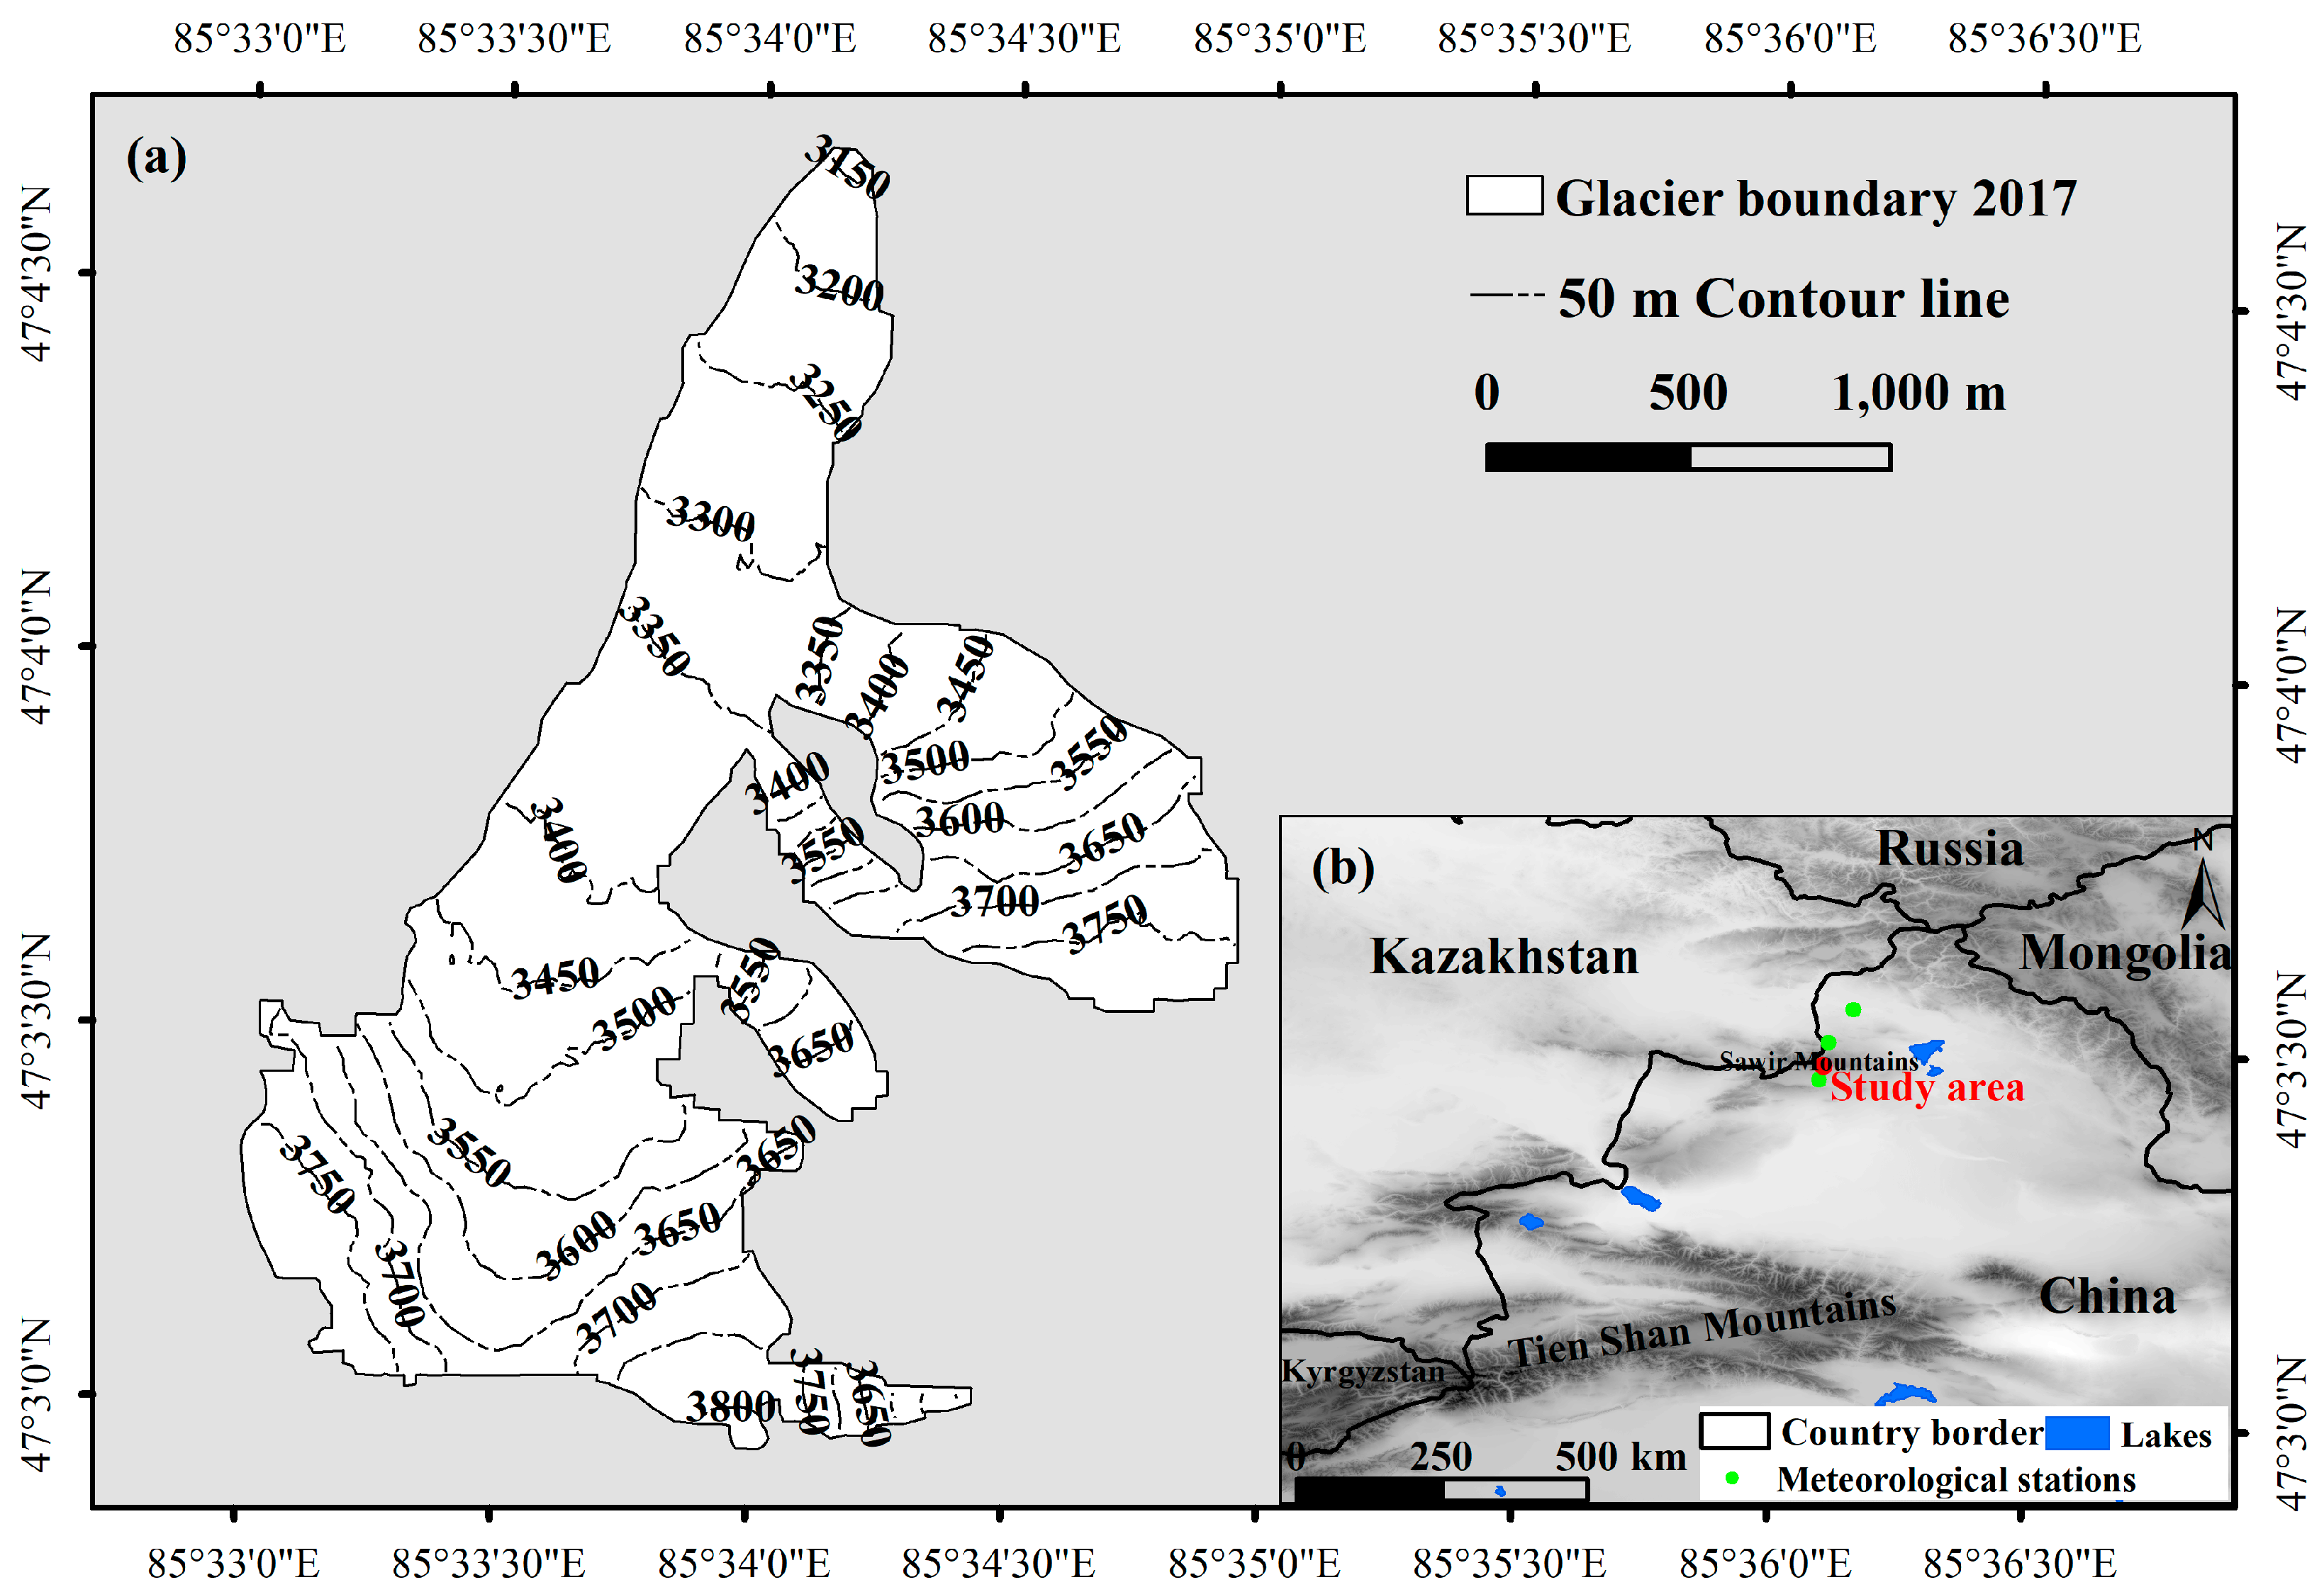
The Sawir Mountains, which straddle the border between China and Kazakhstan, are the transitional section between the Tian Shan Mountains and the central Altai Mountains, located at 84°40′E to 86°30′E and 46°50′N to 47°20′N. The eastern section of Sawir Mountains is in China and stretches for more than 100 km in Jimunai County, Xinjiang (Figure 1). The Sawir Mountains are an extremely obvious watershed between the Arctic Ocean and the inland water system of Xinjiang [69]. For the Sawir Mountains, the ablation of the glaciers is more intense than the global average, and the total area of the glaciers reduced by 46% from 23 km2 in 1977 to 12.5 km2 in 2017 [70].
Figure 1.
Study site description: (a) Muz Taw glacier boundary in 2017. (b) Location map of Muz Taw glacier.
The Muz Taw peak (47°04′N, 85°34′E) is the main peak of Sawir Mountains, with an altitude of 3835 m. It is located on the north side of Sawir Mountains and 45 km south of Jimunai County. The Muz Taw glacier is the only surface water source in Jimunai County, and half of the county’s drinking water is supplied by the Muz Taw glacier. The Muz Taw glacier has been in a state of continuous decline since 1959; in the past 20 years especially, it has been in a rapid and accelerated state of shrinkage [70,71].
2.2. Data
Sentinel-1 series images (downloaded from https://qc.sentinel1.eo.esa.int/, accessed on 16 April 2020) were used for extraction of the Muz Taw glacier 3D surface motion displacement. Interferometric Wide Swath (IWS), VV polarization Sentinel-1A ascending, and Sentinel-1B descending track single look complex images were selected. Due to the absence of Sentinel-1B descending images between 27 August 2018, and 13 May 2019, the end date was selected as the Sentinel-1B image on 15 August 2018. Sentinel-1A ascending and Sentinel-1B descending images were dated only two days apart. They were approximately treated as the same date, and the dates of the Sentinel-1A ascending images (22 August 2017 to 17 August 2018) were used as the base. By limiting the time interval of image pairs to no more than 36 days, 29 ascending and 29 descending SAR images were acquired, and a total of 150 image pairs were selected, including 75 ascending and 75 descending pairs. For details on the data, see Table A1 and Table A2 in Appendix A.
SRTM1 Arc-Second data from 2000 with a resolution of 30 m were obtained from the International Scientific Data Mirroring Website of the Chinese Academy of Sciences Computer Network Information Center (http://datamirror.csdb.cn, accessed on 16 April 2020). SRTM-1 was used to extract the topographic factors of the Muz Taw glacier, as well as to be employed in master and slave image registration and geocoding as auxiliary data. Using SRTM-extracted topographic factors, it was resampled at a spatial resolution of 10 m, which was consistent with the spatial resolution of the remote sensing inversion results.
The meteorological data were mainly used to discuss the influence of climatic factors on glacier surface motion displacement. The meteorological data were obtained from the Chinese surface climate data set on the China Meteorological Science Data Sharing Service website (http://cdc.cma.gov.cn/, accessed on 16 April 2020). Three surface observation meteorological stations closest to the Muz Taw glacier were selected: Jimunai, Hebkeser, and Habahe. Temperature and precipitation data from 1961 to 2016 at these stations were used in our study.
3. Method
3.1. Inversion Method for 3D Surface Motion Displacement of Glacier
The inversion method for 3D surface motion displacement of the glacier based on Sentinel-1 imagery, including the offset tracking method, optimized the offset tracking results by iterative filtering, OT-SBAS technology, and conversion of the 3D surface motion displacement of the glacier [17]. The process of the method used was described in detail in our previous publications, and the feasibility of the method was verified using field measurement data. It is not described in detail in this article.
The correlation coefficients between the inverted and the measured displacement value of the west branch of Urumqi Glacier No. 1 in the east, north, and vertical directions were 0.78, 0.64, and 0.81, respectively, with root mean square errors of 0.015, 0.020, and 0.026 m, respectively. In the east direction, the average absolute value of the difference between the measured and the inversion value accounted for 16.5% of the average absolute value of the measured value. In the north direction, the ratio was 25.3%, and in the vertical direction, it was 17.1%. The accuracy level could satisfy the general requirement of 3D surface motion displacement monitoring of high-latitude mountain glaciers in China.
3.2. Estimation of the Displacement of Total 3D Surface Motion of Glacier
According to the 3D surface motion velocity of the Muz Taw glacier at each time period in different directions and the time interval of each period , the displacement in each direction could be obtained, and it was calculated using Formula (1) [56]:
where indicates the eastward, northward, and vertical directions.
The total 3D displacement could be obtained by combining the east displacement , north displacement , and vertical displacement , which was calculated using Formula (2) [53,55,56]:
3.3. Estimation of 3D Surface Motion Displacement of Glacier in Each Season
The seasonal periods of the Muz Taw glacier were divided into autumn (from September to November 2017), winter (from December 2017 to February 2018), spring (from March to May 2018), and summer (from June to August 2018). For the Muz Taw glacier, the 3D surface motion velocity in different directions was and the time interval of each period was , and based on length of each time period in each seasonal period, the displacement of each season could be calculated using the following formula [53,55,56].
Since the end time of the last period of the acquired Sentinel-1A image pair was 17 August 2018, the approximate displacement of summer—from 18 to 31 August 2018—was calculated using instead of the velocity of this period, as follows:
4. Results
4.1. Overall Distribution Characteristics of Muz Taw Glacier Displacement
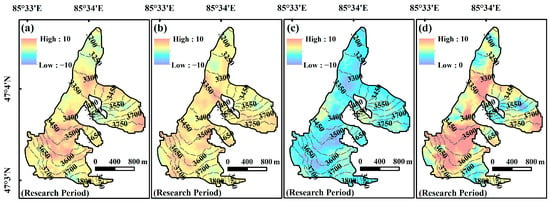
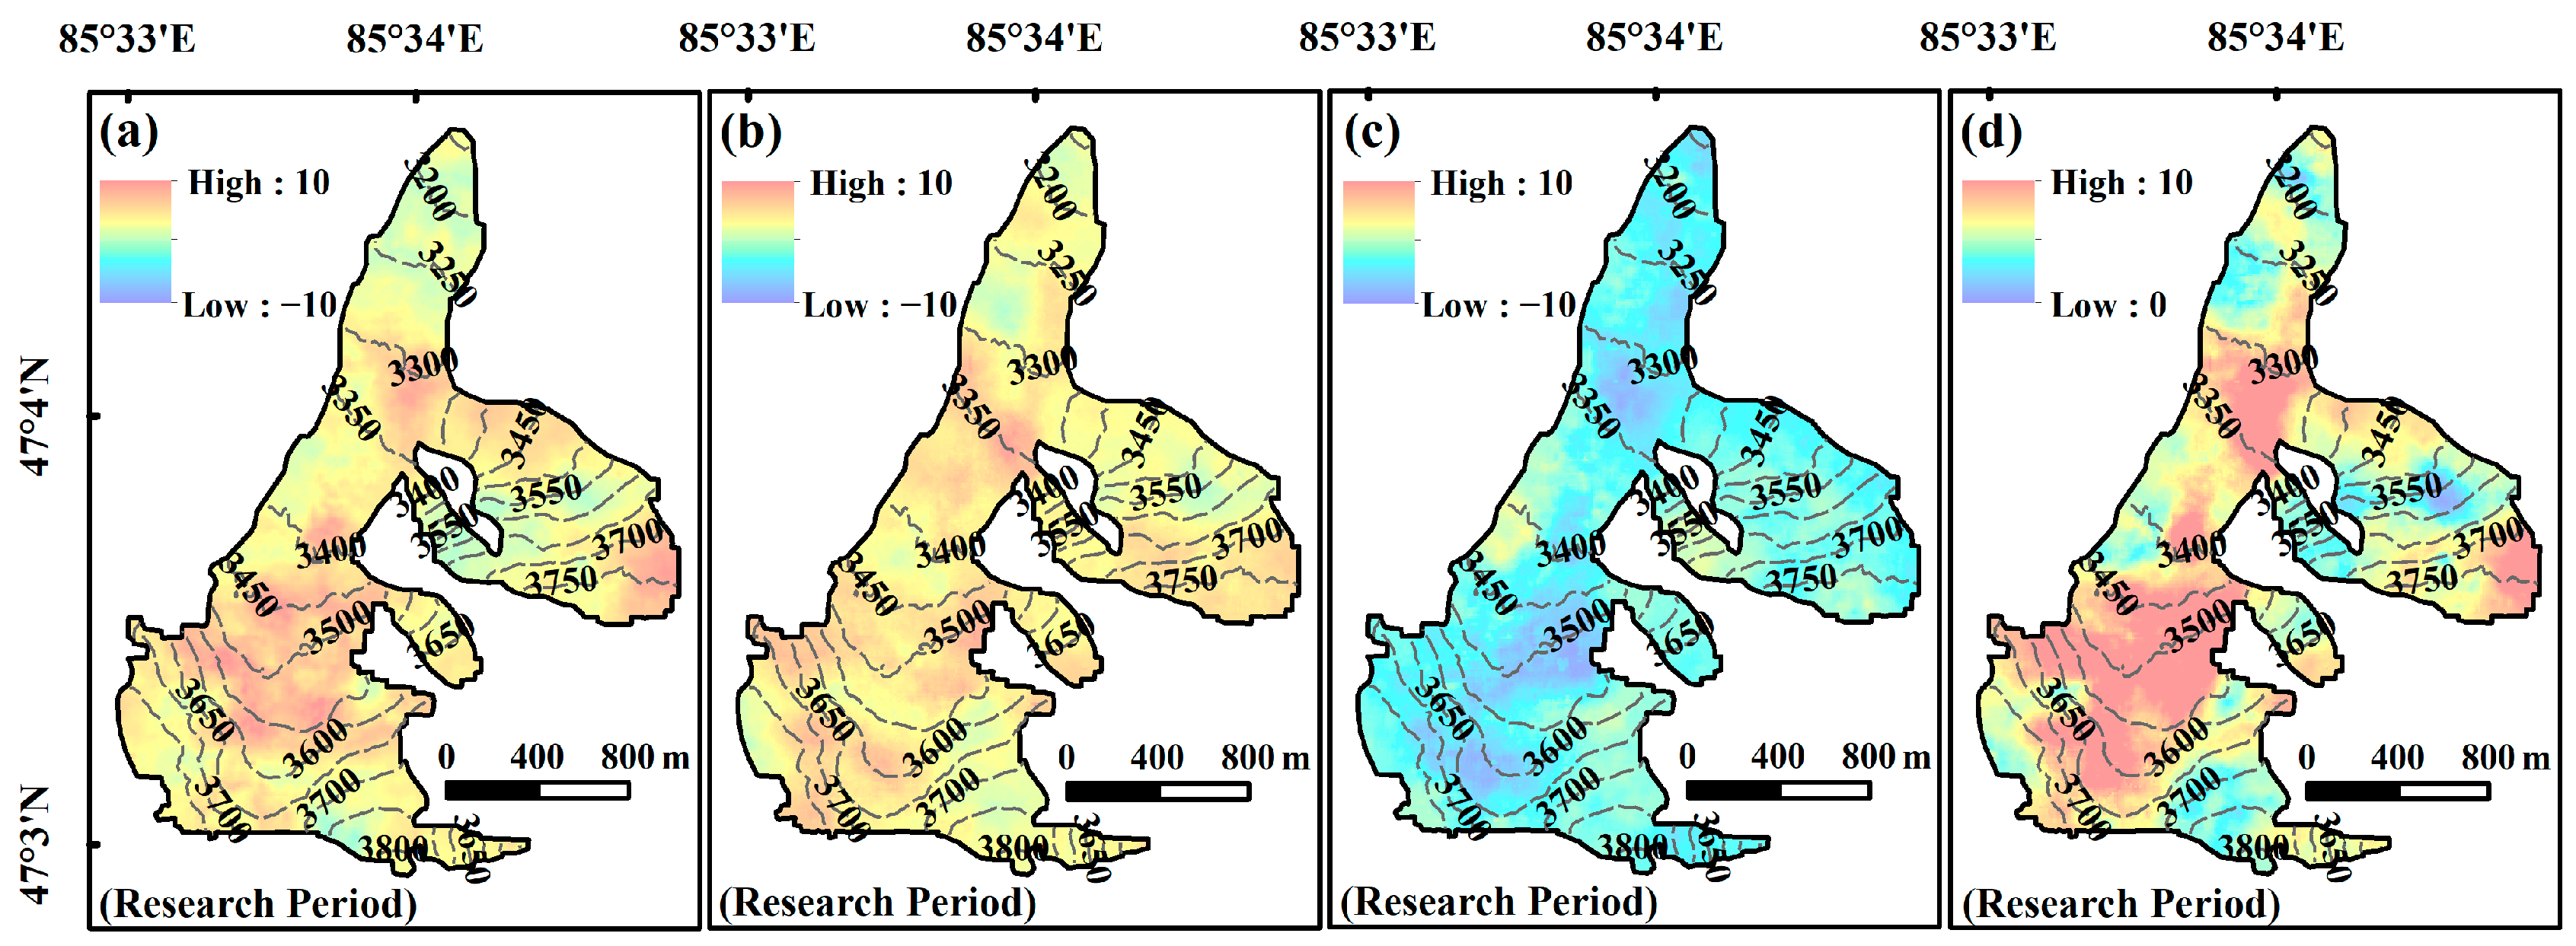
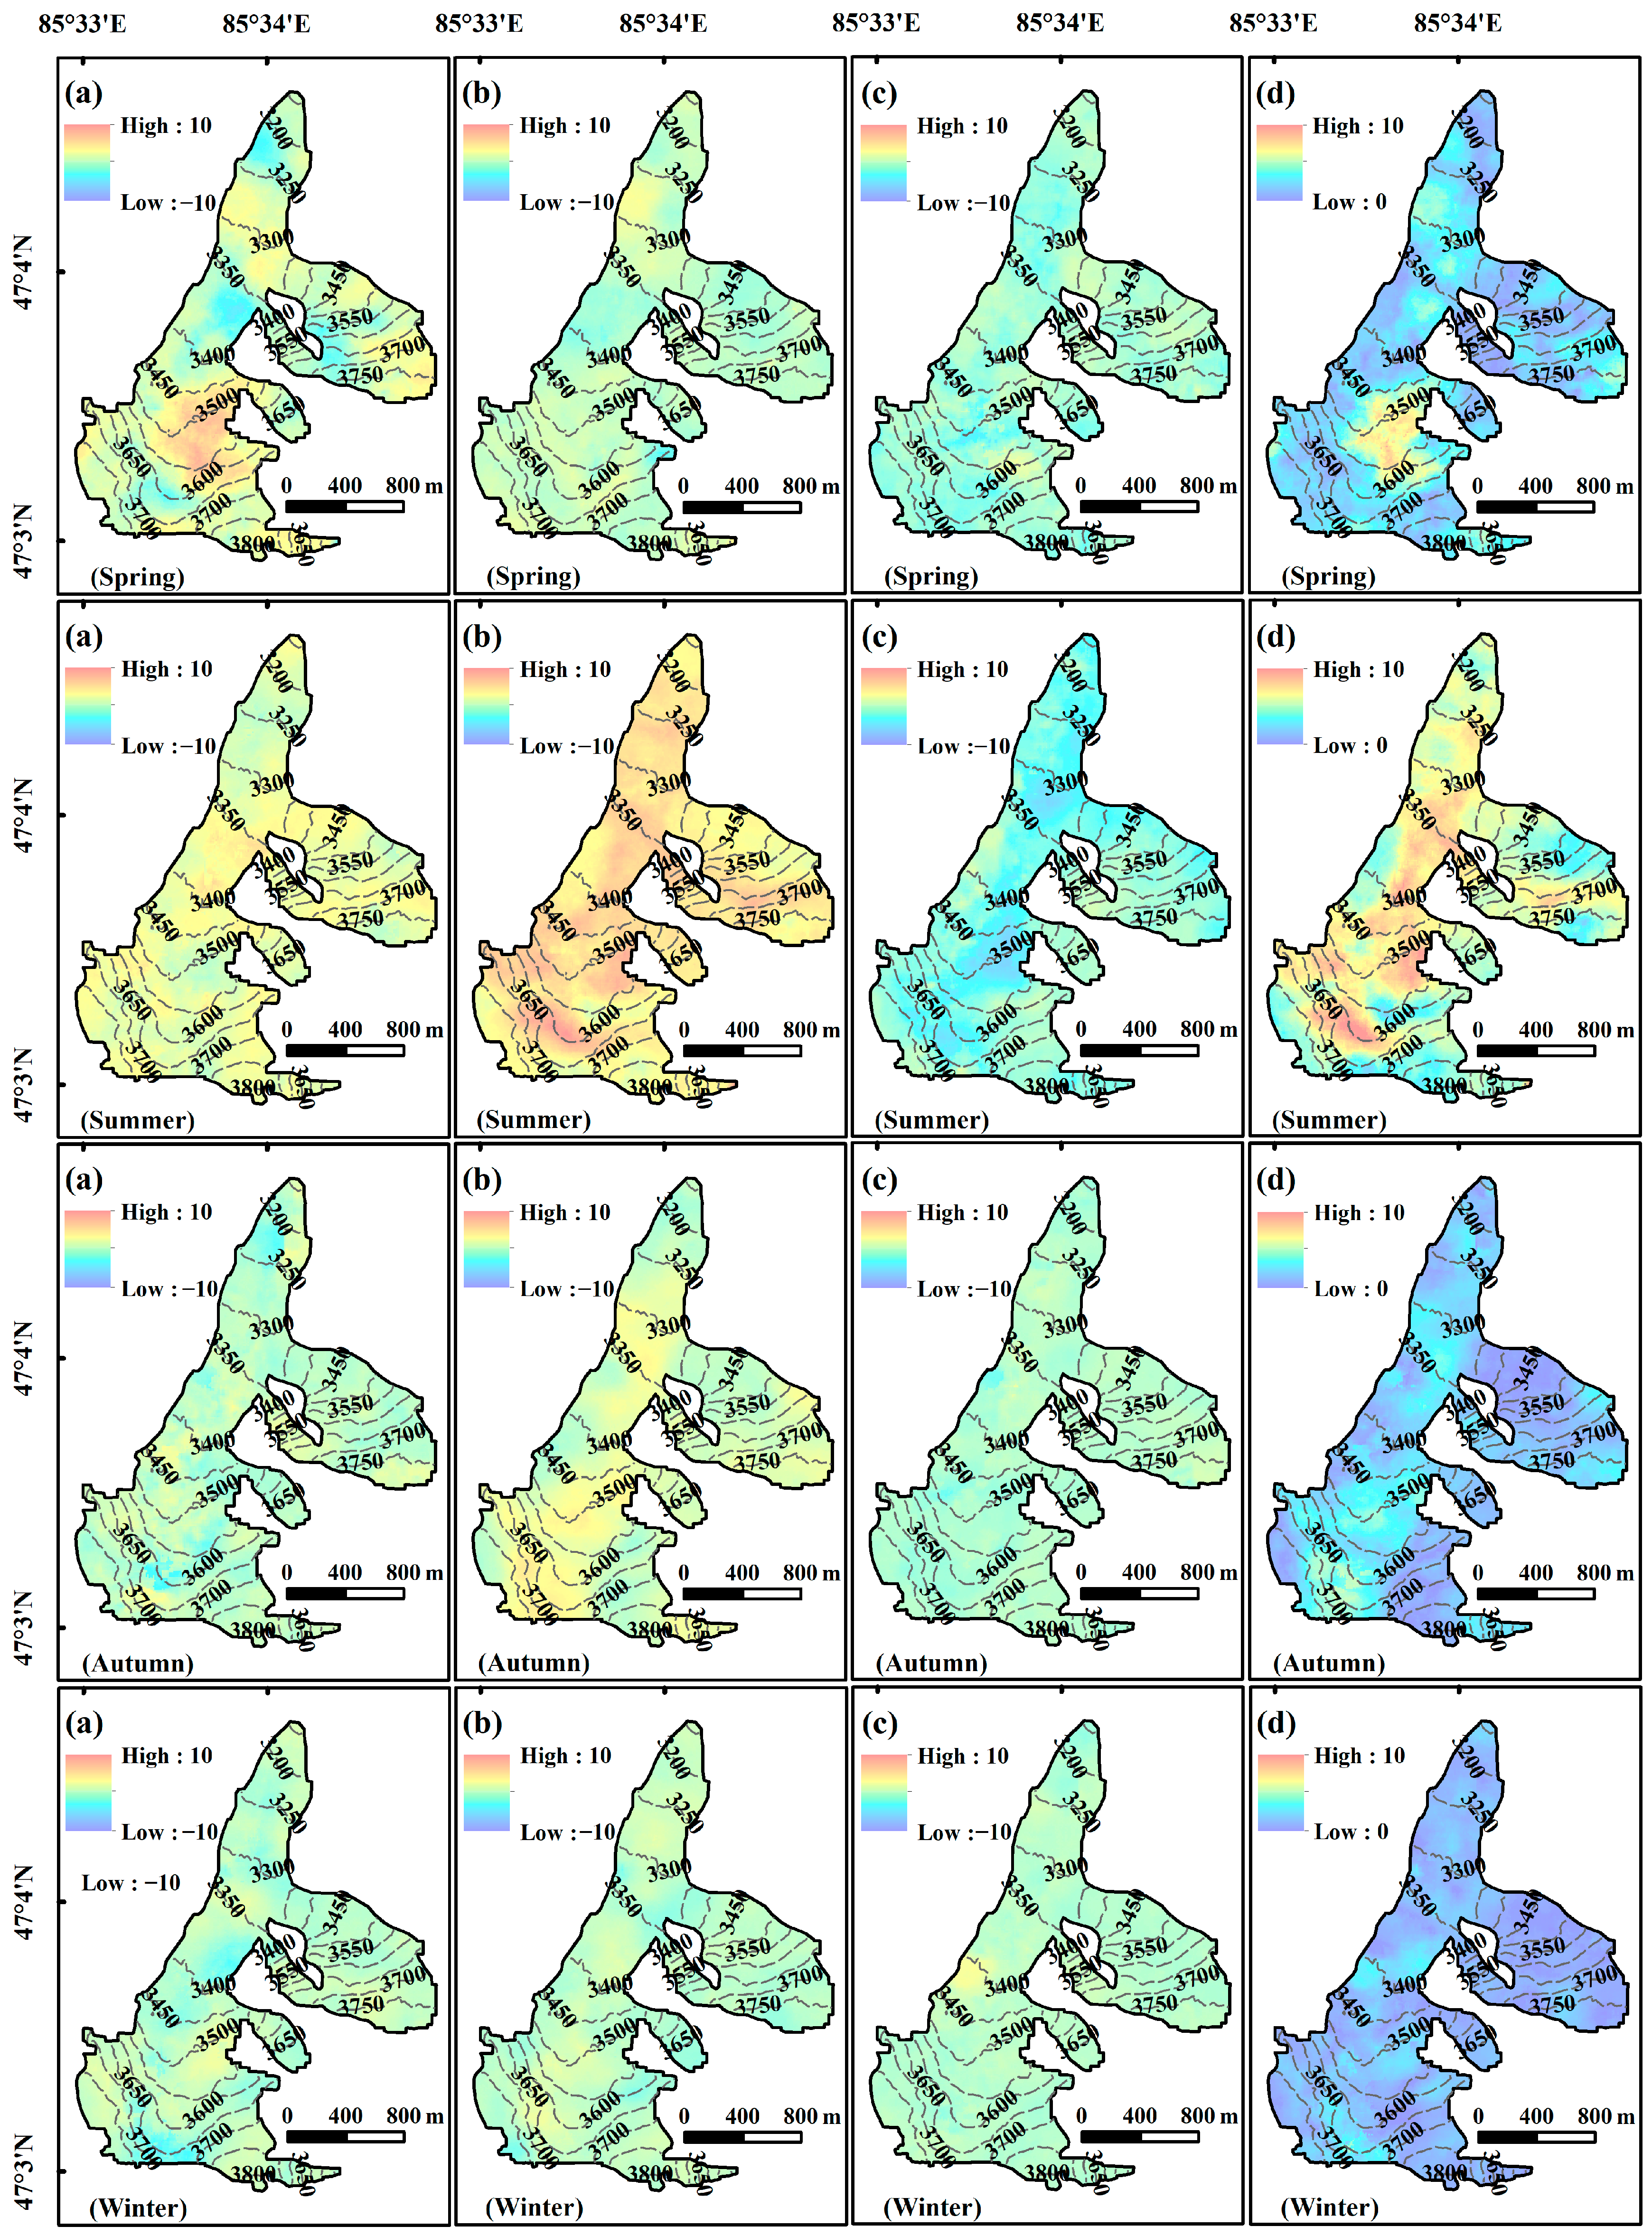
The 3D surface motion displacement of the Muz Taw glacier was estimated for the period from 22 August 2017, to 17 August 2018, and its distribution is shown in Figure 2.
Figure 2.
Spatial distribution of 3D surface motion displacement of Muz Taw glacier during the study period. (a) East, (b) north, and (c) vertical displacement, and (d) total 3D displacement.
During the study period, the total 3D displacement of the Muz Taw glacier ranged from 0.52 m to 13.19 m. The total 3D displacement of the glacier was 7.07 m, which was converted into a displacement rate of 7.17 m/a. The surface motion displacement rate of Chinese glaciers ranges from 0 to 515.4 m/a [72], and the flow rate of the Muz Taw glacier is significantly smaller than that of most glaciers in China. Meanwhile, the east and north displacements of the whole glacier were determined to be 4.27 and 4.07 m, respectively, which were converted into displacement rates of 4.33 and 4.13 m/a, respectively. By combining the east and north displacements, it can be seen that the horizontal displacement of the Muz Taw glacier was 5.90 m, with a displacement rate of 5.98 m/a.
From the analysis of the distribution of the total 3D displacement of the Muz Taw glacier in Figure 2d, it could be found that the displacement in the higher elevation area was higher than that in the lower elevation area. The regions with high values of total 3D displacements were mainly distributed near the regions of the main glacier at 3300–3350 and 3450–3600 m above sea level. From the firn basin in the upper reaches to the terminus, the total 3D displacement showed the distribution characteristics of increasing and then decreasing, increasing, and decreasing. At the location where the tributary glaciers converge, the total 3D displacement was significantly larger than those of the other surrounding areas.
The above distribution characteristics were mainly due to the fact that the change in the glacier surface elevation affects the total 3D displacement to a certain extent. In addition, the transformation of the surface feature structure plays a key role in glacier surface movement, and the accumulation and exchange of glacier mass were also important factors affecting the accelerated movement of the glacier. Considering the results of distribution of the displacement of the Muz Taw glacier in the eastward, northward and vertical directions, it could be seen that in the firn basin area upstream from the glacier, the accumulation of glacier mass was greater than the loss of mass, and the glacier was in an accumulation state with relatively small displacement. However, when the glacier moved from upstream to the middle, the elevation of the glacier decreased rapidly, the slope increased rapidly, and the sections of the glacier narrowed and the longitudinal slope became steeper, so the glacier mass in part of the higher elevation area might have transferred rapidly to lower elevation areas. Therefore, the displacement of the glacier would have increased sharply, easily generating an extreme value near the mass balance line. In the terminus of the glacier, the terrain gradually became relatively gentle and the surface displacement also decreased. When the tributary glacier merged into the main glacier, its elevation also decreased rapidly, its slope increased rapidly, and the mountain section narrowed; thus, the displacement of the glacier at the convergence location increased.
4.2. Seasonal Variation in Muz Taw Glacier Displacement
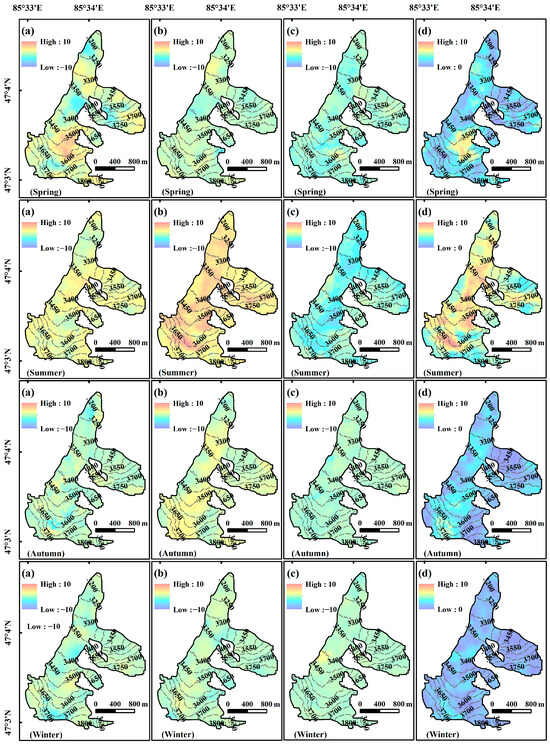
Figure 3 shows the distribution of the 3D surface motion displacement of the Muz Taw glacier in different seasons. There were clear seasonal differences in glacier surface motion displacement in the study area, among which the displacement was larger in summer, followed by spring, with similar and minimal displacements in autumn and winter. The high value of glacier surface displacement in spring was near the east side of the main glacier from 3450 to 3550 m above sea level. The high value of glacier surface displacement in summer was located near the east side of the main glacier at an altitude of 3300 to 3550 m and near the middle of 3550 to 3700 m above sea level, which was similar to the distribution of the high value of total 3D displacement throughout the study period. The high-value area of glacier surface displacement in autumn was distributed in the middle of the upper reaches of the main glacier at an altitude of 3600 to 3750 m. In winter, the high value of glacier surface displacement was mainly found near 3400 m above sea level of the main glacier and in the middle area of 3600–3700 m upstream from the glacier.
Figure 3.
Spatial distribution of 3D surface motion displacement of Muz Taw glacier during the study period. (a) East, (b) north, and (c) vertical displacements, and (d) total 3D displacement.
The displacements of the whole glacier were determined in different seasons, and the results are shown in Table 1. It can be seen that the total 3D displacements of the Muz Taw glacier in different seasons were as follows: 2.58 m in spring, 5.95 m in summer, 1.95 m in autumn, and 1.20 m in winter. The displacement in summer was significantly higher than that in other seasons, which was consistent with the flow characteristics of continental glaciers in China [15]. The reasons why the displacement of the Muz Taw glacier was significantly higher in summer than that in other seasons were as follows: the summer temperature is higher than that of other seasons, resulting in the formation of large amounts of glacier meltwater, which penetrated into the ice bed. This reduced the frictional resistance to glacier sliding and thus increased the glacier surface motion velocity. On the other hand, the Muz Taw glacier is a summer-accumulation-type glacier, and high precipitation or an increase in ablation water caused by the temperature increase during summer may have led to the increase in hydrostatic pressure on the glacier, which led to a peak in the surface motion velocity. However, glacier freezing in autumn and winter would correspondingly increase the resistance to sliding at the bottom, which would reduce the surface motion velocity and the displacement of the glacier.
Table 1.
Statistics of displacements in various directions of the Muz Taw glacier in different seasons.
4.3. Variation in Muz Taw Glacier Displacement Along Centerline and Profiles
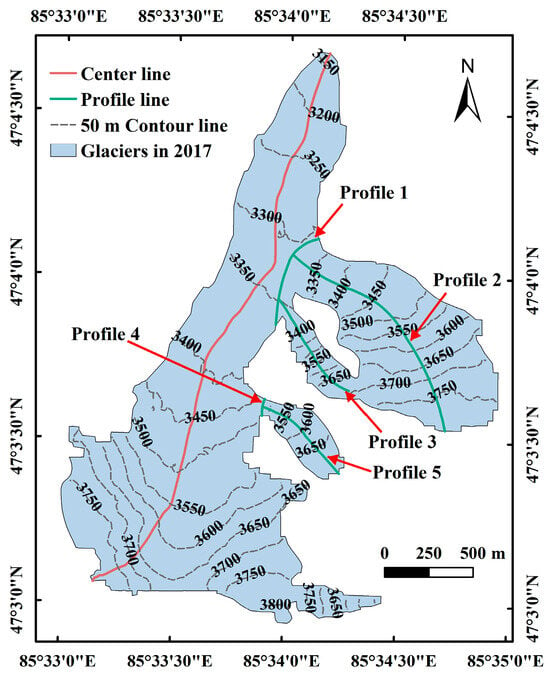
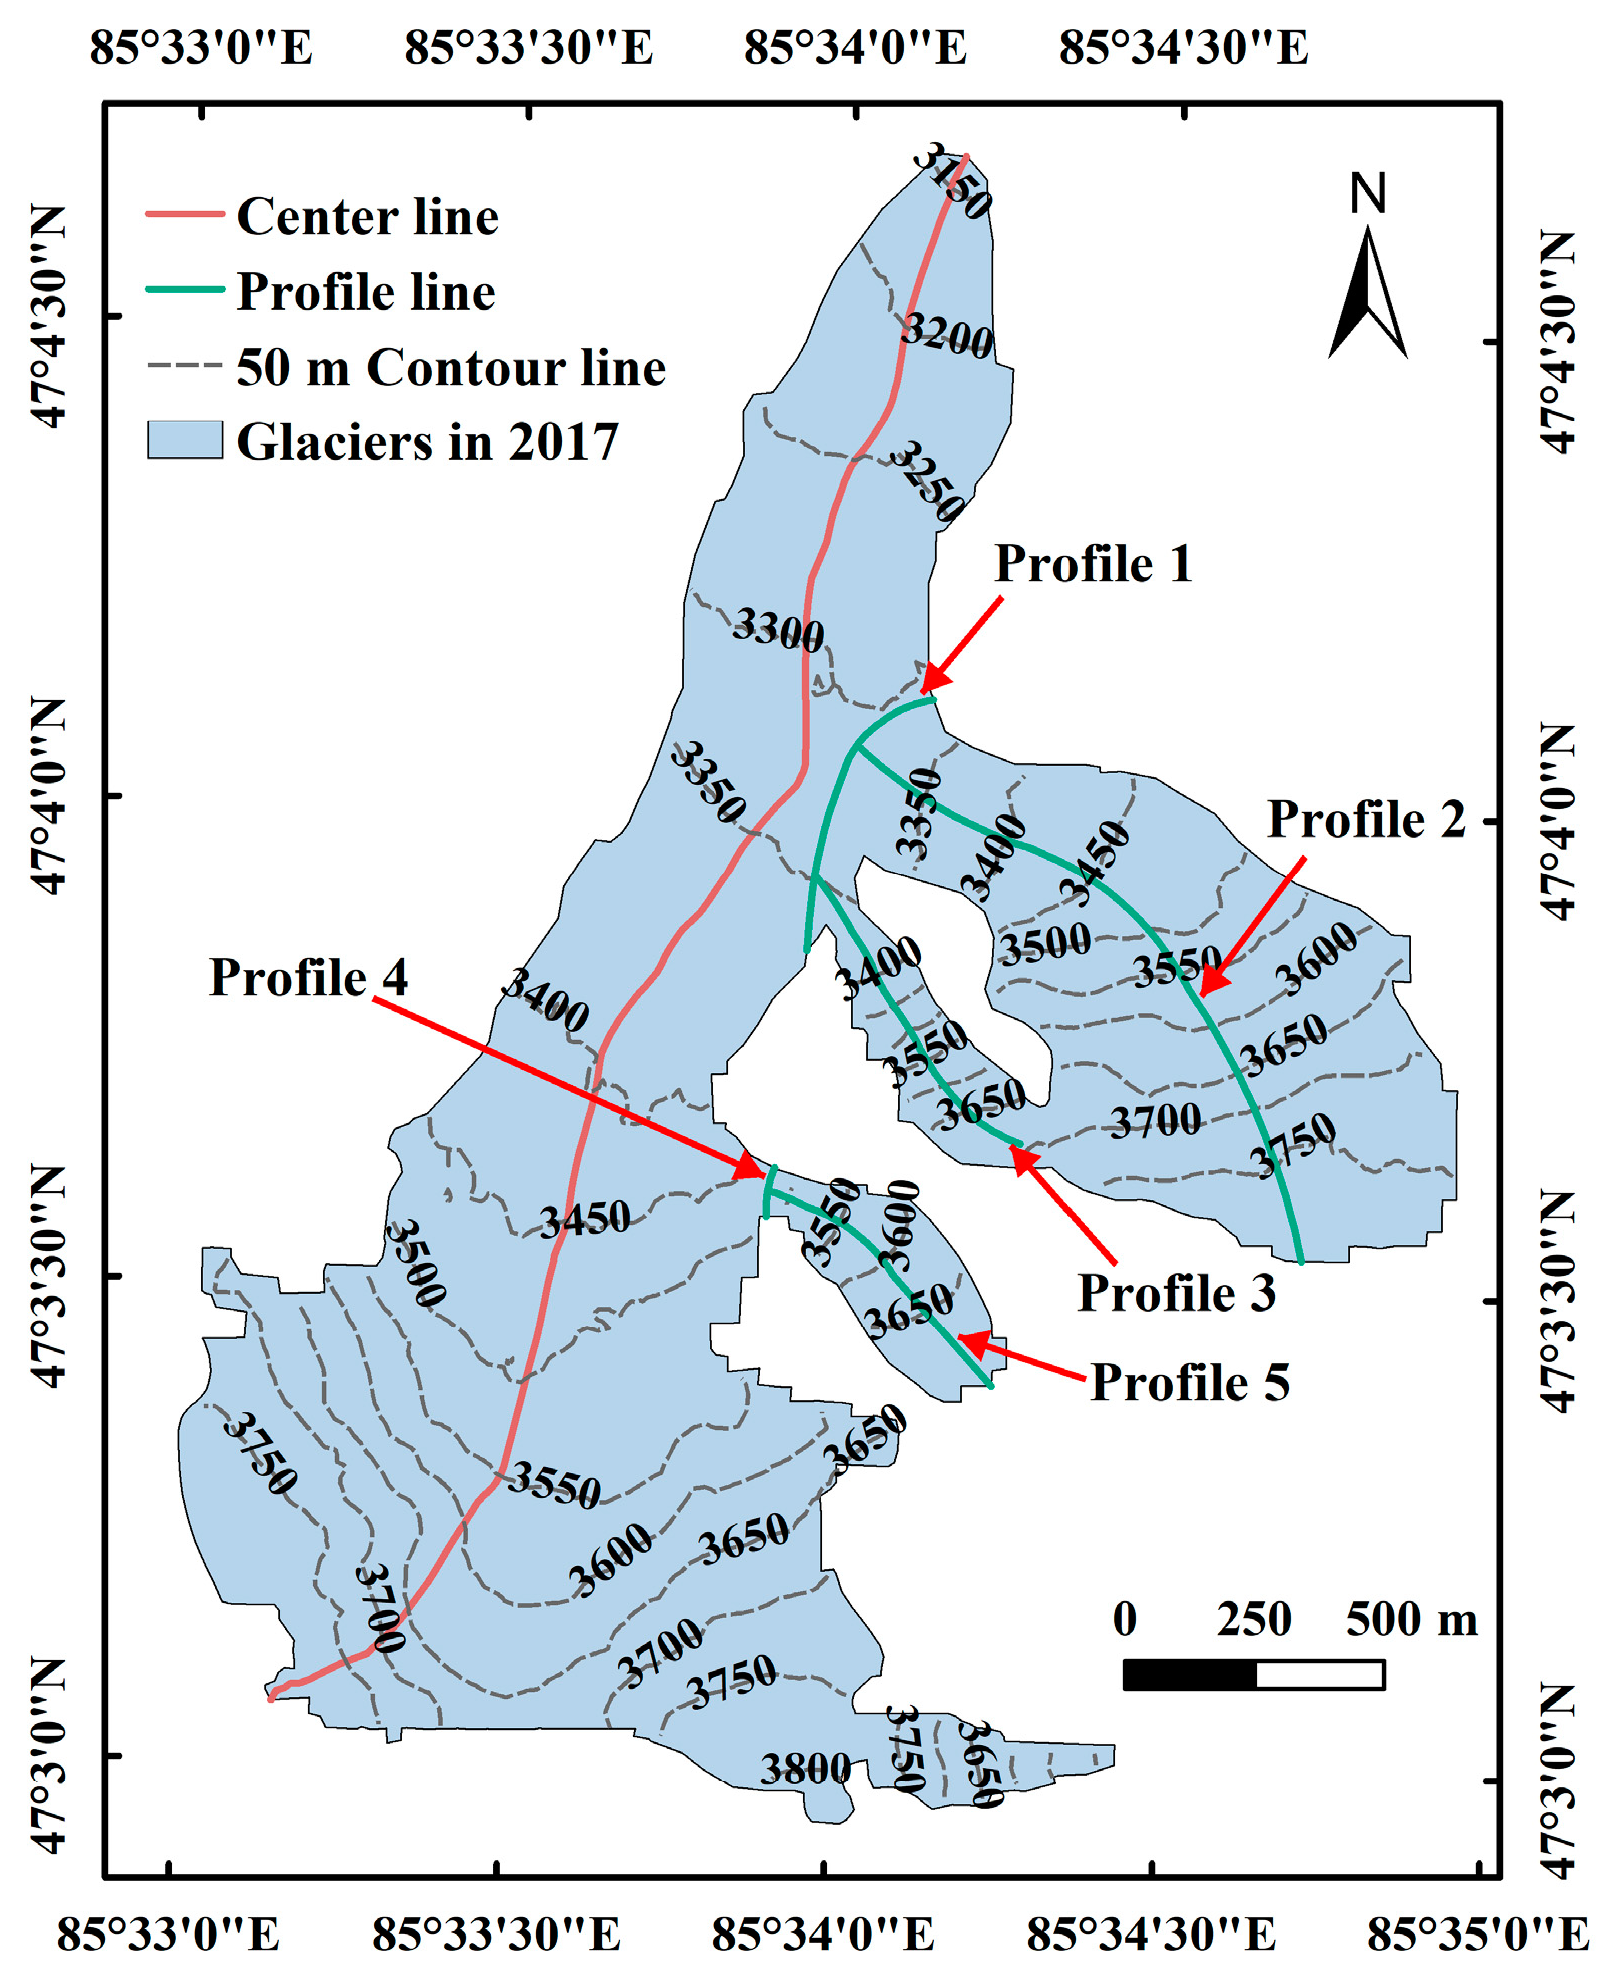
We used the automatic extraction method of the glacier centerline designed by Yao et al. [73] to calculate and extract the centerline of the Muz Taw glacier, as shown in Figure 4. The length of the centerline of the Muz Taw glacier, which was the length of this glacier, was measured to be 3406.35 m.
Figure 4.
Distribution of centerline and profile lines in Muz Taw glacier.
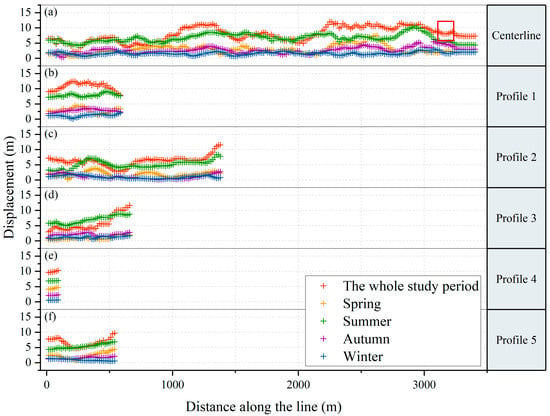
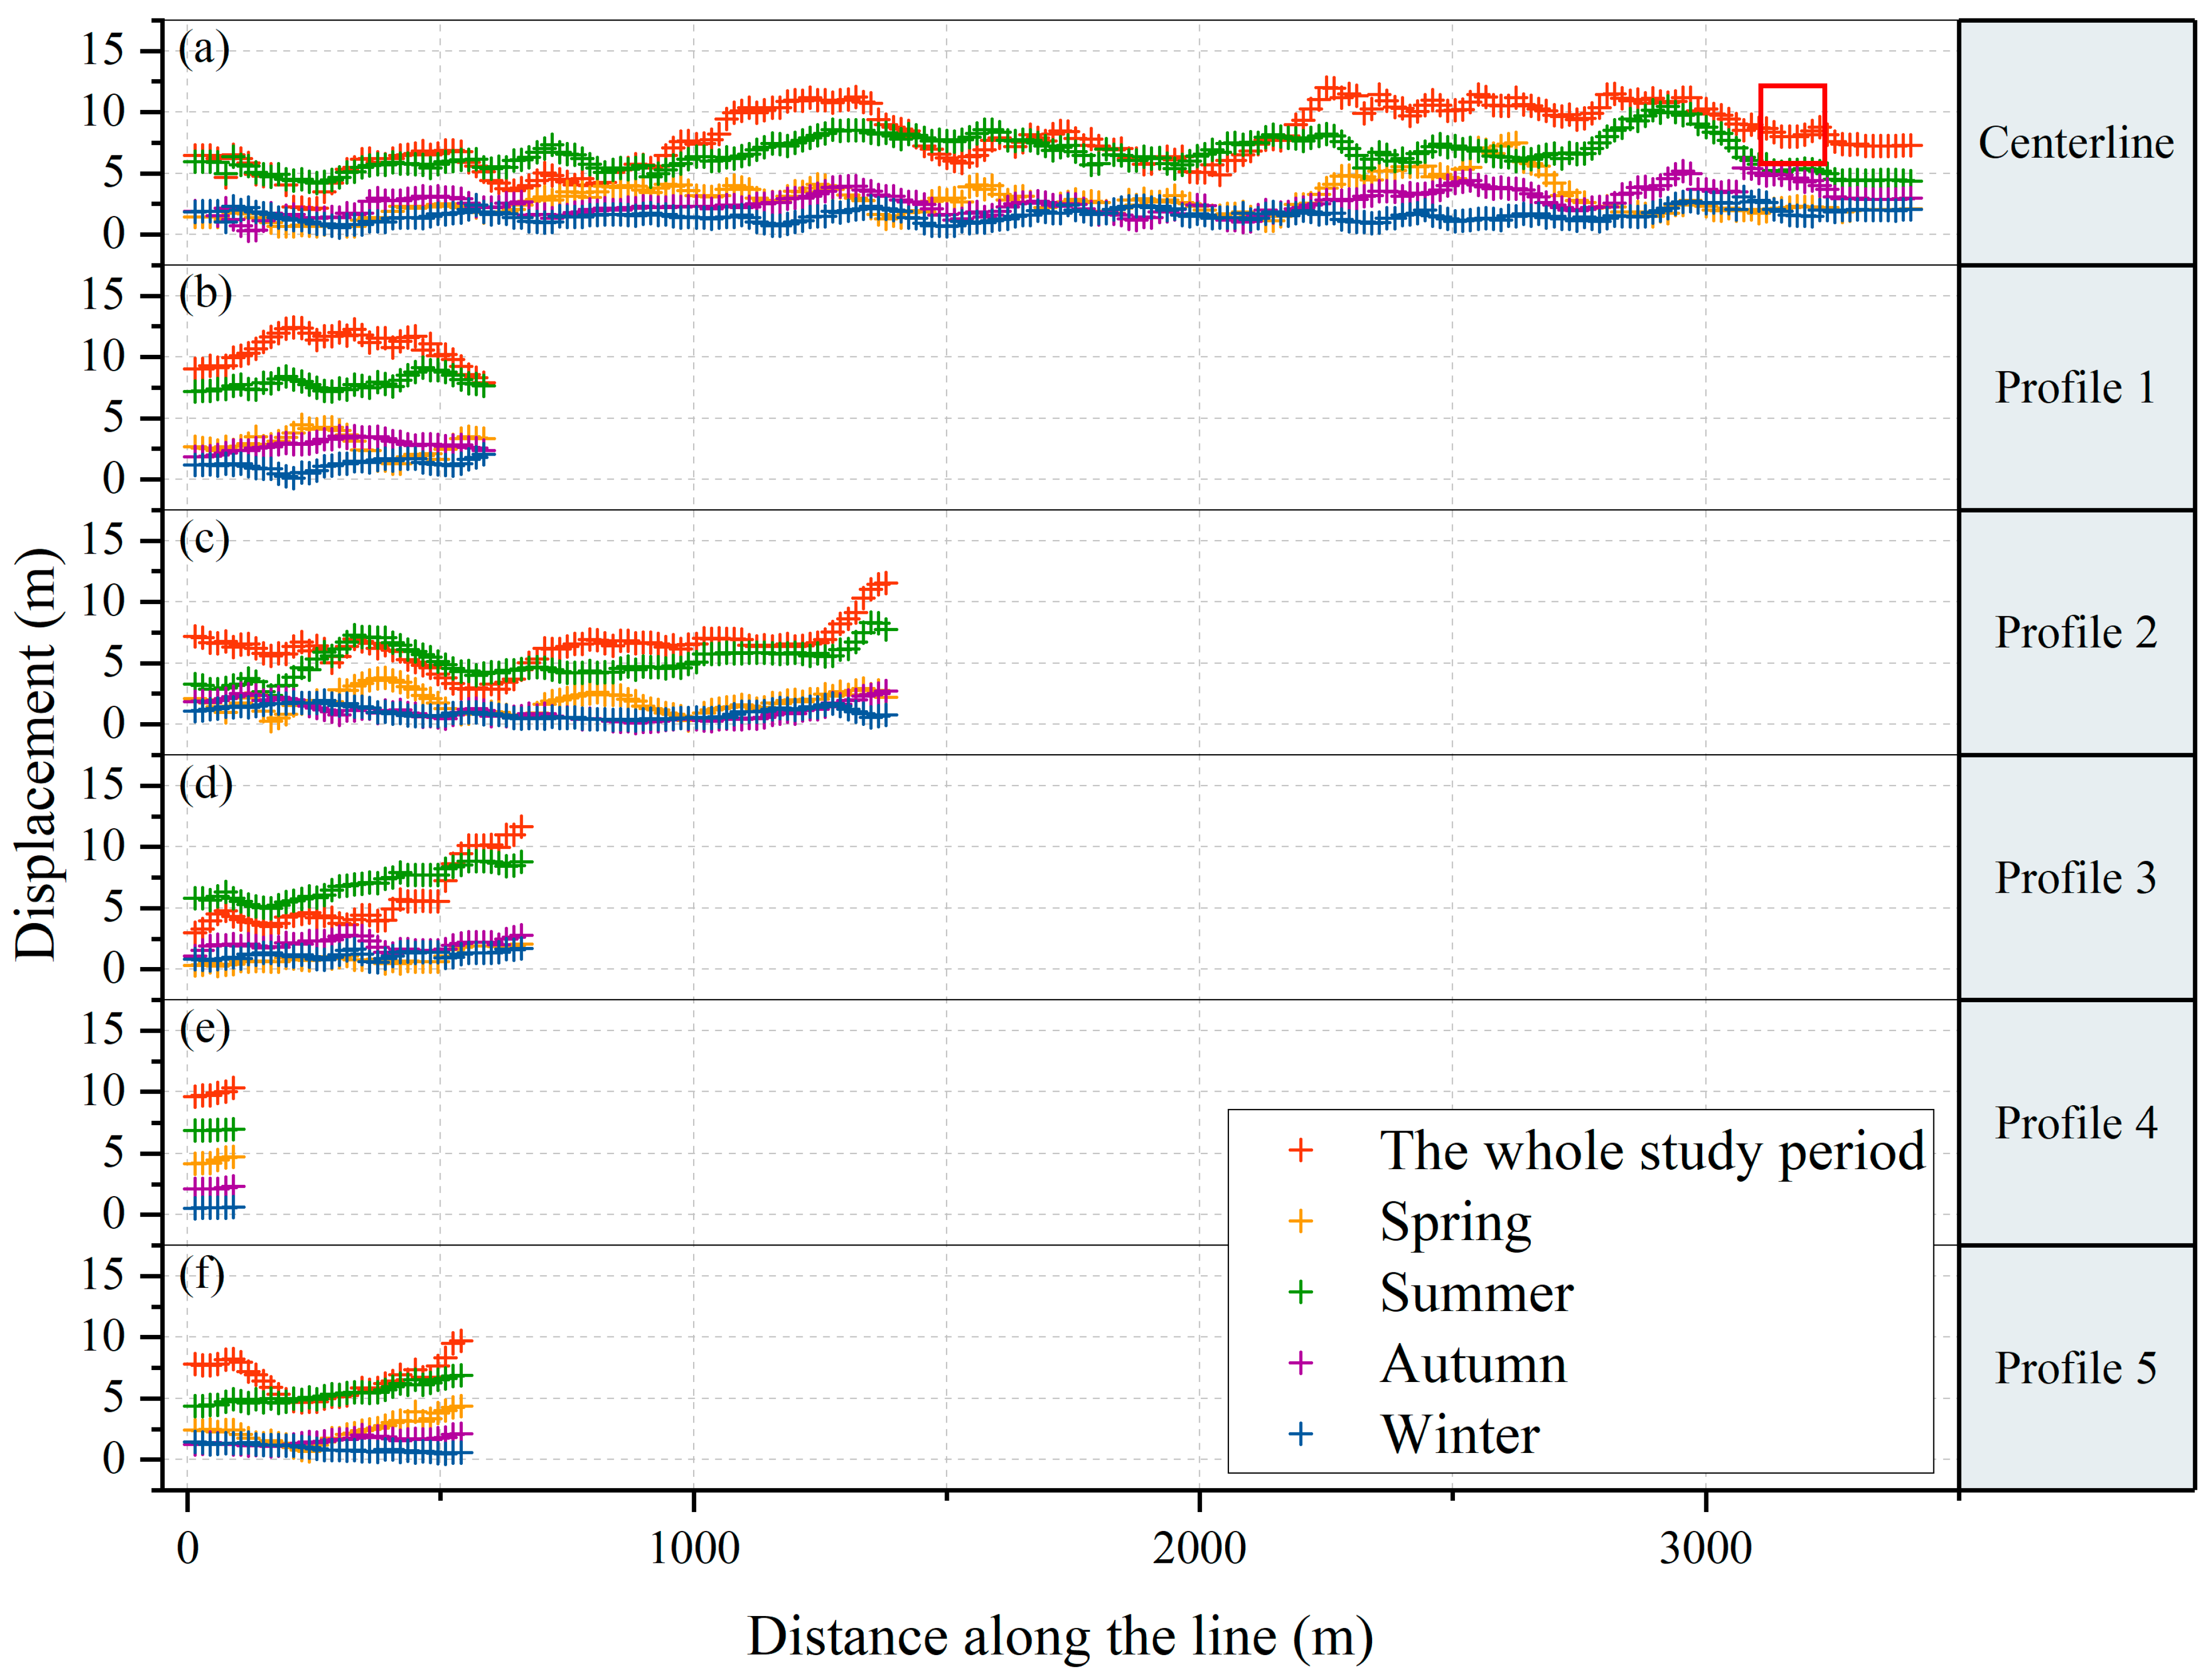
As could be seen from Figure 4, the Muz Taw glacier trunk had three tributaries converging near 3300, 3350, and 3450 m. Therefore, to accurately analyze the glacier surface displacement characteristics, a total of five profiles were selected at the confluence and tributaries to explore the changes in displacement of the glacier tributaries as they converged into the glacier trunk in detail. The extracted total 3D displacement of the glacier along the centerline and the five profiles for the entire study period and for each season is shown in Figure 5. The beginning of the centerline was the terminus of the glacier; profiles 1 and 4 started at the northern end of the profile; and profiles 2, 3, and 5 started at the side with higher elevation.
Figure 5.
Total three-dimensional displacements of the centerline and five profiles of the Muz Taw glacier.
For the convenience of statistics, the centerline and profile lines were converted into points to obtain the total 3D displacement of glaciers for each pixel where each point was located, where the distance between adjacent points was 15 m. Figure 5a–f show the changes in total 3D displacement of the Muz Taw glacier along the centerline and the five profiles from the beginning to end, respectively.
As shown in Figure 5a, the total 3D displacement of the glacier varied greatly along the centerline throughout the study period and in spring, summer, and autumn, while the change was relatively gentle in winter. At distances of 1–1.5 and 2.5–3 km along the centerline, the total 3D displacement of the glacier had a relatively clear rising trend throughout the whole study period and in all seasons, and these locations were the same locations as the elevation area, demonstrating a high total 3D displacement, described in the summary of Section 4.1 and Section 4.2. The statistics of the total 3D displacement of the glacier at each time period showed that the average value of the whole study period on the centerline was 7.83 m, and the average values of the total 3D displacement of spring, summer, autumn, and winter were 2.80, 6.60, 2.63, and 1.60 m, respectively, which were closer to the average values of the total 3D displacement of the whole glacier at each corresponding time period.
Combining (b)–(f) in Figure 5, it could be seen that the total 3D displacement of the Muz Taw glacier was generally the largest in summer, followed by spring, autumn, and winter, and this feature is most clear in Figure 5e. The total 3D displacement was lower and less variable in winter for all five profiles.
The trend of point values in Figure 5b roughly showed the characteristics of being high in the middle and low on both sides, which was due to the fact that although the convergence of the tributary into the glacier trunk increased the displacement of the convergence area, the area of displacement increase was limited, and its influence on the displacement upstream and downstream from the convergence area decreased slowly and relatively with the increase in the distance from the convergence area.
In Figure 5b–f, profiles 2, 3, and 5 showed similar characteristics of variation; when the distance along the profile approached the end of the profile, there was a rapid increase in the total 3D displacement throughout the study period and all seasons. This variation also reflected that the convergence of the tributary into the glacier trunk drove the acceleration of glacier surface motion, which resulted in an increase in surface motion displacement. Figure 5c,d,f show that the total 3D displacement at some locations on the glacier was larger in summer than in the whole study period. This was due to the fact that the total 3D displacement in summer was relatively high and accounted for a large proportion of the total displacement, while the movement of the glacier might have reversed in seasons other than summer, resulting in negative values. Thus, negative values at these locations would lead to smaller total 3D displacements in the whole study period than in summer when considering the whole study period.
5. Discussion
5.1. Effect of Topography on the Surface Motion Displacement
- (1)
- Elevation
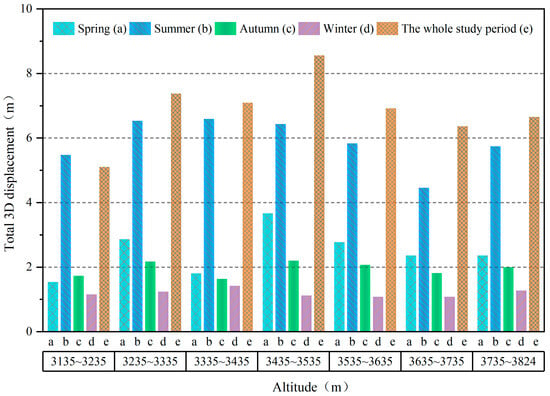
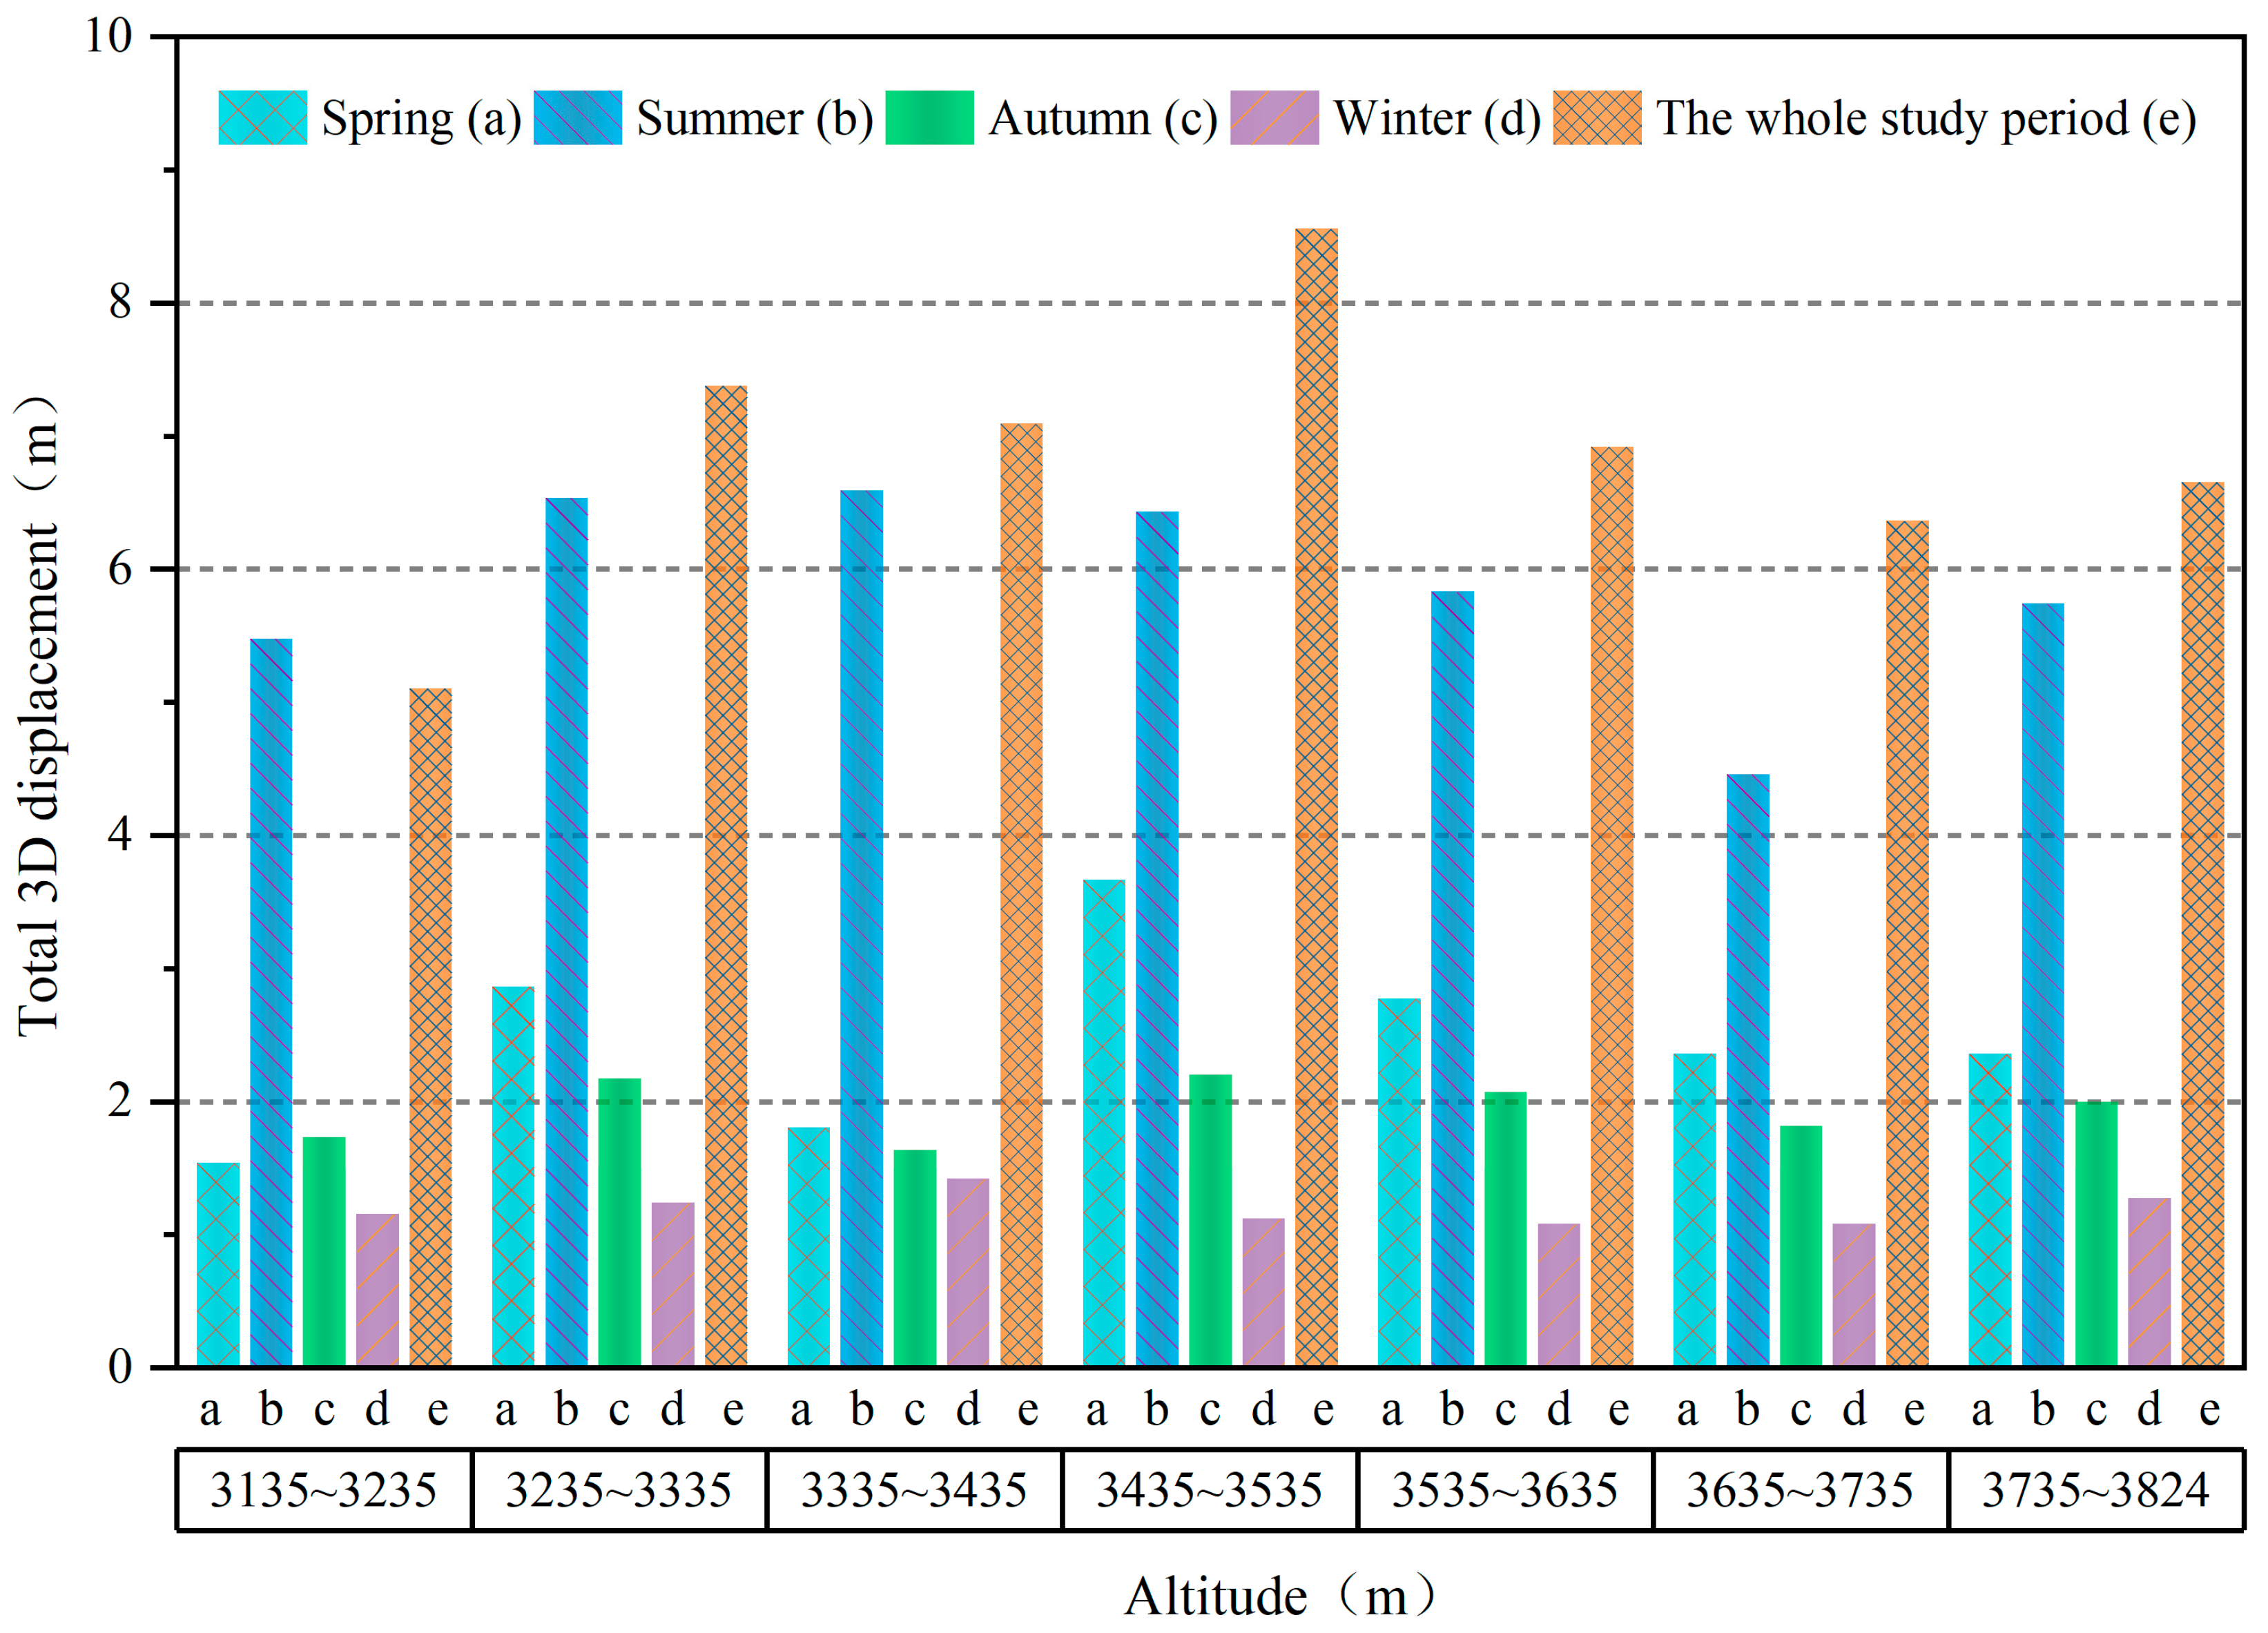
Starting from the end of the Muz Taw glacier, every 100 m increase in elevation was divided into an elevation band, and the glacier area with an elevation of 3135–3824 m was divided into seven elevation zones. The total 3D displacements of the Muz Taw glacier in spring, summer, autumn, winter, and the whole study period were statistically obtained in each altitude zone, and the glacier movement displacement conditions in different periods of time in each altitude zone were obtained, as shown in Figure 6.
Figure 6.
Total three-dimensional displacement of the Muz Taw glacier at different altitude zones.
From Figure 6, it can be seen that the total 3D displacement was at a maximum throughout the study period in all elevation zones except for the elevation zone of 3135–3235 m, followed by summer, spring, and then autumn, with a minimum in winter. In winter, the total 3D displacement of the glacier showed a gentle fluctuating trend in all altitude zones, while it generally increased and then decreased with increasing altitude in all other seasons, which was consistent with the results of Li et al. [74] and Zhang et al. [75]. The maximum values were mainly concentrated in the elevation zone of 3335–3535 m. As shown in Figure 2, the tributary glacier of the Muz Taw glacier was located in the 3335–3535 m altitude zone. Therefore, the increase in glacier displacement in this altitude zone was caused by the tributary glacier merging into the main glacier. It also shows that the elevation had a limited effect on the surface motion displacement of the glacier, and the change in topography had a greater effect on it.
The determination of the glacier equilibrium line usually requires a large amount of a priori knowledge, and the height of the equilibrium line varies from time to time and from space to space, so it is difficult to estimate precisely. For a single glacier, in the longitudinal section, the glacier flow velocity usually increases from the top of the accumulation zone downward, reaching a maximum at the glacier equilibrium line, and then decreases toward the terminus of the glacier. Therefore, combined with Figure 6 and taking into account the conclusion that the maximum value of total 3D displacement of each season due to the confluence of tributaries into the glacier trunk was mainly concentrated in the elevation zone of 3335–3535 m, it could be seen that the total 3D displacement in the upper part of the Muz Taw glacier was the largest in each season between 3535 and 3635 m, except for the elevation zone of the confluence of tributaries into the glacier trunk. Based on the red box in Figure 5a, the initial high glacier centerline from upstream to downstream of the total 3D displacement was in the elevation range of 3562–3618 m. It could be inferred that the equilibrium line of the Muz Taw glacier was in the elevation range of 3562–3618 m.
- (2)
- Slope
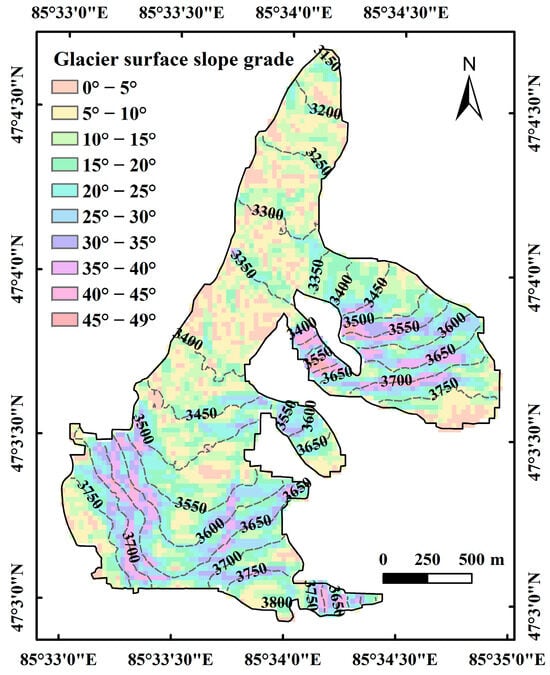
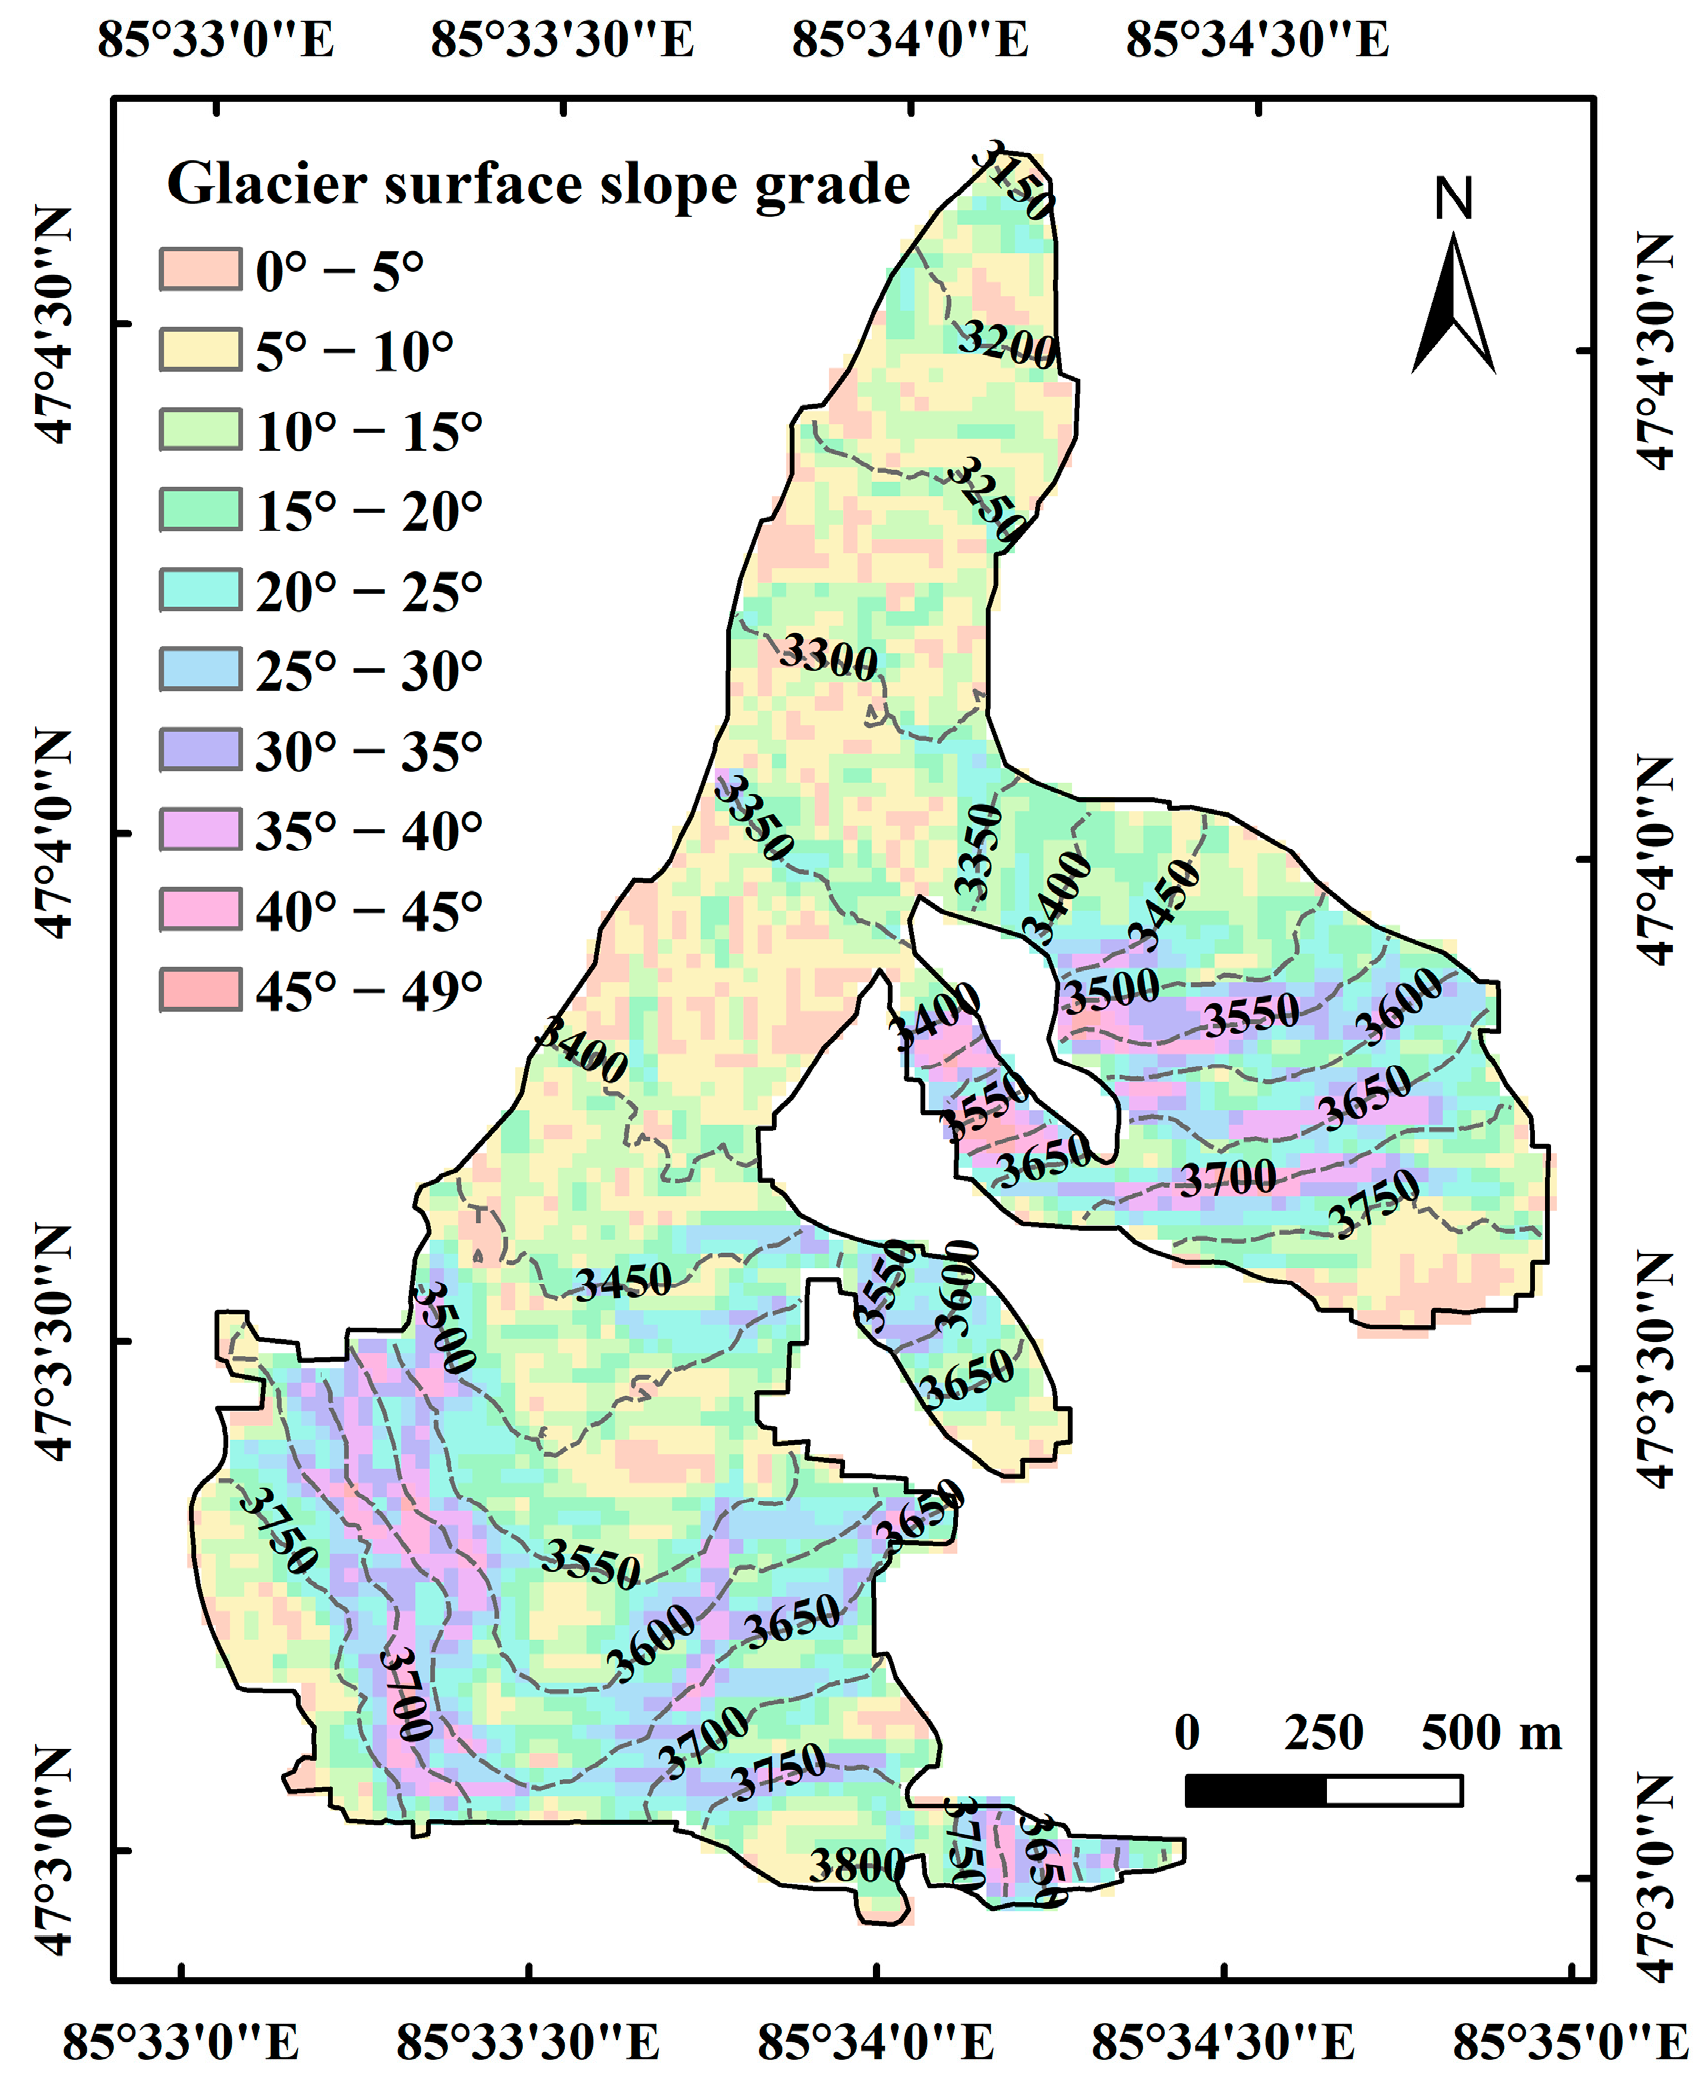
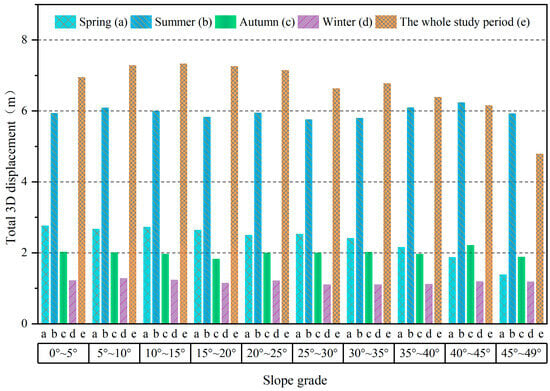
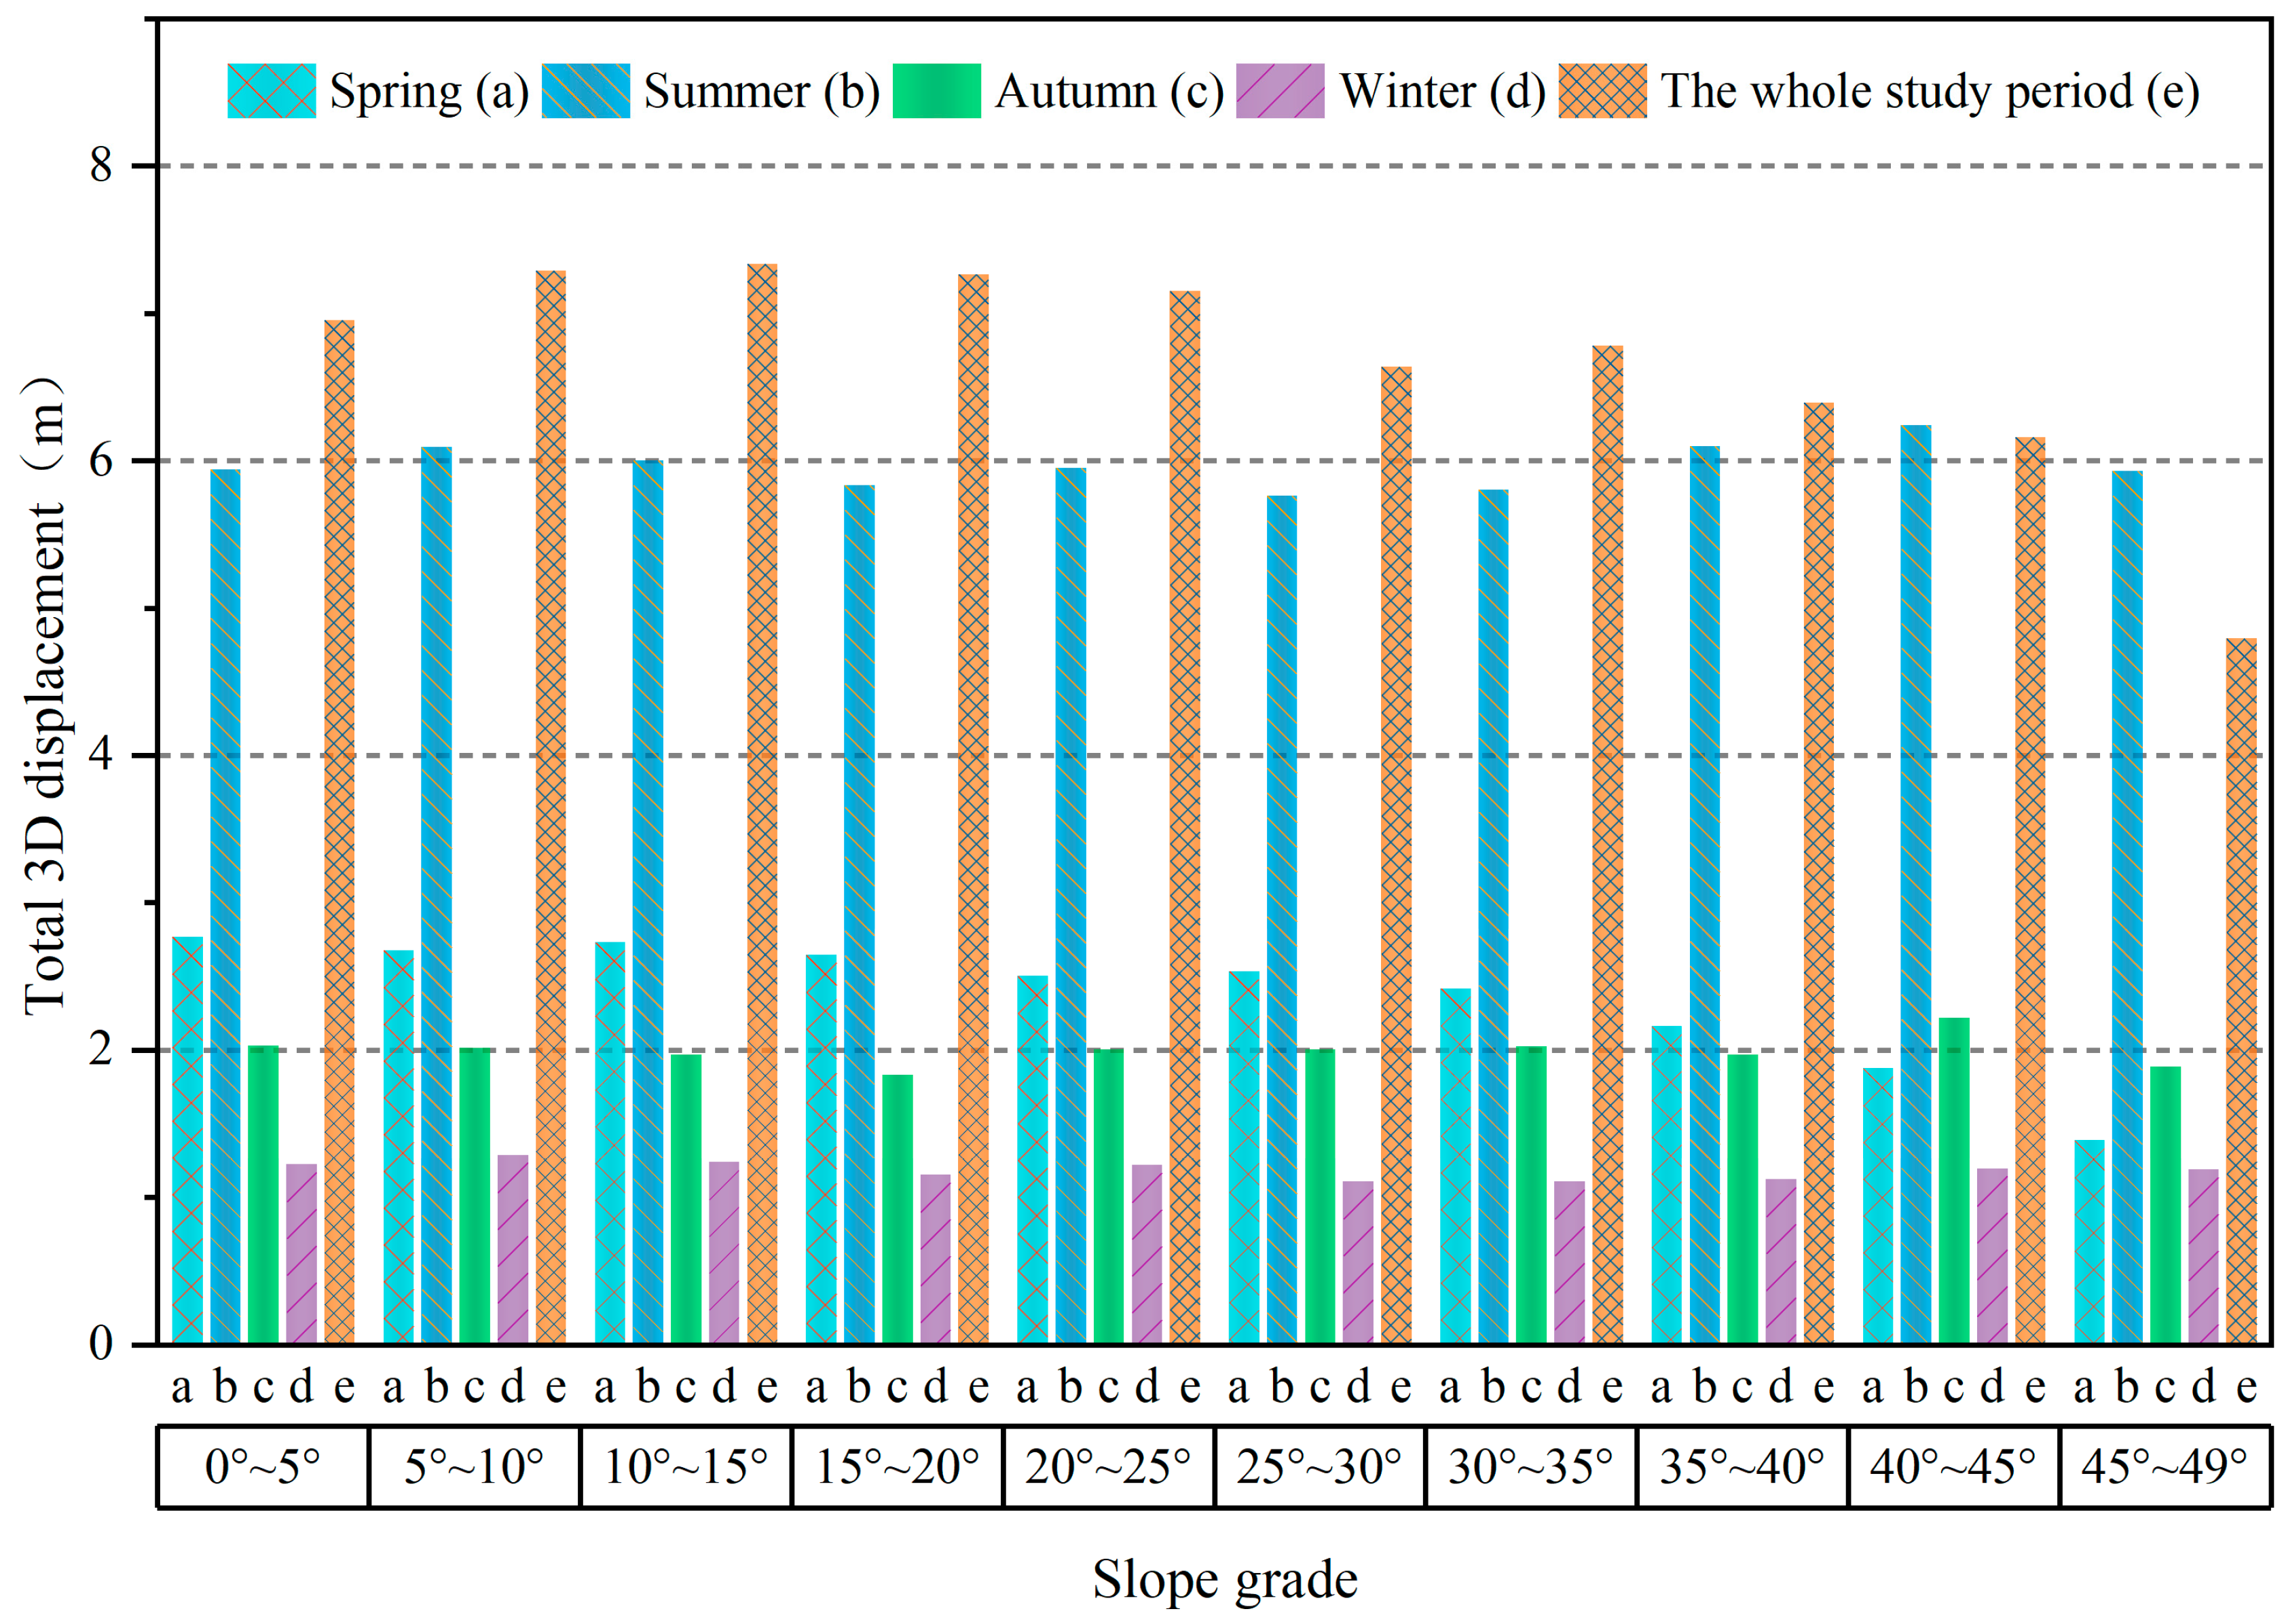
The slope of the Muz Taw glacier was divided at every 5°, as shown in Figure 7. The total 3D displacement of glaciers on each slope grade in spring, summer, autumn, winter, and the whole study period was counted, as shown in Figure 8.
Figure 7.
Grading map of surface slope on Muz Taw glacier.
Figure 8.
Total three-dimensional displacement of Muz Taw glacier in different time periods of each slope grade.
As can be seen from Figure 8, the total 3D displacements in all the profiles in all time periods were largest in summer, followed by the whole study period, autumn, and then spring, with the lowest in winter when the slope was greater than 40°. When the slope was between 0° and 40°, the total displacement was the largest in the whole study period, followed by summer, spring, autumn, and finally winter. On the whole, in autumn and winter, the total 3D displacement of the glacier on each slope grade had a small fluctuation and exhibited a stable trend. In summer, the total 3D displacement showed a slight upward trend, and in spring and the whole study period, it showed a decreasing trend with an increase in the slope. This trend was consistent with the conclusion that “glacier movement velocity decreases with increasing slope and eventually plateaus”, as concluded from a study on the topographic control of glacier movement velocity in the northwestern Karakorum Mountains [73].
Theoretically, glacier motion velocity is closely related to slope. If the slope of the glacier surface increased, the longitudinal slope of the glacier surface becomes steeper and the component of gravity increases, thus prompting the glacier surface motion to accelerate and vice versa. However, as mentioned above, there was no absolute positive correlation between glacier motion displacement and slope; on the one hand, it is due to the slope of the glacier surface affecting the glacier surface velocity to some extent. However, it is not the only major factor affecting the glacier surface velocity. The latter is also influenced by the friction of the surrounding terrain, downstream glacier reactions, glacier size, glacier thickness, and glacier bedrock morphology; on the other hand, it may be because when the displacement of some slope grades have definitely higher values than others, the average displacement of each slope grade tends to be similar. The reason for the changing trend of the displacement of the altitude zone is also likely related to the second reason mentioned above.
5.2. Effect of Glacier Thickness on the Surface Motion Displacement
To explore the effect of glacier thickness on the surface motion displacement of the glacier, we applied the simplified glacier surface motion equation [76], as follows.
where is the surface motion velocity of the glacier; is a temperature-dependent parameter; is the ice thickness; and is the flow driving force from the slope of the ice bed and ice weight, referred to as the basal shear stress, which was calculated as
where is the density of glacial ice, is the gravitational acceleration, is the thickness of the glacier on the centerline, is the shape factor related to the glacier profile and valley shape, and is the slope of the ice bed.
From Formulas (7) and (8), it could be seen that for the same ice thickness and external conditions, the larger the slope of the ice bed, the greater the driving force for surface flow, and the greater the flow rate at the glacier surface. In reality, however, glaciers have generally adapted to the slope of the ice bed by changing over long periods of time, and their long-term development process is in equilibrium; thus, the ice bed usually does not have too much influence on the change in glacier velocity on smaller time scales.
From the above equations, it could be seen that glacier thickness was the main factor determining the driving force of glacier surface motion. Under the same external conditions, the greater the thickness of the glacier, the greater the kinematic driving force, the greater the surface motion velocity, and the greater the displacement.
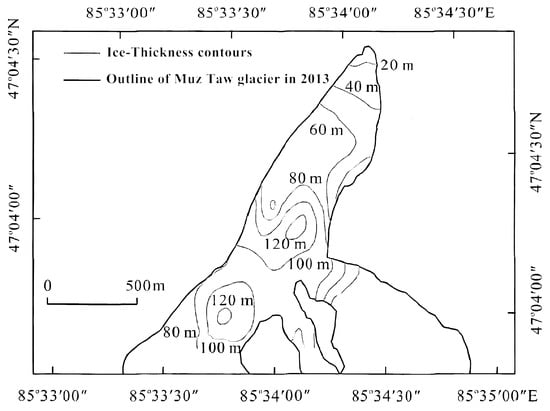
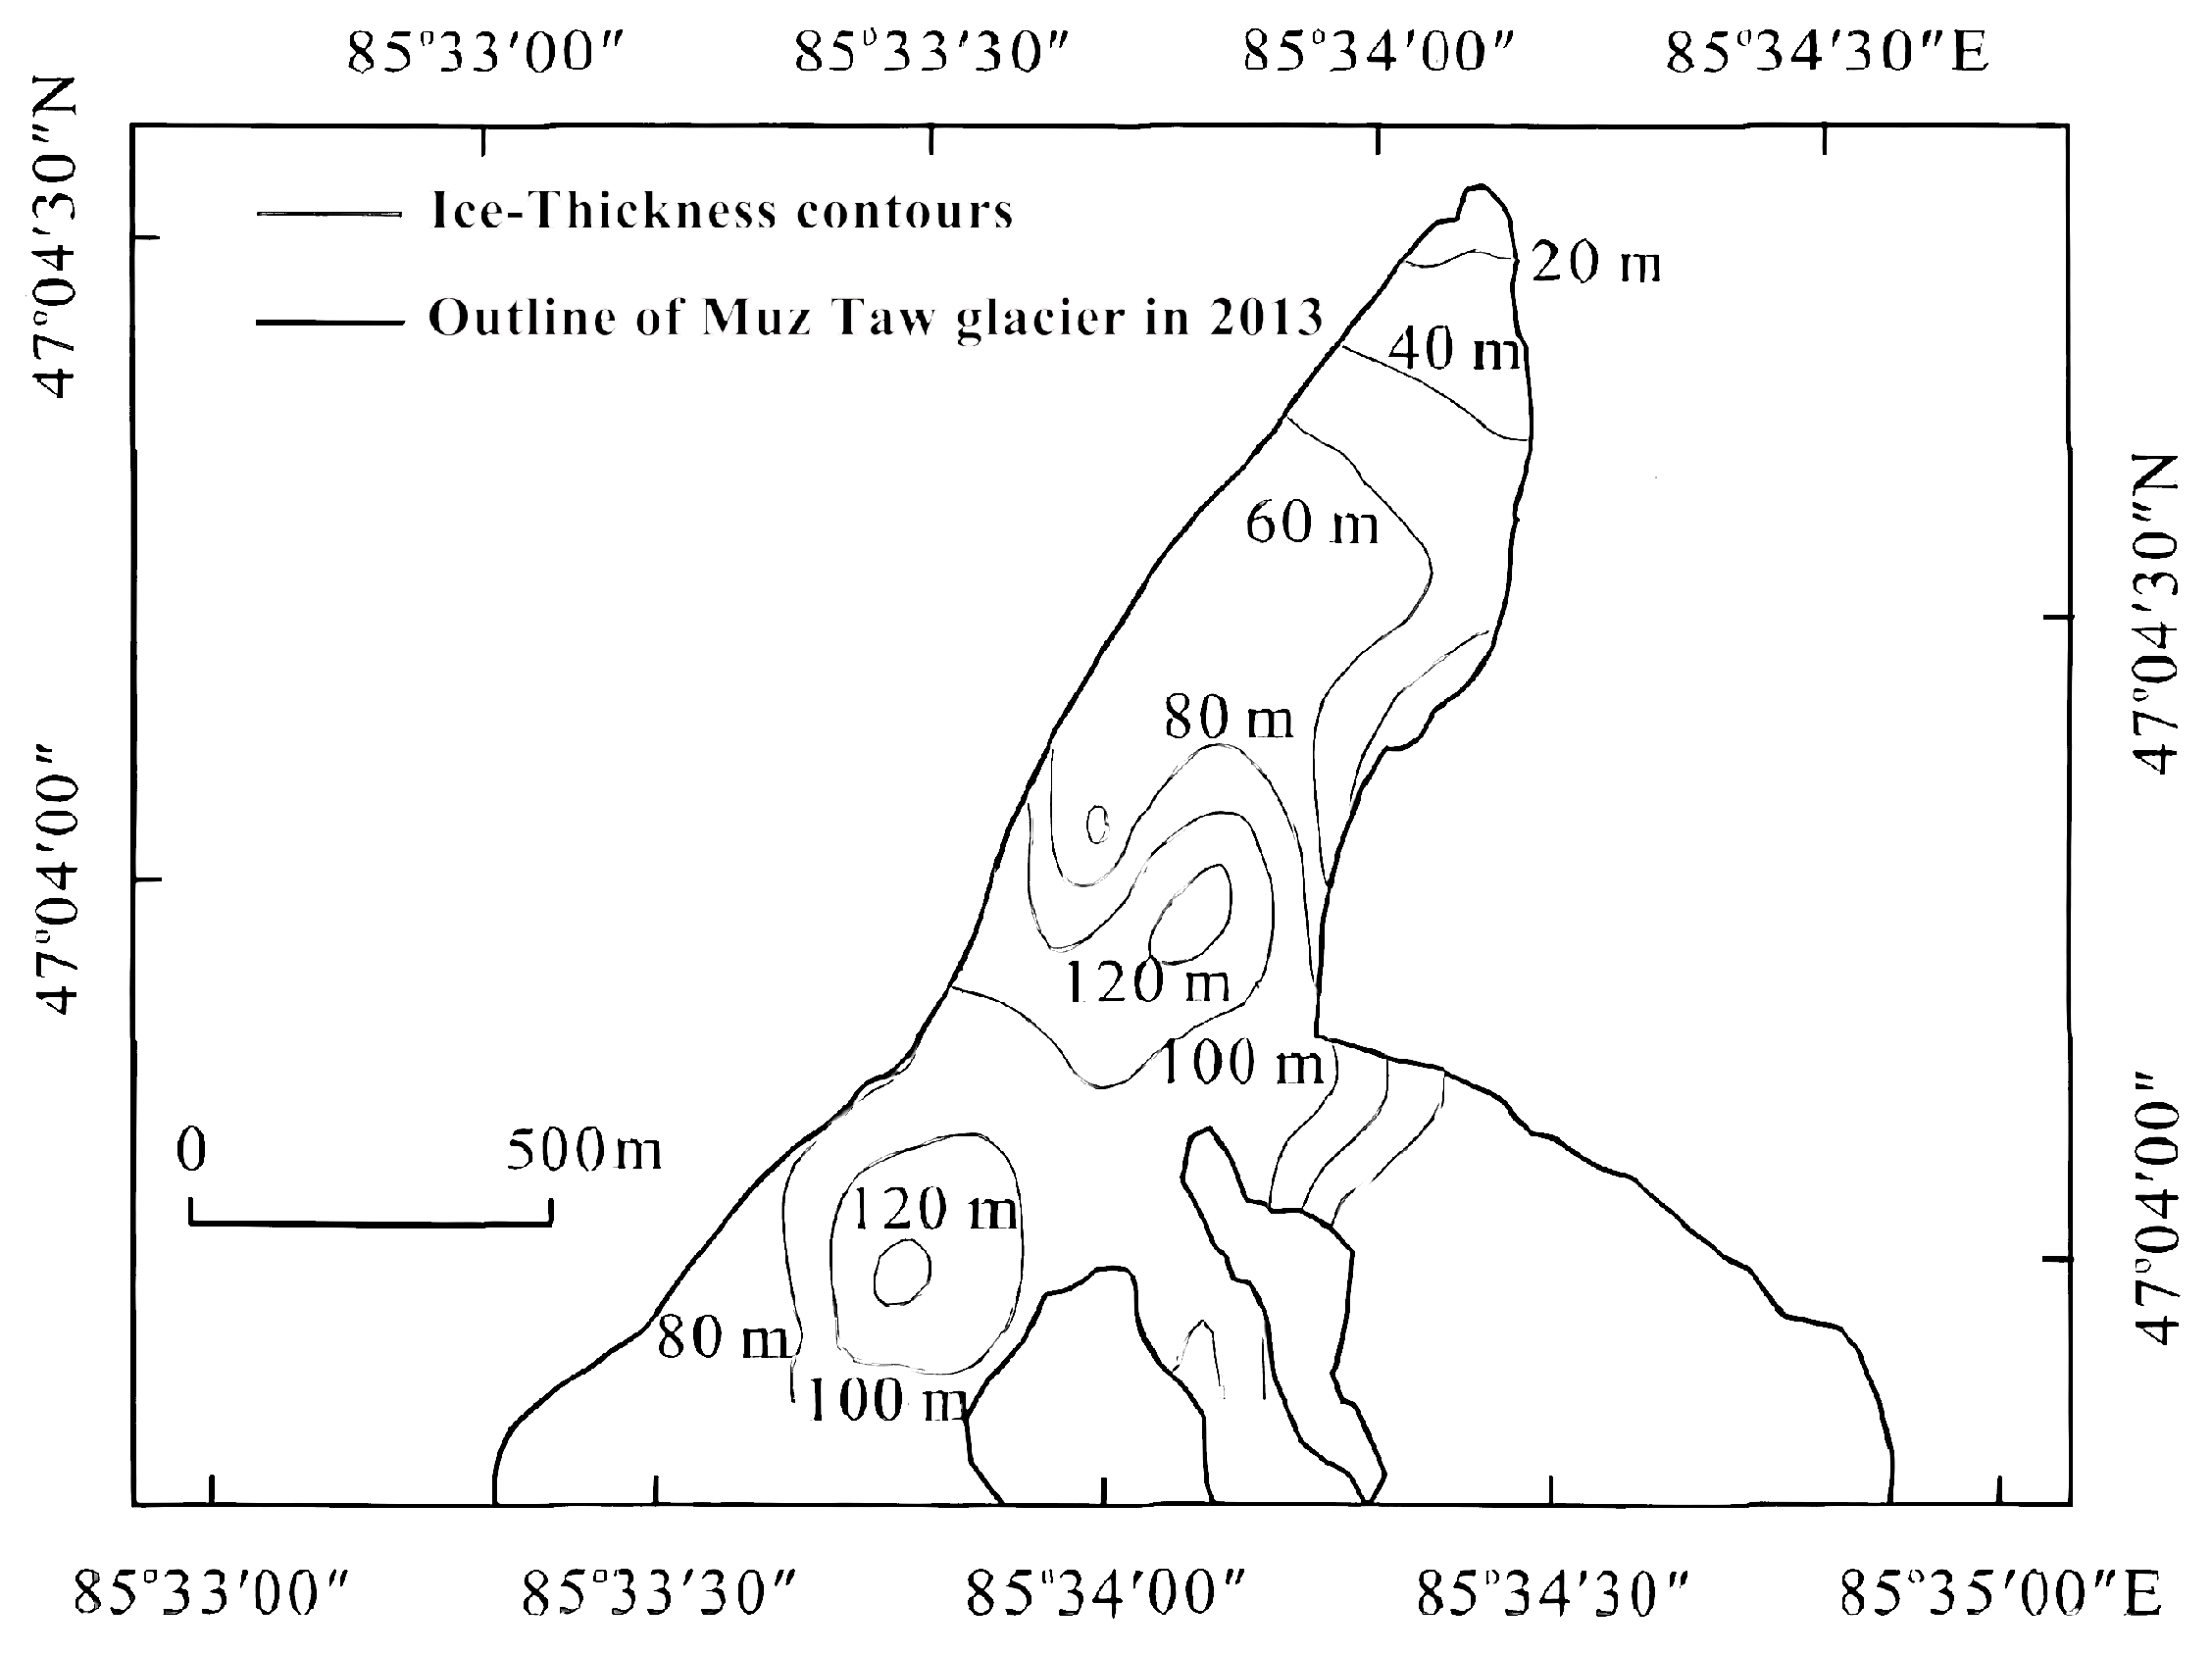
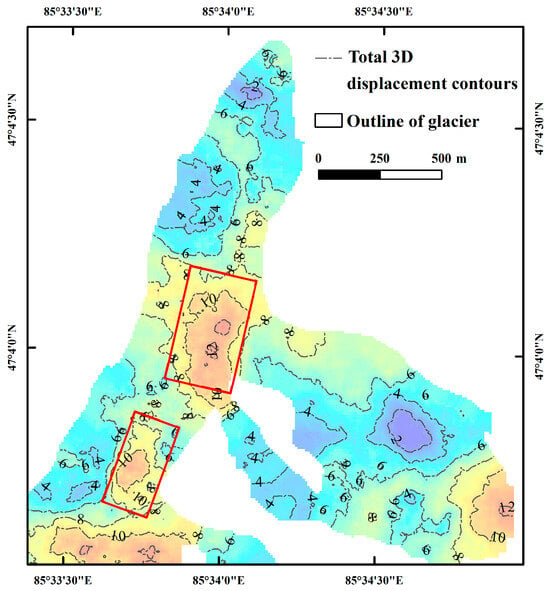
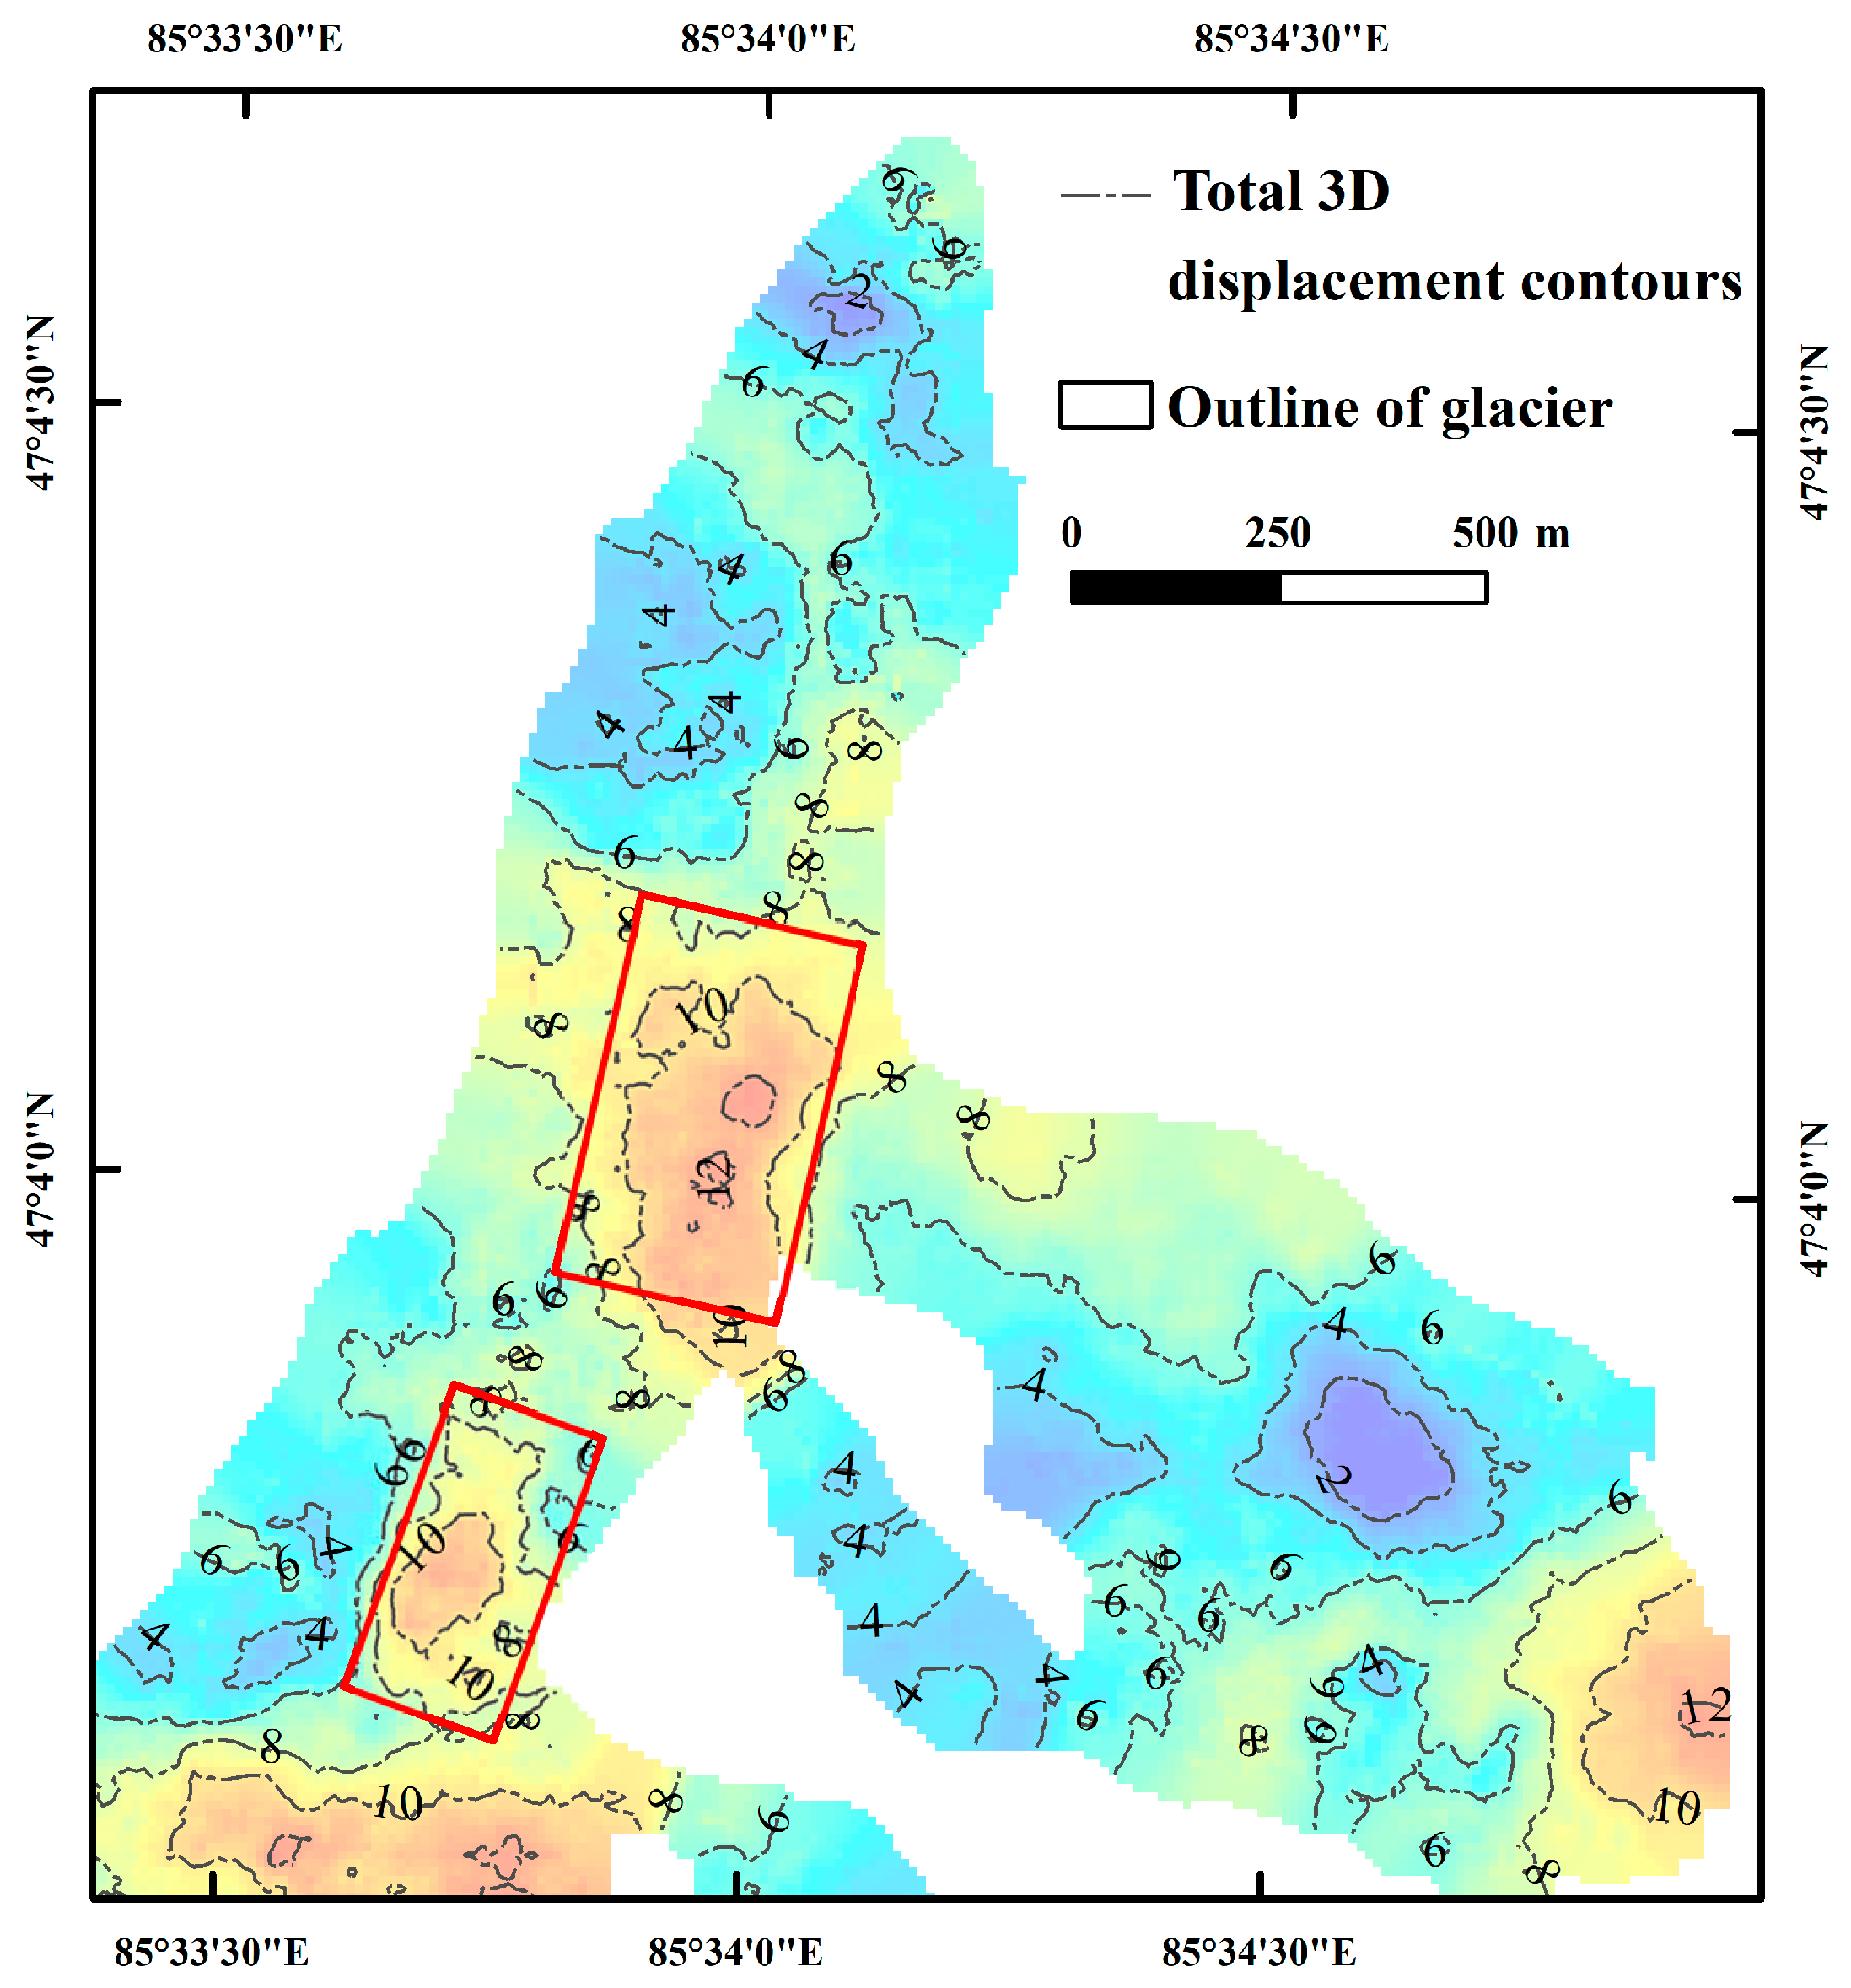
Huai et al. (2016) [69] conducted a study on the thickness of the Muz Taw glacier using the pulse EKKOPRO 100A enhanced ground-penetrating radar [70], and the resulting thickness contour distribution of the Muz Taw glacier is shown in Figure 9. Combined with Figure 10, it could be seen that the location of the contour area with a glacier thickness of 100–120 m was roughly the same as that of the high-displacement-value area marked by the red box in Figure 10. This is consistent with the conclusion that the thicker the glacier, the higher the displacement, and that the glacier thickness is one of the most important factors influencing the surface motion displacement of the Muz Taw glacier.
Figure 9.
Ice thickness contours of Muz Taw glacier [70].
Figure 10.
Displacement contours of 3D surface motion of Muz Taw glacier (2017–2018).
5.3. Effect of Climate on the Surface Motion Displacement
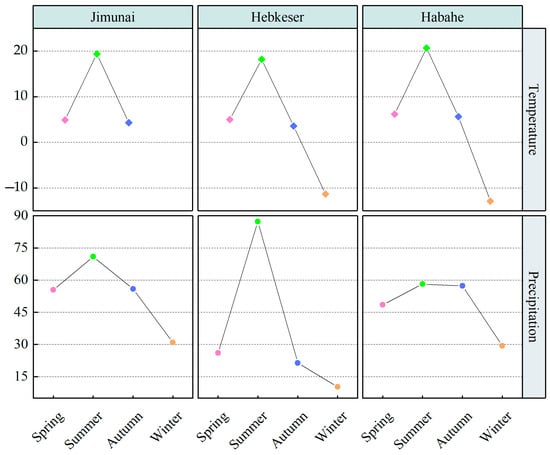
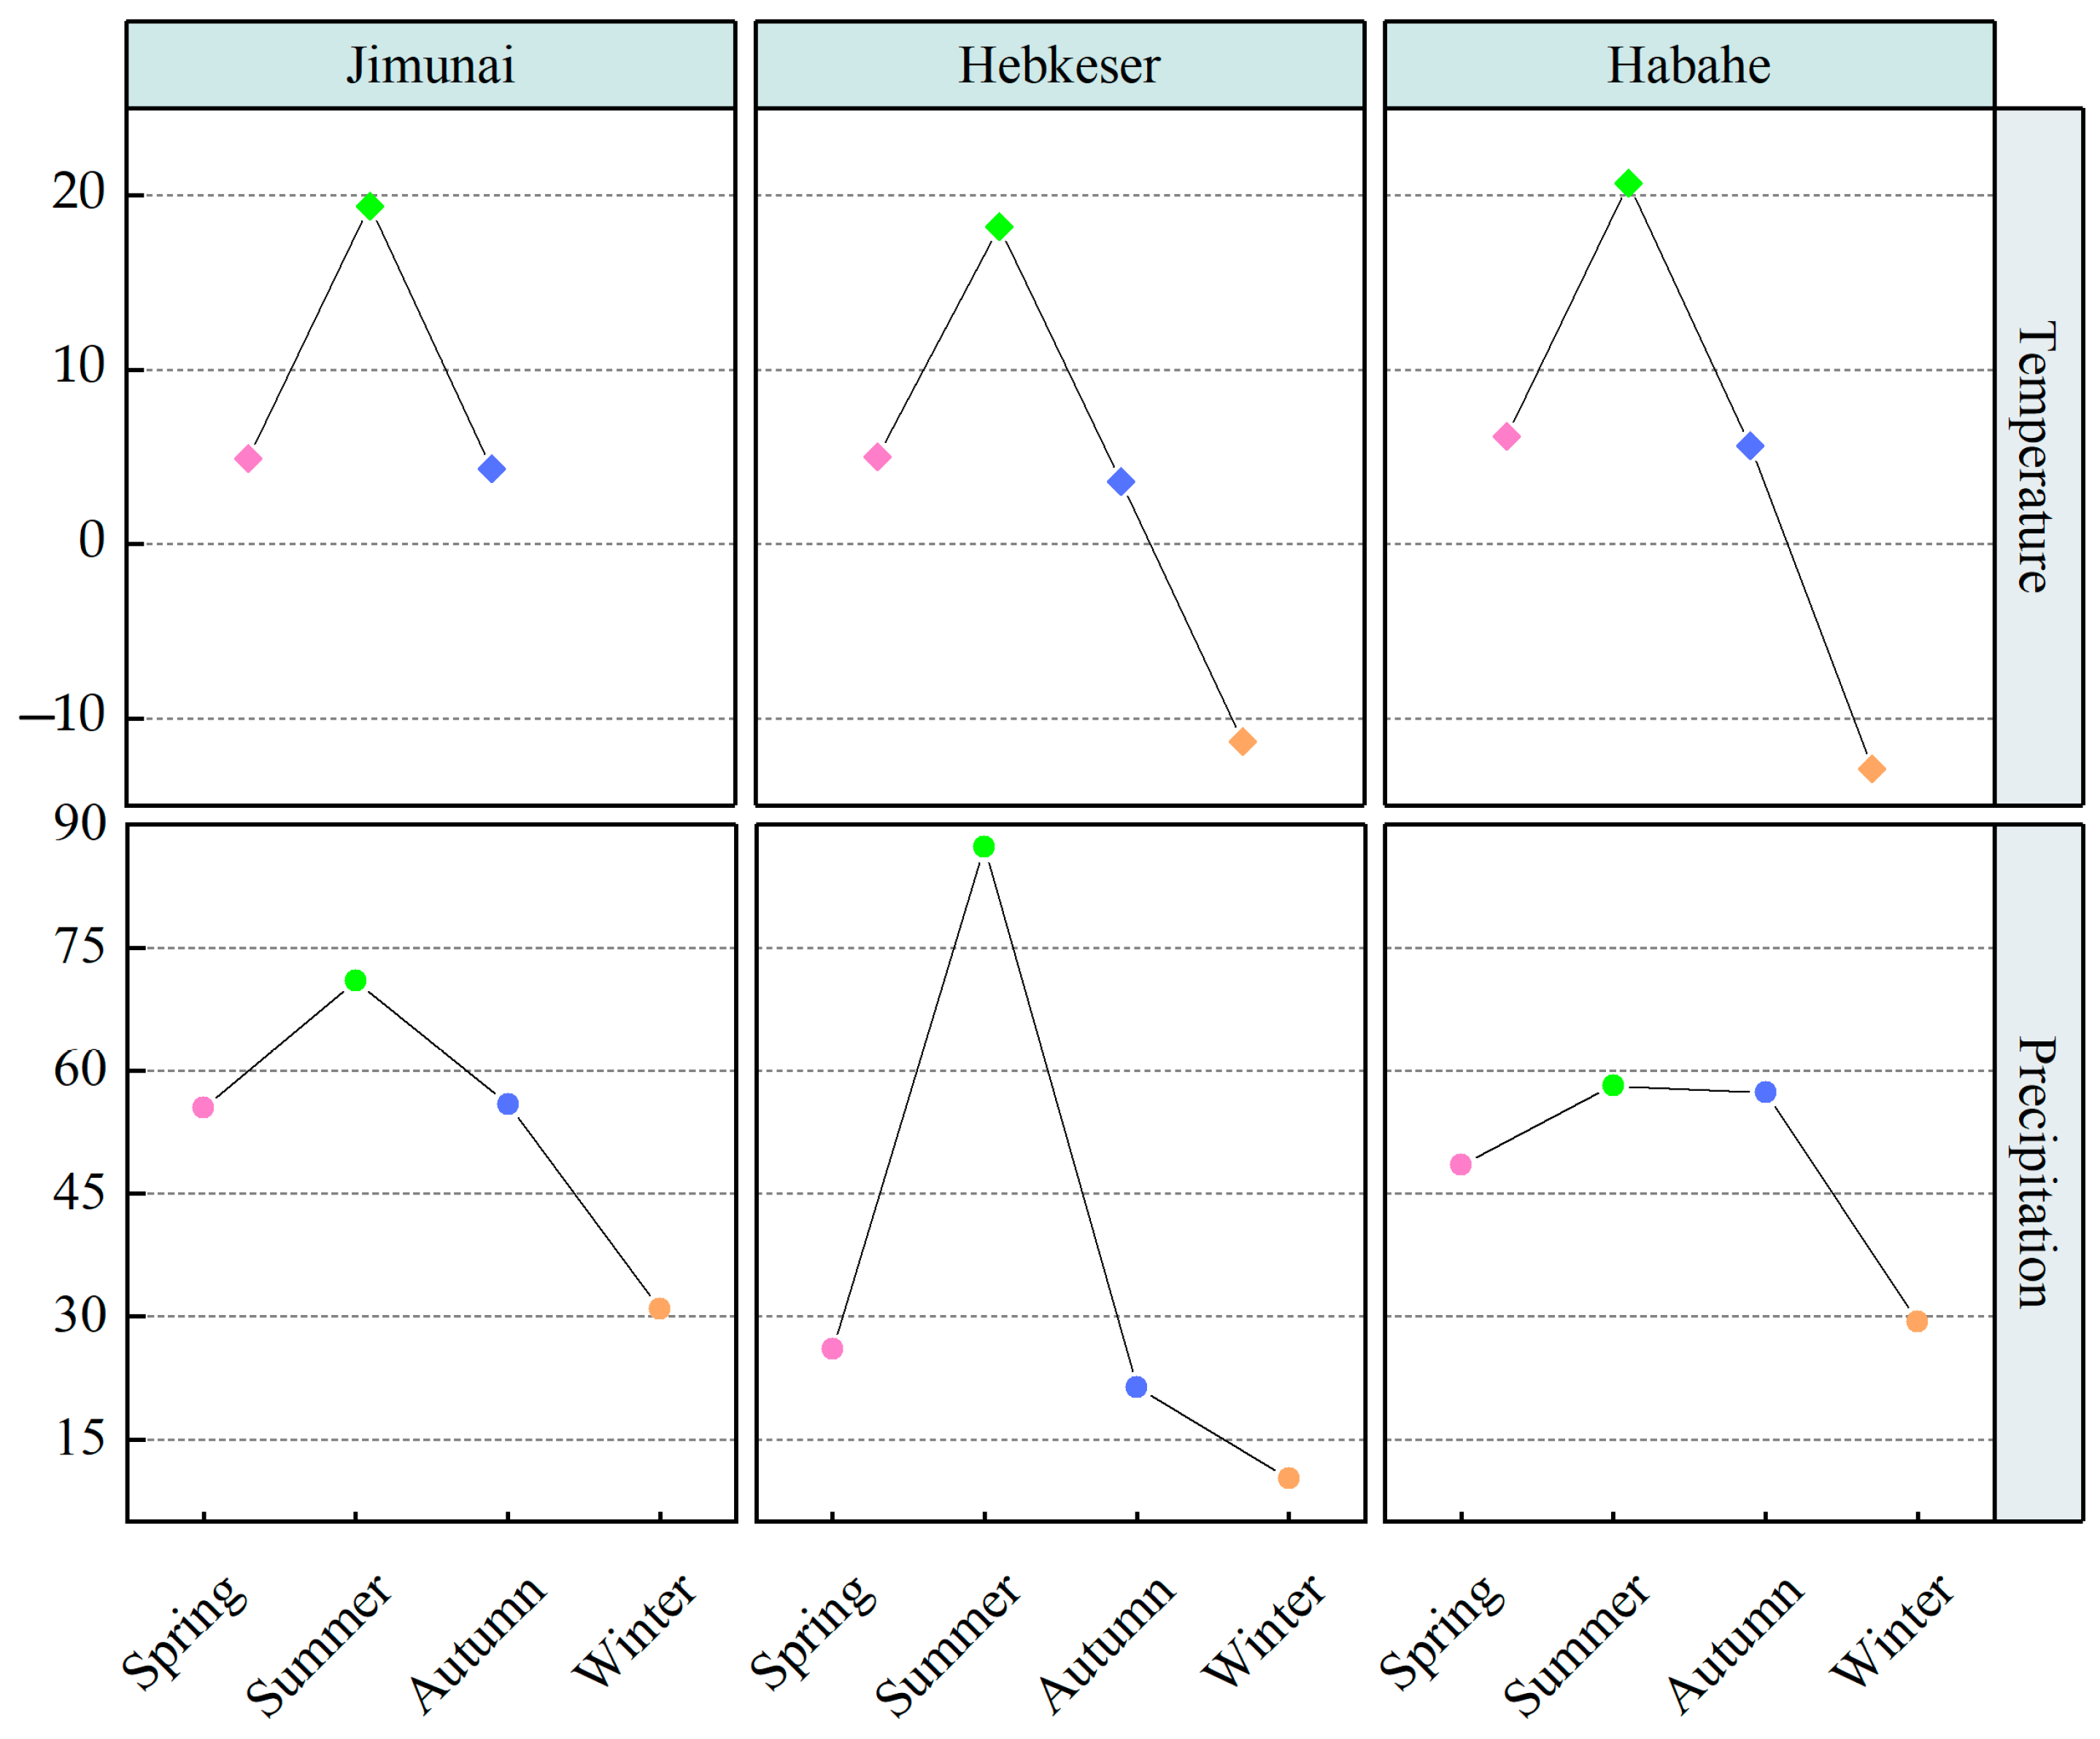
Temperature and precipitation were the most common, and, at the same time, the most important climate factors affecting glacier movement. In order to explore the effects of temperature and precipitation on glacier surface motion displacement, we selected three meteorological stations, Jimunai, Hebukeser, and Habahe, which were closer to the Muz Taw glacier, and counted the temperature and precipitation from 1961 to 2016 by seasons, as shown in Figure 11, in which temperature was the average of multi-year temperatures in three months in each season from 1961 to 2016 and precipitation was the sum of the multi-year average precipitation for the three months in each of the 2016 seasons.
Figure 11.
The average seasonal temperature and precipitation of the three meteorological stations from 1961 to 2016.
As can be seen from Figure 11, the average temperatures at the three stations were highest in summer, followed by spring and then autumn, with the lowest being in winter, while the precipitation was highest in summer and lowest in winter, with little difference between spring and autumn. Combined with the characteristics presented by the total 3D displacements of the Muz Taw glacier in all seasons, it could be concluded that the changes in glacier surface motion displacements had a high degree of synchronization with changes in temperature and precipitation. The reason for this seasonal change was that higher temperatures not only accelerate the formation of glacier meltwater but also increase the precipitation of liquid water at the same time. This is not conducive to the accumulation of glacier masses, resulting in changes in the mass balance of the glacier. Glacier melt water and liquid precipitation would also produce a larger runoff from the surface of the ice through the scouring effect of the intensification of the ice crevasses and the development of other changes in the stability of the glacier, which in turn would change the glacier morphology and ultimately increase the glacier surface movement velocity. On the other hand, glacier meltwater and liquid precipitation through the glacier crevasses penetrate into the ice bed, reducing the frictional resistance to sliding and thus accelerating the glacier’s movement and increasing displacement. Rising temperatures might also increase the internal temperature of the glacier, increasing the glacier’s activity, which in turn would affect the acceleration of glacier movement and the increase in displacement. From the above analysis, it could be concluded that temperature and precipitation are also important factors affecting the surface motion displacement of the glacier.
Temperature and precipitation could also affect glacier movement and displacement by causing changes in glacier mass balance, glacier thickness, glacier morphology, and other factors. When exploring the relationship between glacier area and climate change in the Sawir Mountains, it was found that these mountains and the surrounding areas were in a period of increasing temperature and precipitation. Combined with the conclusion above that the changes in glacier surface motion displacements had a high degree of synchronization with changes in temperature and precipitation, it could be concluded that in the future, the surface motion displacement of glaciers would increase further.
6. Conclusions and Outlook
Based on 75 image pairs of Sentinel-1A ascending and Sentinel-1B descending data, the inversion method of the glacier 3D surface motion displacement (verified using field observation data at Urumqi Glacier No. 1) was used to invert the 3D surface motion displacement of the Muz Taw glacier from 22 August 2017, to 17 August 2018. In addition, the effects of the topographic factors, glacier thickness, and climatic factors on the 3D surface motion displacement of the Muz Taw glacier have been discussed in this paper, with the main conclusions of this study as follows.
During the study period, the total 3D displacement of the Muz Taw glacier ranged from 0.52 to 13.19 m; the eastward displacement was 4.27 m, the northward displacement was 4.07 m, and the horizontal displacement was 5.90 m. These high values were mainly distributed in the vicinity of the main glacier at elevations of 3300–3350 m and 3450–3600 m. The displacement from the upper part of the snow basin area to the ice tongue and other ablation zones presented initially increased, then decreased, increased, and finally decreased. The displacement in the area of tributary glacier confluence was significantly larger than that in other surrounding areas. The total 3D displacement of the Muz Taw glacier varied significantly among the seasons, with a larger displacement in the summer, followed by the spring, with similar displacements in the autumn and winter.
The total 3D displacement along the centerline distance varied greatly throughout the study period and in spring, summer, and autumn, while the change in the point values in winter was relatively gentle. At the centerline distances of 1–1.5 km and 2.5–3 km, the total 3D displacement of the Muz Taw glacier in the whole study period and in all seasons showed a relatively clear upward trend. The total 3D displacements in all the profiles in all time periods were highest over the whole study period, followed by summer, and then spring and autumn, with the lowest found in winter. The surface motion displacements of the Muz Taw glacier along profile 1 showed the characteristics of being high in the middle and low on both sides. Profiles 2, 3, and 5 exhibited similar characteristics, with the total 3D displacements rapidly increasing throughout the study period and across seasons when approaching the end of the profile.
Elevation had a limited effect on the surface motion displacement of the Muz Taw glacier, while the presence or absence of tributary inflow had a greater effect. Slope affected the rate of glacier movement to some extent but was not a major factor in the rate of movement. Glacier thickness was one of the most important factors influencing this displacement, while temperature and precipitation were also important factors.
In this study, we inverted the 3D surface motion displacement of the Muz Taw glacier and analyzed and discussed its change characteristics and its main influencing factors, providing a reference for understanding the trends in changes in glacier motion in the high-latitude mountains of China. However, the field measurement data from the Muz Taw glacier were not obtained using the method presented in this study but were verified using the field measurement data of Urumqi Glacier No. 1. In addition, there were no up-to-date data on the influencing factors of the glacier 3D surface motion displacement, and the study period was relatively short, which may have particularities, so there were still some deficiencies. In future research, we will obtain more abundant data to further develop the relevant research.
Author Contributions
Conceptualization, Y.W. and J.Z.; methodology, Y.W.; software, Y.W.; validation, Y.W., J.Z. and Z.L.; formal analysis, Y.W.; investigation, Y.W.; resources, J.Z. and Z.L.; data curation, Y.W. and J.L.; writing—original draft preparation, Y.W.; writing—review and editing, Y.W. and Y.Y.; visualization, Y.W.; funding acquisition, Y.W., J.Z. and Z.L. All authors have read and agreed to the published version of the manuscript.
Funding
This research was funded by the National Natural Science Foundation of China, grant numbers 42071089 and 42161058; Shanxi Provincial General Youth Foundation, grant number 202303021212117; the Award for Excellent Doctoral work in Shanxi, grant number SXBYKY2023013; and the Scientific and Technological Innovation Foundation of Shanxi Agricultural University (Ph. D. Research Startup), grant number 2023BQ52.
Data Availability Statement
The data are contained within this article.
Acknowledgments
We thank the members of Tien Shan Glaciological Station for supporting the field measurements. We also thank the European Space Agency (ESA) for providing the Sentinel-1 SAR data freely.
Conflicts of Interest
The authors declare no conflicts of interest.
Appendix A
Table A1.
Parameter list of Sentinel-1 on Muz Taw glacier.
Table A2.
Sentinel-1 image pairs used on Muz Taw glacier.
References
- Immerzeel, W.W.; Lutz, A.F.; Andrade, M.; Bahl, A.; Biemans, H.; Bolch, T.; Hyde, S.; Brumby, S.; Davie, B.J.; Elmore, A.C.; et al. Importance and vulnerability of the world’s water towers. Nature 2020, 577, 364–369. [Google Scholar] [CrossRef] [Scilit] [PubMed]
- Yan, S.Y.; Zheng, Y.T.; Li, Y.; Lang, F.K.; Ruan, Z.X. A spatio-temporal variation analysis of Fedchenko and Grumm-Grzhimaylo glacier motion pattern with an efficient pixel-tracking method on spaceborne SAR imagery. Environ. Earth Sci. 2019, 78, 599. [Google Scholar] [CrossRef] [Scilit]
- Ahmad, Q.K. Climate change 1995: Economic and social dimensions of climate change. Contribution of working group III to the second assessment report of the intergovernmental panel on climate change. Glob. Environ. Chang. 1997, 7, 189–190. [Google Scholar] [CrossRef] [Scilit]
- Scherler, D.; Bookhagen, B.; Strecker, M.R. Spatially variable response of Himalayan glaciers to climate change affected by debris cover. Nat. Geosci. 2011, 4, 156–159. [Google Scholar] [CrossRef] [Scilit]
- Radic, V.; Hock, R. Glaciers in The Earth’s Hydrological Cycle: Assessments of Glacier Mass and Runoff Changes on Global and Regional Scales. Surv. Geophys. 2014, 35, 813–837. [Google Scholar] [CrossRef] [Scilit]
- Guo, W.; Liu, S.; Xu, J.; Wu, L.; Shangguan, D.; Yao, X.; Wei, J.; Bao, W.; Yu, P.; Liu, Q. The second Chinese glacier inventory: Data, methods and results. J. Glaciol. 2015, 61, 357–372. [Google Scholar] [CrossRef] [Scilit]
- Yao, T.; Pu, J.; Lu, A.; Wang, Y.; Yu, W. Recent glacial retreat and its impact on hydrological processes on the Tibetan Plateau, China, and surrounding regions. Arct. Antarct. Alp. Res. 2007, 39, 642–650. [Google Scholar] [CrossRef] [Scilit]
- Nesje, A.; Bakke, J.; Dahl, S.O.; Lie, Ø.; Matthews, J.A. Norwegian mountain glaciers in the past, present and future. Glob. Planet. Chang. 2008, 60, 10–27. [Google Scholar] [CrossRef] [Scilit]
- Shangguan, D.H.; Liu, S.Y.; Ding, Y.J.; Ding, L.F.; Li, G. Glacier Changes at the Head of Yurungkax Riverin the West Kunlun Mountains in the Past 32 Years. Acta Geographica Sinica 2004, 59, 855–862. (In Chinese) [Google Scholar]
- Ding, Y.; Liu, S.; Li, J.; Shangguan, D. The retreat of glaciers in response to recent climate warming in western China. Ann. Glaciol. 2006, 43, 97–105. [Google Scholar] [CrossRef] [Scilit]
- Immerzeel, W.W.; van Beek, L.P.H.; Bierkens, M.F.P. Climate change will afect the Asian water towers. Science 2010, 328, 1382–1385. [Google Scholar] [CrossRef] [Scilit] [PubMed]
- Bolch, T.; Pieczonka, T.; Benn, D.I. Multi-decadal mass loss of glaciers in the Everest area (Nepal Himalaya) derived from stereo imagery. Cryosphere 2011, 5, 349–358. [Google Scholar] [CrossRef] [Scilit]
- Yao, T.D.; Thompson, L.; Yang, W.; Yu, W.S.; Gao, Y.; Guo, X.J.; Yang, X.X.; Duan, K.Q.; Zhao, H.B.; Xu, B.Q.; et al. Different glacier status with atmospheric circulations in Tibetan Plateau and surroundings. Nat. Clim. Chang. 2012, 2, 663–667. [Google Scholar] [CrossRef] [Scilit]
- Florentine, C.; Harper, J.; Fagre, D. Parsing complex terrain controls on mountain glacier response to climate forcing. Glob. Planet. Chang. 2020, 191, 103209. [Google Scholar] [CrossRef] [Scilit]
- Huang, M.H.; Sun, Z.Z. Some flow characterstics of continental-Type Glaciers in China. J. Glaciol. Geocryol. 1982, 2, 35–45. (In Chinese) [Google Scholar]
- Paul, F.; Bolch, T.; Kääb, A.; Nagler, T.; Nuth, C.; Scharrer, K.; Shepherd, A.; Strozzi, T.; Ticconi, F.; Bhambri, R.; et al. The glaciers climate change initiative:methods for creating glacier area, elevation change and velocity products. Remote Sens. Environ. 2015, 162, 408–426. [Google Scholar] [CrossRef] [Scilit]
- Wang, Y.Q.; Zhao, J.; Li, Z.Q.; Zhang, M.J.; Wang, Y.C.; Liu, J.L.; Yang, J.X.; Yang, Z.H. Retrieving and Verifying Three-Dimensional Surface Motion Displacement of Mountain Glacier from Sentinel-1 Imagery Using Optimized Method. Water 2021, 13, 1793. [Google Scholar] [CrossRef] [Scilit]
- Guan, W.J.; Cao, B.; Pan, B.T. Research of glacier flow velocity: Current situation and prospects. J. Glaciol. Geocryol. 2020, 42, 1101–1114. (In Chinese) [Google Scholar]
- Richardson, S.D.; Reynolds, J.M. An overview of glacial hazards in the Himalayas. Quat. Int. 2000, 65, 31–47. [Google Scholar] [CrossRef] [Scilit]
- Haeberli, W.; Kääb, A.; Paul, F.; Chiarle, M.; Mortara, G.; Mazza, A.; Deline, P.; Richardson, S. A surge-type movement at Ghiacciaio del Belvedere and a developing slope instability in the east face of Monte Rosa, Macugnaga, Italian Alps. Nor. Geogr. Tidsskr. Nor. J. Geol. 2002, 56, 104–111. [Google Scholar] [CrossRef] [Scilit]
- Kääb, A.; Reynolds, J.; Haeberli, W. Glacier and permafrost hazards in high mountains. Glob. Chang. Mt. Reg. 2005, 23, 225–234. [Google Scholar]
- Paul, F.; Strozzi, T.; Schellenberger, T.; Kääb, A. The 2015 surge of Hispar Glacier in the Karakoram. Remote Sens. 2017, 9, 888. [Google Scholar] [CrossRef] [Scilit]
- Yao, X.; Iqbal, J.; Li, L.; Zhou, Z. Characteristics of mountain glacier surge hazard: Learning from a surge event in NE Pamir, China. J. Mt. Sci. 2019, 16, 1515–1533. [Google Scholar] [CrossRef] [Scilit]
- Zhu, Q.; Ke, C.; Li, H. Monitoring glacier surges in the Kongur Tagh area of the Tibetan Plateau using Sentinel-1 SAR data. Geomorphology 2021, 390, 107869. [Google Scholar] [CrossRef] [Scilit]
- Benn, D.; Warren, C.; Mottra, R. Calving processes and the dynamics of calving glaciers. Earth-Sci. Rev. 2007, 82, 144–179. [Google Scholar] [CrossRef] [Scilit]
- Xu, S.Q.; E, D.C.; Wang, S.D. Glacier movement monitoring on Nelson Ice Cap, Antarctica. J. Geomat. 1988, 4, 30–35. (In Chinese) [Google Scholar]
- Jing, Z.F.; Zhou, Z.M.; Liu, L. Progress of the Research on Glacier Velocities in China. J. Glaciol. Geocryol. 2010, 32, 749–754. (In Chinese) [Google Scholar]
- Berthier, E.; Vadon, H.; Baratoux, D.; Arnaud, Y.; Vincent, C.; Feigl, K.; Remy, F.; Legresy, B. Surface motion of mountain glaciers derived from satellite optical imagery. Remote Sens. Environ. 2005, 95, 14–28. [Google Scholar] [CrossRef] [Scilit]
- Herman, F.; Anderson, B.; Leprince, S. Mountain glacier velocity variation during a retreat/advance cycle quantified using sub-pixel analysis of ASTER images. J. Glaciol. 2011, 57, 197–207. [Google Scholar] [CrossRef] [Scilit]
- Altena, B.; Scambos, T.; Fahnestock, M.; Kääb, A. Extracting recent short-term glacier velocity evolution over southern Alaska and the Yukon from a large collection of Landsat data. Cryosphere 2019, 13, 795–814. [Google Scholar] [CrossRef] [Scilit]
- Li, G.; Zhuoqi Chen, Z.Q.; Mao, Y.T.; Yang, Z.B.; Chen, X.; Cheng, X. Different glacier surge patterns revealed by Sentinel-2 imagery derived quasi-monthly flow velocity at west Kunlun Shan, Karakoram, Hindu Kush and Pamir. Remote Sens. Environ. 2024, 311, 114298. [Google Scholar] [CrossRef] [Scilit]
- Luo, H.Y.; Xu, Q.; Jiang, Y.N.; Pu, C.H. 3-D flow velocity time-series analysis from SAR-derived datasets towards maritime glaciers in the Namcha Barwa, Southeastern Tibetan Plateau. J. Hydrol. 2024, 635, 131190. [Google Scholar] [CrossRef] [Scilit]
- Van De Wal, R.S.W.; Boot, W.; Van Den Broeke, M.R.; Smeets, C.J.P.P.; Reijmer, C.H.; Donker, J.J.A.; Oerlemans, J. Large and Rapid Melt-Induced Velocity Changes in the Ablation Zone of the Greenland Ice Sheet. Science 2008, 321, 111–113. [Google Scholar] [CrossRef] [Scilit]
- Bartholomew, I.; Nienow, P.; Mair, D.; Hubbard, A.; King, M.A.; Sole, A. Seasonal evolution of subglacial drainage and acceleration in a Greenland outlet glacier. Nat. Geosci. 2010, 3, 408–411. [Google Scholar] [CrossRef] [Scilit]
- Goldstein, R.M.; Engelhardt, H.; Kamb, B.; Frolich, R.M. Satellite radar interferometry for monitoring ice sheet motion: Application to an Antarctic ice stream. Science 1993, 262, 1525–1530. [Google Scholar] [CrossRef] [Scilit]
- Shepherd, A.; Wingham, D.J.; Mansley, J.A.D.; Corr, H.F.J. Inland thinning of Pine Island glacier, West Antarctica. Science 2001, 291, 862–864. [Google Scholar] [CrossRef] [Scilit]
- Burgess, E.W.; Forster, R.R.; Larsen, C.F. Flow velocities of Alaskan glaciers. Nat. Commun. 2013, 4, 2146. [Google Scholar] [CrossRef] [Scilit]
- Lemos, A.; Shepherd, A.; McMillan, M.; Hogg, A.E.; Hatton, E.; Joughin, I. Ice velocity of Jakobshavn Isbræ, Petermann Glacier, Nioghalvfjerdsfjorden, and Zachariæ Isstrøm, 2015–2017, from Sentinel 1-a/b SAR imagery. Cryosphere 2018, 12, 2087–2097. [Google Scholar] [CrossRef] [Scilit]
- Jia, B.; Hou, S.; Wang, Y. A Surging Glacier Recognized by Remote Sensing on the Zangser Kangri Ice Field, Central Tibetan Plateau. Remote Sens. 2021, 13, 1220. [Google Scholar] [CrossRef] [Scilit]
- Samsonov, S.; Tiampo, K.; Cassotto, R. SAR-derived flow velocity and its link to glacier surface elevation change and mass balance. Remote Sens. Environ. 2021, 258, 112343. [Google Scholar] [CrossRef] [Scilit]
- Friedl, P.; Seehaus, T.; Braun, M. Global time series and temporal mosaics of glacier surface velocities derived from Sentinel-1 data. Earth Syst. Sci. Data 2021, 13, 4653–4675. [Google Scholar] [CrossRef] [Scilit]
- Immerzeel, W.W.; Kraaijenbrink, P.D.A.; Shea, J.M.; Shrestha, A.B.; Pellicciotti, F.; Bierkens, M.F.P.; De Jong, S.M. High-resolution monitoring of Himalayan glacier dynamics using unmanned aerial vehicles. Remote Sens. Environ. 2014, 150, 93–103. [Google Scholar] [CrossRef] [Scilit]
- Mohr, J.; Reeh, N.; Madsen, S. Three-dimensional glacial flow and surface elevation measured with radar interferometry. Nature 1998, 391, 273–276. [Google Scholar] [CrossRef] [Scilit]
- Rignot, E. Mass balance of East Antarctic glaciers and ice shelves from satellite data. Ann. Glaciol. 2002, 34, 217–227. [Google Scholar] [CrossRef] [Scilit]
- Peng, Y.; Li, Z.; Xu, C.; Zhang, H.; Han, W. Surface Velocity Analysis of Surge Region of Karayaylak Glacier from 2014 to 2020 in the Pamir Plateau. Remote Sens. 2021, 13, 774. [Google Scholar] [CrossRef] [Scilit]
- Feng, L.; Jiang, L.; Liu, L.; Sun, Y. Karayaylak glacier changes in the Kongur Mountain of eastern Pamir between 1973 and 2016 based on active and passive remote sensing technologies. Remote Sens. Land Resour. 2020, 32, 162–169. [Google Scholar]
- Wu, K.P.; Liu, S.Y.; Zhu, Y.; Liu, Q.; Jiang, Z.L. Dynamics of glacier surface velocity and ice thickness for maritime glaciers in the southeastern Tibetan Plateau. J. Hydrol. 2020, 590, 125527. [Google Scholar] [CrossRef] [Scilit]
- Cai, J.X.; Wang, X.W.; Wu, T.T.; Wu, R.Z.; Liu, G.X. Characterizing the kinematics of active rock glaciers in Daxue Shan, southeastern Tibetan plateau, using SAR interferometry and generalized boosted modeling. Remote Sens. Environ. 2024, 313, 114352. [Google Scholar] [CrossRef] [Scilit]
- Kumar, V.; Høgda, K.A.; Larsen, Y. Across-Track and Multi-Aperture InSAR for 3-D Glacier Velocity Estimation of the Siachen Glacier. Remote Sens. 2023, 15, 4794. [Google Scholar] [CrossRef] [Scilit]
- Fan, J.H.; Wamg, Q.; Liu, G.; Zhang, L.; Guo, Z.C.; Tong, L.Q.; Peng, J.H.; Yuan, W.L.; Zhou, W.; Perski, Z.; et al. Monitoring and Analyzing Mountain Glacier Surface Movement Using SAR Data and a Terrestrial Laser Scanner: A Case Study of the Himalayas North Slope Glacier Area. Remote Sens. 2021, 13, 5122. [Google Scholar] [CrossRef] [Scilit]
- Gudmundsson, S.; Gudmundsson, M.T.; Björnsson, H.; Sigmundsson, F.; Rott, H.; Carstensen, J.M. Three-dimensional glacier surface motion maps at the Gja’lp eruption site, Iceland, inferred from combining InSAR and other ice-displacement data. Ann. Glaciol. 2002, 34, 315–322. [Google Scholar] [CrossRef] [Scilit]
- Mohr, J.J.; Reeh, N.; Madsen, S.N. Accuracy of three-dimensional glacier surface velocities derived from radar interferometry and ice-sounding radar measurements. J. Glaciol. 2003, 49, 210–222. [Google Scholar] [CrossRef] [Scilit]
- Hu, J.; Li, Z.W.; Li, J.; Zhang, L.; Ding, X.L.; Zhu, J.J.; Sun, Q. 3-D movement mapping of the alpine glacier in Qinghai-Tibetan Plateau by integrating D-InSAR, MAI and Offset-Tracking: Case study of the Dongkemadi Glacier. Glob. Planet. Chang. 2014, 118, 62–68. [Google Scholar] [CrossRef] [Scilit]
- Reeh, N.; Madsen, S.N.; Mohr, J.J. Combining SAR interferometry and the equation of continuity to estimate the three-dimensional glacier surface-velocity vector. J. Glaciol. 1999, 45, 533–538. [Google Scholar] [CrossRef] [Scilit]
- Li, J.; Li, Z.W.; Wu, L.X.; Xu, B.; Hu, J.; Zhou, Y.S.; Miao, Z.L. Deriving a time series of 3D glacier motion to investigate interactions of a large mountain glacial system with its glacial lake: Use of Synthetic Aperture Radar Pixel Offset-Small Baseline Subset technique. J. Hydrol. 2018, 559, 596–608. [Google Scholar] [CrossRef] [Scilit]
- Yang, L.Y.; Zhao, C.Y.; Zhong, L.; Yang, C.S.; Zhang, Q. Three-Dimensional Time Series Movement of the Cuolangma Glaciers, Southern Tibet with Sentinel-1 Imagery. Remote Sens. 2020, 12, 3466. [Google Scholar] [CrossRef] [Scilit]
- Barrand, N.E.; Murray, T. Multivariate controls on the incidence of glacier surging in the Karakoram Himalaya. Arct. Antarct. Alp. Res. 2006, 38, 489–498. [Google Scholar] [CrossRef] [Scilit]
- Hewitt, K. Tributary glacier surges: An exceptional concentration at Panmah Glacier, Karakoram Himalaya. J. Glaciol. 2007, 53, 181–188. [Google Scholar] [CrossRef] [Scilit]
- Kotlyakov, V.; Osipova, G.; Tsvetkov, D. Monitoring surging glaciers of the Pamirs, central Asia, from space. Ann. Glaciol. 2008, 48, 125–134. [Google Scholar] [CrossRef] [Scilit]
- Copland, L.; Sylvestre, T.; Bishop, M.P.; Shroder, J.F.; Seong, Y.B.; Owen, L.A.; Bush, A.; Kamp, U. Expanded and recently increased glacier surging in the Karakoram. Arct. Antarct. Alp. Res. 2011, 43, 503–516. [Google Scholar] [CrossRef] [Scilit]
- Yasuda, T.; Furuya, M. Short-term glacier velocity changes at West Kunlun Shan, Northwest Tibet, detected by Synthetic Aperture Radar data. Remote Sens. Environ. 2013, 128, 87–106. [Google Scholar] [CrossRef] [Scilit]
- Paul, F. Revealing glacier flow and surge dynamics from animated satellite image sequences: Examples from the Karakoram. Cryosphere 2015, 9, 2201–2214. [Google Scholar] [CrossRef] [Scilit]
- Guo, L.; Li, J.; Dehecq, A.; Li, Z.; Li, X.; Zhu, J. A new inventory of High Mountain Asia surging glaciers derived from multiple elevation datasets since the 1970s. Earth Syst. Sci. Data 2023, 15, 2841–2861. [Google Scholar] [CrossRef] [Scilit]
- Shangguan, D.H.; Liu, S.Y.; Ding, Y.J.; Guo, W.Q.; Xu, B.Q.; Xu, J.L.; Jiang, Z.L. Characterizing the May 2015 Karayaylak Glacier surge in the eastern Pamir Plateau using remote sensing. J. Glaciol. 2016, 62, 944–953. [Google Scholar] [CrossRef] [Scilit]
- Lv, M.Y.; Lu, X.C.; Guo, H.D.; Liu, G.; Ding, Y.X.; Ruan, Z.X.; Ren, Y.Z.; Yan, S.Y. A rapid glacier surge on Mount Tobe Feng, western China, 2015. J. Glaciol. 2016, 62, 407–409. [Google Scholar] [CrossRef] [Scilit]
- Tian, L.D.; Yao, T.D.; Gao, Y.; Thompson, L.; Mosley-Thompson, E.; Muhammad, S.; Zong, J.B.; Wang, C.; Jin, S.Q.; LI, Z.G. Two glaciers collapse in western Tibet. J. Glaciol. 2016, 63, 194–197. [Google Scholar] [CrossRef] [Scilit]
- Gilbert, A.; Leinss, S.; Kargel, J.; Kääb, A.; Gascoin, S.; Leonard, G.; Berthier, E.; Karki, A.; Yao, T.D. Mechanisms leading to the 2016 giant twin glacier collapses, Aru Range, Tibet. Cryosphere 2018, 12, 2883–2900. [Google Scholar] [CrossRef] [Scilit]
- Lei, Y.B.; Yao, T.D.; Tian, L.D.; Sheng, Y.W.; La, Z.; Liao, J.J.; Zhao, H.B.; Yang, W.; Yang, K.; Berthier, E.; et al. Response of downstream lakes to Aru glacier collapses on the western Tibetan Plateau. Cryosphere 2021, 15, 199–214. [Google Scholar] [CrossRef] [Scilit]
- Huai, B.J.; Li, Z.Q.; Wang, F.T.; Wang, P.Y.; Li, K.M. Ice Thickness Distribution and Ice Volume Estimation of Muz Taw Glacier in Sawir Mountains. Earth Sci. 2016, 41, 757–764. (In Chinese) [Google Scholar]
- Wang, Y.Q.; Zhao, J.; Li, Z.Q.; Zhang, M.J. Glacier changes in the Sawuer Mountain during 1977–2017 and their response to climate change. J. Nat. Resour. 2019, 34, 802–814. (In Chinese) [Google Scholar] [CrossRef] [Scilit]
- Wang, F.T.; Yue, X.Y.; Wang, L.; Li, K.L.; Du, Z.C.; Jing, M.; Li, Z.Q. Applying artificial snowfall to reduce the melting of the Muz Taw Glacier, Sawir Mountains. Cryosphere 2020, 14, 2597–2606. [Google Scholar] [CrossRef] [Scilit]
- Jiang, Z.L.; Liu, S.Y.; Peters, J.; Lin, J.; Long, S.C.; Han, Y.S.; Wang, X. Analyzing Yengisogat Glacier surface velocities with ALOS PALSAR data feature tracking, Karakoram, China. Environ. Earth Sci. 2012, 67, 1033–1043. [Google Scholar] [CrossRef] [Scilit]
- Yao, X.J.; Liu, S.Y.; Zhu, Y.; Gong, P.; An, L.N.; Li, X.F. Design and implementation of an automatic method for deriving glacier centerlines based on GIS. J. Glaciol. Geocryol. 2015, 37, 1563–1570. [Google Scholar]
- Li, J.; Li, Z.W.; Zhu, J.J.; Ding, X.L.; Wang, C.C.; Chen, J.L. Deriving surface motion of mountain glaciers in the Tuomuer-Khan Tengri Mountain Ranges from PALSAR images. Glob. Planet. Chang. 2013, 101, 61–71. [Google Scholar] [CrossRef] [Scilit]
- Zhang, S.S.; Zhang, Z.; Liu, S.Y.; Li, X.; Huang, D.N.; Xue, N.T. Terrain dependence characteristics of glacier flow velocity in northwest of the Karakoram Mountains. J. Glaciol. Geocryol. 2019, 41, 1015–1025. (In Chinese) [Google Scholar]
- Wang, P.Y.; Li, Z.Q.; Zhou, P.; Li, H.L.; Yu, G.B.; Xu, C.H.; Wang, L. Long-term change in ice velocity of Urumqi Glacier No. 1, Tian Shan, China. Cold Reg. Sci. Technol. 2018, 145, 177–184. [Google Scholar] [CrossRef] [Scilit]

Disclaimer/Publisher’s Note: The statements, opinions and data contained in all publications are solely those of the individual author(s) and contributor(s) and not of MDPI and/or the editor(s). MDPI and/or the editor(s) disclaim responsibility for any injury to people or property resulting from any ideas, methods, instructions or products referred to in the content. |
© 2024 by the authors. Licensee MDPI, Basel, Switzerland. This article is an open access article distributed under the terms and conditions of the Creative Commons Attribution (CC BY) license (https://creativecommons.org/licenses/by/4.0/).