


The authors wish to make the following correction to this paper [1]:
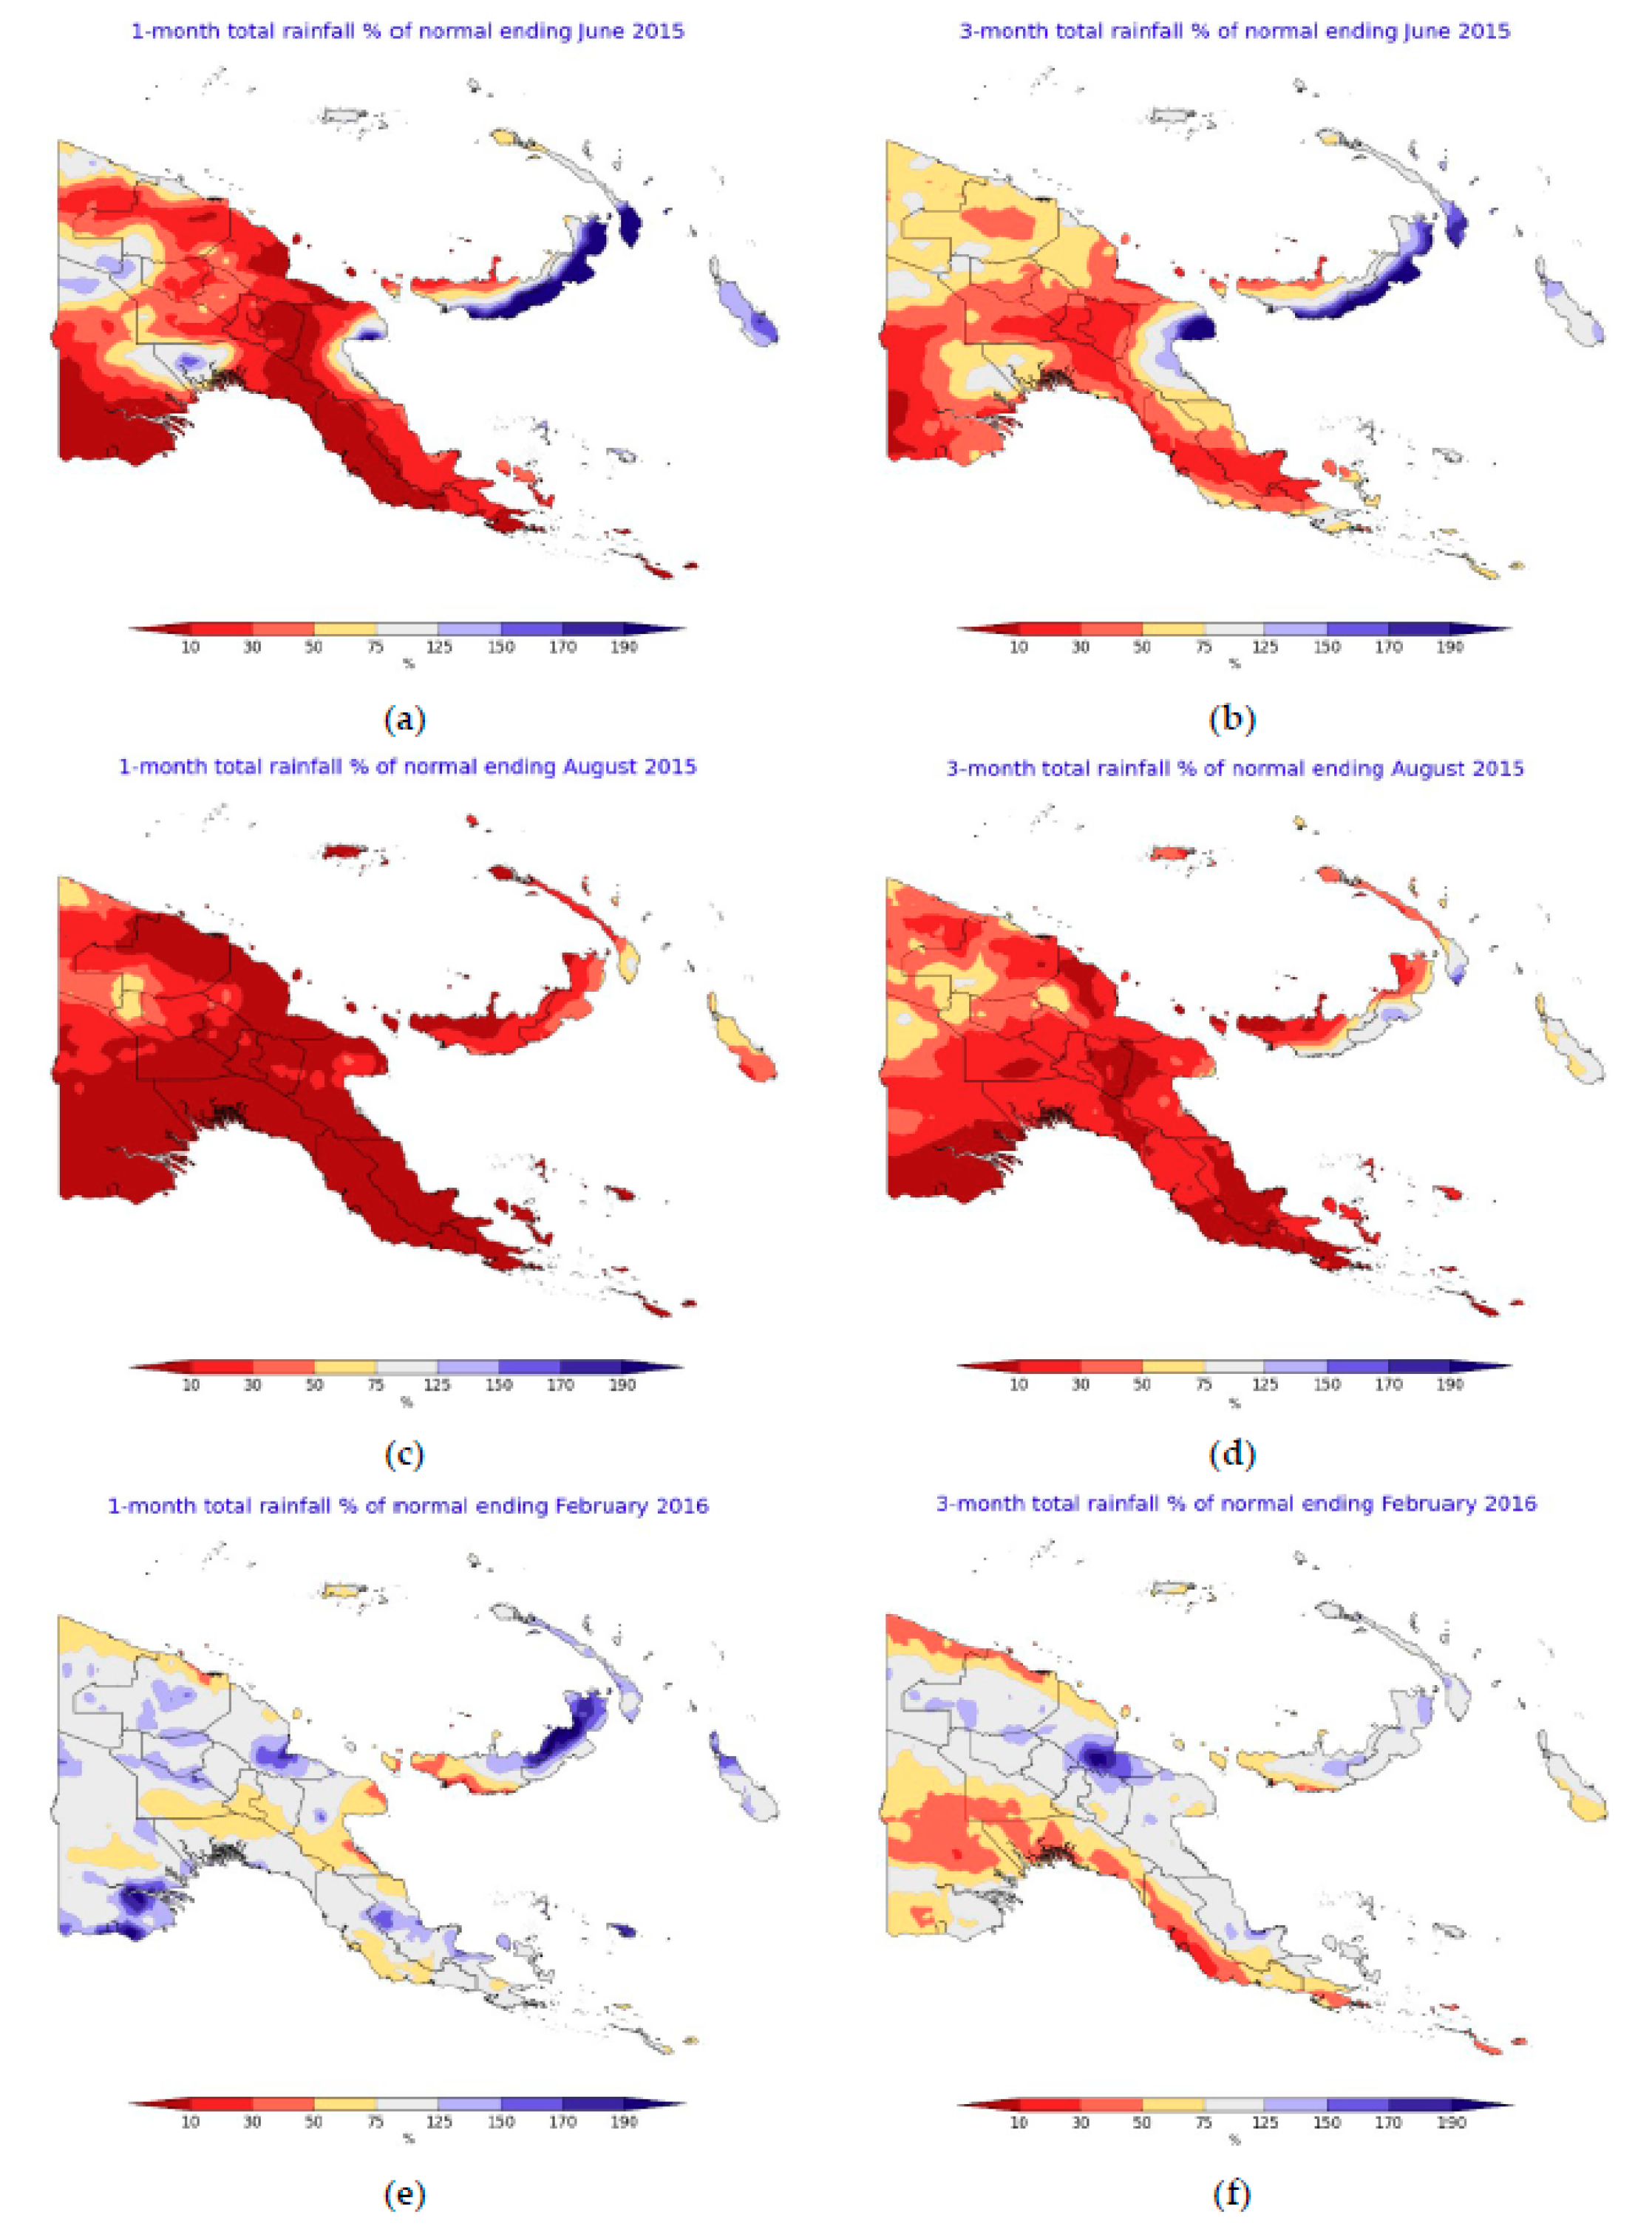
In the original article, there was a mistake in Figure 8 as published. An incorrect climatology was being used for both the one-month and three-month maps. In addition, the three-month accumulation process was incorrect.
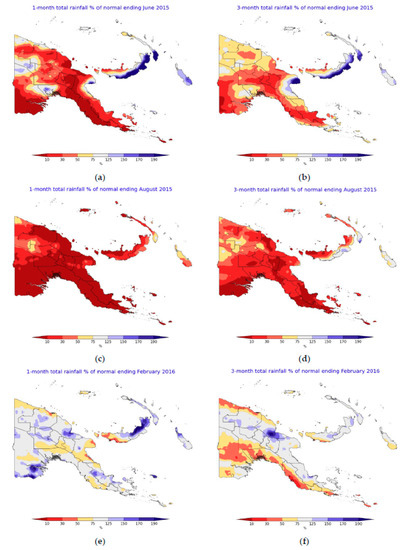
Figure 8.
(Original). One-month and 3-month rainfall percentages of normal depicting onset of meteorological drought conditions in June 2015 and easing in February 2016. (a) 1-month onset; (b) 3-month onset; (c) 1-month peak; (d) 3-month peak; (e) 1-month cessation; (f) 3-month cessation.
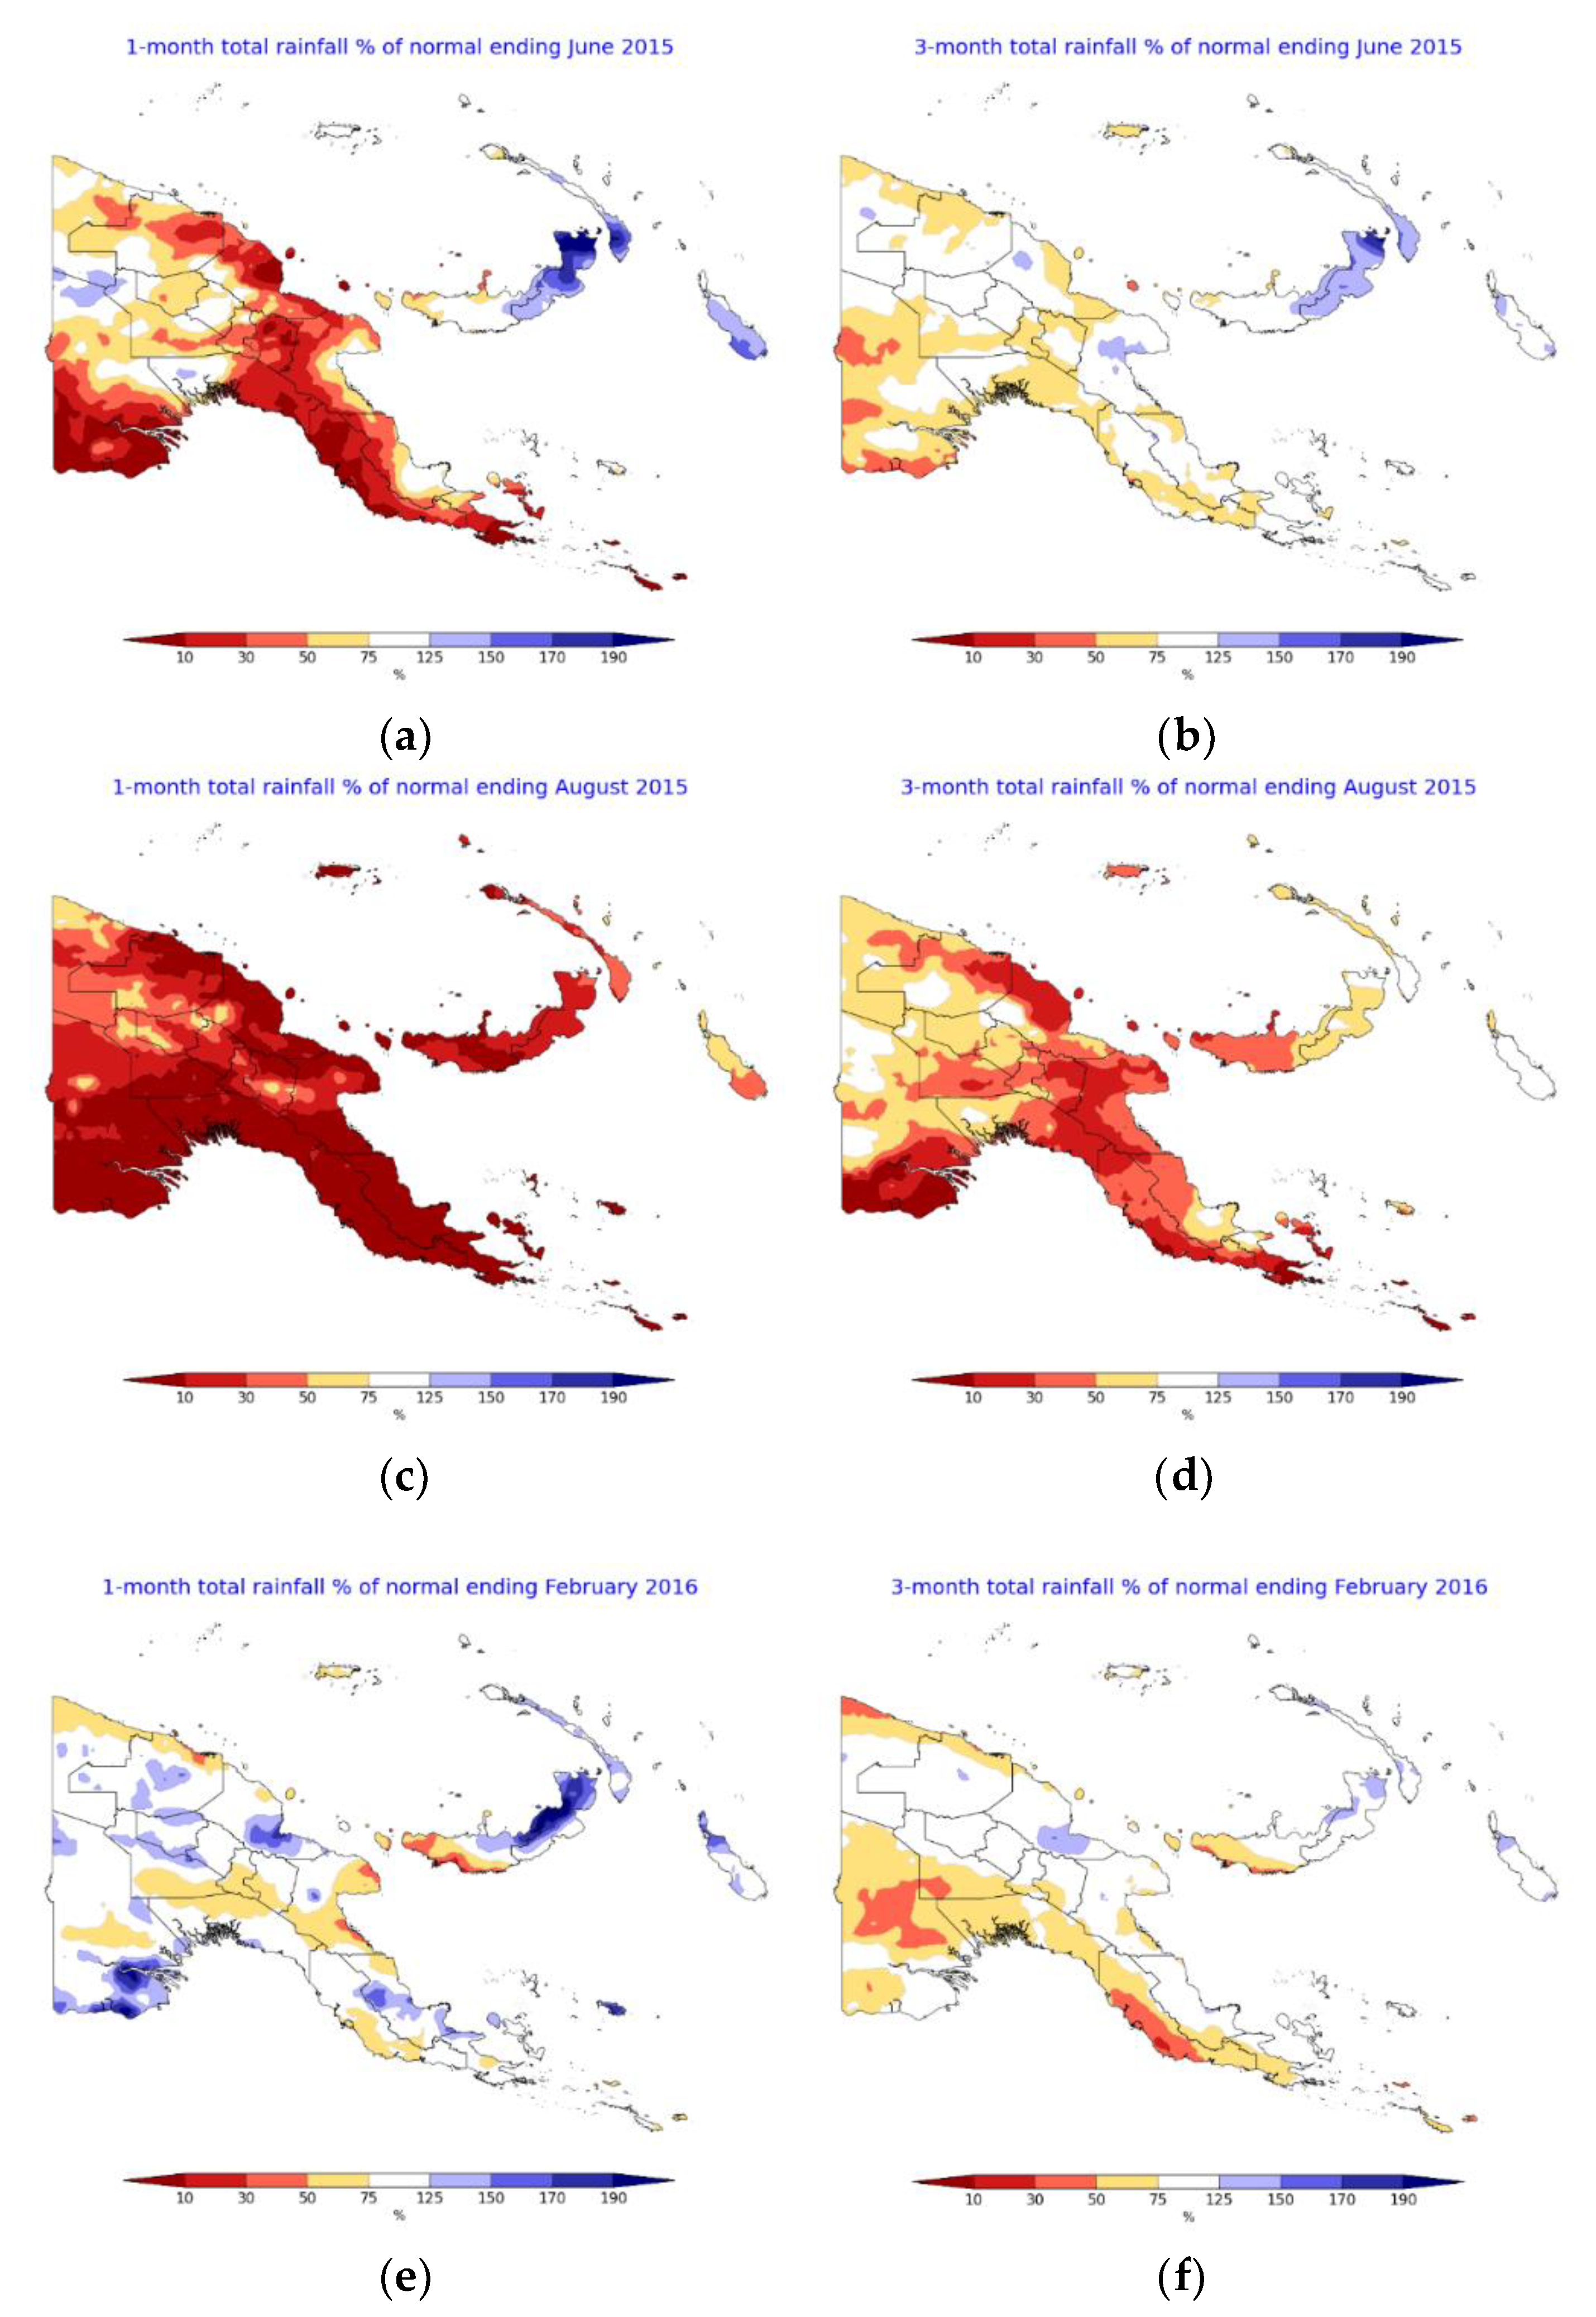
The corrected Figure 8 appears below. The authors apologize for any inconvenience caused and state that the scientific conclusions are unaffected. The original article has been updated.
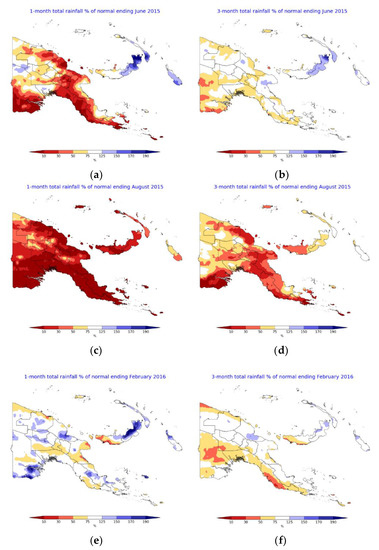
Figure 8.
(Replaced). One-month and 3-month rainfall percentages of normal depicting onset of meteorological drought conditions in June 2015 and easing in February 2016. (a) 1-month onset; (b) 3-month onset; (c) 1-month peak; (d) 3-month peak; (e) 1-month cessation; (f) 3-month cessation.
Reference
- Chua, Z.-W.; Kuleshov, Y.; Watkins, A.B. Drought Detection over Papua New Guinea Using Satellite-Derived Products. Remote Sens. 2020, 12, 3859. [Google Scholar] [CrossRef] [Scilit]
Publisher’s Note: MDPI stays neutral with regard to jurisdictional claims in published maps and institutional affiliations. |
© 2021 by the authors. Licensee MDPI, Basel, Switzerland. This article is an open access article distributed under the terms and conditions of the Creative Commons Attribution (CC BY) license (http://creativecommons.org/licenses/by/4.0/).