Abstract
Complementary information between two difference images (DI’s) has great contribution to improve change detection performances. Based on the effectiveness and flexibility of the multiple kernel learning (MKL) in information fusion, we develop a multiple kernel graph cut (MKGC) algorithm for synthetic aperture radar (SAR) image change detection. An energy function containing a weighted summation kernel is proposed for fusing the complementary information between the subtraction image and the ratio image. By iteratively minimizing the energy function, the kernel weights, region parameters and region labels are estimated automatically and optimally. Besides of it avoids modeling, MKGC also has a complete description of the changed areas and the strong noise immunity. Experiments on real GaoFen-3 SAR data set demonstrate the effectiveness of the MKGC algorithm, and illustrate that it is a good candidate for SAR image change detection.
1. Introduction
Change detection aims at identifying changes in images of the same scene taken at different times [1]. It is a vital branch of remote sensing image interpretation, and it is attracting a growing interest in civil and military applications, such as environment monitoring, disaster prevention and relief, urban study and so on [2,3,4,5]. Synthetic aperture radar (SAR) is insensitive to atmospheric and sun-illumination conditions, and it is an effective tool for change detection tasks. As a representative of high-resolution SAR sensor, Gaofen-3 SAR has great advantages in large scale and high-resolution earth observation. However, with the increase of imaging resolution, many disturbances occur at backgrounds. Moreover, speckle noise is still stubborn in SAR images. Therefore, SAR image change detection techniques, which can comprehensively detect changed areas as well as resisting speckle noise and background disturbances, still face technical challenges.
SAR image change detection can be carried out by binarily classifying a difference image (DI). In the literature, the subtraction operation, ratio operation, and their improvements, such as the mean-filtered subtraction, log-ratio, and mean-ratio are developed for fitting varied practical applications [6,7]. Besides, fusing complementary information of multiple DI’s is a valid solution for producing a powerful DI. In [6], a mean-filtered subtraction image and a median-filtered log-ratio image are fused for producing the smooth and edge-preserved change maps. In [7], the subtraction, ratio, absolute Euclidean distance, and chi-square transformation images are merged by using several decision-level fusion schemes. Moreover, Jia, L., etc. [8] illustrates the prospect of fusing the subtraction image and the ratio image, which provides implications for SAR image change detection.
Given the DI’s, a binary classification is implemented to get the change detection results [9,10]. A number of methods have gain positive change detection results from different perspectives. Statistical methods consider the statistical characteristics of the DI’s to produce the optimal thresholds, which could directly divide the target areas into changed and unchanged ones [11,12]. By incorporating the regular contextual information into the energy function, random field theories produce homogeneous detection areas and strong noise resistance [13,14]. Kernel methods are powerful in dealing with non-linear classification, and both the ratio-kernel based support vector machine (SVM) [15] and kernelized clustering [16] have gain positive change detection results. The rise of deep learning algorithms benefits from their ability in extracting deep and abstract features of the DI’s. In many cases, the features extracted could produce high detection accuracies and strong noise immunity [17,18]. However, it is hard to explain the meaning of the features. Graph learning theory, as a powerful structural information extractor, is promising in SAR image processing [19]. Abundant structural objects in high-resolution SAR images, such as the buildings, rivers, farmlands, and specific targets, promote the application of graph methods. Graph cut (GC) which avoids complex modeling of images is a prospective learning machine. It depicts the structural features of the images well, and thus produce high accuracies. Besides, the kernelized version, i.e., kernel graph cut (KGC), has more powerful detection performance and low computational complexity [20]. By now, KGC has not found wide applications in high-resolution SAR image change detection. Multiple kernel learning (MKL), as one of the most important information fusion methods, could improve the performances of the kernel methods by fusing complementary information from different sources [21]. The ability of KGC in feature extraction and representation and the speciality of MKL in information fusion may provide an important solution for high-resolution SAR image change detection.
Motivated by the merits of the MKL and KGC, we are inspired to propose a powerful unsupervised multiple kernel graph cut (MKGC) algorithm for SAR image change detection. MKGC first contributes in constructing a powerful energy function containing a data term and a smoothness term. The data term fuses the complementary information between the subtraction image and the ratio image by designing a weighted summation kernel (WSK) function. The smoothness term preserves the region boundaries by restricting pixels in the same region with similar labels. The energy function derives from the KGC and it could be minimized with the idea of min-cut [22]. In MKGC, there are three parameters in the energy function. Kernel weights of the WSK function determine the ability of fusing the complementary information of the DI’s. Region parameters represent the core characteristics of the regions, and they evaluate the deviation of the transformed data within the regions. Region labels indicate the partition index, which could be optimized to output the final detection results. The second contribution of MKGC is to propose an iterative optimization strategy to calculate the three parameters. Based on the two efforts above, MKGC realizes SAR image change detection in an unsupervised and optimized way. Moreover, by unitedly considering the merits of KGC and MKL in feature extraction and information fusion, MKGC simultaneously produces good preservation of the edges, comprehensive description of the changed areas and strong noise and disturbance immunity. Experimental results on GaoFen-3 SAR data sets verify the effectiveness of the MKGC in SAR image change detection.
2. Materials and Methods
Given the bi-temporal SAR images , the MKGC change detection method is realized with steps in Figure 1. As the core, the iterative optimization of MKGC is shown in Figure 2. In the following, the construction and optimization of MKGC are elaborated first. Then, the concrete implementation of the proposed change detection method is described.
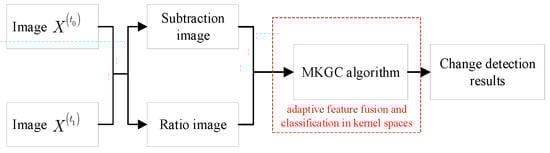
Figure 1.
Proposed MKGC change detection method.
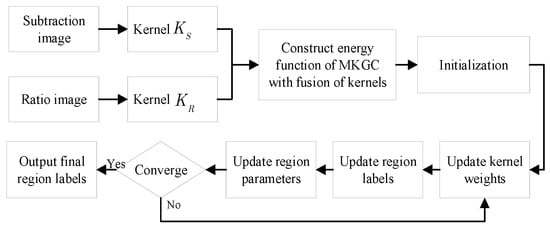
Figure 2.
Iterative optimization of MKGC.
2.1. Fundamentals of MKL
A kernel method utilizes a nonlinear mapping from the input space to a high-dimensional kernel space for increasing the representation capability of a linear machine [15]. Based on the kernel function , a kernel method enables the non-linear classification with a linear algorithm. The kernel function is the inner dot between the mapped pixels , and it can be constructed flexibly. The combination of multiple kernels induces the MKL [21]. MKL which constructs a kernel function from a number of basic kernels allows for a more flexible encoding of the knowledge from different sources. Weighted summation kernel (WSK) is a common tool for MKL, and automatic calculation of the kernel weights is the key. MKL has been widely studied in classification and change detection tasks.
2.2. Introduction to KGC
KGC is the kernel version of the graph cut [20]. It is more general for image classification by avoiding seeking the accurate image models. The energy function of KGC consists of a data term and a smoothness term. The data term measures the deviation of the image data from the classification regions in the kernel space, while the smoothness term polishes region boundaries with the differences between region indices. KGC does image classification by minimizing the following energy function:
where is a positive parameter balancing the data term and the smoothness term . are the image pixels. is the collection of region labels. is the constant parameter of the region (class) . is the neighborhood set containing all pairs of neighboring pixels. By applying the kernel substitution, the data term becomes
The smoothness term is calculated with the truncated squared absolute difference between the region parameters:
is a constant [20]. With respect to the minimization of , KGC realizes classification by iteratively optimizing the region labels and the region parameters.
2.3. Principles of the Proposed MKGC Algorithm
By improving KGC with MKL, a MKGC classifier is proposed in this paper for fusing multiple DI’s in change detection tasks. Suppose are the DI’s that are fused. is the kernel mapping function corresponding to . MKGC is constructed and optimized as follows.
2.3.1. Energy Function of MKGC
In MKGC, MKL is incorporated into the energy function for fusing the complementary features of multiple DI’s in the kernel spaces. The energy function of MKGC is
is same as that in (2). By applying the kernel substitution, the th data term becomes
is the th kernel function corresponding to the mapping function , and is the kernel weight. measures the deviation between the pixel and the constant region parameter in the th kernel space.
In MKGC, region parameters, region labels and kernel weights should be updated. Fixing two parameters, the other one can be optimized or updated by minimizing (5).
2.3.2. Update of Kernel Weights
Given the region parameters and region labels, we apply a Lagrange multiplier under the constraint to estimate the kernel weights:
Taking the partial derivative of with respect to , we have
where
Setting the derivative to zero, we get .
Since , we get the kernel weights as the harmonic mean [21]:
2.3.3. Update of Region Parameters
Given the region labels and kernel weights, regions parameters are optimized by computing the partial derivative of with respect to :
The variables and the formulations in (7) and in (2) are directly substituted into (12). Following the work [20], the region parameters regarding to the minimization of (5) are derived by the gradient descent of the following equation:
is the set of the four horizontally and vertically adjacent pixels neighboring . is the set of pixels in which satisfy . is the boundary of the region . is the set cardinality.
2.3.4. Update of Region Labels
With respect to the region parameters and kernel weights, regions labels are updated by the graph cut optimization. Let be a graph. is the set of nodes (image pixels) containing two terminals, and is the set of edges with non-negative weights. A cut is a subset of edges which separates terminals on an induced graph . The cost of a cut is defined as the sum of its edge weights, and the graph cut aims to find a minimum cut with the lowest cost.
With respect to the local minimum of , the minimum cut can be obtained by the combinatorial optimization with swap-moves [22]. Let be the collection of labels of the two terminals, swap moves find the minimum cut of a subgraph . contains the two terminals. contains the edges between nodes in . In each iteration, the edge weights are dynamically set with the following equation:
where is the set of the pixels labeled as and . is the edge weight between the pixel and the terminal of .
2.4. Implementation of MKGC Change Detection Method
In the proposed MKGC method, the subtraction image and the ratio image are fused. The two DI’s is computed by comparing gray values of the bi-temporal images pixel-by-pixel. They are:
and are the subtraction and ratio images. is a small value used for avoiding the occurrence of a singularity when the denominator becomes zero. The raw SAR images and the DI’s should be normalized.
It has been illustrated in [8] that the subtraction image and ratio image have complementary information. The subtraction image reflects the changed areas evenly and completely, and the ratio image suppresses the disturbances at unchanged backgrounds more heavily. For SAR images contaminated by speckle noise, a similar conclusion can be obtained, which will be analyzed in the following experiments.
Given the two DI’s, two kernel matrices are constructed. The radial basis function (RBF) kernel given by (17) is utilized for producing two kernels and . is the kernel width that needs to be tuned.
In Table 1, the complete procedure of the MKGC change detection method is summarized.

Table 1.
Steps of MKGC change detection algorithm.
3. Results
3.1. Data Sets
In this letter, a set of bi-temporal high-resolution SAR images with 2058 × 2758 pixels (shown in Figure 3) is utilized for illustrating the validity and popularity of the proposed MKGC method. The images are acquired in January 2017 and in October 2017 by the Gaofen-3 SAR sensor around the Huaihe River in Anhui province, China. The image resolution is 5m. The changes are caused by a flood event and some farming activities. In the experiments, three regions marked by red rectangles A, B and C are utilized. In regions A and B, the fields are flooded, and the river widths are slightly increased. In region C, a water region is changed into a farmland. The image sizes are 702 × 502, 420 × 380 and 380 × 274. The zoom-in images are shown in Figure 4(a1)–(c2). Before change detection, the two images are co-registered, and the registration is performed at a sub-pixel level.
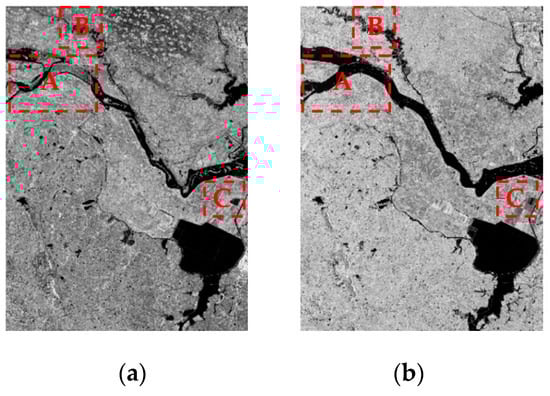
Figure 3.
GaoFen-3 SAR images around Huaihe river. (a) Image acquired in January 2017. (b) Image acquired in October 2017.
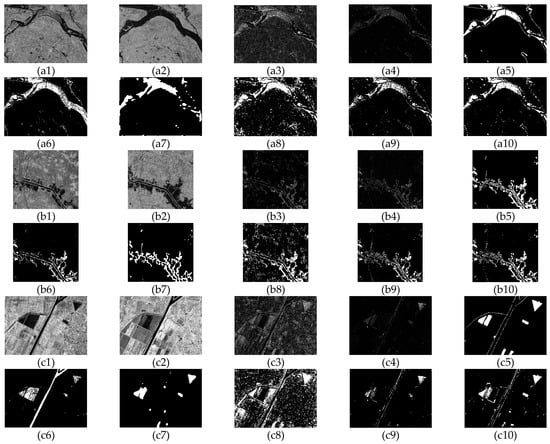
Figure 4.
GaoFen-3 SAR image change detection results. (a1)–(a9) Region A. (b1)–(b9) Region B. (c1)–(c9) Region C. (a1)–(c1) Pre-event images. (a2)–(c2) Post-event images. (a3)–(c3) Subtraction images. (a4)–(c4) Ratio images. (a5)–(c5) Reference images. (a6)–(c6) Change maps resulted from the ratio kernel-based SVM. (a7)–(c7) Change maps resulted from CNN with ratio images. (a8)–(c8) Change maps resulted from KGC with subtraction images. (a9)–(c9) Change maps resulted from KGC with ratio images. (a10)–(c10) Change maps resulted from MKGC.
3.2. Change Detection Results
The proposed MKGC algorithm is compared with four methods. They are the ratio kernel-based SVM [15], the CNN [17] acting on the ratio images, and the subtraction and ratio images classified by the KGC [20]. The SVM and the CNN methods are supervised methods, and they use the same samples as those selected in step 5.1 Table 1. In SVM, the kernel width and regularization parameter of SVM need to be tuned and they are selected with a grid search strategy in the range and [15]. In CNN, the 27 × 27 patches surrounding the samples are trained. Three convolution layers and two pooling layers are used. There are 20 kernels in each layer, and the kernel-sizes in the three convolution layers are 4 × 4, 5 × 5 and 4 × 4. The pooling size is 2 × 2 [17]. To subjectively evaluate the change detection results, final detection results are shown as binary change maps. Black pixels form the unchanged areas and white pixels form the changed areas. For an objective evaluation of the final results, overall accuracy () and kappa coefficient () are calculated by comparing the change maps with the reference images. The reference images are defined manually. Subjective results are given in Figure 4 and quantitative precisions are given in Table 2. Moreover, the execution time is given in Table 2 to show the efficiency of the methods.
Table 2.
Objective evaluation. Overall Accuracy (), Kappa Coefficient () and Execution time. Bold numbers are results of MKGC method.
4. Discussion
In this section, performance of the proposed method is discussed and analyzed. First, the complementary information between the two DI’s is shown and analyzed. Figure 4(a3)–(c3) and (a4)–(c4) show the subtraction and the ratio images. In SAR image processing, speckle noise is a crucial and inevitable factor that hinders the change detection results. Besides, complicated backgrounds, such as the dense urban regions and varied farmlands, also bring some disturbances. From the results, it is obvious that the subtraction image reflects the changed areas more evenly and completely, while the ratio image highlights the extremely large changes and suppresses the moderate changes caused by the disturbances and noise. In other word, the subtraction image has a good description of the changed areas, and the ratio image provides clean and less contaminated unchanged regions.
Change detection results obtained by the five methods are shown in Figure 4 (a6)–(c10). Obviously, SVM produces some false alarms at the changed areas, and the ratio operation in the kernel space provides it with certain noise resistance. CNN has outstanding noise immunity, because it effectively extracts the high-level abstract features of the ratio images. However, details in changed regions, e.g., the slightly increased river widths, may be lost by CNN. KGC with subtraction images provides complete changed areas. However, the heavy disturbances and noise at backgrounds bring so many false alarms. Results by KGC with ratio images provide clean unchanged regions. However, many miss alarms occur. Thus, it can be safely concluded that the change detection results by KGC rely on the performances of the DI’s. From Figure 4(a10)–(c10), it can be seen that the MKGC method produces convincing results by merging the advantages of the two DI’s. It produces changed areas more completely. The details and edges of changed areas are detected well. Besides, it limits false alarms at unchanged areas, that is MKGC has strong disturbances and noise resistance. Quantitative results are shown in Table 2. Evidently, the MKGC method gives relatively high values and values.
The computational efficiency of the five methods is shown in Table 2 too. SVM and CNN are supervised methods, and they consume a significant amount of time for the training processes. Therefore, their efficiency shown in Table 2 is the time consumed by the testing processes (the elapsed time of the training processes is not included). The KGC and MKGC methods are unsupervised. Compared with KGC, the extra time of MKGC is mainly caused by the fusion of the kernels. For region A and region C, 3 iterations are sufficient for MKGC to reach convergence. For region B, 5 iterations are needed. In MKGC, the number of the samples in step 5.1 is defined by experience. It influences the initialization of the parameters in (17) and in (5). As long as the samples are reliable, the parameters computed are reliable, as well as the final results. In a word, all the improvements demonstrate the effectiveness and efficiency of the proposed MKGC method in SAR image change detection.
5. Conclusions
In this paper, we have proposed a MKGC method for SAR image change detection. The method has fused the complementary information between the subtraction image and the ratio image in the kernel spaces, which could dramatically improve the discrimination of changed areas and the noise immunity in unchanged regions. Iterative update of the kernel weights, the region parameters and the region labels are the core optimization. Experimental results on real GaoFen-3 SAR data sets prove that the MKGC method produces competitive change detection results. It has unusual ability in detecting changed areas, in preserving edges and in resisting speckle noise. Future works will consider the SAR image change detection methods based on new MKL classifiers.
Author Contributions
Conceptualization, L.J.; Methodology, L.J.; Software, T.Z.; Validation, J.F.; Formal analysis, F.D.; Writing-Original Draft Preparation, L.J.; Writing-Review & Editing T.Z., J.F. and F.D. All authors have read and agreed to the published version of the manuscript.
Funding
This research was supported by the National Natural Science Foundation of China (61701154), the Natural Science Foundation of Anhui Province (1808085QF185), the China Postdoctoral Science Foundation (2018M630703) and the Fundamental Research Funds for the Central Universities (No.PA2020GDSK0080).
Data Availability Statement
The data presented in this study are available on request from the corresponding author.
Acknowledgments
The authors would like to thank the reviewers and the editor for the constructive comments.
Conflicts of Interest
The authors declare no conflict of interest.
References
- Singh, A. Digital Change Detection Techniques Using Remotely Sensed Data. Int. J. Remote Sens. 1989, 10, 989–1003. [Google Scholar] [CrossRef]
- Ahmadi, S.; Homayouni, S. A Novel Active Contours Model for Environmental Change Detection from Multitemporal Synthetic Aperture Radar Images. Remote Sens. 2020, 12, 1746. [Google Scholar] [CrossRef]
- Wang, Y.; Zhao, F.; Chen, P. A Framework of Spatio-temporal Fuzzy Clustering for Land-cover Change Detection using SAR Time Series. Int. J. Remote Sens. 2017, 28, 450–466. [Google Scholar] [CrossRef]
- Maltezos, E.; Ioannidis, C.; Doulamis, A.; Doulamis, N. Building Change Detection Using Semantic Segmentation on Analogue Aerial Photos. In Proceedings of the FIG Congress, Istanbul, Turkey, 6–11 May 2018. [Google Scholar]
- Chen, J.; Wang, R.; Ding, F.; Liu, B.; Jiao, L.; Zhang, J. A Convolutional Neural Network with Parallel Multi-Scale Spatial Pooling to Detect Temporal Changes in SAR Images. Remote Sens. 2020, 12, 1619. [Google Scholar] [CrossRef]
- Zheng, Y.; Zhang, X.; Hou, B.; Liu, G. Using Combined Difference Image and k -Means Clustering for SAR Image Change Detection. IEEE Geosci. Remote Sens. Lett. 2014, 11, 691–695. [Google Scholar] [CrossRef]
- Du, P.; Liu, S.; Gamba, P.; Tan, K.; Xia, J. Fusion of Difference Images for Change Detection Over Urban Areas. IEEE J. Sel. Top. Appl. Earth Observ. Remote Sens. 2012, 5, 1076–1086. [Google Scholar] [CrossRef]
- Jia, L.; Li, M.; Zhang, P.; Wu, Y.; An, L.; Song, W. Remote-Sensing Image Change Detection With Fusion of Multiple Wavelet Kernels. IEEE Trans. Geosci. Remote Sens. 2016, 9, 3405–3418. [Google Scholar] [CrossRef]
- Liu, L.; Jia, Z.; Yang, J.; Kasabov, N.K. SAR Image Change Detection Based on Mathematical Morphology and the K-Means Clustering Algorithm. IEEE Access 2019, 7, 43970–43978. [Google Scholar] [CrossRef]
- Li, Y.; Liu, G.; Li, T.; Jiao, L.; Lu, G.; Marturi, N. Application of Data Driven Optimization for Change Detection in Synthetic Aperture Radar Images. IEEE Access 2020, 8, 11426–11436. [Google Scholar] [CrossRef]
- Bovolo, F.; Marchesi, S.; Bruzzone, L. A Framework for Automatic and Unsupervised Detection of Multiple Changes in Multitemporal Images. IEEE Trans. Geosci. Remote Sens. 2012, 50, 2196–2212. [Google Scholar] [CrossRef]
- Sumaiya, M.N.; Ramapackiam, S.S.K. Unsupervised Change Detection of Flood affected areas in SAR images using Rayleigh based Bayesian Thresholding. IET Radar Sonar Nav. 2018, 12, 512–522. [Google Scholar] [CrossRef]
- Wang, L.; Huang, X.; Zheng, C.; Zhang, Y. A Markov Random Field Integrating Spectral Dissimilarity and Class Co-occurrence Dependency for Remote Sensing Image Classification Optimization. ISPRS J. Photogramm. Remote Sens. 2017, 128, 223–239. [Google Scholar] [CrossRef]
- Shang, Y.; Cao, G.; Zhang, Y. Change Detection Based on Fully-Connected Conditional Random Field with Region Potential in Remote Sensing Images. In Proceedings of the IGARSS 2018–2018 IEEE International Geoscience and Remote Sensing Symposium, Valencia, Spain, 22–27 July 2018; pp. 5020–5107. [Google Scholar]
- Camps-Valls, G.; Gomez-Chova, L.; Munoz-Mari, J.; Rojo-Alvarez, J.L.; Martinez-Ramon, M. Kernel-Based Framework for Multitemporal and Multisource Remote Sensing Data Classification and Change Detection. IEEE Trans. Geosci. Remote Sens. 2008, 46, 1822–1835. [Google Scholar] [CrossRef]
- Volpi, M.; Tuia, D.; Camps-Valls, G.; Kanevski, M. Unsupervised Change Detection With Kernels. IEEE Geosci. Remote Sens. Lett. 2012, 9, 1026–1030. [Google Scholar] [CrossRef]
- Gong, M.; Yang, H.; Zhang, P. Feature Learning and Change Feature Classification Based on Deep Learning for Ternary Classification Change Detection in SAR Images. ISPRS J. Photogramm. Remote Sens. 2017, 129, 212–225. [Google Scholar] [CrossRef]
- Geng, J.; Ma, X.; Zhou, X.; Wang, H. Saliency-Guided Deep Neural Networks for SAR Image Change Detection. IEEE Trans. Geosci. Remote Sens. 2019, 57, 7365–7377. [Google Scholar] [CrossRef]
- Pham, M.G.; Mercier, G.; Michel, J. Change Detection between SAR Images Using a Pointwise Approach and Graph theory. IEEE Trans. Geosci. Remote Sens. 2016, 54, 2020–2032. [Google Scholar] [CrossRef]
- Salah, M.B.; Mitiche, A.; Ayed, I.B. Multiregion Image Segmentation by Parametric Kernel Graph Cuts. IEEE Trans. Image Process. 2011, 20, 545–557. [Google Scholar] [CrossRef] [PubMed]
- Huang, H.C.; Chuang, Y.Y.; Chen, C.S. Multiple Kernel Fuzzy clustering. IEEE. Trans. Fuzzy Syst. 2004, 20, 120–134. [Google Scholar] [CrossRef]
- Boykov, Y.; Veksler, O.; Zabih, R. Fast Approximate Energy Minimization via Graph Cuts. IEEE Trans. Pattern Anal. Mach. Intell. 2001, 23, 1222–1239. [Google Scholar] [CrossRef]
Publisher’s Note: MDPI stays neutral with regard to jurisdictional claims in published maps and institutional affiliations. |
© 2021 by the authors. Licensee MDPI, Basel, Switzerland. This article is an open access article distributed under the terms and conditions of the Creative Commons Attribution (CC BY) license (http://creativecommons.org/licenses/by/4.0/).