Next Issue
Volume 12, January-1
Previous Issue
Volume 11, December-1
 
 
remotesensing-logo

Journal Browser

Journal Browser

Remote Sens., Volume 11, Issue 24 (December-2 2019) – 173 articles

Cover Story (view full-size image): 
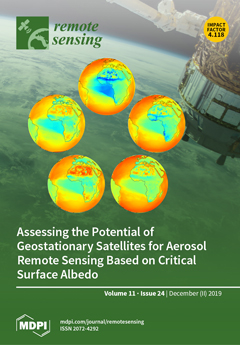
This work investigates the sensitivity to the aerosol optical depth (AOD) of the current and future geostationary weather satellites. The sensitivity to AOD is quantified as the difference between the albedo of the surface and the corresponding critical surface albedo (CSA). CSA refers to the value of surface reflectivity for which the reflectance measured by the satellite at the top of the atmosphere becomes insensitive to AOD. The figure shows the yearly-averaged departure from CSA for several channels of the imagers aboard the European Meteosat satellites. Warm colors highlight the regions that are far away from CSA, thus corresponding to favorable conditions for AOD retrieval. By contrast, cool colors highlight challenging conditions. Departure from CSA strongly depends on the spectral fingerprints of surface albedo and aerosol extinction properties.View this paper.
  • Issues are regarded as officially published after their release is announced to the table of contents alert mailing list.
  • You may sign up for e-mail alerts to receive table of contents of newly released issues.
  • PDF is the official format for papers published in both, html and pdf forms. To view the papers in pdf format, click on the "PDF Full-text" link, and use the free Adobe Reader to open them.
Order results
Result details
Section
Select all
Export citation of selected articles as:
19 pages, 1016 KiB  
Article
Remote Sensing Big Data Classification with High Performance Distributed Deep Learning
by Rocco Sedona, Gabriele Cavallaro, Jenia Jitsev, Alexandre Strube, Morris Riedel and Jón Atli Benediktsson
Remote Sens. 2019, 11(24), 3056; https://doi.org/10.3390/rs11243056 - 17 Dec 2019
Cited by 28 | Viewed by 6376
Abstract
High-Performance Computing (HPC) has recently been attracting more attention in remote sensing applications due to the challenges posed by the increased amount of open data that are produced daily by Earth Observation (EO) programs. The unique parallel computing environments and programming techniques that [...] Read more.
High-Performance Computing (HPC) has recently been attracting more attention in remote sensing applications due to the challenges posed by the increased amount of open data that are produced daily by Earth Observation (EO) programs. The unique parallel computing environments and programming techniques that are integrated in HPC systems are able to solve large-scale problems such as the training of classification algorithms with large amounts of Remote Sensing (RS) data. This paper shows that the training of state-of-the-art deep Convolutional Neural Networks (CNNs) can be efficiently performed in distributed fashion using parallel implementation techniques on HPC machines containing a large number of Graphics Processing Units (GPUs). The experimental results confirm that distributed training can drastically reduce the amount of time needed to perform full training, resulting in near linear scaling without loss of test accuracy. Full article
(This article belongs to the Special Issue Analysis of Big Data in Remote Sensing)
Show Figures

Graphical abstract

20 pages, 4164 KiB  
Article
Can We Use the QA4ECV Black-sky Fraction of Absorbed Photosynthetically Active Radiation (FAPAR) using AVHRR Surface Reflectance to Assess Terrestrial Global Change?
by Nadine Gobron, Mirko Marioni, Monica Robustelli and Eric Vermote
Remote Sens. 2019, 11(24), 3055; https://doi.org/10.3390/rs11243055 - 17 Dec 2019
Cited by 3 | Viewed by 2720
Abstract
NOAA platforms provide the longest period of terrestrial observation since the 1980s. The progress in calibration, atmospheric corrections and physically based land retrieval offers the opportunity to reprocess these data for extending terrestrial product time series. Within the Quality Assurance for Essential Climate [...] Read more.
NOAA platforms provide the longest period of terrestrial observation since the 1980s. The progress in calibration, atmospheric corrections and physically based land retrieval offers the opportunity to reprocess these data for extending terrestrial product time series. Within the Quality Assurance for Essential Climate Variables (QA4ECV) project, the black-sky Joint Research Centre (JRC)-fraction of absorbed photosynthetically active radiation (FAPAR) algorithm was developed for the AVHRR sensors on-board NOAA-07 to -16 using the Land Surface Reflectance Climate Data Record. The retrieval algorithm was based on the radiative transfer theory, and uncertainties were included in the products. We proposed a time and spatial composite for providing both 10-day and monthly products at 0.05º × 0.05º. Quality control and validation were achieved through benchmarking against third-party products, including Sea-Viewing Wide Field-of-View Sensor (SeaWiFS) datasets produced with the same retrieval algorithm. Past ground-based measurements, providing a proxy of FAPAR, showed good agreement of seasonality values over short homogeneous canopies and mixed vegetation. The average difference between SeaWiFS and QA4ECV monthly products over 2002–2005 is about 0.075 with a standard deviation of 0.091. We proposed a monthly linear bias correction that reduced these statistics to 0.02 and 0.001. The complete harmonized long-term time series was then used to address its fitness for the purpose of analysis of global terrestrial change. Full article
(This article belongs to the Section Biogeosciences Remote Sensing)
Show Figures

Figure 1

19 pages, 7933 KiB  
Article
Methane Mapping with Future Satellite Imaging Spectrometers
by Alana K. Ayasse, Philip E. Dennison, Markus Foote, Andrew K. Thorpe, Sarang Joshi, Robert O. Green, Riley M. Duren, David R. Thompson and Dar A. Roberts
Remote Sens. 2019, 11(24), 3054; https://doi.org/10.3390/rs11243054 - 17 Dec 2019
Cited by 28 | Viewed by 8774
Abstract
This study evaluates a new generation of satellite imaging spectrometers to measure point source methane emissions from anthropogenic sources. We used the Airborne Visible and Infrared Imaging Spectrometer Next Generation(AVIRIS-NG) images with known methane plumes to create two simulated satellite products. One simulation [...] Read more.
This study evaluates a new generation of satellite imaging spectrometers to measure point source methane emissions from anthropogenic sources. We used the Airborne Visible and Infrared Imaging Spectrometer Next Generation(AVIRIS-NG) images with known methane plumes to create two simulated satellite products. One simulation had a 30 m spatial resolution with ~200 Signal-to-Noise Ratio (SNR) in the Shortwave Infrared (SWIR) and the other had a 60 m spatial resolution with ~400 SNR in the SWIR; both products had a 7.5 nm spectral spacing. We applied a linear matched filter with a sparsity prior and an albedo correction to detect and quantify the methane emission in the original AVIRIS-NG images and in both satellite simulations. We also calculated an emission flux for all images. We found that all methane plumes were detectable in all satellite simulations. The flux calculations for the simulated satellite images correlated well with the calculated flux for the original AVIRIS-NG images. We also found that coarsening spatial resolution had the largest impact on the sensitivity of the results. These results suggest that methane detection and quantification of point sources will be possible with the next generation of satellite imaging spectrometers. Full article
(This article belongs to the Special Issue State-of-the-Art Remote Sensing in North America 2019)
Show Figures

Graphical abstract

27 pages, 7224 KiB  
Article
Land Use versus Land Cover: Geo-Analysis of National Roads and Synchronisation Algorithms
by Katarzyna Kocur-Bera and Agnieszka Dawidowicz
Remote Sens. 2019, 11(24), 3053; https://doi.org/10.3390/rs11243053 - 17 Dec 2019
Cited by 7 | Viewed by 3039
Abstract
Technological progress in Earth surface observation provides a vast range of information on the land and methods of its use. This enables property owners, users and administrators to monitor the state of the boundaries of the land they own/administer. The land cover, monitored [...] Read more.
Technological progress in Earth surface observation provides a vast range of information on the land and methods of its use. This enables property owners, users and administrators to monitor the state of the boundaries of the land they own/administer. The land cover, monitored directly on the ground, is not always consistent with the land use entered in the Land and Property Registry (LPR). Discrepancies between these data are often found in former communist countries. One of the reasons for this was the rapid process of land privatisation, which took place in Poland, without updating information on the plot geodetic boundaries. The study examined and compared the land use (entered in the LPR) with the land cover (on the ground) for national roads (acr. LU-LC). The most frequent discrepancies were selected, using CLC2018, digital orthophotomaps (using the Web Map Service (WMS) browsing service compliant with Open Geospatial Consortium (OGC) standards), cadastral data, statistical modelling and an updated survey of the right-of-way. Subsequently, six algorithms were proposed to synchronise the land use and land cover when the right-of-way was used by unauthorised persons, and two algorithms for cases of unauthorised use of land by the road administrator. Currently, it is difficult to synchronise the land cover with the land use from the administrative, legal and social points of view. The results of analyses show that full synchronisation of land use and land cover is complicated and time-consuming, although desired. Full article
Show Figures

Graphical abstract

21 pages, 3334 KiB  
Article
A Generic Approach toward Indoor Navigation and Pathfinding with Robust Marker Tracking
by Dawar Khan, Sehat Ullah and Syed Nabi
Remote Sens. 2019, 11(24), 3052; https://doi.org/10.3390/rs11243052 - 17 Dec 2019
Cited by 22 | Viewed by 4653
Abstract
Indoor navigation and localization has gained a key attention of the researchers in the recent decades. Various technologies such as WiFi, Bluetooth, Ultra Wideband (UWB), and Radio-frequency identification (RFID) have been used for indoor navigation and localization. However, most of these existing methods [...] Read more.
Indoor navigation and localization has gained a key attention of the researchers in the recent decades. Various technologies such as WiFi, Bluetooth, Ultra Wideband (UWB), and Radio-frequency identification (RFID) have been used for indoor navigation and localization. However, most of these existing methods often fail in providing a reasonable solution to the key challenges such as implementation cost, accuracy and extendibility. In this paper, we proposed a low-cost, and extendable framework for indoor navigation. We used simple markers printed on the paper, and placed on ceilings of the building. These markers are detected by a smartphone’s camera, and the audio and visual information associated with these markers are used as a user guidance. The system finds shortest path between any two arbitrary nodes for user navigation. In addition, it is extendable having the capability to cover new sections by installing new nodes at any place in the building. The system can be used for guidance of the blind people, tourists and new visitors in an indoor environment. The evaluation results reveal that the proposed system can guide users toward their destination in an efficient and accurate manner. Full article
Show Figures

Graphical abstract

14 pages, 2782 KiB  
Article
Badland Erosion and Its Morphometric Features in the Tropical Monsoon Area
by Ci-Jian Yang, Li-Wei Yeh, Yeuan-Chang Cheng, Chia-Hung Jen and Jiun-Chuan Lin
Remote Sens. 2019, 11(24), 3051; https://doi.org/10.3390/rs11243051 - 17 Dec 2019
Cited by 8 | Viewed by 3152
Abstract
Climatically driven processes are important controls on the Earth’s surface and on interactions between the hydrological cycle and erosion in drainage basins. As a result, landscape forms such as hillslope topography can be used as an archive to reconstruct historical climatic conditions. Recent [...] Read more.
Climatically driven processes are important controls on the Earth’s surface and on interactions between the hydrological cycle and erosion in drainage basins. As a result, landscape forms such as hillslope topography can be used as an archive to reconstruct historical climatic conditions. Recent progress in the Structure-from-Motion (SfM) photogrammetric technique allows for the construction of high-resolution, low-cost topography data using remote-controlled unmanned aerial vehicle (UAV) surveys. Here, we present the climatic effects on the hillslope erosion rate that can be obtained from the drainage frequency of hillslopes. We quantify the centimeter-scale accuracy of surveys across 72 badland hillslopes in SE Taiwan, which is a tropical monsoon area with an annual precipitation of over 2 m. Our observations indicate that climatic erosion results in a higher drainage frequency and the number of furrows, instead of drainage density. Additionally, the morphometric slope index (MSI) has a strong positive correlation with erosion and its rate but shows a negative correlation with drainage length and a positive correlation with inclination. This suggests that the erosion pattern is due to gravitational mass wasting instead of hydrological erosion. MSI should always be calculated relying on the normalized slope length and is less applicable to landslide-dominated erosion. We, therefore, suggest that UAV-driven digital elevation models (DEMs) are integrated into erosion mapping to aid in identifying erosion patterns. We highlight the unique opportunity for cross-climate zone comparative studies offered by badland landscapes and differential rainfall patterns, with remote sensing techniques and the morphometric slope index. Full article
(This article belongs to the Special Issue Remote Sensing for Geomorphological Mapping)
Show Figures

Graphical abstract

19 pages, 3400 KiB  
Article
Human-Induced and Climate-Driven Contributions to Water Storage Variations in the Haihe River Basin, China
by Yulong Zhong, Wei Feng, Vincent Humphrey and Min Zhong
Remote Sens. 2019, 11(24), 3050; https://doi.org/10.3390/rs11243050 - 17 Dec 2019
Cited by 40 | Viewed by 4762
Abstract
Terrestrial water storage (TWS) can be influenced by both climate change and anthropogenic activities. While the Gravity Recovery and Climate Experiment (GRACE) satellites have provided a global view on long-term trends in TWS, our ability to disentangle human impacts from natural climate variability [...] Read more.
Terrestrial water storage (TWS) can be influenced by both climate change and anthropogenic activities. While the Gravity Recovery and Climate Experiment (GRACE) satellites have provided a global view on long-term trends in TWS, our ability to disentangle human impacts from natural climate variability remains limited. Here we present a quantitative method to isolate these two contributions with reconstructed climate-driven TWS anomalies (TWSA) based on long-term precipitation data. Using the Haihe River Basin (HRB) as a case study, we find a higher human-induced water depletion rate (−12.87 ± 1.07 mm/yr) compared to the original negative trend observed by GRACE alone for the period of 2003–2013, accounting for a positive climate-driven TWSA trend (+4.31 ± 0.72 mm/yr). We show that previous approaches (e.g., relying on land surface models) provide lower estimates of the climate-driven trend, and thus likely underestimated the human-induced trend. The isolation method presented in this study will help to interpret observed long-term TWS changes and assess regional anthropogenic impacts on water resources. Full article
(This article belongs to the Section Remote Sensing in Geology, Geomorphology and Hydrology)
Show Figures

Graphical abstract

15 pages, 7449 KiB  
Article
Mapping of Snow Depth by Blending Satellite and In-Situ Data Using Two-Dimensional Optimal Interpolation—Application to AMSR2
by Cezar Kongoli, Jeffrey Key and Thomas M. Smith
Remote Sens. 2019, 11(24), 3049; https://doi.org/10.3390/rs11243049 - 17 Dec 2019
Cited by 5 | Viewed by 4907
Abstract
The development of a snow depth product over North America is investigated by applying two-dimensional optimal interpolation to passive microwave satellite-derived and in-situ measured snow depth. At each snow-covered satellite footprint, the technique computes a snow depth increment as the weighted average of [...] Read more.
The development of a snow depth product over North America is investigated by applying two-dimensional optimal interpolation to passive microwave satellite-derived and in-situ measured snow depth. At each snow-covered satellite footprint, the technique computes a snow depth increment as the weighted average of data increments, and updates the satellite-derived snow depth accordingly. Data increments are computed as the difference between the in-situ-measured and satellite snow depth at station locations surrounding the satellite footprint. Calculation of optimal weights is based on spatial lag autocorrelation of snow depth increments, modelled as functions of horizontal distance and elevation difference between pairs of observations. The technique is applied to Advanced Microwave Scanning Radiometer 2 (AMSR2) snow depth and in-situ snow depth obtained from the Global Historical Climatology Network. The results over North America during January–February 2017 indicate that the technique greatly enhances the performance of the satellite estimates, especially over mountain terrain, albeit with an accuracy inferior to that over low elevation areas. Moreover, the technique generates more accurate output compared to that from NOAA’s Global Forecast System, with implications for improving the utilization of satellite data in snow assessments and numerical weather prediction. Full article
(This article belongs to the Collection Feature Papers for Section Environmental Remote Sensing)
Show Figures

Graphical abstract

23 pages, 9270 KiB  
Article
Simulating Land Cover Change Impacts on Groundwater Recharge under Selected Climate Projections, Maui, Hawaiʻi
by Laura Brewington, Victoria Keener and Alan Mair
Remote Sens. 2019, 11(24), 3048; https://doi.org/10.3390/rs11243048 - 17 Dec 2019
Cited by 15 | Viewed by 5667
Abstract
This project developed an integrated land cover/hydrological modeling framework using remote sensing and geographic information systems (GIS) data, stakeholder input, climate information and projections, and empirical data to estimate future groundwater recharge on the Island of Maui, Hawaiʻi, USA. End-of-century mean annual groundwater [...] Read more.
This project developed an integrated land cover/hydrological modeling framework using remote sensing and geographic information systems (GIS) data, stakeholder input, climate information and projections, and empirical data to estimate future groundwater recharge on the Island of Maui, Hawaiʻi, USA. End-of-century mean annual groundwater recharge was estimated under four future land cover scenarios: Future 1 (conservation-focused), Future 2 (status-quo), Future 3 (development-focused), and Future 4 (balanced conservation and development), and two downscaled climate projections: a coupled model intercomparison project (CMIP) phase 5 (CMIP5) representative concentration pathway (RCP) 8.5 “dry climate” future and a CMIP3 A1B “wet climate” future. Results were compared to recharge estimated using the 2017 baseline land cover to understand how changing land management and climate could influence groundwater recharge. Estimated recharge increased island-wide under all future land cover and climate combinations and was dominated by specific land cover transitions. For the dry future climate, recharge for land cover Futures 1 to 4 increased by 12%, 0.7%, 0.01%, and 11% relative to 2017 land cover conditions, respectively. Corresponding increases under the wet future climate were 10%, 0.9%, 0.6%, and 9.3%. Conversion from fallow/grassland to diversified agriculture increased irrigation, and therefore recharge. Above the cloud zone (610 m), conversion from grassland to native or alien forest led to increased fog interception, which increased recharge. The greatest changes to recharge occurred in Futures 1 and 4 in areas where irrigation increased, and where forest expanded within the cloud zone. Furthermore, new future urban expansion is currently slated for coastal areas that are already water-stressed and had low recharge projections. This study demonstrated that a spatially-explicit scenario planning process and modeling framework can communicate the possible consequences and tradeoffs of land cover change under a changing climate, and the outputs from this study serve as relevant tools for landscape-level management and interventions. Full article
(This article belongs to the Special Issue Remote Sensing of Human-Environment Interactions)
Show Figures

Graphical abstract

15 pages, 1004 KiB  
Article
Sensitivity Analysis of Machine Learning Models for the Mass Appraisal of Real Estate. Case Study of Residential Units in Nicosia, Cyprus
by Thomas Dimopoulos and Nikolaos Bakas
Remote Sens. 2019, 11(24), 3047; https://doi.org/10.3390/rs11243047 - 17 Dec 2019
Cited by 21 | Viewed by 6444
Abstract
A recent study of property valuation literature indicated that the vast majority of researchers and academics in the field of real estate are focusing on Mass Appraisals rather than on the further development of the existing valuation methods. Researchers are using a variety [...] Read more.
A recent study of property valuation literature indicated that the vast majority of researchers and academics in the field of real estate are focusing on Mass Appraisals rather than on the further development of the existing valuation methods. Researchers are using a variety of mathematical models used within the field of Machine Learning, which are applied to real estate valuations with high accuracy. On the other hand, it appears that professional valuers do not use these sophisticated models during daily practice, rather they operate using the traditional five methods. The Department of Lands and Surveys in Cyprus recently published the property values (General Valuation) for taxation purposes which were calculated by applying a hybrid model based on the Cost approach with the use of regression analysis in order to quantify the specific parameters of each property. In this paper, the authors propose a number of algorithms based on Artificial Intelligence and Machine Learning approaches that improve the accuracy of these results significantly. The aim of this work is to investigate the capabilities of such models and how they can be used for the mass appraisal of properties, to highlight the importance of sensitivity analysis in such models and also to increase the transparency so that automated valuation models (AVM) can be used for the day-to-day work of the valuer. Full article
(This article belongs to the Special Issue Remote Sensing in Applications of Geoinformation)
Show Figures

Figure 1

25 pages, 4078 KiB  
Article
Changes in Lake Area in Response to Climatic Forcing in the Endorheic Hongjian Lake Basin, China
by Kang Liang and Yanzhong Li
Remote Sens. 2019, 11(24), 3046; https://doi.org/10.3390/rs11243046 - 17 Dec 2019
Cited by 8 | Viewed by 2800
Abstract
Endorheic lakes are key components of the water cycle and the ecological system in endorheic basins. The endorheic Hongjian Lake wetland is China’s national nature reserve for protecting the vulnerable species of Relict Gull. The Hongjian Lake, once China’s largest desert freshwater lake, [...] Read more.
Endorheic lakes are key components of the water cycle and the ecological system in endorheic basins. The endorheic Hongjian Lake wetland is China’s national nature reserve for protecting the vulnerable species of Relict Gull. The Hongjian Lake, once China’s largest desert freshwater lake, has been suffering from severe shrinkage in the last two decades, yet the variations in the lake area and its responses to climate change are poorly understood due to a lack of in situ observations. In this study, using Landsat remote sensing images, the Modified Normalized Difference Water Index, and nonparametric tests, we obtained the Hongjian Lake area changes on the annual, seasonal, and quasi-monthly scales during 1988–2014, analyzed the corresponding variations of the six climatic factors in the Hongjian Lake Basin (HJLB) using satellite-based products, and investigated the multi-scale response characteristics of lake area to climatic forcing using correlation analysis. The results showed that the lake area decreased during 1988–2014, and this process can be divided into two sub-stages, namely the first slight increasing sub-phase in 1988–1999 and the second significant declining sub-phase in 2000–2014. The shifts in patterns of the seasonal cycle had three types: as the natural rhythm of the lake changes has been broken by intensive human activities since the late 1990s, the natural bimodal type I has obviously changed into non-natural bimodal type II and unimodal type III, featured by a declining peak in July–September. The climatic wet/dry regime on multi-scales during 1988–2014 in the HJLB was generally warming and drying, mainly reflected by the increase in temperature (T), arid index (AI) and evaporation (ET0, ETa), and the decrease in the precipitation (Pre) and actual water difference (AWD). There were large differences in the climatic factors at different time scales, especially in the wet and dry seasons. When the lagged effect, the cumulative effect, and the lagged and cumulative combined effect were gradually considered, the correlation coefficient significantly increased, and the direction of the correlation coefficient became coincident with common sense. The correlation analysis identified a lag period of approximately 1–3 years on an annual scale, and a lag period of approximately 1–3 months on a monthly scale. This study could provide a certain scientific reference for climate change detection, water resource management, and species habitat protection in the HJLB and similar endorheic basins or inland arid regions. Full article
(This article belongs to the Special Issue Remote Sensing of Wetlands)
Show Figures

Graphical abstract

27 pages, 4678 KiB  
Article
Characteristics of Warm Clouds and Precipitation in South China during the Pre-Flood Season Using Datasets from a Cloud Radar, a Ceilometer, and a Disdrometer
by Jiafeng Zheng, Liping Liu, Haonan Chen, Yabin Gou, Yuzhang Che, Haolin Xu and Qian Li
Remote Sens. 2019, 11(24), 3045; https://doi.org/10.3390/rs11243045 - 17 Dec 2019
Cited by 16 | Viewed by 4297
Abstract
The millimeter-wave cloud radar, ceilometer, and disdrometer have been widely used to observe clouds and precipitation. However, there are some drawbacks when those three instruments are solely employed due to their own limitations, such as the fact that radars usually suffer from signal [...] Read more.
The millimeter-wave cloud radar, ceilometer, and disdrometer have been widely used to observe clouds and precipitation. However, there are some drawbacks when those three instruments are solely employed due to their own limitations, such as the fact that radars usually suffer from signal attenuation and ceilometers/disdrometers cannot provide measurements of the hydrometeors of aloft clouds and precipitation. Thus, in this paper, we developed an integrated technology by combining and utilizing the advantages of three instruments together to investigate the vertical structure and diurnal variation of warm clouds and precipitation, and the raindrop size distribution. Specifically, the technology consists of appropriate data processing, quality control, and retrieval methods. It was implemented to study the warm clouds and precipitation in South China during the pre-flood season of 2016. The results showed that the hydrometeors of warm clouds and precipitation were mainly distributed below 2.5 km and most of the rainfall events were very light with a rain rate less than 1 mm h−1, however, the stronger precipitation primarily contributed the accumulated rain amount. Furthermore, a rising trend of cloud base height from 1000 to 1900 BJT was found. The cloud top height and cloud thickness gradually increased from 1200 BJT to reach a maximum at 1600 BJT (Beijing Standard Time, UTC+8), and then decreased until 2000 BJT. Also, three periods of the apparent rainfall on the ground of the day, namely, 0400–0700 BJT, 1400–1800 BJT, and 2300–2400 BJT were observed. During three periods, the raindrops had wider size spectra, higher number concentrations, larger rain rates, and higher water contents than at other times. The hydrometeor type, size, and concentration were gradually changed in the vertical orientation. The raindrop size distributions of warm precipitation in the air and on the ground were different, which can be expressed by γ distributions N(D) = 1.49 × 10⁴D−0.9484exp(−6.79D) in the air and N(D) = 1.875 × 10³D0.862exp(−2.444D) on the ground, where D and N(D) denote the diameter and number concentration of the raindrops, respectively. Full article
(This article belongs to the Special Issue Remote Sensing of Clouds)
Show Figures

Graphical abstract

28 pages, 7664 KiB  
Article
An All-Weather Land Surface Temperature Product Based on MSG/SEVIRI Observations
by João P. A. Martins, Isabel F. Trigo, Nicolas Ghilain, Carlos Jimenez, Frank-M. Göttsche, Sofia L. Ermida, Folke-S. Olesen, Françoise Gellens-Meulenberghs and Alirio Arboleda
Remote Sens. 2019, 11(24), 3044; https://doi.org/10.3390/rs11243044 - 17 Dec 2019
Cited by 59 | Viewed by 5578
Abstract
A new all-weather land surface temperature (LST) product derived at the Satellite Application Facility on Land Surface Analysis (LSA-SAF) is presented. It is the first all-weather LST product based on visible and infrared observations combining clear-sky LST retrieved from the Spinning Enhanced Visible [...] Read more.
A new all-weather land surface temperature (LST) product derived at the Satellite Application Facility on Land Surface Analysis (LSA-SAF) is presented. It is the first all-weather LST product based on visible and infrared observations combining clear-sky LST retrieved from the Spinning Enhanced Visible and Infrared Imager on Meteosat Second Generation (MSG/SEVIRI) infrared (IR) measurements with LST estimated with a land surface energy balance (EB) model to fill gaps caused by clouds. The EB model solves the surface energy balance mostly using products derived at LSA-SAF. The new product is compared with in situ observations made at 3 dedicated validation stations, and with a microwave (MW)-based LST product derived from Advanced Microwave Scanning Radiometer-Earth Observing System (AMSR-E) measurements. The validation against in-situ LST indicates an accuracy of the new product between -0.8 K and 1.1 K and a precision between 1.0 K and 1.4 K, generally showing a better performance than the MW product. The EB model shows some limitations concerning the representation of the LST diurnal cycle. Comparisons with MW LST generally show higher LST of the new product over desert areas, and lower LST over tropical regions. Several other imagers provide suitable measurements for implementing the proposed methodology, which offers the potential to obtain a global, nearly gap-free LST product. Full article
Show Figures

Graphical abstract

19 pages, 7571 KiB  
Article
Evaluation and Intercomparison of SMOS, Aquarius, and SMAP Sea Surface Salinity Products in the Arctic Ocean
by Séverine Fournier, Tong Lee, Wenqing Tang, Michael Steele and Estrella Olmedo
Remote Sens. 2019, 11(24), 3043; https://doi.org/10.3390/rs11243043 - 17 Dec 2019
Cited by 35 | Viewed by 4489
Abstract
Salinity is a critical parameter in the Arctic Ocean, having potential implications for climate and weather. This study presents the first systematic analysis of 6 commonly used sea surface salinity (SSS) products from the National Aeronautics and Space Administration (NASA) Aquarius and Soil [...] Read more.
Salinity is a critical parameter in the Arctic Ocean, having potential implications for climate and weather. This study presents the first systematic analysis of 6 commonly used sea surface salinity (SSS) products from the National Aeronautics and Space Administration (NASA) Aquarius and Soil Moisture Active Passive (SMAP) satellites and the European Space Agency (ESA) Soil Moisture and Ocean Salinity (SMOS) mission, in terms of their consistency among one another and with in-situ data. Overall, the satellite SSS products provide a similar characterization of the time mean SSS large-scale patterns and are relatively consistent in depicting the regions with strong SSS temporal variability. When averaged over the Arctic Ocean, the SSS show an excellent consistency in describing the seasonal and interannual variations. Comparison of satellite SSS with in-situ salinity measurements along ship transects suggest that satellite SSS captures salinity gradients away from regions with significant sea-ice concentration. The root-mean square differences (RMSD) of satellite SSS with respect to in-situ measurements improves with increasing temperature, reflecting the limitation of L-band radiometric sensitivity to SSS in cold water. However, the satellite SSS biases with respect to the in-situ measurements do not show a consistent dependence on temperature. The results have significant implications for the calibration and validation of satellite SSS as well as for the modeling community and the design of future satellite missions. Full article
(This article belongs to the Section Ocean Remote Sensing)
Show Figures

Graphical abstract

22 pages, 8836 KiB  
Review
A Review of RFI Mitigation Techniques in Microwave Radiometry
by J. Querol, A. Perez and A. Camps
Remote Sens. 2019, 11(24), 3042; https://doi.org/10.3390/rs11243042 - 17 Dec 2019
Cited by 28 | Viewed by 4744
Abstract
Radio frequency interference (RFI) is a well-known problem in microwave radiometry (MWR). Any undesired signal overlapping the MWR protected frequency bands introduces a bias in the measurements, which can corrupt the retrieved geophysical parameters. This paper presents a literature review of RFI detection [...] Read more.
Radio frequency interference (RFI) is a well-known problem in microwave radiometry (MWR). Any undesired signal overlapping the MWR protected frequency bands introduces a bias in the measurements, which can corrupt the retrieved geophysical parameters. This paper presents a literature review of RFI detection and mitigation techniques for microwave radiometry from space. The reviewed techniques are divided between real aperture and aperture synthesis. A discussion and assessment of the application of RFI mitigation techniques is presented for each type of radiometer. Full article
(This article belongs to the Special Issue Radio Frequency Interference (RFI) in Microwave Remote Sensing)
Show Figures

Graphical abstract

21 pages, 5203 KiB  
Article
Mapping Grassland Frequency Using Decadal MODIS 250 m Time-Series: Towards a National Inventory of Semi-Natural Grasslands
by Laurence Hubert-Moy, Jeanne Thibault, Elodie Fabre, Clémence Rozo, Damien Arvor, Thomas Corpetti and Sébastien Rapinel
Remote Sens. 2019, 11(24), 3041; https://doi.org/10.3390/rs11243041 - 17 Dec 2019
Cited by 7 | Viewed by 3591
Abstract
Semi-natural grasslands are perennial ecosystems and an important part of agricultural landscapes that are threatened by urbanization and agricultural intensification. However, implementing national grassland conservation policies remains challenging because their inventory, based on short-term observation, rarely discriminate semi-natural permanent from temporary grasslands. This [...] Read more.
Semi-natural grasslands are perennial ecosystems and an important part of agricultural landscapes that are threatened by urbanization and agricultural intensification. However, implementing national grassland conservation policies remains challenging because their inventory, based on short-term observation, rarely discriminate semi-natural permanent from temporary grasslands. This study aims to map grassland frequency at a national scale over a long period using Moderate Resolution Imaging Spectroradiometer (MODIS) 250 m satellite time-series. A three-step method was applied to the entire area of metropolitan France (543,940 km²). First, land-use and land-cover maps—including grasslands—were produced for each year from 2006–2017 using the random forest classification of MOD13Q1 and MYD13Q1 products, which were calibrated and validated using field observations. Second, grassland frequency from 2006–2017 was calculated by combining the 12 annual maps. Third, sub-pixel analysis was performed using a reference layer with 20 m spatial resolution to quantify percentages of land-use and land-cover classes within MODIS pixels classified as grassland. Results indicate that grasslands were accurately modeled from 2006–2017 (F1-score 0.89–0.93). Nonetheless, modeling accuracy varied among biogeographical regions, with F1-score values that were very high for Continental (0.94 ± 0.01) and Atlantic (0.90 ± 0.02) regions, high for Alpine regions (0.86 ± 0.04) but moderate for Mediterranean regions (0.62 ± 0.10). The grassland frequency map for 2006–2017 at 250 m spatial resolution provides an unprecedented view of stable grassland patterns in agricultural areas compared to existing national and European GIS layers. Sub-pixel analysis showed that areas modeled as grasslands corresponded to grassland-dominant areas (60%–94%). This unique long-term and national monitoring of grasslands generates new opportunities for semi-natural grassland inventorying and agro-ecological management. Full article
(This article belongs to the Special Issue Advances of Remote Sensing in Pasture Management)
Show Figures

Graphical abstract

14 pages, 1068 KiB  
Technical Note
Imbalanced Learning in Land Cover Classification: Improving Minority Classes’ Prediction Accuracy Using the Geometric SMOTE Algorithm
by Georgios Douzas, Fernando Bacao, Joao Fonseca and Manvel Khudinyan
Remote Sens. 2019, 11(24), 3040; https://doi.org/10.3390/rs11243040 - 17 Dec 2019
Cited by 53 | Viewed by 5911
Abstract
The automatic production of land use/land cover maps continues to be a challenging problem, with important impacts on the ability to promote sustainability and good resource management. The ability to build robust automatic classifiers and produce accurate maps can have a significant impact [...] Read more.
The automatic production of land use/land cover maps continues to be a challenging problem, with important impacts on the ability to promote sustainability and good resource management. The ability to build robust automatic classifiers and produce accurate maps can have a significant impact on the way we manage and optimize natural resources. The difficulty in achieving these results comes from many different factors, such as data quality and uncertainty. In this paper, we address the imbalanced learning problem, a common and difficult conundrum in remote sensing that affects the quality of classification results, by proposing Geometric-SMOTE, a novel oversampling method, as a tool for addressing the imbalanced learning problem in remote sensing. Geometric-SMOTE is a sophisticated oversampling algorithm which increases the quality of the instances generated in previous methods, such as the synthetic minority oversampling technique. The performance of Geometric- SMOTE, in the LUCAS (Land Use/Cover Area Frame Survey) dataset, is compared to other oversamplers using a variety of classifiers. The results show that Geometric-SMOTE significantly outperforms all the other oversamplers and improves the robustness of the classifiers. These results indicate that, when using imbalanced datasets, remote sensing researchers should consider the use of these new generation oversamplers to increase the quality of the classification results. Full article
Show Figures

Graphical abstract

25 pages, 7504 KiB  
Article
Discovering Potential Settlement Areas around Archaeological Tells Using the Integration between Historic Topographic Maps, Optical, and Radar Data in the Northern Nile Delta, Egypt
by Abdelaziz Elfadaly, Mohamed A. R. Abouarab, Radwa R. M. El Shabrawy, Wael Mostafa, Penelope Wilson, Christophe Morhange, Jay Silverstein and Rosa Lasaponara
Remote Sens. 2019, 11(24), 3039; https://doi.org/10.3390/rs11243039 - 16 Dec 2019
Cited by 15 | Viewed by 5790
Abstract
The primary objective of this study is to leverage the integration of surface mapping data derived from optical, radar, and historic topographical studies with archaeological sampling to identify ancient settlement areas in the Northern Nile Delta, Egypt. This study employed the following methods: [...] Read more.
The primary objective of this study is to leverage the integration of surface mapping data derived from optical, radar, and historic topographical studies with archaeological sampling to identify ancient settlement areas in the Northern Nile Delta, Egypt. This study employed the following methods: digitization of topographic maps, band indices techniques on optical data, the creation of a 3D model from SRTM data, and Sentinel-1 interferometric wide swath (IW) analysis. This type of study is particularly relevant to the search for evidence of otherwise hidden ancient settlements. Due to its geographical situation and the fertility of the Nile, Egypt witnessed the autochthonous development of predynastic and dynastic civilizations, as well as an extensive history of external influences due to Greek, Roman, Coptic, Islamic, and Colonial-era interventions. Excavation work at Buto (Tell el-Fara’in) in 2017–18, carried out by the Kafrelsheikh University (KFS) in cooperation with the Ministry of Antiquities, demonstrated that remote sensing data offers considerable promise as a tool for developing regional settlement studies and excavation strategies. This study integrates the mission work in Buto with the satellite imagery in and around the area of the excavation. The results of the initial Buto area research serve as a methodological model to expand the study area to the North Delta with the goal of detecting the extent of the ancient kingdoms of Buto and Sakha. The results of this research include the creation of a composite historical database using ancient references and early topographical maps (1722, 1941, 1950, and 1997), Optical Corona (1965), Landsat MSS (Multispectral Scanner System) (1973, 1978, and 1988), TM (Thematic Mapper) (2005) data, and Radar SRTM (2014) and Sentinel1 (2018 and 2019) data. The data in this study have been analyzed using the ArcMap, Envi, and SNAP software. The results from the current investigation highlight the rapid changes in the land use/land cover in the last century in which many ancient sites were lost due to agriculture and urban development. Three potential settlement areas have been identified with the Sentinel1 Radar data, and have been integrated with the early maps. These discoveries will help develop excavation strategies aimed at elucidating the ancient settlement dynamics and history of the region during the next phase of research. Full article
Show Figures

Graphical abstract

23 pages, 9076 KiB  
Article
A Probability-Based Spectral Unmixing Analysis for Mapping Percentage Vegetation Cover of Arid and Semi-Arid Areas
by Yunlei Cui, Hua Sun, Guangxing Wang, Chengjie Li and Xiaoyu Xu
Remote Sens. 2019, 11(24), 3038; https://doi.org/10.3390/rs11243038 - 16 Dec 2019
Cited by 5 | Viewed by 2930
Abstract
China has been facing serious land degradation and desertification in its north and northwest arid and semi-arid areas. Monitoring the dynamics of percentage vegetation cover (PVC) using remote sensing imagery in these areas has become critical. However, because these areas are large, remote, [...] Read more.
China has been facing serious land degradation and desertification in its north and northwest arid and semi-arid areas. Monitoring the dynamics of percentage vegetation cover (PVC) using remote sensing imagery in these areas has become critical. However, because these areas are large, remote, and sparsely populated, and also because of the existence of mixed pixels, there have been no accurate and cost-effective methods available for this purpose. Spectral unmixing methods are a good alternative as they do not need field data and are low cost. However, traditional linear spectral unmixing (LSU) methods lack the ability to capture the characteristics of spectral reflectance and scattering from endmembers and their interactions within mixed pixels. Moreover, existing nonlinear spectral unmixing methods, such as random forest (RF) and radial basis function neural network (RBFNN), are often costly because they require field measurements of PVC from a large number of training samples. In this study, a cost-effective approach to mapping PVC in arid and semi-arid areas was proposed. A method for selection and purification of endmembers mainly based on Landsat imagery was first presented. A probability-based spectral unmixing analysis (PBSUA) and a probability-based optimized k nearest-neighbors (PBOkNN) approach were then developed to improve the mapping of PVC in Duolun County in Inner Mongolia, China, using Landsat 8 images and field data from 920 sample plots. The proposed PBSUA and PBOkNN methods were further validated in terms of accuracy and cost-effectiveness by comparison with two LSU methods, with and without purification of endmembers, and two nonlinear approaches, RF and RBFNN. The cost-effectiveness was defined as the reciprocal of cost timing relative root mean square error (RRMSE). The results showed that (1) Probability-based spectral unmixing analysis (PBSUA) was most cost-effective and increased the cost-effectiveness by 29.3% 29.3%, 33.5%, 50.8%, and 53.0% compared with two LSU methods, PBOkNN, RF, and RBFNN, respectively; (2) PBSUA, RF, and RBFNN gave RRMSE values of 22.9%, 21.8%, and 22.8%, respectively, which were not significantly different from each other at the significance level of 0.05. Compatibly, PBOkNN and LSU methods with and without purification of endmembers resulted in significantly greater RRMSE values of 27.5%, 32.4%, and 43.3%, respectively; (3) the average estimates of the sample plots and predicted maps from PBSUA, PBOkNN, RF, and RBFNN fell in the confidence interval of the test plot data, but those from two LSU methods did not, although the LSU with purification of endmembers improved the PVC estimation accuracy by 25.2% compared with the LSU without purification of endmembers. Thus, this study indicated that the proposed PBSUA had great potential for cost-effectively mapping PVC in arid and semi-arid areas. Full article
(This article belongs to the Section Forest Remote Sensing)
Show Figures

Graphical abstract

23 pages, 10631 KiB  
Article
Snow Depth Retrieval in Farmland Based on a Statistical Lookup Table from Passive Microwave Data in Northeast China
by Lingjia Gu, Xintong Fan, Xiaofeng Li and Yanlin Wei
Remote Sens. 2019, 11(24), 3037; https://doi.org/10.3390/rs11243037 - 16 Dec 2019
Cited by 7 | Viewed by 2728
Abstract
At present, passive microwave remote sensing is the most efficient method to estimate snow depth (SD) at global and regional scales. Farmland covers 46% of Northeast China and accurate SD retrieval throughout the whole snow season has great significance for the agriculture management [...] Read more.
At present, passive microwave remote sensing is the most efficient method to estimate snow depth (SD) at global and regional scales. Farmland covers 46% of Northeast China and accurate SD retrieval throughout the whole snow season has great significance for the agriculture management field. Based on the results of the statistical analysis of snow properties in Northeast China from December 2017 to January 2018, conducted by the China snow investigation project, snow characteristics such as snow grain size (SGS), snow density, snow thickness, and temperature of the layered snowpack were measured and analyzed in detail. These characteristics were input to the microwave emission model of layered snowpacks (MEMLS) to simulate the brightness temperature (TB) time series of snow-covered farmland in the periods of snow accumulation, stabilization, and ablation. Considering the larger SGS of the thick depth hoar layer that resulted in a rapid decrease of simulated TBs, effective SGS was proposed to minimize the simulation errors and ensure that the MEMLS can be correctly applied to satellite data simulation. Statistical lookup tables (LUTs) for MWRI and AMSR2 data were generated to represent the relationship between SD and the brightness temperature difference (TBD) at 18 and 36 GHz. The SD retrieval results based on the LUT were compared with the actual SD and the SD retrieved by Chang’s algorithm, Foster’s algorithm, the standard MWRI algorithm, and the standard AMSR2 algorithm. The results demonstrated that the proposed algorithm based on the statistical LUT achieved better accuracy than the other algorithms due to its incorporation of the variation in snow characteristics with the age of snow cover. The average root mean squared error of the SD for the whole snow season was approximately 3.97 and 4.22 cm for MWRI and AMSR2, respectively. The research results are beneficial for monitoring SD in the farmland of Northeast China. Full article
Show Figures

Graphical abstract

24 pages, 5711 KiB  
Article
Satellite Observations of Wind Wake and Associated Oceanic Thermal Responses: A Case Study of Hainan Island Wind Wake
by Jin Sha, Xiao-Ming Li, Xue’en Chen and Tianyu Zhang
Remote Sens. 2019, 11(24), 3036; https://doi.org/10.3390/rs11243036 - 16 Dec 2019
Cited by 3 | Viewed by 2877
Abstract
The wind wake on the lee side of Hainan Island in the winter covers the southwest entrance of Beibu Gulf (or Gulf of Tonkin) and is essential to regional ocean dynamics. Using multiple satellite observations including advanced synthetic aperture radar (ASAR), we revisited [...] Read more.
The wind wake on the lee side of Hainan Island in the winter covers the southwest entrance of Beibu Gulf (or Gulf of Tonkin) and is essential to regional ocean dynamics. Using multiple satellite observations including advanced synthetic aperture radar (ASAR), we revisited the wake process during the winter of 2011. Asymmetric oceanic thermal responses were found with a warm band expanding northwestwardly while a cold tongue formed to the southeast. Combining satellite observations, model simulations, and reanalysis data, heat advection terms (ADV) are reconstructed and compared to air-sea heat flux terms. The observed thermal evolution process across the wake footprint is closely related to the balanced spatial variability from the Ekman ADV, the barotropic geostrophic ADV, and the latent heat flux (LHF), which are all on the order of 10−5 K·m·s−1. Specifically, the Ekman ADV tends to heat the northwestern side of the wake and cool the southeastern side, while the geostrophic ADV compensates with the Ekman ADV across the wake footprint. This study reveals detailed oceanic responses associated with the wind wake and clarifies the contribution of ADV to the asymmetric spatial thermal variabilities. The identified role of heat advection on a sub-seasonal timescale may further benefit the understanding of regional oceanic dynamics. Full article
(This article belongs to the Special Issue Applications of Remote Sensing in Coastal Areas)
Show Figures

Figure 1

25 pages, 7277 KiB  
Article
Cloud Detection from FY-4A’s Geostationary Interferometric Infrared Sounder Using Machine Learning Approaches
by Qi Zhang, Yi Yu, Weimin Zhang, Tengling Luo and Xiang Wang
Remote Sens. 2019, 11(24), 3035; https://doi.org/10.3390/rs11243035 - 16 Dec 2019
Cited by 11 | Viewed by 3758
Abstract
FengYun-4A (FY-4A)’s Geostationary Interferometric Infrared Sounder (GIIRS) is the first hyperspectral infrared sounder on board a geostationary satellite, enabling the collection of infrared detection data with high temporal and spectral resolution. As clouds have complex spectral characteristics, and the retrieval of atmospheric profiles [...] Read more.
FengYun-4A (FY-4A)’s Geostationary Interferometric Infrared Sounder (GIIRS) is the first hyperspectral infrared sounder on board a geostationary satellite, enabling the collection of infrared detection data with high temporal and spectral resolution. As clouds have complex spectral characteristics, and the retrieval of atmospheric profiles incorporating clouds is a significant problem, it is often necessary to undertake cloud detection before further processing procedures for cloud pixels when infrared hyperspectral data is entered into assimilation system. In this study, we proposed machine-learning-based cloud detection models using two kinds of GIIRS channel observation sets (689 channels and 38 channels) as features. Due to differences in surface cover and meteorological elements between land and sea, we chose logistic regression (lr) model for the land and extremely randomized tree (et) model for the sea respectively. Six hundred and eighty-nine channels models produced slightly higher performance (Heidke skill score (HSS) of 0.780 and false alarm rate (FAR) of 16.6% on land, HSS of 0.945 and FAR of 4.7% at sea) than 38 channels models (HSSof 0.741 and FAR of 17.7% on land, HSS of 0.912 and FAR of 7.1% at sea). By comparing visualized cloud detection results with the Himawari-8 Advanced Himawari Imager (AHI) cloud images, the proposed method has a good ability to identify clouds under circumstances such as typhoons, snow covered land, and bright broken clouds. In addition, compared with the collocated Advanced Geosynchronous Radiation Imager (AGRI)-GIIRS cloud detection method, the machine learning cloud detection method has a significant advantage in time cost. This method is not effective for the detection of partially cloudy GIIRS’s field of views, and there are limitations in the scope of spatial application. Full article
(This article belongs to the Section Atmospheric Remote Sensing)
Show Figures

Graphical abstract

18 pages, 3815 KiB  
Article
A Cuboid Model for Assessing Surface Soil Moisture
by Xiufang Zhu, Yaozhong Pan, Junxia Wang and Ying Liu
Remote Sens. 2019, 11(24), 3034; https://doi.org/10.3390/rs11243034 - 16 Dec 2019
Cited by 4 | Viewed by 2899
Abstract
This study proposes a cuboid model for soil moisture assessment. In the model, the three edges were the meteorological, soil, and vegetation feature parameters highly related to soil moisture, and the edge lengths represented the degree of influence of each feature parameter on [...] Read more.
This study proposes a cuboid model for soil moisture assessment. In the model, the three edges were the meteorological, soil, and vegetation feature parameters highly related to soil moisture, and the edge lengths represented the degree of influence of each feature parameter on soil moisture. Soil moisture is assessed by the cuboid diagonal, which is referred to as the cuboid soil moisture index (CSMI) in this paper. The model was applied and validated in the Huang-Huai-Hai Plain. The results showed that (1) the difference in land surface temperature between day and night (ΔLST), land surface water index (LSWI), and accumulated precipitation (AP) were most closely correlated with soil moisture observation data in our study area, and were therefore selected as soil, crop, and meteorological system parameters to participate in CSMI calculations, respectively. (2) CSMI-1, with a cuboid length coefficient of 2/1/2, was the best model. The correlation of soil moisture derived from CSMI-1 with observed values was 0.64, 0.60, and 0.52 at depths of 10 cm, 20 cm, and 50 cm, respectively. (3) CSMI-1 had good applicability to the evaluation of soil moisture under different vegetation coverage. When the normalized difference vegetation index (NDVI)was 0–0.7, CSMI-1 was highly correlated with soil moisture at a significance level of 0.01. (4) The three-dimensional (3D) CSMI model can be easily converted to a two-dimensional (2D) model to adapt to different surface conditions (as long as the weight coefficient of one parameter is set to 0). Irrigation information (if available) can be considered as artificial recharge precipitation added in the AP to improve the accuracy of soil moisture inversion. This study provides a reference for soil moisture inversion using optical remote sensing images by integrating soil, vegetation, and meteorological feature parameters. Full article
Show Figures

Figure 1

19 pages, 6815 KiB  
Article
Influence of Tropical Cyclone Intensity and Size on Storm Surge in the Northern East China Sea
by Jian Li, Yijun Hou, Dongxue Mo, Qingrong Liu and Yuanzhi Zhang
Remote Sens. 2019, 11(24), 3033; https://doi.org/10.3390/rs11243033 - 16 Dec 2019
Cited by 14 | Viewed by 4910
Abstract
Typhoon storm surge research has always been very important and worthy of attention. Less is studied about the impact of tropical cyclone size (TC size) on storm surge, especially in semi-enclosed areas such as the northern East China Sea (NECS). Observational data for [...] Read more.
Typhoon storm surge research has always been very important and worthy of attention. Less is studied about the impact of tropical cyclone size (TC size) on storm surge, especially in semi-enclosed areas such as the northern East China Sea (NECS). Observational data for Typhoon Winnie (TY9711) and Typhoon Damrey (TY1210) from satellite and tide stations, as well as simulation results from a finite-volume coastal ocean model (FVCOM), were developed to study the effect of TC size on storm surge. Using the maximum wind speed (MXW) to represent the intensity of the tropical cyclone and seven-level wind circle range (R7) to represent the size of the tropical cyclone, an ideal simulation test was conducted. The results indicate that the highest storm surge occurs when the MXW is 40–45 m/s, that storm surge does not undergo significant change with the RWM except for the area near the center of typhoon and that the peak surge values are approximately a linear function of R7. Therefore, the TC size should be considered when estimating storm surge, particularly when predicting marine-economic effects and assessing the risk. Full article
(This article belongs to the Special Issue Remote Sensing of the Oceans: Blue Economy and Marine Pollution)
Show Figures

Graphical abstract

17 pages, 6042 KiB  
Article
Spaceborne EO and a Combination of Inverse and Forward Modelling for Monitoring Lava Flow Advance
by Nikola Rogic, Annalisa Cappello, Gaetana Ganci, Alessandro Maturilli, Hazel Rymer, Stephen Blake and Fabrizio Ferrucci
Remote Sens. 2019, 11(24), 3032; https://doi.org/10.3390/rs11243032 - 16 Dec 2019
Cited by 8 | Viewed by 2893
Abstract
We aim here to improve the understanding of the relationship between emissivity of the lava and temperature by carrying out a multi-stage experiment for the 2017 Mt Etna (Italy) eruption. We combine laboratory, spaceborne, and numerical modelling data, to quantify the emissivity–temperature relationship. [...] Read more.
We aim here to improve the understanding of the relationship between emissivity of the lava and temperature by carrying out a multi-stage experiment for the 2017 Mt Etna (Italy) eruption. We combine laboratory, spaceborne, and numerical modelling data, to quantify the emissivity–temperature relationship. Our laboratory-based Fourier-transform infrared (FTIR) results indicate that emissivity and temperature are inversely correlated, which supports the argument that emissivity of molten material is significantly lower than that of the same material in its solid state. Our forward-modelling tests using MAGFLOW Cellular Automata suggest that a 35% emissivity variation (0.95 to 0.60) can produce up to 46% overestimation (for constant emissivity 0.60) in simulated/forecasted lava flow lengths (compared to actual observed). In comparison, our simulation using a ‘two-component’ emissivity approach (i.e., different emissivity values for melt and cooled lava) and constant emissivity 0.95 compares well (≤10% overestimation) with the actual 2017 lava flow lengths. We evaluated the influence of variable emissivity on lava surface temperatures using spaceborne data by performing several parametrically controlled assessments, using both constant (‘uniform’) and a ‘two-component’ emissivity approach. Computed total radiant fluxes, using the same spaceborne scene (Landsat 8 Operational Land Imager (OLI)), differ ≤15% depending on emissivity endmembers (i.e., 0.95 and 0.60). These results further suggest that computed radiant flux using high-spatial resolution data is bordering at lower boundary (range) values of the moderate-to-high temporal resolution spaceborne data (i.e., Moderate Resolution Imaging Spectroradiometer (MODIS) and Spinning Enhanced Visible and Infrared Imager (SEVIRI)), acquired for the same target area (and the same time interval). These findings may have considerable impact on civil protection decisions made during volcanic crisis involving lava flows as they approach protected or populated areas. Nonetheless, the laboratory work, reported here, should be extended to include higher volcanic eruptive temperatures (up to 1350 K). Full article
Show Figures

Graphical abstract

17 pages, 5656 KiB  
Article
Wildfire Detection Probability of MODIS Fire Products under the Constraint of Environmental Factors: A Study Based on Confirmed Ground Wildfire Records
by Lingxiao Ying, Zehao Shen, Mingzheng Yang and Shilong Piao
Remote Sens. 2019, 11(24), 3031; https://doi.org/10.3390/rs11243031 - 16 Dec 2019
Cited by 36 | Viewed by 6510
Abstract
The Moderate Resolution Imaging Spectroradiometer (MODIS) has been widely used for wildfire occurrence and distribution detecting and fire risk assessments. Compared with its commission error, the omission error of MODIS wildfire detection has been revealed as a much more challenging, unsolved issue, and [...] Read more.
The Moderate Resolution Imaging Spectroradiometer (MODIS) has been widely used for wildfire occurrence and distribution detecting and fire risk assessments. Compared with its commission error, the omission error of MODIS wildfire detection has been revealed as a much more challenging, unsolved issue, and ground-level environmental factors influencing the detection capacity are also variable. This study compared the multiple MODIS fire products and the records of ground wildfire investigations during December 2002–November 2015 in Yunnan Province, Southwest China, in an attempt to reveal the difference in the spatiotemporal patterns of regional wildfire detected by the two approaches, to estimate the omission error of MODIS fire products based on confirmed ground wildfire records, and to explore how instantaneous and local environmental factors influenced the wildfire detection probability of MODIS. The results indicated that across the province, the total number of wildfire events recorded by MODIS was at least twice as many as that in the ground records, while the wildfire distribution patterns revealed by the two approaches were inconsistent. For the 5145 confirmed ground records, however, only 11.10% of them could be detected using multiple MODIS fire products (i.e., MOD14A1, MYD14A1, and MCD64A1). Opposing trends during the studied period were found between the yearly occurrence of ground-based wildfire records and the corresponding proportion detected by MODIS. Moreover, the wildfire detection proportion by MODIS was 11.36% in forest, 9.58% in shrubs, and 5.56% in grassland, respectively. Random forest modeling suggested that fire size was a primary limiting factor for MODIS fire detecting capacity, where a small fire size could likely result in MODIS omission errors at a threshold of 1 ha, while MODIS had a 50% probability of detecting a wildfire whose size was at least 18 ha. Aside from fire size, the wildfire detection probability of MODIS was also markedly influenced by weather factors, especially the daily relative humidity and the daily wind speed, and the altitude of wildfire occurrence. Considering the environmental factors’ contribution to the omission error in MODIS wildfire detection, we emphasized the importance of attention to the local conditions as well as ground inspection in practical wildfire monitoring and management and global wildfire simulations. Full article
(This article belongs to the Section Environmental Remote Sensing)
Show Figures

Figure 1

18 pages, 3571 KiB  
Article
Remote-Sensing Monitoring of Grassland Degradation Based on the GDI in Shangri-La, China
by Yanlin Yang, Jinliang Wang, Yun Chen, Feng Cheng, Guangjie Liu and Zenghong He
Remote Sens. 2019, 11(24), 3030; https://doi.org/10.3390/rs11243030 - 16 Dec 2019
Cited by 20 | Viewed by 3630
Abstract
Grassland resources are important land resources. However, grassland degradation has become evident in recent years, which has reduced the function of soil and water conservation and restricted the development of animal husbandry. Timely and accurate monitoring of grassland changes and understanding the degree [...] Read more.
Grassland resources are important land resources. However, grassland degradation has become evident in recent years, which has reduced the function of soil and water conservation and restricted the development of animal husbandry. Timely and accurate monitoring of grassland changes and understanding the degree of degradation are the foundation for the scientific use of grasslands. The grassland degradation index of ground comprehensive evaluation (grassland degradation index, GDIg) is a digital expression of grassland growth that can accurately indicate the degradation of grasslands. In this research, the accuracy of GDIg in evaluating grassland degradation is discussed; the typical areas of grassland degradation in Shangri-La City, i.e., the towns of Jiantang and Xiaozhongdian, are selected as the research area. Through a field survey and spectroscopy combined with Huanjing-1 (HJ-1) satellite image data, grassland degradation was monitored in the study area from 2008 to 2017. The results show that: (1) GDIg based on six indicators, namely, above-ground biomass, cover level, height, biomass of edible herbage, biomass of toxic weeds, and species richness, can effectively indicate grassland degradation, with the accuracy of the degradation grade assessment reaching 98.6%. (2) The correlation between the GDIg and the grey values of 4 wavebands and 7 types of vegetation indexes derived from the HJ-1 is analysed, and the degraded grassland inversion model was built and revised based on HJ-1 data. The grassland degradation evaluation index of remote sensing (GDIrs) model indicates that grassland degradation is proportional to the ratio vegetation index (RVI). (3) The grassland area was 405.40 km2 in the initial monitoring period, accounting for 17.26% of the study area, while at the end of the monitoring period, the area was 338.87 km2, with a loss of 66.53 km2. From 2008 to 2017, the area of non-degraded and slightly degraded grassland in the study area presented a downward trend, with decreases of 59.87 km2 and 49.93 km2, respectively. In contrast, the area of moderately degraded grassland increased by 41.17 km2 from 91.58 km2 in 2008 to 132.74 km2 in 2017, accounting for 39.17% of the grassland. The area of severely degraded grassland was 78.32 km2, accounting for 23.11% of the grassland in 2017. (4) The degraded grasslands in the study area mainly transformed into the degradation-enhanced (deterioration) type. As the transformation rate gradually slows down, the current situation of grassland degradation is not hopeful. Full article
Show Figures

Graphical abstract

20 pages, 12645 KiB  
Article
Crustal Deformation of Northeastern China Following the 2011 Mw 9.0 Tohoku, Japan Earthquake Estimated from GPS Observations: Strain Heterogeneity and Seismicity
by Guojie Meng, Xiaoning Su, Weiwei Wu, Shestakov Nikolay, Hiroaki Takahashi, Mako Ohzono and Mikhail Gerasimenko
Remote Sens. 2019, 11(24), 3029; https://doi.org/10.3390/rs11243029 - 16 Dec 2019
Cited by 9 | Viewed by 2987
Abstract
Using global positioning system (GPS) observations of northeastern China and the southeast of the Russian Far East over the period 2012–2017, we derived an ITRF2014-referenced velocity field by fitting GPS time series with a functional model incorporating yearly and semiannual signals, linear trends, [...] Read more.
Using global positioning system (GPS) observations of northeastern China and the southeast of the Russian Far East over the period 2012–2017, we derived an ITRF2014-referenced velocity field by fitting GPS time series with a functional model incorporating yearly and semiannual signals, linear trends, and offsets. We subsequently rotated the velocity field into a Eurasia-fixed velocity field and analyzed its spatial characteristics. Taking an improved multiscale spherical wavelet algorithm, we computed strain rate tensors and analyzed their spatial distribution at multiple scales. The derived Eurasia-referenced velocity field shows that northeastern China generally moved southeastward. Extensional deformation was identified at the Yilan–Yitong Fault (YYF) and the Dunhua–Mishan Fault (DMF), with negligible strike–slip rates. The principal strain rates were characterized by NE–SW compression and NW–SE extension. The dilation rates show compressional deformation in the southern segment of the YYF, northern end of the Nenjiang Fault (NJF), and southeast of the Russian Far East. We also investigated the impact of the 2011 Tohoku Mw 9.0 earthquake on the crustal deformation of northeastern China, generated by its post-seismic viscoelastic relaxation. The velocities generated by the post-seismic viscoelastic relaxation of the giant earthquake are generally orientated southeast, with magnitudes inversely proportional with the epicentral distances. The principal strain rates caused by the viscoelastic relaxation were also characterized by NW–SE stretching and NE–SW compression. The dilation rates show that compressional deformation appeared in the southern segment of the DMF and the YYF and southeast of the Russian Far East. Significant maximum shear rates were identified around the southern borderland between northeastern China and the southeast of the Russian Far East. Finally, we compared the multiple strain rates and the seismicity of northeastern China after the 2011 Tohoku earthquake. Our finding shows that the ML ≥ 4.0 earthquakes were mostly concentrated around the zones of high areal strain rates and shear rates at scales of 4 and 5, in particular, at the DMF and YYF fault zones. Full article
(This article belongs to the Special Issue Global Navigation Satellite Systems for Earth Observing System)
Show Figures

Graphical abstract

21 pages, 7014 KiB  
Article
Hyperspectral Anomaly Detection with Harmonic Analysis and Low-Rank Decomposition
by Pei Xiang, Jiangluqi Song, Huan Li, Lin Gu and Huixin Zhou
Remote Sens. 2019, 11(24), 3028; https://doi.org/10.3390/rs11243028 - 16 Dec 2019
Cited by 8 | Viewed by 2715
Abstract
Hyperspectral anomaly detection methods are often limited by the effects of redundant information and isolated noise. Here, a novel hyperspectral anomaly detection method based on harmonic analysis (HA) and low rank decomposition is proposed. This paper introduces three main innovations: first and foremost, [...] Read more.
Hyperspectral anomaly detection methods are often limited by the effects of redundant information and isolated noise. Here, a novel hyperspectral anomaly detection method based on harmonic analysis (HA) and low rank decomposition is proposed. This paper introduces three main innovations: first and foremost, in order to extract low-order harmonic images, a single-pixel-related HA was introduced to reduce dimension and remove redundant information in the original hyperspectral image (HSI). Additionally, adopting the guided filtering (GF) and differential operation, a novel background dictionary construction method was proposed to acquire the initial smoothed images suppressing some isolated noise, while simultaneously constructing a discriminative background dictionary. Last but not least, the original HSI was replaced by the initial smoothed images for a low-rank decomposition via the background dictionary. This operation took advantage of the low-rank attribute of background and the sparse attribute of anomaly. We could finally get the anomaly objectives through the sparse matrix calculated from the low-rank decomposition. The experiments compared the detection performance of the proposed method and seven state-of-the-art methods in a synthetic HSI and two real-world HSIs. Besides qualitative assessment, we also plotted the receiver operating characteristic (ROC) curve of each method and report the respective area under the curve (AUC) for quantitative comparison. Compared with the alternative methods, the experimental results illustrated the superior performance and satisfactory results of the proposed method in terms of visual characteristics, ROC curves and AUC values. Full article
Show Figures

Graphical abstract

21 pages, 3193 KiB  
Article
Quantifying Coral Reef Composition of Recreational Diving Sites: A Structure from Motion Approach at Seascape Scale
by Marco Palma, Chiara Magliozzi, Monica Rivas Casado, Ubaldo Pantaleo, João Fernandes, Gianpaolo Coro, Carlo Cerrano and Paul Leinster
Remote Sens. 2019, 11(24), 3027; https://doi.org/10.3390/rs11243027 - 16 Dec 2019
Cited by 12 | Viewed by 4451
Abstract
Recreational diving is known to have both direct and indirect impacts on coral habitats. Direct impacts include increasing sedimentation, breaks and diseases that lead to a decrease in the richness and abundances of hard corals. Indirect impacts include urban development, land management and [...] Read more.
Recreational diving is known to have both direct and indirect impacts on coral habitats. Direct impacts include increasing sedimentation, breaks and diseases that lead to a decrease in the richness and abundances of hard corals. Indirect impacts include urban development, land management and sewage disposal. The ecological effects of scuba diving on the spatial composition metrics of reef benthic communities are less well studied, and they have not been investigated at seascape scale. In this study, we combine orthomosaics derived from Structure from Motion (SfM) photogrammetry and data-mining techniques to study the spatial composition of reef benthic communities of recreational diving sites at seascape scale (>25 m 2 ). The study focuses on the case study area of Ponta do Ouro Partial Marine Reserve (Mozambique). Results showed that scuba-diving resistant taxa (i.e., sponges and algae) were abundant at small (>850 m 2 ) and highly dived sites (>3000 dives yr 1 ), characterized by low diversity and density, and big organisms with complex shapes. Fragile taxa (i.e., Acropora spp.) were abundant at low (365 dives yr 1 ) and moderately dived sites (1000–3000 dives yr 1 ) where the greater depth and wider coral reef surfaces attenuate the abrasive effect of waves and re-suspended sediments. Highest taxa diversity and density, and lowest abundance of resistant taxa were recorded at large (>2000 m 2 ) and rarely dived sites. This study highlights the potential applications for a photogrammetric approach to support monitoring programs at Ponta do Ouro Partial Marine Reserve (Mozambique), and provides some insight to understand the influence of scuba diving on benthic communities. Full article
Show Figures

Graphical abstract

Previous Issue
Back to TopTop