Next Issue
Volume 11, December-2
Previous Issue
Volume 11, November-2
 
 
remotesensing-logo

Journal Browser

Journal Browser

Remote Sens., Volume 11, Issue 23 (December-1 2019) – 164 articles

Cover Story (view full-size image): 
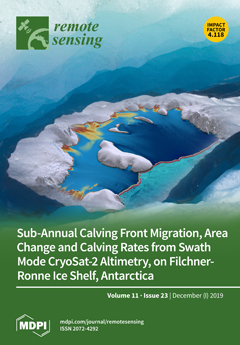
The figure shows an elevation model of the Filchner–Ronne Ice Shelf in Antarctica derived from CryoSat-2 swath altimetry data acquired in 2018. The color coding indicates the surface elevation scaled from 0 to 200 m. The calving front location (CFL) marks the seaward limit of the shelf and is indicated by a series of lines illustrating the gradual advance of the ice shelf in the period 2011–2018 with a 6-month sampling. Mapping the time variable CFL of Antarctic ice shelves is important for estimating the freshwater budget or as a precursor of dynamic instability. Wuite et al. have developed a novel approach for deriving regular and consistent CFLs based on edge detection and vectorization of the sharp ice edge in gridded elevation data, representing a valuable new application for the CryoSat-2 mission that has not been previously exploited.View this paper.
  • Issues are regarded as officially published after their release is announced to the table of contents alert mailing list.
  • You may sign up for e-mail alerts to receive table of contents of newly released issues.
  • PDF is the official format for papers published in both, html and pdf forms. To view the papers in pdf format, click on the "PDF Full-text" link, and use the free Adobe Reader to open them.
Order results
Result details
Section
Select all
Export citation of selected articles as:
16 pages, 3486 KiB  
Article
Comparison of Lake Optical Water Types Derived from Sentinel-2 and Sentinel-3
by Tuuli Soomets, Kristi Uudeberg, Dainis Jakovels, Matiss Zagars, Anu Reinart, Agris Brauns and Tiit Kutser
Remote Sens. 2019, 11(23), 2883; https://doi.org/10.3390/rs11232883 - 03 Dec 2019
Cited by 18 | Viewed by 4644
Abstract
Inland waters play a critical role in our drinking water supply. Additionally, they are important providers of food and recreation possibilities. Inland waters are known to be optically complex and more diverse than marine or ocean waters. The optical properties of natural waters [...] Read more.
Inland waters play a critical role in our drinking water supply. Additionally, they are important providers of food and recreation possibilities. Inland waters are known to be optically complex and more diverse than marine or ocean waters. The optical properties of natural waters are influenced by three different and independent sources: phytoplankton, suspended matter, and colored dissolved organic matter. Thus, the remote sensing of these waters is more challenging. Different types of waters need different approaches to obtain correct water quality products; therefore, the first step in remote sensing of lakes should be the classification of the water types. The classification of optical water types (OWTs) is based on the differences in the reflectance spectra of the lake water. This classification groups lake and coastal waters into five optical classes: Clear, Moderate, Turbid, Very Turbid, and Brown. We studied the OWTs in three different Latvian lakes: Burtnieks, Lubans, and Razna, and in a large Estonian lake, Lake Võrtsjärv. The primary goal of this study was a comparison of two different Copernicus optical instrument data for optical classification in lakes: Ocean and Land Color Instrument (OLCI) on Sentinel-3 and Multispectral Instrument (MSI) on Sentinel-2. We found that both satellite OWT classifications in lakes were comparable (R2 = 0.74). We were also able to study the spatial and temporal changes in the OWTs of the study lakes during 2017. The comparison between two satellites was carried out to understand if the classification of the OWTs with both satellites is compatible. Our results could give us not only a better overview of the changes in the lake water by studying the temporal and spatial variability of the OWTs, but also possibly better retrieval of Level 2 satellite products when using OWT guided approach. Full article
Show Figures

Graphical abstract

18 pages, 8103 KiB  
Article
Synthetic Aperture Radar Remote Sensing of Operational Platform Produced Water Releases
by Stine Skrunes, A. Malin Johansson and Camilla Brekke
Remote Sens. 2019, 11(23), 2882; https://doi.org/10.3390/rs11232882 - 03 Dec 2019
Cited by 13 | Viewed by 3626
Abstract
Oil spill detection services based on satellite synthetic aperture radar (SAR) frequently detect oil slicks close to platforms due to legal releases of produced water. Separating these slicks from larger releases, e.g., due to accidental leakage is challenging. The aim of this work [...] Read more.
Oil spill detection services based on satellite synthetic aperture radar (SAR) frequently detect oil slicks close to platforms due to legal releases of produced water. Separating these slicks from larger releases, e.g., due to accidental leakage is challenging. The aim of this work is to investigate the SAR characteristics of produced water, including the typical appearance in HH/VV data, possible variations with oil volume, and limitations on detectability. The study is based on dual-polarization TerraSAR-X data collected with constant imaging geometry over one platform in the North Sea. Despite the low oil content (volume percentage of 0.001%–0.002% in this data set), produced water is clearly detectable, with median damping ratios around 3–9 dB. Produced water is detected here in wind speeds of 2–12 m/s, with reduced detectability above ca 9 m/s. Hourly average release volumes with an oil component as low as 0.003 m 3 are detected. The damping ratio, polarization difference, and co-polarization power ratio are investigated and show no clear correlation with released oil volume. However, some indications of trends such as increasing signal damping with oil volume should be further investigated when data over larger release volumes are available. When comparing the properties of the entire slick with the most recently released part, similar or slightly higher damping ratios were found in the full slick case. Full article
(This article belongs to the Special Issue She Maps)
Show Figures

Graphical abstract

18 pages, 8924 KiB  
Article
Next Generation Mapping: Combining Deep Learning, Cloud Computing, and Big Remote Sensing Data
by Leandro Parente, Evandro Taquary, Ana Paula Silva, Carlos Souza and Laerte Ferreira
Remote Sens. 2019, 11(23), 2881; https://doi.org/10.3390/rs11232881 - 03 Dec 2019
Cited by 45 | Viewed by 10149
Abstract
The rapid growth of satellites orbiting the planet is generating massive amounts of data for Earth science applications. Concurrently, state-of-the-art deep-learning-based algorithms and cloud computing infrastructure have become available with a great potential to revolutionize the image processing of satellite remote sensing. Within [...] Read more.
The rapid growth of satellites orbiting the planet is generating massive amounts of data for Earth science applications. Concurrently, state-of-the-art deep-learning-based algorithms and cloud computing infrastructure have become available with a great potential to revolutionize the image processing of satellite remote sensing. Within this context, this study evaluated, based on thousands of PlanetScope images obtained over a 12-month period, the performance of three machine learning approaches (random forest, long short-term memory-LSTM, and U-Net). We applied these approaches to mapped pasturelands in a Central Brazil region. The deep learning algorithms were implemented using TensorFlow, while the random forest utilized the Google Earth Engine platform. The accuracy assessment presented F1 scores for U-Net, LSTM, and random forest of, respectively, 96.94%, 98.83%, and 95.53% in the validation data, and 94.06%, 87.97%, and 82.57% in the test data, indicating a better classification efficiency using the deep learning approaches. Although the use of deep learning algorithms depends on a high investment in calibration samples and the generalization of these methods requires further investigations, our results suggest that the neural network architectures developed in this study can be used to map large geographic regions that consider a wide variety of satellite data (e.g., PlanetScope, Sentinel-2, Landsat-8). Full article
Show Figures

Graphical abstract

18 pages, 6208 KiB  
Letter
The Influence of Vegetation Characteristics on Individual Tree Segmentation Methods with Airborne LiDAR Data
by Qiuli Yang, Yanjun Su, Shichao Jin, Maggi Kelly, Tianyu Hu, Qin Ma, Yumei Li, Shilin Song, Jing Zhang, Guangcai Xu, Jianxin Wei and Qinghua Guo
Remote Sens. 2019, 11(23), 2880; https://doi.org/10.3390/rs11232880 - 03 Dec 2019
Cited by 40 | Viewed by 5980
Abstract
This study investigated the effects of forest type, leaf area index (LAI), canopy cover (CC), tree density (TD), and the coefficient of variation of tree height (CVTH) on the accuracy of different individual tree segmentation methods (i.e., canopy height model, pit-free canopy height [...] Read more.
This study investigated the effects of forest type, leaf area index (LAI), canopy cover (CC), tree density (TD), and the coefficient of variation of tree height (CVTH) on the accuracy of different individual tree segmentation methods (i.e., canopy height model, pit-free canopy height model (PFCHM), point cloud, and layer stacking seed point) with LiDAR data. A total of 120 sites in the Sierra Nevada Forest (California) and Shavers Creek Watershed (Pennsylvania) of the United States, covering various vegetation types and characteristics, were used to analyze the performance of the four selected individual tree segmentation algorithms. The results showed that the PFCHM performed best in all forest types, especially in conifer forests. The main forest characteristics influencing segmentation methods were LAI and CC, LAI and TD, and CVTH in conifer, broadleaf, and mixed forests, respectively. Most of the vegetation characteristics (i.e., LAI, CC, and TD) negatively correlated with all segmentation methods, while the effect of CVTH varied with forest type. These results can help guide the selection of individual tree segmentation method given the influence of vegetation characteristics. Full article
(This article belongs to the Special Issue Trends in UAV Remote Sensing Applications)
Show Figures

Graphical abstract

22 pages, 12078 KiB  
Article
The July/August 2019 Lava Flows at the Sciara del Fuoco, Stromboli–Analysis from Multi-Sensor Infrared Satellite Imagery
by Simon Plank, Francesco Marchese, Carolina Filizzola, Nicola Pergola, Marco Neri, Michael Nolde and Sandro Martinis
Remote Sens. 2019, 11(23), 2879; https://doi.org/10.3390/rs11232879 - 03 Dec 2019
Cited by 29 | Viewed by 3878
Abstract
On 3 July 2019 a rapid sequence of paroxysmal explosions at the summit craters of Stromboli (Aeolian-Islands, Italy) occurred, followed by a period of intense Strombolian and effusive activity in July, and continuing until the end of August 2019. We present a joint [...] Read more.
On 3 July 2019 a rapid sequence of paroxysmal explosions at the summit craters of Stromboli (Aeolian-Islands, Italy) occurred, followed by a period of intense Strombolian and effusive activity in July, and continuing until the end of August 2019. We present a joint analysis of multi-sensor infrared satellite imagery to investigate this eruption episode. Data from the Spinning-Enhanced-Visible-and-InfraRed-Imager (SEVIRI) was used in combination with those from the Multispectral-Instrument (MSI), the Operational-Land-Imager (OLI), the Advanced-Very High-Resolution-Radiometer (AVHRR), and the Visible-Infrared-Imaging-Radiometer-Suite (VIIRS). The analysis of infrared SEVIRI-data allowed us to detect eruption onset and to investigate short-term variations of thermal volcanic activity, providing information in agreement with that inferred by nighttime-AVHRR-observations. By using Sentinel-2-MSI and Landsat-8-OLI imagery, we better localized the active lava-flows. The latter were quantitatively characterized using infrared VIIRS-data, estimating an erupted lava volume of 6.33 × 10 6 ± 3.17 × 10 6 m3 and a mean output rate of 1.26 ± 0.63 m3/s for the July/August 2019 eruption period. The estimated mean-output-rate was higher than the ones in the 2002–2003 and 2014 Stromboli effusive eruptions, but was lower than in the 2007-eruption. These results confirmed that a multi-sensor-approach might provide a relevant contribution to investigate, monitor and characterize thermal volcanic activity in high-risk areas. Full article
(This article belongs to the Special Issue Satellite Remote Sensing of High-Temperature Thermal Anomalies)
Show Figures

Graphical abstract

25 pages, 8869 KiB  
Article
An Object-Based Markov Random Field Model with Anisotropic Penalty for Semantic Segmentation of High Spatial Resolution Remote Sensing Imagery
by Chen Zheng, Xinxin Pan, Xiaohui Chen, Xiaohui Yang, Xin Xin and Limin Su
Remote Sens. 2019, 11(23), 2878; https://doi.org/10.3390/rs11232878 - 03 Dec 2019
Cited by 5 | Viewed by 3752
Abstract
The Markov random field model (MRF) has attracted a lot of attention in the field of remote sensing semantic segmentation. But, most MRF-based methods fail to capture the various interactions between different land classes by using the isotropic potential function. In order to [...] Read more.
The Markov random field model (MRF) has attracted a lot of attention in the field of remote sensing semantic segmentation. But, most MRF-based methods fail to capture the various interactions between different land classes by using the isotropic potential function. In order to solve such a problem, this paper proposed a new generalized probability inference with an anisotropic penalty for the object-based MRF model (OMRF-AP) that can distinguish the differences in the interactions between any two land classes. Specifically, an anisotropic penalty matrix was first developed to describe the relationships between different classes. Then, an expected value of the penalty information (EVPI) was developed in this inference criterion to integrate the anisotropic class-interaction information and the posteriori distribution information of the OMRF model. Finally, by iteratively updating the EVPI terms of different classes, segmentation results could be achieved when the iteration converged. Experiments of texture images and different remote sensing images demonstrated that our method could show a better performance than other state-of-the-art MRF-based methods, and a post-processing scheme of the OMRF-AP model was also discussed in the experiments. Full article
Show Figures

Graphical abstract

19 pages, 4352 KiB  
Article
Use of A Neural Network-Based Ocean Body Radiative Transfer Model for Aerosol Retrievals from Multi-Angle Polarimetric Measurements
by Cheng Fan, Guangliang Fu, Antonio Di Noia, Martijn Smit, Jeroen H.H. Rietjens, Richard A. Ferrare, Sharon Burton, Zhengqiang Li and Otto P. Hasekamp
Remote Sens. 2019, 11(23), 2877; https://doi.org/10.3390/rs11232877 - 03 Dec 2019
Cited by 21 | Viewed by 4121
Abstract
For aerosol retrieval from multi-angle polarimetric (MAP) measurements over the ocean it is important to accurately account for the contribution of the ocean-body to the top-of-atmosphere signal, especially for wavelengths <500 nm. Performing online radiative transfer calculations in the coupled atmosphere ocean system [...] Read more.
For aerosol retrieval from multi-angle polarimetric (MAP) measurements over the ocean it is important to accurately account for the contribution of the ocean-body to the top-of-atmosphere signal, especially for wavelengths <500 nm. Performing online radiative transfer calculations in the coupled atmosphere ocean system is too time consuming for operational retrieval algorithms. Therefore, mostly lookup-tables of the ocean body reflection matrix are used to represent the lower boundary in an atmospheric radiative transfer model. For hyperspectral measurements such as those from Spectro-Polarimeter for Planetary Exploration (SPEXone) on the NASA Plankton, Aerosol, Cloud and ocean Ecosystem (PACE) mission, also the use of look-up tables is unfeasible because they will become too big. In this paper, we propose a new method for aerosol retrieval over ocean from MAP measurements using a neural network (NN) to model the ocean body reflection matrix. We apply the NN approach to synthetic SPEXone measurements and also to real data collected by SPEX airborne during the Aerosol Characterization from Polarimeter and Lidar (ACEPOL) campaign. We conclude that the NN approach is well capable for aerosol retrievals over ocean, introducing no significant error on the retrieved aerosol properties Full article
(This article belongs to the Special Issue Advances of Remote Sensing Inversion)
Show Figures

Graphical abstract

25 pages, 11219 KiB  
Article
A Multi-Channel Algorithm for Mapping Volcanic Thermal Anomalies by Means of Sentinel-2 MSI and Landsat-8 OLI Data
by Francesco Marchese, Nicola Genzano, Marco Neri, Alfredo Falconieri, Giuseppe Mazzeo and Nicola Pergola
Remote Sens. 2019, 11(23), 2876; https://doi.org/10.3390/rs11232876 - 03 Dec 2019
Cited by 44 | Viewed by 7810
Abstract
The Multispectral Instrument (MSI) and the Operational Land Imager (OLI), respectively onboard Sentinel-2A/2B and Landsat 8 satellites, thanks to their features especially in terms of spatial/spectral resolution, represents two important instruments for investigating thermal volcanic activity from space. In this study, we used [...] Read more.
The Multispectral Instrument (MSI) and the Operational Land Imager (OLI), respectively onboard Sentinel-2A/2B and Landsat 8 satellites, thanks to their features especially in terms of spatial/spectral resolution, represents two important instruments for investigating thermal volcanic activity from space. In this study, we used data from those sensors to test an original multichannel algorithm, which aims at mapping volcanic thermal anomalies at a global scale. The algorithm, named Normalized Hotspot Indices (NHI), combines two normalized indices, analyzing near infrared (NIR) and short wave infrared (SWIR) radiances, to identify hotspot pixels in daylight conditions. Results, achieved studying a number of active volcanoes located in different geographic areas and characterized by a different eruptive behavior, demonstrated the NHI capacity in mapping both subtle and more intense volcanic thermal anomalies despite some limitations (e.g., missed detections because of clouds/volcanic plumes). In addition, the study shows that the performance of NHI might be further increased using some additional spectral/spatial tests, in view of a possible usage of this algorithm within a known multi-temporal scheme of satellite data analysis. The low processing times and the straight forth exportability to data from other sensors make NHI, which is sensitive even to other high temperature sources, suited for mapping hot volcanic targets integrating information provided by current and well-established satellite-based volcanoes monitoring systems. Full article
Show Figures

Graphical abstract

20 pages, 3022 KiB  
Article
Long-Term Change of the Secchi Disk Depth in Lake Maninjau, Indonesia Shown by Landsat TM and ETM+ Data
by Fajar Setiawan, Bunkei Matsushita, Rossi Hamzah, Dalin Jiang and Takehiko Fukushima
Remote Sens. 2019, 11(23), 2875; https://doi.org/10.3390/rs11232875 - 03 Dec 2019
Cited by 22 | Viewed by 3928
Abstract
Most of the lakes in Indonesia are facing environmental problems such as eutrophication, sedimentation, and depletion of dissolved oxygen. The water quality data for supporting lake management in Indonesia are very limited due to financial constraints. To address this issue, satellite data are [...] Read more.
Most of the lakes in Indonesia are facing environmental problems such as eutrophication, sedimentation, and depletion of dissolved oxygen. The water quality data for supporting lake management in Indonesia are very limited due to financial constraints. To address this issue, satellite data are often used to retrieve water quality data. Here, we developed an empirical model for estimating the Secchi disk depth (SD) from Landsat TM/ETM+ data by using data collected from nine Indonesian lakes/reservoirs (SD values 0.5–18.6 m). We made two efforts to improve the robustness of the developed model. First, we carried out an image preprocessing series of steps (i.e., removing contaminated water pixels, filtering images, and mitigating atmospheric effects) before the Landsat data were used. Second, we selected two band ratios (blue/green and red/green) as SD predictors; these differ from previous studies’ recommendation. The validation results demonstrated that the developed model can retrieve SD values with an R2 of 0.60 and the root mean square error of 1.01 m in Lake Maninjau, Indonesia (SD values ranged from 0.5 to 5.8 m, n = 74). We then applied the developed model to 230 scenes of preprocessed Landsat TM/ETM+ images to generate a long-term SD database for Lake Maninjau during 1987–2018. The visual comparison of the in situ-measured and satellite estimated SD values, as well as several events (e.g., algal bloom, water gate open, and fish culture), showed that the Landsat-based SD estimations well captured the change tendency of water transparency in Lake Maninjau, and these estimations will thus provide useful data for lake managers and policy-makers. Full article
(This article belongs to the Section Environmental Remote Sensing)
Show Figures

Graphical abstract

12 pages, 1477 KiB  
Letter
Quantification of Soil Organic Carbon in Biochar-Amended Soil Using Ground Penetrating Radar (GPR)
by Xiaoqing Shen, Tyler Foster, Heather Baldi, Iliyana Dobreva, Byron Burson, Dirk Hays, Rodante Tabien and Russell Jessup
Remote Sens. 2019, 11(23), 2874; https://doi.org/10.3390/rs11232874 - 03 Dec 2019
Cited by 12 | Viewed by 4366
Abstract
The application of biochar amendments to soil has been proposed as a strategy for mitigating global carbon (C) emissions and soil organic carbon (SOC) loss. Biochar can provide additional agronomic benefits to cropping systems, including improved crop yield, soil water holding capacity, seed [...] Read more.
The application of biochar amendments to soil has been proposed as a strategy for mitigating global carbon (C) emissions and soil organic carbon (SOC) loss. Biochar can provide additional agronomic benefits to cropping systems, including improved crop yield, soil water holding capacity, seed germination, cation exchange capacity (CEC), and soil pH. To maximize the beneficial effects of biochar amendments towards the inventory, increase, and management of SOC pools, nondestructive analytical methods such as ground penetrating radar (GPR) are needed to identify and quantify belowground C. The use of GPR has been well characterized across geological, archaeological, engineering, and military applications. While GPR has been predominantly utilized to detect relatively large objects such as rocks, tree roots, land mines, and peat soils, the objective of this study was to quantify comparatively smaller, particulate sources of SOC. This research used three materials as C sources: biochar, graphite, and activated C. The C sources were mixed with sand—12 treatments in total—and scanned under three moisture levels: 0%, 10%, and 20% to simulate different soil conditions. GPR attribute analyses and Naïve Bayes predictive models were utilized in lieu of visualization methods because of the minute size of the C particles. Significant correlations between GPR attributes and both C content and moisture levels were detected. The accuracy of two predictive models using a Naïve Bayes classifier for C content was trivial but the accuracy for C structure was 56%. The analyses confirmed the ability of GPR to identify differences in both C content and C structure. Beneficial future applications could focus on applying GPR across more diverse soil conditions. Full article
(This article belongs to the Section Remote Sensing in Agriculture and Vegetation)
Show Figures

Graphical abstract

20 pages, 5016 KiB  
Article
Monitoring Within-Field Variability of Corn Yield using Sentinel-2 and Machine Learning Techniques
by Ahmed Kayad, Marco Sozzi, Simone Gatto, Francesco Marinello and Francesco Pirotti
Remote Sens. 2019, 11(23), 2873; https://doi.org/10.3390/rs11232873 - 03 Dec 2019
Cited by 86 | Viewed by 11151
Abstract
Monitoring and prediction of within-field crop variability can support farmers to make the right decisions in different situations. The current advances in remote sensing and the availability of high resolution, high frequency, and free Sentinel-2 images improve the implementation of Precision Agriculture (PA) [...] Read more.
Monitoring and prediction of within-field crop variability can support farmers to make the right decisions in different situations. The current advances in remote sensing and the availability of high resolution, high frequency, and free Sentinel-2 images improve the implementation of Precision Agriculture (PA) for a wider range of farmers. This study investigated the possibility of using vegetation indices (VIs) derived from Sentinel-2 images and machine learning techniques to assess corn (Zea mays) grain yield spatial variability within the field scale. A 22-ha study field in North Italy was monitored between 2016 and 2018; corn yield was measured and recorded by a grain yield monitor mounted on the harvester machine recording more than 20,000 georeferenced yield observation points from the study field for each season. VIs from a total of 34 Sentinel-2 images at different crop ages were analyzed for correlation with the measured yield observations. Multiple regression and two different machine learning approaches were also tested to model corn grain yield. The three main results were the following: (i) the Green Normalized Difference Vegetation Index (GNDVI) provided the highest R2 value of 0.48 for monitoring within-field variability of corn grain yield; (ii) the most suitable period for corn yield monitoring was a crop age between 105 and 135 days from the planting date (R4–R6); (iii) Random Forests was the most accurate machine learning approach for predicting within-field variability of corn yield, with an R2 value of almost 0.6 over an independent validation set of half of the total observations. Based on the results, within-field variability of corn yield for previous seasons could be investigated from archived Sentinel-2 data with GNDVI at crop stage (R4–R6). Full article
Show Figures

Graphical abstract

26 pages, 4878 KiB  
Article
Deriving the Reservoir Conditions for Better Water Resource Management Using Satellite-Based Earth Observations in the Lower Mekong River Basin
by Syed A. Ali and Venkataramana Sridhar
Remote Sens. 2019, 11(23), 2872; https://doi.org/10.3390/rs11232872 - 03 Dec 2019
Cited by 12 | Viewed by 4111
Abstract
The Mekong River basin supported a large population and ecosystem with abundant water and nutrient supply. However, the impoundments in the river can substantially alter the flow downstream and its timing. Using limited observations, this study demonstrated an approach to derive dam characteristics, [...] Read more.
The Mekong River basin supported a large population and ecosystem with abundant water and nutrient supply. However, the impoundments in the river can substantially alter the flow downstream and its timing. Using limited observations, this study demonstrated an approach to derive dam characteristics, including storage and flow rate, from remote-sensing-based data. Global Reservoir and Lake Monitor (GRLM), River-Lake Hydrology (RLH), and ICESat-GLAS, which generated altimetry from Jason series and inundation areas from Landsat 8, were used to estimate the reservoir surface area and change in storage over time. The inflow simulated by the variable infiltration capacity (VIC) model from 2008 to 2016 and the reservoir storage change were used in the mass balance equation to calculate outflows for three dams in the basin. Estimated reservoir total storage closely resembled the observed data, with a Nash-Sutcliffe efficiency and coefficient of determination more than 0.90 and 0.95, respectively. An average decrease of 55% in outflows was estimated during the wet season and an increase of up to 94% in the dry season for the Lam Pao. The estimated decrease in outflows during the wet season was 70% and 60% for Sirindhorn and Ubol Ratana, respectively, along with a 36% increase in the dry season for Sirindhorn. Basin-wide demand for evapotranspiration, about 935 mm, implicitly matched with the annual water diversion from 1000 to 2300 million m3. From the storage–discharge rating curves, minimum storage was also evident in the monsoon season (June–July), and it reached the highest in November. This study demonstrated the utility of remote sensing products to assess the impacts of dams on flows in the Mekong River basin. Full article
Show Figures

Graphical abstract

14 pages, 5386 KiB  
Article
Thickness Measurement of Water Film/Rivulets Based on Grayscale Index
by Haiquan Jing, Yi Cheng, Xuhui He, Xu Zhou and Jia He
Remote Sens. 2019, 11(23), 2871; https://doi.org/10.3390/rs11232871 - 03 Dec 2019
Cited by 1 | Viewed by 4616
Abstract
This study proposed a nonintrusive and cost-efficient technique to measure the thickness of a thin water film/rivulet based on the grayscale index. This technique uses millions of probes and only needs a digital camera, fill lights, and pigment. For water colored with diluted [...] Read more.
This study proposed a nonintrusive and cost-efficient technique to measure the thickness of a thin water film/rivulet based on the grayscale index. This technique uses millions of probes and only needs a digital camera, fill lights, and pigment. For water colored with diluted pigment, the grayscale index of the water captured by a digital camera depends on the water thickness. This relationship can be utilized to measure the water thickness through digital image processing. In the present study, the relationship between the grayscale index and water thickness was theoretically and experimentally investigated. Theoretical derivation revealed that when the product of water thickness and the color density approaches to 0, the grayscale index is inversely proportional to the thickness. The experimental results show that under the color density of 0.05%, the grayscale index is inversely proportional to the thickness of water film when the thickness is less than 6 mm. This linear relationship was utilized to measure the distribution and profile of a water rivulet flowing on the lower surface of a cable model. Full article
(This article belongs to the Special Issue Vision-Based Sensing in Engineering Structures)
Show Figures

Graphical abstract

17 pages, 13446 KiB  
Article
Remote Sensing and Texture Image Classification Network Based on Deep Learning Integrated with Binary Coding and Sinkhorn Distance
by Chu He, Qingyi Zhang, Tao Qu, Dingwen Wang and Mingsheng Liao
Remote Sens. 2019, 11(23), 2870; https://doi.org/10.3390/rs11232870 - 03 Dec 2019
Cited by 6 | Viewed by 3473
Abstract
In the past two decades, traditional hand-crafted feature based methods and deep feature based methods have successively played the most important role in image classification. In some cases, hand-crafted features still provide better performance than deep features. This paper proposes an innovative network [...] Read more.
In the past two decades, traditional hand-crafted feature based methods and deep feature based methods have successively played the most important role in image classification. In some cases, hand-crafted features still provide better performance than deep features. This paper proposes an innovative network based on deep learning integrated with binary coding and Sinkhorn distance (DBSNet) for remote sensing and texture image classification. The statistical texture features of the image extracted by uniform local binary pattern (ULBP) are introduced as a supplement for deep features extracted by ResNet-50 to enhance the discriminability of features. After the feature fusion, both diversity and redundancy of the features have increased, thus we propose the Sinkhorn loss where an entropy regularization term plays a key role in removing redundant information and training the model quickly and efficiently. Image classification experiments are performed on two texture datasets and five remote sensing datasets. The results show that the statistical texture features of the image extracted by ULBP complement the deep features, and the new Sinkhorn loss performs better than the commonly used softmax loss. The performance of the proposed algorithm DBSNet ranks in the top three on the remote sensing datasets compared with other state-of-the-art algorithms. Full article
Show Figures

Graphical abstract

19 pages, 3276 KiB  
Article
Assessing the Feasibility of Using Sentinel-2 Imagery to Quantify the Impact of Heatwaves on Irrigated Vineyards
by Alessia Cogato, Vinay Pagay, Francesco Marinello, Franco Meggio, Peter Grace and Massimiliano De Antoni Migliorati
Remote Sens. 2019, 11(23), 2869; https://doi.org/10.3390/rs11232869 - 02 Dec 2019
Cited by 27 | Viewed by 5369
Abstract
Heatwaves are common in many viticultural regions of Australia. We evaluated the potential of satellite-based remote sensing to detect the effects of high temperatures on grapevines in a South Australian vineyard over the 2016–2017 and 2017–2018 seasons. The study involved: (i) comparing the [...] Read more.
Heatwaves are common in many viticultural regions of Australia. We evaluated the potential of satellite-based remote sensing to detect the effects of high temperatures on grapevines in a South Australian vineyard over the 2016–2017 and 2017–2018 seasons. The study involved: (i) comparing the normalized difference vegetation index (NDVI) from medium- and high-resolution satellite images; (ii) determining correlations between environmental conditions and vegetation indices (Vis); and (iii) identifying VIs that best indicate heatwave effects. Pearson’s correlation and Bland–Altman testing showed a significant agreement between the NDVI of high- and medium-resolution imagery (R = 0.74, estimated difference −0.093). The band and the VI most sensitive to changes in environmental conditions were 705 nm and enhanced vegetation index (EVI), both of which correlated with relative humidity (R = 0.65 and R = 0.62, respectively). Conversely, SWIR (short wave infrared, 1610 nm) exhibited a negative correlation with growing degree days (R = −0.64). The analysis of heat stress showed that green and red edge bands—the chlorophyll absorption ratio index (CARI) and transformed chlorophyll absorption ratio index (TCARI)—were negatively correlated with thermal environmental parameters such as air and soil temperature and growing degree days (GDDs). The red and red edge bands—the soil-adjusted vegetation index (SAVI) and CARI2—were correlated with relative humidity. To the best of our knowledge, this is the first study demonstrating the effectiveness of using medium-resolution imagery for the detection of heat stress on grapevines in irrigated vineyards. Full article
(This article belongs to the Special Issue Remote Sensing in Viticulture)
Show Figures

Graphical abstract

22 pages, 9627 KiB  
Article
Scattering Transform Framework for Unmixing of Hyperspectral Data
by Yiliang Zeng, Christian Ritz, Jiahong Zhao and Jinhui Lan
Remote Sens. 2019, 11(23), 2868; https://doi.org/10.3390/rs11232868 - 02 Dec 2019
Cited by 5 | Viewed by 3807
Abstract
The scattering transform, which applies multiple convolutions using known filters targeting different scales of time or frequency, has a strong similarity to the structure of convolution neural networks (CNNs), without requiring training to learn the convolution filters, and has been used for hyperspectral [...] Read more.
The scattering transform, which applies multiple convolutions using known filters targeting different scales of time or frequency, has a strong similarity to the structure of convolution neural networks (CNNs), without requiring training to learn the convolution filters, and has been used for hyperspectral image classification in recent research. This paper investigates the application of the scattering transform framework to hyperspectral unmixing (STFHU). While state-of-the-art research on unmixing hyperspectral data utilizing scattering transforms is limited, the proposed end-to-end method applies pixel-based scattering transforms and preliminary three-dimensional (3D) scattering transforms to hyperspectral images in the remote sensing scenario to extract feature vectors, which are then trained by employing the regression model based on the k-nearest neighbor (k-NN) to estimate the abundance of maps of endmembers. Experiments compare performances of the proposed algorithm with a series of existing methods in quantitative terms based on both synthetic data and real-world hyperspectral datasets. Results indicate that the proposed approach is more robust to additive noise, which is suppressed by utilizing the rich information in both high-frequency and low-frequency components represented by the scattering transform. Furthermore, the proposed method achieves higher accuracy for unmixing using the same amount of training data with all comparative approaches, while achieving equivalent performance to the best performing CNN method but using much less training data. Full article
Show Figures

Graphical abstract

15 pages, 2705 KiB  
Article
Mitigation of Ionospheric Scintillation Effects on GNSS Signals with VMD-MFDFA
by Wasiu Akande Ahmed, Falin Wu, Dessi Marlia, Ednofri and Yan Zhao
Remote Sens. 2019, 11(23), 2867; https://doi.org/10.3390/rs11232867 - 02 Dec 2019
Cited by 9 | Viewed by 3550
Abstract
Severe scintillations degrade the satellite signal intensity below the fade margin of satellite receivers thereby resulting in failure of communication, positioning, and navigational services. The performance of satellite receivers is obviously restricted by ionospheric scintillation effects, which may lead to signal degradation primarily [...] Read more.
Severe scintillations degrade the satellite signal intensity below the fade margin of satellite receivers thereby resulting in failure of communication, positioning, and navigational services. The performance of satellite receivers is obviously restricted by ionospheric scintillation effects, which may lead to signal degradation primarily due to the refraction, reflection, and scattering of radio signals. Thus, there is a need to develop an ionospheric scintillation detection and mitigation technique for robust satellite signal receivers. Hence, variational mode decomposition (VMD) is proposed. VMD addresses the problem of ionospheric scintillation effects on global navigation satellite system (GNSS) signals by extracting the noise from the radio signals in combination with multifractal detrended fluctuation analysis (MFDFA). MFDFA helps as a criterion designed to detect and distinguish the intrinsic mode functions (IMFs) into noisy (scintillated) and noise-free (non-scintillated) IMF signal components using the MFDFA threshold. The results of the proposed method are promising, reliable, and have the potential to mitigate ionospheric scintillation effects on both the synthetic (simulated) and real GNSS data obtained from Manado station (latitude 1.34° S and longitude 124.82° E), Indonesia. From the results, the effectiveness of VMD-MFDFA over complementary ensemble empirical mode decomposition with MFDFA (CEEMD-MFDFA) is an indication of better performance. Full article
Show Figures

Graphical abstract

28 pages, 6892 KiB  
Article
A Novel Ensemble Approach for Landslide Susceptibility Mapping (LSM) in Darjeeling and Kalimpong Districts, West Bengal, India
by Jagabandhu Roy, Sunil Saha, Alireza Arabameri, Thomas Blaschke and Dieu Tien Bui
Remote Sens. 2019, 11(23), 2866; https://doi.org/10.3390/rs11232866 - 02 Dec 2019
Cited by 122 | Viewed by 7553
Abstract
Landslides are among the most harmful natural hazards for human beings. This study aims to delineate landslide hazard zones in the Darjeeling and Kalimpong districts of West Bengal, India using a novel ensemble approach combining the weight-of-evidence (WofE) and support vector machine (SVM) [...] Read more.
Landslides are among the most harmful natural hazards for human beings. This study aims to delineate landslide hazard zones in the Darjeeling and Kalimpong districts of West Bengal, India using a novel ensemble approach combining the weight-of-evidence (WofE) and support vector machine (SVM) techniques with remote sensing datasets and geographic information systems (GIS). The study area currently faces severe landslide problems, causing fatalities and losses of property. In the present study, the landslide inventory database was prepared using Google Earth imagery, and a field investigation carried out with a global positioning system (GPS). Of the 326 landslides in the inventory, 98 landslides (30%) were used for validation, and 228 landslides (70%) were used for modeling purposes. The landslide conditioning factors of elevation, rainfall, slope, aspect, geomorphology, geology, soil texture, land use/land cover (LULC), normalized differential vegetation index (NDVI), topographic wetness index (TWI), sediment transportation index (STI), stream power index (SPI), and seismic zone maps were used as independent variables in the modeling process. The weight-of-evidence and SVM techniques were ensembled and used to prepare landslide susceptibility maps (LSMs) with the help of remote sensing (RS) data and geographical information systems (GIS). The landslide susceptibility maps (LSMs) were then classified into four classes; namely, low, medium, high, and very high susceptibility to landslide occurrence, using the natural breaks classification methods in the GIS environment. The very high susceptibility zones produced by these ensemble models cover an area of 630 km2 (WofE& RBF-SVM), 474 km2 (WofE& Linear-SVM), 501km2 (WofE& Polynomial-SVM), and 498 km2 (WofE& Sigmoid-SVM), respectively, of a total area of 3914 km2. The results of our study were validated using the receiver operating characteristic (ROC) curve and quality sum (Qs) methods. The area under the curve (AUC) values of the ensemble WofE& RBF-SVM, WofE & Linear-SVM, WofE & Polynomial-SVM, and WofE & Sigmoid-SVM models are 87%, 90%, 88%, and 85%, respectively, which indicates they are very good models for identifying landslide hazard zones. As per the results of both validation methods, the WofE & Linear-SVM model is more accurate than the other ensemble models. The results obtained from this study using our new ensemble methods can provide proper and significant information to decision-makers and policy planners in the landslide-prone areas of these districts. Full article
(This article belongs to the Special Issue Remote Sensing of Natural Hazards)
Show Figures

Graphical abstract

26 pages, 5947 KiB  
Article
Detection of New Zealand Kauri Trees with AISA Aerial Hyperspectral Data for Use in Multispectral Monitoring
by Jane J. Meiforth, Henning Buddenbaum, Joachim Hill, James Shepherd and David A. Norton
Remote Sens. 2019, 11(23), 2865; https://doi.org/10.3390/rs11232865 - 02 Dec 2019
Cited by 4 | Viewed by 4902
Abstract
The endemic New Zealand kauri trees (Agathis australis) are of major importance for the forests in the northern part of New Zealand. The mapping of kauri locations is required for the monitoring of the deadly kauri dieback disease (Phytophthora agathidicida [...] Read more.
The endemic New Zealand kauri trees (Agathis australis) are of major importance for the forests in the northern part of New Zealand. The mapping of kauri locations is required for the monitoring of the deadly kauri dieback disease (Phytophthora agathidicida (PTA)). In this study, we developed a method to identify kauri trees by optical remote sensing that can be applied in an area-wide campaign. Dead and dying trees were separated in one class and the remaining trees with no to medium stress symptoms were defined in the two classes “kauri” and “other”. The reference dataset covers a representative selection of 3165 precisely located crowns of kauri and 21 other canopy species in the Waitakere Ranges west of Auckland. The analysis is based on an airborne hyperspectral AISA Fenix image (437–2337 nm, 1 m2 pixel resolution). The kauri spectra show characteristically steep reflectance and absorption features in the near-infrared (NIR) region with a distinct long descent at 1215 nm, which can be parameterised with a modified Normalised Water Index (mNDWI-Hyp). With a Jeffries–Matusita separability over 1.9, the kauri spectra can be well separated from 21 other canopy vegetation spectra. The Random Forest classifier performed slightly better than Support Vector Machine. A combination of the mNDWI-Hyp index with four additional spectral indices with three red to NIR bands resulted in an overall pixel-based accuracy (OA) of 91.7% for crowns larger 3 m diameter. While the user’s and producer’s accuracies for the class “kauri” with 94.6% and 94.8% are suitable for management purposes, the separation of “dead/dying trees” from “other” canopy vegetation poses the main challenge. The OA can be improved to 93.8% by combining “kauri” and “dead/dying” trees in one class, separate classifications for low and high forest stands and a binning to 10 nm bandwidths. Additional wavelengths and their respective indices only improved the OA up to 0.6%. The method developed in this study allows an accurate location of kauri trees for an area-wide mapping with a five-band multispectral sensor in a representative selection of forest ecosystems. Full article
(This article belongs to the Section Forest Remote Sensing)
Show Figures

Graphical abstract

21 pages, 8360 KiB  
Article
Retrieval of Snow Depth over Arctic Sea Ice Using a Deep Neural Network
by Jiping Liu, Yuanyuan Zhang, Xiao Cheng and Yongyun Hu
Remote Sens. 2019, 11(23), 2864; https://doi.org/10.3390/rs11232864 - 02 Dec 2019
Cited by 19 | Viewed by 4645
Abstract
The accurate knowledge of spatial and temporal variations of snow depth over sea ice in the Arctic basin is important for understanding the Arctic energy budget and retrieving sea ice thickness from satellite altimetry. In this study, we develop and validate a new [...] Read more.
The accurate knowledge of spatial and temporal variations of snow depth over sea ice in the Arctic basin is important for understanding the Arctic energy budget and retrieving sea ice thickness from satellite altimetry. In this study, we develop and validate a new method for retrieving snow depth over Arctic sea ice from brightness temperatures at different frequencies measured by passive microwave radiometers. We construct an ensemble-based deep neural network and use snow depth measured by sea ice mass balance buoys to train the network. First, the accuracy of the retrieved snow depth is validated with observations. The results show the derived snow depth is in good agreement with the observations, in terms of correlation, bias, root mean square error, and probability distribution. Our ensemble-based deep neural network can be used to extend the snow depth retrieval from first-year sea ice (FYI) to multi-year sea ice (MYI), as well as during the melting period. Second, the consistency and discrepancy of snow depth in the Arctic basin between our retrieval using the ensemble-based deep neural network and two other available retrievals using the empirical regression are examined. The results suggest that our snow depth retrieval outperforms these data sets. Full article
Show Figures

Graphical abstract

23 pages, 9713 KiB  
Article
Near-Real Time Automatic Snow Avalanche Activity Monitoring System Using Sentinel-1 SAR Data in Norway
by Markus Eckerstorfer, Hannah Vickers, Eirik Malnes and Jakob Grahn
Remote Sens. 2019, 11(23), 2863; https://doi.org/10.3390/rs11232863 - 02 Dec 2019
Cited by 30 | Viewed by 7289
Abstract
Knowledge of the spatio-temporal occurrence of avalanche activity is critical for avalanche forecasting. We present a near-real time automatic avalanche monitoring system that outputs detected avalanche polygons within roughly 10 min after Sentinel-1 SAR data are download. Our avalanche detection algorithm has an [...] Read more.
Knowledge of the spatio-temporal occurrence of avalanche activity is critical for avalanche forecasting. We present a near-real time automatic avalanche monitoring system that outputs detected avalanche polygons within roughly 10 min after Sentinel-1 SAR data are download. Our avalanche detection algorithm has an average probability of detection (POD) of 67.2% with a false alarm rate (FAR) averaging 45.9, with a maximum POD of over 85% and a minimum FAR of 24.9% compared to manual detection of avalanches. The high variability in performance stems from the dynamic nature of snow in the Sentinel-1 data. After tuning parameters of the detection algorithm, we processed five years of Sentinel-1 images acquired over a 150 × 100 km large area in Northern Norway, with the best setup. Compared to a dataset of field-observed avalanches, 77.3% were manually detectable. Using these manual detections as benchmark, the avalanche detection algorithm achieved an accuracy of 79% with high POD in cases of medium to large wet snow avalanches. For the first time, we present a dataset of spatio-temporal avalanche activity over several winters from a large region. Currently, the Norwegian Avalanche Warning Service is using our processing system for pre-operational use in three regions in Norway. Full article
Show Figures

Graphical abstract

27 pages, 23440 KiB  
Article
Ship Detection Using Deep Convolutional Neural Networks for PolSAR Images
by Weiwei Fan, Feng Zhou, Xueru Bai, Mingliang Tao and Tian Tian
Remote Sens. 2019, 11(23), 2862; https://doi.org/10.3390/rs11232862 - 02 Dec 2019
Cited by 33 | Viewed by 4142
Abstract
Ship detection plays an important role in many remote sensing applications. However, the performance of the PolSAR ship detection may be degraded by the complicated scattering mechanism, multi-scale size of targets, and random speckle noise, etc. In this paper, we propose a ship [...] Read more.
Ship detection plays an important role in many remote sensing applications. However, the performance of the PolSAR ship detection may be degraded by the complicated scattering mechanism, multi-scale size of targets, and random speckle noise, etc. In this paper, we propose a ship detection method for PolSAR images based on modified faster region-based convolutional neural network (Faster R-CNN). The main improvements include proposal generation by adopting multi-level features produced by the convolution layers, which fits ships with different sizes, and the addition of a Deep Convolutional Neural Network (DCNN)-based classifier for training sample generation and coast mitigation. The proposed method has been validated by four measured datasets of NASA/JPL airborne synthetic aperture radar (AIRSAR) and uninhabited aerial vehicle synthetic aperture radar (UAVSAR). Performance comparison with the modified constant false alarm rate (CFAR) detector and the Faster R-CNN has demonstrated that the proposed method can improve the detection probability while reducing the false alarm rate and missed detections. Full article
Show Figures

Graphical abstract

23 pages, 34308 KiB  
Article
Remotely-Sensed Identification of a Transition for the Two Ecosystem States Along the Elevation Gradient: A Case Study of Xinjiang Tianshan Bogda World Heritage Site
by Hong Wan, Xinyuan Wang, Lei Luo, Peng Guo, Yanchuang Zhao, Kai Wu and Hongge Ren
Remote Sens. 2019, 11(23), 2861; https://doi.org/10.3390/rs11232861 - 02 Dec 2019
Cited by 3 | Viewed by 3185
Abstract
The alpine treeline, as an ecological transition zone between montane coniferous forests and alpine meadows (two ecosystem states), is a research hotspot of global ecology and climate change. Quantitative identification of its elevation range can efficiently capture the results of the interaction between [...] Read more.
The alpine treeline, as an ecological transition zone between montane coniferous forests and alpine meadows (two ecosystem states), is a research hotspot of global ecology and climate change. Quantitative identification of its elevation range can efficiently capture the results of the interaction between climate change and vegetation. Digital extraction and extensive analysis in such a critical elevation range crucially depend on the ability of monitoring ecosystem variables and the suitability of the experimental model, which are often restricted by the weak intersection of disciplines and the spatial-temporal continuity of the data. In this study, the existence of two states was confirmed by frequency analysis and the Akaike information criterion (AIC) as well as the Bayesian information criterion (BIC) indices. The elevation range of a transition for the two ecosystem states on the northern slope of the Bogda was identified by the potential analysis. The results showed that the elevation range of co-occurrence for the two ecosystem states was 2690–2744 m. At the elevation of 2714 m, the high land surface temperature (LST) state started to exhibit more attraction than the low LST state. This elevation value was considered as a demarcation where abrupt shifts between the two states occurred with the increase of elevation. The identification results were validated by a field survey and unmanned aerial vehicle data. Progress has been made in the transition identification for the ecosystem states along the elevation gradient in mountainous areas by combining the remotely-sensed index with a potential analysis. This study also provided a reference for obtaining the elevation of the alpine tree line quickly and accurately. Full article
Show Figures

Graphical abstract

35 pages, 7039 KiB  
Article
An Under-Ice Hyperspectral and RGB Imaging System to Capture Fine-Scale Biophysical Properties of Sea Ice
by Emiliano Cimoli, Klaus M. Meiners, Arko Lucieer and Vanessa Lucieer
Remote Sens. 2019, 11(23), 2860; https://doi.org/10.3390/rs11232860 - 02 Dec 2019
Cited by 12 | Viewed by 5863
Abstract
Sea-ice biophysical properties are characterized by high spatio-temporal variability ranging from the meso- to the millimeter scale. Ice coring is a common yet coarse point sampling technique that struggles to capture such variability in a non-invasive manner. This hinders quantification and understanding of [...] Read more.
Sea-ice biophysical properties are characterized by high spatio-temporal variability ranging from the meso- to the millimeter scale. Ice coring is a common yet coarse point sampling technique that struggles to capture such variability in a non-invasive manner. This hinders quantification and understanding of ice algae biomass patchiness and its complex interaction with some of its sea ice physical drivers. In response to these limitations, a novel under-ice sled system was designed to capture proxies of biomass together with 3D models of bottom topography of land-fast sea-ice. This system couples a pushbroom hyperspectral imaging (HI) sensor with a standard digital RGB camera and was trialed at Cape Evans, Antarctica. HI aims to quantify per-pixel chlorophyll-a content and other ice algae biological properties at the ice-water interface based on light transmitted through the ice. RGB imagery processed with digital photogrammetry aims to capture under-ice structure and topography. Results from a 20 m transect capturing a 0.61 m wide swath at sub-mm spatial resolution are presented. We outline the technical and logistical approach taken and provide recommendations for future deployments and developments of similar systems. A preliminary transect subsample was processed using both established and novel under-ice bio-optical indices (e.g., normalized difference indexes and the area normalized by the maximal band depth) and explorative analyses (e.g., principal component analyses) to establish proxies of algal biomass. This first deployment of HI and digital photogrammetry under-ice provides a proof-of-concept of a novel methodology capable of delivering non-invasive and highly resolved estimates of ice algal biomass in-situ, together with some of its environmental drivers. Nonetheless, various challenges and limitations remain before our method can be adopted across a range of sea-ice conditions. Our work concludes with suggested solutions to these challenges and proposes further method and system developments for future research. Full article
Show Figures

Graphical abstract

21 pages, 2082 KiB  
Article
Hyperspectral Image Super-Resolution with 1D–2D Attentional Convolutional Neural Network
by Jiaojiao Li, Ruxing Cui, Bo Li, Rui Song, Yunsong Li and Qian Du
Remote Sens. 2019, 11(23), 2859; https://doi.org/10.3390/rs11232859 - 01 Dec 2019
Cited by 21 | Viewed by 4450
Abstract
Hyperspectral image (HSI) super-resolution (SR) is of great application value and has attracted broad attention. The hyperspectral single image super-resolution (HSISR) task is correspondingly difficult in SR due to the unavailability of auxiliary high resolution images. To tackle this challenging task, different from [...] Read more.
Hyperspectral image (HSI) super-resolution (SR) is of great application value and has attracted broad attention. The hyperspectral single image super-resolution (HSISR) task is correspondingly difficult in SR due to the unavailability of auxiliary high resolution images. To tackle this challenging task, different from the existing learning-based HSISR algorithms, in this paper we propose a novel framework, i.e., a 1D–2D attentional convolutional neural network, which employs a separation strategy to extract the spatial–spectral information and then fuse them gradually. More specifically, our network consists of two streams: a spatial one and a spectral one. The spectral one is mainly composed of the 1D convolution to encode a small change in the spectrum, while the 2D convolution, cooperating with the attention mechanism, is used in the spatial pathway to encode spatial information. Furthermore, a novel hierarchical side connection strategy is proposed for effectively fusing spectral and spatial information. Compared with the typical 3D convolutional neural network (CNN), the 1D–2D CNN is easier to train with less parameters. More importantly, our proposed framework can not only present a perfect solution for the HSISR problem, but also explore the potential in hyperspectral pansharpening. The experiments over widely used benchmarks on SISR and hyperspectral pansharpening demonstrate that the proposed method could outperform other state-of-the-art methods, both in visual quality and quantity measurements. Full article
Show Figures

Graphical abstract

19 pages, 7052 KiB  
Article
Assessment of the Degree of Building Damage Caused by Disaster Using Convolutional Neural Networks in Combination with Ordinal Regression
by Tianyu Ci, Zhen Liu and Ying Wang
Remote Sens. 2019, 11(23), 2858; https://doi.org/10.3390/rs11232858 - 01 Dec 2019
Cited by 40 | Viewed by 5293
Abstract
We propose a new convolutional neural networks method in combination with ordinal regression aiming at assessing the degree of building damage caused by earthquakes with aerial imagery. The ordinal regression model and a deep learning algorithm are incorporated to make full use of [...] Read more.
We propose a new convolutional neural networks method in combination with ordinal regression aiming at assessing the degree of building damage caused by earthquakes with aerial imagery. The ordinal regression model and a deep learning algorithm are incorporated to make full use of the information to improve the accuracy of the assessment. A new loss function was introduced in this paper to combine convolutional neural networks and ordinal regression. Assessing the level of damage to buildings can be considered as equivalent to predicting the ordered labels of buildings to be assessed. In the existing research, the problem has usually been simplified as a problem of pure classification to be further studied and discussed, which ignores the ordinal relationship between different levels of damage, resulting in a waste of information. Data accumulated throughout history are used to build network models for assessing the level of damage, and models for assessing levels of damage to buildings based on deep learning are described in detail, including model construction, implementation methods, and the selection of hyperparameters, and verification is conducted by experiments. When categorizing the damage to buildings into four types, we apply the method proposed in this paper to aerial images acquired from the 2014 Ludian earthquake and achieve an overall accuracy of 77.39%; when categorizing damage to buildings into two types, the overall accuracy of the model is 93.95%, exceeding such values in similar types of theories and methods. Full article
(This article belongs to the Special Issue Remote Sensing of Natural Hazards)
Show Figures

Graphical abstract

21 pages, 11553 KiB  
Article
Transferred Multi-Perception Attention Networks for Remote Sensing Image Super-Resolution
by Xiaoyu Dong, Zhihong Xi, Xu Sun and Lianru Gao
Remote Sens. 2019, 11(23), 2857; https://doi.org/10.3390/rs11232857 - 01 Dec 2019
Cited by 26 | Viewed by 4061
Abstract
Image super-resolution (SR) reconstruction plays a key role in coping with the increasing demand on remote sensing imaging applications with high spatial resolution requirements. Though many SR methods have been proposed over the last few years, further research is needed to improve SR [...] Read more.
Image super-resolution (SR) reconstruction plays a key role in coping with the increasing demand on remote sensing imaging applications with high spatial resolution requirements. Though many SR methods have been proposed over the last few years, further research is needed to improve SR processes with regard to the complex spatial distribution of the remote sensing images and the diverse spatial scales of ground objects. In this paper, a novel multi-perception attention network (MPSR) is developed with performance exceeding those of many existing state-of-the-art models. By incorporating the proposed enhanced residual block (ERB) and residual channel attention group (RCAG), MPSR can super-resolve low-resolution remote sensing images via multi-perception learning and multi-level information adaptive weighted fusion. Moreover, a pre-train and transfer learning strategy is introduced, which improved the SR performance and stabilized the training procedure. Experimental comparisons are conducted using 13 state-of-the-art methods over a remote sensing dataset and benchmark natural image sets. The proposed model proved its excellence in both objective criterion and subjective perspective. Full article
(This article belongs to the Special Issue Image Super-Resolution in Remote Sensing)
Show Figures

Graphical abstract

18 pages, 9643 KiB  
Article
Effects of Distinguishing Vegetation Types on the Estimates of Remotely Sensed Evapotranspiration in Arid Regions
by Tao Du, Li Wang, Guofu Yuan, Xiaomin Sun and Shusen Wang
Remote Sens. 2019, 11(23), 2856; https://doi.org/10.3390/rs11232856 - 01 Dec 2019
Cited by 5 | Viewed by 3144
Abstract
Accurate estimates of evapotranspiration (ET) in arid ecosystems are important for sustainable water resource management due to competing water demands between human and ecological environments. Several empirical remotely sensed ET models have been constructed and their potential for regional scale ET estimation in [...] Read more.
Accurate estimates of evapotranspiration (ET) in arid ecosystems are important for sustainable water resource management due to competing water demands between human and ecological environments. Several empirical remotely sensed ET models have been constructed and their potential for regional scale ET estimation in arid ecosystems has been demonstrated. Generally, these models were built using combined measured ET and corresponding remotely sensed and meteorological data from diverse sites. However, there are usually different vegetation types or mixed vegetation types in these sites, and little information is available on the estimation uncertainty of these models induced by combining different vegetation types from diverse sites. In this study, we employed the most popular one of these models and recalibrated it using datasets from two typical vegetation types (shrub Tamarix ramosissima and arbor Populus euphratica) in arid ecosystems of northwestern China. The recalibration was performed in the following two ways: using combined datasets from the two vegetation types, and using a single dataset from specific vegetation type. By comparing the performance of the two methods in ET estimation for Tamarix ramosissima and Populus euphratica, we investigated and compared the accuracy of ET estimation at the site scale and the difference in annual ET estimation at the regional scale. The results showed that the estimation accuracy of daily, monthly, and yearly ET was improved by distinguishing the vegetation types. The method based on the combined vegetation types had a great influence on the estimation accuracy of annual ET, which overestimated annual ET about 9.19% for Tamarix ramosissima and underestimated annual ET about 11.50% for Populus euphratica. Furthermore, substantial difference in annual ET estimation at regional scale was found between the two methods. The higher the vegetation coverage, the greater the difference in annual ET. Our results provide valuable information on evaluating the estimation accuracy of regional scale ET using empirical remotely sensed ET models for arid ecosystems. Full article
Show Figures

Graphical abstract

20 pages, 6946 KiB  
Article
Biomass Estimation for Semiarid Vegetation and Mine Rehabilitation Using Worldview-3 and Sentinel-1 SAR Imagery
by Nisha Bao, Wenwen Li, Xiaowei Gu and Yanhui Liu
Remote Sens. 2019, 11(23), 2855; https://doi.org/10.3390/rs11232855 - 01 Dec 2019
Cited by 23 | Viewed by 4391
Abstract
The surface mining activities in grassland and rangeland zones directly affect the livestock production, forage quality, and regional grassland resources. Mine rehabilitation is necessary for accelerating the recovery of the grassland ecosystem. In this work, we investigate the integration of data obtained via [...] Read more.
The surface mining activities in grassland and rangeland zones directly affect the livestock production, forage quality, and regional grassland resources. Mine rehabilitation is necessary for accelerating the recovery of the grassland ecosystem. In this work, we investigate the integration of data obtained via a synthetic aperture radar (Sentinel-1 SAR) with data obtained by optical remote sensing (Worldview-3, WV-3) in order to monitor the conditions of a vegetation area rehabilitated after coal mining in North China. The above-ground biomass (AGB) is used as an indicator of the rehabilitated vegetation conditions and the success of mine rehabilitation. The wavelet principal component analysis is used for the fusion of the WV-3 and Sentinel-1 SAR images. Furthermore, a multiple linear regression model is applied based on the relationship between the remote sensing features and the AGB field measurements. Our results show that WV-3 enhanced vegetation indices (EVI), mean texture from band8 (near infrared band2, NIR2), the SAR vertical and horizon (VH) polarization, and band 8 (NIR2) from the fused image have higher correlation coefficient value with the field-measured AGB. The proposed AGB estimation model combining WV-3 and Sentinel 1A SAR imagery yields higher model accuracy (R2 = 0.79 and RMSE = 22.82 g/m2) compared to that obtained with any of the two datasets only. Besides improving AGB estimation, the proposed model can also reduce the uncertainty range by 7 g m−2 on average. These results demonstrate the potential of new multispectral high-resolution datasets, such as Sentinel-1 SAR and Worldview-3, in providing timely and accurate AGB estimation for mine rehabilitation planning and management. Full article
Show Figures

Graphical abstract

17 pages, 10605 KiB  
Article
Sequential InSAR Time Series Deformation Monitoring of Land Subsidence and Rebound in Xi’an, China
by Baohang Wang, Chaoying Zhao, Qin Zhang and Mimi Peng
Remote Sens. 2019, 11(23), 2854; https://doi.org/10.3390/rs11232854 - 01 Dec 2019
Cited by 22 | Viewed by 4415
Abstract
Interferometric synthetic aperture radar (InSAR) time series deformation monitoring plays an important role in revealing historical displacement of the Earth’s surface. Xi’an, China, has suffered from severe land subsidence along with ground fissure development since the 1960s, which has threatened and will continue [...] Read more.
Interferometric synthetic aperture radar (InSAR) time series deformation monitoring plays an important role in revealing historical displacement of the Earth’s surface. Xi’an, China, has suffered from severe land subsidence along with ground fissure development since the 1960s, which has threatened and will continue to threaten the stability of urban artificial constructions. In addition, some local areas in Xi’an suffered from uplifting for some specific period. Time series deformation derived from multi-temporal InSAR techniques makes it possible to obtain the temporal evolution of land subsidence and rebound in Xi’an. In this paper, we used the sequential InSAR time series estimation method to map the ground subsidence and rebound in Xi’an with Sentinel-1A data during 2015 to 2019, allowing estimation of surface deformation dynamically and quickly. From 20 June 2015 to 17 July 2019, two areas subsided continuously (Sanyaocun-Fengqiyuan and Qujiang New District), while Xi’an City Wall area uplifted with a maximum deformation rate of 12 mm/year. Furthermore, Yuhuazhai subsided from 20 June 2015 to 14 October 2018, and rebound occurred from 14 October 2018 to 17 July 2019, which can be explained as the response to artificial water injection. In the process of artificial water injection, the rebound pattern can be further divided into immediate elastic recovery deformation and time-dependent visco-elastic recovery deformation. Full article
(This article belongs to the Special Issue Remote Sensing of Natural Hazards)
Show Figures

Graphical abstract

Previous Issue
Back to TopTop