


Abstract
Electric vehicles (EVs) are essential for sustainable urban mobility, coordinating transportation demands with energy distribution networks. However, uncoordinated EV charging neglects trip chain continuity, inducing spatial–temporal congestion and overloading local charging capacities. Thus, effectively guiding EVs is a key problem in mitigating traffic emissions and preventing power grid-side stress. In this paper, a two-stage dynamic routing framework within a traffic–energy coordination architecture is proposed, integrating an AHP–Entropy–TOPSIS model for station selection and an Improved Ant Colony Optimization algorithm for trajectory execution. Using this framework, a series of macro–micro simulations on the Sioux Falls network was conducted alongside a congestion-driven dynamic pricing mechanism. The results indicate that the pricing strategy facilitates spatial load balancing through peak shaving at core nodes. Compared to conventional standard meta-heuristic baselines, this framework reduces average economic costs by 28.9% while ensuring battery safety and limiting indirect carbon emissions. The proposed framework provides a multi-objective navigation solution that prevents cross-layer decision fragmentation, supporting the sustainable development of smart city infrastructure.
1. Introduction
With growing concerns regarding energy sustainability and environmental impact, the adoption of electric vehicles (EVs) has become a primary driver in the transition to smart grids [1,2]. However, increasing EV penetration introduces significant operational challenges to existing urban infrastructure. Uncoordinated charging behaviors and the spatial–temporal distribution of charging demands can exacerbate traffic-side problems, including road congestion and queuing, while simultaneously introducing grid-side stress, particularly localized charging capacity limitations at distribution nodes [3,4]. Consequently, research is shifting from isolated perspectives toward a “Traffic–Energy Coordination” network framework, where charging stations serve as interactive physical nodes bridging the transportation network and the energy grid [5,6].
Within this dynamic environment, formulating an EV route selection and charging navigation strategy is an important engineering task. The objective is to guide EVs to appropriate charging facilities, seeking a balance between individual travel efficiency and system-level spatial load equilibrium. Fundamentally, this constitutes a complex, multi-objective stochastic optimization problem [7]. Addressing this problem has become a significant research focus. Recent studies have employed machine learning and artificial intelligence—including deep reinforcement learning (DRL)—to tackle energy–traffic coordination and EV routing under grid constraints [8,9,10,11]. However, data-driven DRL models often lack interpretability. It remains challenging for these models to transparently integrate personalized multi-dimensional user preferences (e.g., subjective weighting between charging prices and time) in zero-shot scenarios without retraining. Furthermore, while exact solvers and advanced controllers like Mixed-Integer Linear Programming (MILP) or Model Predictive Control (MPC) can manage decentralized electrical limits (e.g., voltage control) [12], they often face exponential computational complexity in real-time large-scale transportation networks. Therefore, a transparent, computationally efficient, and preference-aware mathematical framework is needed.
To address EV routing, extensive efforts have been dedicated from various perspectives. However, an in-depth review reveals limitations in existing methodologies across three main dimensions.
Firstly, at the macroscopic routing level, the spatial consistency of the complete “Trip Chain” is often not fully addressed. A substantial body of literature on EV en-route charging navigation formulates the problem to minimize the physical distance or travel time solely to the charging facility [13,14]. By treating the charging station as the terminal node, the spatial continuity of the travel demand is truncated. While recent studies have incorporated multi-criteria decision-making (MCDM) methods such as the Analytic Hierarchy Process (AHP) and TOPSIS to evaluate user satisfaction [15,16,17], they primarily rely on subjective weighting combinations, leaving spatial consistency largely unaddressed. Although cutting-edge research recognizes the necessity of integrating trip chains [18], omitting the secondary detour costs from the charging station to the final destination can result in spatial deviations and reduced overall user satisfaction [19,20,21].
Secondly, regarding charging demand management, real-time spatial load balancing remains difficult to achieve with conventional pricing mechanisms. To mitigate queuing issues during peak hours, queuing theory and Time-of-Use (ToU) electricity pricing mechanisms are widely utilized [22,23]. However, traditional ToU pricing is usually temporally static and spatially uniform. While demand is shifted across different time periods, the response to real-time spatial congestion is limited. Emerging research has explored dynamic price-incentive strategies based on macroscopic grid loads [24,25]. It is noted that rather than solving physical distribution-level power flow equations (e.g., feeder limits or voltage constraints), recent operational frameworks abstract electrical capacity constraints into economic (pricing) and temporal (queuing) signals. However, a dynamic pricing mechanism derived directly from real-time physical occupancy and multi-server (M/M/c) queuing pressures requires further exploration [26]. Relying on static mechanisms during morning peaks tends to direct price-sensitive users toward geographically convenient stations, potentially increasing localized spatial congestion.
Thirdly, at the microscopic trajectory execution level, methodological gaps often exist when multi-objective heuristic algorithms are applied. Heuristic algorithms such as Ant Colony Optimization (ACO) have been deployed for EV path planning [27,28]. Nevertheless, in multi-stage charging navigation tasks, a conceptual gap can emerge between upper-level station selection and lower-level route execution. Economic preferences formulated during station selection are occasionally bypassed by underlying routing algorithms designed to prioritize shortest-distance mapping. Furthermore, while eco-routing supports carbon-neutral transportation [29], integrating these environmental metrics into real-time trajectory execution remains a challenge. Algorithms often struggle to balance time and energy [30], and a non-linear coupling among dynamic traffic flow impedance (such as the Bureau of Public Roads (BPR) function), real-time travel speed, and indirect carbon footprint requires further development [31,32,33].
Motivated by these gaps, this paper proposes a two-stage comprehensive satisfaction evaluation and dynamic routing framework for EVs under a traffic–energy coordination architecture. While methodologies such as MCDM, dynamic pricing, and heuristic optimization have been acknowledged as effective individual components in existing literature, the primary methodological contribution of this study lies in the architectural integration of these components via a cross-layer preference inheritance mechanism. This integration allows macroscopic subjective preferences and objective constraints to be mathematically translated into dynamic heuristic steering weights at the microscopic level, reducing decision fragmentation.
In summary, the main contributions of this paper are highlighted as follows:
- A Two-Stage Trip-Chain Satisfaction Evaluation Model: An AHP–Entropy–TOPSIS evaluation model is formulated based on the complete EV trip chain. By integrating the entropy weighting method, this model mitigates the subjectivity of traditional multi-criteria evaluations. The framework introduces an absolute detour distance formulation and a destination accessibility penalty to maintain spatial consistency and reachability ofthe final destination.
- A Congestion-Driven Dynamic Pricing Mechanism for Spatial Load Balancing: To reduce the spatial rigidity of conventional ToU pricing, a real-time spatial load-balancing mechanism is developed. By integrating the physical occupancy rate and the M/M/c queuing pressure at each station, a dynamic price penalty/discount factor is generated. This economic mechanism redistributes price-sensitive charging demands from congested core areas to peripheral nodes.
- An IACO Algorithm with Cross-Layer Preference Inheritance: An Improved Ant Colony Optimization (IACO) algorithm is proposed for microscopic dynamic trajectory execution, featuring a two-stage decoupling design. Stage I enforces a minimum-energy heuristic to maintain battery safety limits before charging. Stage II maps the user’s multi-dimensional preferences from the upper-level evaluation into the dynamic heuristic function. This achieves a non-linear fusion of the BPR dynamic traffic flow impedance and the indirect carbon footprint, ensuring cross-layer decision consistency.
The remainder of this paper is organized as follows. Section 2 develops the system model, including the coordinated traffic–energy dynamics. Section 3 details the two-stage solution methodology. Section 4 presents comprehensive simulation setups, macro/micro-analyses, and benchmark comparisons. Finally, Section 5 draws the conclusions and outlines future work.
2. System Modeling and Problem Formulation
2.1. System Overview and Architecture
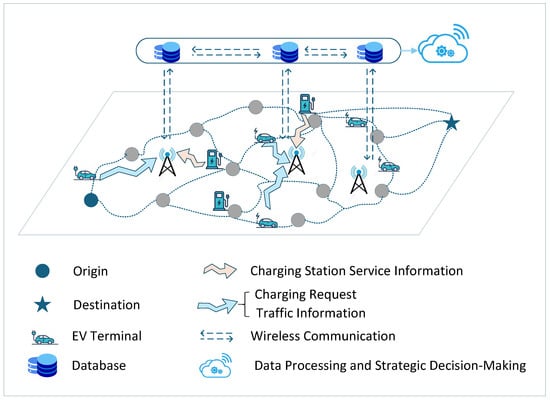
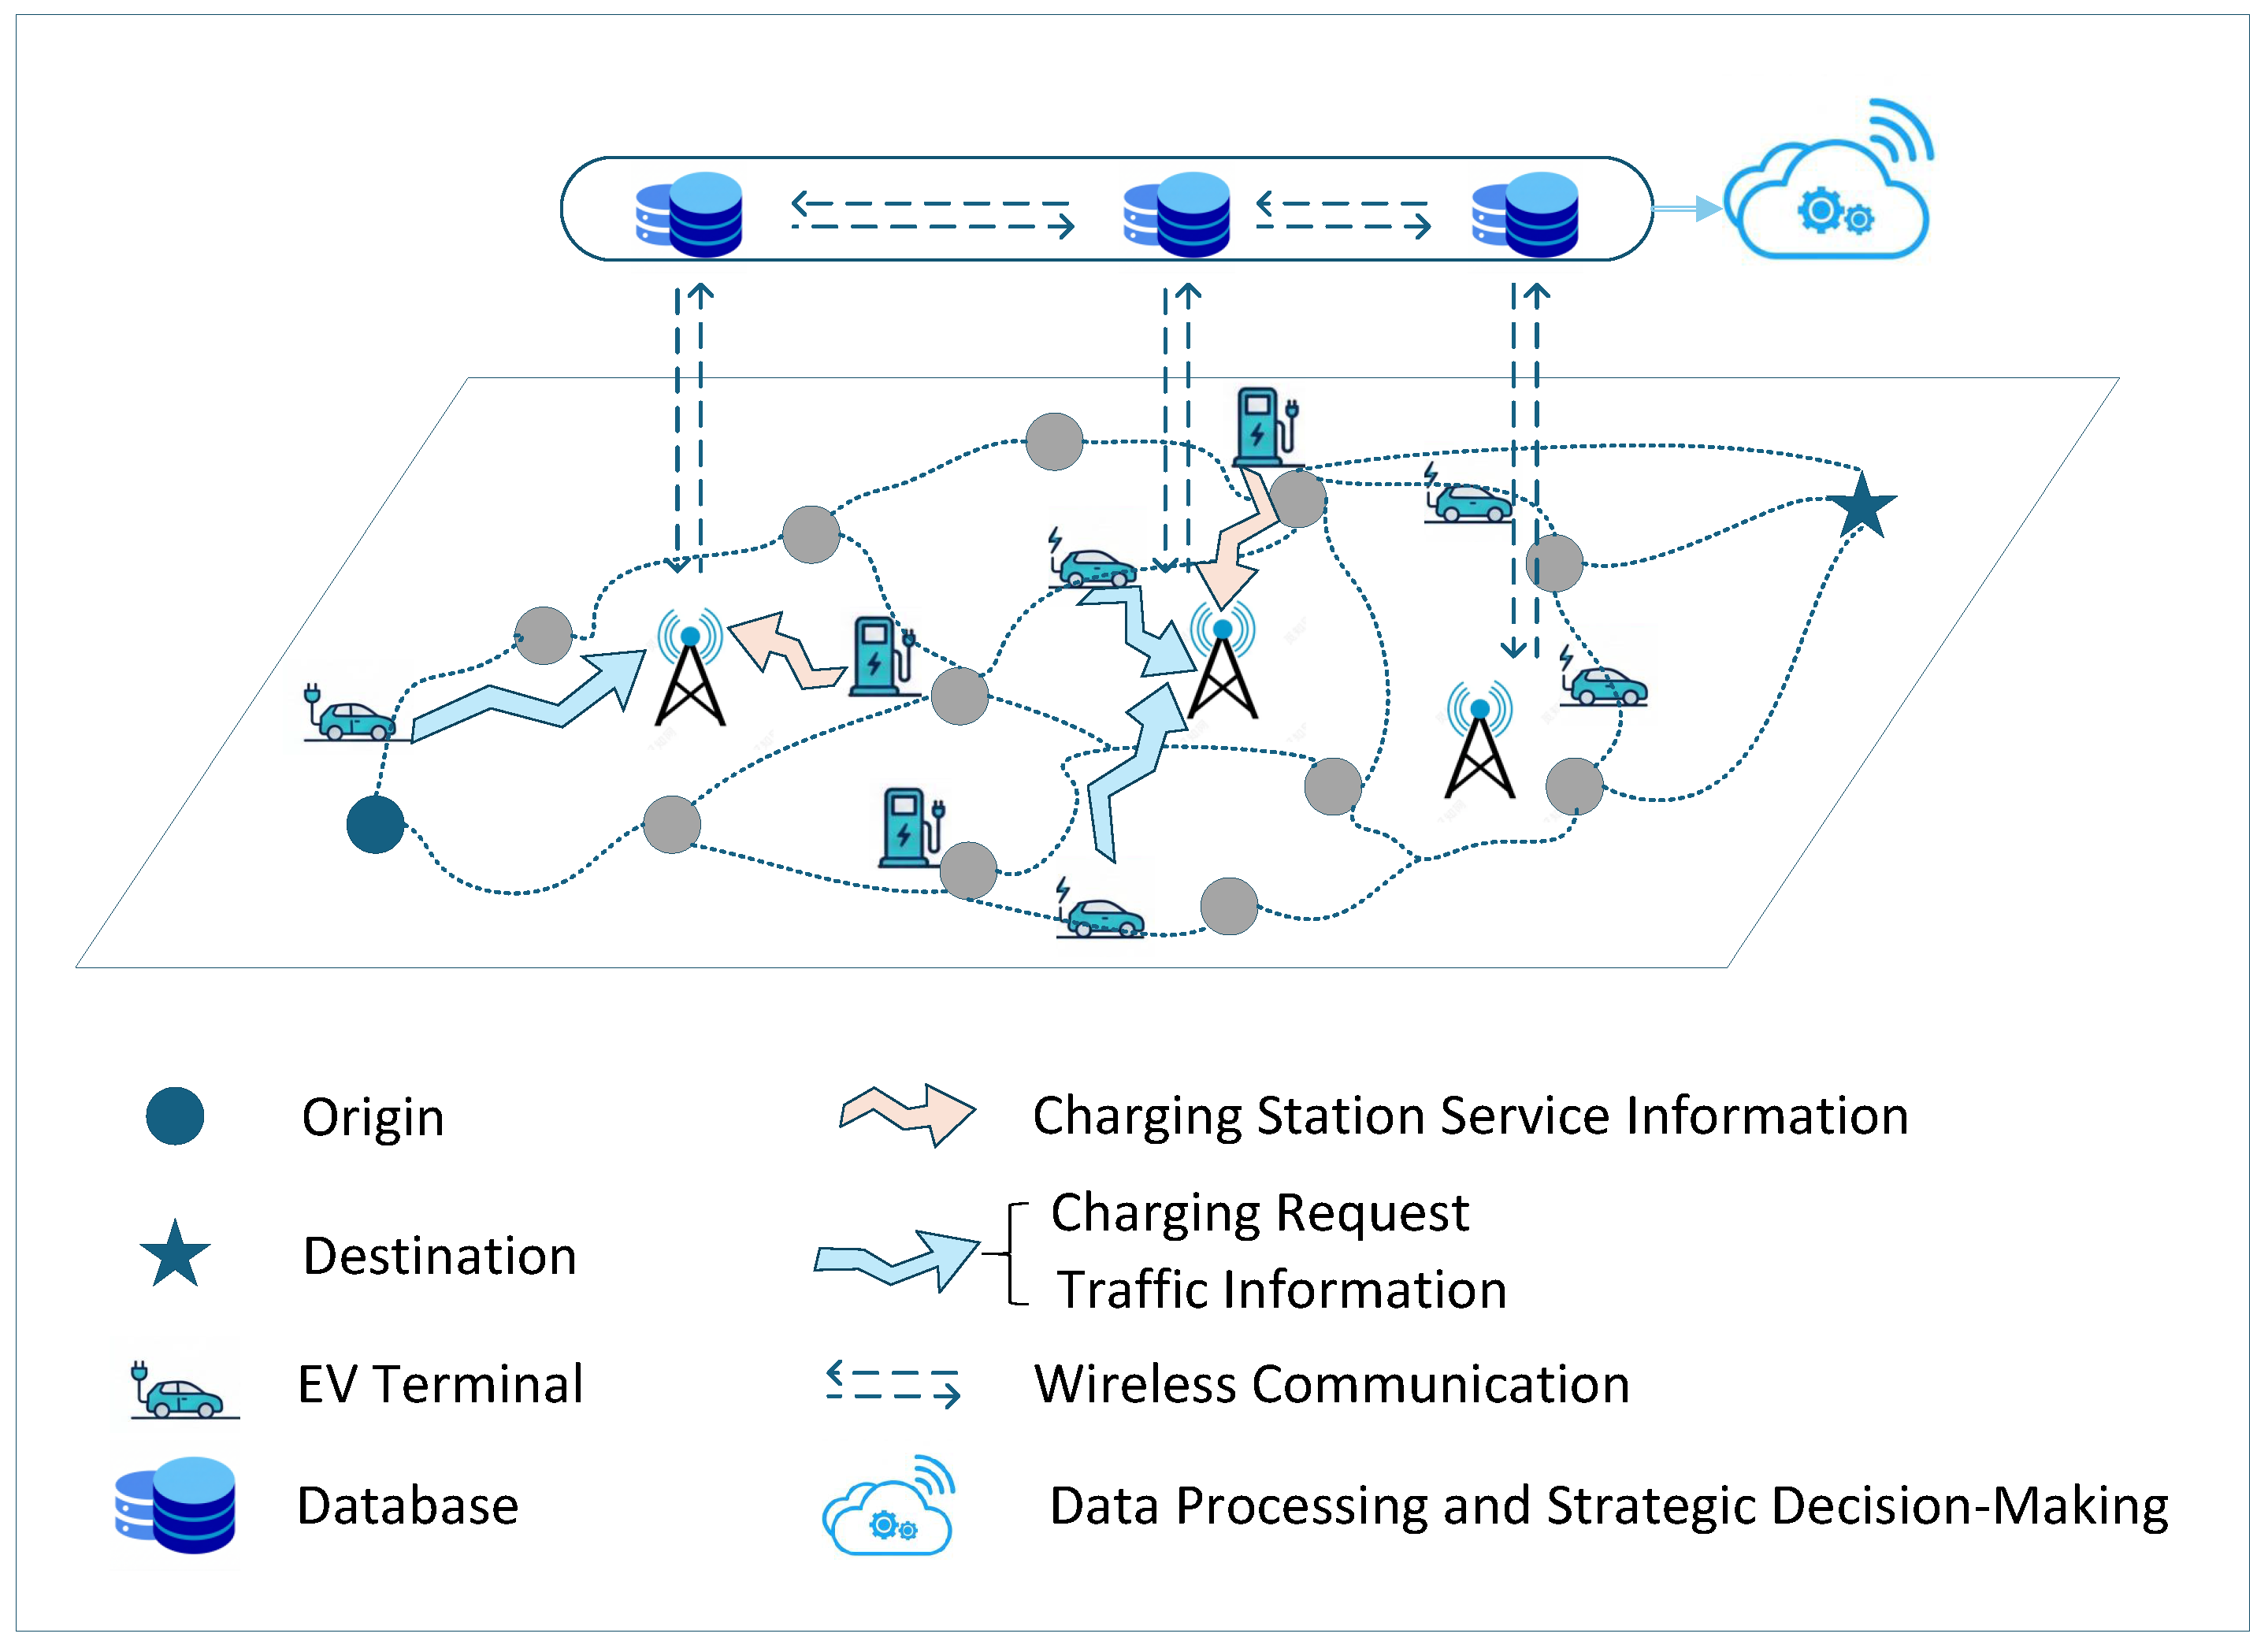
To formulate the routing and charging station selection problem for EVs, we first define the overall physical environment and the traffic–energy interactions. The architecture of the proposed traffic–energy coordination navigation framework is illustrated in Figure 1.
Figure 1.
Architecture of the proposed EV routing and charging navigation system within the traffic–energy coordination network.
The system operates within a cyber-physical environment comprising two primary layers. In the physical infrastructure layer, EVs act as mobile agents initiating their travel demands. To alleviate range anxiety, the charging task transforms traditional routing into a two-stage trip chain (). During the trip, EVs upload real-time sensory data to the centralized database via wireless communication, while candidate fast charging stations (FCSs) broadcast their dynamic service status, including queuing length.
The core of this architecture resides in the cloud-based data processing layer. By aggregating multi-source data, this center sequentially executes macro-level multi-dimensional evaluation to identify the optimal station (), followed by the micro-level routing algorithm to generate the specific trajectory. Based on this architecture, a mixed-integer nonlinear programming (MINLP) model is established below to encapsulate the optimization objectives and operational constraints.
2.2. Network Abstraction and Trip Chain Definition
The urban transportation network is abstracted as a directed graph (, where V represents the set of intersection nodes and E represents the set of directed road links connecting these nodes). Let the set of potential origins be and the set of final destinations be . Furthermore, a subset of nodes () is designated as a candidate FCS equipped to provide energy replenishment.
Each link () is assigned fixed physical attributes, including link length (), free-flow speed (), and designed road capacity (). En-route charging necessitates a paradigm shift from traditional point-to-point routing to a two-stage trip-chain formulation: , where is the optimal charging station determined by the decision-making system.
This study limits the application scenario to intra-city commuting during morning peaks. Given the battery capacities of modern EVs, a single charging event is sufficient to meet the daily mileage requirements of urban drivers. Therefore, the navigation problem is abstracted into a single-stop trip chain (). This abstraction reflects urban travel behaviors and isolates the core research focus—evaluating the spatial–temporal interactions between dynamic traffic congestion and grid-side pricing—without introducing unnecessary multi-stop permutations.
2.3. Modeling of Coordinated Traffic–Energy Dynamics
The operational status of the coupled network dynamically impacts the travel time, energy consumption, and charging costs of EVs. The physical mechanisms are modeled as follows.
2.3.1. Dynamic Traffic Flow and Energy Consumption
To capture the spatial–temporal characteristics of traffic flow, the BPR link performance function is utilized. The dynamic travel time () of any link () based on real-time traffic volume () is calculated as follows:
where represents the free-flow travel time; denotes the designed road capacity of link ; and and are the deterministic impedance parameters, typically set to and 4, respectively. Here, encompasses both the background conventional vehicle traffic and the dynamic flow of EVs.
Simultaneously, the dynamic energy consumption rate (, measured in kWh/km) on link is defined as a non-linear function of the actual travel speed ():
where is the minimum energy consumption rate achieved at the optimal economic speed (), while and k are vehicle-specific empirical coefficients reflecting the powertrain’s efficiency characteristics. By adopting an even-powered exponent (typically ), this formulation reflects the symmetric efficiency drop when deviating from the optimal speed.
2.3.2. Charging Station Queuing Dynamics
The charging station is modeled as a multi-server M/M/c queuing system. We assume that the arrival of EVs follows a Poisson process with an average arrival rate of and that the charging service duration for each EV follows an exponential distribution with a service rate of . For a station (S) equipped with fast-charging plugs, the service intensity is defined as (with ensuring system stability). The probability of an empty system () is determined by the Erlang C formula:
By applying Little’s Law, the expected queuing waiting time () for a newly arrived EV at charging station (S) is derived as follows:
2.3.3. Congestion-Driven Dynamic Pricing Mechanism
To proactively guide traffic flow and establish a quantitative link between the energy grid and the transportation network, a real-time load index () is formulated. By fusing physical plug occupancy (reflecting grid-side capacity limits) and latent queuing pressure, this index acts as a crucial feedback mechanism:
where is a penalty coefficient. The system then generates a dynamic adjustment factor (, where is the baseline threshold and is the price sensitivity coefficient). The dynamic service price is fundamentally expressed as follows:
To prevent unbounded price fluctuations, this dynamic price is strictly subject to a regulatory boundary constraint:
where and represent the established lower and upper pricing limits. Operationally, this economic mechanism is executed via a centralized cloud-based architecture. A pricing center aggregates global station data to compute and update the dynamic service tariff at an adequate resolution, ensuring high-fidelity responsiveness to real-time traffic dynamics.
2.4. Mathematical Problem Formulation
Based on the dynamic models established above, the EV routing and charging station selection problem is formulated as a mixed-integer nonlinear programming (MINLP) model. The objective is to simultaneously identify the optimal charging station () and the corresponding micro-trajectory () to minimize the comprehensive generalized cost.
2.4.1. Objective Function and Multi-Dimensional Cost Quantification
The objective function evaluates the generalized cost of each potential trip chain (). It integrates multi-dimensional costs—time, estimated monetary, spatial detour, and indirect carbon emission costs—structured as follows:
where is a binary decision variable indicating whether charging station S is selected () or not () and represent the normalized global user preference weights. The four core cost components are quantified as follows:
(1) Comprehensive Time Cost (): This integrates dynamic travel time, queuing time, and actual charging time:
where , and are time conversion coefficients; represents the initial state of charge; is the target state of charge after replenishment; is the physical battery capacity; represents the charging efficiency; and is the rated charging power of the station.
(2) Estimated Monetary Cost (): This evaluates the estimated monetary expense by calculating the cost to replenish the dynamic energy consumed across the macroscopically estimated trip chain at the station’s real-time price:
(3) Spatial Consistency Penalty (): To penalize secondary detours within the trip chain, the absolute detour distance () is mapped to an exponential penalty cost:
where is a spatial scale parameter.
(4) Indirect Carbon Emission Cost (): This integrates the regional grid emission factor () with the total dynamic energy consumption for the trip:
2.4.2. System Constraints
The optimization objective is subject to the following physical and network constraints:
(1) Uniqueness Constraint of Station Selection: An EV must select exactly one charging station during the trip chain:
(2) Battery State-of-Charge () Constraints: The EV’s remaining energy must remain above the safety threshold () upon arrival at the station (S) and the final destination (D). Energy consumption utilizes an expected rate of , where is a safety-margin coefficient:
(3) Traffic Network Flow Conservation Constraints: For the microscopic routing on graph , flow conservation is maintained for any node :
where indicates whether link is selected in the planned trajectory.
3. Two-Stage Solution Methodology
The MINLP model formulated in Section 2 is inherently NP-hard due to the spatial–temporal coupling of non-linear continuous variables and integer routing variables. Solving it directly via exact mathematical solvers such as MILP via CPLEX (Version 20.1.0) or Gurobi (Version 13.0) ensures global optimality but introduces exponential computational complexity in dynamic large-scale networks. Therefore, this paper proposes a computationally efficient and preference-aware two-stage heuristic framework to decouple the problem and approximate the Pareto-optimal solution.
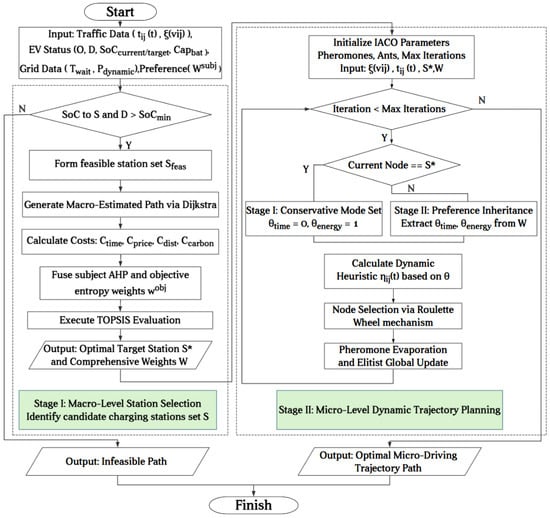
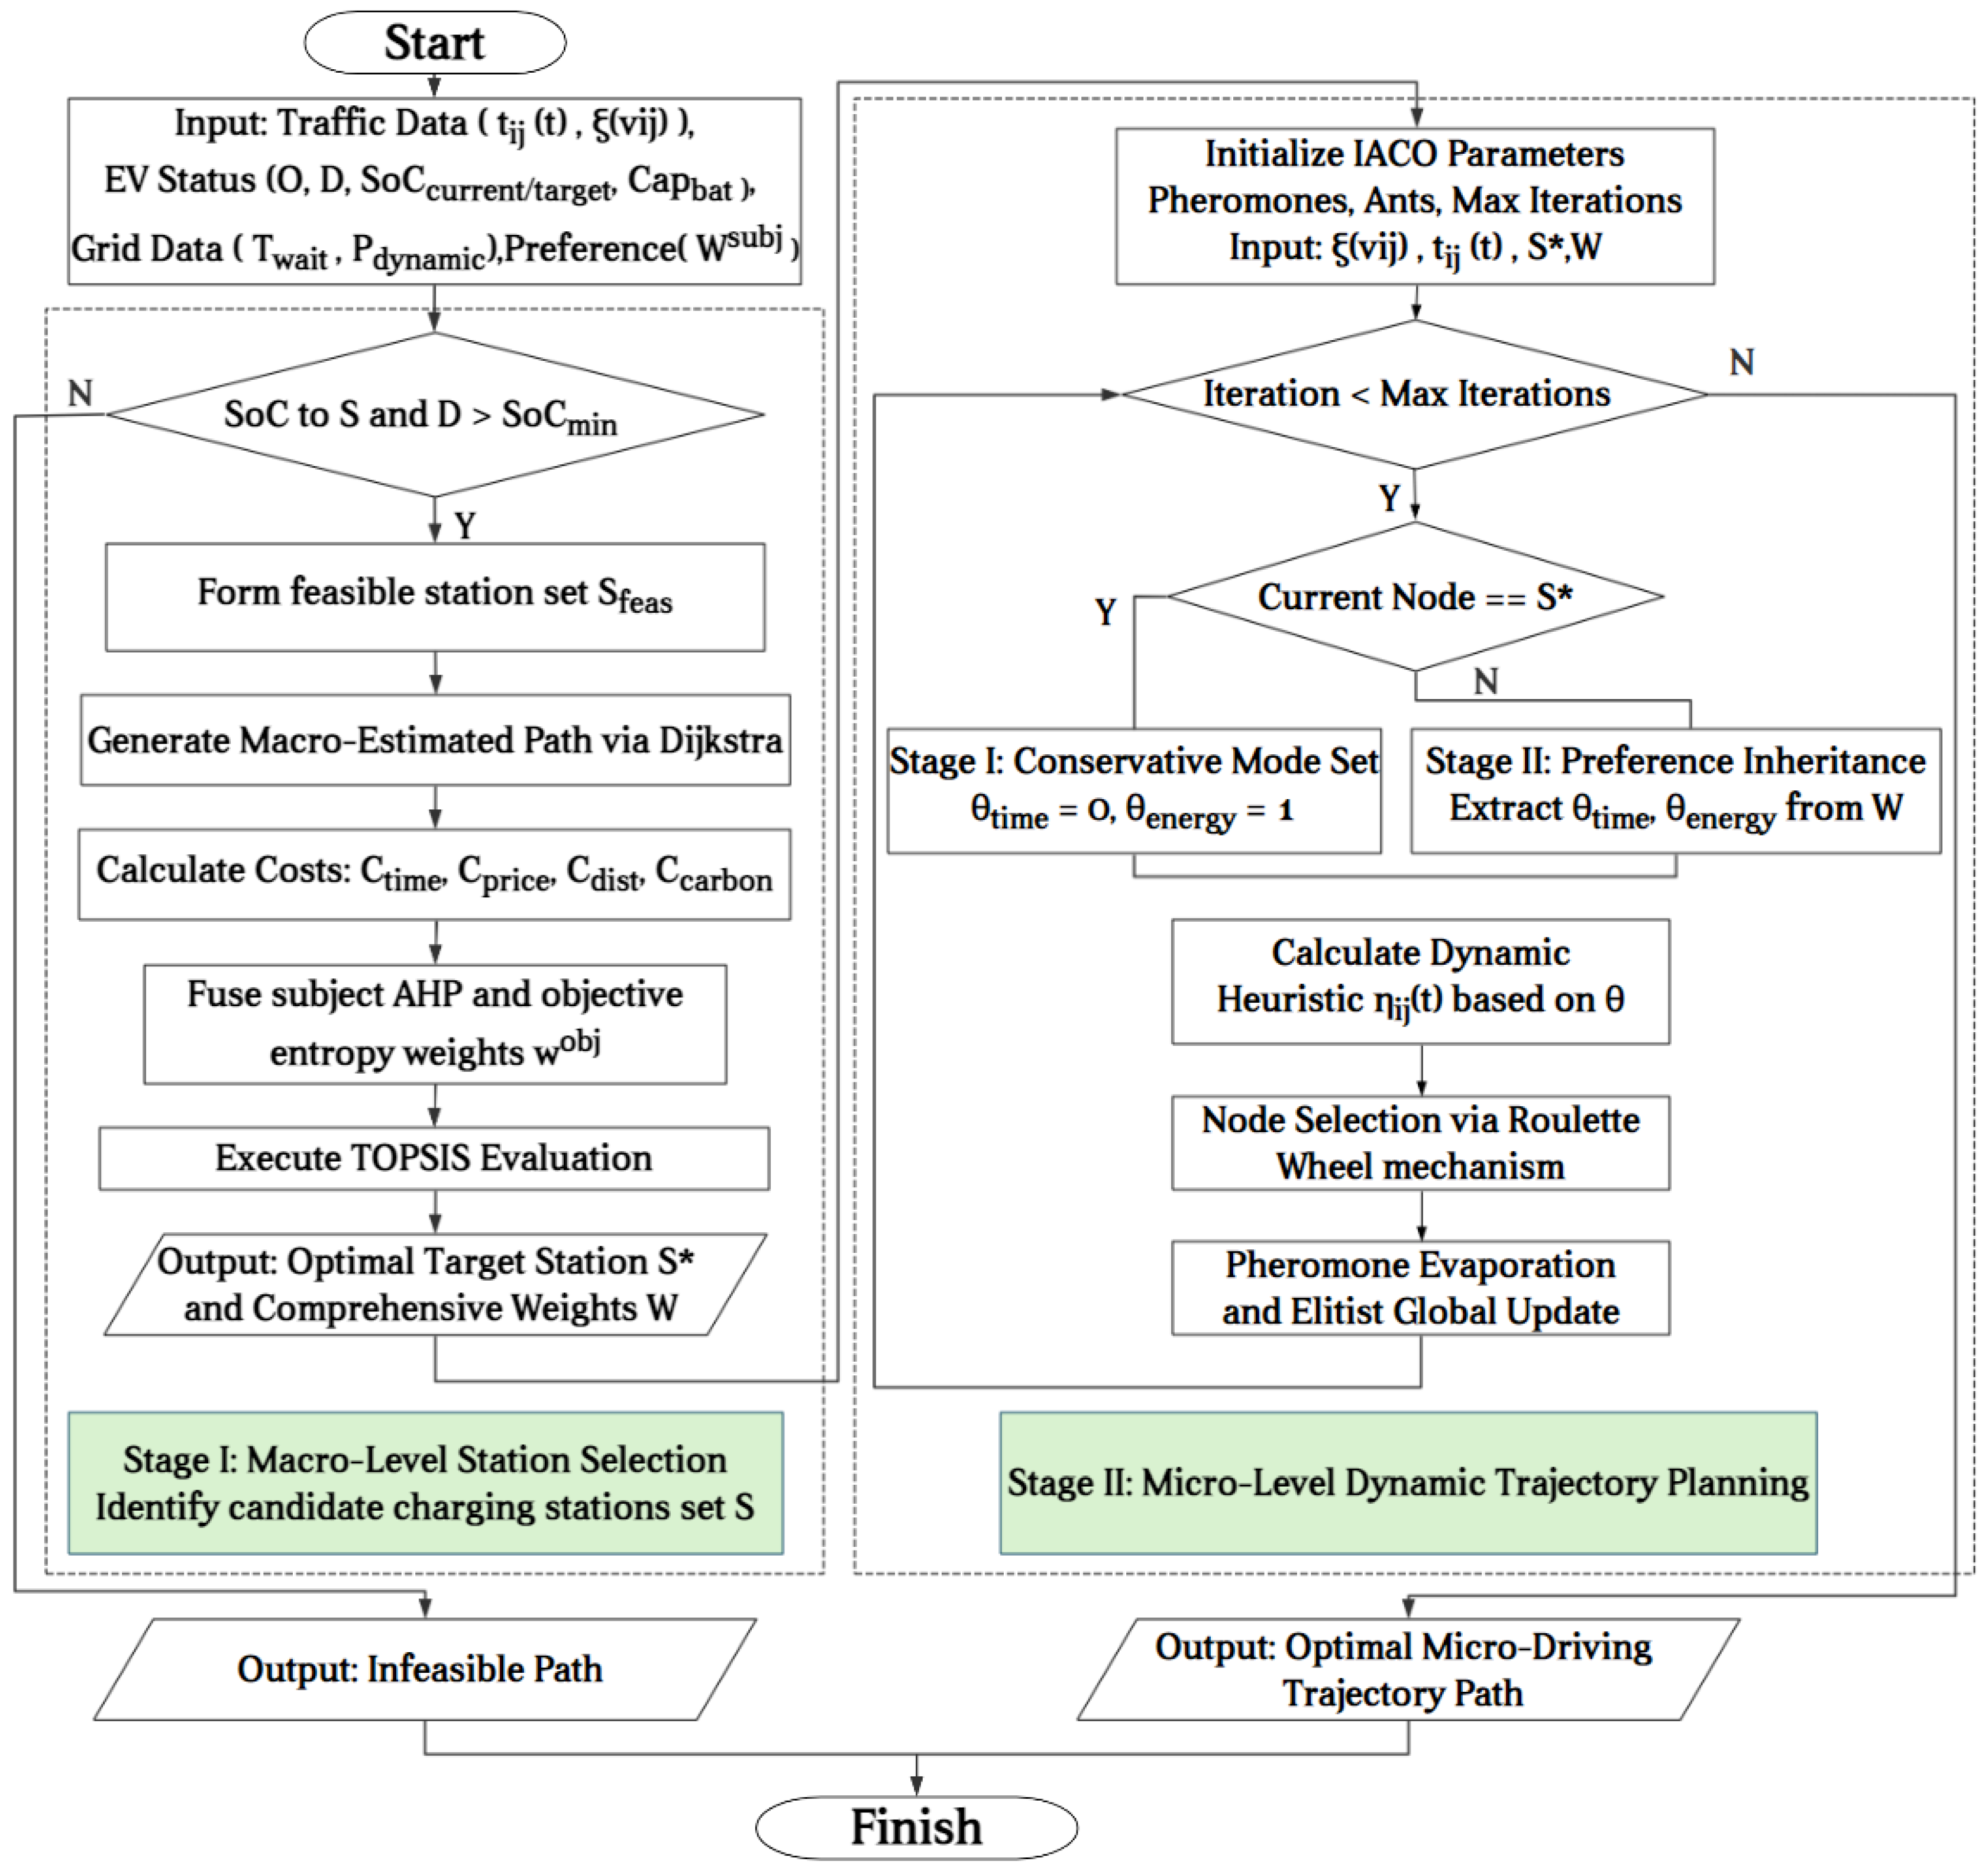
To illustrate the execution logic and cross-layer interaction, the algorithmic flowchart is presented in Figure 2. The process operates sequentially: Stage I executes macro-level station evaluation, and Stage II performs micro-level trajectory planning.
Figure 2.
Flowchart of the two-stage EV routing and station selection algorithm, illustrating the transition from macro-level AHP–Entropy–TOPSIS evaluation to micro-level IACO trajectory planning.
3.1. Stage I: Macro-Level Station Selection Based on AHP–Entropy–TOPSIS
In the first stage, prior to the detailed evaluation, a reachability pre-screening is conducted based on the constraints (Equations (14) and (15)) to filter out geographically infeasible stations. For the remaining valid candidates, since the real-time microscopic underlying trajectories have not yet been generated, the system utilizes a “Macro-Estimated Path” () generated via the Dijkstra algorithm—weighted by the real-time dynamic travel time ().
Subsequently, the system substitutes this macroscopic estimated path into the four cost formulas defined in Section 2.4.1 to calculate the estimated costs for each candidate station, constructing the initial decision matrix.
Since these four evaluation criteria have different dimensions and all represent cost attributes, a reversed min–max normalization is applied to construct the positive decision matrix ():
To balance subjective input with objective data variance, the subjective weight vector () from AHP and the objective weight vector () from the entropy weight method are fused to form the comprehensive weight ():
The weighted normalized decision matrix () is obtained as . The Euclidean distances from the i-th candidate station to the positive ideal solution () and negative ideal solution () are computed as
yielding the relative closeness (). The station satisfying is selected as the optimal target, and this result, along with the comprehensive weight vector (), is explicitly passed to Stage II to guide the microscopic routing.
3.2. Stage II: Micro-Level Dynamic Trajectory Planning Based on IACO
Once is determined, an IACO algorithm (Algorithm 1) is activated to perform microscopic trajectory planning. The driving trajectory is decoupled into two stages to manage battery constraints and inherit user preferences.
(1) Charging Routing (): Operating under a low , IACO enforces a minimum-energy heuristic () to prevent mid-journey battery depletion.
(2) Destination Routing (): With replenished energy, this stage inherits the multi-dimensional preferences from Stage I. In this micro-routing phase, the dynamic charging price becomes a sunk cost, rendering the economic weight () inactive for the remainder of the trip. Similarly, the spatial detour penalty () acts as a macro-level constraint for the entire chain; for point-to-point micro-routing, optimizing dynamic time and energy naturally limits spatial deviation, making an explicit detour weight redundant. Consequently, the algorithm normalizes the comprehensive time weight () and the environmental weight () to generate the preference guidance factors:
The dynamic heuristic function from node i to node j () is reconstructed as a non-linear fusion:
where and represent the normalized dynamic travel time and the normalized dynamic energy consumption of link , respectively. Specifically, to maintain strict mathematical consistency with the comprehensive economic cost defined in Stage I, the absolute dynamic energy consumption intrinsically captures the congestion-induced energy dissipation, derived as . To prevent magnitude dominance between the temporal and energy dimensions, both the absolute travel time () and the energy () are scaled to the dimensionless interval via min–max normalization prior to integration. This formulation consistently guides the algorithm to bypass highly congested segments, simultaneously optimizing temporal efficiency and operational costs.
During the routing process, the state transition probability () for the k-th ant moving from node i to node j follows the pseudo-random proportional rule:
where is the pheromone concentration and and are control factors. To accelerate convergence, an elitist ant strategy is employed:
where is inversely proportional to the generalized cost () of the globally optimal path in the current generation. Once the IACO algorithm converges, the optimal microscopic trajectory is finalized, completing the two-stage navigation framework.
Furthermore, while the proposed framework is instantiated for a single-stop charging scenario to match the urban commuting context, its underlying mathematical logic is extensible. The two-stage decision process serves as an “atomic decision unit”. For intercity travel requiring multiple energy replenishments, the framework can be executed recursively. Specifically, upon reaching the first optimal station (), this node updates to the new origin () for the subsequent trip segment, enabling multi-stop route generation () without structural alterations to the core architecture.
| Algorithm 1 Micro-Level Dynamic Trajectory Planning based on Preference-Inheriting IACO |
|
4. Simulation Setup and Case Study
4.1. Simulation Parameters and Scenario Initialization
The classic Sioux Falls network is selected as the simulation testbed to evaluate the proposed multi-dimensional decision-making framework and the IACO routing algorithm. Its macroscopic network topology, baseline link capacities, and free-flow times are sourced from standard open-source transportation datasets. Although large-scale real-world networks better reflect actual engineering environments, their complexity can obscure the underlying operational mechanisms of heuristic algorithms. Therefore, the Sioux Falls network, comprising 24 nodes and 76 links, provides a balance between network complexity and benchmark comparability.
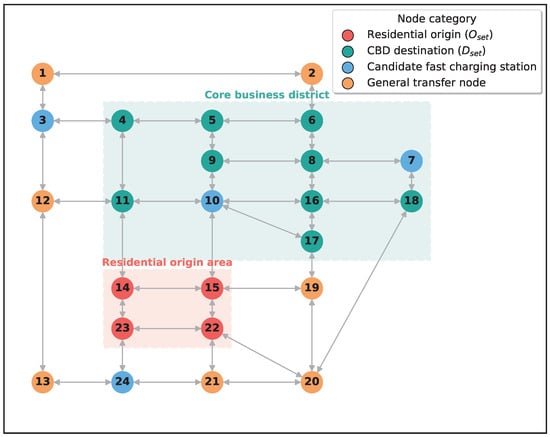
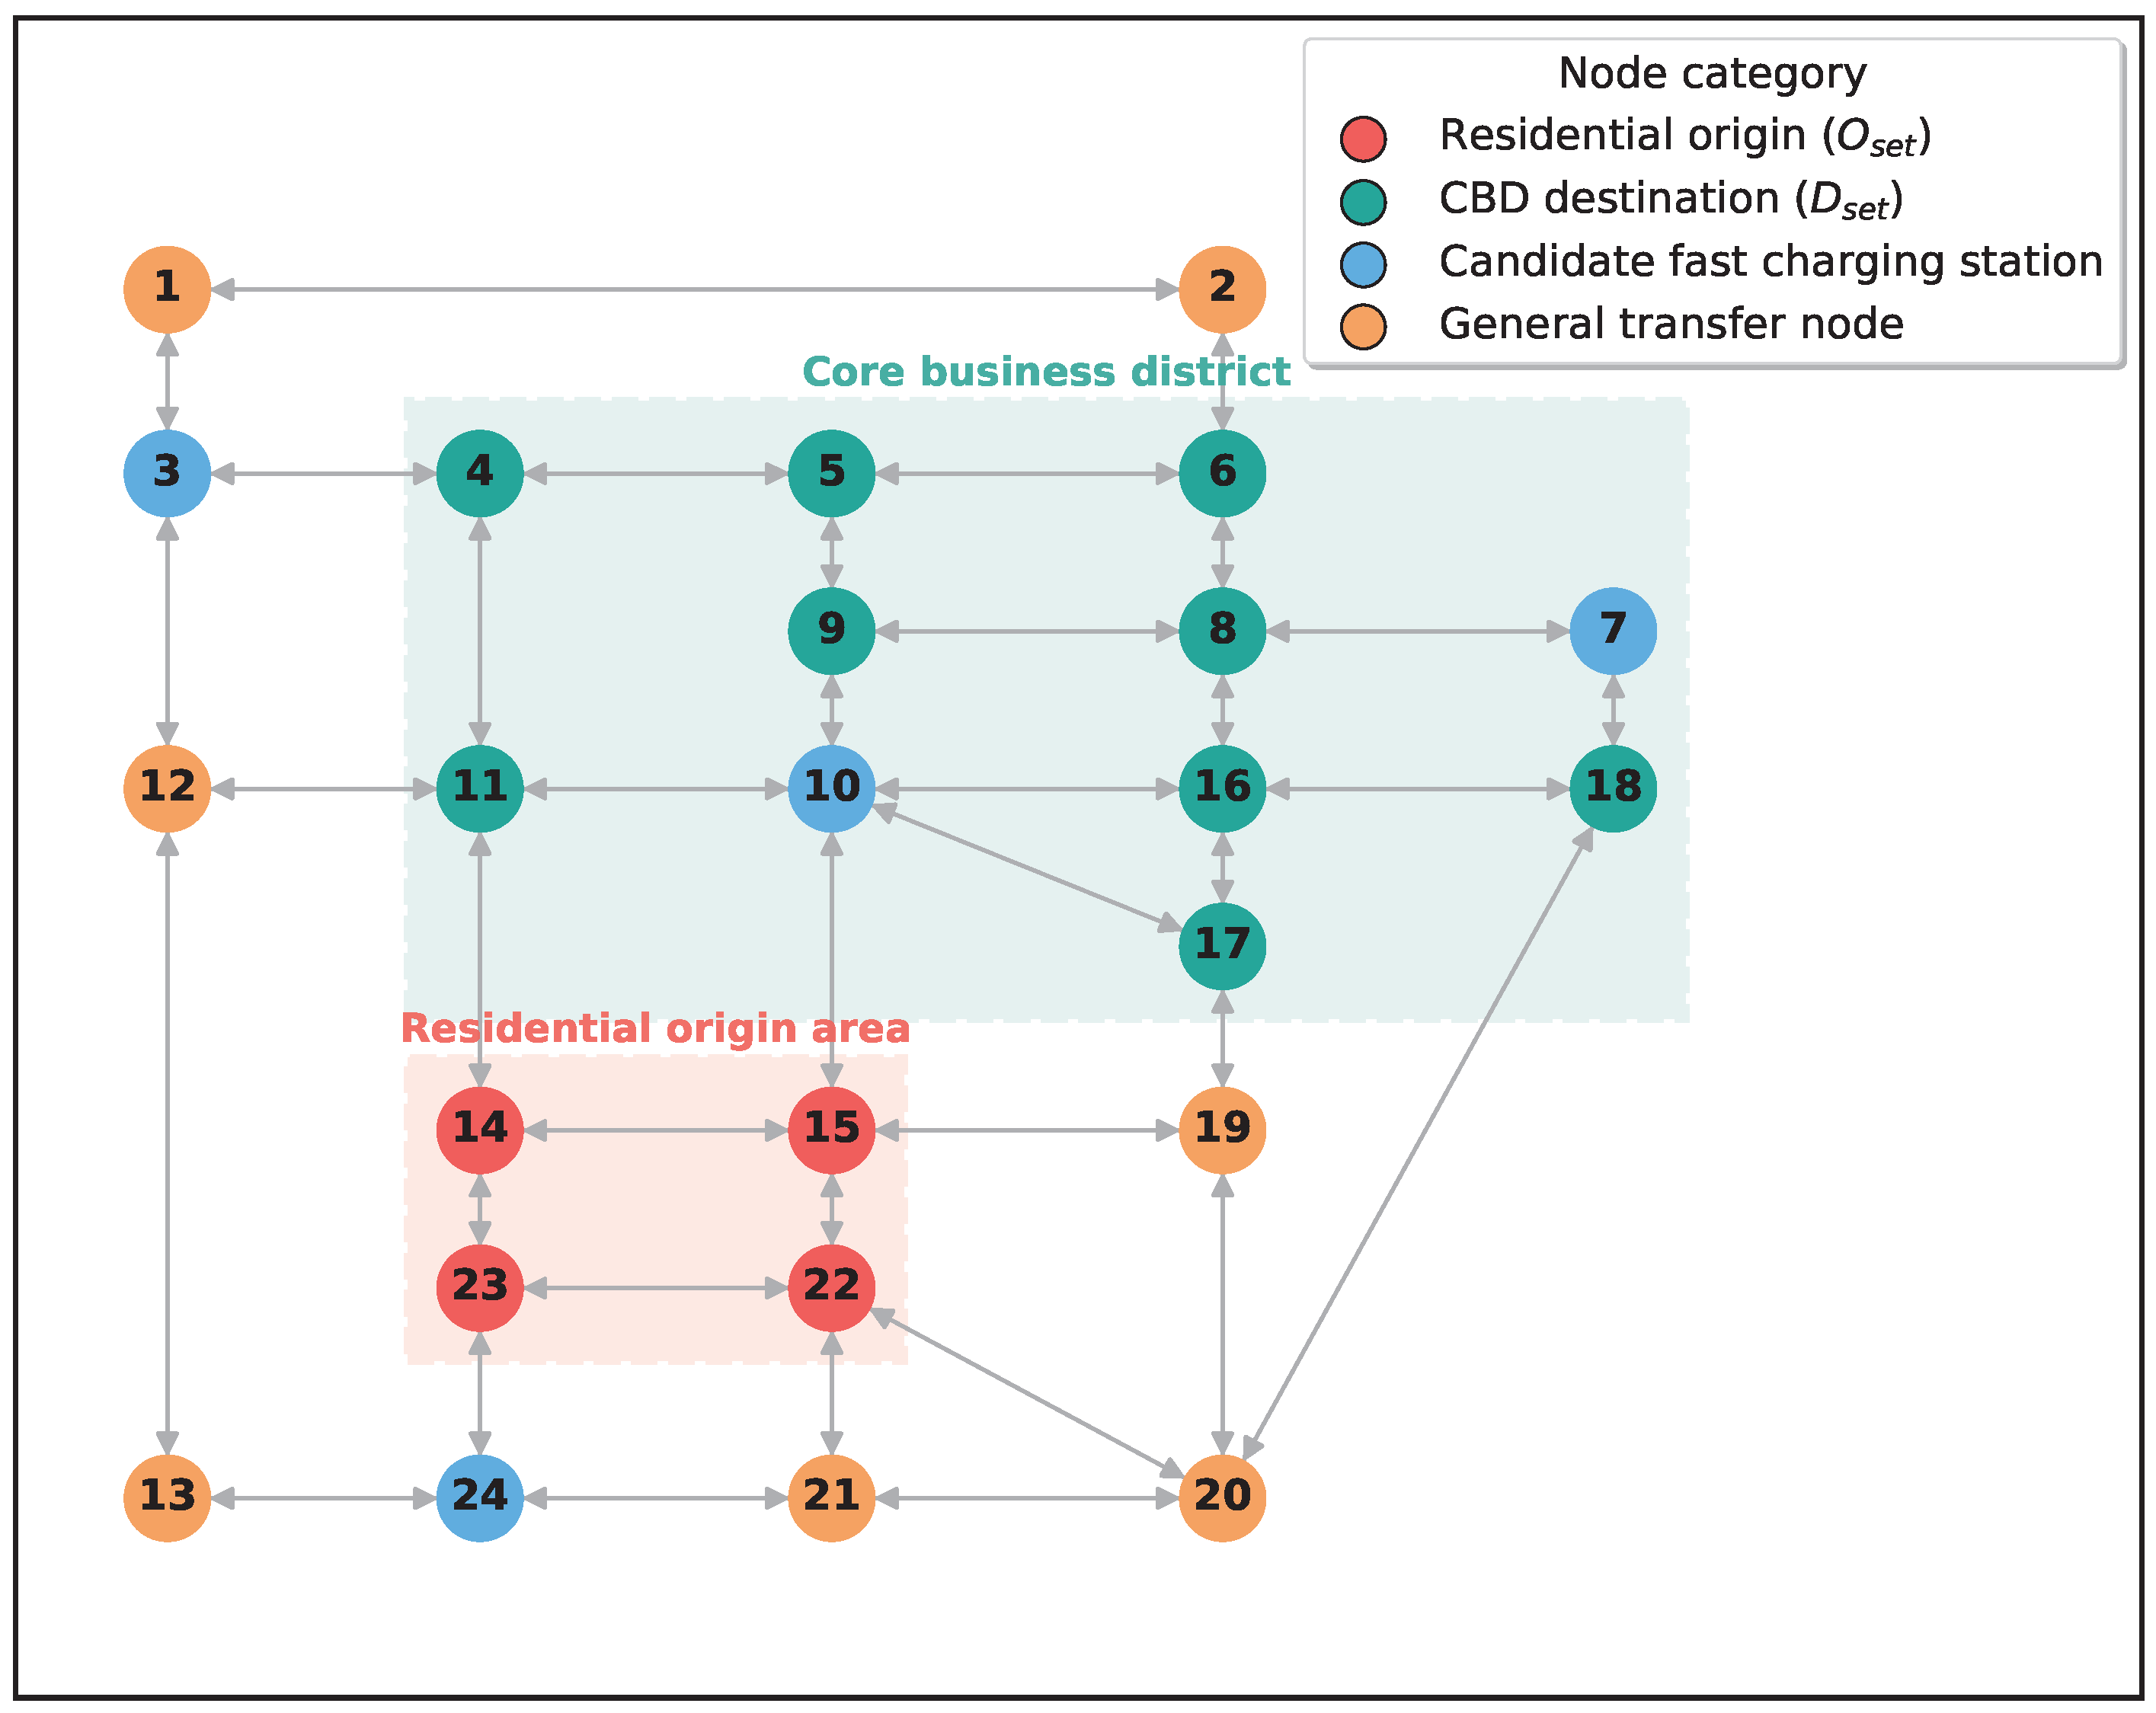
Based on the topological characteristics of this network and the typical commuting patterns of urban morning peaks, an EV travel simulation scenario with specific origin–destination (O–D) mapping is constructed. To induce the non-linear congestion effects of the BPR function and simulate a realistic morning peak, a global scaling factor is applied to the baseline O-D flow data. The network is functionally partitioned as follows (as shown in Figure 3):
Figure 3.
Topology of the 24-node Sioux Falls transportation network, showing the distribution of origins, destinations, and candidate fast-charging stations.
- Residential Origin Set (): Nodes on the periphery are selected as concentrated departure points, i.e., .
- Central Business District (CBD) Destination Set (): Highly dense nodes in the central–northern region act as workplaces, i.e., .
To evaluate the dynamic pricing and spatial consistency mechanisms, four representative nodes are selected for FCS deployment, forming a distinct spatial load gradient:
- Core Destination Station (Node 10): Located in the core CBD, bearing extreme traffic loads;
- Commuting Gateway Station (Node 7): Located on an essential arterial road;
- En-route Overflow Station (Node 3): Located at the northern edge, serving as a detour alternative;
- Reverse Induction Station (Node 24): Located at the southern periphery, acting as a highly idle control group.
To ensure a realistic representation of near-future urban mobility, we implement a mixed traffic flow environment where the global EV penetration level is set at 30%. The remaining 70% of the traffic volume consists of conventional internal combustion engine vehicles (ICEVs), which collectively contribute to the background road impedance.
The simulation covers a 120 min morning peak period (07:00–09:00). The arrival of EVs requiring charging services follows a non-homogeneous Poisson process, with the arrival rate () modeled by a Gaussian-like distribution peaking at min:
To ensure the reproducibility of the numerical experiments, the physical parameters of the EVs, the dynamic traffic–energy environment, and the IACO hyperparameters are explicitly defined. Although the framework supports dynamic charging-time calculations based on the individual SoC of each vehicle, for the baseline evaluation, we assume a uniform target charging demand of 40 kWh per vehicle and a base service duration of 30 min at the FCS. This standardization isolates the non-linear interference of individual battery management systems (BMSs), allowing for a controlled comparison of algorithmic routing performance across the network topology. The settings of the specific parameters and boundary conditions are summarized in Table 1.
Table 1.
Comprehensive simulation parameters and operational constraints.
4.2. Macro-Analysis of Dynamic Pricing and Spatial Load Balancing
To evaluate the dynamic pricing mechanism in alleviating spatial–temporal charging congestion, a continuous 120 min macro-simulation representing a typical morning peak (07:00 to 09:00) is conducted. Vehicle arrivals follow a non-homogeneous Poisson process with a bell-shaped rate that peaks at the 60th minute. To reflect traffic heterogeneity, EVs are stochastically generated with various preference profiles and subsequently evaluated by the AHP–Entropy–TOPSIS decision engine.
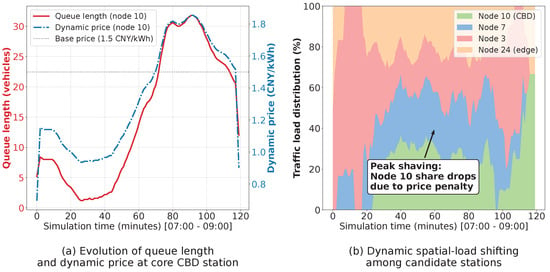
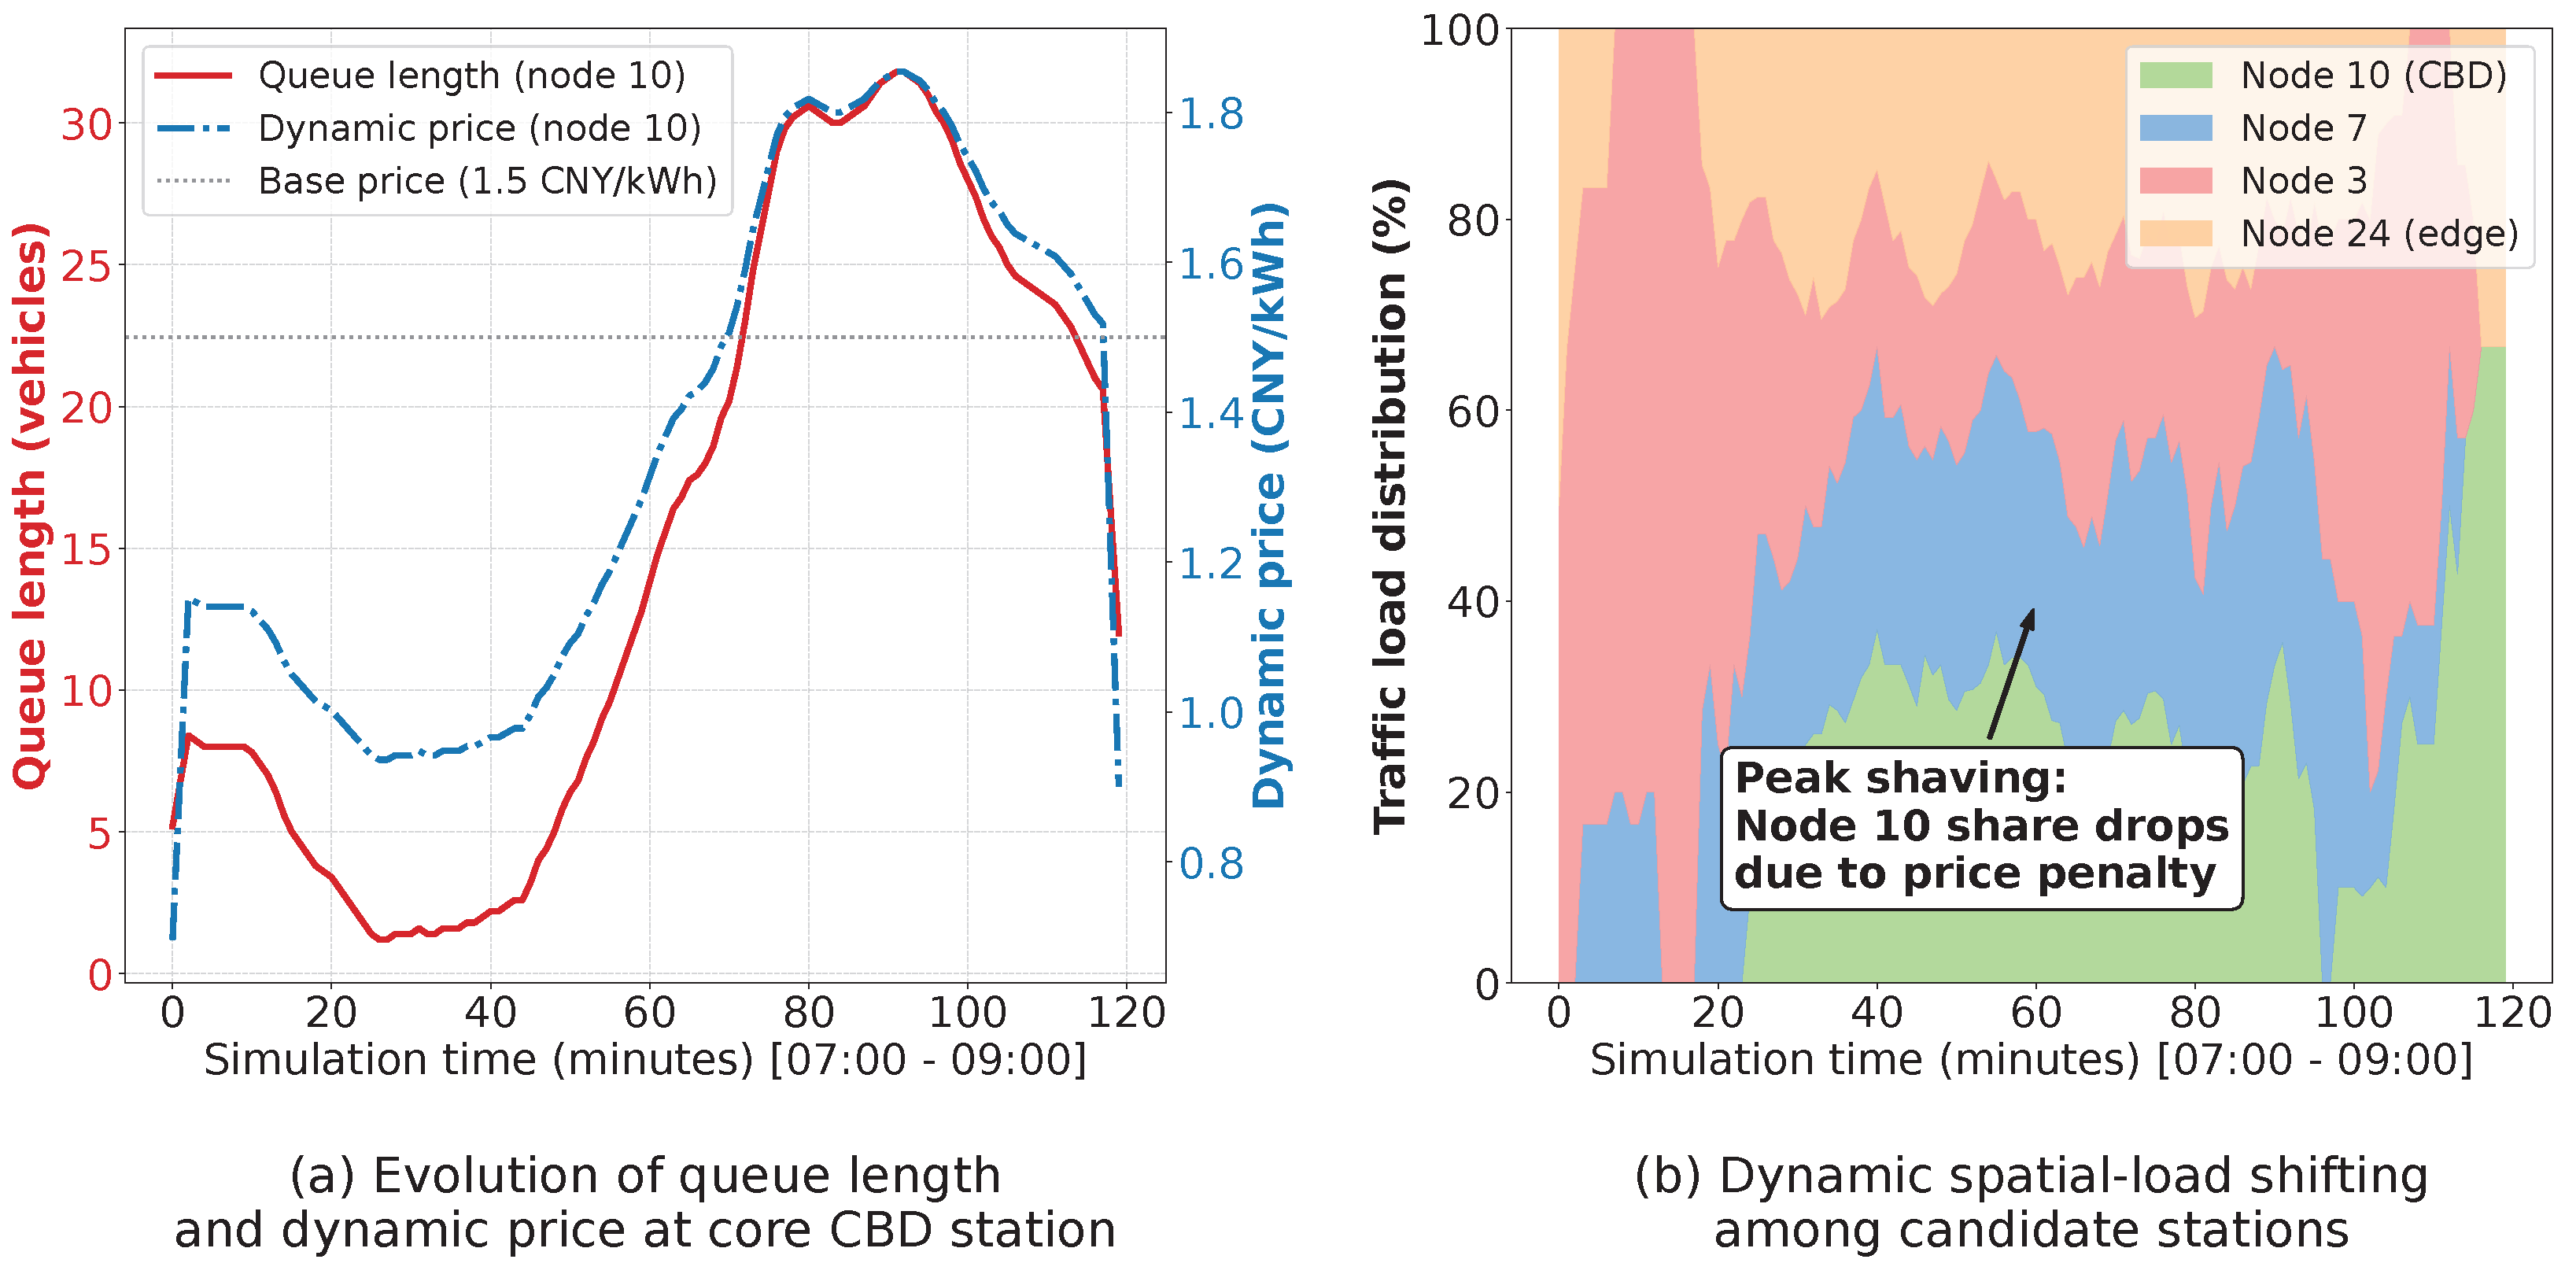
Figure 4 illustrates the system’s macroscopic dynamic response to the surging demand. Specifically, Figure 4a tracks the temporal evolution of the queue length and dynamic service price at the core CBD station (Node 10). During the initial 30 min off-peak phase, the queue remains manageable, and the dynamic price stays close to the base tariff of 1.5 CNY/kWh. However, as the morning commute peaks, the influx of EVs causes the queue at Node 10 to surge. Triggered by the real-time load index, the pricing mechanism imposes a progressive penalty. The queue length is capped at approximately 30 vehicles as the price reaches a local maximum of 1.8 CNY/kWh, demonstrating that this economic lever limits unbounded queuing.
Figure 4.
Evaluation of the dynamic pricing and spatial load-balancing mechanism. (a) Dynamic price response to queue-length variations at the core CBD station (Node 10). (b) Spatial load shifting, illustrating peak shaving at the core node and valley filling at peripheral stations.
To explicitly demonstrate the spatial load-balancing effect, the dynamic market share of the charging stations is visualized in Figure 4b. Before heavy congestion builds during the first 20 min, the vast majority of EVs select Node 10 due to its proximity to CBD destinations, resulting in a dominant market share (indicated by the light-green area).
However, driven by economic preferences, highly price-sensitive users gradually abandon the overloaded core station as dynamic tariffs increase. This leads to a visible reduction in Node 10’s market share, demonstrating a distinct “peak-shaving” effect. Concurrently, the diverted charging demand is effectively guided to peripheral alternatives, including gateway Node 7 (blue area), en-route Node 3 (red area), and remote Node 24 (yellow area), thereby achieving a corresponding “valley-filling” effect across the network. By leveraging the price elasticity of diverse users, the system successfully alters the rigid nearest-station principle to facilitate proactive spatial load balancing.
4.3. Micro-Analysis of Preference-Driven Station Selection and Trajectory Evolution
Following the macroscopic validation of load balancing in Section 4.2, this section evaluates the framework at the microscopic execution level. It analyzes how the integrated models tailor station selection and two-stage routing trajectories for individual EVs with varying behavioral preferences.
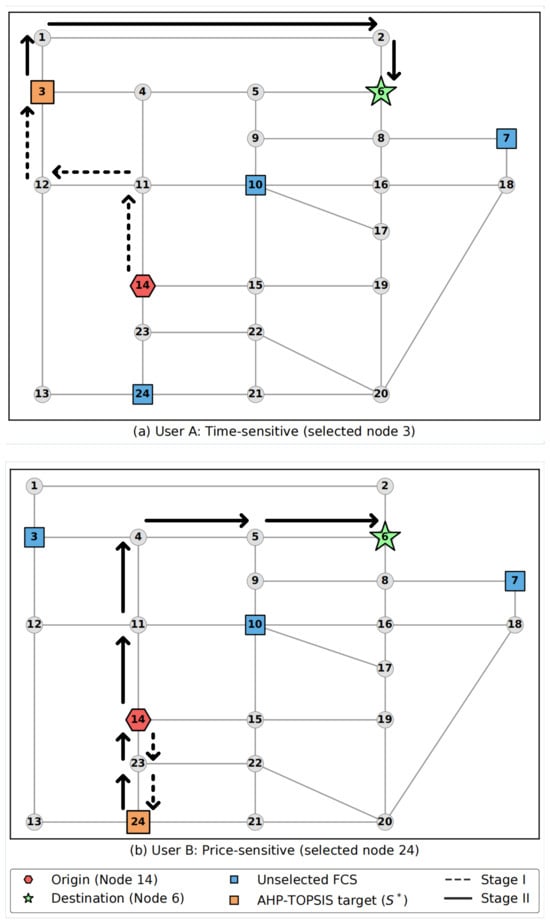
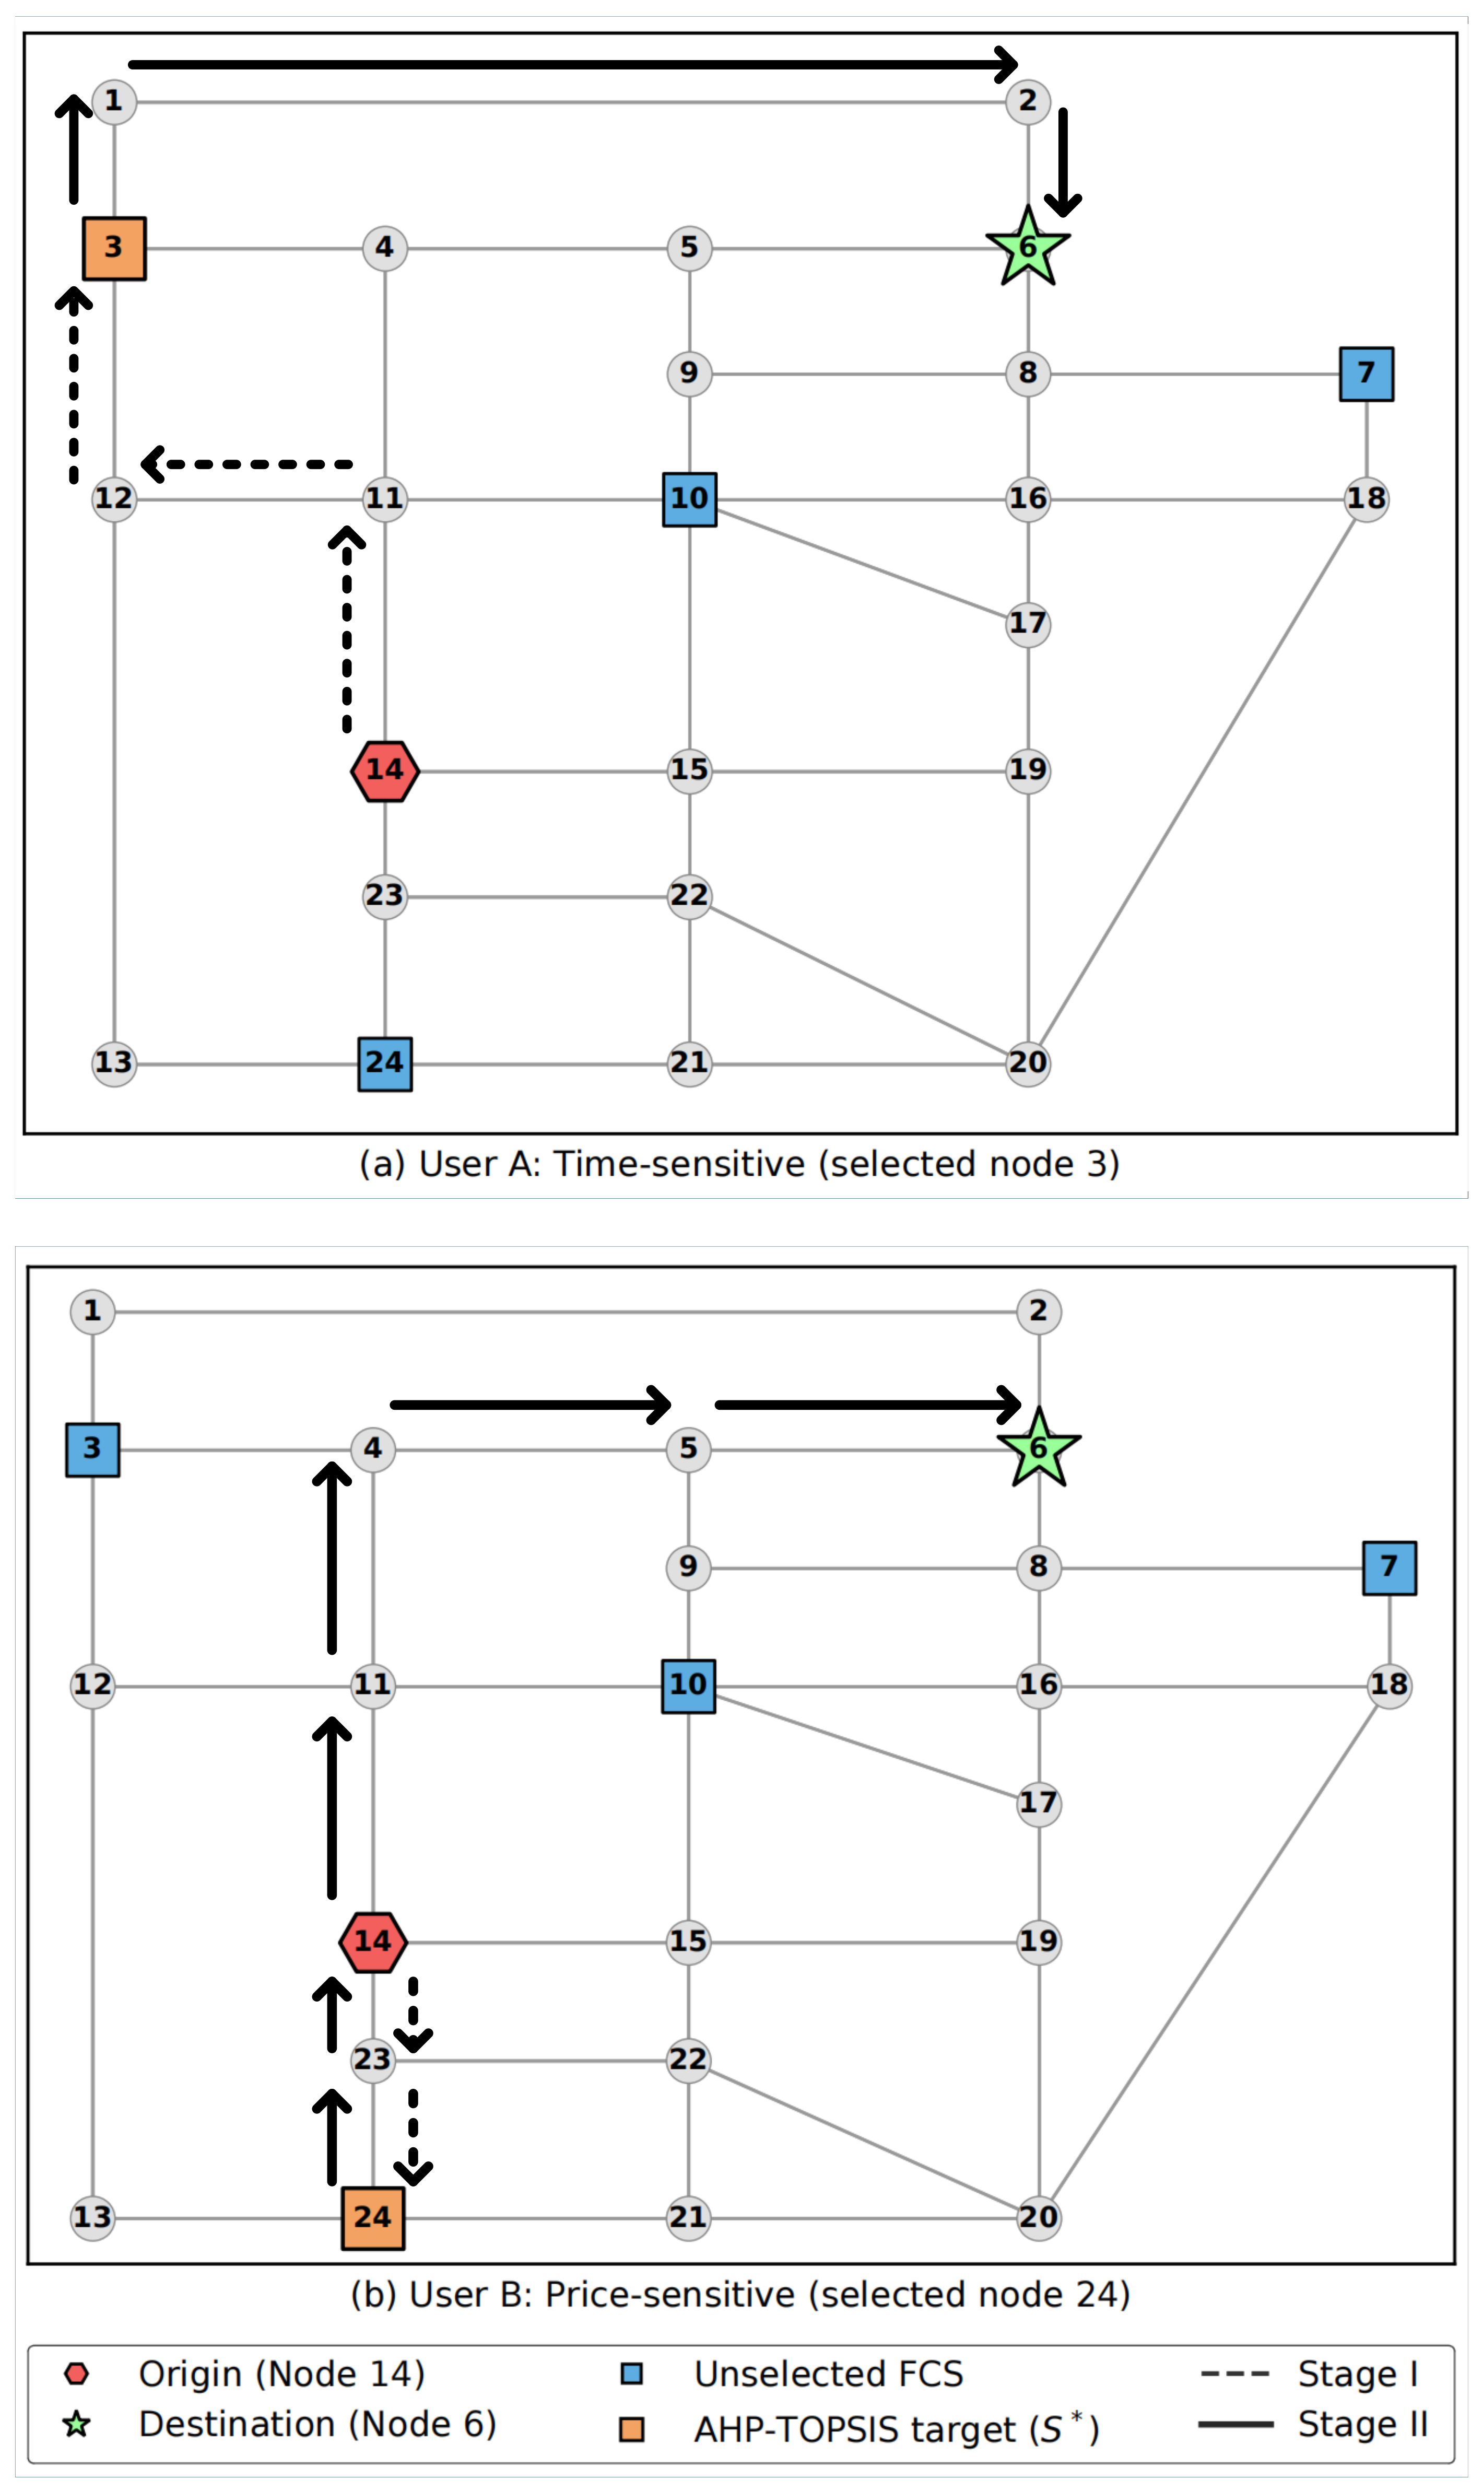
A comparative case study is designed with two representative users departing from the same residential origin (Node 14, ) and traveling to the same CBD destination (Node 6, ). User A is modeled as a time-sensitive commuter with a dominant time-preference weight of . Conversely, User B represents a price- and energy-sensitive driver assigned a dominant economic weight of . Figure 5 illustrates the complete two-stage trip chains generated for both users.
Figure 5.
Two-stage trip chains generated by the integrated framework. (a) User A selects Node 3 via a congestion-avoidance outer loop. (b) User B selects Node 24 via a minimum-energy inner route.
(1) Target Station Selection (AHP–Entropy–TOPSIS Level): Faced with congestion and peak-hour price penalties at the nearest CBD station (Node 10), the two users exhibit divergent station selections driven by their disparate preference weights. User A avoids the long queue at Node 10 and is guided to the en-route overflow station (Node 3). Node 3 presents a compromise, offering minimal queuing time without a significant spatial detour. In contrast, User B selects the reverse induction station (Node 24). Although Node 24 requires a detour away from the destination, its high availability offers dynamic price discounts. This aligns with User B’s economic preference, offsetting the spatial penalty defined in the evaluation matrix.
(2) Stage I Routing—Energy-Conserving Path (IACO Level): Regardless of their subjective preferences, both EVs operate under a low state of charge during Stage I (from the origin to the selected FCS). Enforcing the cross-layer preference inheritance mechanism, the IACO algorithm overrides the user-specific weights and adopts a minimum-energy heuristic () to prevent mid-journey battery depletion. As depicted by the dashed lines in Figure 5, both users travel along the most direct topological paths to their respective chargers. User A follows the sequence of , while User B proceeds directly south via .
(3) Stage II Routing—Preference-Driven Path (IACO Level): Once recharged at the FCS, the EVs enter Stage II (from the FCS to the final destination). In this stage, the IACO algorithm integrates the users’ initial high-level preferences into the dynamic heuristic function, resulting in distinct routing behaviors.
For User A (Figure 5a), rather than taking the physically shorter internal arterials (e.g., ) that suffer from severe traffic impedance during the morning peak, the algorithm accounts for the dynamic BPR delay and plans an outer congestion-avoidance loop (). This illustrates a strategy of trading distance for time to minimize temporal costs.
Conversely, for User B (Figure 5b), any extra detour increases dynamic energy consumption and subsequent economic costs. Therefore, after charging at Node 24, the algorithm plans the shortest physical trajectory through the network (). As observed, User B retraces the Stage I path northbound before heading to the CBD. This behavior prioritizes energy conservation over temporal delays.
This comparative analysis confirms the logical consistency between the macro-level station evaluation and the micro-level trajectory execution. The proposed framework provides personalized and optimized navigation services for diverse EV users.
4.4. Macro–Micro Consistency and Ranking Robustness
In the proposed two-stage architecture, Stage I selects the optimal station based on macroscopic cost estimations, while Stage II executes microscopic routing using the IACO heuristic. This section validates the consistency between these two stages to ensure that microscopic execution variances do not alter the upper-level station ranking.
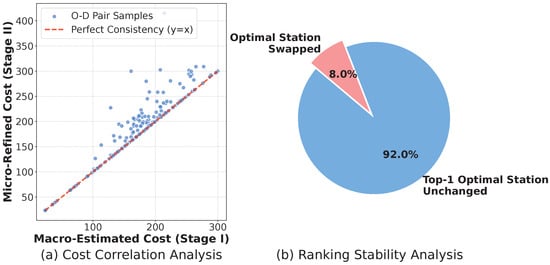
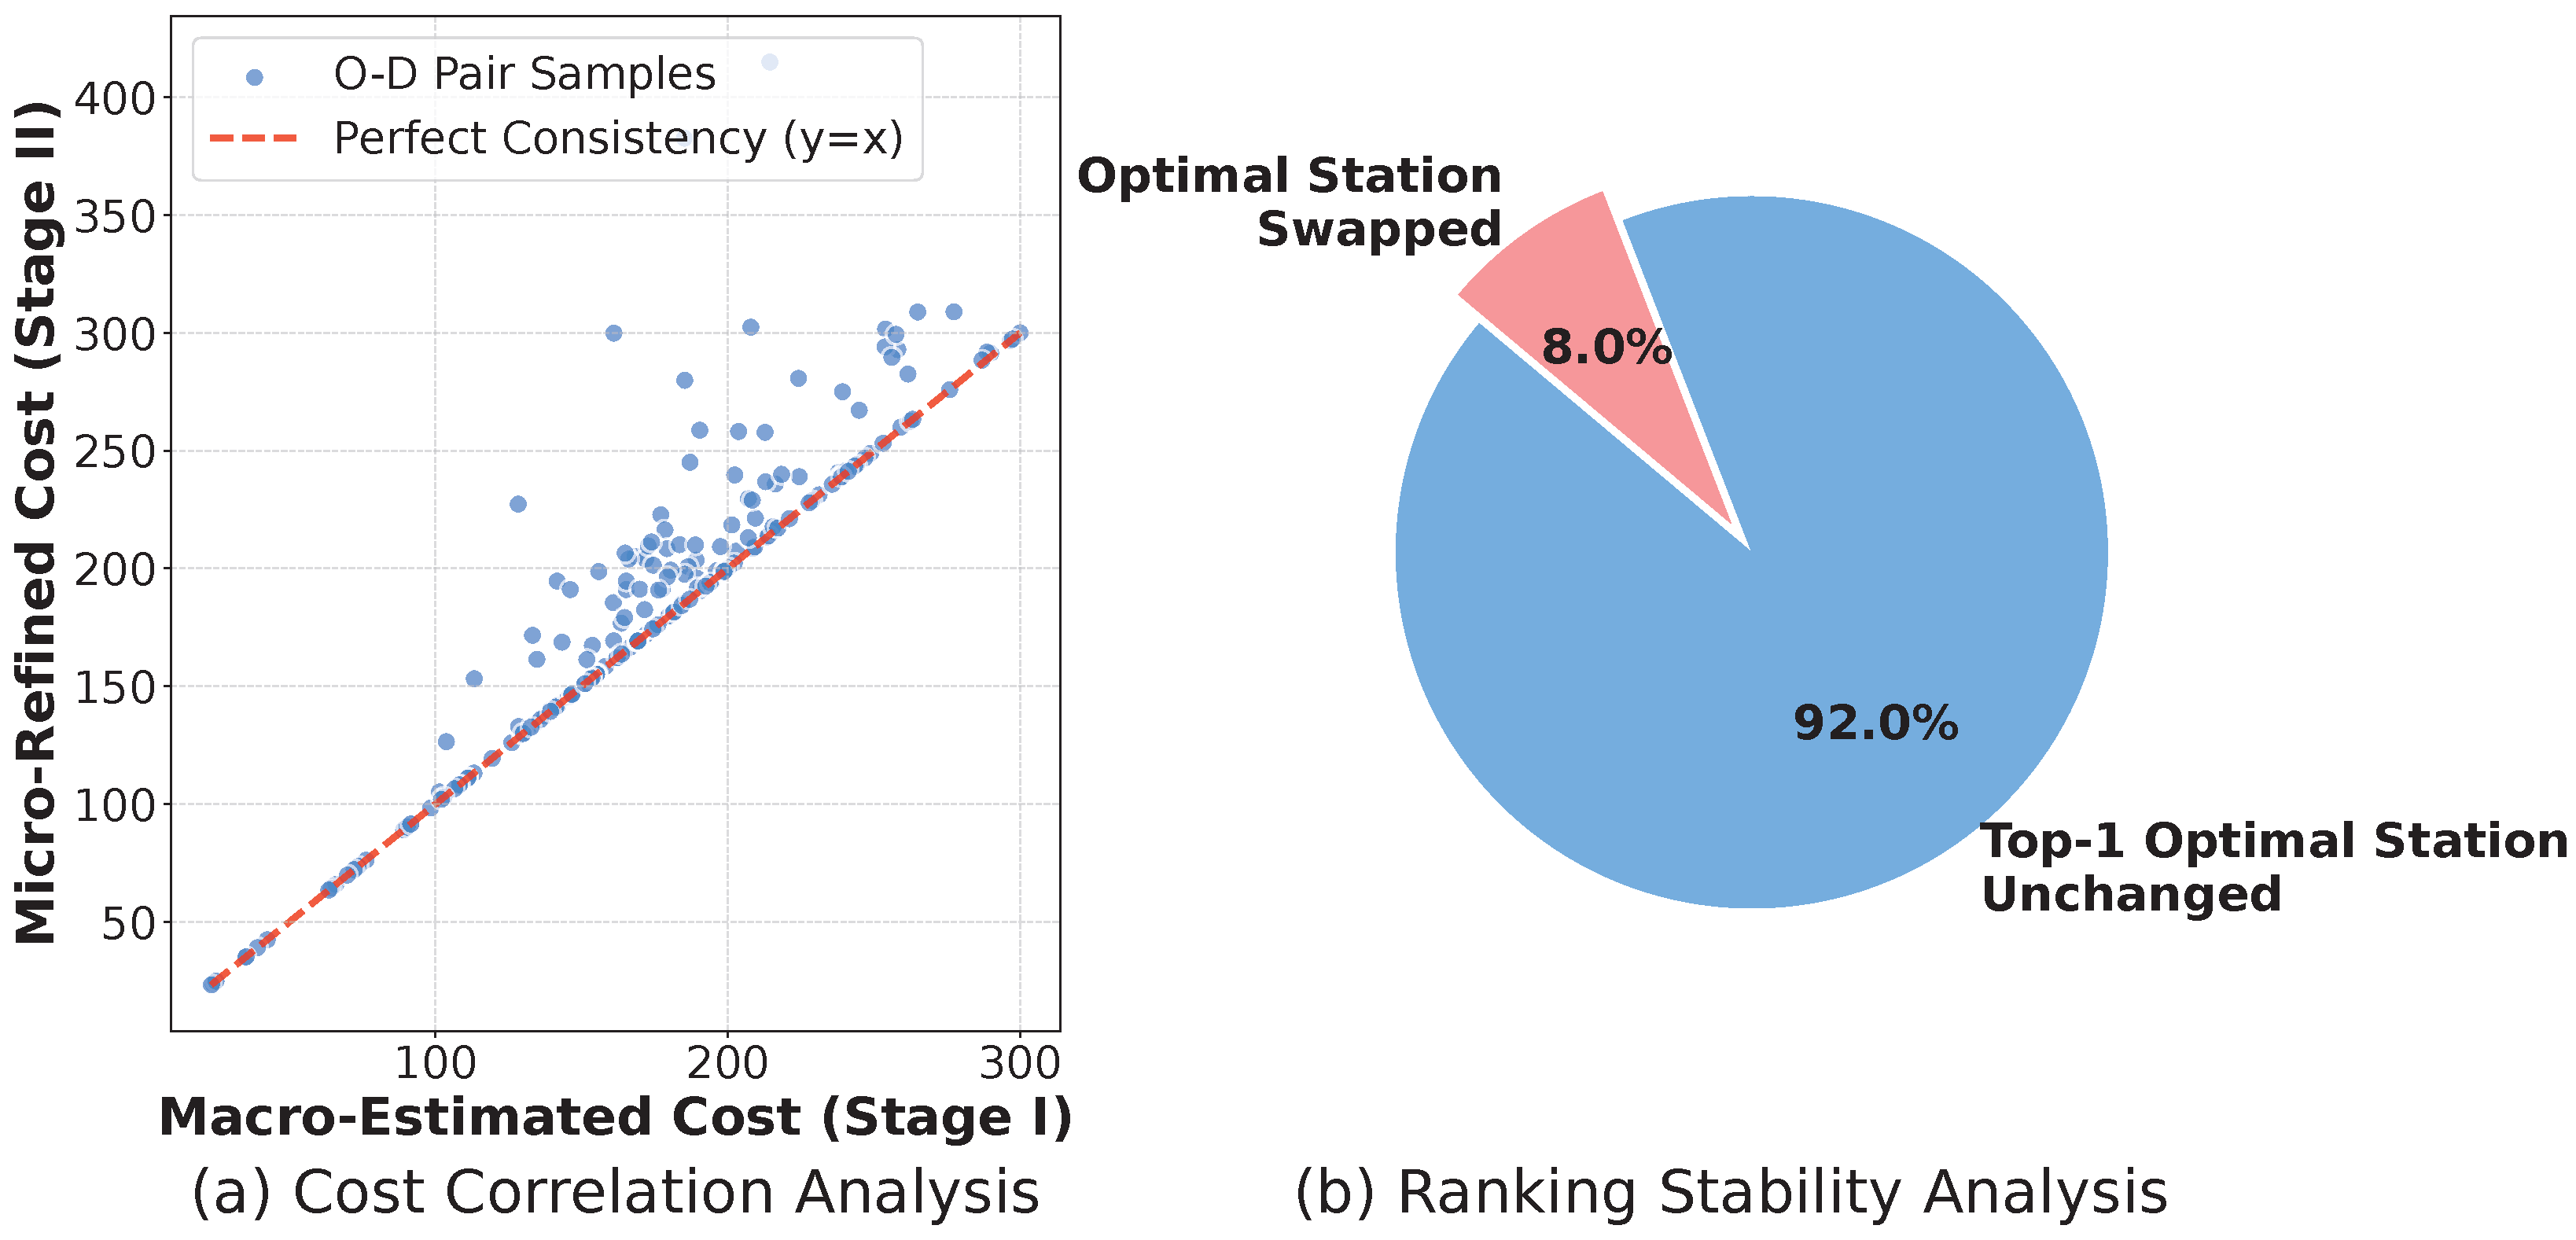
Note on Test Conditions: A consistency check is conducted across 50 random O–D pairs. For each task, the cost of the optimal station selected in Stage I (using macro-estimated Dijkstra paths) is compared against the actual cost incurred after executing the Stage II IACO routing.
The statistical results in Figure 6 demonstrate the alignment between the two stages. As shown in the scatter plot (Figure 6a), the micro-refined costs track the macro-estimated costs, yielding a mean deviation error of 7.38%. This variance is a natural characteristic of comparing a meta-heuristic algorithm (IACO) against an exact solver (Dijkstra).
Figure 6.
Macro–micro consistency analysis and ranking stability of the optimal station: (a) cost correlation analysis; (b) ranking stability analysis.
More importantly, the consistency of the station ranking is evaluated. When the candidate stations are re-ranked based on the actual Stage II execution costs, the framework achieves a 92.0% top-1 match rate compared to the initial Stage I evaluations (Figure 6b). This indicates that in 92.0% of the tested scenarios, the optimal station selected during the macroscopic estimation remains the globally optimal choice after microscopic routing.
The results confirm that the cost variance induced by the heuristic search is insufficient to alter the AHP–Entropy–TOPSIS ranking order. Consequently, the two-stage framework maintains cross-layer decision consistency.
4.5. Benchmark Comparison and Algorithmic Superiority
Note on Simulation Scale: The benchmark values for average travel time and economic cost are significantly higher than those of typical daily commutes. This setup serves as a deliberate “stress test” to evaluate the framework’s operational boundaries. By applying magnified congestion multipliers and non-linear energy penalties, we amplify the performance gaps among algorithms to ensure a comparative analysis.
To ensure the rigorous evaluation of algorithmic performance, it is necessary to distinguish the final evaluation metrics from the macroscopic estimations used in Stage I. Specifically, the actual economic cost () reported in this benchmark evaluation represents the true monetary expense incurred by the EV. It is formulated based on the final microscopic trajectory () generated by the IACO algorithm and the locked dynamic price at the selected station ():
This formulation ensures that the reported economic metrics intrinsically account for the non-linear energy dissipation caused by real-world traffic congestion along the actual driven route.
To evaluate the performance of the integrated framework, a macro-level batch simulation involving 50 independent Monte Carlo tasks is conducted. The proposed approach is compared against two baselines:
- Baseline 1 (Distance-Greedy): Selects the geographically nearest station and the shortest topological path, disregarding dynamic congestion and electricity prices;
- Baseline 2 (Standard ACO): Employs a single-stage meta-heuristic with fixed, uniform weights for time and energy (i.e., a rigid 50/50 balance), lacking the ability to inherit personalized user preferences.
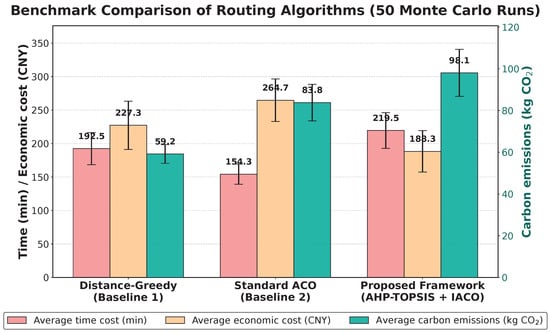
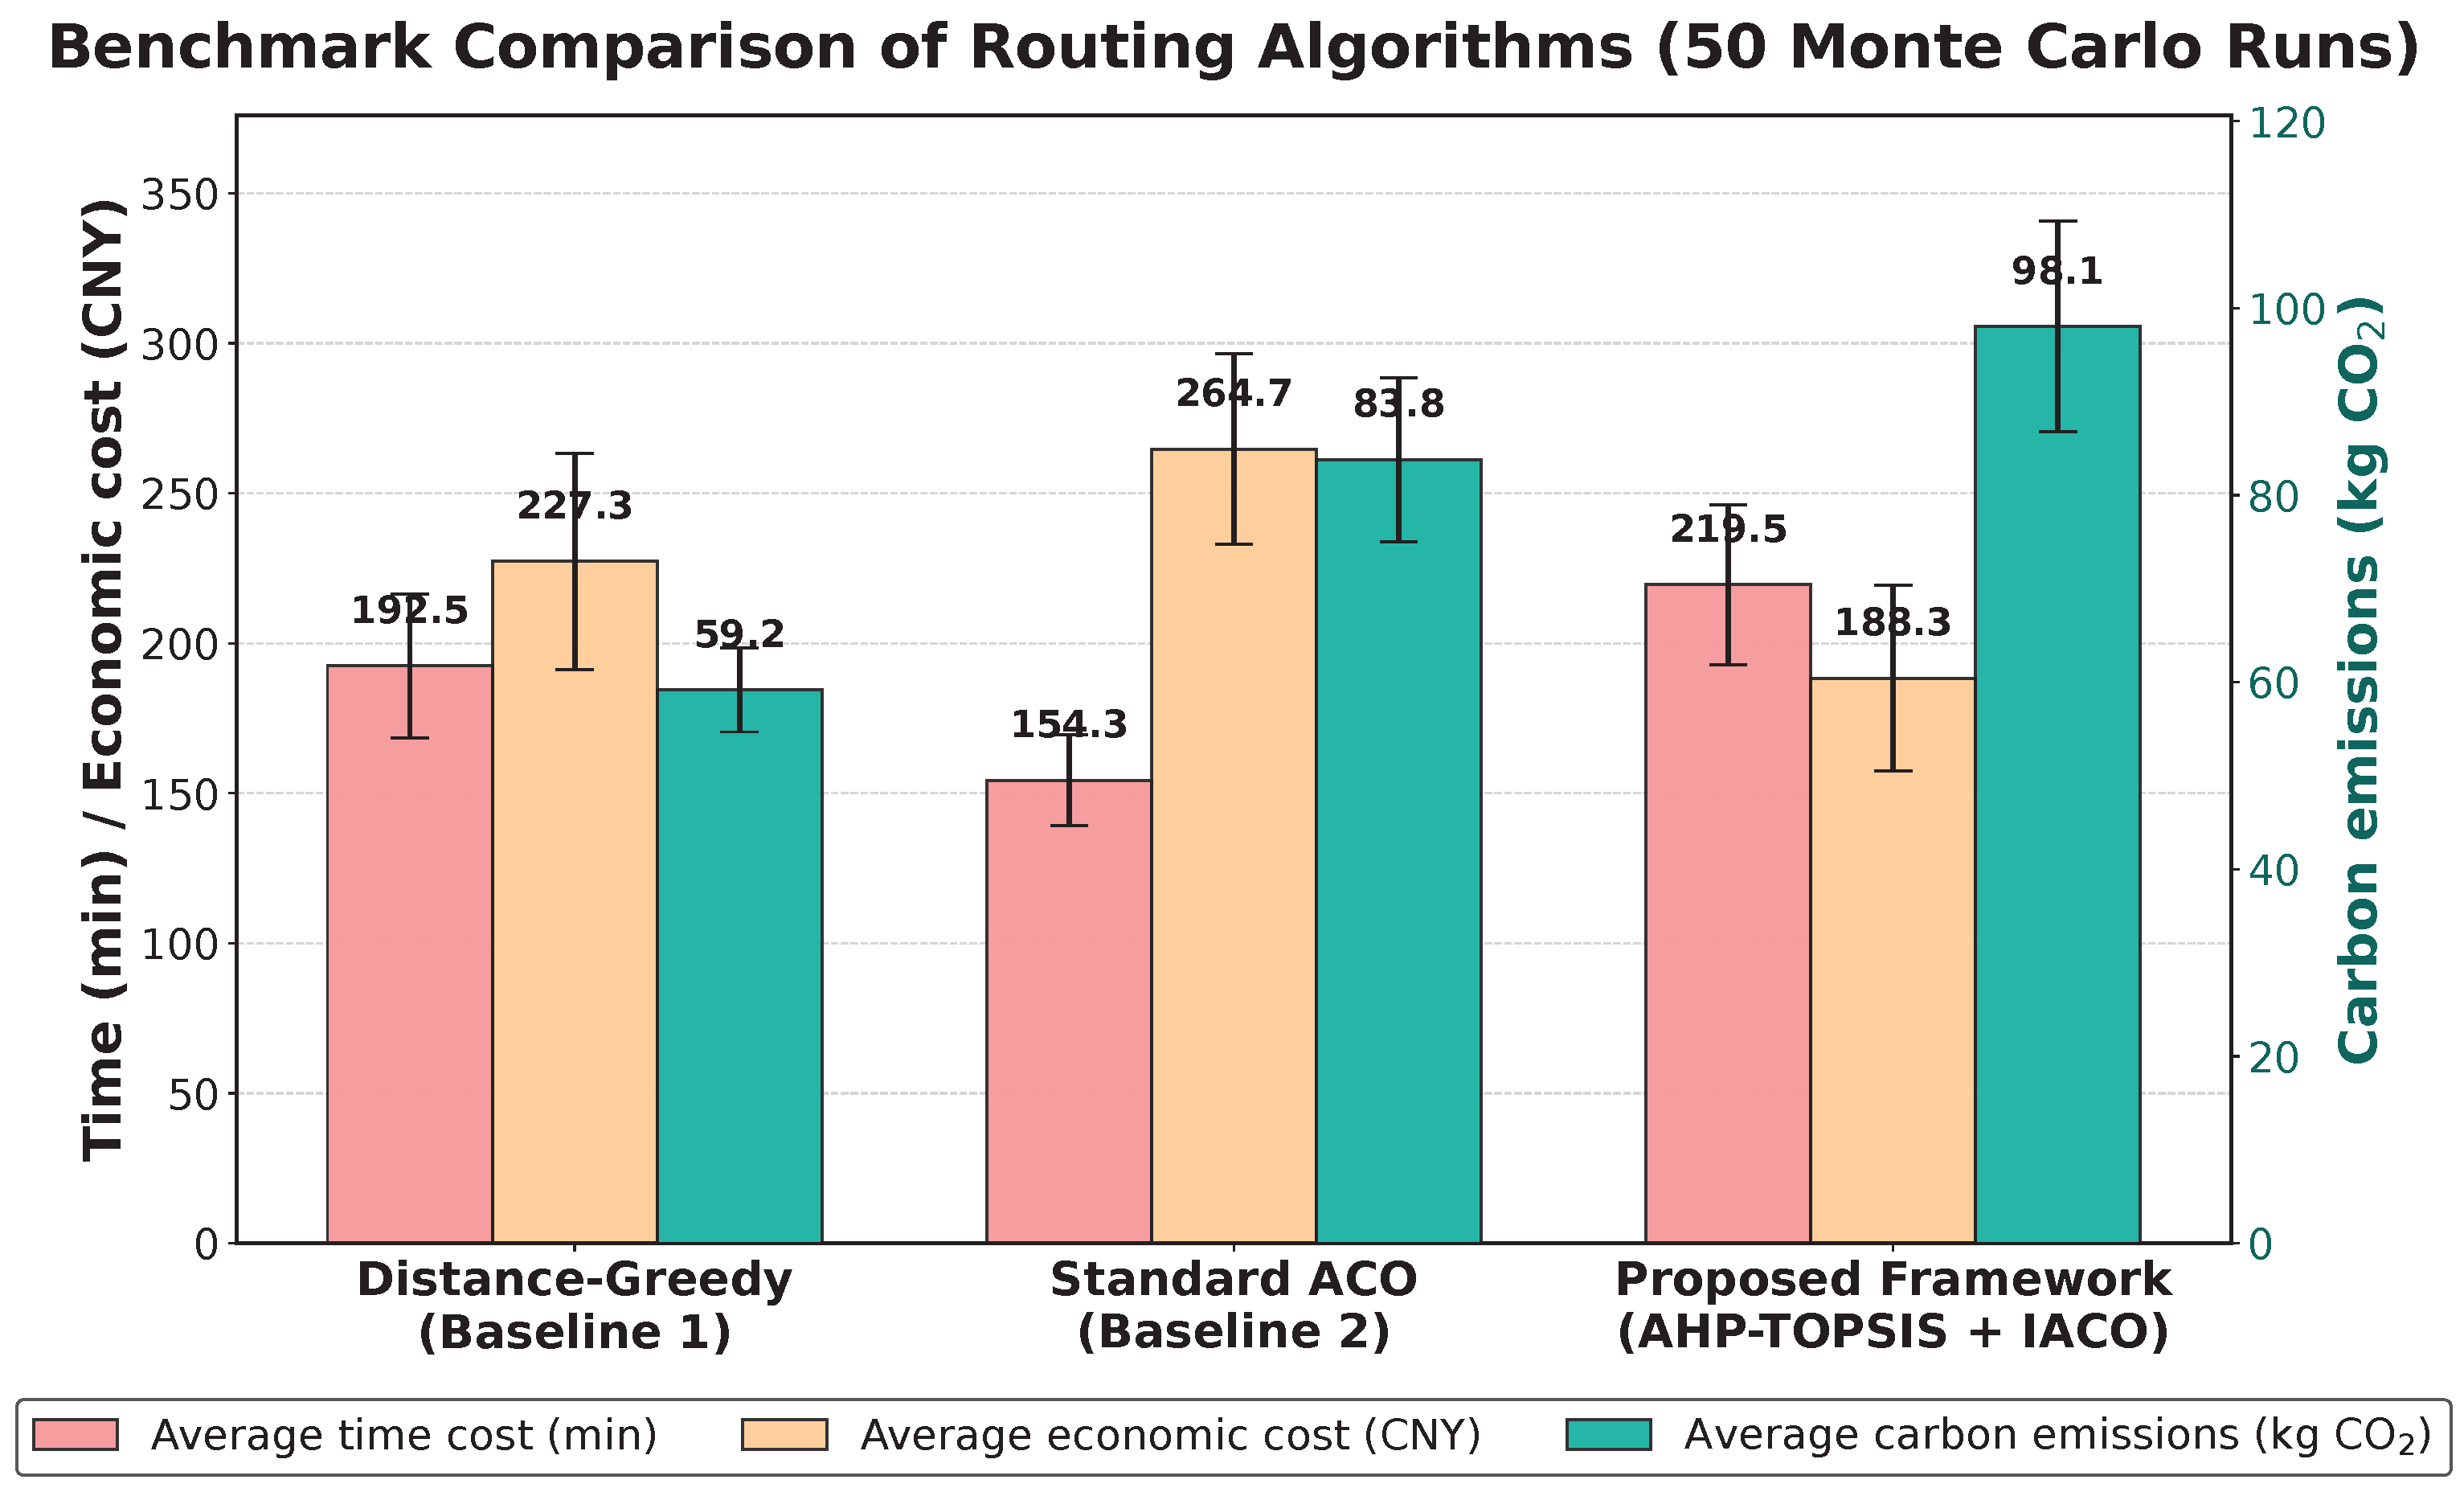
The statistical results in Figure 7 highlight the limitations of conventional approaches. Baseline 1 achieves the lowest carbon emissions (59.2 kg CO2) but triggers severe gridlock at CBD stations, resulting in high dynamic price penalties and an average economic cost of 227.3 CNY.
Figure 7.
Benchmark comparison of EV routing strategies across 50 Monte Carlo runs.
Baseline 2 (Standard ACO) yields the lowest time cost (154.3 min) by prioritizing speed. However, its fixed heuristic does not align with the price-sensitive profiles of the simulated users. Sacrificing economic efficiency for temporal gain results in the highest average economic cost (264.7 CNY) and higher performance instability, as evidenced by the wider 95% confidence intervals.
In contrast, the proposed framework achieves a favorable Pareto balance. By integrating AHP–Entropy–TOPSIS with the preference-inheriting IACO algorithm, it identifies peripheral stations with dynamic price discounts. This yields the lowest average economic cost (188.3 CNY), reducing expenses by 28.9% compared to Standard ACO.
The moderately higher time cost (219.5 min) and carbon emissions (98.1 kg CO2) are a direct consequence of the preference inheritance mechanism. As the simulated population is predominantly price-sensitive, the algorithm executes detour behaviors to trade temporal efficiency for economic benefits, providing an economically optimized solution.
4.6. Adaptability Across Diverse User Populations
To evaluate the framework’s ability to accommodate varying user preferences, an adaptability experiment is conducted. The proposed approach is compared against Baseline 2 (Standard ACO) across different user population profiles.
Note on Test Conditions: The simulated EVs are categorized into three distinct behavioral profiles: Time-Sensitive (high weight), Balanced (equal weighting), and Price-Sensitive (high weight). For each profile, 30 random O–D routing tasks are executed using 50 Monte Carlo runs to capture spatial–temporal variance.
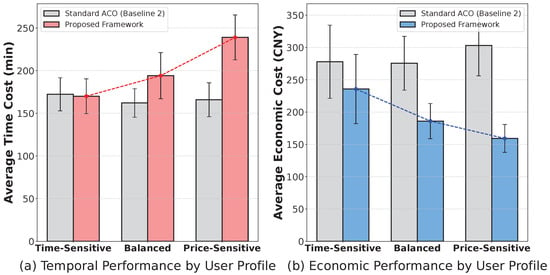
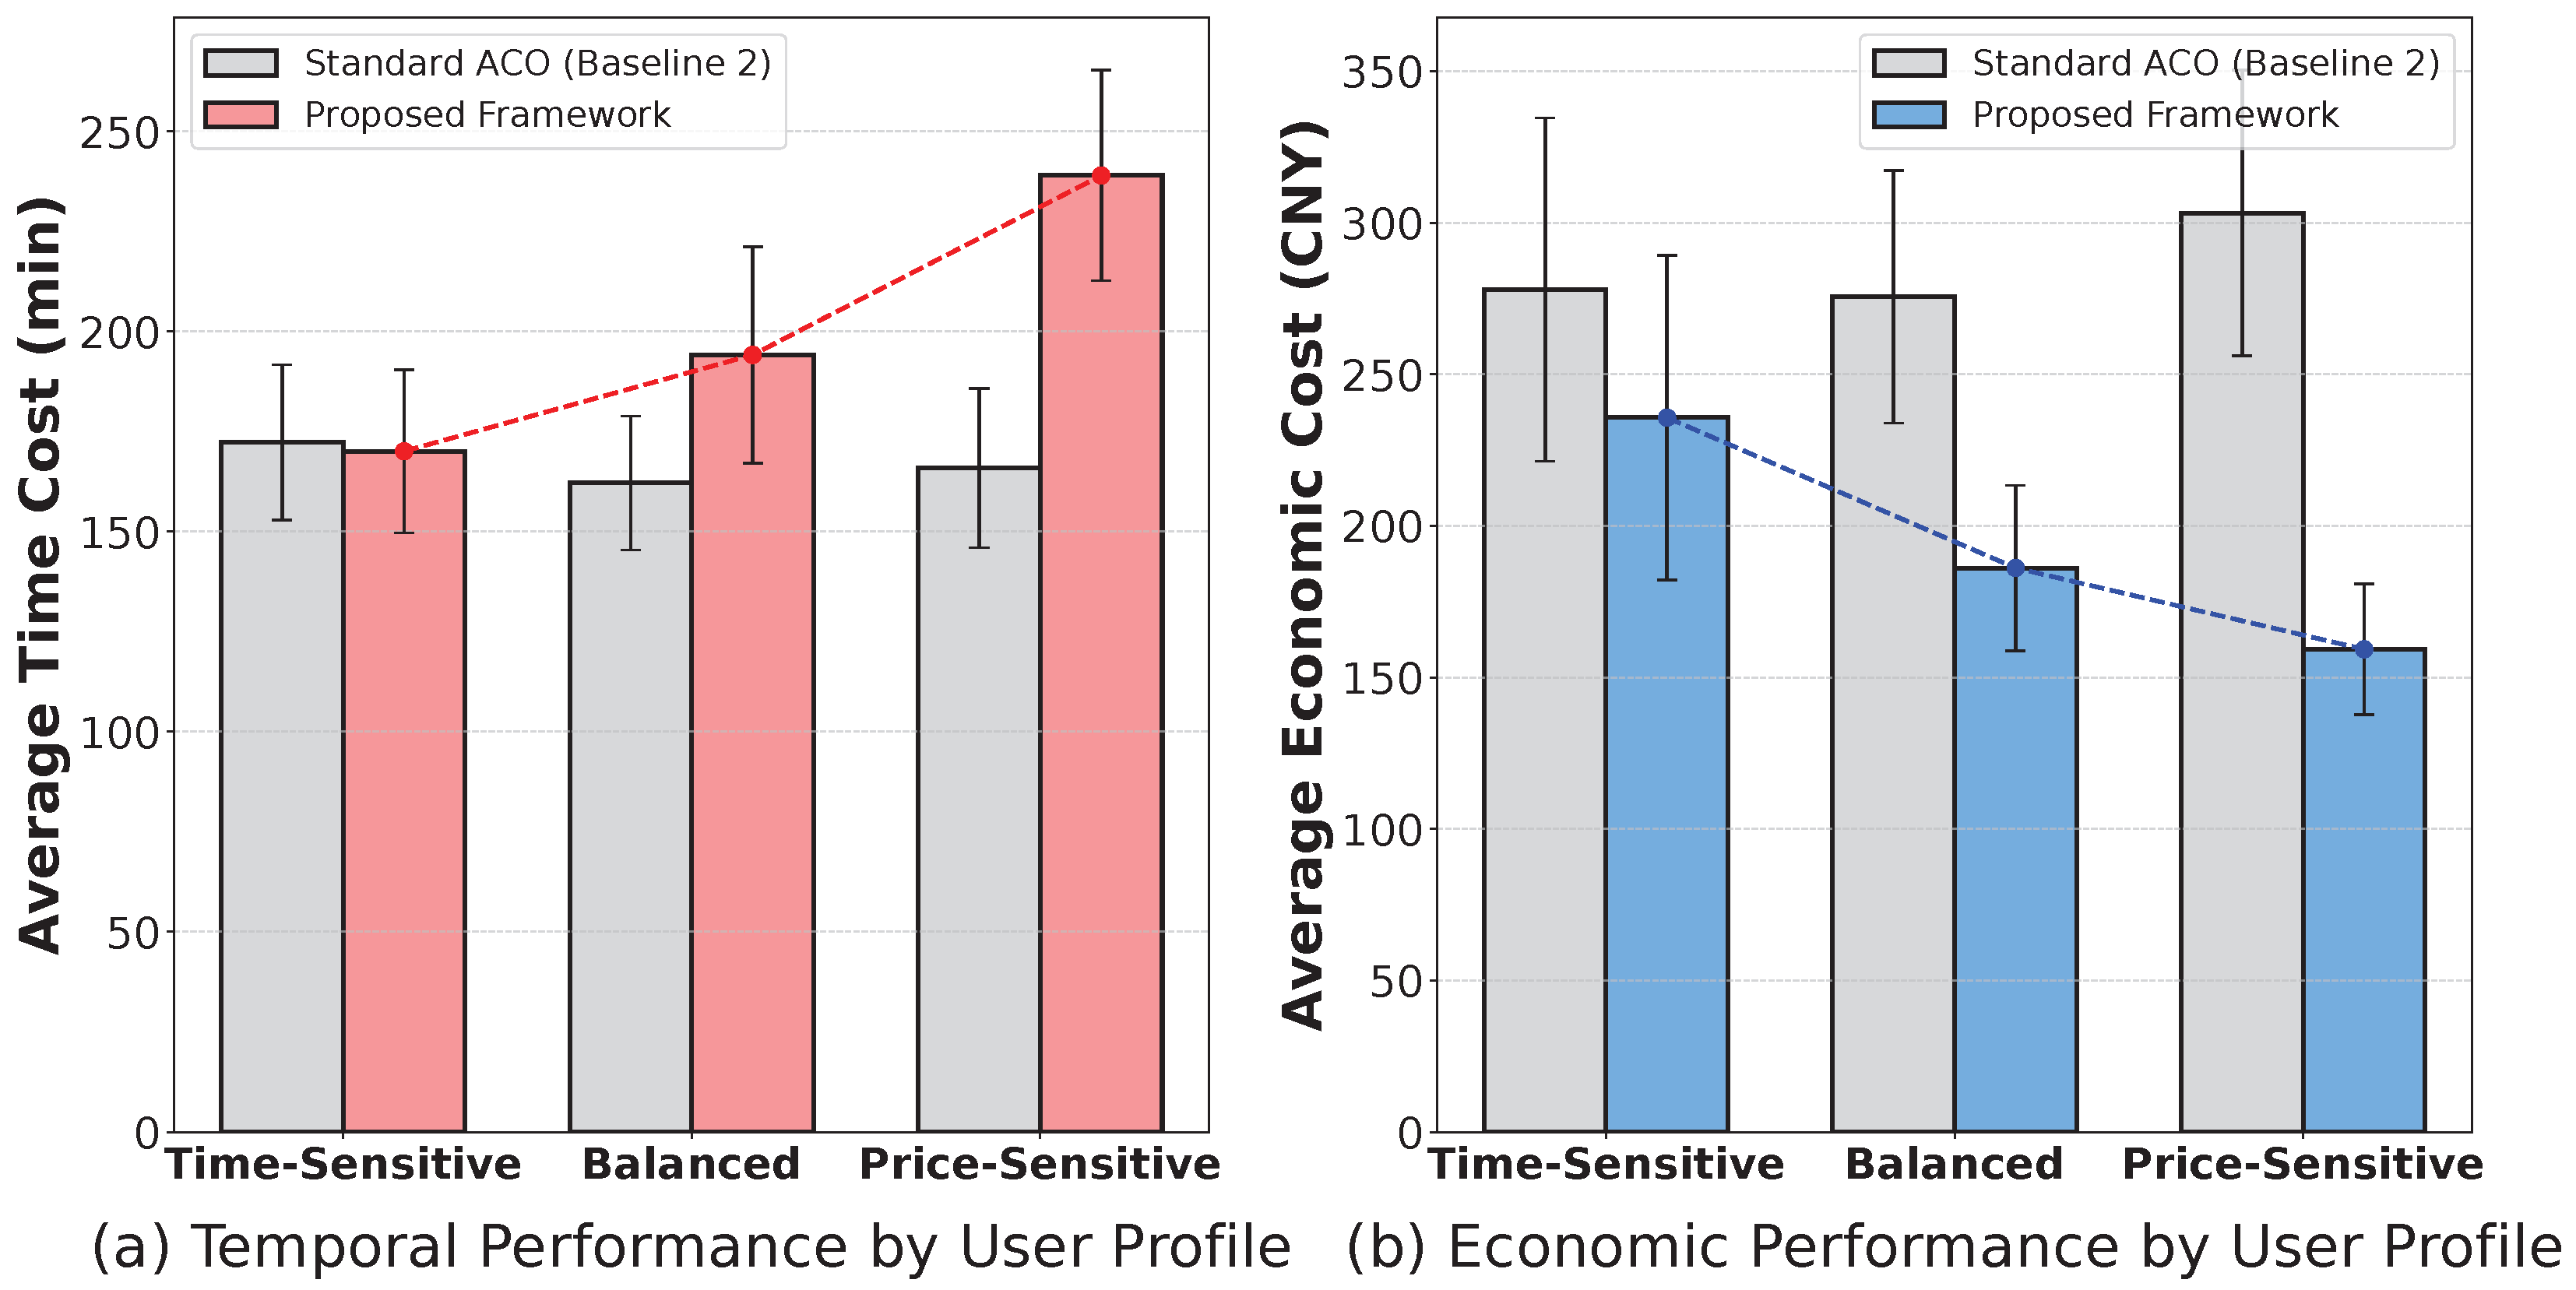
The statistical results in Figure 8 illustrate the behavioral differences between the two algorithms under varying user inputs. Baseline 2 (Standard ACO) exhibits static performance metrics across all three profiles. Because it employs fixed heuristic weights for physical routing, it does not adapt to the shifting economic and temporal priorities of the user population.
Figure 8.
Performance evaluation of routing algorithms across diverse user profiles: (a) temporal performance by user profile; (b) economic performance by user profile.
In contrast, the proposed framework demonstrates a responsive trade-off mechanism. As shown in Figure 8a,b, when serving time-sensitive users, the algorithm prioritizes temporal efficiency. It achieves time costs comparable to Baseline 2 but incurs higher economic costs, as vehicles are routed to geographically proximate but premium-priced central stations.
As the user shifts toward a price-sensitive profile, the framework alters its routing strategy. It executes detour behaviors to peripheral stations, which increases the average time cost (indicated by the upward trend in Figure 8a) but reduces the average economic cost (indicated by the downward trend in Figure 8b). These inverse trends indicate that the proposed framework dynamically adjusts its routing decisions based on specific user requirements.
4.7. Ablation Studies on Core Mechanisms
To evaluate the contributions of individual modules within the architecture, two targeted ablation studies are conducted. These experiments isolate the congestion-driven dynamic pricing mechanism and the objective entropy fusion module.
4.7.1. Ablation on Congestion-Driven Dynamic Pricing
This study examines the spatial load-balancing capability of the pricing mechanism. The proposed framework is compared against Baseline 3 (static pricing), where dynamic tariffs are replaced by a fixed ToU baseline.
Note on Test Conditions: The simulated EV fleet is configured with a 75% proportion of highly price-sensitive commercial agents. This setup is designed to observe routing behaviors under conditions where users have a high tolerance for queuing but strong resistance to spatial detours without economic incentives.
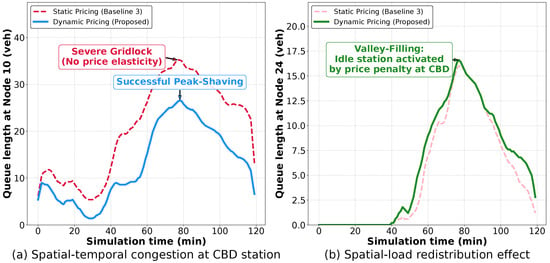
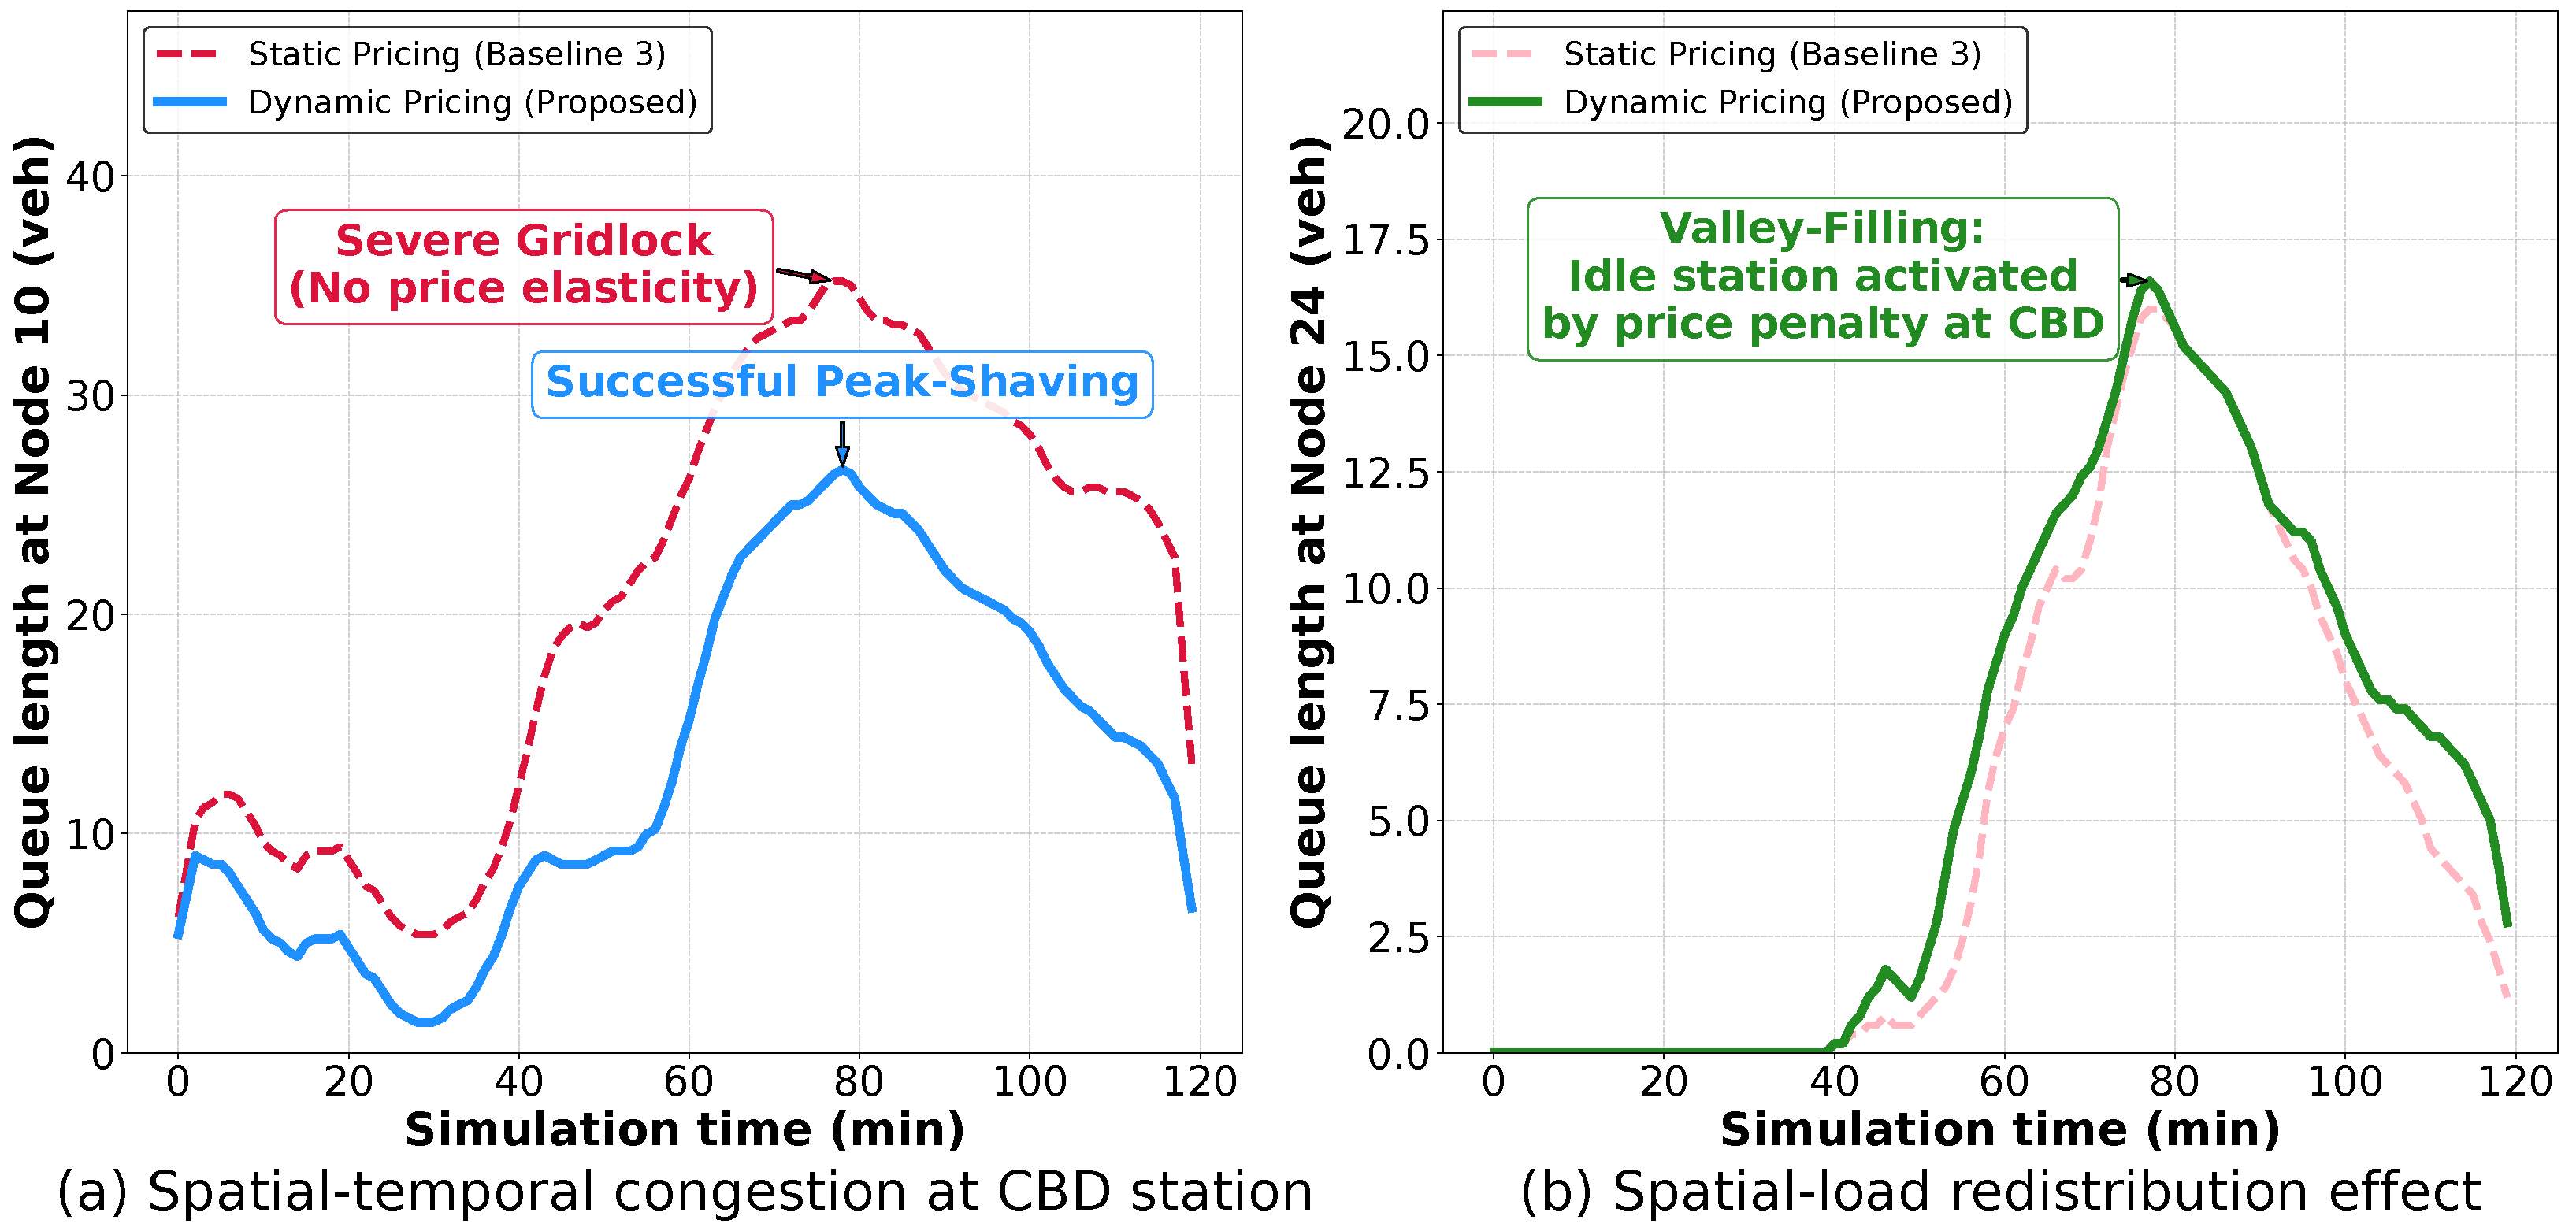
As illustrated in Figure 9a, under static pricing (Baseline 3), the price-sensitive fleet converges on the geographically proximate CBD station (Node 10). This routing behavior leads to localized congestion, with the queue length reaching approximately 35 vehicles.
Figure 9.
Ablation study evaluating the spatial load-balancing effect of dynamic pricing: (a) spatial–temporal congestion at CBD station; (b) spatial load redistribution effect.
Figure 9b shows the system response under the proposed dynamic pricing. As prices escalate at congested Node 10 and relative discounts are offered at idle peripheral Node 24, charging demand is redistributed. The results indicate a peak-shaving effect at the core node and a valley-filling effect at the peripheral node.
4.7.2. Ablation on Entropy-Based Weight Fusion
This study assesses the role of the cross-layer evaluation mechanism. The proposed approach is compared against Baseline 4 (Pure AHP-TOPSIS), which relies exclusively on user-defined subjective weights and disables the objective entropy fusion.
Note on Test Conditions: The simulation constructs a scenario where a user expresses balanced subjective weights for time and economy (). Concurrently, the economically favorable stations experience queuing delays (35–55 min), while a slightly higher-priced peripheral station remains idle.
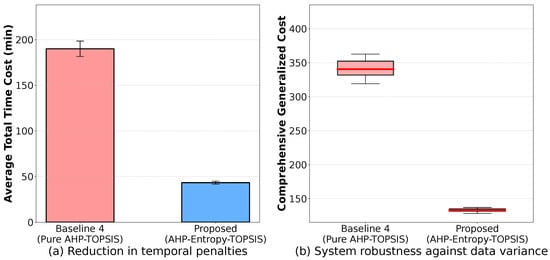
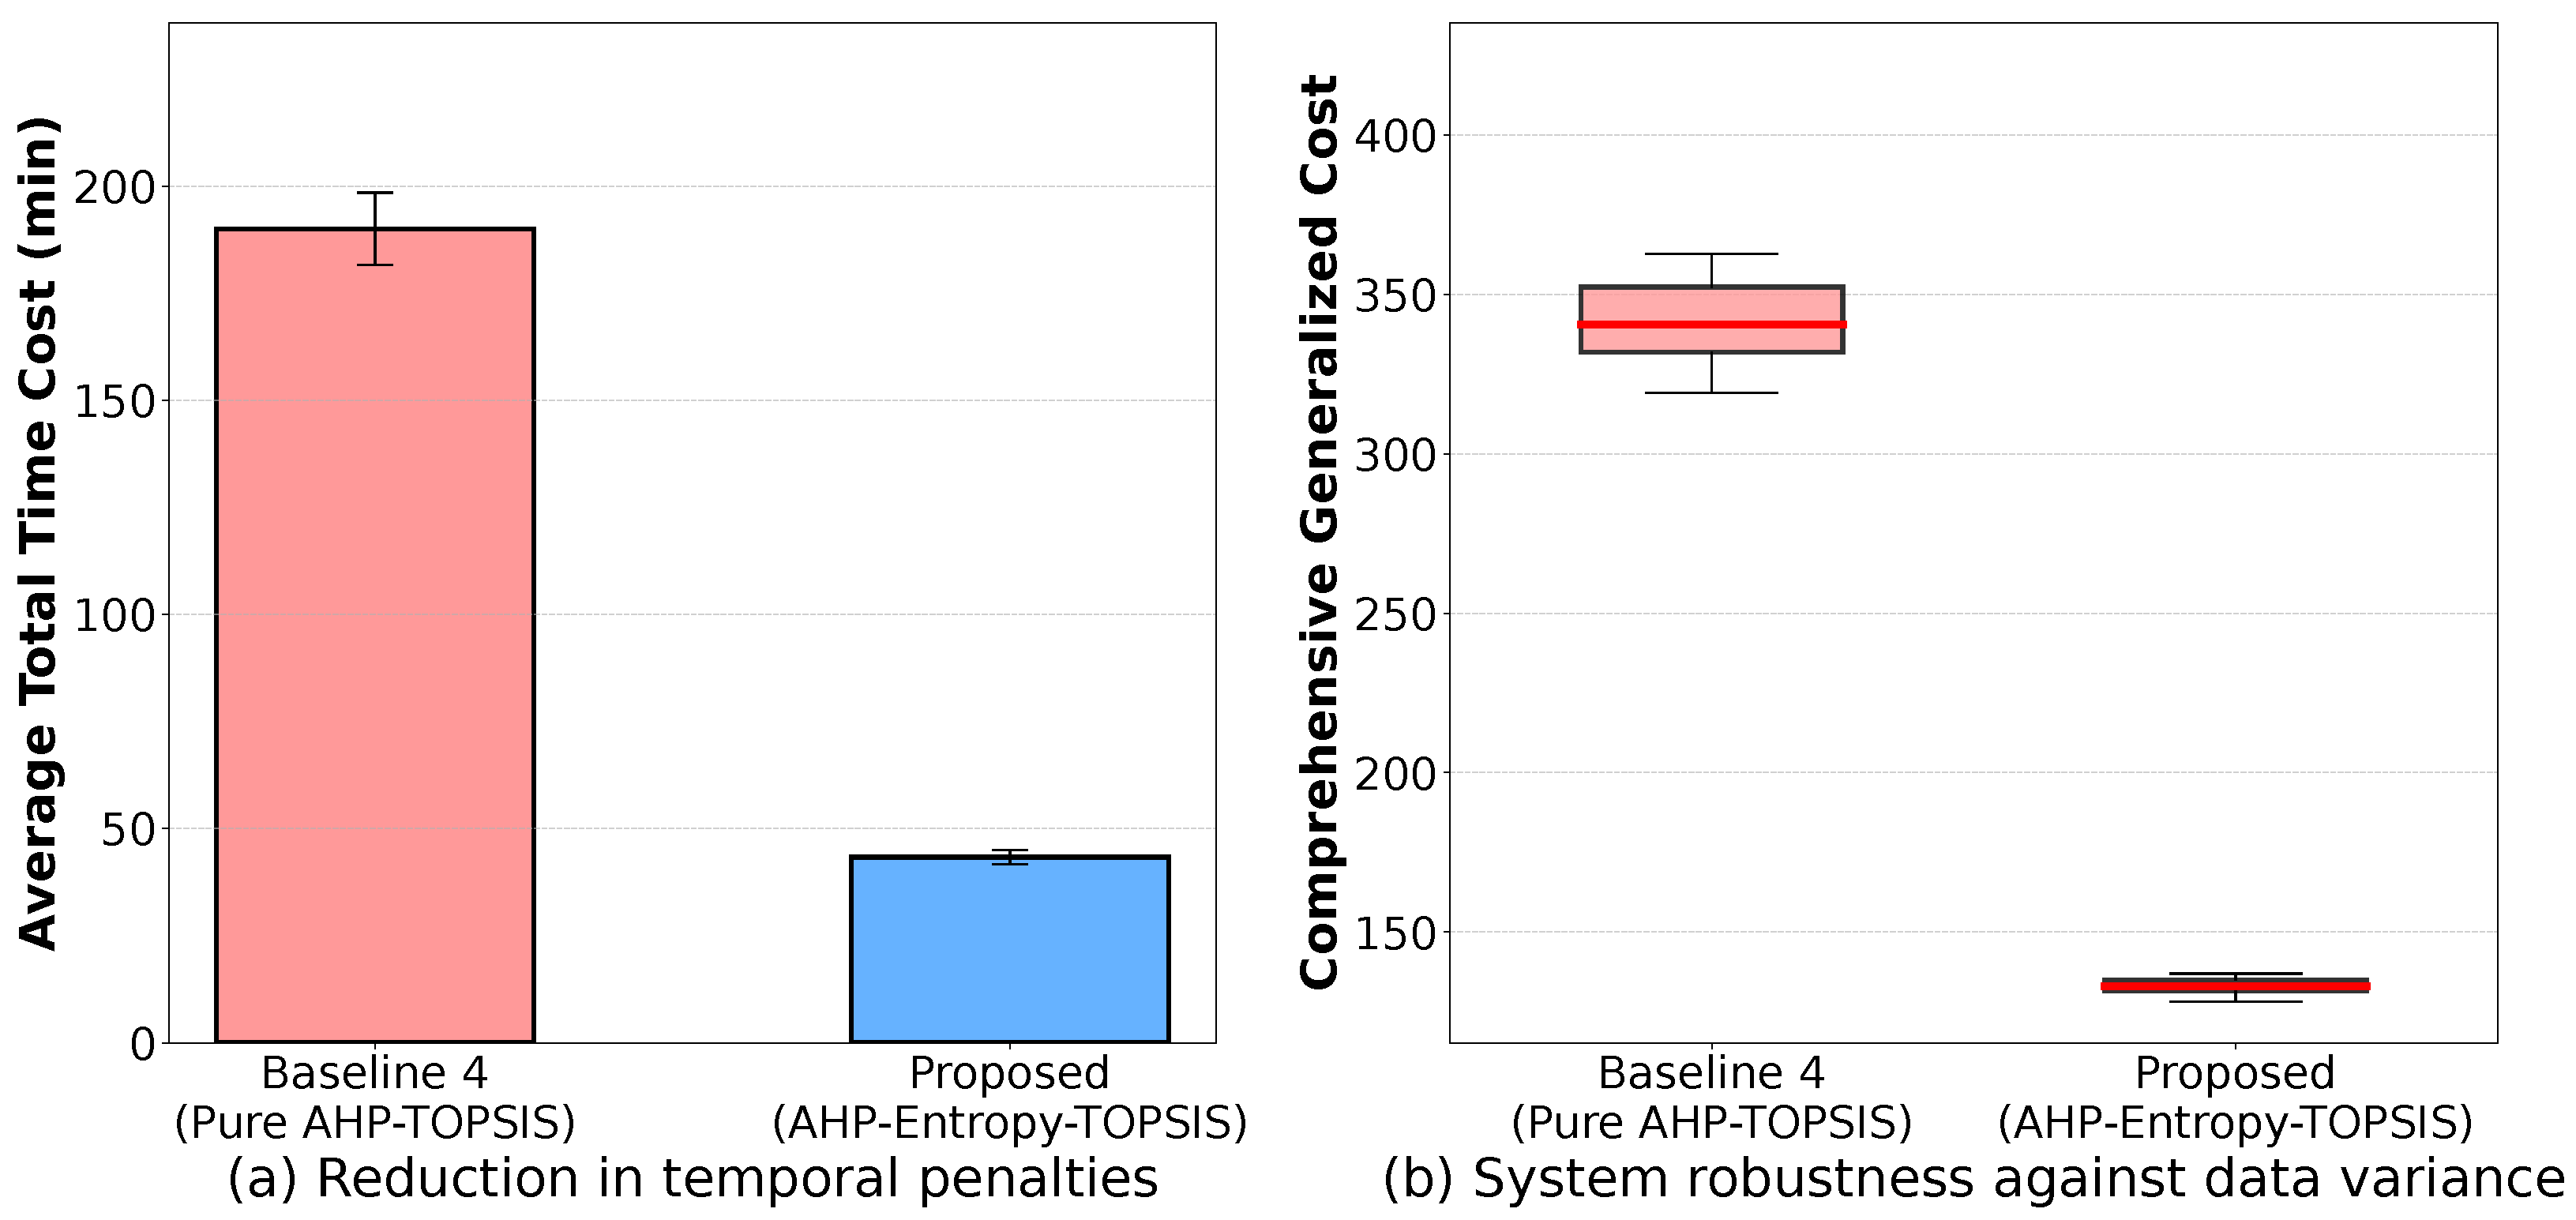
As shown in Figure 10a,b, Baseline 4 maintains static subjective weights. The algorithm prioritizes the economic advantage of the congested stations, which results in higher average time costs and increased variance in the comprehensive generalized cost.
Figure 10.
Ablation study on the entropy fusion mechanism under data variance. (a) Reduction in temporal penalties. (b) System robustness against data variance.
In contrast, the AHP–Entropy–TOPSIS framework accounts for the variance in real-time queuing data through the entropy mechanism. This fusion increases the objective weight of the temporal criterion, rerouting the vehicle to the idle station. The results show that integrating objective data entropy reduces the generalized cost and improves system stability during traffic fluctuations.
5. Conclusions and Future Work
This paper proposes a two-stage dynamic routing and charging station selection framework for EVs within a traffic–energy coordination architecture. To mitigate localized charging congestion and maintain spatial–temporal continuity for users, the framework integrates a macro-level AHP–Entropy–TOPSIS station selection model with a micro-level preference-inheriting IACO routing algorithm. A congestion-driven dynamic pricing mechanism is also introduced to translate physical multi-server queuing constraints into economic signals.
The numerical simulations conducted on the Sioux Falls network yield the following primary conclusions: (1) The two-stage architecture maintains cross-layer decision consistency. Consistency checks verify a 92.0% top-1 match rate between the macroscopic estimations and the microscopic heuristic executions. (2) The congestion-driven dynamic pricing mechanism facilitates spatial load balancing. By leveraging price elasticity, the system limits the queue length at the core CBD station to manageable levels and reroutes excess demand to peripheral stations, achieving a peak-shaving effect. (3) The preference-inheriting micro-routing algorithm effectively adapts to diverse user profiles. Compared to the conventional Standard ACO baseline, the proposed framework reduces the average economic cost for price-sensitive users by 28.9% while maintaining battery safety limits and dynamically trading off temporal efficiency and indirect carbon emissions.
While the proposed framework provides an operational methodology for traffic–energy coordination, certain limitations exist in the current study that delimit its application boundaries. First, the pricing mechanism relies on a centralized macroscopic deterministic broadcast; it does not currently account for extreme, unforeseen grid outages or highly stochastic power supply fluctuations. Second, the underlying energy model focuses exclusively on unidirectional charging (Grid to Vehicle, G2V) and does not incorporate Vehicle-to-Grid (V2G) bidirectional discharging capabilities, which are increasingly relevant for grid peak regulation. Finally, while the Sioux Falls network serves as an optimal baseline testbed, scaling real-time two-stage heuristic evaluation to mega-city networks with millions of nodes may introduce computational latency.
Therefore, future research will focus on extending the framework to address these limitations. Key directions include integrating V2G discharging models to formulate a bidirectional energy-trading routing problem. Additionally, exploring decentralized edge-computing architectures or physically constrained multi-agent reinforcement learning (MARL) could further reduce computational overhead and enhance the real-time responsiveness of the framework in ultra-large-scale urban transportation networks.
Author Contributions
Conceptualization, M.Z. and J.Y.; methodology, M.Z. and J.Y.; software, M.Z. and H.W.; validation, J.Y., M.Z. and H.W.; formal analysis, M.Z. and H.W.; investigation, M.Z. and H.W.; data curation, M.Z. and H.W.; writing—original draft preparation, M.Z.; writing—review and editing, M.Z. and J.Y.; visualization, H.W. and M.Z.; supervision, J.Y.; project administration, J.Y.; funding acquisition, J.Y. All authors have read and agreed to the published version of the manuscript.
Funding
This work was supported in part by the Science and Technology Project of State Grid Corporation of China under Grant 52060025002R-241-TD.
Institutional Review Board Statement
Not applicable.
Informed Consent Statement
Not applicable.
Data Availability Statement
Data will be made available upon request.
Conflicts of Interest
Jun Yang has received research grants from the Science and Technology Project of State Grid Corporation of China under Grant 52060025002R-241-TD. The other authors declare no conflicts of interest.
References
- Ahmed, I.; Maaruf, M.; Ali, A.; AlMuhaini, M.; Khalid, M. A review on challenges and future of green charging networks for zero emission electric transportation. Energy Convers. Manag. X 2025, 25, 100867. [Google Scholar] [CrossRef] [Scilit]
- Kavousighahfarokhi, A.; Hannan, M.A.; Abu, S.M.; Ker, P.J.; Wong, R.T.K.; Jang, G. Grid-integrated electric vehicle charging station technologies and data dissemination through internet of energy use. Renew. Sustain. Energy Rev. 2025, 220, 115904. [Google Scholar] [CrossRef] [Scilit]
- He, B.; Yang, B.; Han, Y.; Zhou, Y.; Hu, Y.; Shu, H.; Su, S.; Yang, J.; Huang, Y.; Li, J.; et al. Optimal EVCS planning via spatial-temporal distribution of charging demand forecasting and traffic-grid coupling. Energy 2024, 313, 133885. [Google Scholar] [CrossRef] [Scilit]
- Chen, B.; Guo, H.; Zhou, F.; Hu, Z.; Huang, J.S.; Wu, K.; Meroux, D.; Bao, S. Electric vehicle users’ charging patterns and selection considerations at public charging stations. Transp. Res. Part D 2025, 149, 105081. [Google Scholar] [CrossRef] [Scilit]
- He, L.; He, J.; Zhu, L.; Huang, W.; Wang, Y.; Yu, H. Comprehensive evaluation of electric vehicle charging network under the coupling of traffic network and power grid. PLoS ONE 2022, 17, e027523. [Google Scholar] [CrossRef] [Scilit] [PubMed]
- Yuan, Q.; Ding, L.; Yao, J.; Guo, L.; Fan, J.; Wang, Q. Research on electric vehicle demand response strategy in traffic-grid coupling networks based on charging state forecasting model. In Proceedings of the 2020 23rd International Conference on Electrical Machines and Systems (ICEMS), Hamamatsu, Japan, 24–27 November 2020; pp. 1403–1407. [Google Scholar]
- Alharbi, I.; Ben Ncir, C.-E.; Alyoubi, B.; Ben-Romdhane, H. (Eds.) Advances in Computational Logistics and Supply Chain Analytics, 1st ed.; Springer: Cham, Switzerland, 2024. [Google Scholar]
- Yang, X.; Cui, T.; Wang, H.; Ye, Y. Multiagent deep reinforcement learning for electric vehicle fast charging station pricing game in electricity-transportation nexus. IEEE Trans. Ind. Inform. 2024, 20, 6345–6355. [Google Scholar] [CrossRef] [Scilit]
- Narayanan, A.; Misra, P.; Ojha, A.; Bandhu, V.; Ghosh, S.; Vasan, A. A reinforcement learning approach for electric vehicle routing problem with vehicle-to-grid supply. arXiv 2022, arXiv:2204.05545. [Google Scholar]
- Zhang, Y.; Li, M.; Chen, Y.; Chiang, Y.-Y.; Hua, Y. A constraint-based routing and charging methodology for battery electric vehicles with deep reinforcement learning. IEEE Trans. Smart Grid 2023, 14, 2446–2459. [Google Scholar] [CrossRef] [Scilit]
- Raviprabhakaran, V.; Sarakonda, J.; Udugula, V.; Datla, N.V. Electric automobile route scheduling with time setting using machine learning methods. Int. J. Sustain. Transp. 2026, 20, 413–428. [Google Scholar] [CrossRef] [Scilit]
- Wang, L.; Dubey, A.; Gebremedhin, A.H.; Srivastava, A.K.; Schulz, N. MPC-based decentralized voltage control in power distribution systems with EV and PV coordination. IEEE Trans. Smart Grid 2022, 13, 2908–2919. [Google Scholar] [CrossRef] [Scilit]
- Liu, C.; Zhou, M.; Wu, J.; Long, C.; Wang, Y. Electric vehicles en-route charging navigation systems: Joint charging and routing optimization. IEEE Trans. Control Syst. Technol. 2019, 27, 906–914. [Google Scholar] [CrossRef] [Scilit]
- Al-Zuhairi, Y.; Kannan, P.; Guillén, A.B.; de la Cruz Llopis, L.J.; Igartua, M.A. Efficient charging station selection for minimizing total travel time of electric vehicles. Future Internet 2025, 17, 374. [Google Scholar] [CrossRef] [Scilit]
- Bi, J.; Du, Y.; Wang, Y.; Zuo, X. Optimization model of electric vehicle charging induction based on comprehensive satisfaction of users. J. Tsinghua Univ. Sci. Technol. 2023, 63, 1750–1759. [Google Scholar]
- Guo, S.; Zhao, H. Optimal site selection of electric vehicle charging station by using fuzzy TOPSIS based on sustainability perspective. Appl. Energy 2015, 158, 390–402. [Google Scholar] [CrossRef] [Scilit]
- Wang, X.; Xia, W.; Yao, L.; Zhao, X. Improved Bayesian best-worst networks with geographic information system for electric vehicle charging station selection. IEEE Access 2024, 12, 758–771. [Google Scholar] [CrossRef] [Scilit]
- Tang, S.; Mu, Y.; Dong, X.; Jia, H.; Yu, X. Modeling electric vehicle charging load dynamics: A Spatial-Temporal approach integrating trip chains and dynamic user equilibrium. IEEE Trans. Smart Grid 2025, 16, 582–597. [Google Scholar] [CrossRef] [Scilit]
- Ouyang, T.; Cai, J.; Gao, Y.; He, X.; Chen, H.; Hang, K. A method of EV detour-to-recharge behavior modeling and charging station deployment. In Proceedings of the 2020 IEEE Symposium Series on Computational Intelligence (SSCI), Canberra, Australia, 1–4 December 2020; pp. 1265–1271. [Google Scholar]
- Froger, A.; Jabali, O.; Mendoza, J.E.; Laporte, G. The electric vehicle routing problem with capacitated charging stations. Transp. Sci. 2022, 56, 460–482. [Google Scholar] [CrossRef] [Scilit]
- Chen, B.; Chen, J.; Feng, H. Systematic planning of electric vehicle battery swapping and charging station location and driver routing with bi-level optimization. World Electr. Veh. J. 2025, 16, 499. [Google Scholar] [CrossRef] [Scilit]
- Yang, H.; Deng, Y.; Qiu, J.; Li, M.; Lai, M.; Dong, Z.Y. Electric vehicle route selection and charging navigation strategy based on crowd sensing. IEEE Trans. Ind. Inform. 2017, 13, 2214–2226. [Google Scholar] [CrossRef] [Scilit]
- Su, S.; Zhao, H.; Zhang, H.; Lin, X.; Yang, F.; Li, Z. Forecast of electric vehicle charging demand based on traffic flow model and optimal path planning. In Proceedings of the 2017 19th International Conference on Intelligent System Application to Power Systems (ISAP), San Antonio, TX, USA, 17–20 September 2017; pp. 1–6. [Google Scholar]
- Li, X.; Xiang, Y.; Lyu, L.; Ji, C.; Zhang, Q.; Teng, F.; Liu, Y. Price incentive-based charging navigation strategy for electric vehicles. IEEE Trans. Ind. Appl. 2020, 56, 5762–5774. [Google Scholar] [CrossRef] [Scilit]
- Azin, B.; Yang, X.T.; Marković, N.; Xiong, C. An incentivized scheme for electric vehicle charging demand management. Transp. Res. Part C 2023, 155, 104288. [Google Scholar] [CrossRef] [Scilit]
- D’Auria, B.; Adan, I.J.B.F.; Bekker, R.; Kulkarni, V. An M/M/c queue with queueing-time dependent service rates. Eur. J. Oper. Res. 2022, 299, 566–579. [Google Scholar] [CrossRef] [Scilit]
- Tan, A.; Wang, C.; Wang, Y.; Dong, C. Electric vehicle charging route planning for shortest travel time based on improved ant colony optimization. Sensors 2025, 25, 176. [Google Scholar] [CrossRef] [Scilit] [PubMed]
- Lee, D.; Kim, D.S.; Chung, B.J.; Chung, Y.M. Recommendation of electric vehicle charging stations in driving situations based on a preference objective function. World Electr. Veh. J. 2025, 16, 192. [Google Scholar] [CrossRef] [Scilit]
- Li, W.; Ding, H.; Xu, N.; Zhang, J. Toward carbon-neutral transportation electrification: A comprehensive and systematic review of eco-driving for electric vehicles. IEEE Trans. Transp. Electrif. 2024, 10, 6340–6360. [Google Scholar] [CrossRef] [Scilit]
- Moon, J.; Fahim, M.Q.; Anwar, H.; Ahmed, Q. Optimizing energy and time for electric vehicle charging routes. IEEE Trans. Transp. Electrif. 2025, 11, 7823–7832. [Google Scholar] [CrossRef] [Scilit]
- Caballero, H.; Sang, Y.; Wang, S. An energy-efficient routing algorithm for electric delivery trucks considering battery constraints and traffic flow. In Proceedings of the 2024 56th North American Power Symposium (NAPS), El Paso, TX, USA, 13–15 October 2024; pp. 1–6. [Google Scholar]
- Wang, N.; Gu, J.; Jing, W.; Huang, F.-A.; Zhu, H. Study of an impedance function for mixed traffic flows considering the travel time-cost characteristics of long-distance electric vehicle trips. Appl. Sci. 2024, 14, 7138. [Google Scholar] [CrossRef] [Scilit]
- Zhang, Y.; Shen, X.; Wang, Y. Dynamic electric vehicle route planning via traffic flow prediction and charging service integration. Processes 2026, 14, 762. [Google Scholar] [CrossRef] [Scilit]

Disclaimer/Publisher’s Note: The statements, opinions and data contained in all publications are solely those of the individual author(s) and contributor(s) and not of MDPI and/or the editor(s). MDPI and/or the editor(s) disclaim responsibility for any injury to people or property resulting from any ideas, methods, instructions or products referred to in the content. |
© 2026 by the authors. Licensee MDPI, Basel, Switzerland. This article is an open access article distributed under the terms and conditions of the Creative Commons Attribution (CC BY) license.