


Abstract
With the advancement of the “dual carbon” goals, the electric vehicle market has experienced explosive growth, and user review mining has become key data support for industrial quality improvement and low-carbon transportation transition. Addressing the limitations of existing sentiment classification methods in long-distance feature capture, cross-sentence semantic association, and emotional feature focus, this study proposes a BERT-Bi-xLSTM-Attention fusion model: BERT pre-trained semantic representation extracts deep contextual information, Bi-xLSTM models long-range dependency relationships, and the Attention mechanism locates sentiment-critical markers. Based on multi-platform review data from Chinese Autohome, Yiche, and China Quality Inspection Network, experiments show that the model achieves Accuracy, Recall, Precision, and F1 values of 0.9323, 0.9326, 0.9321, and 0.9328, significantly outperforming baseline models. A “sentiment-topic” fusion analysis framework is constructed, identifying five positive themes and four negative themes, revealing the dual emotional characteristics of range, driving experience, and smart features. Temporal analysis finds that negative attention to intelligent system reliability has continued to rise from 2021 to 2024, becoming an emerging user pain point. Combined with the above findings, it is recommended that consumers comprehensively evaluate multi-attribute experiences when purchasing; manufacturers prioritize optimizing user-concerned attributes; and policymakers improve industrial standards and regulatory mechanisms. This promotes high-quality development of electric vehicles, contributes to the realization of carbon neutrality goals in the transportation sector, and facilitates sustainable transportation development.
Keywords:
deep learning; electric vehicles; sentiment mining; green mobility; data analysis; BERT; xLSTM; LDA 1. Introduction
With the increasingly severe global climate change issues, reducing greenhouse gas emissions and achieving carbon peak and carbon neutrality have become common goals of the international community. As an emerging industry, electric vehicles have attracted considerable attention due to their environmental advantages and technological potential, becoming a key pathway for emission reduction in the transportation sector and a core driving force for sustainable green transportation development [1]. According to the “Global Electric Vehicle Outlook 2025” report [2], electric vehicle sales accounted for 20% of global vehicle sales in 2024, with China contributing 70% of total global electric vehicle sales. China has achieved the largest and fastest promotion and adoption of electric vehicles worldwide [3]. However, market penetration of electric vehicles still needs to be improved [4]. Promoting the development and adoption of electric vehicles and accelerating the replacement of traditional fuel vehicles are of great significance for achieving the “dual carbon” goals, advancing the green and low-carbon transformation of transportation [5], and facilitating the sustainable development of the “transport-energy-environment” system [6].
To promote the high-quality and sustainable development of the electric vehicle industry, the Chinese government has consecutively implemented a series of incentive policies, including purchase subsidies, trade-in programs, and vehicle purchase tax reductions [7,8]. These policies have stimulated the consumer market for electric vehicles, driving technological innovation in the industry and facilitating green upgrades throughout the industrial chain. However, with the gradual reduction in subsidy intensity, the rapid industry expansion has led to a decline in consumer satisfaction and an iteration in demand structure, which has become a critical bottleneck limiting the high-quality and sustainable development of the sector. Concurrently, the proliferation of the internet has enabled users to post a substantial volume of reviews on electric vehicles, containing rich information regarding user sentiment, product experience, and demand. This provides robust data support for analyzing user preferences, guiding product and service improvement, and optimizing policy formulation. Fully extracting consumer needs and concerns holds significant practical importance and value for the optimization and upgrading of the entire industrial chain and for promoting sustainable development of green and low-carbon transportation.
From a perspective of sustainable development, the widespread adoption of electric vehicles depends not only on technological advancements but also on user acceptance and continuous usage intentions. If negative user experiences are not effectively addressed, they can erode market trust, hinder word-of-mouth dissemination, and consequently impact the large-scale development of the industry and environmental benefits. Currently, the industry is in a critical transition from “policy-driven” to “market-driven” dynamics. Gaining in-depth understanding of users’ concerns and how their focus shifts is essential for optimizing products and enhancing the sustainability quality of the industry. However, traditional manual analysis methods struggle to cope with large-scale review texts. Leveraging natural language processing techniques for intelligent mining of review data has become a key concern for both academia and industry, serving as a crucial data foundation and decision-making prerequisite for supporting the sustainable development of the vehicle industry.
Sentiment analysis and topic mining, as core techniques of text mining, have been widely applied in fields such as e-commerce [9,10] and social media [11]. To promote the development of electric vehicles, extensive research has been conducted by scholars both domestically and internationally. Foreign researchers primarily rely on questionnaire surveys and interview data [12], whereas domestic scholars focus more on text mining and topic identification methods [13]. However, foreign studies are often limited by small sample sizes, making it difficult to comprehensively capture the authentic needs of a large consumer base. Conversely, domestic research tends to concentrate solely on topic identification, lacking detailed exploration of fine-grained sentiment features, which results in insufficient mining of consumer demands. Sentiment analysis mainly relies on sentiment lexicon-based methods [14], machine learning techniques [15], and deep learning approaches [16]. Existing studies have made certain progress in leveraging natural language processing techniques to mine user reviews of electric vehicles; however, several limitations remain. First, in sentiment analysis, current methods struggle to accurately capture emotional logic within complex semantic contexts. While lexicon-based methods offer strong interpretability, they face limitations in handling complex and diverse emotions; machine learning methods improve precision over lexicon approaches but still have room to enhance efficiency and accuracy. With the advancement of deep learning technologies in recent years, models such as BERT (Bidirectional Encoder Representations from Transformers) [17] and LSTM (Long Short-Term Memory) [18] have been introduced, demonstrating superior capability in capturing deeper sentiment features within electric vehicles reviews. Nevertheless, for longer texts, current studies have yet to adequately address challenges posed by long-distance feature attenuation and the capture of cross-sentence semantic correlations in complex semantic contexts, which adversely affect sentiment classification accuracy. Relying solely on the BERT model for text sentiment classification presents limitations in modeling long sequences, making it difficult to accurately capture cross-sentence emotional logic and syntactic dependencies, as well as to focus on key emotional lexicons. Second, in the analysis of the relationship between sentiment and topics, most research treats sentiment analysis and topic mining as independent tasks, lacking systematic investigation into the “sentiment-topic” interrelationships. This hampers the ability to reveal which specific issues users focus on under different emotional states and makes it challenging to provide precise guidance for product optimization and policy formulation. Furthermore, seldom focusing on the dynamic temporal changes in sentiment-topic prominence, limiting insights into the evolving trends of user needs. Additionally, existing studies predominantly rely on data from a single automotive forum [19], which to some extent limits the generalizability of their conclusions. To overcome the above limitations, this study aims to develop an advanced deep learning-based sentiment classification model to enhance the accuracy of electric vehicle review text classification. A joint “emotion-topic” analysis framework for electric vehicle reviews will be constructed to provide data-driven insights for product optimization, policy improvement, and the sustainable development of green, low-carbon transportation. Based on this objective, the study proposes the following research questions:
RQ1: How does the proposed model improve the performance of sentiment classification for electric vehicle reviews in complex semantic environments, and what is the extent of the improvement?
RQ2: What are the positive and negative emotional themes in reviews of electric vehicles, and how do they differ? How does the attention to negative emotional themes evolve over time?
RQ3: Based on the analysis results, what feasible recommendations can be provided to consumers, automakers, and policymakers to promote the sustainable development of the vehicle industry and support the transition to green, low-carbon transportation?
To address the above questions, this study focused on user reviews of electric vehicles, collecting multi-source data from Autohome, Yiche, and the China Automobile Quality Inspection Network. A comprehensive review dataset covering the entire user feedback process from pre-purchase, to purchase, and post-use was constructed to overcome the limitations of single data sources and enhance the applicability and representativeness of the research findings. To more accurately analyze the complex sentiment orientations in the reviews, this study improves the Bi-xLSTM (Bidirectional Extended Long Short-Term Memory) model and proposes a BERT-Bi-xLSTM-Attention deep learning sentiment classification model. The xLSTM addresses the problems of gradient vanishing, limited memory capacity in standard BiLSTM when handling long sequences, and possesses stronger long-distance dependency modeling capabilities, larger memory capacity, and more efficient computational performance. This model utilizes BERT to convert texts into word vectors and perform initial feature extraction, then employs Bi-xLSTM to capture long-distance dependencies and cross-sentence semantic associations, and incorporates an attention mechanism to weight key sentiment words. Finally, a Softmax classifier outputs the sentiment classification results.
A joint sentiment-topic analysis framework was constructed. After sentiment classification, LDA (Latent Dirichlet Allocation) topic modeling is applied to reviews of different sentiments, combined with semantic network analysis for in-depth analysis. Furthermore, by integrating time series to examine the dynamic changes in attention to negative review topics, thereby gaining deeper insights into user needs and focal concerns. The study’s findings not only offer valuable purchase references for consumers but also assist manufacturers in optimizing product design and service experience. Furthermore, these findings support policymakers in refining industry sustainable development strategies, ultimately promoting the coordinated and sustainable development of the electric vehicle industry and the green, low-carbon transportation system.
The significant contributions of this work are as follows:
1. Methodological Contributions
A deep learning analysis framework adapted to complex user reviews in the electric vehicle domain has been proposed. To address the challenge of long-distance feature attenuation and difficulty in capturing cross-sentence semantic relationships in complex semantic environments—issues that affect the accuracy of sentiment classification—this study introduces a BERT-Bi-xLSTM-Attention deep learning sentiment classification model. Experimental evaluations demonstrate that this model significantly outperforms benchmark models. The results indicate that this model achieves superior classification performance compared to baseline models.
2. Data-Level Contributions
The scope of data coverage has been expanded. Data collected from multiple platforms were used to construct a comprehensive review dataset covering the entire user feedback process—from “pre-purchase” through “purchase” to “post-use”—ensuring both breadth and depth of the data.
3. Analytical Framework Contributions
A combined sentiment-topic mining analysis framework was developed. By integrating time series analysis with negative emotional topics, the framework visualizes the changes in attention to negative review themes, providing an intuitive depiction of how concern over these themes evolves dynamically over time. This offers a new perspective for research on electric vehicle reviews.
4. Management and Practical Contributions
The research helps manufacturers of electric vehicles accurately identify potential causes of negative user emotions, providing data support to optimize decision-making for automakers and relevant management departments. It also offers reference guidance for consumers in their purchasing decisions, thus promoting the high-quality and sustainable development of the vehicle market, and further supporting the advancement of green, sustainable transportation.
The remainder of this paper is structured as follows: Section 2 provides a review of related work. Section 3 presents the construction of a BERT-Bi-xLSTM-Attention model for the electric vehicle domain. Section 4 conducts different sentiment topic mining based on sentiment classification results. Section 5 discusses the results. Section 6 presents the conclusions of the paper.
2. Related Work
This section adopts a two-layer progressive logic of research object and research method. Section 2.1 focuses on research in the electric vehicle domain, systematically reviewing studies on electric vehicle user reviews and their links to sustainability, aiming to identify research gaps for RQ2 and RQ3. Section 2.2 focuses on research methods, reviewing the evolution of sentiment classification technologies, aiming to provide a technical foundation and innovation points for RQ1.
2.1. Research on Electric Vehicle
With the rapid development of the electric vehicles industry, user reviews have become a crucial data source for analyzing consumer demands. To promote the advancement of electric vehicles, numerous studies have been conducted both domestically and internationally. In international research, for example, Bielski et al. [20] analyzed factors influencing purchase decisions based on 103 surveys of Polish users; Gómez Vilchez et al. [21] examined the role of price factors in European users’ choices; Anton et al. [22] investigated the impact of energy efficiency on consumer selection through interview data; and Krishna [23] identified factors affecting electric vehicle purchases via topic analysis, revealing that users prioritize concerns about driving range. Although foreign studies primarily rely on interview data, the limited data scale makes it difficult to comprehensively capture the genuine demands of a large consumer base. Domestic scholars tend to focus more on text mining and topic identification methods. Zeng et al. [24] utilized data mining techniques to identify users’ focal points; Bai et al. [25] conducted an in-depth analysis of the differences between policy themes and government attitudes through topic modeling; Liu et al. [26] employed text mining to reveal shortcomings in the content of electric vehicle policies. However, most existing research emphasizes policy or review topic identification while neglecting fine-grained sentiment impacts and dynamic temporal analysis of topic attention evolution. Additionally, many studies draw data from single platforms [27], limiting in-depth analysis of user needs and attention dynamics. At the level of sustainable development, scholars have analyzed the relationship between electric vehicles and sustainable development goals from economic and environmental perspectives [28]; Tyagi et al. [29] assessed electric vehicles’ contributions to sustainable development goals from a technological standpoint. Moreover, electric vehicles will continue to play a leading role in the future [30]. These studies offer valuable references linking electric vehicle industry development with sustainability goals but are mainly based on macro-level techno-economic analyses lacking support from micro-level consumer behavior data. With the advent of the big data era, users have generated massive amounts of online reviews on internet platforms, providing rich data support for research.
2.2. Research on Text Emotion Classification Methods
Sentiment analysis has been widely applied in the field of electric vehicles, yet efficiently and accurately extracting sentiment from vast textual data remains a major challenge. Over recent years, significant advances have been made in text sentiment classification, primarily through three key approaches: lexicon-based methods, traditional machine learning, and deep learning. The lexicon-based approach determines the overall sentiment by building sentiment lexicons and tallying sentiment words within the text [31]. As these lexicons have been continuously refined and expanded, classification accuracy has improved accordingly [32]. However, this method tends to work better for straightforward sentiment analyses and still struggles to fully capture the nuances of more complex information.
Machine learning overcomes the limitations of lexicon-based methods. Pang et al. [33] were the first to demonstrate that machine learning techniques out-perform manual classification. Common machine learning algorithms include SVM (Support Vector Machines) [34] and RF (Random Forests) [35], among others. However, machine learning approaches require large amounts of manually annotated data, and subjective human factors can influence the results, limiting efficiency and accuracy. In contrast, deep learning does not require manual intervention.
Deep neural network models have overcome certain limitations of machine learning [36] and can achieve more accurate sentiment classification. Commonly used deep learning algorithms such as RNN (Recurrent Neural Networks), LSTM, and attention mechanisms are widely applied in sentiment classification research. Arshed et al. [37] applied an LSTM model for text sentiment classification, achieving an accuracy of 71.1%. However, LSTM exhibits notable limitations when processing long texts, including difficulty in capturing long-range dependencies, emotional shifts within sentences, and inefficiencies due to inability to perform parallel computation, resulting in slower training speeds.
To address the aforementioned limitations, the xLSTM (Extended Long Short-Term Memory) model was proposed in 2024 [38]. By incorporating a matrix memory structure and an exponential gating mechanism, this model supports fully parallel training and significantly enhances the capability of modeling long sequential data. Since the introduction of the BERT pre-trained model in 2018, its powerful text representation has established it as the predominant pre-trained language model for the vast majority of natural language processing tasks [39]. Yuan et al. replaced Word2Vec with BERT to generate input features, and experimental results showed a 3.96% improvement in text classification accuracy [40]. Liang et al. [41] applied xLSTM to the field of information retrieval and demonstrated through experiments on multiple datasets that xLSTM not only improved accuracy compared to traditional LSTM but also significantly enhanced computational efficiency. Mao et al. [42] proposed an English text classification model based on BERT-xLSTM, which outperformed traditional LSTM across several public datasets, providing important references for optimizing text classification model architectures. Ghasemi et al. [43] enhanced model interpretability by introducing an attention mechanism, resulting in a 0.54% increase in accuracy. Although deep learning significantly outperforms traditional methods in terms of performance, many models still suffer from insufficient interpretability. Current research primarily focuses on model optimization to improve the accuracy and generalization capability of sentiment classification [44], while a deeper understanding of the model decision mechanisms will provide essential methodological support for model optimization in text analysis, representing a key direction for future research [45].
In summary, existing research on electric vehicles faces limitations in both datasets and analytical methods. Regarding data sources, foreign studies largely rely on small-scale interview data, while domestic studies, although utilizing large-scale review text data, are mostly confined to a single platform, making it difficult to comprehensively capture the diversity of user reviews and needs. In terms of methodology, existing sentiment classification methods struggle to address the issues of long-range feature decay and the capture of cross-sentence semantic relationships within the complex semantic context of electric vehicle reviews, while also overlooking key sentiment-related words. Additionally, topic mining and sentiment analysis are often treated as independent tasks, which can lead to the neglect of how sentiment factors influence topic mining. Furthermore, topic mining research lacks consideration from a time-series perspective, overlooking the dynamic evolution of topic popularity and making it difficult to capture trends in user interest.
Based on these analyses, this paper utilizes multi-platform reviews of electric vehicles to analyze user concerns. We propose a sentiment classification model based on BERT-Bi-xLSTM-Attention, which enables bidirectional learning and captures contextual semantic features within complex semantic environments, thereby improving sentiment classification performance. By integrating sentiment analysis with topic mining, we construct a joint sentiment-topic analysis framework. Furthermore, we employ time-series visualization to analyze the evolution trends of negative topic attention, providing a new analytical framework for related research.
3. Data and Methods
3.1. Data Collection and Pre-Processing
This study constructs an integrated framework combining sentiment analysis and topic mining based on online reviews of electric vehicles. The analysis process consists of six steps: (1) data collection; (2) sentiment annotation of the data, dividing it into annotated and unannotated data; (3) data preprocessing; (4) building a BERT-Bi-xLSTM-Attention sentiment classification model to classify the unannotated data, with the resulting classifications used together with the annotated data for subsequent research; (5) sentiment topic mining and analysis based on sentiment classification; and (6) discussion and conclusion. The detailed analytical workflow is shown in Figure 1.
Figure 1.
Research analysis flowchart.
Online reviews of electric vehicles contain abundant valuable information, providing authentic and effective data support for this study. During the data collection phase, after careful evaluation, Autohome (https://www.autohome.com), Yiche (https://www.yiche.com), and China Automotive Quality Inspection Network (https://www.aqsiqauto.com) were selected as the primary data sources. These three platforms possess high market recognition and user engagement within China’s auto-motive industry, thereby comprehensively reflecting consumers’ multidimensional evaluations of electric vehicles. As leading domestic automotive vertical platforms, Autohome and Yiche cover a wide range of age groups, geographic regions, and consumer segments, boasting a large and representative user base. The content on these platforms primarily consists of user experiences, performance evaluations, reports of malfunctions, and purchasing advice. This information is authentic and multifaceted, effectively reflecting genuine user sentiment in the market. China Auto Quality Inspection Network focuses on quality complaints and issue feedback. Its users are primarily car owners experiencing actual vehicle problems, and reviews concentrate on quality defects, after-sales disputes, and detailed fault descriptions, offering greater professionalism and specificity. The three platforms complement each other in terms of user demographics and review content, enabling a comprehensive and objective reflection of domestic automotive user evaluations and providing strong data representativeness.
Based on this, the study constructs a cross-platform review dataset encompassing the complete user feedback process from pre-purchase, purchase, to post-use stages, providing a solid data foundation for subsequent sentiment analysis and topic mining. The advantages of the chosen platforms are summarized in Table 1.
Table 1.
Platform advantage summary.
Data were collected using Python web crawlers over the period from January 2021 to December 2024. Each review includes information such as user name, price, and vehicle model. When scraping data, remove duplicate comments and content posted by suspicious accounts, and filter out garbled text, missing comment content, and short texts with incomplete meaning, retaining only valid, unique comments. Convert all raw scraped text to UTF-8 encoding and normalize HTML characters to ensure consistent text formatting and complete, reliable content. To address the website’s encryption, the corresponding woff font files were downloaded and used to decode the encrypted fonts, thereby obtaining clear, non-garbled review texts. Subsequently, the collected data were cleaned by removing noise content such as web tags, links, special symbols, emoticons, platform-specific tags, and redundant expressions using regular expressions. For text preprocessing, the Jieba tokenizer in Python was employed for word segmentation, and the HIT stopword list was used to filter out stopwords for subsequent experiments. Relying on user IDs and comment content, a combination of hash-based deduplication and text similarity matching was used to sequentially eliminate completely duplicate homogeneous comments, repetitive content posted by the same user, and similar texts, effectively reducing data redundancy. Finally, the comments collected from multiple platforms were normalized in expression. A platform-specific vocabulary mapping table was used to unify platform-specific expressions into standard terminology, while preserving original sentiment intensity words and tagging each comment with its platform source. This approach eliminated terminology discrepancies across platforms while retaining sentiment intensity information and platform-specific features, thereby avoiding misclassification of sentiment polarity and platform bias interference. Data cleansing processes, including deduplication, missing value treatment, and invalid character removal, resulted in 21,001 valid reviews.
This study employs a binary sentiment classification framework based on the differences in tagging mechanisms and data distribution characteristics across the three platforms. Autohome requires users to fill out both the “Most Satisfied” and “Least Satisfied” sections when posting comments, utilizing a mandatory binary tagging mechanism. The system does not provide neutral options or an overall rating, so there are no neutral sentiment samples in the data from this platform. Yiche uses a 1-to-5-point rating system. However, data collection results show that ratings are highly concentrated in the 4–5 range, with very few samples scoring 3 or below. The emotional boundaries are blurred, and the ratings exhibit a significantly positive skew, making it difficult to annotate sentiment based on the platform’s scoring data. China Auto Quality Inspection Network provides only user feedback and complaint content, without defined sentiment labels or a rating system. Based on the data characteristics of the aforementioned platforms, this study adopts a binary sentiment classification framework, incorporating data from Yiche and China Auto Quality Inspection Network into an unlabeled dataset for subsequent sentiment classification by a model.
This study uses comments collected from Autohome as the primary data source and strictly adheres to the dual principles of balanced temporal distribution and balanced sentiment categories to construct the experimental dataset. The experimental dataset contains a total of 10,157 valid samples, of which the “most satisfied” module corresponds to 5125 positive evaluations, and the “most dissatisfied” module corresponds to 5032 negative evaluations. Sentiment polarity was initially labeled based on platform tags: comments marked as “most satisfied” were identified as positive and labeled as “1”; comments marked as “most dissatisfied” were identified as negative and labeled as “−1”.
To ensure the reliability of the sentiment labels in the experimental dataset, 600 samples were randomly selected from the 10,157 labeled samples and independently reviewed by three researchers. The verification results showed that the consistency rate between the manual review results and the platform labels reached 94%, with a Fleiss’ Kappa coefficient of 0.87, indicating that the platform labels can serve as high-quality supervised signals that meet the requirements for model training. To verify the model’s cross-platform generalization capability, 600 samples were randomly selected from both the Yiche and China Automobile Quality Inspection Network datasets for manual annotation. Annotation followed a binary sentiment classification framework and was independently completed by three researchers. After consistency verification, a cross-platform test set was formed. These annotated samples were used solely for evaluating model generalization and for the LDA topic modeling analysis in Section 4; they were not used in model training or debugging.
The experimental dataset was split into training, validation, and test sets according to a 7:1:2 ratio. Part of the electric vehicle reviews is shown in Table 2. The automotive user review dataset from the 2018 CCF Big Data Competition [46], together with the aforementioned annotated datasets from Yiche and China Quality Inspection Network, was utilized to evaluate the model’s generalization capability. Finally, the sentiment classification was performed using the proposed BERT-Bi-xLSTM-Attention model to obtain classification results.
Table 2.
Sample review data.
3.2. BERT-Bi-xLSTM-Attention Model Design
Current research on electric vehicle reviews has not sufficiently ad-dressed issues such as long-distance feature attenuation, the disruption of cross-sentence semantic associations, and the precise highlighting of the intensity of sentiment-bearing words within complex semantic environments. These challenges negatively impact the accuracy of sentiment classification. To overcome these limitations, this study proposes the BERT-Bi-xLSTM-Attention model. This study selected BERT as the text encoder rather than large language models such as LLaMA, primarily based on the alignment between task characteristics and model mechanisms. BERT employs a bidirectional Transformer encoder and is pre-trained using Masked Language Modeling, enabling it to effectively handle polysemous words, implicit sentiment, and colloquial expressions in electric vehicle review texts. Furthermore, its moderate number of parameters ensures high efficiency in sentiment analysis tasks and results in lower computational costs compared to models like LLaMA. Compared to standard recurrent networks such as LSTM and GRU, Bi-xLSTM better mitigates the feature decay issue in long sequences while supporting parallel training. Unlike the O(n2) attention complexity of Transformers, Bi-xLSTM maintains linear O(n) sequence complexity, enhancing training efficiency while capturing long-range bidirectional semantic dependencies, making it better suited for the complex and variable-length nature of electric vehicle review texts. It complements BERT’s bidirectional encoding, with the two working in concert to enhance feature extraction in complex semantic environments. This study introduces an attention mechanism to strengthen the model’s ability to focus on core sentiment information while improving the interpretability of classification results, which aligns closely with the decision-making needs of users, automakers, and policymakers. In summary, the integrated model constructed in this paper combines the complementary strengths of all three approaches. It demonstrates greater stability when addressing issues such as high data noise, complex sentiment expressions, and long semantic spans in electric vehicle review data. Compared to single-model approaches and traditional fusion architectures, it achieves higher classification accuracy and stronger domain adaptability. Figure 2 depicts the overall structure of the proposed model.
Figure 2.
Overall structure of the model.
The specific process is as follows: First, the preprocessed sequence of reviews on electric vehicles is fed into the BERT layer to obtain deeply contextualized word vector representations. The BERT output is then dimension-reduced via a linear layer and fed into the Bi-xLSTM layer to capture deeper contextual dependencies. Within the Bi-xLSTM module, the forward mLSTM (matrix Long Short-Term Memory) captures the historical context, while the backward mLSTM captures future context by means of a flip, with their outputs concatenated to form a global dependency representation. The sLSTM (scalar Long Short-Term Memory) module enhances the ability to capture sentiment shifts. The outputs of these modules are integrated to form new sequence features. Finally, the output from the Bi-xLSTM serves as input to the attention mechanism, which calculates positional weights to emphasize key sentiment words in the sequence, generating the conclusive feature representation of the text. The final sentiment classification result is output by the softmax classifier.
3.2.1. BERT
The deep pre-trained language model BERT [47] is grounded in the Transformer architecture. It employs a bidirectional Transformer encoder and utilizes a self-attention mechanism, allowing each word vector to integrate contextual information from both left and right, thereby more accurately capturing word polysemy and intra-sentence semantic relationships. The input layer of BERT comprises the element-wise sum of three types of embeddings: Token Embeddings represent the semantic content of the word itself, Segment Embeddings distinguish between different sentence segments, and Position Embeddings provide learnable absolute positional encodings. The input text is marked with “[CLS]” at the start and “[SEP]” at the end. Specifically, the input sequence is first converted into embedding vectors, which are then processed by the bidirectional Transformer encoder to generate deep representations rich in contextual semantics. The input representation of BERT is shown in Figure 3.
Figure 3.
Bert input representation. The “##” symbol denotes a subword suffix generated by WordPiece tokenization (e.g., “playing” is split into “play” and “##ing”).
Figure 4 illustrates the pre-training structure of BERT. Here, represent the word embedding vectors of the input sequence, obtained by summing token embeddings, positional encodings, and segment embeddings [48]. After processing by BERT’s bidirectional Transformer encoder, context-dependent contextualized representations are generated, with each integrating semantic information from the entire sequence to support downstream tasks.
Figure 4.
BERT model pre-training structure diagram.
3.2.2. Bi-xLSTM
LSTM [49] is a variant of RNN designed specifically for sequence data processing, effectively capturing long-range dependencies. Although LSTM can remember key in-formation and forget irrelevant content through gating mechanisms, making it suitable for long-sequence sentiment analysis, traditional LSTM relies solely on past information and struggles to capture future contextual information, potentially leading to inaccurate sentiment judgments.
To address these limitations, xLSTM was proposed in May 2024. This architecture includes two variants, sLSTM and mLSTM, utilizing a modular design. sLSTM enhances long-range dependency modeling through exponential gating, while mLSTM employs matrix memory for high-capacity information storage. Coupled with residual connections and layer normalization, xLSTM captures cross-sentence sentiment cues and associates fine-grained sentiment information among multiple entities in the text, significantly improving classification performance. The overall architecture consists of stacked homogeneous or heterogeneous xLSTM modules, each internally adopting either sLSTM or mLSTM. The structure of xLSTM is shown in Figure 5.
Figure 5.
Overall structure of xLSTM.
The cell state of traditional LSTM is a one-dimensional vector, whereas mLSTM extends it to a two-dimensional matrix. Through outer product updates, it achieves high-capacity key-value storage, enabling simultaneous recording of multiple information fragments and their distributed associations. This expands storage capacity and enhances the flexibility of information retrieval. This mechanism allows the model to simultaneously represent multiple “aspect-sentiment” associations within the same matrix space, making it suitable for fine-grained sentiment analysis tasks. The forward computation formula for mLSTM [38] is
where t denotes time, denotes the current cell state, with as the normalized state and as the hidden state. The output gate is represented by , the query, key, and value vectors by , , and , and the input and forget gates by and , respectively. represent the respective offset values.
When processing sentiment texts unidirectionally, traditional xLSTM struggles to simultaneously model the preceding and succeeding semantic contexts of words, often leading to inaccurate sentiment polarity classification. The bidirectional architecture processes text in both forward and backward directions simultaneously, allowing the model to better grasp contextual relationships and avoid losing semantic information that can happen with one-way processing.
Based on retaining the scalar memory unit, sLSTM introduces a novel memory fusion technique and a normalized state constraint, enabling information exchange and integration across multiple levels. This mechanism provides strong support for the multi-head architecture. However, due to the inherent sequential nature of recurrent connections, sLSTM is difficult to parallelize, and bidirectional extension requires coordination across heads, which can increase design complexity. In contrast, mLSTM uses outer product updates and query normalization within matrix-stored memory, eliminating recurrent connections between hidden layers and achieving fully parallel computation, thereby providing a more straightforward architectural foundation for bidirectional extension. For text classification tasks, mLSTM’s capacity for modeling long-range dependencies enhances classification performance, and its parallelization capability improves training efficiency in large-scale scenarios. This advantage enables mLSTM, when adapted bidirectionally, to significantly boost text classification accuracy and strengthen hierarchical feature extraction.
Based on this, the study proposes an improved bidirectional xLSTM model, composed of alternating stacked Bi-mLSTM and sLSTM layers. The Bi-mLSTM layers encode forward and backward sequences separately, processing the backward sequence via a flipping operation. The concatenated bidirectional contextual representations are aggregated via a one-dimensional convolutional layer (Conv1D) for feature extraction. Bi-xLSTM effectively learns complex dependencies within the text, thereby enhancing data utilization efficiency and text classification accuracy. The calculation formula is as follows:
The structure of the Bi-mLSTM model is shown in Figure 6.
Figure 6.
Bi-mLSTM model structure diagram.
Furthermore, traditional LSTM relies on the sigmoid gate function for information regulation, limiting the extent of memory state updates and often causing long-range semantic information attenuation in text classification tasks. xLSTM introduces an exponential activation function, enabling the input and forget gates to dynamically regulate memory updates in an exponential manner. This design allows for more efficient semantic information flow and improved extraction of category-discriminative features in text classification. Consequently, the model can more effectively adjust deep semantic representations of the text, rapidly integrate key terms with contextual information, and correspondingly update category-relevant memory states, thereby enhancing classification performance on long texts with com-plex semantic relationships.
3.2.3. Attention
In sentiment classification tasks for electric vehicle reviews, different words vary in their importance to classification decisions. Introducing an attention mechanism can better capture the dependencies among words, enhance focus on sentiment-relevant key terms, and thereby further improve classification accuracy. The formula is as follows:
where is the output of the Bi-xLSTM, is the attention weight matrix, and is the bias term. Equation (11) obtains the feature representation vector by applying a nonlinear transformation to via the tanh activation function; is the transpose of the attention vector , is the attention weight, N is the sequence length, and is the weighted vector of the preceding and following sentences, representing a weighted aggregated representation of the Bi-xLSTM output. Finally, the resulting vector representation is fed into a softmax classifier to obtain the final sentiment classification result.
3.2.4. TF-IDF
During text vectorization, TF-IDF preserves the local importance of words within individual reviews while using inverse document frequency to reduce the weight meaningless generic terms and upweight distinctive topic-relevant terms, thereby providing accurate and interpretable text features for subsequent topic modeling. This paper utilizes TF-IDF (term frequency-inverse document frequency) to perform weighted text vectorization for subsequent topic modeling. represents the frequency of word in document , with higher term frequency generally indicating stronger representational power of the word for that document. Here, denotes the number of occurrences of word in document , and indicates the total number of words in document . The formula is as follows [50]:
quantifies a word’s overall significance across a document set; if a word appears in more documents, its discriminative power decreases, resulting in a lower IDF value. Here, represents the total document count, and indicates how many documents include the word . indicates the importance of a word.
3.2.5. LDA
LDA can be used to discover latent topic distribution patterns within texts. The core concept is that each document represents a probability distribution of multiple topics, denoted as , each topic corresponds to a probability distribution over a set of words, expressed as . Therefore, the probability distribution of an individual word within a document is given by [51]
LDA is a three-layer structural topic model based on the Bayesian probabilities of words, topics, and documents. As shown in Figure 7, the model structure includes: with K indicating the total topics and M the total reviews, and N as the total word count per review. and represent the probability distributions of reviews-topics and topics-words, respectively, with and being the Dirichlet hyperparameters for and . The topic assignment for the word in review is denoted by , while represents the observed value of the word in the review . Arrows indicate the probability dependencies between nodes.
Figure 7.
Directed probabilistic graphical model for LDA.
Coherence and perplexity are applied here to establish the most suitable value for K [52]. Coherence is used to measure the semantic interpretability of topics; a higher coherence value indicates greater interpretability of the topic. Perplexity is used to evaluate the model’s ability to predict text; a lower value indicates stronger predictive capability. These two metrics complement each other: coherence ensures topic quality, while perplexity ensures model stability. Using both metrics simultaneously helps avoid over-reliance on a single metric. Therefore, by balancing these two metrics, we determine the optimal number of topics. Coherence and Perplexity are calculated for each value of K, and the optimal value of K is determined by analyzing the curves of both metrics and identifying their inflection points. The coherence formula is as follows:
where denotes the coherence score of topic , where is the set of topic words and represents the total number of topic words. The is the normalized point mutual information, measuring the statistical association strength between word pairs. and are the vector representations of word and word , respectively. , are the edge probabilities of word and word , and is the joint probability of the word pair. The perplexity formula is as follows:
where refers to the word probabilities in document , with as its total word count, and is the total number of reviews. The lower this metric value, the better.
To reveal the temporal evolution characteristics of attention to negative review topics, for documents in time period , the temporal intensity of topic is calculated as
where represents the probability estimate of topic in the topic distribution of document . A higher value indicates greater average prominence of the topic during the corresponding time period.
3.3. Experimental Results and Analysis
3.3.1. Parameter Settings
Python 3.8 was used as the coding tool for this study. The model was constructed using the deep learning framework PyTorch (version 2.0.1), and Jupyter Notebook (version 6.5.4) was employed for visualizing subsequent analyses. Experimental parameter settings are detailed in Table 3.
Table 3.
Parameter settings.
3.3.2. Evaluation Indicators
To comprehensively evaluate the performance of sentiment classification, this study evaluates the model using four metrics: accuracy, precision, recall, and F1 score [53]. Accuracy measures overall correctness and serves as the primary metric for direct comparison with baseline studies. Precision and recall assess the model’s ability to avoid false positives and false negatives, respectively, which is crucial for understanding misclassification patterns. When the costs of false positives and false negatives are equal, the F1 score provides a balanced measure. These four metrics ensure a comprehensive evaluation of the model’s overall performance. The calculation formulas are as follows:
where refer to the number of positive reviews correctly predicted as positive; denote the number of negative reviews correctly predicted as negative; represent the number of negative reviews incorrectly predicted as positive; indicate the number of positive reviews incorrectly predicted as negative.
3.3.3. Comparison and Analysis of Different Model Performance
To more effectively assess the performance of the developed model, it was compared on the experimental dataset with the following models: LSTM, BiLSTM, xLSTM, Bi-xLSTM, Bi-xLSTM-Attention, BERT, BERT-BiLSTM-Attention, BERT-Bi-xLSTM, RoBERTa, ERNIE, LLaMA and BERT-Bi-xLSTM-Attention. Table 4 and Figure 8 display the results of the comparative experiments.
Table 4.
Performance comparison of different models.
Figure 8.
Model comparison chart.
As shown in Table 4 and Figure 8, the BERT-Bi-xLSTM-Attention model outperforms other models in sentiment classification. Its accuracy, recall, precision, and F1-score reach 93.23%, 93.26%, 93.21%, and 93.28%, respectively. Compared with Bi-xLSTM, the BERT-Bi-xLSTM model improves the F1-score by 4.47%. Compared with Bi-xLSTM-Attention, the BERT-Bi-xLSTM-Attention model achieves increases in F1 score of 6.95%, respectively. This demonstrates that the BERT pre-trained model can better dynamically extract deep contextual features, thereby enhancing classification performance. Compared with LSTM, xLSTM achieves an 8.44% improvement in F1 score. Furthermore, Bi-xLSTM shows significant gains across various metrics compared to BiLSTM and xLSTM, indicating that Bi-xLSTM performs better in complex semantic environments by effectively capturing long-distance feature information and cross-sentence semantic associations. Compared to BERT-Bi-xLSTM, the BERT-Bi-xLSTM-Attention model improves the F1 score by 2.8%, demonstrating that the incorporation of an attention mechanism highlights key sentiment words and enhances classification accuracy. The BERT-Bi-xLSTM-Attention model proposed in this study achieved an F1 score improvement of 15.88% over the LSTM model and a 5.50% increase compared to the BERT model, demonstrating superior performance over the two baseline models. Compared with mainstream pre-trained baseline models such as RoBERTa, ERNIE and LLaMA, the proposed model improves the F1-score by 2.74%, 1.98% and 1.5%, respectively, demonstrating its superior ability to capture complex emotional expressions in electric vehicle reviews. Even when compared with advanced pre-trained models such as RoBERTa, ERNIE and LLaMA, the BERT-Bi-xLSTM-Attention model still maintains a clear performance advantage, proving that the architecture combining deep contextual understanding, enhanced sequence modeling and attention weighting can achieve more robust and accurate sentiment classification. It can be seen that the model proposed in this paper effectively overcomes the shortcomings of traditional LSTM, including long-distance feature attenuation in complex semantic environments, disruption of cross-sentence semantic associations, and the failure to accurately highlight emotional feature words. This model addresses these issues and exhibits excellent performance in the sentiment classification of electric vehicle reviews, significantly outperforming other comparative models and thereby validating its effectiveness and practical applicability.
3.3.4. Ablation Study
In this study, accuracy and F1-score were uniformly adopted as evaluation metrics in ablation experiments, statistical significance tests, and parameter sensitivity analyses to ensure the consistency, comparability, and reliability of performance evaluation.
To validate the effectiveness of each module in the proposed BERT-Bi-xLSTM-Attention model, we conducted ablation experiments on a dataset of electric vehicle reviews. We ran multiple experiments under identical settings, using accuracy and F1 score as performance metrics, and reported the average results across these experiments.
The ablation experiments were designed as follows, with results shown in Table 5:
Table 5.
Module ablation experiment table.
1. BERT-Bi-xLSTM: Combines BERT and Bi-xLSTM, with the attention mechanism module removed;
2. Bi-xLSTM-Attention: Combines Bi-xLSTM with the attention mechanism, removing the BERT module;
3. BERT-Attention: Combines BERT with the attention mechanism, removing the Bi-xLSTM module;
4. BERT-BiLSTM-Attention: Replaces Bi-xLSTM with BiLSTM to validate the effectiveness of Bi-xLSTM
5. BERT-xLSTM-Attention: Replaces Bi-xLSTM with xLSTM to validate the importance of bidirectional processing;
6. BERT-Bi-xLSTM-Attention: The complete hybrid model proposed in this study, integrating three major modules: BERT, Bi-xLSTM (using Conv1D for feature integration), and the attention mechanism.
As shown in Table 5, replacing Bi-xLSTM with a standard BiLSTM resulted in a 2.32% decrease in accuracy and a 3.93% decrease in F1 score. This indicates that, compared to the standard BiLSTM, Bi-xLSTM is better able to capture long-range dependencies in reviews of electric vehicles. Replacing Bi-xLSTM with a unidirectional xLSTM resulted in a 1.66% decrease in accuracy and a 2.89% decrease in F1 score, demonstrating the necessity of bidirectional encoding. Removing the Bi-xLSTM module led to a 3.76% decrease in accuracy and a 5.12% decrease in F1 score, illustrating the necessity of the Bi-xLSTM module. Removing the BERT module resulted in a 4.28% drop in accuracy and a 5.8% decrease in F1 score, proving the effectiveness of the BERT module for this task. Removing the attention module led to a 0.84% drop in accuracy and a 1.90% decrease in F1 score, demonstrating the effectiveness of the attention module; the introduction of the attention mechanism enables more effective identification of sentiment keywords.
To verify the necessity of using Conv1D for feature integration in the Bi-xLSTM, we designed the following ablation experiments comparing different feature fusion strategies; the results are shown in Table 6.
Table 6.
Comparison of feature fusion methods.
7. BERT-Bi-xLSTM-Attention: In this model, the Bi-xLSTM layers use fully connected layer for feature integration
8. BERT-Bi-xLSTM-Attention: where the Bi-xLSTM layer uses direct concatenation for feature integration
9. BERT-Bi-xLSTM-Attention: where the Bi-xLSTM layer uses average pooling for feature integration
10. BERT-Bi-xLSTM-Attention: where the Bi-xLSTM layer uses Conv1D for feature integration
As shown in Table 6, directly concatenating the bidirectional outputs results in a 2.17% decrease in accuracy and a 3% decrease in F1 score compared to using Conv1D. Using average pooling results in a 1.98% decrease in accuracy and a 2.82% decrease in F1 score compared to using Conv1D. Although average pooling reduces dimensionality, it results in information loss. Using fully connected layers is prone to overfitting, leading to a 1.49% decrease in accuracy and a 2.41% decrease in F1 score compared to Conv1D. Conv1D resolves the issues of disordered features and high dimensional redundancy after bidirectional concatenation. By utilizing sliding convolutional kernels to achieve local bidirectional feature interaction and dynamically fuse contextual information, it represents the optimal integration method.
3.3.5. Statistical Validation
To evaluate the statistical significance of the performance enhancement achieved by the BERT-Bi-xLSTM-Attention model, paired sample t-tests were carried out against three baseline models: xLSTM, Bi-xLSTM, and BERT-Bi-xLSTM. These tests were based on multiple independent runs evaluating accuracy and F1-score to ensure the reliability of the performance comparison. To ensure the reproducibility and fairness of the comparison results, all models were tested under identical experimental conditions: a uniform random seed was used, the dataset was independently shuffled and split, and model parameters were reinitialized for each run to eliminate interference caused by training order and initialization. The variations observed across the 10 repeated experiments stem solely from the inherent randomness of the model training process, effectively controlling the effects of overfitting and random factors. According to the Central Limit Theorem, the performance differences across the 10 repeated experiments approximately follow a normal distribution, satisfying the prerequisites for a paired t-test, thereby enhancing the rigor and credibility of the performance comparison conclusions. As shown in Table 7, BERT-Bi-xLSTM-Attention significantly outperforms all three baseline models across all metrics, indicating that the observed performance improvements are statistically significant.
Table 7.
Paired t-test results.
3.3.6. Parameter Sensitivity Analysis
To verify the robustness of the parameter selection, this paper conducts a sensitivity analysis on five key hyperparameters of the BERT-Bi-xLSTM-Attention model: Epochs, Learning Rate, Hidden Size, Dropout, and Batch Size. As shown in Figure 9, the model’s accuracy begins to rise as the number of epochs increases, reaching its peak at the 10th iteration, and the gap in accuracy between the test set and the training set also narrows progressively. Figure 9 clearly shows that as the number of model iterations increases, the loss value decreases significantly and eventually stabilizes, while the gap in loss values between the training and test sets also narrows. Combining the trends shown in the two figures, the Epoch value is set to 10, and the following parameter sensitivity analysis is conducted based on this setting.
Figure 9.
(a) Model accuracy vs. epoch line graph. (b) Model loss vs. epoch line graph.
As shown in Figure 10a, both accuracy and F1 score first increase and then decrease as the learning rate increases. When the learning rate is set to 5 × 10⁻⁵, the model achieves optimal accuracy and F1 score. Both excessively high and excessively low learning rates lead to a decline in performance; therefore, the learning rate is set to 5 × 10⁻⁵. As shown in Figure 10b, model performance is optimal when the hidden layer size is 256. If the hidden layer size is increased further, both accuracy and F1 score actually decrease, indicating that excessive scale can lead to overfitting; therefore, a hidden layer size of 256 is selected. As shown in Figure 10c, accuracy and F1 score are highest when the dropout rate is set to 0.2; a rate that is too high will weaken the model’s learning ability, so a value of 0.2 is adopted. As shown in Figure 10d, accuracy reaches its peak when the batch size is 128. A batch size that is too small can lead to unstable gradients, while one that is too large can cause the model to get stuck in a local optimum; therefore, 128 is selected. Consequently, the parameter combinations selected in this paper all fall within the performance peak ranges for each metric, demonstrating good stability.
Figure 10.
Parameter sensitivity analysis chart. (a) Performance under different learning rates; (b) performance under different batch sizes; (c) performance under different dropout rates; (d) performance under different hidden sizes.
3.3.7. Generalization and Stability Tests
To validate the model’s generalization ability and stability, this study conducted comparative experiments on the electric vehicle review dataset, the Yiche annotated dataset, the Quality Inspection Network annotated dataset and the 2018 CCF Big Data Competition automotive review dataset. Five-fold cross-validation was employed on the Yiche annotated dataset, the Quality Inspection Network annotated dataset and the public CCF dataset, with the average accuracy and F1-score across the folds used as performance metrics, and the standard deviation employed to measure the stability of the model results. As shown in Table 8, the BERT-Bi-xLSTM-Attention model proposed in this paper achieves an accuracy of 0.9323 on the electric vehicle review dataset, and an F1 score of 0.9328. On the publicly available CCF dataset, the Yiche dataset, and the China Quality Inspection Network review dataset, the model’s accuracy reached 0.9045, 0.9102, and 0.9079, respectively, with F1 scores all exceeding 0.9. Furthermore, with the optimization of the model architecture, the standard deviation (Std) across different datasets shows a significant downward trend. On the CCF dataset, the Yiche annotated dataset, and the China Quality Inspection Network review annotated dataset, the standard deviations are only 0.48%, 0.46%, and 0.47%, respectively. Compared to the performance on the experimental, the models exhibited only a slight performance drop on the CCF dataset, the Yiche annotated dataset, and the China Quality Inspection Network review annotated dataset, demonstrating strong generalization capabilities. Furthermore, the low standard deviation indicates that the models possess good stability.
Table 8.
Comparison results across different datasets.
4. Results
This study employs the BERT-Bi-xLSTM-Attention model to conduct sentiment analysis on 21,001 collected electric vehicle reviews. Initial annotations were made based on platform classifications; for unlabeled reviews, sentiment polarity was assigned according to the model’s classification results. The model labels positive reviews as “1”, and negative reviews as “−1”. The classification results, shown in Table 9, indicate that positive reviews constitute 58.8%, and negative reviews 41.2%. Subsequently, the preprocessed raw data were divided into positive and negative review datasets based on these labels for subsequent sentiment-topic mining analysis.
Table 9.
Proportion of positive and negative reviews.
4.1. Determine the Number of Topics
The quantity of topics is decided based on evaluating Perplexity and Coherence measures. A lower Perplexity value indicates stronger predictive ability of the model for the text, while a higher Coherence value signifies greater interpretability of the topics. This study involved adjusting the number of themes within a reasonable range, calculating the corresponding perplexity and coherence scores for each, and plotting the metric variation curves to visually observe the patterns of numerical fluctuations. Figure 11 shows the coherence score for the positive emotion theme. Figure 12 depicts the perplexity score for the positive emotion theme. Figure 13 presents the coherence score for the negative emotion theme. Figure 14 illustrates the perplexity score for the negative emotion theme. Therefore, the number of topics is determined by balancing these two metrics [54]. Regarding the selection of the number of positive review topics, the results of the metric experiments are shown in Figure 11. Coherence peaks when the number of topics is 5. As shown in Figure 12, perplexity reaches its lowest value when the number of topics is 5. As the number of topics increases, coherence decreases and perplexity increases. Therefore, we select 5 as the number of positive review topics to balance statistical performance and semantic interpretability. Regarding the selection of the number of negative review topics, Figure 13 shows that Coherence approaches its peak when the number of topics is 4. Figure 14 indicates that Perplexity is lowest at a value of 4, with optimal semantic distinction among topics. Therefore, the number of negative review topics is set to 4. The combined selection of these two metrics balances the objectivity of statistical indicators with the interpretability of topics, providing a reliable basis for subsequent topic modeling.
Figure 11.
Positive emotion theme coherence score.
Figure 12.
Positive emotion theme perplexity score.
Figure 13.
Negative emotion theme coherence score.
Figure 14.
Negative emotion theme perplexity score.
4.2. Emotional Theme Modeling
Figure 15 and Figure 16 visualizations of the thematic modeling for positive and negative reviews. On the left side of the figure, bubbles represent topics. Larger bubbles indicate a higher frequency of the corresponding topic. The closer the bubbles are to each other, the greater the semantic similarity between the two topics. On the right side, the blue bars represent the global word frequency across the entire corpus. Selecting a topic allows viewing the word frequency within the chosen topic.
Figure 15.
Visualization of positive review topics. The numbered circles represent different topics. The visualization follows the methods in in references [55,56].
Figure 16.
Visualization of negative review topics. Symbols follow the same conventions as defined in Figure 15 [55,56].
4.2.1. Positive Review Topic Modeling
The positive review topics and their representative words are shown in Table 10. Topic 1 covers intelligent technology and driver assistance, accounting for 18.62% of all comments. Smart parking and driver assistance offer significant convenience to users. These features help increase user satisfaction. The XPeng brand appears frequently in this topic, with 596 mentions, with user comments such as “XPeng’s smart driving is truly hassle-free; the automated navigation driving is incredibly useful” and “I bought an XPeng specifically for its smart features; the infotainment system is smooth, and the voice assistant ‘Xiao P’ is incredibly user-friendly,” indicating that the brand’s smart features have garnered widespread approval and may become a defining aspect of its brand image in the future.
Table 10.
Positive review topics.
Topic 2 relates to space comfort and seat layout, which appeared with the lowest frequency in all comments, accounting for 14.23%. It highlights how practical the vehicle’s space is, such as the legroom in the back seats, the size of the trunk, and how comfortable the seats are. Although this topic makes up a smaller portion of the discussion, it plays an important role for family users. Especially when several family members travel together. Representative comments include “The rear-seat space is spacious—more than enough for family use” and “The seats are incredibly comfortable; long drives with friends are no problem.” Consequently, interior space and comfort have become key considerations in the purchasing decision.
Topic 3 focuses on driving experience and vehicle performance, accounting for 14.77% of all comments. Most users give positive feedback on their driving experience. The design and technology have been steadily improved to better meet user needs. Representative comments on this theme include: “The chassis feels solid, the steering is linear, and the braking force is well-calibrated—it’s clearly been professionally tuned,” and “Lane changes at high speeds are stable without any wobble, and the suspension provides adequate support; the difference is very noticeable when compared to driving a gasoline-powered car.” The language used in these comments is relatively technical, indicating that they mostly come from users with driving experience who have high expectations for vehicle performance.
Topic 4 relates to driving range, charging, and purchasing decisions, which appeared most frequently, accounting for 32.30% of the total. Typical feedback includes “test drive confirmed range meets daily needs,” with 67% stressing the importance of test drives and 42% discussing purchase service experiences. This topic has the highest volume of reviews, reflecting consumers’ strong attention to the core functional attributes of vehicles, with range performance being the primary factor influencing purchase decisions.
Topic 5 mainly focuses on the exterior design and styling of electric vehicles, an important factor affecting consumers’ purchase decisions, this theme accounts for 20.08% of all comments. High-frequency words such as “appearance,” “design,” “styling,” “color,” and “attractive” demonstrate users’ aesthetic preferences. Additionally, factors such as “interior,” “materials,” and “style” highlight users’ attention to the details of cabin decoration and design elements, which play a significant role in their driving and riding experience.
To comprehensively analyze the relevance of the text content, the semantic network diagram of reviews is constructed to explore the relevance. Figure 17 depicts the semantic network graph of positive reviews, while Figure 18 shows that of negative reviews. The semantic network diagram was created using Jupyter Notebook, with visualization achieved by calling upon Python’s networkx and matplotlib libraries. The nodes in the diagram represent core keywords in the text, with node size proportional to their frequency of occurrence; the lines and arrows connecting the nodes indicate directed co-occurrence relationships between keywords, with the direction of the arrows signifying the flow of semantic associations; The thickness of the lines represents the strength of the association between keyword nodes; thicker lines indicate a stronger co-occurrence between nodes in the comments, as well as more significant semantic associations and intrinsic connections, while thinner lines indicate weaker associations; different colors are used to distinguish different semantic clusters. The co-occurrence threshold is set at a co-occurrence frequency of ≥3, retaining only valid associations that meet this threshold to filter out low-frequency noise; edge weights are calculated using Salton’s cosine similarity, normalized based on co-occurrence frequency to eliminate the influence of word frequency differences. Some nodes do not form connections with other nodes; these nodes represent isolated feature words with low occurrence frequency and weak semantic associations, reflecting only local information and failing to meet the conditions for forming stable associations. By eliminating weak co-occurrence relationships, network redundancy and random noise can be effectively reduced, highlighting the core associative structure with substantive semantic connections. This allows the network to focus more on the intrinsic logic of keywords rather than merely the accumulation of high-frequency co-occurrences. The associations presented by this network are not merely the accidental result of high-frequency co-occurrence. Its topological structure exhibits distinct small-world and scale-free characteristics, and there are clear semantic logic and user-cognitive associations between word pairs.
Figure 17.
Positive review semantic network diagram. Nodes represent keywords, with size proportional to term frequency; lines and directed arrows indicate co-occurrence relationships and semantic association direction; line thickness reflects co-occurrence strength; and different colors indicate distinct semantic clusters.
Figure 18.
Negative review semantic network diagram. Symbols follow the same conventions as defined in Figure 17.
Analysis of the positive topics and Figure 17 reveals that “Range” and “Battery” are linked, indicating that users prefer electric vehicles with stable driving ranges. This reflects recognition of manufacturers’ technological capabilities and existing battery technologies. Words like “Seat,” “Rear seat,” and “Space” are also interconnected, highlighting that seat design, space, and ride comfort are key concerns for users. “Service” and “Experience” suggest that besides objective hardware conditions, pre-sale and after-sale services from manufacturers are also important considerations for buyers.
4.2.2. Negative Review Topic Modeling
The negative reviews topics and their representative words are shown in Table 11.
Table 11.
Negative review topics.
Topic 1 concerns issues related to driving experience (43.9%). This topic appears most frequently, reflecting users’ dissatisfaction with the vehicle’s driving experience. The main aspects include seat comfort, suspension system problems, space limitations, and noise issues. These issues directly point to systemic defects in the vehicle’s ergonomic design, chassis tuning, and interior space planning. Specifically, insufficient seat support and overly firm padding stem from flaws in ergonomic design and material selection; poor suspension damping and a loose chassis result from inadequate tuning and component durability; cramped passenger and storage space is attributed to shortcomings in body dimensions and space utilization design; and excessive wind, tire, and road noise are closely related to body sealing processes and the configuration of sound-insulating materials.
Topic 2 focuses on problems with driving range and manufacturer services (17.1%). The mention of “range” shows that battery life is still a major source of negative feedback from users. This problem is especially serious in cold winter weather, where batteries drain faster and need improvement. Words like “pickup” and “delivery” reveal users’ dissatisfaction with the service provided by manufacturers. In addition, “price” also plays a role in how satisfied users feel. Regarding range, the severe decline in range during cold winter temperatures and the significant gap between actual and rated range stem from defects in the power battery’s low-temperature performance and unreasonable calibration of the battery management system. In terms of service, dissatisfaction with vehicle pickup and delivery processes exposes shortcomings in automakers’ supply chain management and delivery fulfillment capabilities, while price-related complaints indicate a discrepancy between pricing strategies and user expectations.
Topic 3 focuses on problems with interior design and craftsmanship (19.1%). Users have pointed out issues like the design feeling cheap and plastic-like, poor sound insulation, and overly simple styling. These reviews show that the choice of materials, noise reduction, and design details are important factors affecting user experience. Manufacturers need to keep working on these areas to win user approval. User feedback regarding a strong “plastic feel” and cheap design reflects inappropriate material selection and a lack of design refinement; poor sound insulation stems from insufficient sound-deadening material and substandard sealing processes; while crude design and poor workmanship in details reveal gaps in the interior engineering design and quality control processes.
Topic 4 concerns issues with intelligent systems and navigation failures (19.8%). Problems include navigation positioning errors, parking assistance failure, and in-car connectivity malfunctions. These complaints reflect users’ dissatisfaction with faults in intelligent driver assistance features. Some users also express displeasure with the vehicle’s entertainment functions, possibly due to system lag or poor voice recognition performance. Negative reviews frequently mention errors in the voice recognition system. Specifically, navigation positioning errors and parking assist failures stem from inaccurate sensor calibration and insufficient algorithm robustness; in-car connectivity failures and system lag result from insufficient computing power of the in-car chips and inadequate software optimization; while voice recognition errors and slow command responses are caused by insufficient training data coverage in natural language processing models and low adaptability to various scenarios.
Compared with existing research, the thematic analysis in this study reveals both consistency and differences. Regarding users’ negative concerns, this study, along with the research by Qin et al. [57] and Gong et al. [58] identified common themes such as range anxiety, charging inconvenience, and cost concerns. This validates the central role of issues like range degradation, inadequate charging infrastructure, and poor interior quality in the user experience, reflecting users’ widespread focus on core performance and supporting services. This study creatively identified intelligent systems as a new core pain point, reflecting a trend in user demand shifting from basic performance to intelligent experiences and subjective quality.
Analysis of the negative topics and Figure 18 reveals that “sound,” “noise,” and “sound insulation” are connected, indicating user dissatisfaction with various noise-related issues. Words like “interior,” “plastic,” “material,” and “cheap” suggest that users pay close attention to the materials used in vehicle interior design and seek a sense of quality. Terms including “seat,” “adjustment,” “comfort,” and “inconvenience” reveal users’ concern for seat comfort and adjustability. The connection among “air conditioning,” “voice,” and “buttons” indicates dissatisfaction with certain functional features, such as air conditioning odors, noise pollution, voice recognition failures, and difficulty operating buttons. The linkage of “charging” with “location” and “range” reflects user frustration with the deployment and coverage of charging stations, which also contributes to complaints about driving range. The occurrence of the word “price” signifies that pricing issues similarly affect user sentiment.
4.2.3. Temporal Evolution of Negative Topic Attention
This study uses a heatmap to show how attention to negative sentiment topics changes over time. In Figure 19, the vertical axis represents negative topics T1–T4, and the horizontal axis denotes time from 2021 to 2024. Since the product iteration and delivery rhythms of electric vehicles are closely related to quarterly cycles, and quarters are the standard time unit in industry reports and official announcements, the time intervals are set to three months (one natural quarter) for analysis. The color gradient from blue to red indicates increasing intensity of attention.
Figure 19.
Negative topics heat map.
RQ2: Temporal evolution of negative themes.
Figure 19 shows the temporal evolution of public attention toward four negative themes from 2021 to 2024. Based on the data, we can observe and infer the following, Topic 1 received notably higher attention than other topics during 2021–2022, representing the main source of early negative user reviews. The topic’s discussion volume declined slightly from 2023 onward, but regained attention by the end of 2023. Overall, during the same period, Topic 1 consistently received more discussion than other topics, indicating that driving experience remains a key source of user dissatisfaction. Topic 2 shows a marked increase in discussion during the winter. The discussion on this topic fluctuated little in 2022 but gradually increased between September 2023 and December 2024, indicating that users’ demands for driving range and service quality are steadily rising. The discussion level of Topic 3 exhibited significant fluctuations. The relatively low discussion level in March 2023 may be attributed to data gaps during this period, but it showed a marked increase in September 2023. Compared with other topics, the discussion level of this topic has relatively declined since 2024. Topic 4 exhibited relatively low discussion frequency during the 2021–2022 period, but negative feedback continued to increase during the 2023–2024 phase. Since September 2023, it has become the second most discussed topic in terms of negative reviews.
RQ1: Model Performance.
This study proposes the BERT-Bi-xLSTM-Attention hybrid model, which integrates BERT’s semantic representations, Bi-xLSTM’s contextual modeling, and the attention mechanism’s sentiment-focusing capabilities. The model achieves Accuracy, Recall, Precision, and F1 scores of 0.9323, 0.9326, 0.9321, and 0.9328, respectively. Compared to the baseline model, the accuracy improved by 1.99–7.91 percentage points, demonstrating the best performance.
RQ2: Topic Identification and Defect Attribution.
Five positive topics: Range, Charging, and Purchase Decisions (32.30%); Exterior and Design Style (20.08%); Smart Technology and Driver Assistance (18.62%); Driving Experience and Performance (14.77%); and Interior Comfort and Seat Configuration (14.23%).
Four negative themes: driving comfort (43.9%), range and service quality (17.1%), interior craftsmanship (19.1%), and smart system reliability (19.8%).
The core difference lies in the fact that positive themes exhibit a “combined experience” pattern, where users value smart features, space, performance, and aesthetics simultaneously; negative themes, however, exhibit a “defect propagation” pattern, where a single functional failure (such as navigation errors) tends to be generalized into an overall negative evaluation of smart features, and may even affect perceptions of safety.
This study integrates sentiment classification with the analysis of thematic evolution over time, differing from existing research in terms of methodological design and analytical focus. He et al. [27] applied LDA in conjunction with time-window segmentation to analyze online reviews of vehicles from 2016 to 2023, identifying themes through inter-window similarity calculations. However, their study did not account for sentiment factors and analyzed the temporal changes in themes across all reviews. Hu et al. [13] introduced the temporal dimension into the analysis of vehicle patents, using LDA to track the importance of technical themes from 2014 to 2020 and employing ARIMA for trend forecasting. However, the technical themes derived from patents (heat dissipation, installation and mounting, vibration damping) are structurally distant from attributes related to user perception and experience. The contribution of this study lies in shifting the focus of time-series analysis from technology to user needs, combining sentiment factors with time series to reveal how consumer concerns regarding negative themes dynamically evolve.
5. Discussion
Electric vehicle review data contains rich information, including both positive and negative user feedback. This information serves as an important source for uncovering user needs and identifying product issues. By analyzing multi-platform data, we can provide data-driven support for consumer purchasing decisions, product optimization, and policy formulation. This study can promote sustainable, high-quality development in the vehicle market, thereby advancing the sustainable development of the “transportation-energy-environment” system.
(1) Based on the analysis of positive review topic mining, it can be seen that five themes collectively form a multidimensional framework for purchasing decisions of electric vehicles. Driving experience and performance remain the primary factors influencing purchase decisions, and manufacturers should continue to prioritize these in their design. Intelligent features have established a shift from technology to brand image perception, creating a core distinguishing marker from traditional automakers. Regarding factors such as driving range and charging, users are shifting from traditional parameter comparisons to confirming real driving experiences. Test drives have become a critical evaluation in purchase decisions, and users are increasingly pursuing aesthetic appeal. Therefore, manufacturers are advised to shift from battery life claims to scenario-based validation, establish quantifiable service evaluation criteria to enhance service quality, and strengthen aesthetic design.
(2) Analysis of negative review topic mining reveals that users’ negative feedback mainly concerns four areas: driving experience, driving range and manufacturer services, interior design, and intelligent systems. Issues with driving comfort represent the largest source of user dissatisfaction. Defects related to the driving experience fall under the category of fundamental mechanical and comfort-related issues in vehicles; they cannot be quickly resolved or optimized through subsequent OTA updates. Once such problems arise, they lead to persistent user dissatisfaction and directly undermine the overall perceived quality of the vehicle. As the topic of greatest concern to users, this indicates that today’s consumers have higher expectations for the fundamental driving and riding experience of electric vehicles. Optimizing underlying mechanical design and manufacturing processes is a critical step toward improving user satisfaction. This finding suggests that manufacturers, against the backdrop of maturing “three-electric” (battery, motor, and control system) technology, must shift their focus from “spec competition” back to “competition on the essence of the driving and riding experience.” Dissatisfaction with range and service has led to a crisis of trust in manufacturers. Negative sentiments caused by range degradation are further amplified by inadequate delivery and after-sales service systems, creating a dual negative experience of subpar performance and inadequate service. This significantly reduces user brand trust, repurchase intent, and willingness to recommend the brand. Manufacturers must intensify research and development in battery technology and establish a “product-service” synergy mechanism to prevent service-related issues from damaging brand reputation. Evaluations such as “plastic-like,” “cheap,” and “shabby” indicate that interior quality has become a key indicator for users in assessing a vehicle’s overall class. While such defects do not affect the normal use of core vehicle functions, they lead users to attribute the issues directly to the company’s excessive cost-cutting and insufficient emphasis on user experience, thereby causing long-term negative impacts on brand image. This requires manufacturers to strike a balance between cost and design, ensuring that the interior’s visual appeal do. The more advanced the vehicle’s intelligent system, the stronger the negative sentiment when failures occur. Manufacturers need to strike a balance between innovation in functionality and system stability to prevent frequent faults leading to numerous negative reviews. In general, manufacturers should address issues by following the “stop-loss-consolidate foundation-enhance efficiency” approach.
(3) Based on heatmap data analysis, it is evident that the driving experience is the primary source of early negative user reviews. With the design upgrades of new models, related discussions fluctuated, but overall, driving experience remains the core of user dissatisfaction. Manufacturers need to continuously optimize their designs accordingly.
Compared to other topics, negative discussions about interior design are relatively fewer, yet interior issues remain one of the primary user complaints. Manufacturers should balance research and development costs with material quality to enhance user experience. During 2021 to 2022, negative feedback on intelligent systems was still accumulating. Starting in 2024, user concerns gradually shifted toward driving range, service, and the experience of using intelligent systems, indicating increasing demands for product quality. Dissatisfaction related to driving range is noticeably higher during cold winter periods than in other times. Therefore, manufacturers should intensify efforts in technology research and development, establish a complete service lifecycle process, and quantify service standards. The reliability and stability of intelligent systems have become key challenges for large-scale application scenarios, which manufacturers must prioritize.
RQ3: Recommendations for Stakeholders.
Product performance and user satisfaction jointly determine the environmental impact of a technology’s lifecycle. Based on the research findings, targeted recommendations are proposed for three categories of stakeholders. For consumers, test drives should be prioritized over parameter comparisons, with a focus on evaluating the four core attributes most frequently cited in negative reviews: driving comfort, range and service quality, interior craftsmanship, and smart system reliability; among these, stability should be a key consideration for smart systems. For manufacturers, priority should be given to improving attributes of concern to users to enhance product competitiveness. As complaints about driving comfort continue to dominate, the driving experience must be prioritized over parameter-based competition; range claims should shift toward scenario-based validation and promotion; iterations of smart features must be balanced with stability guarantees; the accuracy of navigation data for charging locations needs to be improved; and vehicle design should shift toward aesthetics. For policymakers, real-world range assessments should be standardized, and the accuracy of charging infrastructure data should be regulated. Improve automotive after-sales service standards and strengthen consumer rights protection, thereby guiding manufacturers to remedy product shortcomings and optimize service quality. This will facilitate the high-quality development of the industry and further advance the sustainable transition of green and low-carbon transportation.
This study collected data from multiple platforms, overcoming the limitation of previous research that was confined to a single automotive platform [26]. By integrating topic mining with semantic network analysis, considering the influence of sentiment factors, and combining time-series dynamic analysis, the study enriches the analytical methods for researching electric vehicle topics. The results show that users’ design preferences for electric vehicles are gradually shifting toward aesthetic demands, consistent with He’s findings [27]. User dissatisfaction with space, interior, and noise aligns with Liu’s study [59], and dissatisfaction with intelligent systems was also identified. This research adds a governmental analytical perspective, providing data support for decision-making by relevant departments based on user feedback. To some extent, this study enriches the analytical framework and offers valuable information and insights for the development of electric vehicles, thereby promoting sustainable development and the construction of green and low-carbon transportation systems.
Although this study focuses on the Chinese electric vehicle market, the user concerns and dynamic evolution patterns revealed can provide references for the global electrification transition market. The four identified negative themes, namely driving comfort, range and service quality, interior craftsmanship, and reliability of intelligent systems, constitute potential pain points in the shift from policy-driven to market-driven development of electric vehicles. If unaddressed, these pain points may lead to reputation externalities through word-of-mouth dissemination, inhibit risk-averse consumers’ willingness to adopt, and delay the process of automotive electrification. Addressing these issues can enhance user satisfaction, potentially accelerating the replacement of traditional fuel-powered vehicles, creating favorable conditions for reducing traffic-related carbon emissions, and assisting transportation departments in achieving carbon neutrality targets. Moreover, a temporal analysis of the attention given to negative themes indicates that user concerns about negative attributes are not static: since 2023, discussions about the reliability of intelligent systems have continued to rise, becoming the second most discussed negative theme by the end of 2024. This dynamic shift suggests that manufacturers and policymakers should prioritize ensuring system stability over blindly adding new features. This conclusion offers valuable insights for other markets undergoing automotive electrification. From a policy perspective, the analytical framework proposed in this study provides a reproducible method for monitoring the evolving dynamics of consumer dissatisfaction, enabling proactive adjustments to relevant policies, such as charging infrastructure planning and after-sales service standards. Regarding generalizability, the model demonstrates strong cross-platform transferability and can be adapted to different platforms and data sources; the framework can also be extended to other domains such as review mining and sustainable mobility research. However, caution is advised when applying it across regions, as cultural, policy, linguistic, and market maturity differences may influence the applicability of the findings. Future research could include cross-national and cross-domain comparative studies to further validate the transferability of the framework and identify region-specific drivers of sustainable mobility. Overall, this research offers a data-driven reference for sustainable decision-making within the electric vehicle industry.
However, the analytical approach used in this paper has some limitations. First, the emotion labels mainly originate from the “Most Satisfied” and “Least Satisfied” sections on the Autohome platform, which uses a forced binary annotation mechanism combined with manual verification to establish the sentiment labeling strategy. Although this approach provides clear supervision signals and maintains high annotation consistency, it nonetheless has inherent limitations and potential biases. Firstly, user self-reporting is subject to subjective bias; the enforced binary structure excludes neutral responses, thereby hindering the capture of mixed emotions and fine-grained viewpoints, which may lead to an overestimation of the distinction between extreme emotions and introduce polarity bias. Secondly, the binary classification framework neglects neutral emotions, potentially resulting in information loss and classification bias. Thirdly, raw comments from platforms such as Yiche and China Automotive Quality Network are unlabeled and are predicted and annotated by the proposed model, which may introduce model-dependent biases. Despite cross-platform validation, differences in user demographics, review motivations, and platform scoring mechanisms may still affect the generalizability of the sentiment distribution. Future work should consider incorporating neutral emotion categories, collecting more balanced multi-source labeled data, and adopting fine-grained sentiment annotations to reduce these biases. Second, the static LDA model assumes that topic distributions do not change over time, whereas user interests evolve dynamically; future research could integrate dynamic topic models to better capture shifts in users’ interests.
6. Conclusions
This study constructs an integrated analytical framework combining sentiment analysis and topic mining to address the influence of emotional factors on topic analysis, providing a methodological reference for related research. Through multi-platform data collection, a cross-platform user review dataset for electric vehicles covering the entire process of “pre-purchase—during purchase—post-use” is formed, enriching the data foundation and research methods for user demand mining and dynamic evolution analysis of topic attention in electric vehicles.
At the methodological level, this paper proposes a BERT-Bi-xLSTM-Attention hybrid deep learning model for sentiment classification of electric vehicle user reviews. By integrating the semantic representation capability of the BERT pre-trained language model, the contextual modeling capability of Bi-xLSTM, and the emotional feature word focusing capability of Attention, the model effectively improves the accuracy of sentiment classification. The experimental results show that the proposed model outperforms all comparison models, achieving accuracy, recall, precision, and F1-score of 0.9323, 0.9326, 0.9321, and 0.9328, respectively. The sentiment classification results indicate that positive evaluations account for 58.8% and negative evaluations account for 41.2%, reflecting that users have an overall positive attitude towards electric vehicles, but there are still prominent dissatisfactions and room for improvement. Subsequently, an LDA model is constructed, combined with semantic network diagrams to analyze users’ concerns on different emotional topics. This study innovatively introduces temporal evolution analysis into the sentiment-topic research of electric vehicle reviews to reveal the evolution trend of negative sentiment concerns, providing a basis for users’ purchase decisions, manufacturers and relevant departments to solve core problems in a targeted manner and optimize decision-making. The main conclusions are as follows:
(1) This study identifies five positive topics and four negative topics. Some product attributes present dual-sided characteristics, with both positive feedback and negative controversies existing simultaneously for the same attribute, rather than showing a single advantage or shortcoming. Such dual-sided features indicate that while manufacturers’ relevant designs meet user demands, continuous optimization and improvement are still required. Targeted upgrading should be implemented on the basis of retaining existing strengths. Meanwhile, the findings can provide data-driven references for users’ purchase decisions.
(2) The analysis of negative topics shows that users’ negative feedback is mainly concentrated on four attributes: driving comfort (43.9%), cruising range and service quality (17.1%), interior workmanship (19.1%), and intelligent system reliability (19.8%). Users can pay close attention to these aspects during vehicle selection and make choices according to their actual needs. The temporal analysis of negative topics reveals that driving experience remains the core focus of user dissatisfaction, and the negative sentiment surrounding intelligent systems shows a growing trend, which has become the second most discussed negative topic by the fourth quarter of 2024. Exploring the concerns in users’ negative reviews and analyzing the dynamic evolution of negative sentiment topics enables manufacturers to carry out targeted improvements. This can effectively enhance users’ purchase intention and satisfaction, and further promote the sustainable development of low-carbon transportation.
(3) Finally, based on the research findings, targeted recommendations are proposed for users, manufacturers, and governments to drive high-quality industrial development and further advance the sustainable development of green and low-carbon transportation. From the perspective of industrial development, the problem attributes and evolution patterns extracted from users’ real feedback in this study provide a practical basis for relevant authorities to formulate industrial policies, improve standards and specifications, and strengthen quality supervision. In terms of sustainability contributions, addressing the core pain points identified, namely driving comfort, range and service quality, interior craftsmanship, and reliability of intelligent systems, can enhance user satisfaction, potentially accelerate the replacement of traditional fuel vehicles by electric vehicles, and support the reduction in traffic-related carbon emissions and the achievement of carbon neutrality goals at the perceptual level. Moreover, the analytical framework proposed in this paper demonstrates good transferability and can be adapted to other fields, languages, or sustainable mobility scenarios involving user comment mining, offering a data-driven reference for low-carbon transportation transitions under different policy and market environments. The research findings have broader implications for sustainability: reducing complaints related to driving comfort, reliability of intelligent systems, range, and interior quality can foster consumer trust and accelerate the adoption of electric vehicles, thereby supporting decarbonization in the transportation sector. Meanwhile, the dynamic evolution of user concerns highlights the need for adaptive policies that prioritize system stability and service standards over solely pursuing technological novelty. Overall, this research has certain practical significance.
However, this study also has several limitations. First, the research data are mainly collected from automotive forums, where users are a self-selected group. Since online reviewers tend to post comments only after experiencing particularly positive or negative experiences, the representativeness of the sample may be limited. Second, the research object of this study is text data, while multi-modal data such as images and videos on modern social media also contain rich information. In future research, the data sources can be expanded to include a combination of social media, e-commerce platforms, questionnaires, and offline interviews to collect user opinions more comprehensively. Additionally, multi-modal data can be incorporated into the research to achieve a more comprehensive and detailed mining of user feedback, thereby providing richer research support for the optimization of sustainable transportation systems.
Author Contributions
Conceptualization, Y.S. and T.Y.; methodology, Y.S.; software, Y.S.; validation, Y.S. and T.Y.; formal analysis, R.Z.; resources, T.Y.; data curation, Y.S.; writing—original draft preparation, Y.S.; writing—review and editing, T.Y.; visualization, Y.S.; supervision, T.Y.; project administration, T.Y.; funding acquisition, R.Z. All authors have read and agreed to the published version of the manuscript.
Funding
This research was funded by the Ministry of Education of China Humanities and Social Sciences Youth Foundation Project (Grant No. 24YJC630298). The APC was funded by the same grant.
Institutional Review Board Statement
Not applicable.
Informed Consent Statement
Not applicable.
Data Availability Statement
The data presented in this study are available on request from the author.
Conflicts of Interest
The authors declare no conflicts of interest.
References
- Mopidevi, S.; Narasipuram, R.P.; Aemalla, S.R.; Rajan, H. E-mobility: Impacts and analysis of future transportation electrification market in economic, renewable energy and infrastructure perspective. Int. J. Powertrains 2022, 11, 264–284. [Google Scholar] [CrossRef] [Scilit]
- Global EV Outlook. 2025. Available online: https://www.iea.org/reports/global-ev-outlook-2025 (accessed on 25 May 2025).
- Zhang, R.; Fujimori, S. The role of transport electrification in global climate change mitigation scenarios. Environ. Res. Lett. 2020, 15, 034019. [Google Scholar] [CrossRef] [Scilit]
- Lan, Y. More than 6.8 million new energy vehicles will be sold in 2022. Auto. Rev. 2023, 2, 106–107. [Google Scholar]
- Muratori, M.; Alexander, M.; Arent, D.; Bazilian, M.; Cazzola, P.; Dede, E.M.; John, F.; Chris, G.; David, G.; Alan, J.; et al. The rise of electric vehicles—2020 status and future expectations. Prog. Energy 2021, 3, 022002. [Google Scholar] [CrossRef] [Scilit]
- Kayakuş, M.; Terzioğlu, M.; Erdoğan, D.; Zetter, S.A.; Kabas, O.; Moiceanu, G. European Union 2030 carbon emission target: The case of Turkey. Sustainability 2023, 15, 13025. [Google Scholar] [CrossRef] [Scilit]
- Ju, Q.; Ju, P.; Dai, W.; Ran, L. Adoption of new energy vehicles under subsidy policies: Unit subsidies, sales incentives and product differentiation. J. Manag. Sci. China 2021, 24, 101–116. [Google Scholar]
- Dai, H. Review of New Energy Vehicle Subsidy Policy Effect and Future Adjustment Suggestions. Price Theory Pract. 2021, 9, 28–30. [Google Scholar]
- Agboola, A.O.; Ladoja, K.T.; Onifade, O.F.W. Movie Recommendation system with sentiment analysis using deep learning algorithms. Egypt. Inform. J. 2026, 33, 100905. [Google Scholar]
- Abdalla, H.B.; Gheisari, M.; Awlla, A.H. Hybrid self-attention BiLSTM and incentive learning-based collaborative filtering for e-commerce recommendation systems. Electron. Commer. Res. 2025, 25, 4947–4970. [Google Scholar] [CrossRef] [Scilit]
- Durmus Senyapar, H.N. Electric Vehicles in the Digital Discourse: A Sentiment Analysis of Social Media Engagement for Turkey. SAGE Open 2024, 14, 21582440241295945. [Google Scholar] [CrossRef] [Scilit]
- Wicki, M.; Brückmann, G.; Quoss, F.; Bernauer, T. What do we really know about the acceptance of battery electric vehicles? Turns out, not much. Transp. Rev. 2023, 43, 62–87. [Google Scholar] [CrossRef] [Scilit]
- Hu, R.J.; Ma, W.C.; Lin, W.Q.; Chen, X.D.; Zhong, Z.C.; Zeng, C.H. Technology Topic Identification and Trend Prediction of New Energy Vehicle Using LDA Modeling. Complexity 2022, 2022, 9373911. [Google Scholar] [CrossRef] [Scilit]
- Geetha, M.; Singha, P.; Sinha, S. Relationship between customer sentiment and online customer ratings for hotels-An empirical analysis. Tour. Manag. 2017, 61, 43–54. [Google Scholar] [CrossRef] [Scilit]
- Ashbaugh, L.; Zhang, Y. A Comparative Study of Sentiment Analysis on Customer Reviews Using Machine Learning and Deep Learning. Computers 2024, 13, 340. [Google Scholar] [CrossRef] [Scilit]
- Tzimiris, S.; Nikiforos, S.; Nikiforos, M.N.; Mouratidis, D.; Kermanidis, K.L. A Comparative Evaluation of Transformer-Based Language Models for Topic-Based Sentiment Analysis. Electronics 2025, 14, 2957. [Google Scholar] [CrossRef] [Scilit]
- Cheng, C.; Zhao, J.H. Sentiment Analysis of New Energy Vehicle User Reviews Based on BERT and VADER Rules. Intell. Comput. Appl. 2025, 15, 1–8. [Google Scholar]
- Li, J.; Zeng, D.; Wang, S.; Wang, Y.; Wen, X.; Liu, Y. Analysis and prediction of development trends of new energy vehicles based on ISM-ARIMA-LSTM. In Proceedings of the International Conference on Modeling, Natural Language Processing and Machine Learning, Xi’an, China, 17 May 2024. [Google Scholar]
- Li, Q.; Yang, Y.; Li, C.; Zhao, G. Energy Vehicle User Demand Mining Method Based on Fusion of Online Reviews and Complaint Information. Energy Rep. 2023, 9, 3120–3130. [Google Scholar] [CrossRef] [Scilit]
- Bielski, S.; Marks-Bielska, R.; Wiśniewski, P.; Kurowska, K.; Sobieraj, P. Determinants of Consumer Decisions in the Electric Vehicle Market. Energies 2026, 19, 667. [Google Scholar] [CrossRef] [Scilit]
- Gómez Vilchez, J.J.; Smyth, A.; Kelleher, L.; Lu, H.; Rohr, C.; Harrison, G.; Thiel, C. Electric Car Purchase Price as a Factor Determining Consumers’ Choice and their Views on Incentives in Europe. Sustainability 2019, 11, 6357. [Google Scholar] [CrossRef] [Scilit]
- Anton, O.; Steffen, K. The impact of consumer attitudes towards energy efficiency on car choice: Survey results from Norway. J. Clean. Prod. 2019, 214, 816–822. [Google Scholar] [CrossRef] [Scilit]
- Krishna, G. Understanding and identifying barriers to electric vehicle adoption through thematic analysis. Transp. Res. Interdiscip. Perspect. 2021, 10, 100364. [Google Scholar] [CrossRef] [Scilit]
- Zeng, R.; Shi, D. A study on user perception of new energy vehicles based on data mining. Manag. Sci. Shanghai 2025, 47, 43–47. [Google Scholar]
- Bai, Y.; Zhou, X.; Tan, J.; Ding, X. Exploring dynamic attitudes to hydrogen energy vehicles: Evidence from China’s media. Transp. Res. Part D Transp. Environ. 2026, 150, 105120. [Google Scholar] [CrossRef] [Scilit]
- Liu, Q.; Jia, M.; Xia, D. Dynamic evaluation of new energy vehicle policy based on text mining of PMC knowledge framework. J. Clean. Prod. 2023, 392, 136237. [Google Scholar] [CrossRef] [Scilit]
- He, S.; Xue, B.; Luo, D. Research on the Evolution of Online User Reviews of New Energy Vehicles in China Based on LDA. World Electr. Veh. J. 2026, 17, 21. [Google Scholar] [CrossRef] [Scilit]
- Omahne, V.; Knez, M.; Obrecht, M. Social aspects of electric vehicles research—Trends and relations to sustainable development goals. World Electr. Veh. J. 2021, 12, 15. [Google Scholar] [CrossRef] [Scilit]
- Tyagi, R.; Vishwakarma, S. Technology aspect of Electric Vehicles Initiative’s social sustainability. Technol. Sustain. 2022, 1, 24–41. [Google Scholar] [CrossRef] [Scilit]
- Gao, J.; Xu, X.; Zhang, T. Forecasting the Development of Clean Energy Vehicles in Large Cities: A System Dynamics Perspective. Transp. Res. Part A-Policy Pract. 2024, 181, 103969. [Google Scholar] [CrossRef] [Scilit]
- Wang, T.; Yang, W. Review of Text Sentiment Analysis Methods. Comput. Eng. Appl. 2021, 57, 11–24. [Google Scholar]
- Wang, Z.; Chong, C.; Xue, C.; Zhang, L. Research on Construction of Chinese Domain Sentiment Lexicon Based on Feature-Opinion Pairs. J. Jingchu Univ. Technol. 2025, 40, 39–51. [Google Scholar]
- Pang, B.; Lee, L.; Vaithyanathan, S. Thumbs up? Sentiment classification using machine learning techniques. In Proceedings of the ACL-02 Conference on Empirical Methods in Natural Language Processing, Philadelphia, PA, USA, 6 July 2002. [Google Scholar]
- Hossain, M.S.; Rahman, M.F. Customer Sentiment Analysis and Prediction of Insurance Products’ Reviews Using Machine Learning Approaches. FIIB Bus. Rev. 2023, 12, 386–402. [Google Scholar] [CrossRef] [Scilit]
- Rao, G.A.; Prakash, L.N.C.K.; Suryanarayana, G.; Joshua, P.V.; Reddy, K.N.K.; Karnati, R. Sentiment Analysis of Amazon Alexa Product Reviews: A Comprehensive Comparative Study of Learning Algorithms. In Proceedings of the 5th International Conference on Data Science, Machine Learning and Applications, Hyderabad, India, 15 December 2023. [Google Scholar]
- Minaee, S.; Kalchbrenner, N.; Cambria, E.; Nikzad, N.; Chenaghlu, M.; Gao, J. Deep learning–based text classification:A comprehensive review. ACM Comput. Surv. 2021, 54, 1–40. [Google Scholar] [CrossRef] [Scilit]
- Arshed, M.A.; Mumtaz, S.; Liaqat, M.S.; Haq, I.U.; Hussain, M. Lstm based sentiment analysis model to monitor COVID-19 emotion. VFAST Trans. Softw. Eng. 2022, 10, 70–78. [Google Scholar] [CrossRef] [Scilit]
- Beck, M.; Pöppel, K.; Spanring, M.; Auer, A.; Prudnikova, O.; Kopp, M.; Klambauer, G.; Brandstetter, J.; Hochreiter, S. xLSTM: Extended Long Short-Term Memory. arXiv 2024, arXiv:2405.04517. [Google Scholar]
- Belaroussi, R.; Noufe, S.C.; Dupin, F.; Vandanjou, P.O. Polarity of Yelp Reviews: A BERT-LSTM Comparative Study. Big Data Cogn. Comput. 2025, 9, 140. [Google Scholar] [CrossRef] [Scilit]
- Yuan, M.; Jiang, K. Combining Dual Pre-trained Language Models for Chinese Text Classification. Intell. Comput. Appl. 2023, 13, 1–7. [Google Scholar]
- Liang, L.; Wang, H.; Wang, K. Cognitive-inspired xLSTM for multi-agent information retrieval. Sci. Rep. 2025, 15, 36121. [Google Scholar] [CrossRef] [Scilit]
- Mao, X.L.; Li, Z.H.; Li, Q.X.; Zhang, S.C. BERT-DXLMA: Enhanced representation learning and generalization model for English text classification. Neurocomputing 2025, 622, 129325. [Google Scholar] [CrossRef] [Scilit]
- Ghasemi, R.; Momtazi, S. How a Deep Contextualized Representation and Attention Mechanism Justifies Explainable Cross-Lingual Sentiment Analysis. ACM Trans. Asian Low Resour. Lang. Inf. Process. 2023, 22, 245. [Google Scholar] [CrossRef] [Scilit]
- Prabhu, O.; Navada, S.G. ModernBERT-XAI: A synergistic approach to sentiment analysis with layer-wise learning and SHAP-LIME interpretability. Syst. Sci. Control Eng. 2025, 13, 2600795. [Google Scholar] [CrossRef] [Scilit]
- Tian, C.; Cheng, T.; Peng, Z.; Zuo, W.; Tian, Y.; Zhang, Q.; Wang, F.; Zhang, D. A survey on deep learning fundamentals. Artif. Intell. Rev. 2024, 58, 381. [Google Scholar] [CrossRef] [Scilit]
- CCF Big Data Committee. 2018 CCF Big Data Competition: Automotive User Review Topic and Sentiment Recognition Dataset. 11 October 2018. Available online: https://tianchi.aliyun.com/dataset/4809 (accessed on 11 October 2018).
- Devlin, J.; Chang, M.-W.; Lee, K.; Toutanova, K. Bert: Pre-training of deep bidirectional transformers for language understanding. arXiv 2018, arXiv:1810.04805. [Google Scholar]
- Gardazi, N.M.; Daud, A.; Malik, M.K.; Bukhari, A.; Alsahfi, T.; Alshemaimri, B. BERT applications in natural language processing: A review. Artif. Intell. Rev. 2025, 58, 166. [Google Scholar] [CrossRef] [Scilit]
- Lawrynczuk, M.; Zarzycki, K. LSTM and GRU type recurrent neural networks in model predictive control: A Review. Neurocomputing 2025, 632, 129712. [Google Scholar] [CrossRef] [Scilit]
- Huang, Y.; Xiong, N.; Liu, C.K. Smart City Policies and Corporate Renewable Energy Technology Innovation: Insights from Patent Text and Machine Learning. Energy Econ. 2025, 148, 108612. [Google Scholar] [CrossRef] [Scilit]
- Blei, D.M.; Ng, A.Y.; Jordan, M.I. Latent Dirichlet Allocation. J. Mach. Learn. Res. 2003, 3, 993–1022. [Google Scholar]
- Hankar, M.; Kasri, M.; Beni-Hssane, A. A comprehensive overview of topic modeling: Techniques, applications and challenges. Neurocomputing 2025, 628, 129638. [Google Scholar] [CrossRef] [Scilit]
- Kumar, A.; Abhishek, K.; Shafeeq, B.M.A. SentXFormer: A Transformer-Enhanced Hybrid Deep Learning Framework for Cross-Domain Sentiment Analysis of Customer Reviews. Sci. Rep. 2026, 16, 3528. [Google Scholar] [CrossRef] [Scilit]
- Jelodar, H.; Wang, Y.; Yuan, C.; Feng, X.; Jiang, X.; Li, Y.; Zhao, L. Latent Dirichlet allocation (LDA) and topic modeling: Models, applications, a survey. Multimed. Tools Appl. 2019, 78, 15169–15211. [Google Scholar] [CrossRef] [Scilit]
- Chuang, J.; Manning, C.D.; Heer, J. Termite: Visualization Techniques for Assessing Textual Topic Models. In Proceedings of the International Working Conference on Advanced Visual Interfaces, Capri Island, Italy, 21 May 2012. [Google Scholar]
- Sievert, C.; Shirley, K.E. LDAvis: A Method for Visualizing and Interpreting Topics. In Proceedings of the Workshop on In-teractive Language Learning, Visualization, and Interfaces, Baltimore, MD, USA, 27 June 2014. [Google Scholar]
- Qin, Q.; Zhou, Z.; Zhou, J.; Huang, Z.; Zeng, X.; Fan, B. Sentiment and attention of the Chinese public toward electric vehicles: A big data analytics approach. Eng. Appl. Artif. Intell. 2024, 127, 107216. [Google Scholar] [CrossRef] [Scilit]
- Gong, B.; Liu, R.; Zhang, X.; Chang, C.; Liu, Z. Sentiment analysis of online reviews for electric vehicles using the SMAA-2 method and interval type-2 fuzzy sets. Appl. Soft Comput. 2023, 147, 110745. [Google Scholar] [CrossRef] [Scilit]
- Liu, Y.; Zhang, M.; Chen, X.; Li, K.; Tang, L. The Impact of Consumer Sentiment on Sales of New Energy Vehicles: Evidence from Textual Analysis. World Electr. Veh. J. 2024, 15, 318. [Google Scholar] [CrossRef] [Scilit]
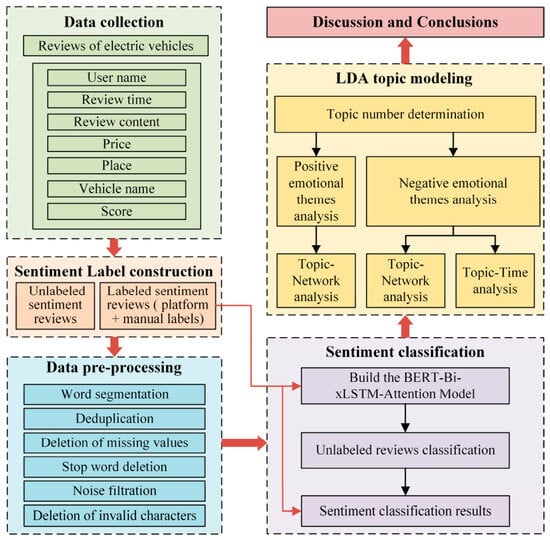
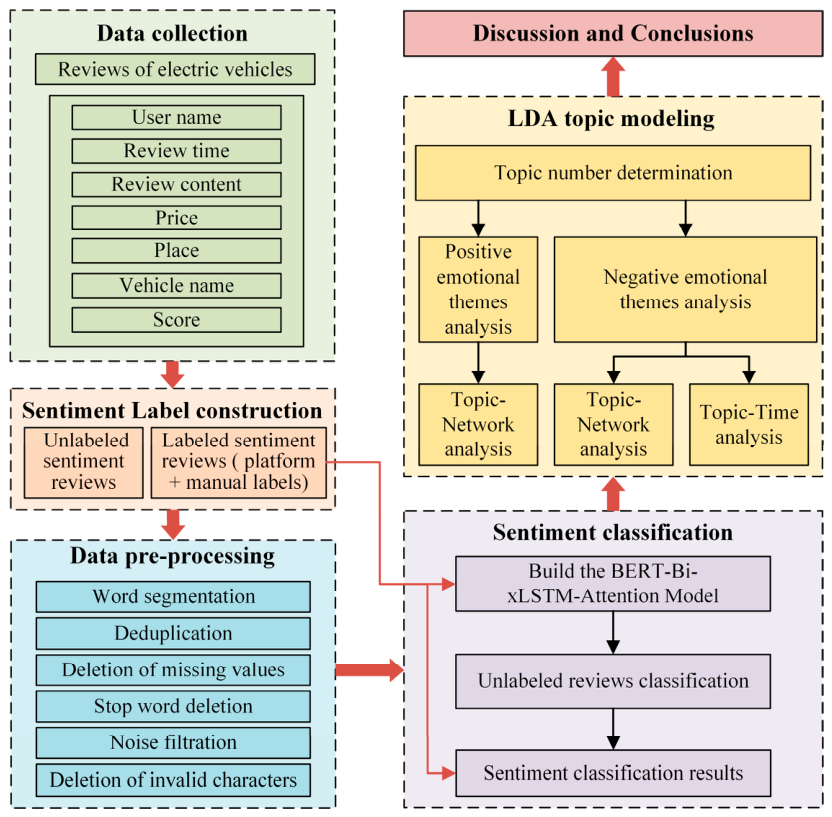
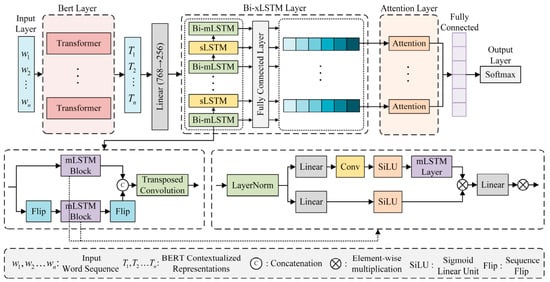
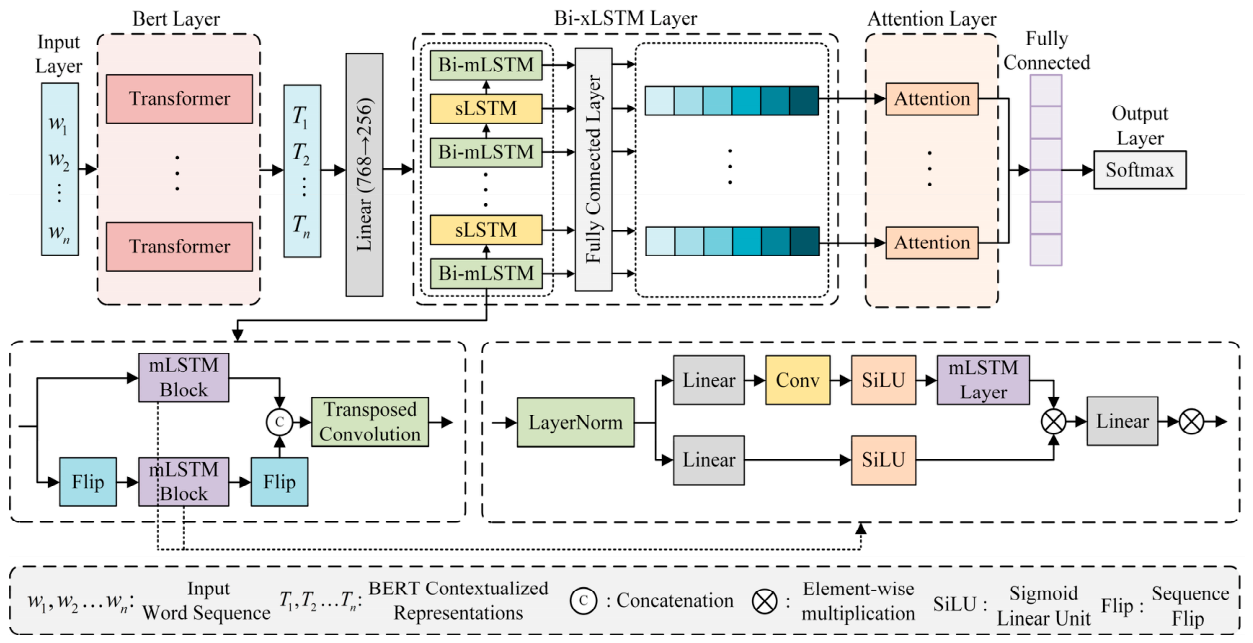
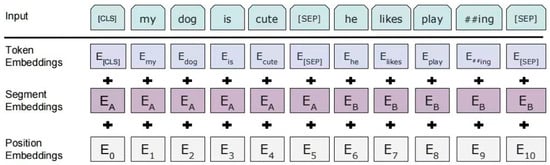
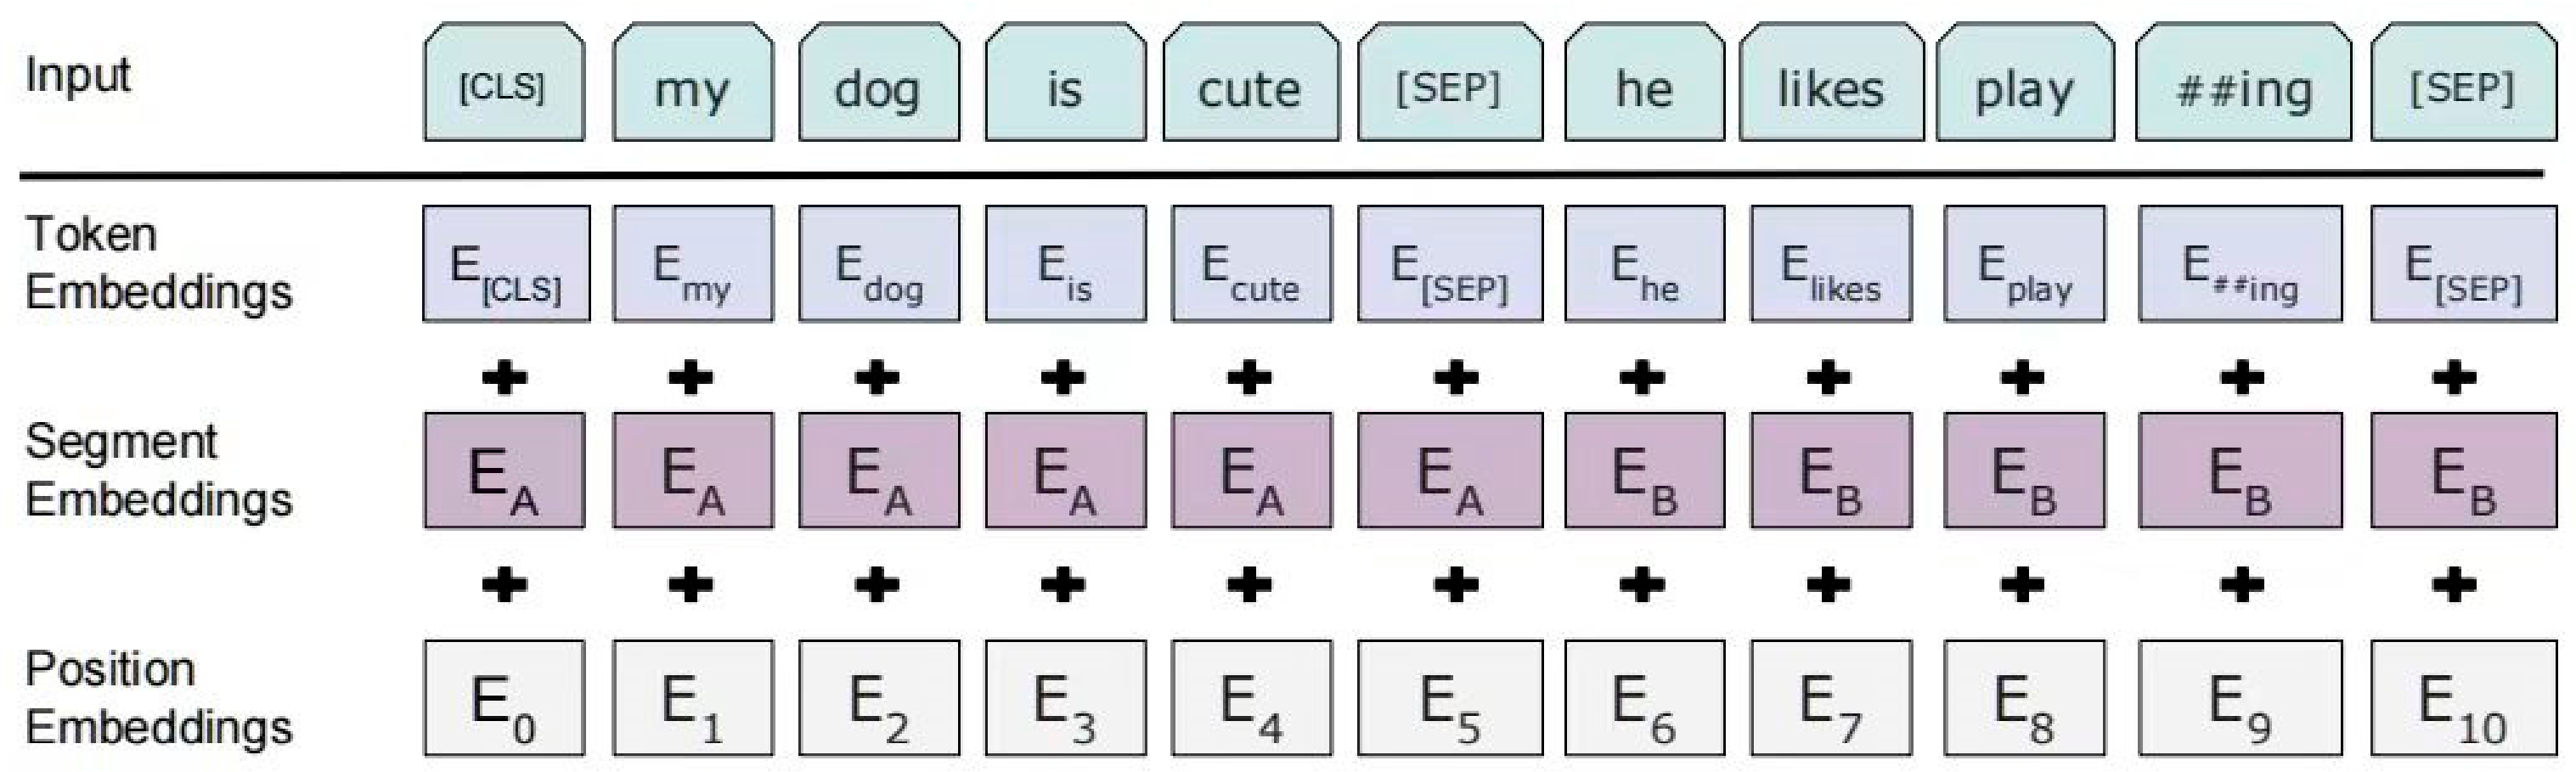
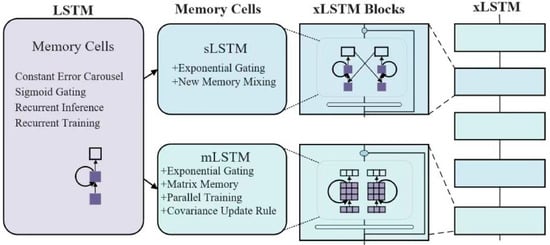
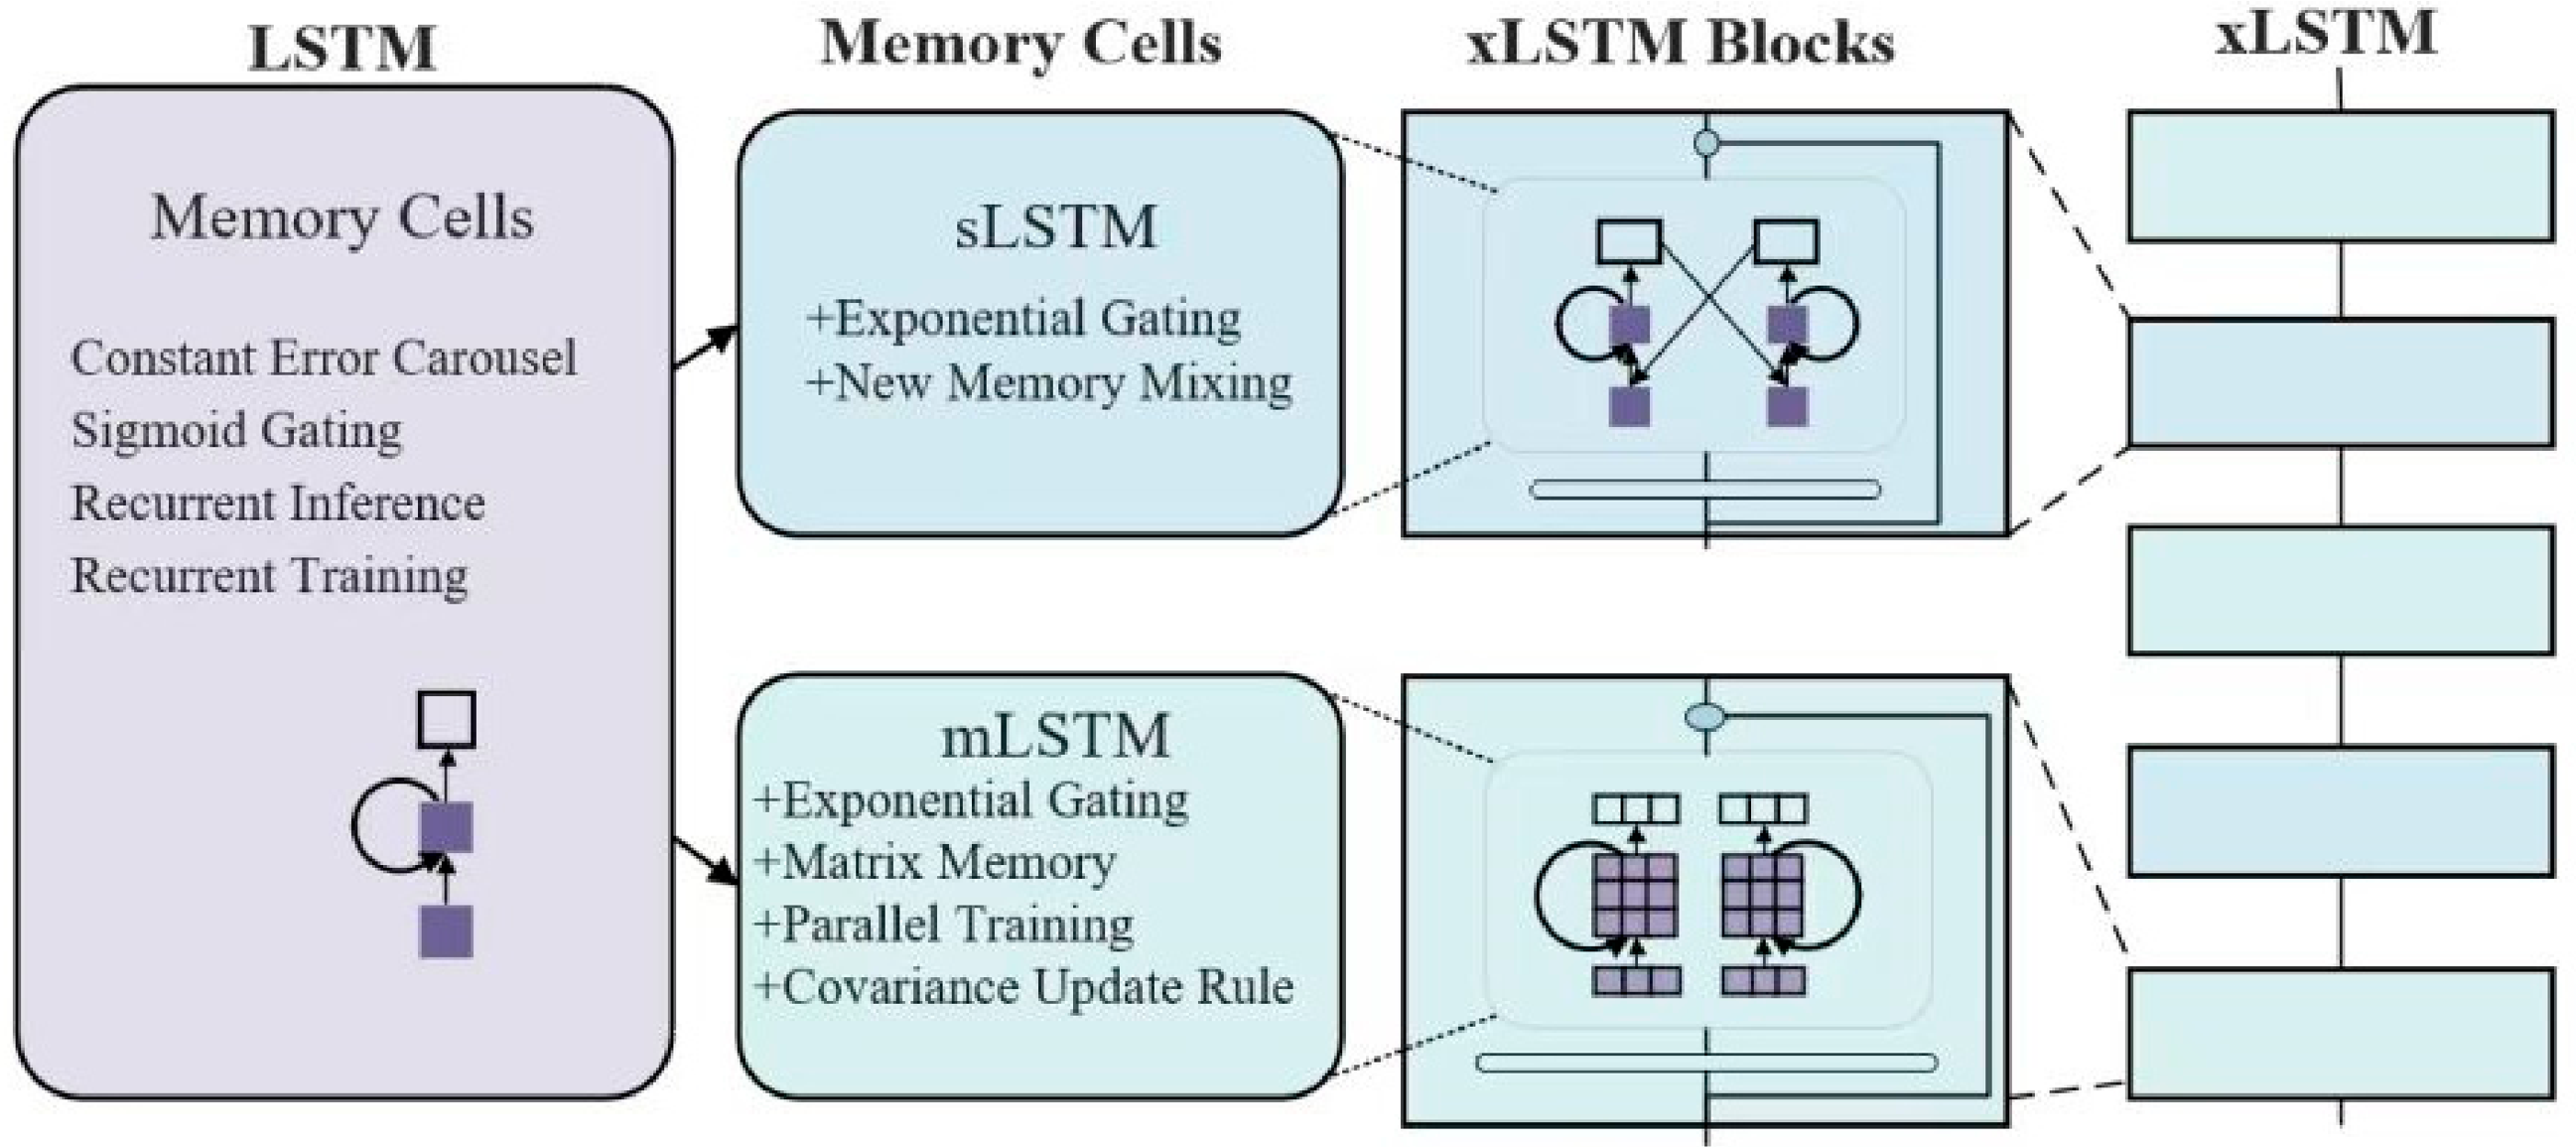


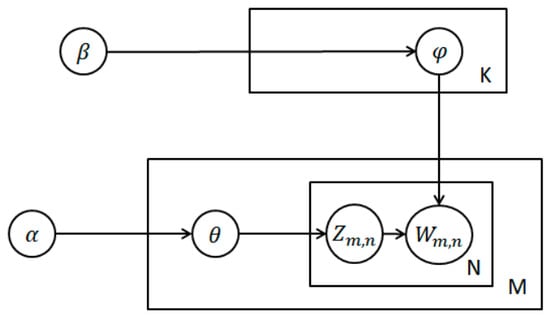
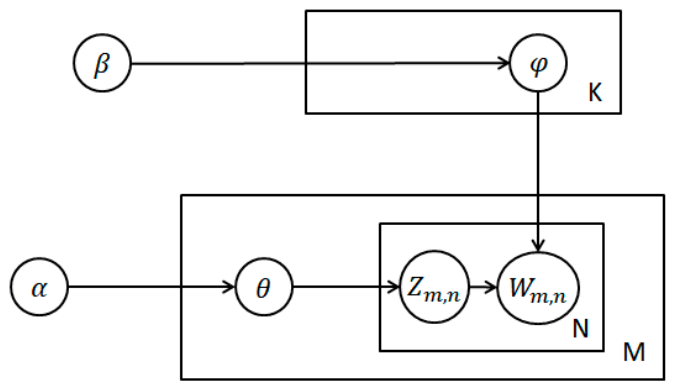
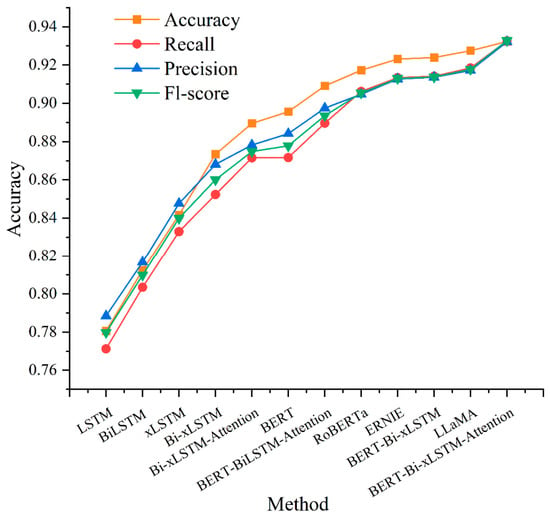
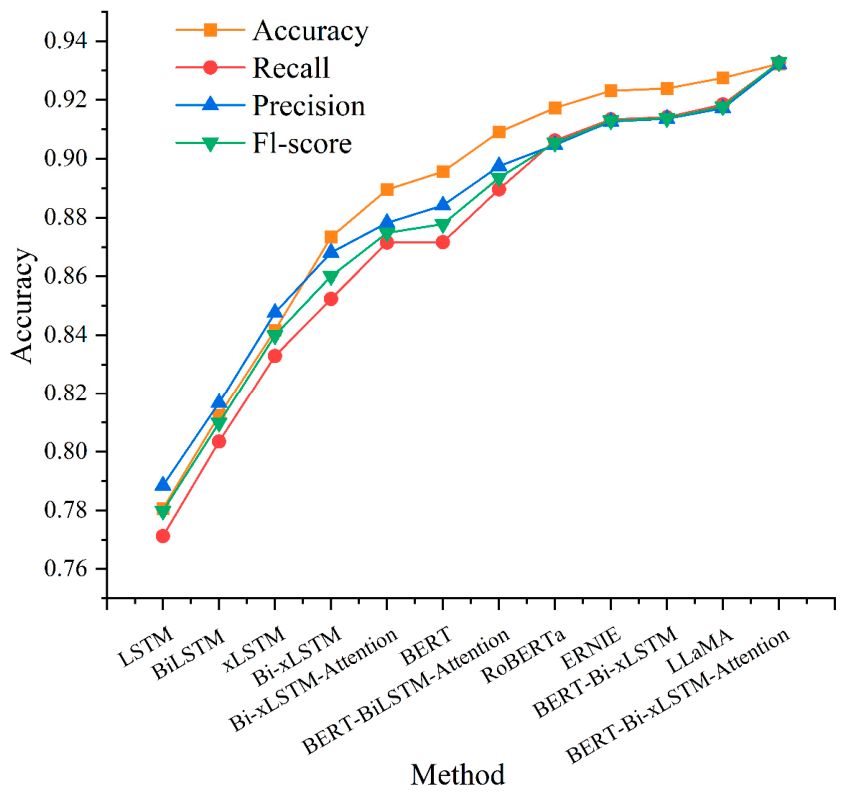
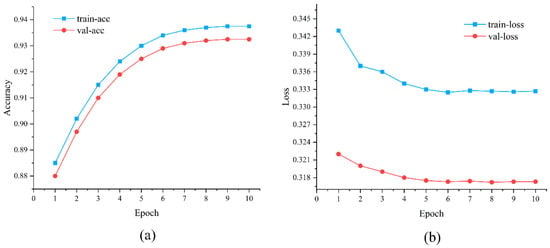
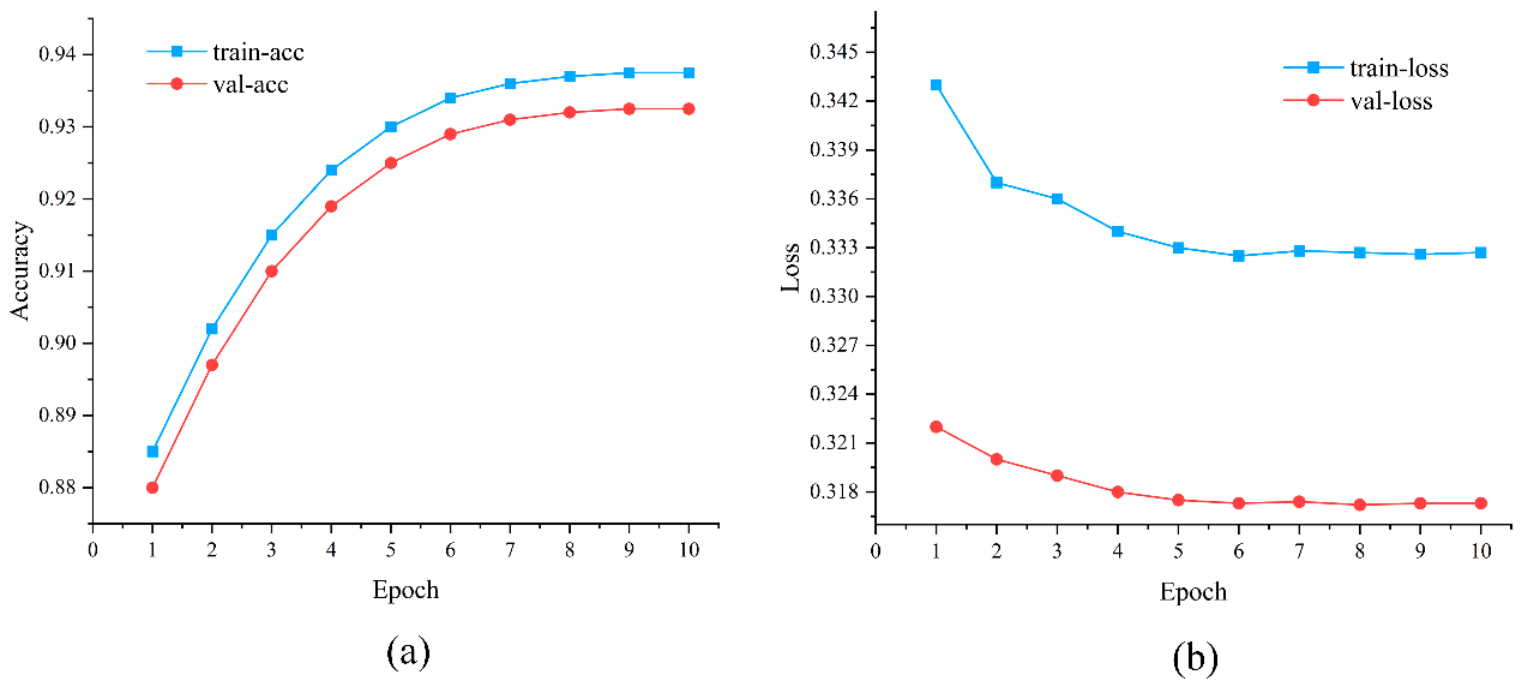
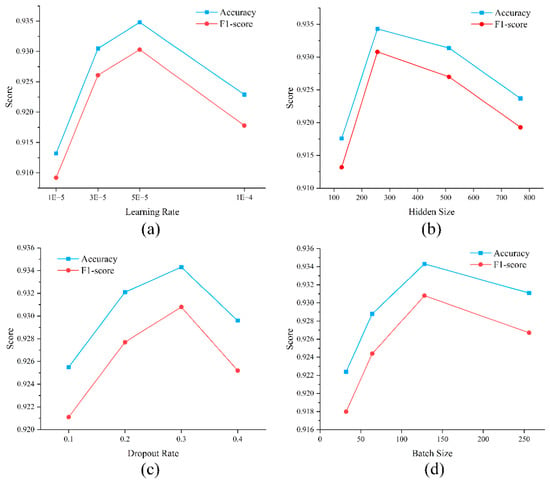
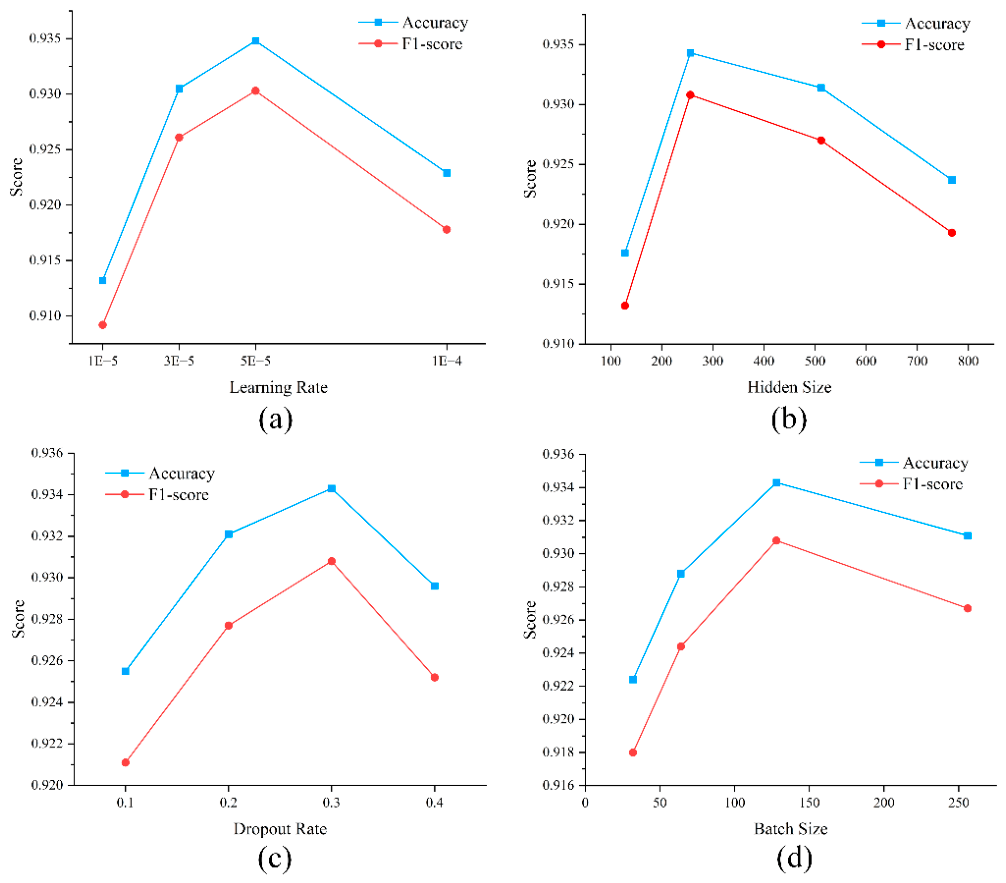
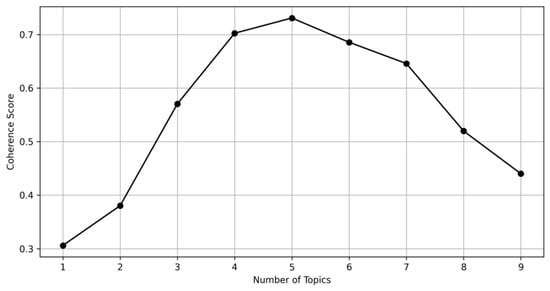
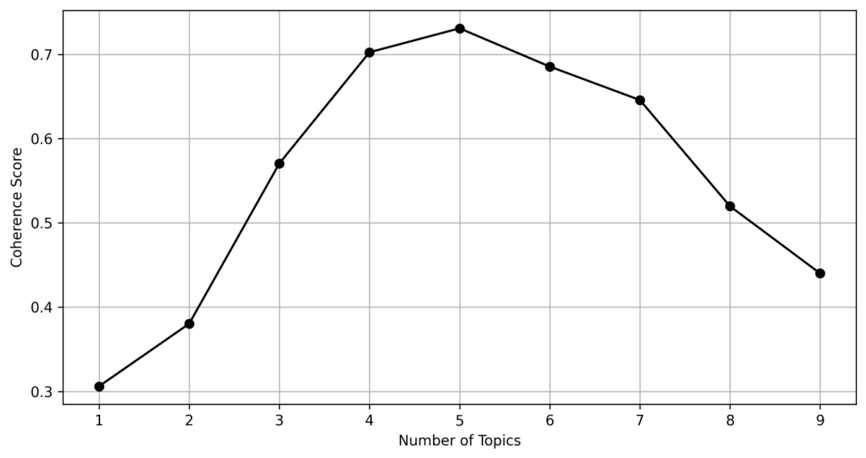
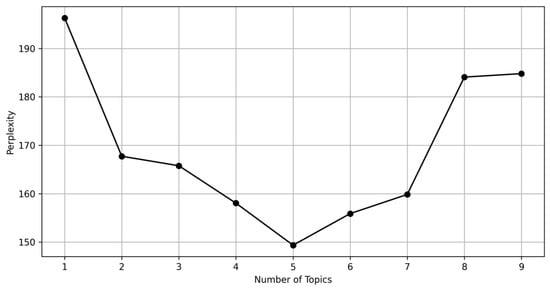
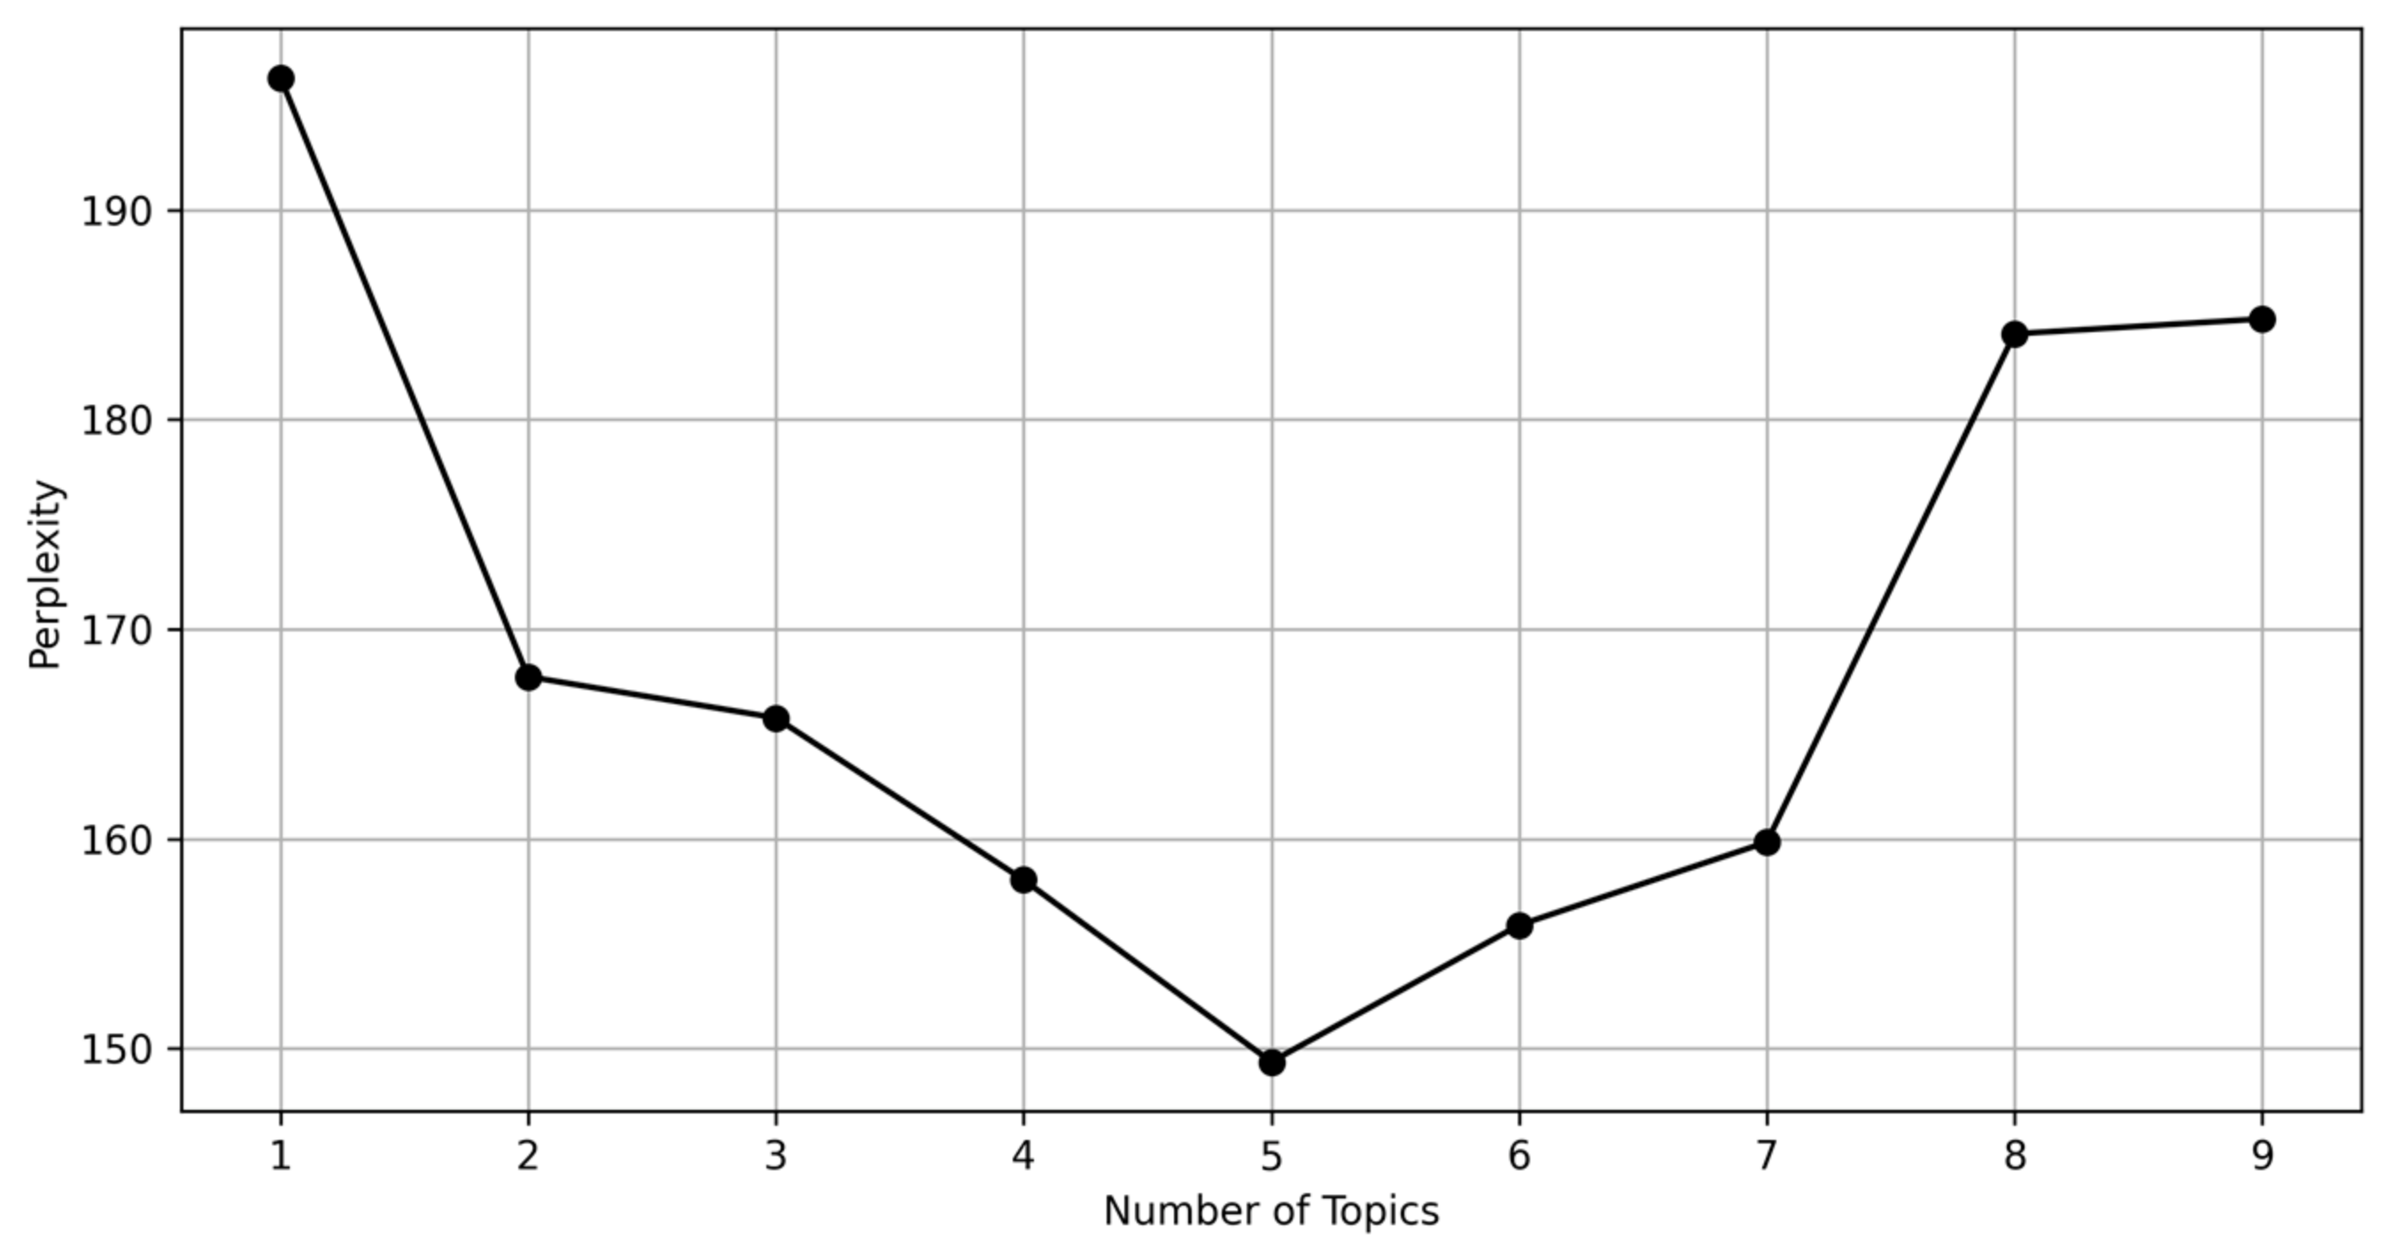
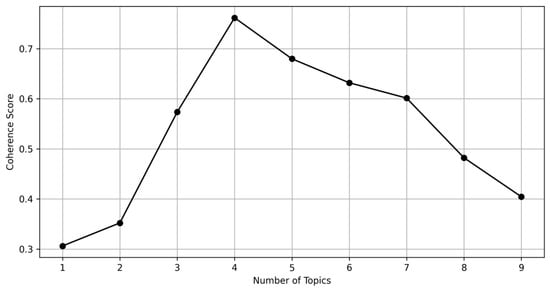
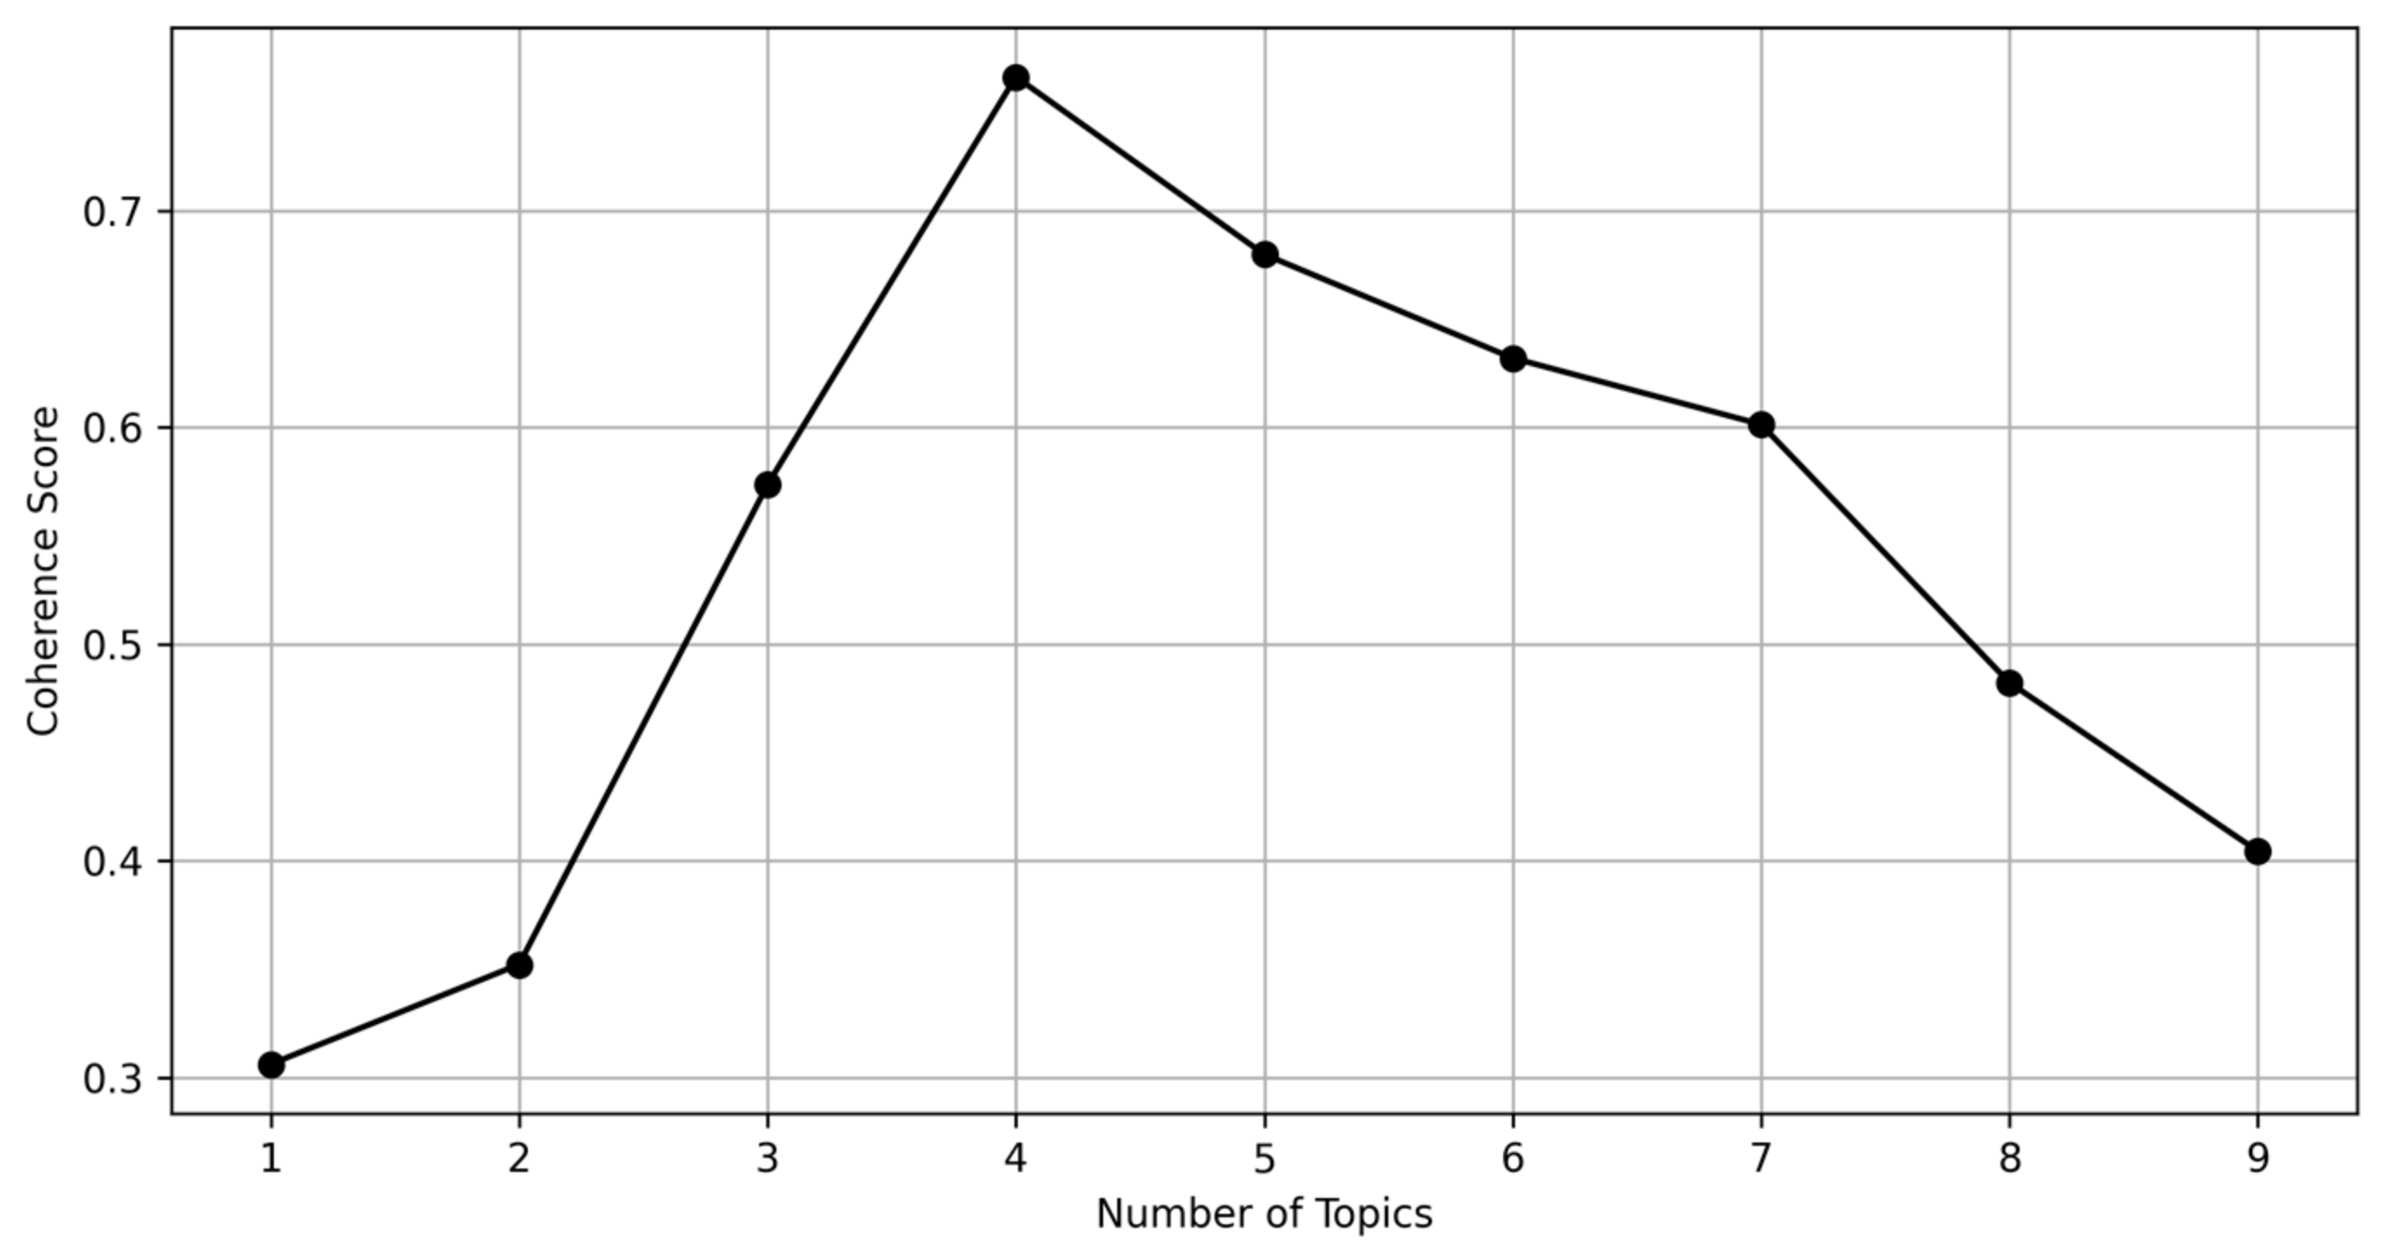
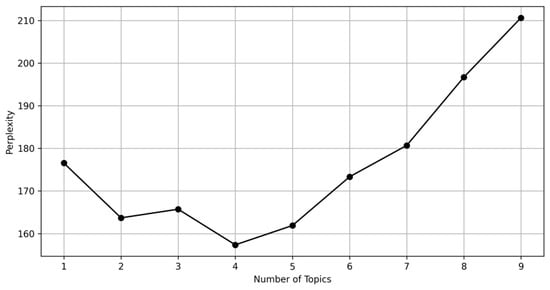
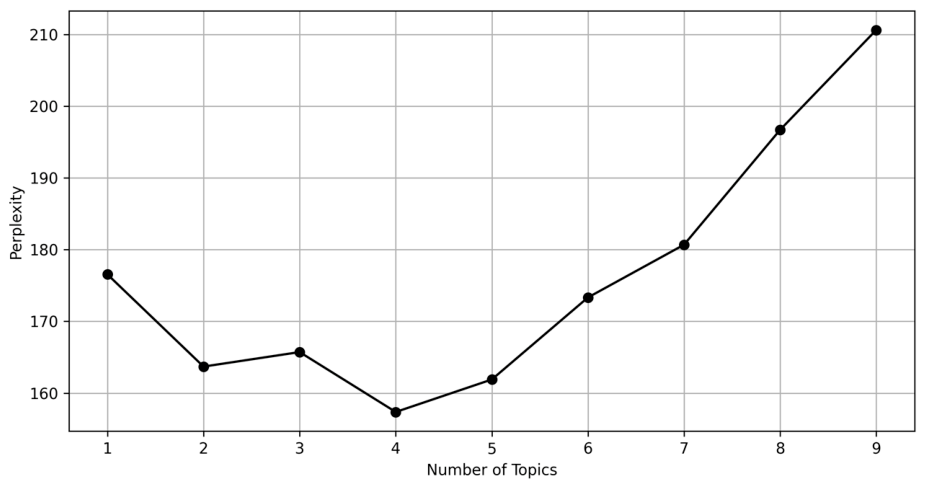
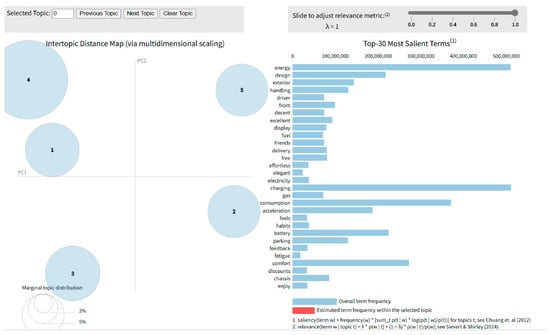
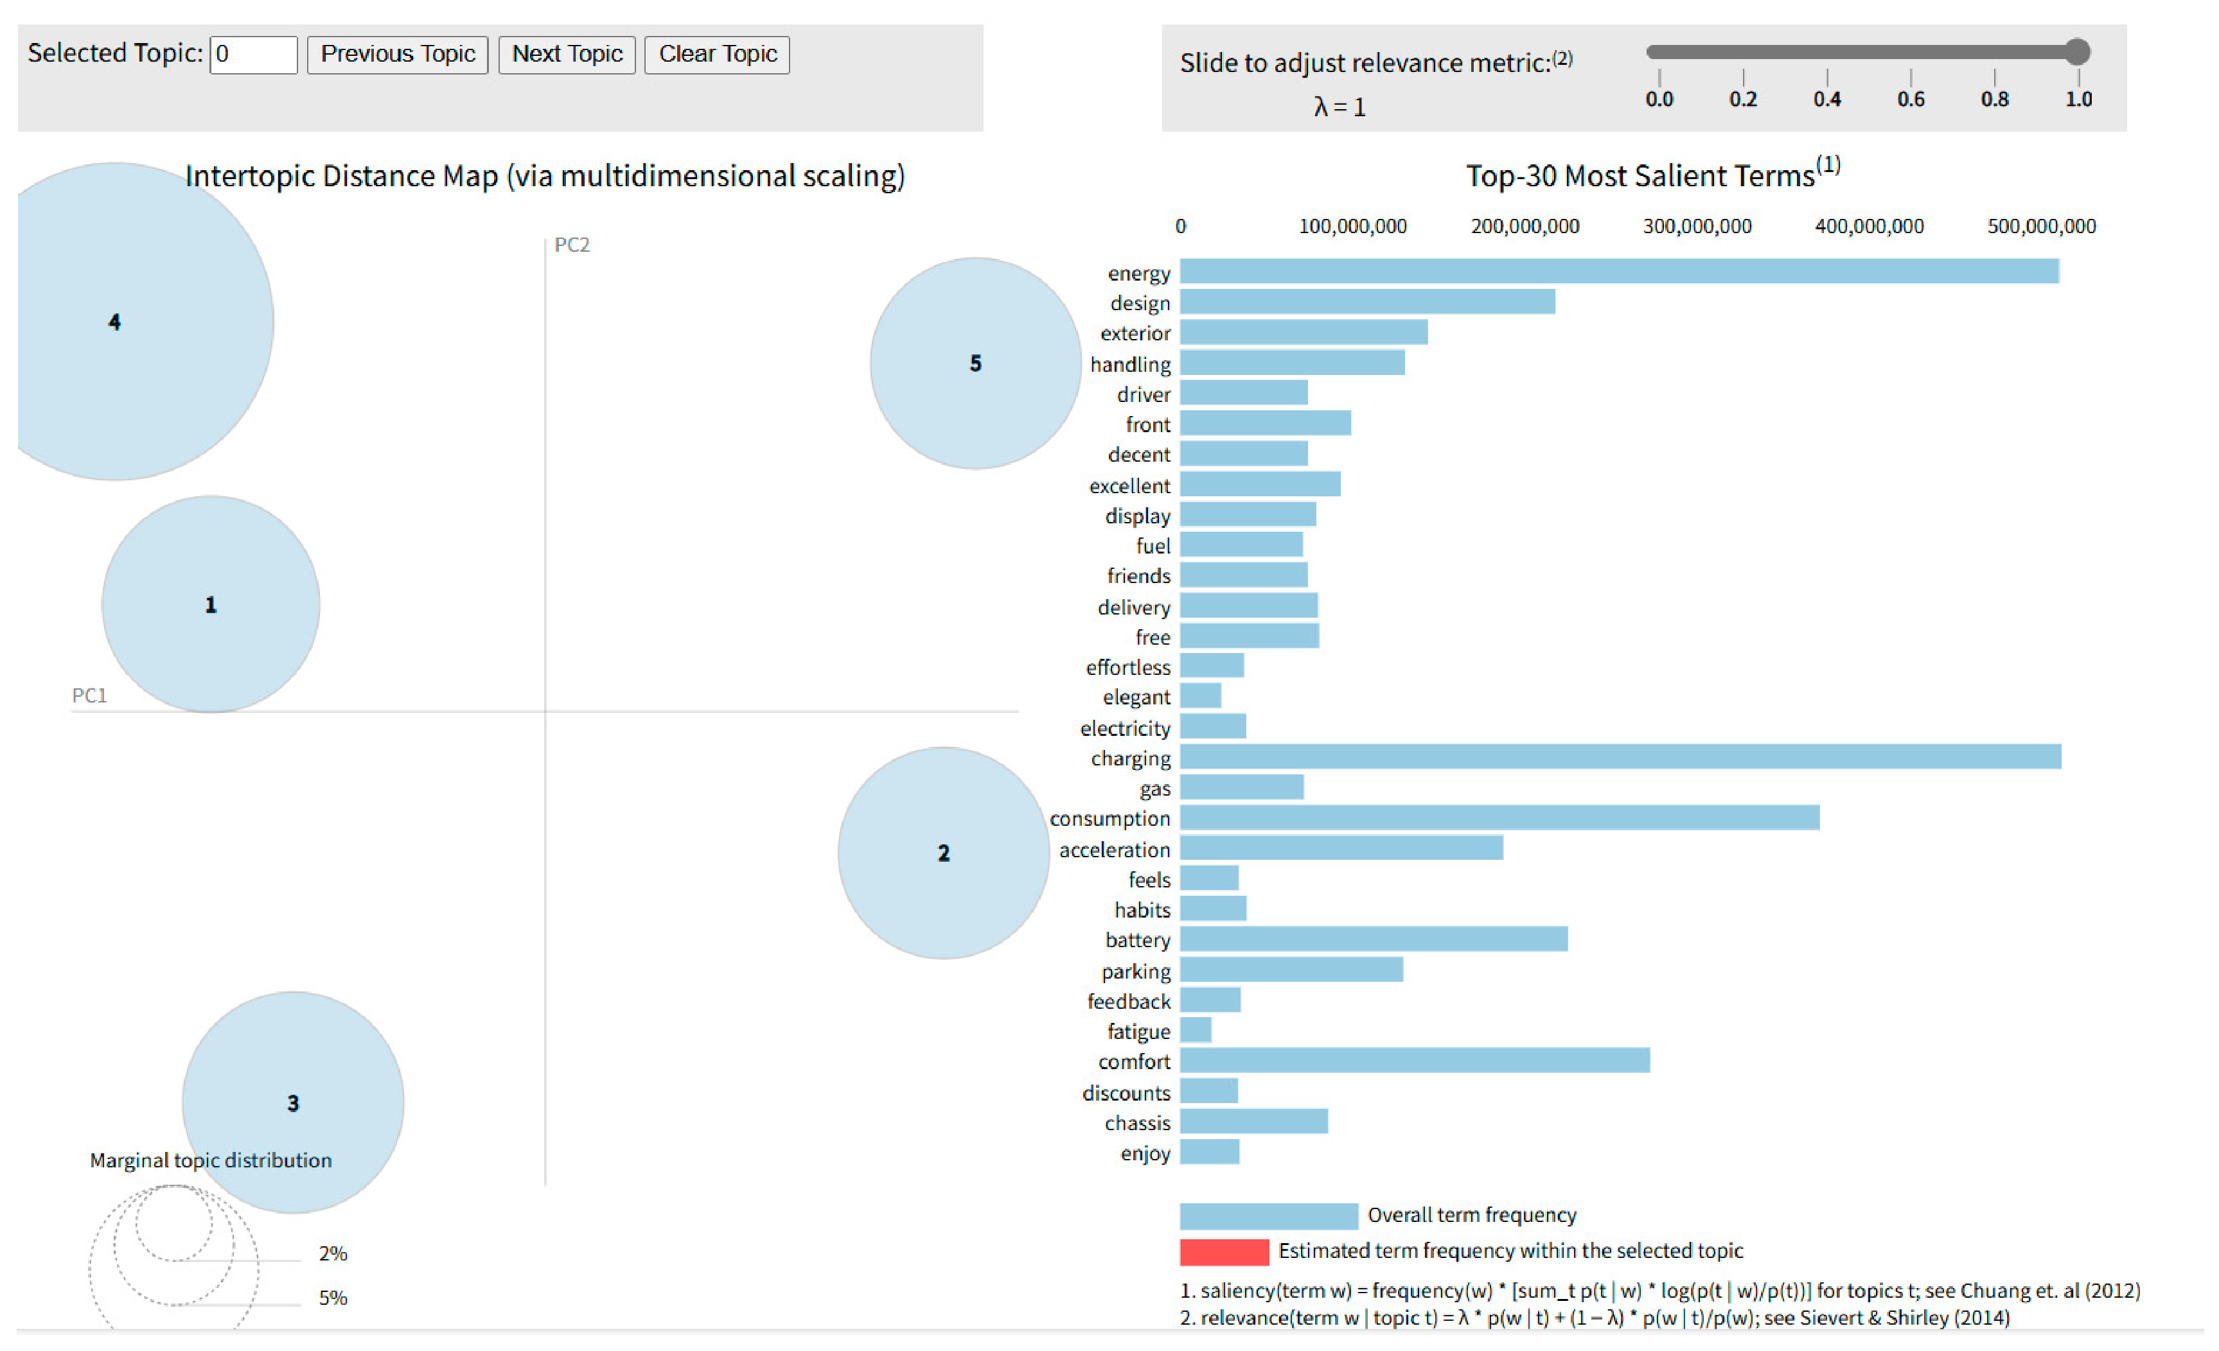
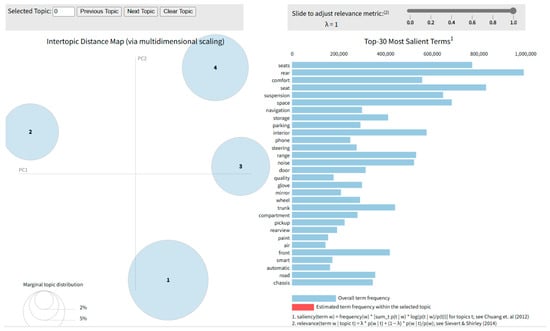
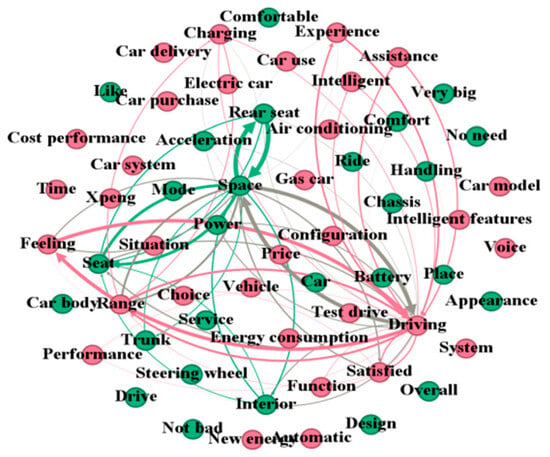
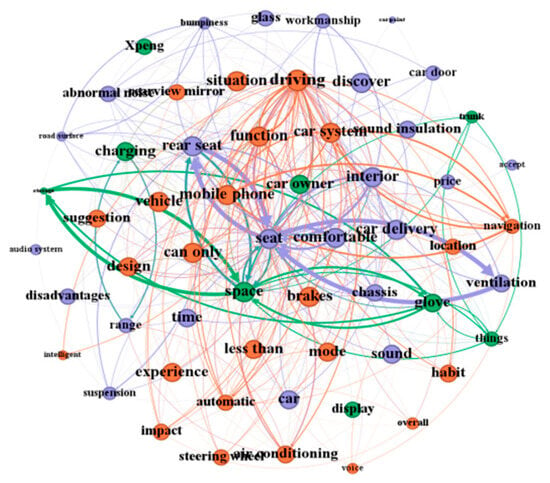
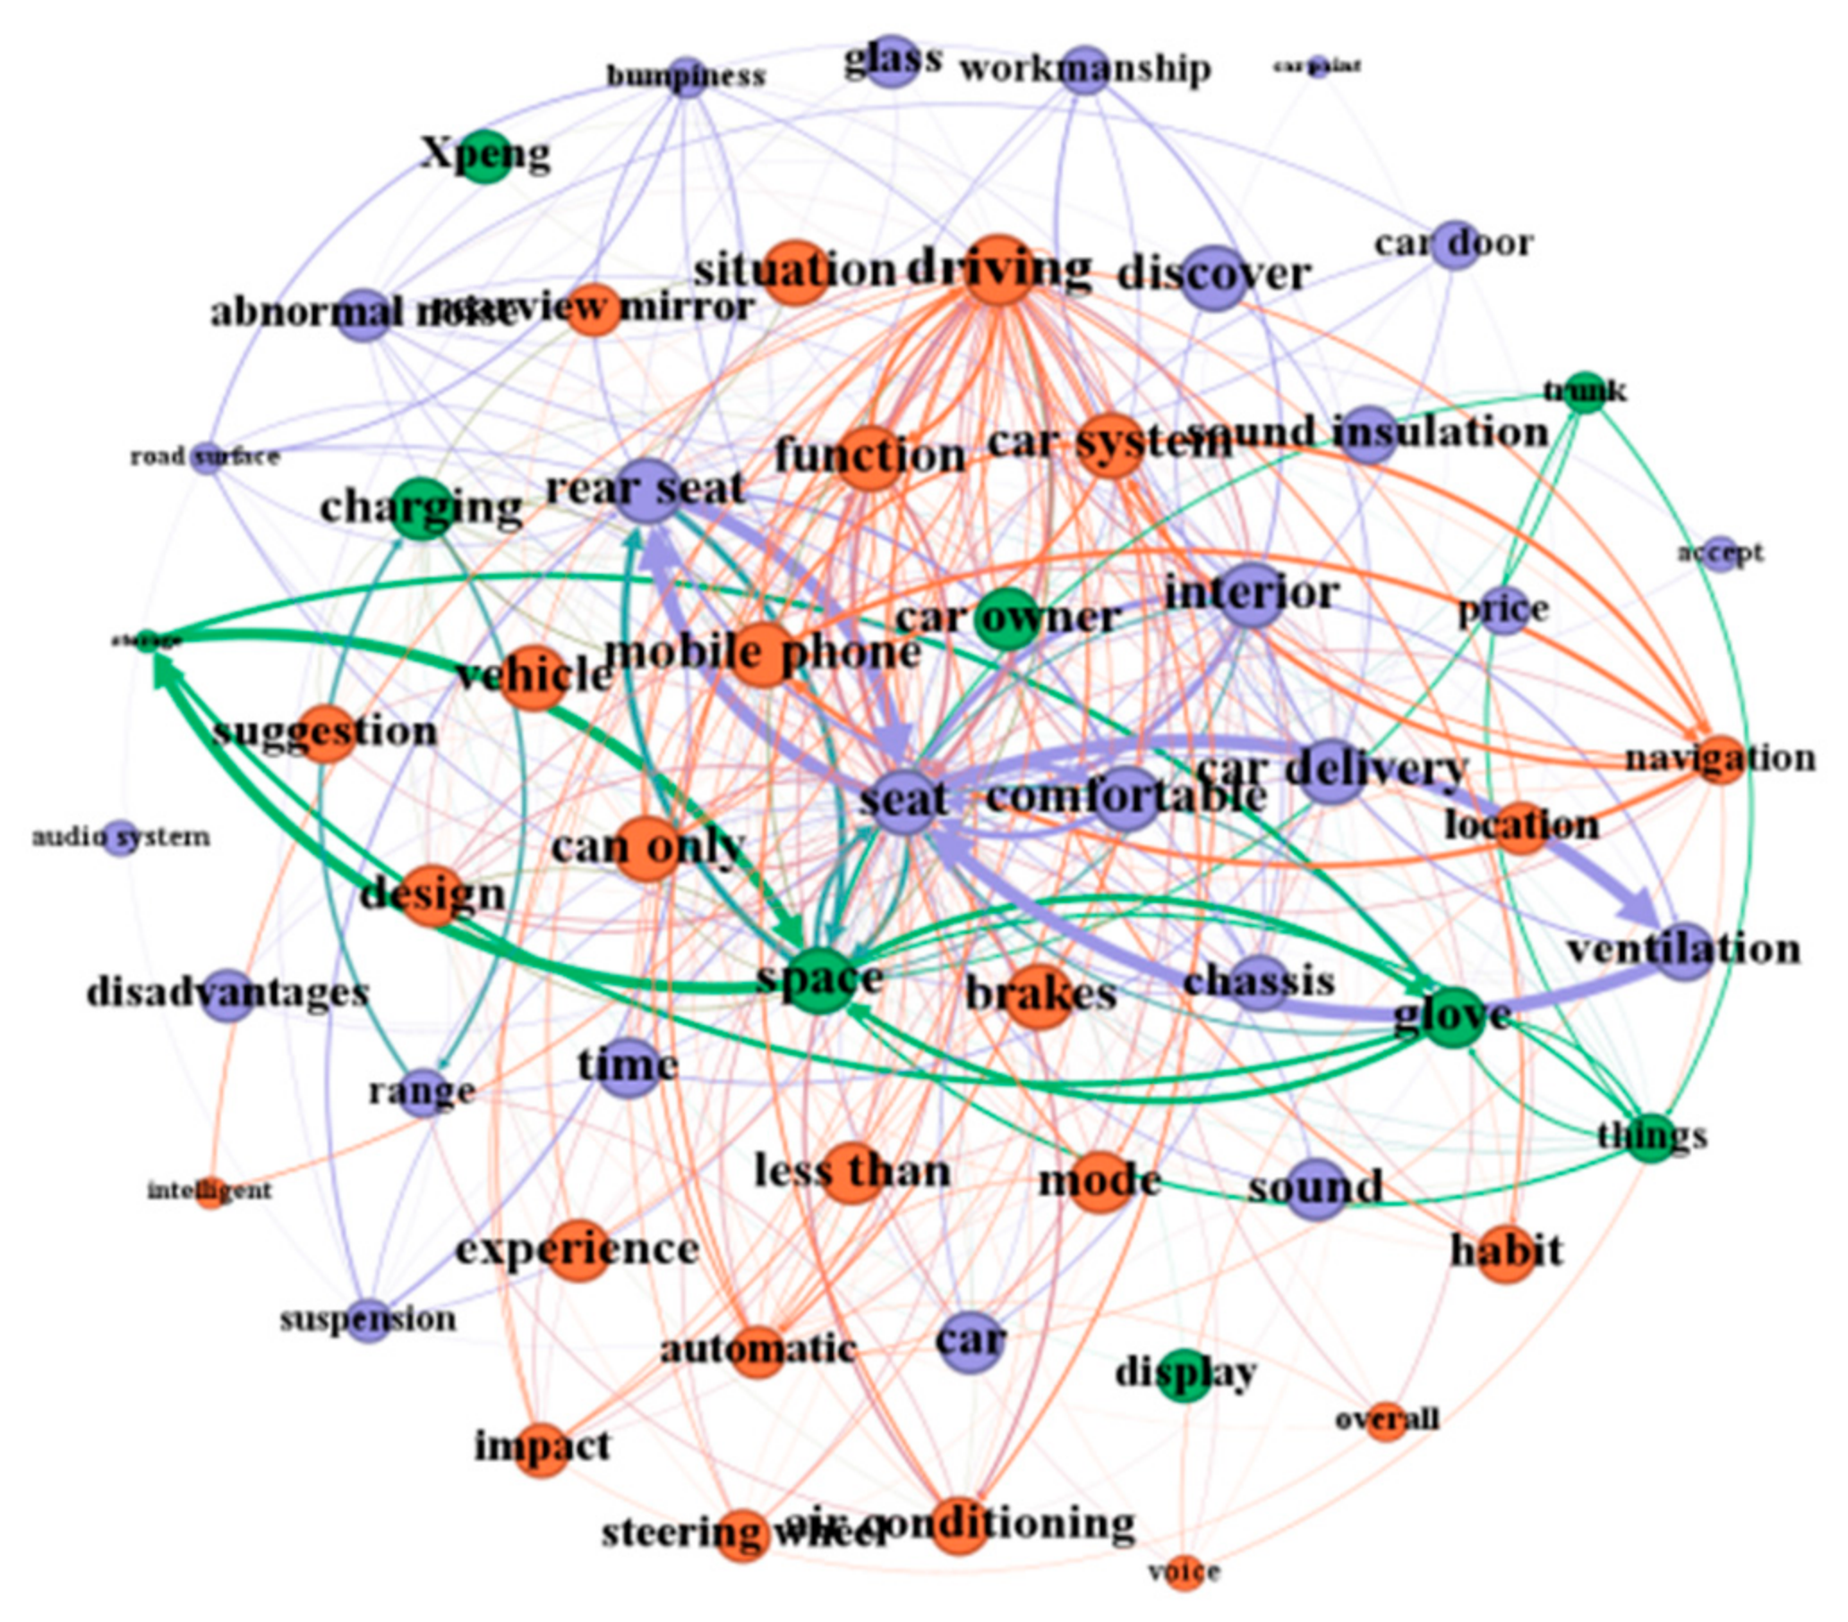
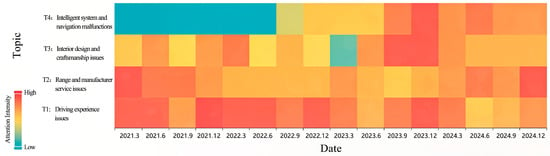
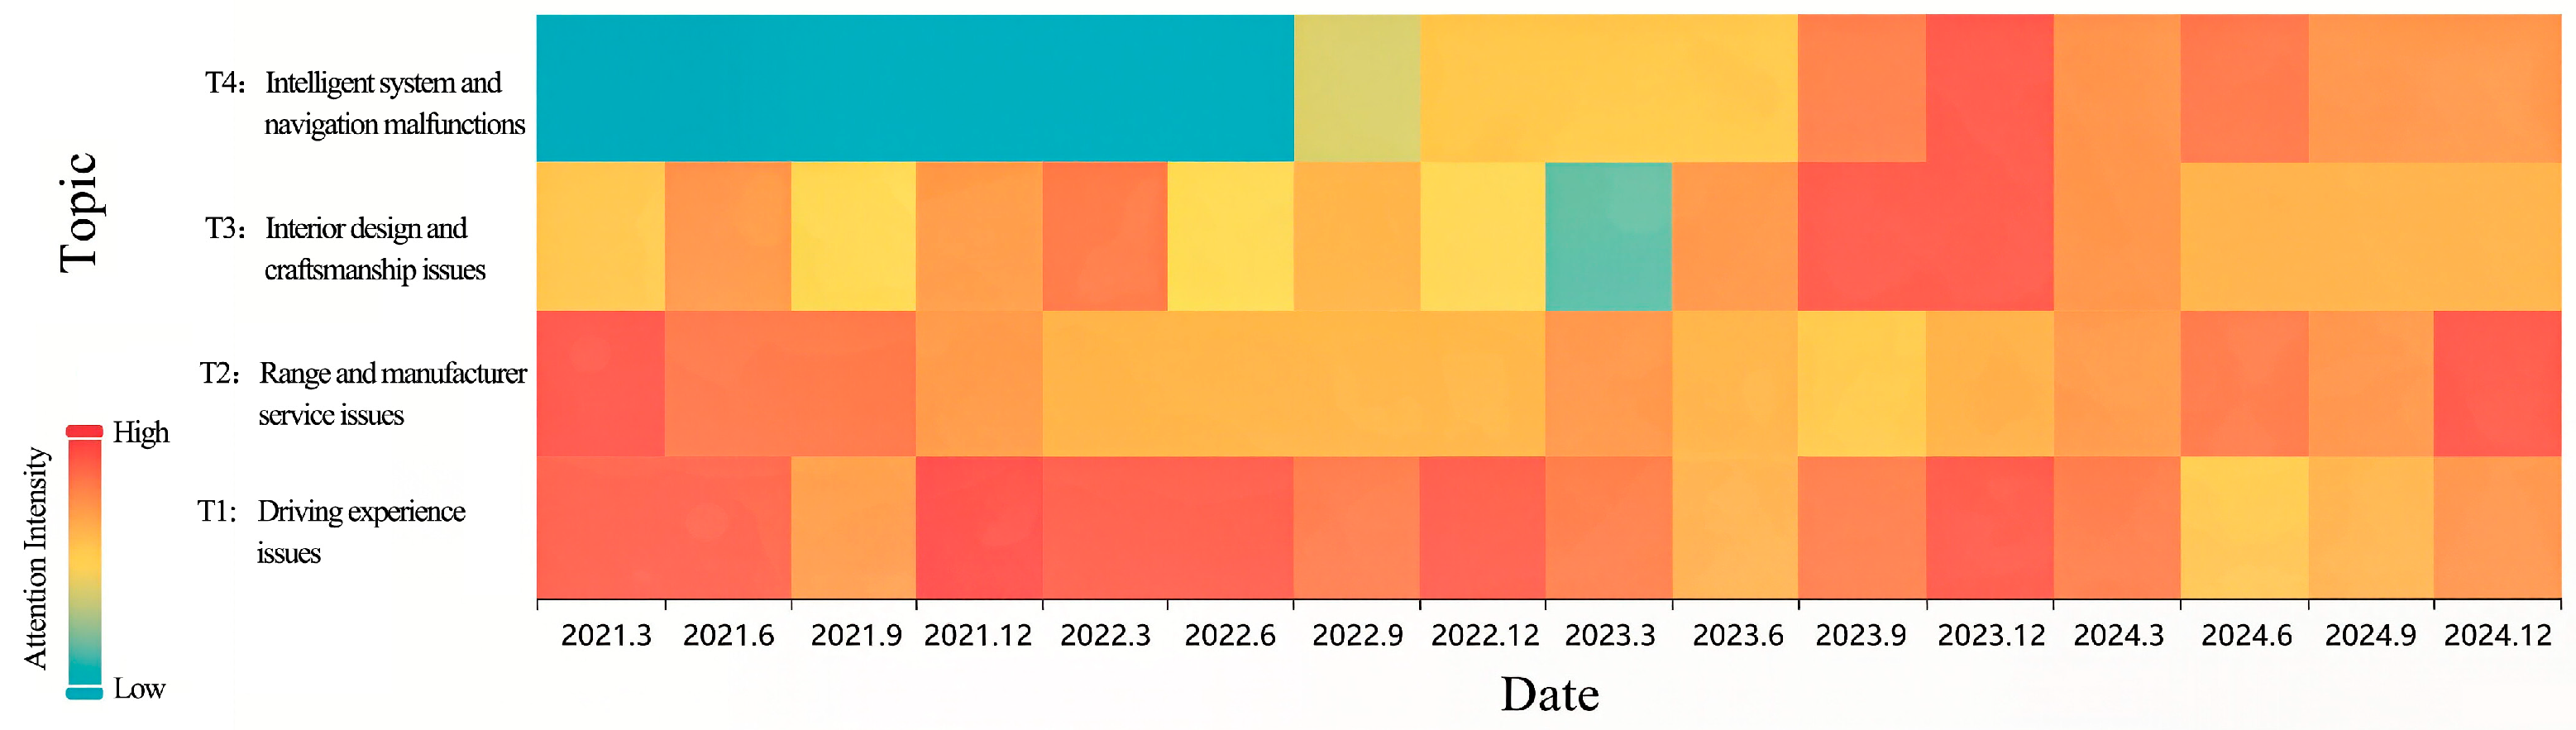

Disclaimer/Publisher’s Note: The statements, opinions and data contained in all publications are solely those of the individual author(s) and contributor(s) and not of MDPI and/or the editor(s). MDPI and/or the editor(s) disclaim responsibility for any injury to people or property resulting from any ideas, methods, instructions or products referred to in the content. |
© 2026 by the authors. Licensee MDPI, Basel, Switzerland. This article is an open access article distributed under the terms and conditions of the Creative Commons Attribution (CC BY) license.