


Abstract
Frequent rainfall events threaten expressway operations, and toll stations, as critical network nodes, are vulnerable to functional degradation and cascading effects. However, existing traffic resilience studies mainly focus on urban road networks or static assessments, making it difficult to characterize the resilience evolution, recovery process, and predictability of toll-station nodes. This study proposes a resilience quantification and recovery prediction method for expressway toll-station nodes under rainfall disturbances. By integrating multi-source meteorological data, neighborhood propagation relationships, and network topology, a three-level resilience quantification framework is developed across the functional, neighborhood, and network layers. A piecewise exponential function is used to model the damage–valley–recovery process of node resilience and to extract parameters including damage depth and recovery rate. Focusing on the recovery stage, a node recovery prediction model is constructed by combining resilience sequences, meteorological disturbance features, and dual-graph spatial relationships, while dual-graph convolution and long short-term memory (LSTM) are used to capture the spatiotemporal evolution of node recovery. Results show that the proposed method quantifies toll-station node resilience, captures its staged evolution, and effectively predicts recovery. Baseline, cross-scene, and ablation results confirm the value of multi-source feature fusion and dual-graph propagation, supporting the sustainable operation of expressway systems under rainfall disturbances.
1. Introduction
Against the backdrop of global climate change, the frequency and intensity of heavy rainfall and extreme precipitation events have continued to increase, posing significant risks to the safe and stable operation of infrastructure systems [1,2]. For road transportation systems, rainfall disturbances not only weaken traffic conditions through water accumulation, reduced visibility, and deteriorated pavement adhesion, but also trigger cascading impacts such as congestion propagation, reduced operational efficiency, and functional failure [3,4]. Therefore, systematically characterizing the degradation, functional maintenance, and recovery capacities of road transportation systems under rainfall disturbances from a resilience perspective has become an important research issue in the fields of traffic safety, disaster management, and infrastructure operation management [5,6].
In expressway systems, toll stations are critical operational nodes that undertake vehicle collection and distribution, toll collection, and traffic organization functions. Compared with ordinary road sections, toll stations exhibit more pronounced nodal characteristics and perform both service and regulatory functions. Fluctuations in their operating status can significantly affect local traffic capacity, queue length, traffic conflict risk, and the operational efficiency of upstream and downstream road sections [7,8]. Constrained by limited space and complex weaving behavior, toll stations and their downstream areas are more susceptible to speed fluctuations, lane-changing interference, and increased crash risk [7]. Meanwhile, mainline toll stations have long been regarded as typical bottlenecks in expressway systems, and abnormal operation at these locations can amplify adverse effects on network service levels and safety performance [8]. Therefore, investigating the dynamic resilience changes and recovery patterns of toll stations during rainfall events from a node-level perspective is important for understanding the resilience behavior of critical operational nodes under rainfall disturbances. Existing studies on road transportation system resilience have gradually evolved from early single-outcome descriptions to multidimensional and process-oriented analyses. On the one hand, previous research has examined the effects of road connectivity, network efficiency, critical nodes, redundancy, and connection reliability on system resilience from a structural perspective [9], and has further extended robustness analysis to multimodal freight networks and integrated transportation networks [10,11]. On the other hand, with the introduction of the performance–time curve perspective, the functional evolution of systems before, during, and after disturbances has increasingly become an important basis for resilience measurement, while recovery speed, recovery path, and final recovery level have been recognized as key components of resilience assessment [5,12,13]. Under flooding or heavy rainfall disturbances, the resilience of road transportation networks is commonly characterized as a staged evolution process consisting of stable, damage, valley, and recovery stages, with significant spatial and temporal heterogeneity [3,14,15]. Relevant studies have also assessed road transportation resilience under rainfall disturbances from the perspectives of road hierarchy, spatial distribution, and integrated vulnerability [15,16], and have further combined percolation theory, hydrodynamic modeling, and multiple disturbance factors to conduct dynamic assessments of road network resilience under extreme rainstorm conditions [17,18]. Recent review studies have further indicated that transportation resilience assessment commonly involves topological, functional, and performance-related dimensions [6,19]. In this context, some recent studies under rainfall or extreme-weather disturbances have begun to incorporate multi-dimensional or multi-scale representations into resilience assessment. For example, Hong et al. evaluated the dynamic comprehensive resilience of urban road networks from the perspectives of structure, function, and performance [20], Du et al. assessed the resilience of bus–metro double-layer networks by jointly considering network structure and system function [21], and Li et al. examined road-network resilience under rainstorm events from both link-level and network-level perspectives [22]. Despite these advances, current studies still mainly focus on urban road systems, regional transportation systems, or multimodal public transport networks, while relatively limited attention has been paid to expressway toll stations as critical operational nodes [23,24]. More importantly, most existing studies remain at the link, road-section, or overall network level, and have not yet established a node-oriented multi-level resilience representation framework for toll-station nodes under rainfall disturbances that simultaneously captures functional degradation, neighborhood interaction, and network-topology heterogeneity. Consequently, recovery characterization and recovery-oriented analysis at the toll-station-node level remain insufficiently explored.
With advances in traffic big data, graph neural networks, and spatiotemporal deep learning methods, researchers have increasingly used real traffic data, meteorological data, and spatial adjacency relationships to predict road network operating conditions or resilience levels under extreme weather conditions [25,26,27]. In this line of research, long short-term memory (LSTM) has remained one of the most widely used temporal modeling frameworks because of its ability to capture the sequential evolution and nonlinear temporal dependencies of traffic states [28]. Recent studies have continued to apply LSTM-based architectures to traffic prediction, including bidirectional LSTM for freeway forecasting [29], MLR-LSTM for multi-section traffic flow prediction [30], optimized Bi-LSTM for short-term traffic forecasting under complex fluctuations [31], and GT-LSTM for spatiotemporal traffic forecasting [32]. These studies indicate that LSTM-based methods continue to provide an effective basis for modeling temporal continuity in traffic-related sequences. Meanwhile, graph-based spatiotemporal models have further extended this research line by incorporating spatial dependence into temporal prediction. For example, Wang et al. proposed a deep learning framework based on diffusion graph convolution to estimate and predict the spatiotemporal patterns of transportation resilience under extreme weather events [25]. Zang et al. further developed a dynamic graph neural network approach for real-time predictive assessment of road network resilience under heavy rainfall scenes [26]. Ma et al. constructed a traffic-state prediction model using graph convolution and gated recurrent units under adverse weather conditions, demonstrating that the incorporation of meteorological features can improve predictive performance [27]. These studies suggest that transportation resilience research is gradually shifting from static assessment toward dynamic perception and real-time early warning. Nevertheless, current prediction tasks still mainly target links, regional networks, or overall system states, while modeling efforts for different evolutionary stages, especially the recovery stages, remain insufficient. Compared with the damage stages, the recovery stages better reflect system recovery capability, resource allocation efficiency, and network regulation effects. It is therefore more suitable as a focal point for resilience assessment and operational intervention.
In summary, existing studies on transportation resilience under rainfall disturbances still pay limited attention to expressway toll-station nodes, and most of them focus on links, road sections, or overall networks rather than the resilience evolution of critical operational nodes. This leaves insufficient understanding of how toll-station nodes degrade, interact with neighboring nodes, and recover within the expressway network under rainfall disturbances. These limitations indicate a clear research opportunity to develop a node-level, multi-level, and recovery-oriented analytical framework for expressway toll-station resilience under rainfall disturbances. To address this gap, this study focuses on toll-station nodes as critical operational units and develops a unified framework for node-level resilience quantification, staged evolution analysis, and recovery-oriented prediction by integrating meteorological, neighborhood, and topological information. The novelty of the study lies in shifting the analytical focus from conventional link- or network-level perspectives to toll-station nodes and constructing a multi-level resilience representation framework to characterize node functional degradation, neighborhood interaction, and network-topology heterogeneity under rainfall disturbances. In addition, rather than directly predicting a general resilience sequence, the study specifically targets the recovery stage and develops a parameter prediction–trajectory reconstruction strategy to jointly predict recovery-related parameters and trajectories, thereby improving the interpretability of recovery prediction.
2. Materials and Methods
To implement the above research objectives, the overall methodological framework of this study is presented in Figure 1. The framework includes three core analytical stages, followed by validation and output. In the first stage, a three-level resilience quantification framework is constructed to quantify toll-station-node resilience under rainfall disturbances. In the second stage, the staged evolution characteristics of toll-station-node resilience are identified, and the key recovery-related parameters are extracted from the quantified resilience sequences. In the third stage, the study focuses on the recovery stage and performs the joint prediction of recovery parameters and recovery trajectories. Finally, the proposed framework is evaluated through main-scene experiments, cross-scene validation, ablation analysis, and baseline comparison.
Figure 1.
Overall framework and organization of the research study.
2.1. Study Area and Data Sources
This study focuses on the toll-station network of the Jilin Province expressway system in China. Four categories of data were used, including basic toll-station information, ERA5-Land reanalysis meteorological data, toll-station traffic flow data, and expressway network topology data. The basic toll-station information was used to determine the spatial location of nodes and their network connections. The meteorological data were used to characterize the intensity of external disturbances during rainfall events. The traffic flow data were employed to reflect variations in the functional state of toll-station nodes, thereby providing the basis for characterizing node-level performance degradation and recovery. The network topology data were used not only to construct node adjacency relationships, but also to calculate topology-related indicators for characterizing structural heterogeneity and topological importance within the expressway network, thereby supporting neighborhood-effect propagation and topology-based correction in the resilience quantification process. These four data categories correspond to the core components of the proposed framework, including node identification and spatial positioning, rainfall disturbance characterization, traffic-state response measurement, and network-structure representation, thereby providing the necessary data basis for node resilience quantification, staged evolution modeling, and recovery prediction. To examine the applicability of the proposed method under different rainfall disturbance conditions, three representative rainfall events during the 2023 flood season were selected as experimental scenes. According to their relative duration, these events were defined as Scene A (16:00, 12 July 2023–17:00, 18 July 2023), representing a long-duration rainfall scene; Scene B (22:00, 21 July 2023–11:00, 24 July 2023), representing a medium-duration rainfall scene; and Scene C (06:00, 4 August 2023–08:00, 6 August 2023), representing a short-duration rainfall scene. For each scene, 15 toll-station nodes were selected, representing 23.1% of all toll stations in the study network. These nodes were chosen as representative samples by comprehensively considering data completeness within the study window, the representativeness of rainfall impacts, and the spatial distribution and topological hierarchy of the nodes.
During data preprocessing, the traffic flow time series and meteorological time series were aligned to a unified temporal resolution, and samples with abnormal values or excessive missing records were removed. Meteorological variables corresponding to each toll-station node and time step were extracted by spatially matching station locations with meteorological grid data. In addition, adjacency matrices and topology-related information were constructed according to the expressway network structure to support the subsequent resilience quantification at the neighborhood and network levels.
2.2. Three-Level Resilience Quantification Method for Toll-Station Nodes
Considering that the resilience of toll-station nodes under rainfall disturbances depends not only on the degree of functional degradation of the node itself, but also on the propagation effects of neighboring nodes and network topology differences, a three-level resilience quantification framework was constructed, including the functional layer, the neighborhood layer, and the network layer. The three-level resilience quantification framework is illustrated in Figure 2.
Figure 2.
Framework of the three-level resilience quantification method for toll-station nodes.
2.2.1. Functional-Layer Resilience Quantification
Rainfall disturbances first act directly on the operating state of toll-station nodes through changes in meteorological conditions. Therefore, the core of functional-layer resilience quantification is to establish the relationship among meteorological impact, functional degradation, and functional resilience.
To comprehensively characterize the external disturbance intensity experienced by a node at a given time, six meteorological variables were extracted from the hourly ERA5-Land reanalysis data for the grid in which the node is located, including hourly precipitation, 3h accumulated precipitation, soil moisture, surface runoff, wind speed, and relative humidity, which are denoted as:
To eliminate dimensional effects and improve comparability among different meteorological variables, the z-score method was used to standardize all variables:
where and denote the mean and standard deviation of the -th meteorological variable during the study period, respectively.
Considering that different meteorological variables may affect the operating state of toll stations to different degrees, principal component analysis was used to determine the weight of each variable, and the composite meteorological impact intensity of node at time was constructed as:
where denotes the weight of the -th meteorological variable, and is the total number of meteorological variables. In intuitive terms, Equation (3) converts multiple meteorological variables into one integrated disturbance indicator, so that the subsequent resilience mapping can be driven by a single external-impact measure.
Since the response of toll-station nodes to rainfall disturbances is characterized by obvious threshold and nonlinear features, a piecewise Hybrid Logistic function was constructed to establish the mapping between meteorological impact intensity and the functional failure probability of nodes:
where and are the lower and upper impact thresholds, is the slope parameter of the logistic curve, and is the midpoint parameter. This formulation indicates that low-intensity disturbances induce only limited functional failure, whereas the failure probability increases rapidly once the disturbance intensity enters the threshold transition range.
To ensure consistency between the failure probability and the actual degree of toll-station operational degradation, a functional resilience sensitivity parameter was calibrated using the traffic-flow degradation rate. Let denote the reference traffic flow of node at time , and denote the actual traffic flow. The observed traffic-flow degradation rate can be expressed as:
Accordingly, the parameter was estimated by minimizing the error between the observed traffic-flow degradation and the degradation implied by the failure probability:
Based on the failure probability, the functional-layer resilience of node was reversely constructed as:
Thus, the functional-layer resilience reflects the degree to which a toll-station node can maintain normal operation under external meteorological disturbances.
2.2.2. Neighborhood-Layer Resilience Quantification
The resilience of a single node captures only its local functional state. However, road networks exhibit strong spatial interdependence, and changes in the state of one node tend to propagate to surrounding nodes along network connections. Therefore, to incorporate local propagation effects, the neighborhood-layer resilience was constructed by extending functional-layer resilience to include the influence of neighboring nodes.
The expressway network was abstracted as an undirected weighted graph , where the node set represents toll-station nodes and the edge set represents road connections among toll stations. Edge weights were defined using roadway geometric length. The shortest travel distance between any two toll-station nodes was calculated using Dijkstra’s algorithm, and an exponential decay function was adopted to construct the neighborhood weight:
where denotes the neighborhood reachability range, is the indicator function, is the distance-decay scale parameter, and denotes the neighboring node set of node . This weighting scheme reflects both the physical connectivity of the expressway network and the attenuation of disturbance effects with increasing propagation distance. Intuitively, nearby nodes exert stronger influence on node , whereas the contribution of farther nodes decreases progressively with distance.
Using these neighborhood weights, the neighborhood-layer resilience of node was defined by combining the functional-layer resilience of the node itself and that of its neighboring nodes:
where denotes the self-contribution coefficient of the node. This formulation indicates that the neighborhood-layer resilience reflects not only the local functional degradation of the node itself, but also the propagated influence of surrounding nodes.
2.2.3. Network-Layer Resilience Quantification
Although neighborhood-layer resilience can characterize local interaction effects within a limited spatial range, physical adjacency alone is insufficient to fully represent the structural importance of a node in the entire network. Therefore, a topology-based correction factor was introduced to adjust the neighborhood-layer resilience and construct the integrated resilience of toll-station nodes.
To characterize the structural role of a node in the expressway network, three topological indicators were selected, namely betweenness centrality, eigenvector centrality, and the inverse of average shortest path length. All indicators were normalized using the min–max method:
PCA was then employed to determine the integrated weights of the three topological indicators, denoted by , , and . The composite topology score of node was defined as:
where , and denote the normalized betweenness centrality, normalized eigenvector centrality, and normalized inverse average shortest path length of node , respectively. The coefficients , , and are the corresponding PCA-derived weights.
Using the mean composite topology score of the whole network as a reference, a relative correction factor was constructed to reflect the structural difference among nodes:
where denotes the mean topology score of all toll-station nodes.
Finally, the integrated network-layer resilience of node at time was calculated as:
Substituting the neighborhood-layer resilience into the above expression yields:
The integrated resilience simultaneously considers the node’s own functional degradation state, the propagated influence of neighboring nodes, and its structural importance within the expressway network. Accordingly, three resilience time series can be obtained for each toll-station node at every time step, namely functional-layer resilience, neighborhood-layer resilience, and integrated resilience:
2.3. Resilience Evolution Model Based on a Piecewise Exponential Function
2.3.1. Stage Division of Resilience Evolution and Identification of Key Time Points
Under rainfall disturbances, the integrated resilience of toll-station nodes generally follows a staged evolution process, which can generally be divided into four stages, namely the stable stage, damage stage, valley stage, and recovery stage [33]. In addition, the degradation and recovery of transportation networks may vary significantly under different spatial exposure patterns [34]. Specifically, the stable stage represents the relatively steady state before rainfall disturbances occur; the damage stage describes the rapid decline in resilience under rainfall impact; the valley stage describes the low-resilience period caused by sustained disturbances; and the recovery stage reflects the gradual rebound of resilience after the disturbance weakens until a new stable state is reached. Figure 3 presents a schematic illustration of node resilience evolution developed in this study.
Figure 3.
Schematic illustration of node resilience evolution under rainfall conditions.
Let denote the integrated resilience of node at time . The change in resilience between two adjacent time points is defined as:
To avoid identifying normal fluctuations as resilience degradation, the decline and recovery threshold were determined based on the first-order difference in the integrated resilience sequence during dry periods. Let the dry-period sample set be denoted by . The decline threshold was defined as the 25th percentile of the dry-period first-order difference sequence, while the recovery threshold was set as 1.2 times the absolute value of the decline threshold:
Based on these thresholds, three key time points in the resilience evolution process were identified. The decline threshold was defined from dry-period fluctuations to identify only substantial resilience drops, whereas the recovery threshold was set more conservatively to prevent short-term oscillations from being misclassified as effective recovery.
The damage onset time was defined as the earliest time at which the node exhibited a significant and continuous decline after remaining relatively stable during the preceding period:
where denotes the end time of the analysis window for the rainfall even, denotes a dummy time index within the preceding stability-check window before the candidate time .
The valley time was defined as the time at which the integrated resilience reaches its minimum during a rainfall event:
The recovery onset time was defined as the earliest time after the valley stage at which the node showed a significant increase, following a relatively stable low-resilience period:
Accordingly, the resilience evolution process of a node can be divided into four stages: the stable stage (), the damage stage (), the valley stage , and the recovery stage (), where denotes the start time of the rainfall-event analysis window. This stage division transforms the integrated resilience sequence into a piecewise dynamic evolution process with explicit temporal boundaries, establishing a unified framework for identifying resilience evolution across heterogeneous rainfall scenes. Accordingly, differences among scenes can be compared through the timing and characteristics of the identified stages under a consistent set of rules.
2.3.2. Resilience Curve Model for the Damage Stage
During the damage stage, node resilience gradually declines from a relatively high level at the damage onset to the valley level. To characterize this nonlinear process, which is characterized by a rapid initial decline followed by slower convergence toward the valley level, an exponential damage function was used to model the resilience decline of nodes under rainfall disturbances [33]:
where denotes the resilience level at the damage onset time, denotes the minimum resilience level, and is the damage-rate parameter, which reflects the sensitivity of the node to rainfall disturbance. This formulation captures the nonlinear feature that resilience decreases rapidly during the early damage stage and then gradually approaches the valley level.
The damage depth of node during a rainfall event is defined as:
A larger value of indicates more severe performance degradation under rainfall disturbance.
2.3.3. Resilience Curve Model for the Recovery Stage
After the valley stage, as rainfall disturbance weakens and system operation gradually recovers, node resilience rebounds from the valley level toward a new stable state. To describe this asymptotic recovery process, which is characterized by a rapid early rebound followed by gradual convergence to a stable platform, an exponential recovery function was used to model the resilience evolution of node during the recovery stage [33]:
where denotes the stable recovery platform value after recovery, and denotes the recovery-rate parameter. The parameter characterizes the long-term resilience level approached after recovery, whereas controls the speed at which the resilience curve approaches this platform. Under the stage-division framework above, the recovery process is represented as the post-valley rebound segment beginning at , with governing the recovery speed and characterizing the long-term recovery level. When , , indicating that the recovery process starts from the valley resilience level. When , , indicating that node resilience eventually converges to a stable platform value. As increases, the exponential term gradually decays, and the resilience value converges to the stable recovery platform This representation also provides a consistent basis for comparing recovery dynamics across rainfall scenes with different durations and disturbance intensities.
2.3.4. Estimation of Resilience Evolution Characteristic Parameters
By combining the damage-stage and recovery-stage models, the resilience evolution of node during a rainfall event can be represented as a piecewise function controlled by a set of key parameters:
The resilience evolution characteristics of node in a rainfall event can therefore be summarized by the following parameter set:
The parameter set was estimated by minimizing the squared error between the fitted curve and the observed resilience sequence over the rainfall-event window, so that the fitted curve could reproduce the observed resilience evolution as closely as possible:
subject to:
where denotes the rainfall-event window, and and represent the observed resilience and fitted resilience of node respectively. The constraints in Equation (29) ensure that all fitted parameters remain within physically meaningful ranges. Since the model is a smooth nonlinear function, the gradient-based bounded quasi-Newton algorithm L-BFGS-B was adopted for parameter estimation [35]. The resulting resilience evolution parameters can be used to compare the resilience differences among toll-station nodes under rainfall disturbances, and can also serve as prediction targets and physical constraints for the subsequent recovery prediction model.
2.4. Recovery Prediction Model for Node Resilience
2.4.1. Model Architecture
To predict the recovery platform value and the recovery rate , a node-level resilience recovery prediction model was constructed for the recovery stage, and the recovery-stage equation was further used to reconstruct future recovery trajectories. The overall model consists of four components, namely input feature construction, dual-graph spatiotemporal encoding, a multi-task parameter prediction head, and a recovery-stage decoder. The overall structure is shown in Figure 4.
Figure 4.
Architecture of the recovery prediction model.
2.4.2. Input Feature Construction
To comprehensively characterize the driving factors of node resilience evolution under rainfall disturbances, the input features were divided into three categories: dynamic operational features, meteorological disturbance features, and static structural features.
- Dynamic operational features
The dynamic operational state of node within the historical observation window is represented as:
where , , and denote the functional-layer, neighborhood-layer, and integrated resilience values of node at time , respectively, and denotes the resilience variation rate. This variation term helps the model capture accelerated degradation and recovery turning points. These dynamic features are constructed from the quantified multi-level resilience states and their variation rate and determine the short-term operational fluctuation characteristics of toll-station nodes during functional degradation and recovery.
- 2.
- Meteorological disturbance features
Based on the quantified meteorological impact, the meteorological input vector of node is constructed as:
where denotes the composite meteorological impact intensity, denotes hourly precipitation, and denotes surface soil moisture. These variables describe both the instantaneous rainfall disturbance and the antecedent wetness condition that may affect the recovery process.
To characterize the influence of future rainfall scenes on the recovery process, exogenous constraint features within the future horizon are further constructed as:
where denotes the maximum rainfall intensity within the future prediction horizon, and denotes the cumulative precipitation. These exogenous features are introduced to represent the remaining rainfall pressure during the recovery stage.
- 3.
- Static topological features
The static structural features of node are represented as:
where , , and denote the normalized betweenness centrality, normalized eigenvector centrality, and normalized inverse average shortest path length of node , respectively, and denotes the topology correction factor. These static topological features reflect the structural role and importance of each toll-station node in the expressway network.
2.4.3. Dual-Graph Spatiotemporal Encoding and Recovery Parameter Prediction
To characterize the coupled propagation mechanism of node resilience from the perspectives of spatial adjacency and topological structure under rainfall disturbances, a dual-graph structure was constructed. In graph representation learning, graph convolutional networks can effectively capture local neighborhood relationships and feature propagation patterns in graph-structured data [36], while long short-term memory (LSTM) networks are capable of modeling long-term temporal dependencies in sequential data and remain widely used as temporal encoders in recent traffic prediction studies [28,29,30,31,32]. Therefore, a dual-graph convolution + LSTM framework was adopted to extract spatiotemporal features of the node recovery process.
The distance graph was defined using the adjacency weight matrix based on actual travel distance:
The topology graph was constructed according to the similarity of node topological characteristics, thereby reflecting structural similarity and potential diffusion relationships across the network:
where denotes the decay parameter of topological difference.
At each time step, the total input feature vector of node is defined as the concatenation of dynamic, meteorological, and static topological features:
Based on the dual-graph structure, graph convolution is applied to aggregate spatial neighborhood information. Let denote the node feature matrix at time in the -th layer. The dual-graph convolution can be written as:
where and are learnable weight matrices for the distance-graph branch and topology-graph branch, respectively, and is a nonlinear activation function. Equation (37) indicates that each node updates its representation by aggregating information from both physically adjacent nodes and topologically similar nodes, thereby capturing complementary spatial dependencies related to the recovery process.
After spatial aggregation, the resulting spatial representations within the historical window are sequentially fed into the LSTM module to capture temporal dependencies in the recovery process:
where denotes the spatial representation of node at time , and denotes the historical window length. The LSTM models the temporal evolution of these spatially aggregated node states, allowing the prediction model to capture recovery-related temporal continuity.
The temporal representation is then concatenated with the future rainfall summary feature and fed into the multi-task prediction head to obtain the recovery parameters:
To satisfy the parameter boundary constraints, different activation functions were applied to the two output branches:
where and denote the raw outputs of the corresponding prediction branches. Through this design, and are guaranteed. Table 1 summarizes the roles of the major components in the proposed framework.
Table 1.
Roles of the major components in the proposed framework.
2.4.4. Recovery-Stage Decoder
The predicted recovery parameters are substituted into the recovery-stage equation to reconstruct the future resilience recovery curve. Let denote the resilience value of node at the recovery onset time . Based on and , the predicted recovery curve is expressed as:
This decoder transforms the predicted recovery parameters into a physically interpretable recovery trajectory, so that the model output includes not only the recovery platform value and the recovery rate, but also the future recovery curve itself.
2.4.5. Model Training
To simultaneously ensure the accuracy of parameter prediction and the physical consistency of the recovery curve, a joint optimization objective was constructed as:
where denotes the total training loss, and , , , and denote the parameter supervision loss, curve reconstruction loss, physical constraint loss, and spatial smoothness loss, respectively; and , , , and are their corresponding weighting coefficients.
- Parameter supervision loss
This term constrains the prediction accuracy of the recovery platform value and recovery rate, where and are the loss weights for the two parameters.
- Curve reconstruction loss
This term measures the overall discrepancy between the decoded recovery curve and the observed resilience curve.
- Physical constraint loss
- Spatial smoothness loss
This term is introduced to encourage spatial smoothness of the predicted recovery parameters among nearby nodes.
The model was trained end-to-end using the Adam optimizer. During the training process, samples were divided into training, validation, and test sets, and an early-stopping strategy was adopted to mitigate overfitting.
2.5. Experimental Settings and Evaluation Metrics
For the experimental design, a strategy combining in-depth analysis in a main scene with comparative validation across multiple scenes was adopted. Scene A was selected as the main experimental scene, in which three-level resilience quantification, stage identification, piecewise exponential fitting, and recovery prediction experiments were conducted. Scene B and Scene C were used as supplementary scenes to compare the resilience evolution characteristics and recovery prediction performance of toll-station nodes under different rainfall disturbance conditions.
For the recovery prediction experiment, the historical window before the recovery onset time was used as the model input, while the recovery-stage parameters and recovery curves were taken as prediction targets. Samples were divided into training, validation, and test sets. The spatial encoding module consisted of a two-layer dual-graph convolution structure, while the temporal encoding module consisted of a one-layer LSTM. This relatively compact architecture was selected to balance model expressiveness and the risk of overfitting in an event-based node dataset. The remaining hyperparameters were set as follows: , , and , and the number of . These settings were chosen to maintain stable optimization while avoiding over-parameterization under a limited sample size.
To comprehensively evaluate the effectiveness of the proposed model, the evaluation was conducted from two perspectives, namely curve prediction and parameter prediction.
- Curve-level evaluation metrics
At the curve level, the root mean square error, mean absolute error, and Pearson correlation coefficient were used to evaluate the consistency between the predicted recovery curves and the observed recovery curves.
- Parameter-level evaluation metrics
At the parameter level, the prediction errors of the recovery platform value and the recovery rate were evaluated using RMSE and MAE.
In summary, the proposed prediction model for the node recovery stage integrates historical resilience states, rainfall disturbance inputs, neighborhood interaction relationships, and network topology information into a unified spatiotemporal learning framework. Through the parameter prediction–trajectory reconstruction strategy, the model predicts both recovery-stage parameters and recovery trajectories.
3. Results
3.1. Results of Three-Level Resilience Quantification for Toll-Station Nodes
According to the functional-layer resilience quantification method, the weights of the six meteorological variables in Scene A are shown in Figure 5. These weighted variables were then aggregated to derive the composite meteorological impact intensity , and the functional-layer resilience sequence was further derived through the Hybrid Logistic failure-mapping function and parameter calibration.
Figure 5.
Weights of meteorological variables.
As shown by the blue curves in Figure 6, the functional-layer resilience of most nodes declined markedly during the intensified rainfall period and gradually recovered as rainfall weakened, exhibiting a staged variation pattern consistent with the rainfall process. These results indicate that the functional-layer resilience can effectively characterize the direct impact of rainfall disturbances on the local operating state of toll-station nodes.
Figure 6.
Resilience evolution curves of all nodes in Scene A.
To further capture the spatial propagation effect of rainfall disturbances within the road network, an undirected weighted graph of toll-station nodes was constructed based on the vectorized expressway network of Jilin Province. The shortest path distance matrix between toll stations was calculated, and an adjacency weight matrix was generated using an exponential distance-decay function. Based on the parameter sensitivity analysis, the neighborhood radius was set to km, the distance scale parameter was set to km, and the self-contribution coefficient was set to . This parameter combination was selected to preserve meaningful spatial interactions among toll-station nodes, avoid overly sparse neighborhoods under a smaller radius, and reduce the risk of oversmoothing caused by excessive spatial aggregation. In addition, assigning a self-contribution coefficient of 0.7 ensures that the node’s own functional state remains dominant while still allowing neighboring nodes to contribute to local resilience propagation. The resulting neighborhood-layer resilience is shown by the orange curves in Figure 6. Compared with the functional-layer curves, the neighborhood-layer curves retain broadly consistent evolutionary trends but show weaker short-term fluctuations. This suggests that the neighborhood layer preserves the local damage information of each node while also reflecting the linkage and spatial diffusion effects among adjacent nodes.
For the network-layer correction, the topological importance correction factor was calculated using the standardized values and weights of three topological indicators: betweenness centrality, eigenvector centrality, and average shortest path length. The corrected comprehensive resilience was then obtained after incorporating this network-level adjustment. As shown by the green curves in Figure 6, compared with the orange curves that only reflect local node states and neighborhood propagation effects, the corrected resilience preserves the overall damage–valley–recovery pattern while further enlarging the resilience differences among nodes, thereby revealing a clearer stratification across nodes with different levels of topological importance. This indicates that network-layer correction not only captures local degradation and neighborhood interaction, but also incorporates the structural role of nodes in the overall road network, thereby improving the discriminative capacity and global interpretability of the resilience representation.
3.2. Piecewise Fitting Results of Node Resilience Evolution Curves
3.2.1. Results of Resilience Stage Identification
Based on the integrated resilience quantification results, the damage, valley, and recovery stages of toll-station nodes under rainfall disturbances were further identified. The key time-point identification results show that, in Scene A, most nodes entered the damage stage around 14 July, then experienced the valley stage, and gradually transitioned into the recovery stage. Taking node 0325 as an example, Figure 7 shows that its resilience curve remained relatively stable before , declined rapidly during the interval from to , then remained at a low level with slight fluctuations during the valley stage, and finally entered the recovery stage after , where resilience gradually increased and stabilized. This damage–valley–recovery evolutionary pattern was also observed in most of the other nodes.
Figure 7.
Three-stage identification result of resilience for Node 0325.
The key time-point statistics for the 15 toll-station nodes in Table 2 further indicate that the damage onset time , valley time , and recovery onset time were relatively concentrated along the time axis, suggesting that this rainfall event produced a strong synchronous disturbance across nodes. By contrast, the valley duration, defined as , varied considerably among nodes, indicating a certain degree of spatial heterogeneity in both recovery triggering time and recovery progression.
Table 2.
Statistics of key phase transition times identified in Scene A.
3.2.2. Piecewise Exponential Fitting Performance
Based on the identified resilience stages, a piecewise exponential function was used to fit the resilience evolution process of each toll-station node and to characterize the nonlinear variation in both the damage stage and the recovery stage. The results show that the fitted curves can effectively capture the rapid decline during the damage stage, the plateau-like feature of the valley stage, and the asymptotic increase during the recovery stage.
Taking node 0325 as an example, the comparison between the observed resilience curve and the fitted curve is shown in Figure 8. The damage-rate parameter of this node was estimated as , whereas the recovery-rate parameter was estimated as , indicating that the node experienced relatively rapid degradation but comparatively slow recovery.
Figure 8.
Piecewise fitting result of resilience for Node 0325.
The piecewise exponential fitting procedure was then applied to the resilience sequences of all nodes in Scene A. The full fitting results are shown in Figure 9. For most nodes, the fitted curves reproduced the dominant curve patterns in the damage, valley, and recovery stages well, demonstrating the applicability of the proposed resilience evolution curve model.
Figure 9.
Piecewise fitting results for all nodes in Scene A.
3.2.3. Statistical Characteristics of Resilience Evolution Parameters
To characterize the differences in resilience response among toll-station nodes under rainfall disturbances, the key evolution parameters derived from the piecewise fitting results were statistically analyzed. Table 3 presents the descriptive statistics of the damage depth, the damage rate, the recovery rate, and the valley duration in Scene A, while Figure 10 illustrates their overall distributions. As shown in Table 3 and Figure 10, the damage depth and the damage rate were relatively concentrated across nodes. This is reflected not only by the compact boxes in Figure 10, but also by the relatively small standard deviations in Table 3, namely 0.049 for and 0.070 for . These results indicate that most nodes showed similar levels of damage severity and degradation speed within Scene A. By contrast, the recovery rate and the valley duration exhibited greater dispersion. In particular, showed the largest standard deviation of 0.228, a median value of 0.068 that was much lower than its mean value of 0.136, and several high-value outliers in Figure 10. This indicates that the recovery speed varied substantially among nodes and was right-skewed by a few nodes with relatively fast recovery. Likewise, showed a wide interquartile range and a standard deviation of 8.224, suggesting considerable differences in the duration for which different nodes remained in the low-resilience stage. Therefore, compared with the damage-stage parameters, the recovery-related parameters showed stronger inter-node variability, which further supports focusing on the recovery stage as the main prediction target in the subsequent analysis.
Table 3.
Descriptive statistics of evolution parameters in Scene A.
Figure 10.
Boxplots of piecewise fitting parameters of resilience.
3.2.4. Cross-Scene Comparative Validation Results
On the basis of the main scene, Scene A, the stage identification and piecewise exponential fitting procedure were further applied to Scene B and Scene C to test the applicability of the proposed method under different rainfall disturbance conditions. In terms of fitting accuracy, the piecewise exponential framework achieved stable fitting performance in all three scenes. As shown in Table 4, Scene A exhibited the lowest error level and highest fitting accuracy. Although the fitting accuracy varied to some extent across scenes, the proposed piecewise exponential model could consistently characterize the staged evolution process of node resilience in all cases.
Table 4.
Comparison of fitting accuracy across three rainfall scenes.
To further compare the recovery processes under different rainfall scenes, a recovery characteristic time was introduced, which represents the time required for the recovery curve of node to reach 95% of its final recovery level.
As shown in Table 5 and Figure 11, both and differed markedly across the three rainfall scenes. Scene A exhibited not only the highest median values of and , but also a visibly wider distribution in both indicators, indicating that long-duration rainfall was associated with both longer recovery and stronger inter-node heterogeneity. By contrast, Scenes B and C showed much lower and more concentrated distributions, suggesting shorter and more stable recovery processes under medium- and short-duration rainfall disturbances. In addition, Figure 11b shows an isolated high-value outlier in Scene B, implying that although most nodes recovered relatively quickly in this scene, a small number of nodes still experienced delayed recovery. Overall, the comparison in Table 5 and Figure 11 indicates that prolonged rainfall not only lengthens the recovery phase and valley duration of toll-station nodes, but also increases the variability of recovery behavior across nodes.
Table 5.
Recovery and Low-Resilience Characteristic Indicators.
Figure 11.
Comparison of Recovery and Valley Characteristics across the Three Scenes: (a) ; (b) .
3.3. Results and Analysis of Node Resilience Recovery Prediction
3.3.1. Prediction Results of Recovery Parameters
To further predict the resilience recovery process of nodes under rainfall disturbances, a node-level resilience recovery prediction model was developed. By learning historical resilience evolution features, topological structure features, and rainfall disturbance features, the model predicts the recovery parameters of nodes and further reconstructs their resilience recovery curves. Based on the main scene, Scene A, the key recovery-stage parameters and were predicted, and the prediction performance was evaluated using the root mean square error (RMSE) and mean absolute error (MAE), as reported in Table 6. The model showed good performance in predicting the recovery platform value , with an RMSE of 0.0764 and an MAE of 0.0521, indicating that it can relatively reliably estimate the resilience level reached after node recovery. By contrast, the prediction error of the recovery-rate parameter was larger, suggesting that the recovery rate exhibits stronger dynamic complexity and node-level heterogeneity than the recovery platform value. This is because mainly characterizes the final stable platform reached in the later stage of recovery and is more strongly constrained by the overall recovery trend, making it easier to learn from historical resilience sequences and future rainfall summary features. In contrast, primarily describes the rate of change from the early to middle stages of recovery and is more sensitive to local slope variations, short-term fluctuations, and differences in recovery paths among nodes, making it more susceptible to noise and local disturbances. In addition, differences among toll-station nodes in operational recovery conditions, traffic organization states, and network topological positions may further amplify the dispersion of recovery rates, thereby increasing the difficulty of predicting . Overall, the proposed model can effectively predict the key parameters of the recovery stage and provide reliable inputs for the subsequent reconstruction of recovery curves.
Table 6.
Prediction errors of resilience recovery parameters.
3.3.2. Prediction Results of Recovery Curves
Based on the predicted recovery parameters, the exponential recovery function was used to reconstruct the resilience recovery trajectories, and the predicted recovery curves were compared with the observed curves. The experimental results for Scene A show that the RMSE, MAE, and Pearson correlation coefficient of the recovery-curve prediction were 0.176, 0.112, and 0.706, respectively. The predicted curves were able to track the overall variation trend of the recovery stage reasonably well and maintained good shape consistency in both the rapid rise during the early recovery stage and the gradual stabilization during the later recovery stage.
Figure 12 presents the recovery-curve prediction results for representative toll-station nodes in the test set of Scene A. For several nodes, the predicted recovery speed was slightly faster than the observed recovery speed; nevertheless, the overall variation trend remained consistent with the actual recovery process. These results suggest that the proposed prediction model can effectively capture the major evolution patterns of the recovery stage.
Figure 12.
Comparison of recovery curves for representative nodes in Scene A.
3.3.3. Comparison with Baseline Models
To further evaluate the proposed framework, two recurrent baseline models, namely LSTM and GRU, were implemented in the main scene (Scene A), and the results are summarized in Table 7. The proposed model achieved the best overall performance when both recovery-parameter prediction and recovery-curve reconstruction were considered simultaneously. Specifically, it obtained the lowest MAE for the recovery platform parameter , the lowest RMSE and MAE for the recovery-rate parameter , and the lowest Curve RMSE and Curve MAE. Although GRU yielded a slightly lower RMSE for , its errors for and recovery-curve reconstruction were larger than those of the proposed model. LSTM showed relatively competitive performance, but it still underperformed the proposed model in both recovery-rate prediction and curve reconstruction. These results indicate that simple recurrent models can provide competitive performance on some individual metrics, whereas the proposed model is more effective in jointly capturing the recovery parameters and the overall recovery trajectory.
Table 7.
Comparison with baseline models in Scene A.
3.3.4. Comparative Analysis of Cross-Scene Recovery Prediction Results
To further assess the applicability of the model, the prediction results under different rainfall scenes were compared. Table 8 reports the prediction errors of the recovery parameters across scenes, while Figure 13 and Figure 14 present the corresponding recovery-curve prediction results for Scene B and Scene C, respectively. For recovery-parameter prediction, the model achieved stable performance in all three rainfall scenes. In particular, the prediction accuracy for the recovery platform parameter was relatively high, and the RMSE values remained within a small range in all scenes, indicating that the model can reliably estimate the post-recovery stable resilience level. For the recovery-rate parameter , the prediction task was more challenging in the long-duration rainfall scene, which is consistent with the longer and more complex recovery process observed in Scene A. Under long-duration rainfall conditions, node recovery is more likely to be affected by prolonged disturbance effects, delayed functional restoration, and greater temporal complexity in the recovery stage, which together increase the uncertainty of recovery-rate estimation. Nevertheless, the model still captured the recovery-stage variation trend reasonably well overall.
Table 8.
Comparison of predicted recovery parameters under different scenes.
Figure 13.
Comparison of recovery curves for representative nodes in Scene B.
Figure 14.
Comparison of recovery curves for representative nodes in Scene C.
For recovery-curve prediction, the predicted curves of the test nodes in Scenes B and C generally followed the main variation trends of the actual recovery process. The predicted curves were broadly consistent with the observed curves in terms of both the initial rising pattern and the final stable level. These findings indicate that the proposed recovery prediction framework can consistently learn the spatiotemporal evolution patterns of node recovery and exhibits reasonable cross-scene generalization capability.
3.3.5. Ablation Study
To further analyze the influence of different model components on node resilience recovery prediction performance, an ablation study was conducted. In this experiment, the static topological features, rainfall disturbance features, and dual-graph propagation module were removed separately and compared with the full model. The results are listed in Table 9.
Table 9.
Results of the Ablation Experiments.
The full model achieved the best overall performance across all evaluation metrics, where overall performance refers to both curve-level recovery reconstruction performance and parameter-level recovery prediction performance. Specifically, the full model yielded the lowest Curve RMSE and Curve MAE, the highest Curve Corr, and the lowest prediction errors for both and . These results indicate that the proposed multi-source feature fusion framework can effectively capture both the overall evolution trend of the recovery stage and the characteristics of key recovery parameters. When the static topological features were removed, the model performance declined, the curve correlation coefficient decreased, and the prediction error of the recovery-rate parameter increased. This suggests that the structural position of nodes in the expressway network plays an important role in the resilience recovery process. After removing the rainfall features, the recovery-curve prediction error increased further, indicating that rainfall features, as external disturbance inputs, make an important contribution to the identification of recovery trends. When the dual-graph propagation module was removed, the prediction performance deteriorated most substantially, which suggests that jointly considering both inter-node distance relationships and topological associations is beneficial for improving the characterization of the recovery process.
4. Discussion
4.1. Heterogeneity of Toll-Station Node Recovery and the Significance of Recovery-Oriented Prediction
Toll-station nodes exhibit pronounced recovery heterogeneity under rainfall disturbances, which is mainly reflected in two dimensions: recovery rate and valley-stage duration. Compared with the relatively concentrated distribution of parameters in the damage stage, the parameters in the recovery stage show much greater dispersion, indicating more evident differences among nodes in terms of recovery initiation and recovery speed. Previous studies have pointed out that transportation resilience should focus on the complete dynamic process before, during, and after disturbances, particularly the duration, path, and final level of the recovery stage [5,12]. The findings obtained in this study at the toll-station node level are consistent with this understanding, showing that toll-station node recovery is both stage-dependent and highly heterogeneous across nodes. This is also consistent with recent studies on the dynamic resilience of road networks under rainstorm and flood disturbances [13,20,37].
From a mechanistic perspective, such recovery heterogeneity is not determined solely by localized meteorological exposure, but is the result of the combined effects of external rainfall disturbances, local neighborhood propagation, and network topological importance. Therefore, compared with merely analyzing whether a node is damaged, using the recovery stage as the key prediction target is of greater operational management significance. For critical nodes such as toll stations, managers are more concerned with when the node will recover, to what level it will recover, and how the recovery sequence of different nodes should be prioritized. Therefore, recovery-oriented prediction can better support traffic operation scheduling and recovery management under rainfall disturbances. Similar studies on multilayer public transport networks have also shown that recovery sequence and network coupling relationships can significantly affect the overall recovery efficiency [21,38].
4.2. Roles of Multi-Source Feature Fusion and the Dual-Graph Propagation Mechanism
The ablation study results show that multi-source feature fusion and the dual-graph propagation mechanism are essential to improving the performance of node recovery prediction. When static topological features were removed, the decline in model performance indicated that the structural position of toll-station nodes in the expressway network directly affects their recovery process. Removing rainfall disturbance features increased the recovery-curve error, suggesting that external meteorological disturbance inputs play an important role in identifying node recovery trends. The most substantial performance deterioration occurred after removing the dual-graph propagation module, indicating that simultaneously considering inter-node distance relationships and topological similarity is essential for accurately characterizing the recovery process of toll-station nodes.
These results suggest that the recovery process of toll-station nodes is not a simple single-node temporal prediction problem, but rather a spatiotemporally coupled process jointly affected by external disturbances, neighborhood interactions, and network structure [39,40]. Under flood-disturbance scenes, critical facility accessibility, recovery resource scheduling, and network recovery sequence can jointly affect the overall recovery performance of the system [41,42].
4.3. Implications and Research Limitations
The resilience quantification and recovery prediction framework for toll-station nodes proposed in this study can provide quantitative support for expressway operation monitoring, critical node identification, and recovery scheduling under rainfall conditions. The three-level resilience quantification results can be used to identify critical nodes that are more sensitive to rainfall and recover more slowly. The stage identification results help determine the temporal boundary at which nodes shift from the damaged stage to the recovery stage. The recovery prediction results can further support the prioritization of node recovery and the allocation of recovery resources.
The empirical analysis was mainly based on the expressway toll-station network in Jilin Province and selected three representative rainfall scenes as the study cases. Therefore, both the sample scope and the event types remain limited. In addition, the current empirical evidence is still restricted to a single provincial expressway toll-station network and three typical rainfall processes, which means that the quantitative results may still be affected by local network structure, toll-station layout, traffic organization characteristics, and rainfall disturbance patterns. Although the cross-scene validation results indicate that the model has a certain degree of applicability, its robustness and transferability still need to be further examined under larger-scale road networks and more diverse extreme rainfall events. From the perspective of methodological composition, the proposed framework integrates meteorological disturbance, neighborhood interaction, and network topology information, and therefore has potential applicability to other regions with similar data conditions. However, when extending the framework to other regions, local differences in network structure, traffic demand characteristics, rainfall patterns, and data quality should be taken into account, and the node-selection strategy, disturbance characterization process, and key model parameters may need to be recalibrated according to local conditions. Future studies may extend the sample size to larger scales, multiple regions, and multiple event conditions, and further incorporate transportation network coupling structures, climate change scenes, and more complex recovery issues in multilayer transportation systems, thereby continuously improving the applicability and generalization capability of the proposed framework [43,44].
5. Conclusions
This study proposed a resilience quantification and recovery prediction framework for expressway toll-station nodes under rainfall disturbance conditions, aiming to characterize the dynamic resilience evolution process of toll-station nodes under rainfall impacts and to improve the accuracy and interpretability of recovery-stage prediction. The main conclusions are as follows.
In terms of node resilience quantification, a multi-level resilience representation framework consisting of the functional layer, neighborhood layer, and network layer was constructed. This framework incorporates meteorological disturbances, neighborhood interactions, and network topology characteristics into the node resilience analysis process, thereby enhancing the completeness and structural sensitivity of toll-station node resilience quantification from a node-oriented multi-level perspective.
In terms of resilience evolution analysis, threshold-based rules were used to identify the key time points of the damage, valley, and recovery stages of toll-station node resilience. A piecewise exponential evolution model was then constructed to perform segmented fitting of resilience curves and to extract parameters such as the recovery platform value and recovery rate, thereby characterizing the staged resilience evolution of toll-station nodes in an interpretable manner.
In terms of recovery prediction, a node recovery prediction model integrating historical resilience states, rainfall disturbance inputs, topological features, and dual-graph propagation relationships was developed. Based on the predicted parameters, recovery trajectory reconstruction was further performed, thereby realizing the prediction of node recovery processes through a parameter prediction–trajectory reconstruction strategy. The results indicate that the proposed model can capture both recovery-stage parameters and recovery trajectories, and the baseline comparison, cross-scene validation, and ablation analysis further support the effectiveness of multi-source feature fusion and the dual-graph propagation mechanism.
Overall, this study establishes a unified analytical framework that links node-level resilience quantification, staged evolution analysis, and recovery-oriented prediction for expressway toll-station nodes under rainfall disturbances. The added value of the study lies in shifting the analytical focus from conventional link- or network-level perspectives to critical toll-station nodes, constructing a multi-level resilience representation framework that integrates functional degradation, neighborhood interaction, and network topology, clarifying the staged evolution characteristics of toll-station-node resilience under rainfall disturbances, and further extending resilience research from staged evolution analysis to recovery-oriented prediction. Therefore, the proposed framework provides a quantitative basis for the resilience assessment, evolution analysis, recovery analysis, and operational management of critical expressway nodes under rainfall disturbances.
Author Contributions
Conceptualization, X.W.; methodology, J.J.; software, J.J.; validation, C.Z.; formal analysis, D.J.; investigation, M.F.; data curation, S.Z.; supervision, Z.W. All authors have read and agreed to the published version of the manuscript.
Funding
This research was funded by the Natural Science Foundation of Jilin Province of China, grant number 20230101112JC.
Institutional Review Board Statement
Not applicable.
Informed Consent Statement
Not applicable.
Data Availability Statement
ERA5-Land meteorological data are publicly available. Access to toll-station traffic flow data is restricted due to confidentiality and data security requirements. The main methodological framework and experimental settings have been described in detail in the manuscript.
Acknowledgments
The authors would like to thank the anonymous reviewers and editors for their constructive comments. All authors have read and agreed to the published version of the manuscript.
Conflicts of Interest
The authors declare no conflicts of interest.
References
- IPCC. Climate Change 2022: Impacts, Adaptation and Vulnerability; Chapter 4: Water; Cambridge University Press: Cambridge, UK, 2022. [Google Scholar]
- WMO. State of the Global Climate 2023; World Meteorological Organization: Geneva, Switzerland, 2024. [Google Scholar]
- Pregnolato, M.; Ford, A.; Wilkinson, S.M.; Dawson, R.J. The impact of flooding on road transport: A depth-disruption function. Transp. Res. Part D Transp. Environ. 2017, 55, 67–81. [Google Scholar] [CrossRef] [Scilit]
- Li, X.; Xie, Y.; Guo, Y.; Wang, T.; Lin, T. Toward climate-resilient freight systems: Measuring regional truck resilience to extreme rainfall via integrated flood demand modeling. Sustainability 2025, 17, 1783. [Google Scholar] [CrossRef] [Scilit]
- Ahmed, S.; Dey, K. Resilience modeling concepts in transportation systems: A comprehensive review based on mode, and modeling techniques. J. Infrastruct. Preserv. Resil. 2020, 1, 8. [Google Scholar] [CrossRef] [Scilit]
- Serdar, M.Z.; Koç, M.; Al-Ghamdi, S.G. Urban transportation networks resilience: Indicators, disturbances, and assessment methods. Sustain. Cities Soc. 2022, 76, 103452. [Google Scholar] [CrossRef] [Scilit]
- Ren, Q.; He, J.; Liu, Z.; Xu, M. Traffic flow characteristics and traffic conflict analysis in the downstream area of expressway toll station based on vehicle trajectory data. Asian Transp. Stud. 2024, 10, 100138. [Google Scholar] [CrossRef] [Scilit]
- Mo, W.; Lee, J.; Abdel-Aty, M.; Mao, S.; Jiang, Q. Dynamic short-term crash analysis and prediction at toll plazas for proactive safety management. Accid. Anal. Prev. 2024, 197, 107456. [Google Scholar] [CrossRef] [Scilit] [PubMed]
- Mattsson, L.-G.; Jenelius, E. Vulnerability and resilience of transport systems—A discussion of recent research. Transp. Res. Part A Policy Pract. 2015, 81, 16–34. [Google Scholar] [CrossRef] [Scilit]
- He, Z.; Navneet, K.; van Dam, W.; Van Mieghem, P. Robustness assessment of multimodal freight transport networks. Reliab. Eng. Syst. Saf. 2021, 207, 107315. [Google Scholar] [CrossRef] [Scilit]
- Postorino, M.N.; Sarnè, G.M.L. A new approach to assessing transport network resilience. Urban Sci. 2025, 9, 35. [Google Scholar] [CrossRef] [Scilit]
- Poulin, C.; Kane, M.B. Infrastructure resilience curves: Performance measures and summary metrics. Reliab. Eng. Syst. Saf. 2021, 216, 107926. [Google Scholar] [CrossRef] [Scilit]
- Dong, S.; Gao, X.; Mostafavi, A.; Gao, J.; Gangwal, U. Characterizing resilience of flood-disrupted dynamic transportation network through the lens of link reliability and stability. Reliab. Eng. Syst. Saf. 2023, 232, 109071. [Google Scholar] [CrossRef] [Scilit]
- Watson, G.; Ahn, Y.H. A systematic review: To increase transportation infrastructure resilience to flooding events. Appl. Sci. 2022, 12, 12331. [Google Scholar] [CrossRef] [Scilit]
- Tang, J.; Wu, S.; Yang, S.; Shi, Y. Resilience assessment of urban road transportation in rainfall. Remote Sens. 2024, 16, 3311. [Google Scholar] [CrossRef] [Scilit]
- Lang, Q.; Wan, Z.; Zhang, J.; Zhang, Y.; Zhu, D.; Liu, G. Resilience assessment and enhancement strategies for urban transportation infrastructure to cope with extreme rainfalls. Sustainability 2024, 16, 4780. [Google Scholar] [CrossRef] [Scilit]
- Ma, F.; Fu, R.; Ren, W.; Lu, Q.-C.; Liu, Q.; Yang, Z.; Ma, Z. Assessing road network resilience to extreme rainstorms: A percolation and hydrodynamic approach. Transp. Res. Part D Transp. Environ. 2026, 152, 105192. [Google Scholar] [CrossRef] [Scilit]
- Liu, J.; Xu, Z.; Wan, L.; MacAskill, K. Road transport resilience under extreme rainfall: Integrating multiple impact factors and delay propagation. Int. J. Disaster Risk Reduct. 2026, 134, 106024. [Google Scholar] [CrossRef] [Scilit]
- Yang, Z.; Barroca, B.; Bony-Dandrieux, A.; Dolidon, H. Resilience indicator of urban transport infrastructure: A review on current approaches. Infrastructures 2022, 7, 33. [Google Scholar] [CrossRef] [Scilit]
- Hong, Y.; Zhang, Z.; Fang, X.; Lu, L. Evaluating the dynamic comprehensive resilience of urban road network: A case study of rainstorm in Xi’an, China. Land 2024, 13, 1894. [Google Scholar] [CrossRef] [Scilit]
- Du, Q.; Zong, X.; Li, Y.; Guo, X.; Ye, Z.; Li, S.; Bai, L. Resilience optimization of bus-metro double-layer network against extreme weather events. Transp. Res. Part D Transp. Environ. 2024, 135, 104378. [Google Scholar] [CrossRef] [Scilit]
- Li, M.; Zhang, K.; Zhang, Y. Resilience assessment for road network under rainstorm events using crowdsourced data. Transp. Res. Part D Transp. Environ. 2025, 149, 105030. [Google Scholar] [CrossRef] [Scilit]
- Martín, B.; Ortega, E.; Cuevas-Wizner, R.; Ledda, A.; De Montis, A. Assessing road network resilience: An accessibility comparative analysis. Transp. Res. Part D Transp. Environ. 2021, 95, 102851. [Google Scholar] [CrossRef] [Scilit]
- Aghababaei, M.T.S.; Costello, S.B.; Ranjitkar, P. Measures to evaluate post-disaster trip resilience on road networks. J. Transp. Geogr. 2021, 95, 103154. [Google Scholar] [CrossRef] [Scilit]
- Wang, H.-W.; Peng, Z.-R.; Wang, D.; Meng, Y.; Wu, T.; Sun, W.; Lu, Q.-C. Evaluation and prediction of transportation resilience under extreme weather events: A diffusion graph convolutional approach. Transp. Res. Part C Emerg. Technol. 2020, 115, 102619. [Google Scholar] [CrossRef] [Scilit]
- Zang, D.; Ding, Y.; Zhao, J.; Tang, K.; Zhu, H. Predictive resilience assessment of road networks based on dynamic multi-granularity graph neural network. Neurocomputing 2024, 601, 128207. [Google Scholar] [CrossRef] [Scilit]
- Ma, J.; Ma, J.; Zeng, M.; Zou, X.; Luo, Q.; Zhang, Y.; Li, Y. A deep learning approach on traffic states prediction of freeway weaving sections under adverse weather conditions. Sustainability 2025, 17, 7970. [Google Scholar] [CrossRef] [Scilit]
- Shaygan, M.; Meese, C.; Li, W.; Zhao, X.G.; Nejad, M. Traffic prediction using artificial intelligence: Review of recent advances and emerging opportunities. Transp. Res. Part C Emerg. Technol. 2022, 145, 103921. [Google Scholar] [CrossRef] [Scilit]
- Abduljabbar, R.L.; Dia, H.; Tsai, P.-W. Development and evaluation of bidirectional LSTM freeway traffic forecasting models using simulation data. Sci. Rep. 2021, 11, 23899. [Google Scholar] [CrossRef] [Scilit]
- Shi, R.; Du, L. Multi-Section Traffic Flow Prediction Based on MLR-LSTM Neural Network. Sensors 2022, 22, 7517. [Google Scholar] [CrossRef] [Scilit]
- Naheliya, B.; Redhu, P.; Kumar, K. MFOA-Bi-LSTM: An optimized bidirectional long short-term memory model for short-term traffic flow prediction. Phys. A Stat. Mech. Its Appl. 2024, 634, 129448. [Google Scholar] [CrossRef] [Scilit]
- Luo, Y.; Zheng, J.; Wang, X.; Tao, Y.; Jiang, X. GT-LSTM: A spatio-temporal ensemble network for traffic flow prediction. Neural Netw. 2024, 171, 251–262. [Google Scholar] [CrossRef] [Scilit]
- Henry, D.; Ramirez-Marquez, J.E. Generic metrics and quantitative approaches for system resilience as a function of time. Reliab. Eng. Syst. Saf. 2012, 99, 114–122. [Google Scholar] [CrossRef] [Scilit]
- Shen, Z.; Ji, C.; Lu, S. Transportation network resilience response to the spatial feature of hazards. Transp. Res. Part D Transp. Environ. 2024, 128, 104121. [Google Scholar] [CrossRef] [Scilit]
- Byrd, R.H.; Lu, P.; Nocedal, J.; Zhu, C. A limited memory algorithm for bound constrained optimization. SIAM J. Sci. Comput. 1995, 16, 1190–1208. [Google Scholar] [CrossRef] [Scilit]
- Kipf, T.N.; Welling, M. Semi-supervised classification with graph convolutional networks. In Proceedings of the 5th International Conference on Learning Representations (ICLR 2017), Toulon, France, 24–26 April 2017. [Google Scholar]
- Ashja-Ardalan, S.; Alesheikh, A.A.; Sharif, M.; Wittowsky, D. Resilience of urban road networks to climate change: A spatial-topological approach. Transp. Res. Part D Transp. Environ. 2025, 148, 104948. [Google Scholar] [CrossRef] [Scilit]
- Guo, C.; Tang, J.; Hong, J.; Lu, Q.; Wu, H.; Wei, R. Resilience assessment of urban bus-metro system to floods under future climate change. Transp. Res. Part D Transp. Environ. 2025, 148, 104925. [Google Scholar] [CrossRef] [Scilit]
- Bi, W.; Hackl, J.; MacAskill, K. Enhancing flood resilience of urban rail transit systems through recovery resource scheduling optimisation: A case study of London. Sustain. Cities Soc. 2025, 128, 106437. [Google Scholar] [CrossRef] [Scilit]
- Ge, Y.; Du, L.; Ye, H. Co-optimization approach to post-storm recovery for interdependent power and transportation systems. J. Mod. Power Syst. Clean Energy 2019, 7, 688–695. [Google Scholar] [CrossRef] [Scilit]
- Mitropoulos, L.; Karolemeas, C.; Tsigdinos, S. Road network accessibility assessment during flood events by using infrastructure facility-based indices. Int. J. Disaster Risk Reduct. 2025, 122, 105475. [Google Scholar] [CrossRef] [Scilit]
- Gangwal, U.; Siders, A.R.; Horney, J.; Michael, H.A.; Dong, S. Critical facility accessibility and road criticality assessment considering flood-induced partial failure. Sustain. Resilient Infrastruct. 2023, 8, 337–355. [Google Scholar] [CrossRef] [Scilit]
- Li, S.; Zhou, Y.; Zhang, F. Interdependency in transportation system resilience: Review and discussion. Transp. Res. Part D Transp. Environ. 2025, 140, 104618. [Google Scholar] [CrossRef] [Scilit]
- Mei, X.; Ye, W.; Li, W.; Chen, C.; Li, A.; Wu, J.; Du, H. Robustness evaluation and optimization of China’s multilayer coupled integrated transportation system from a complex network perspective. Sustainability 2025, 17, 7398. [Google Scholar] [CrossRef] [Scilit]
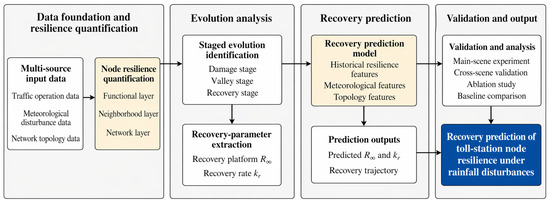
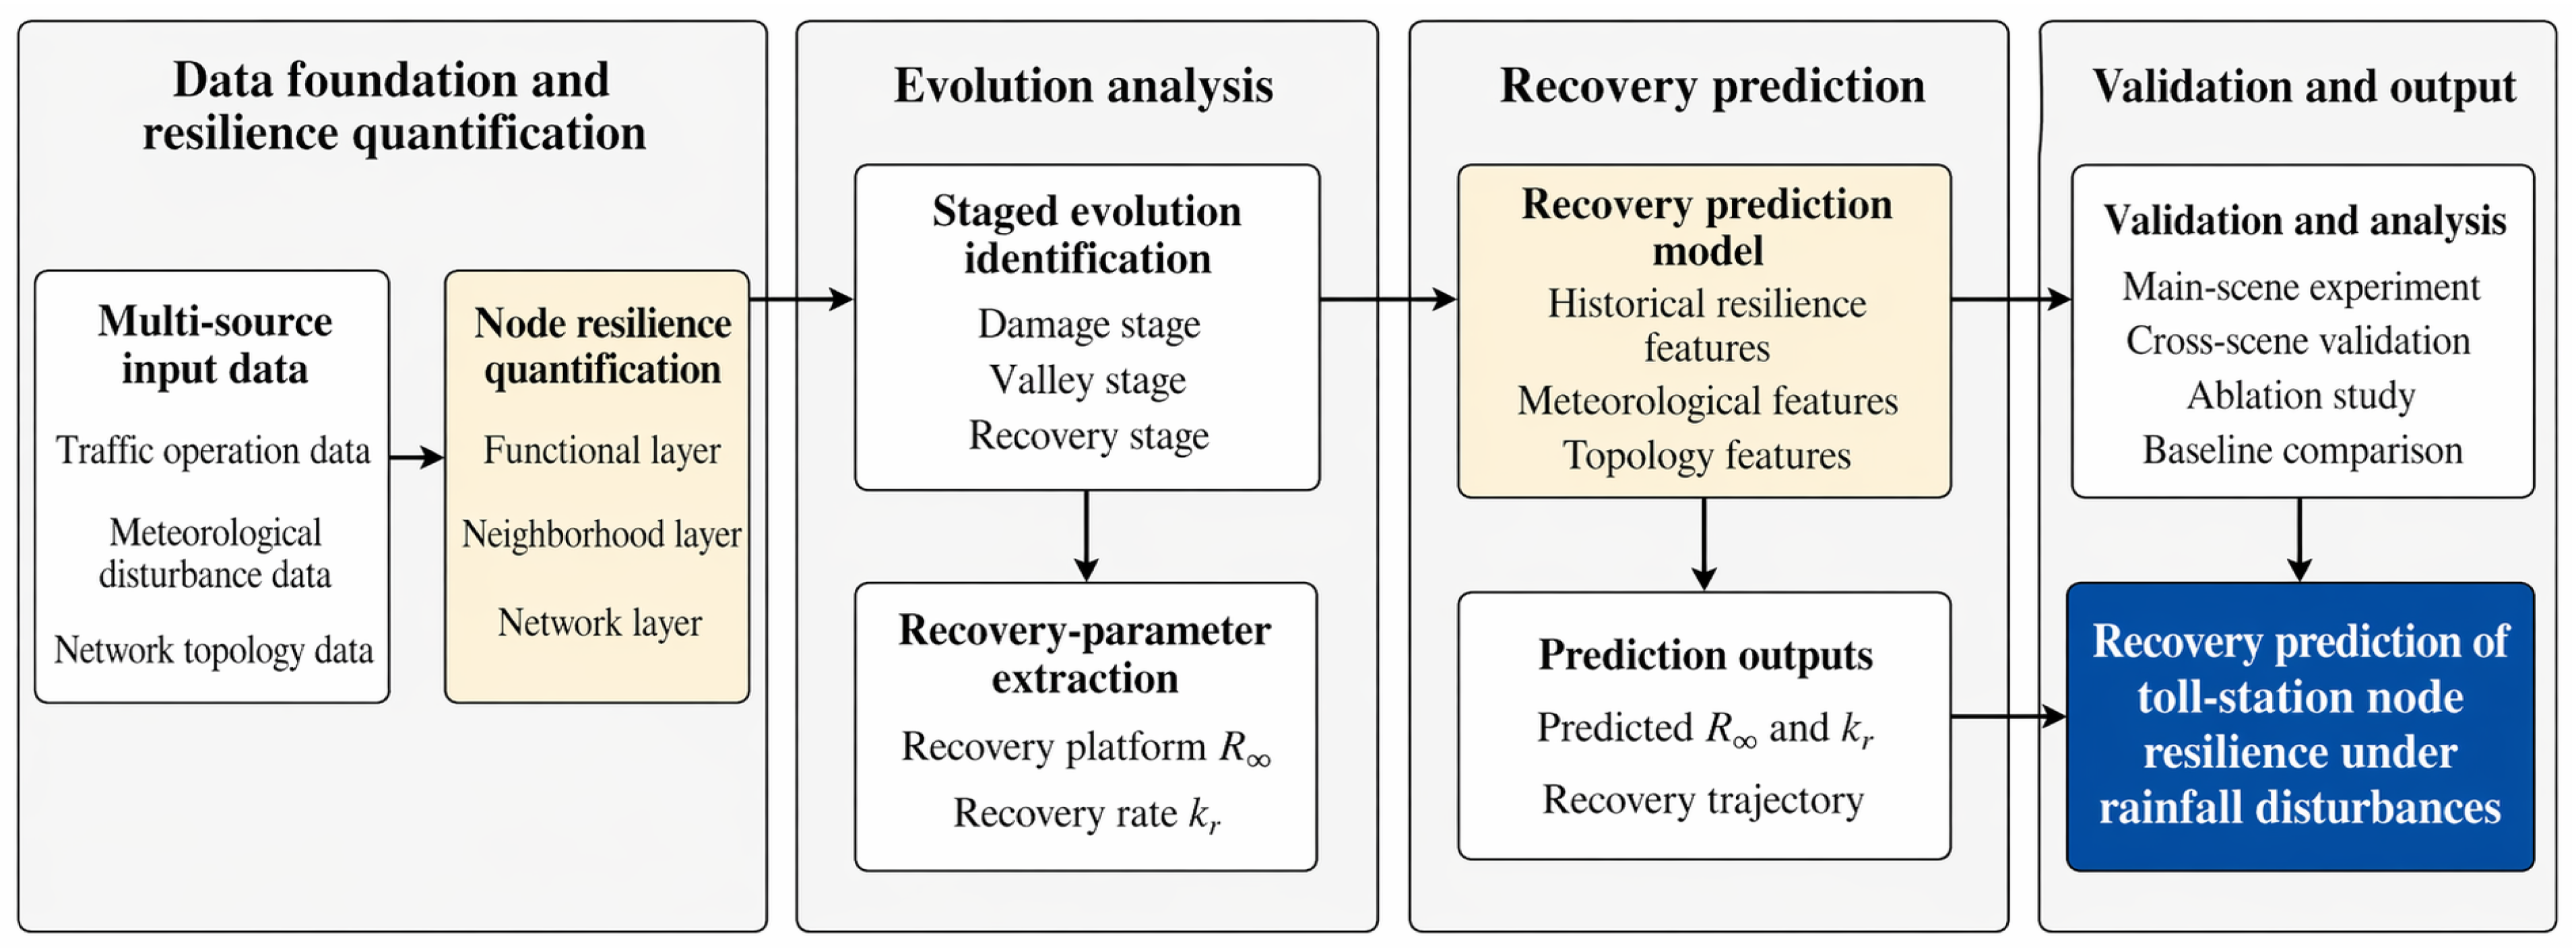
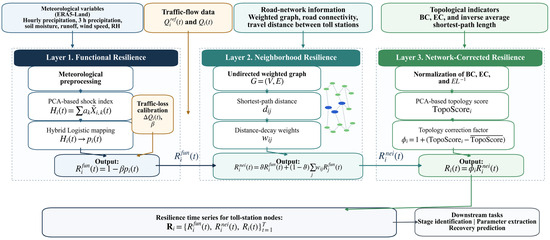
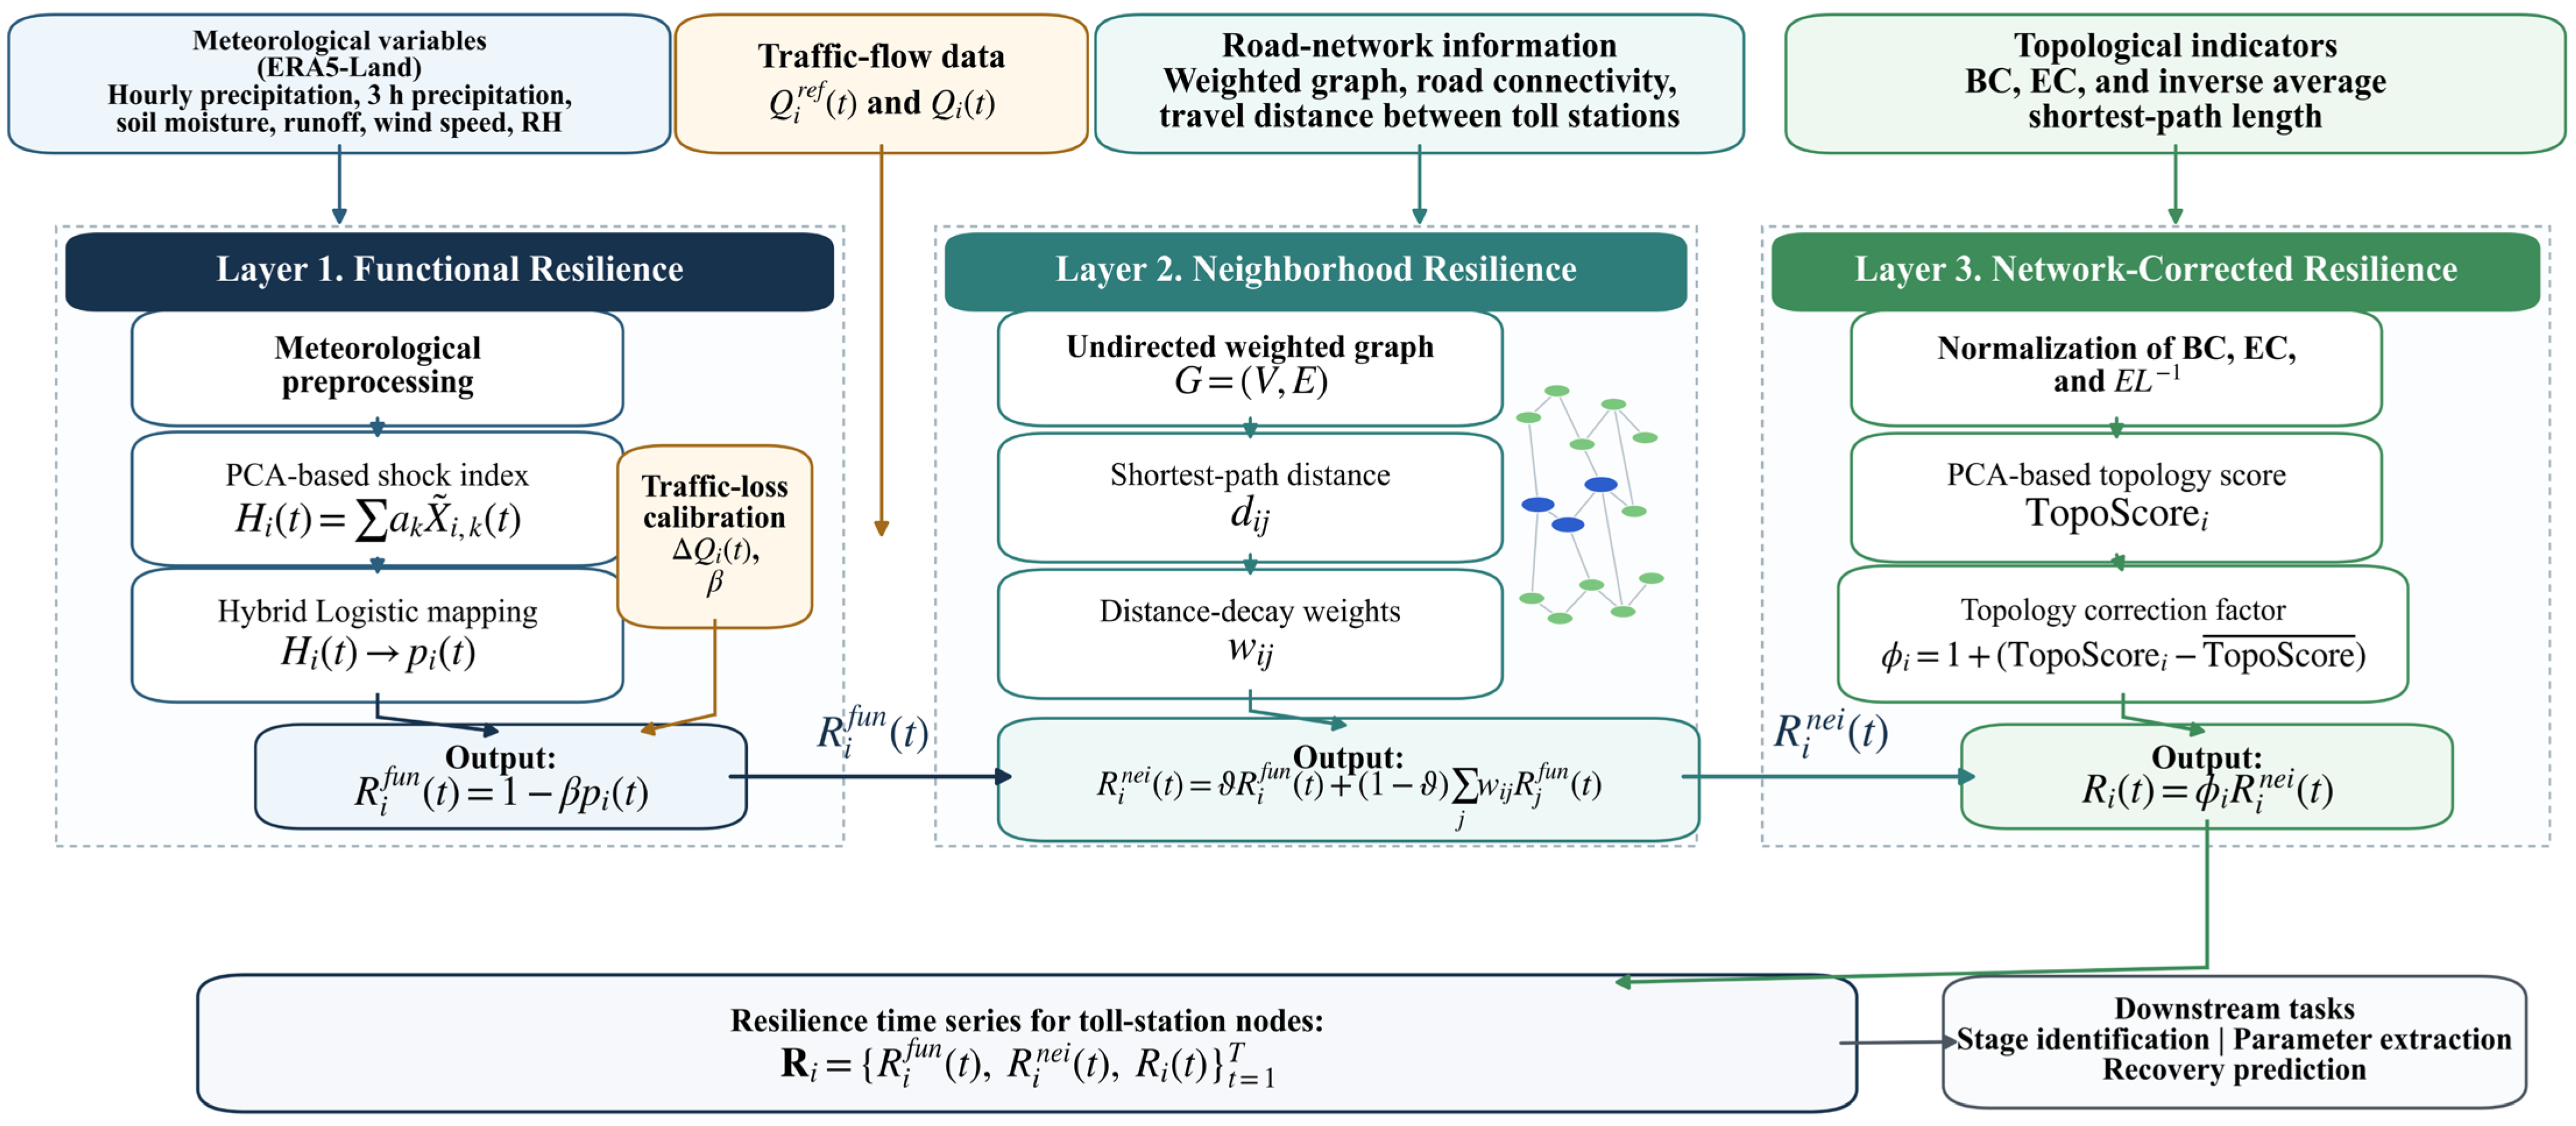
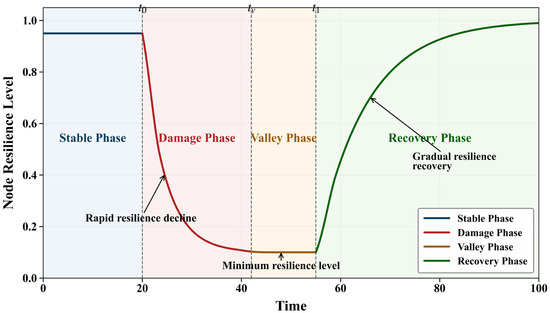
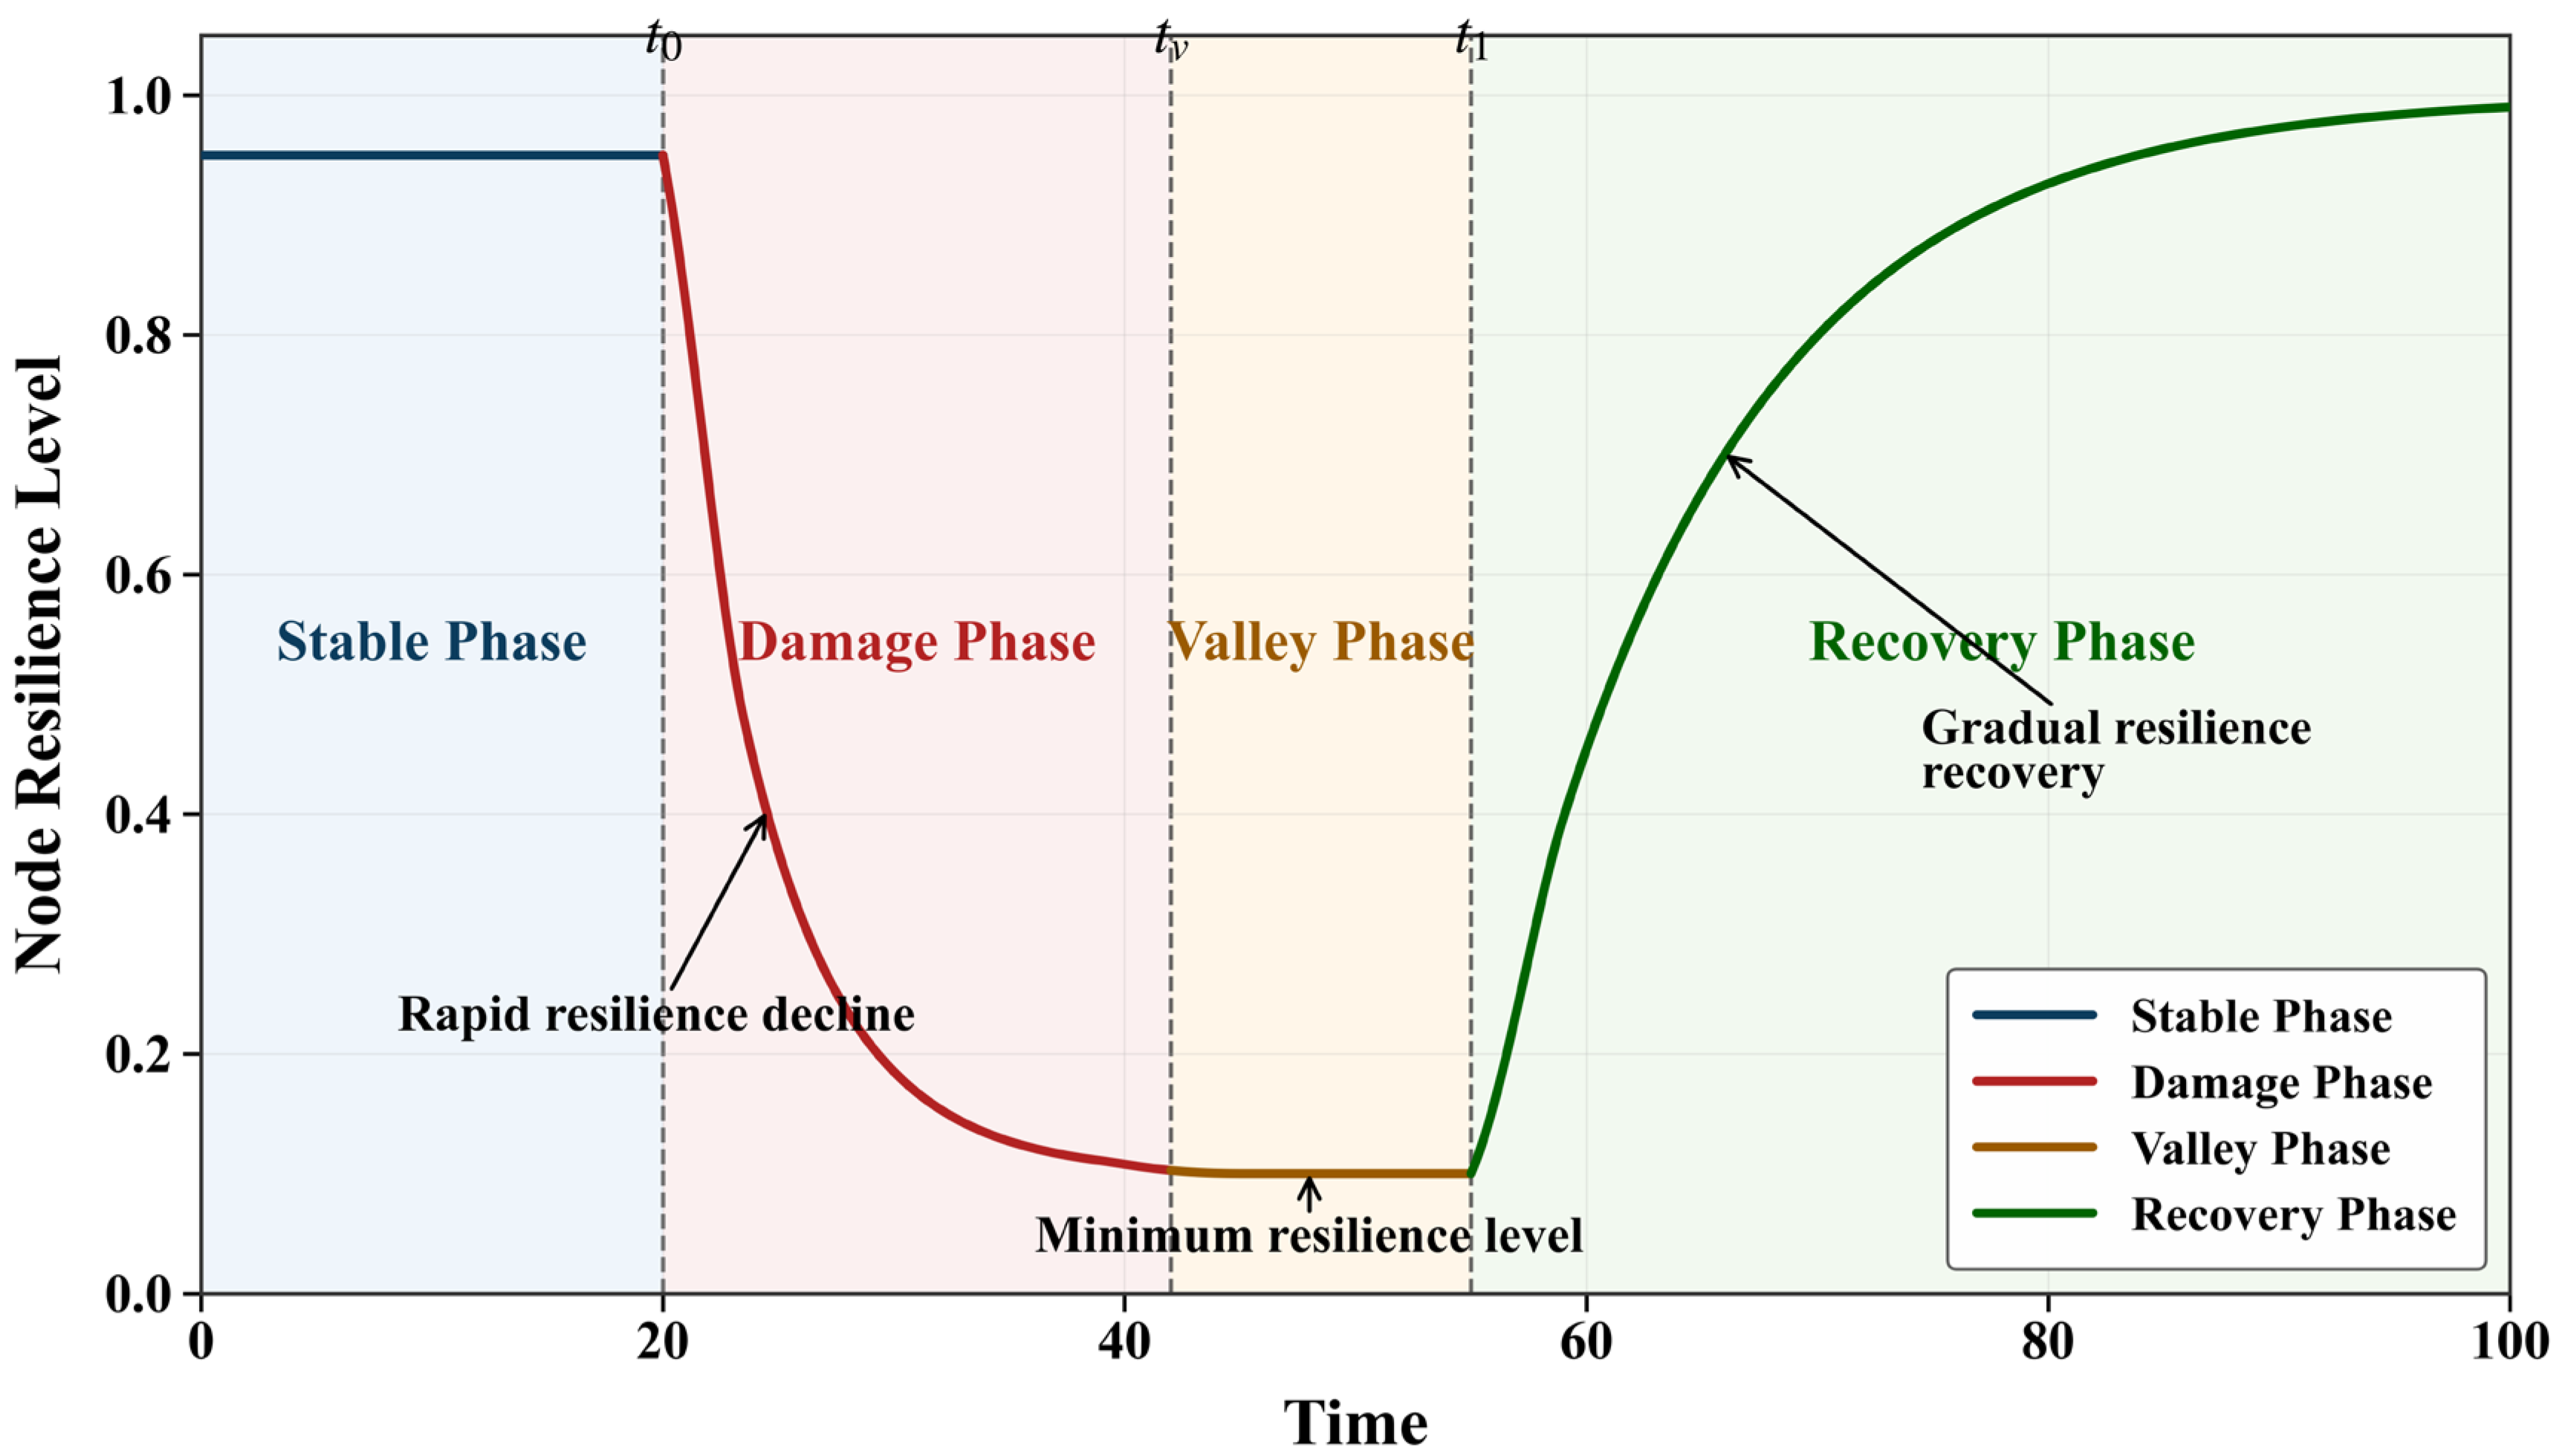
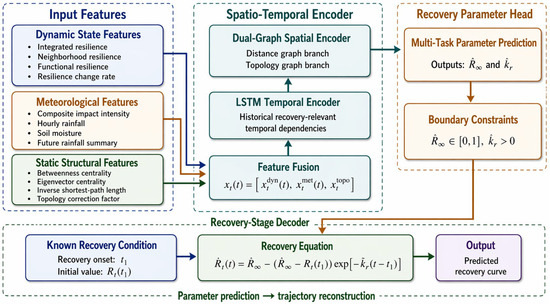
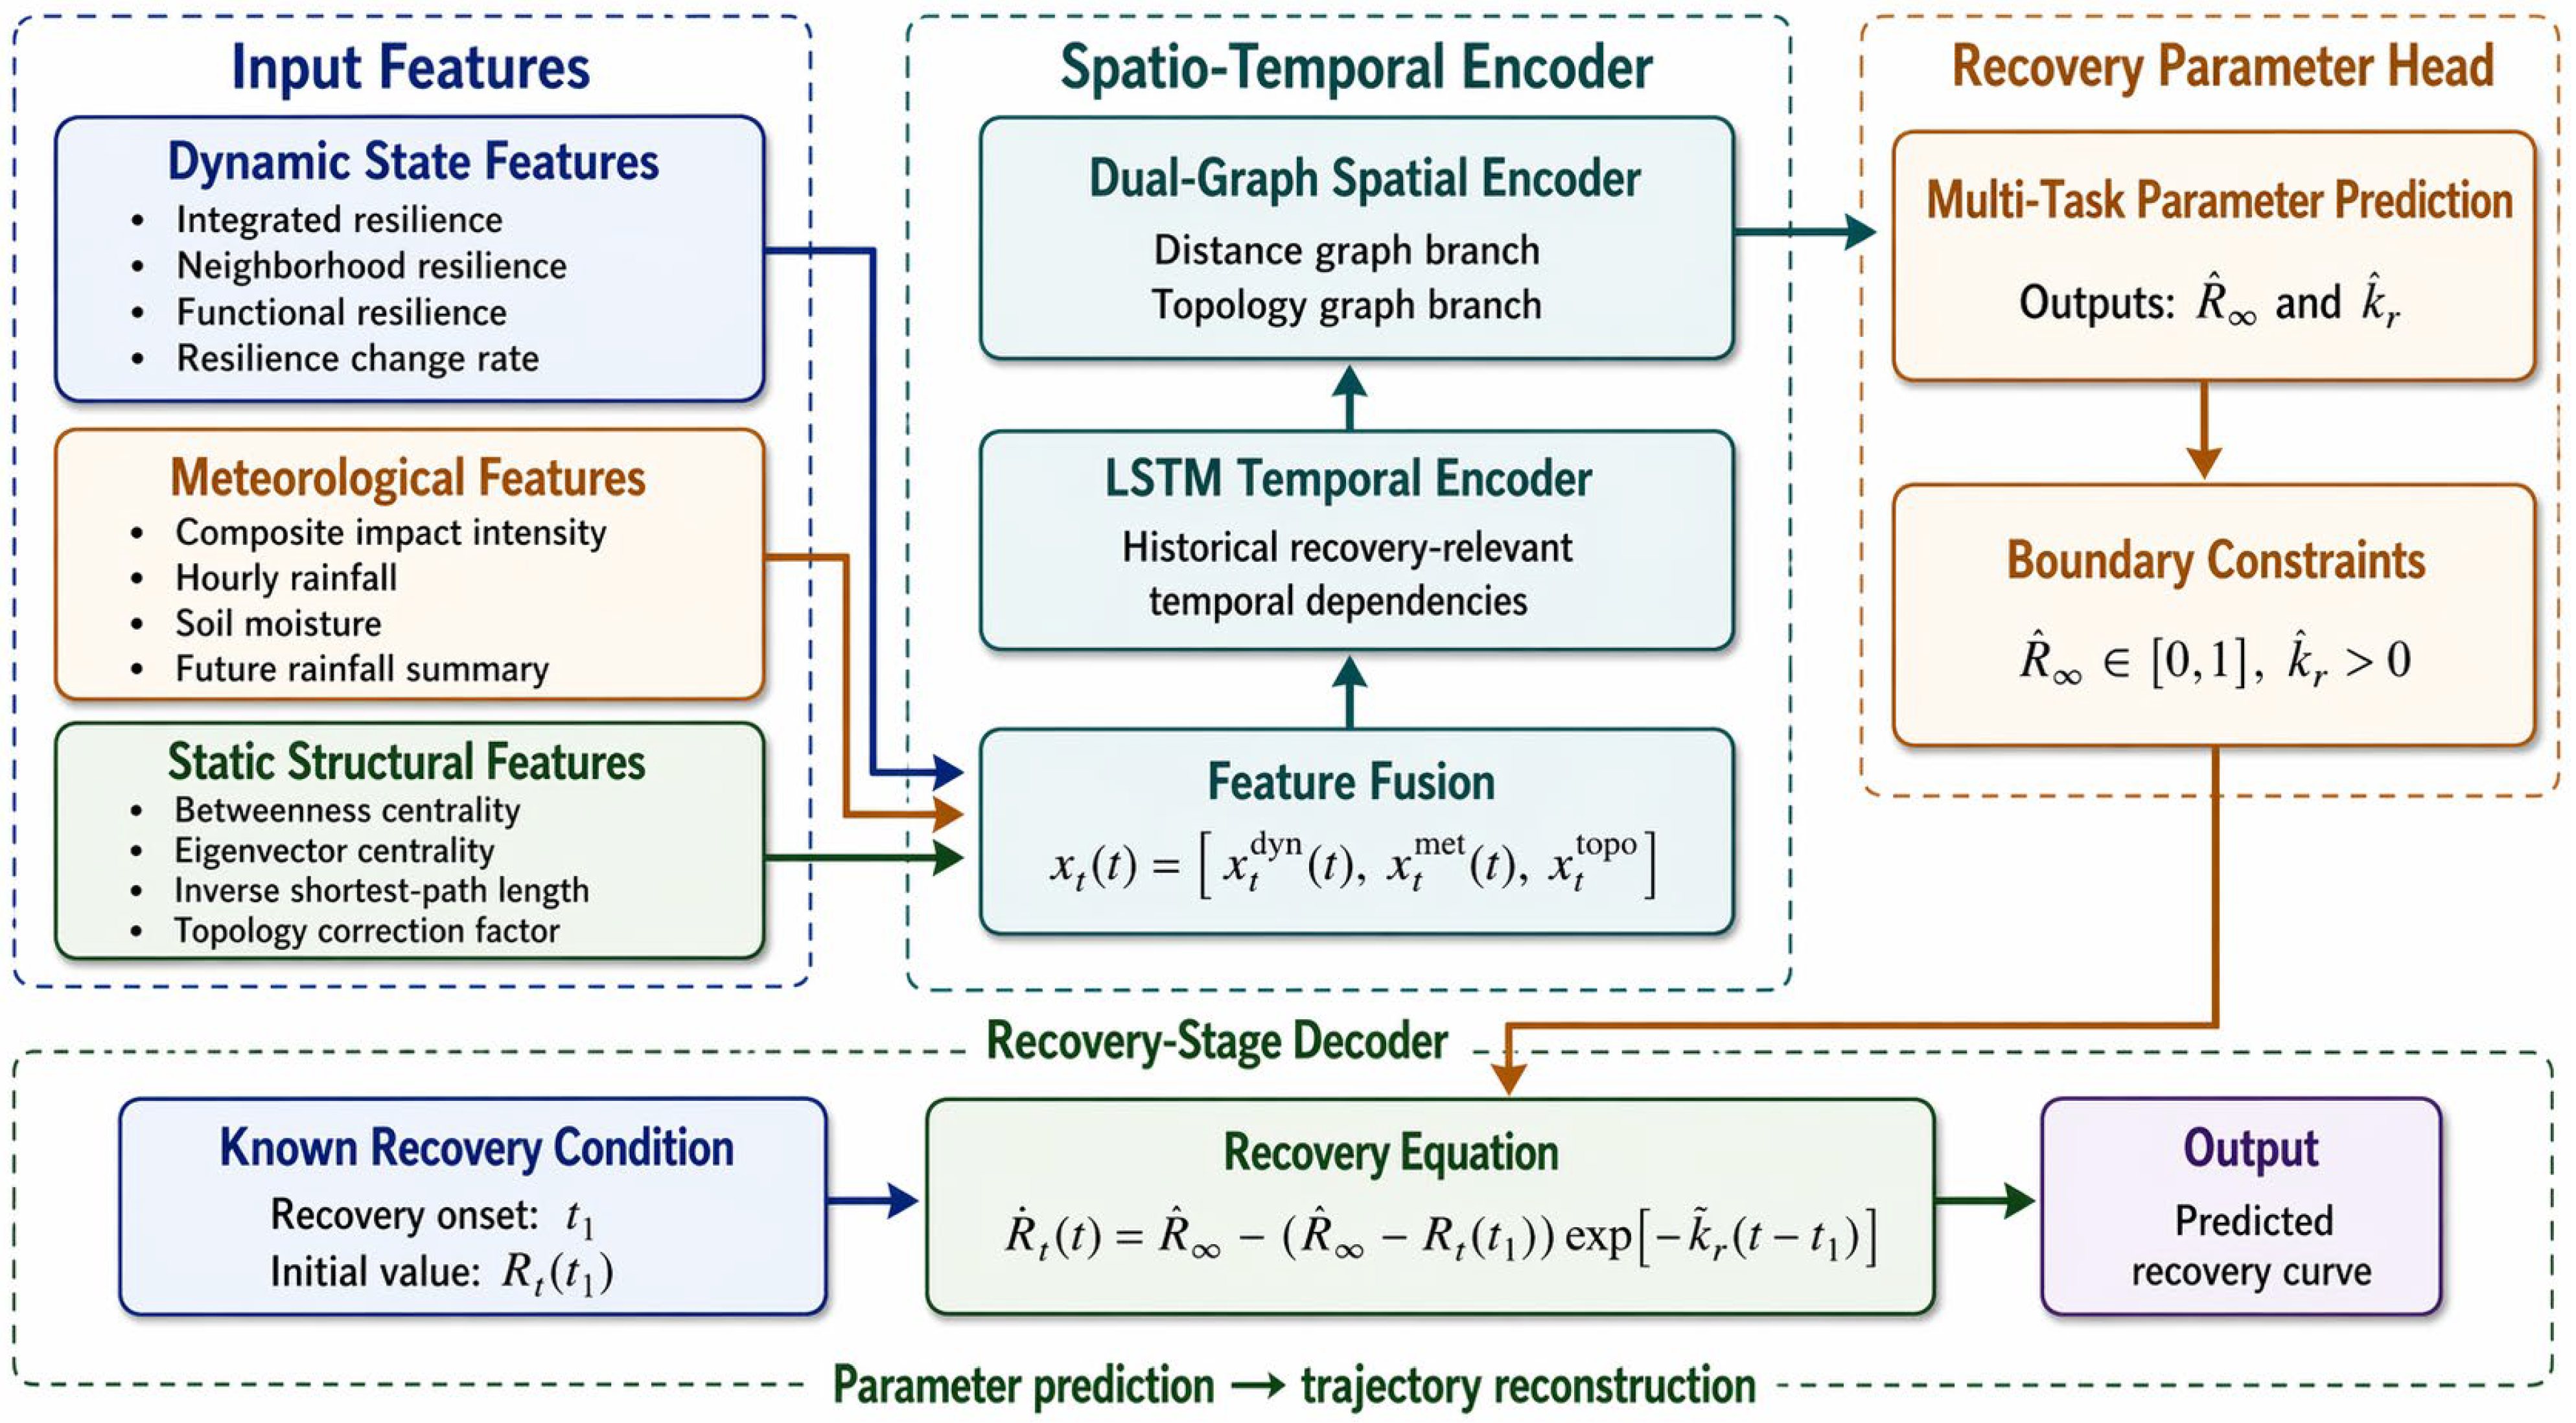
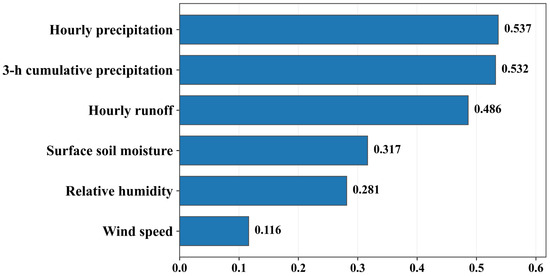
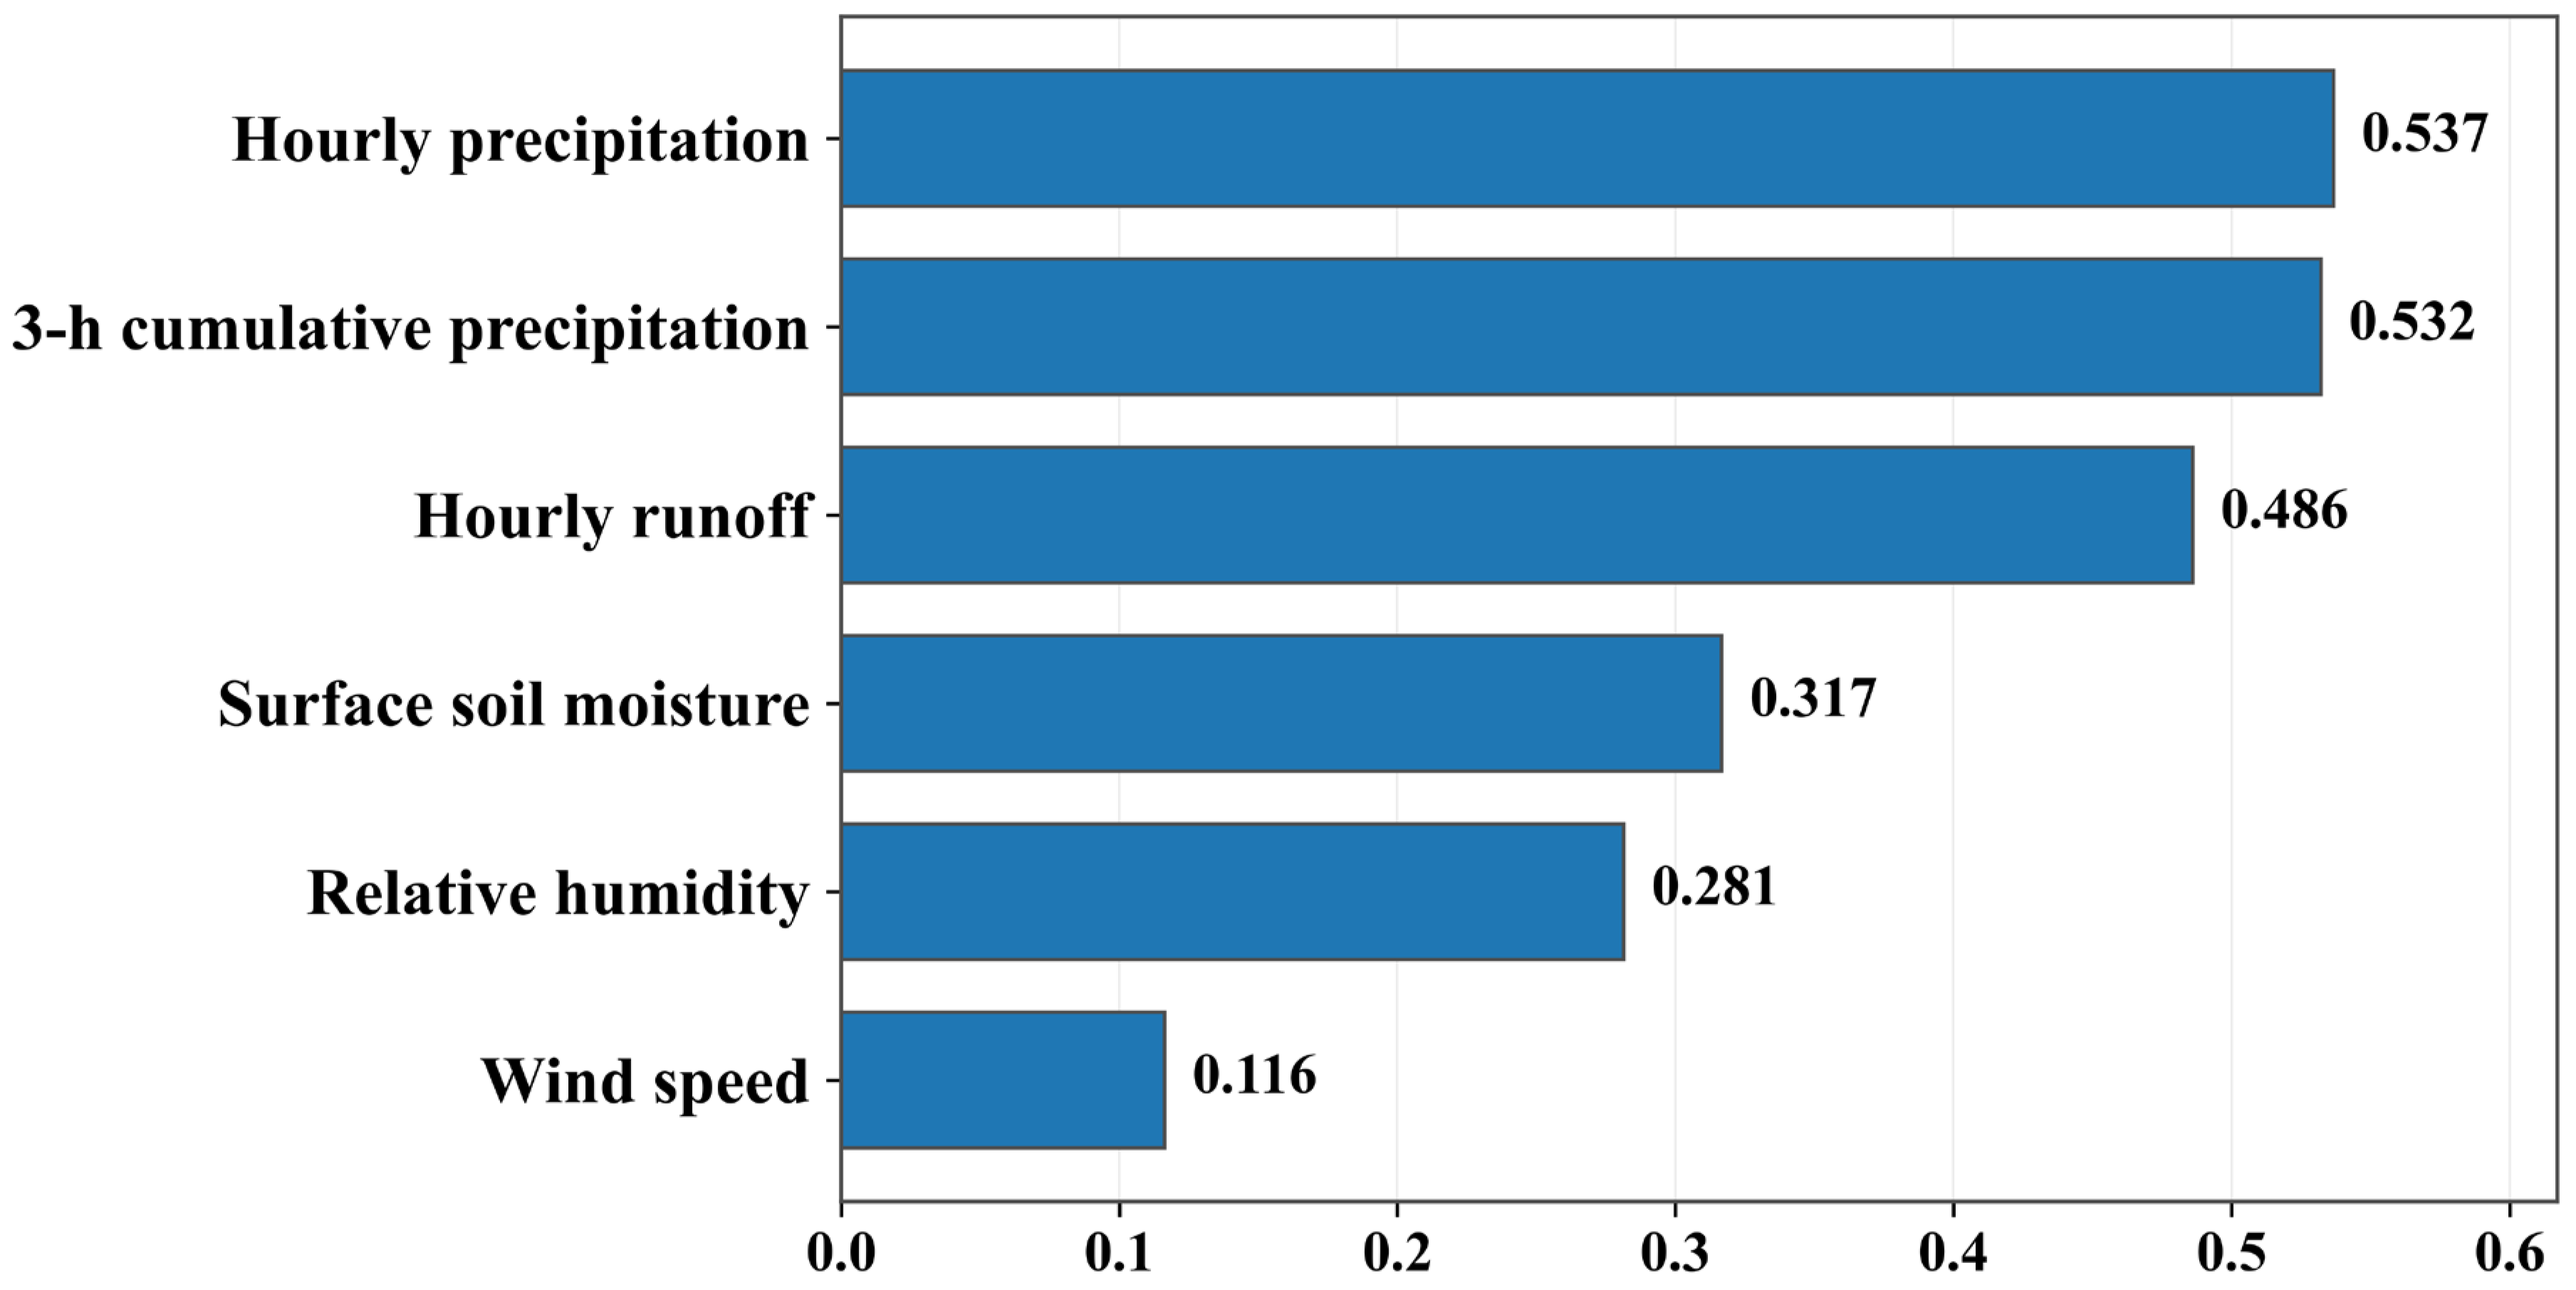
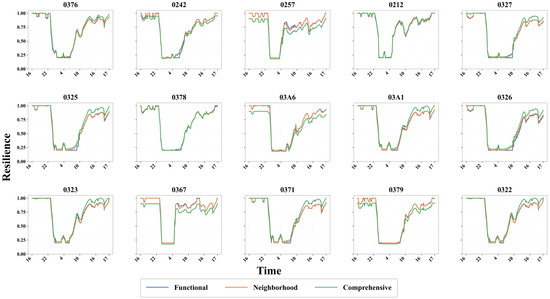
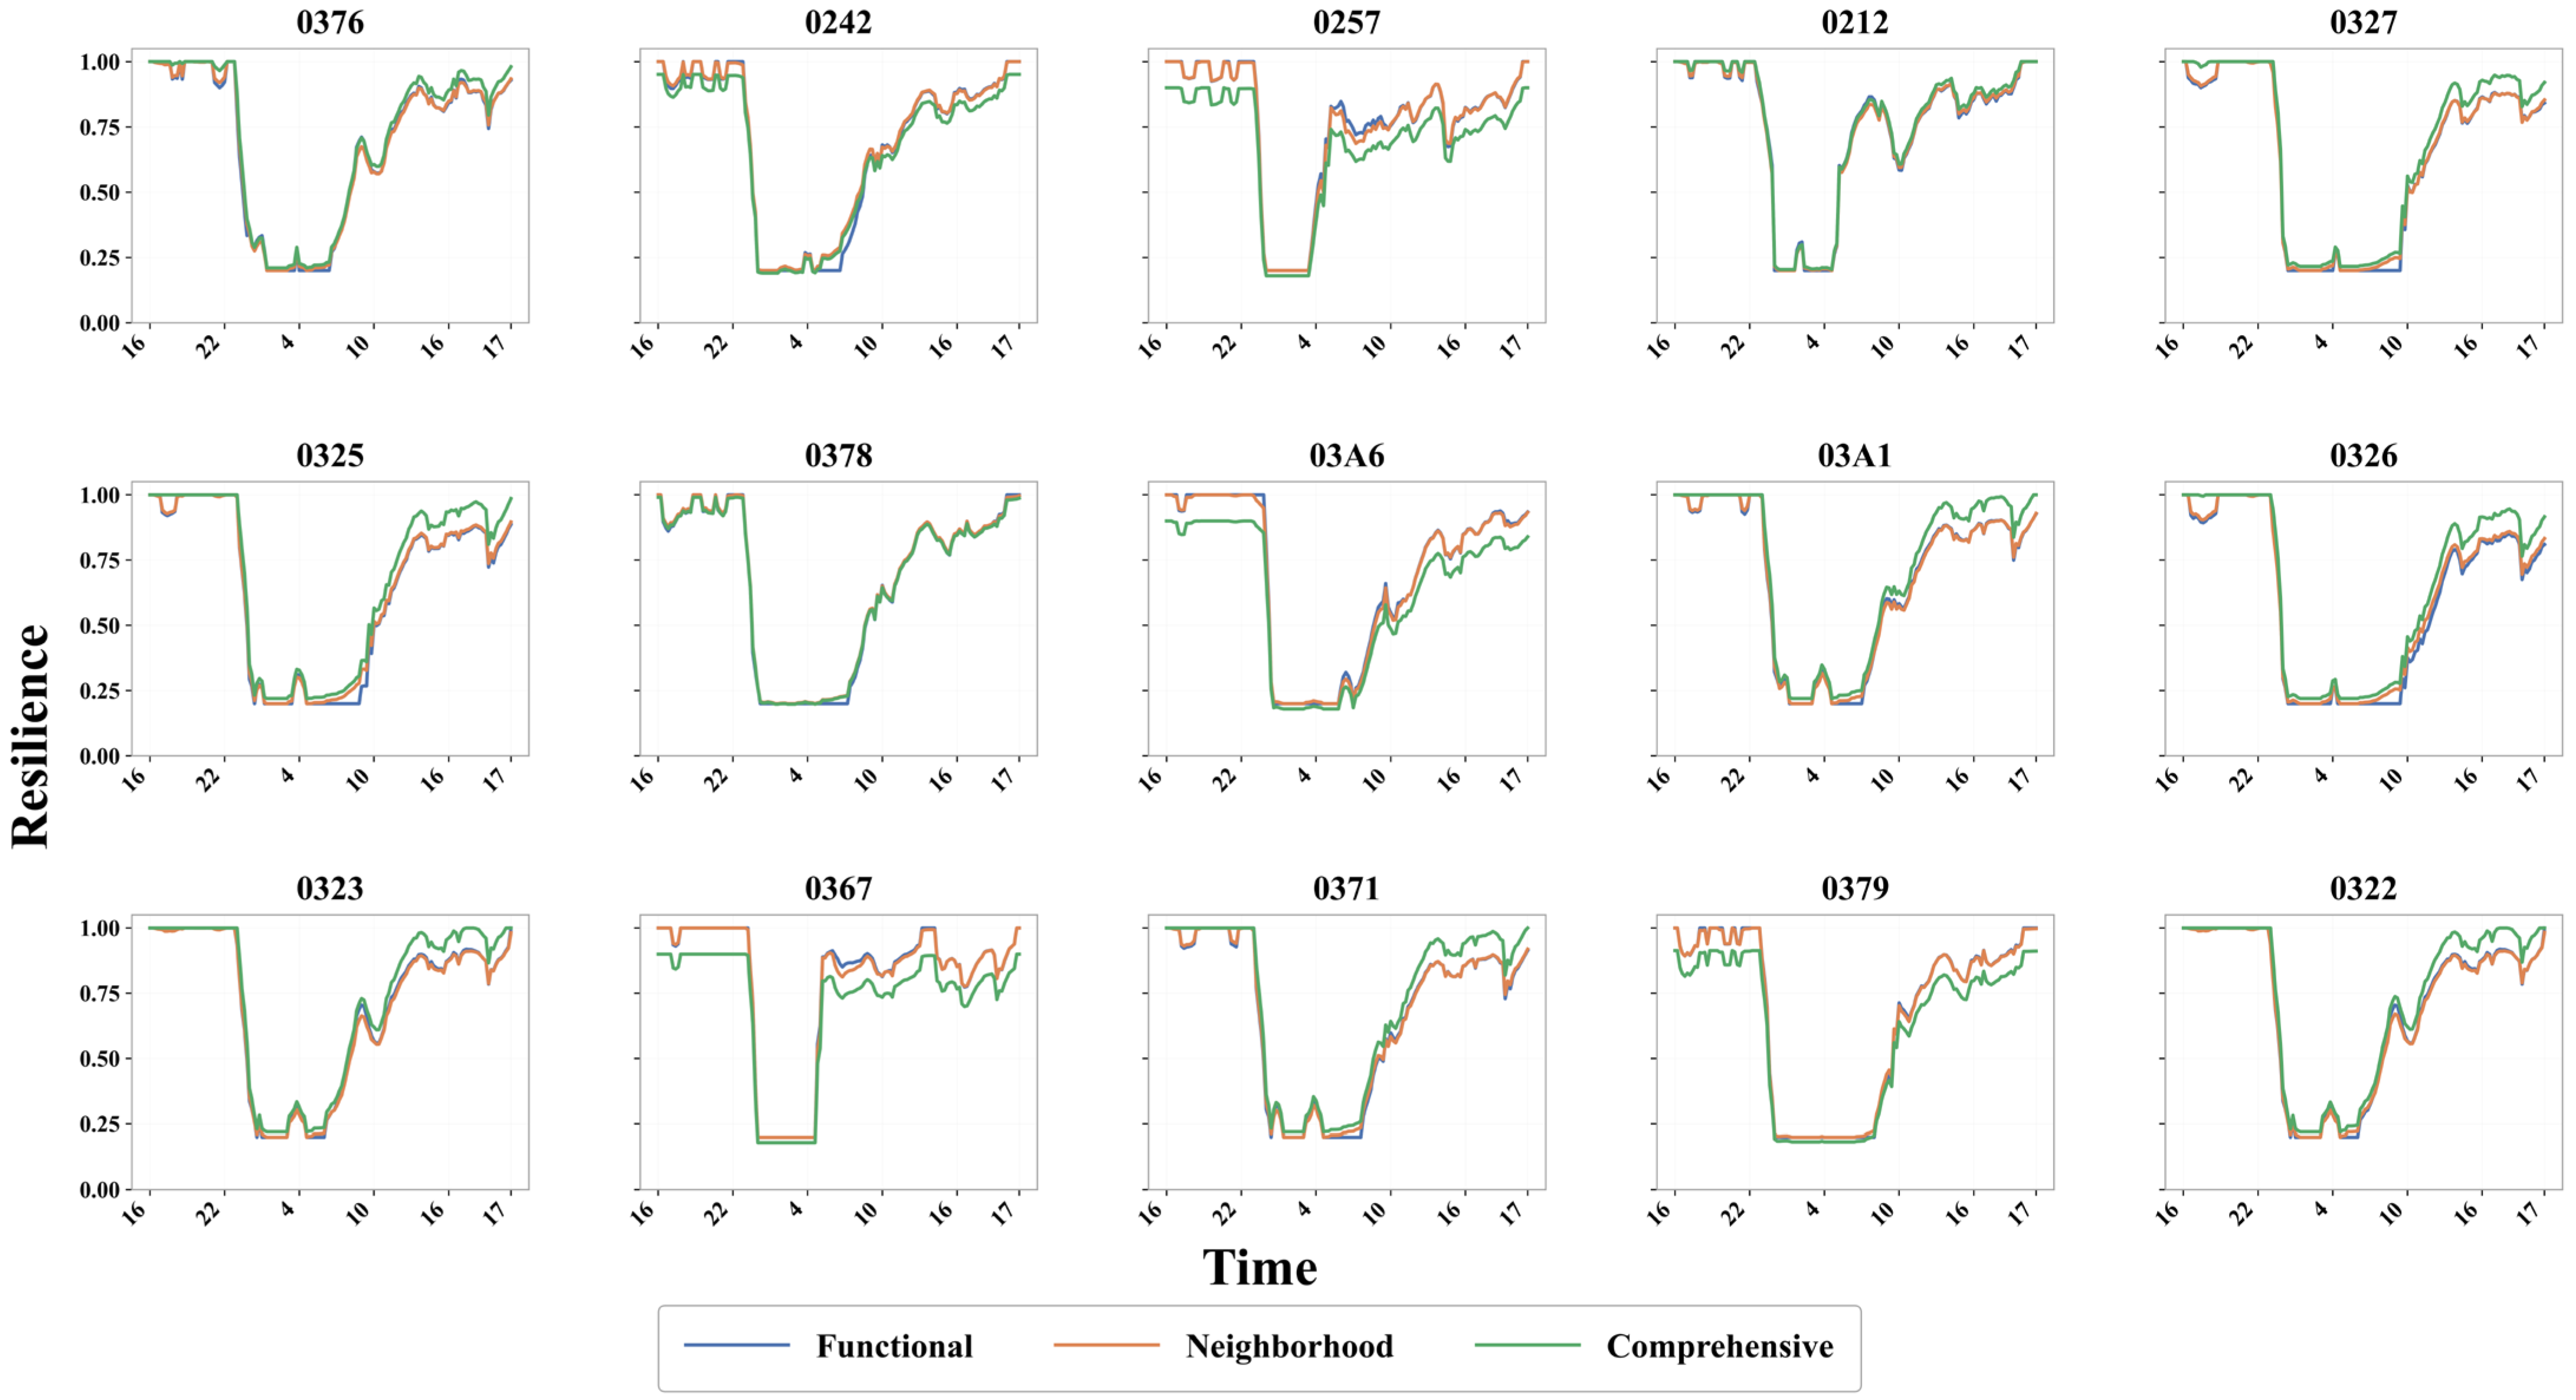
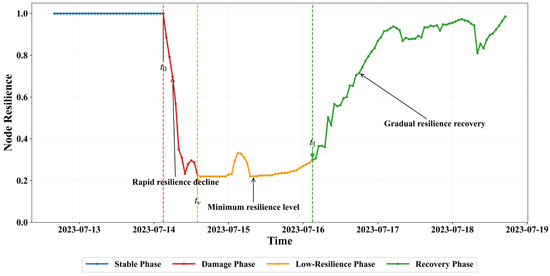
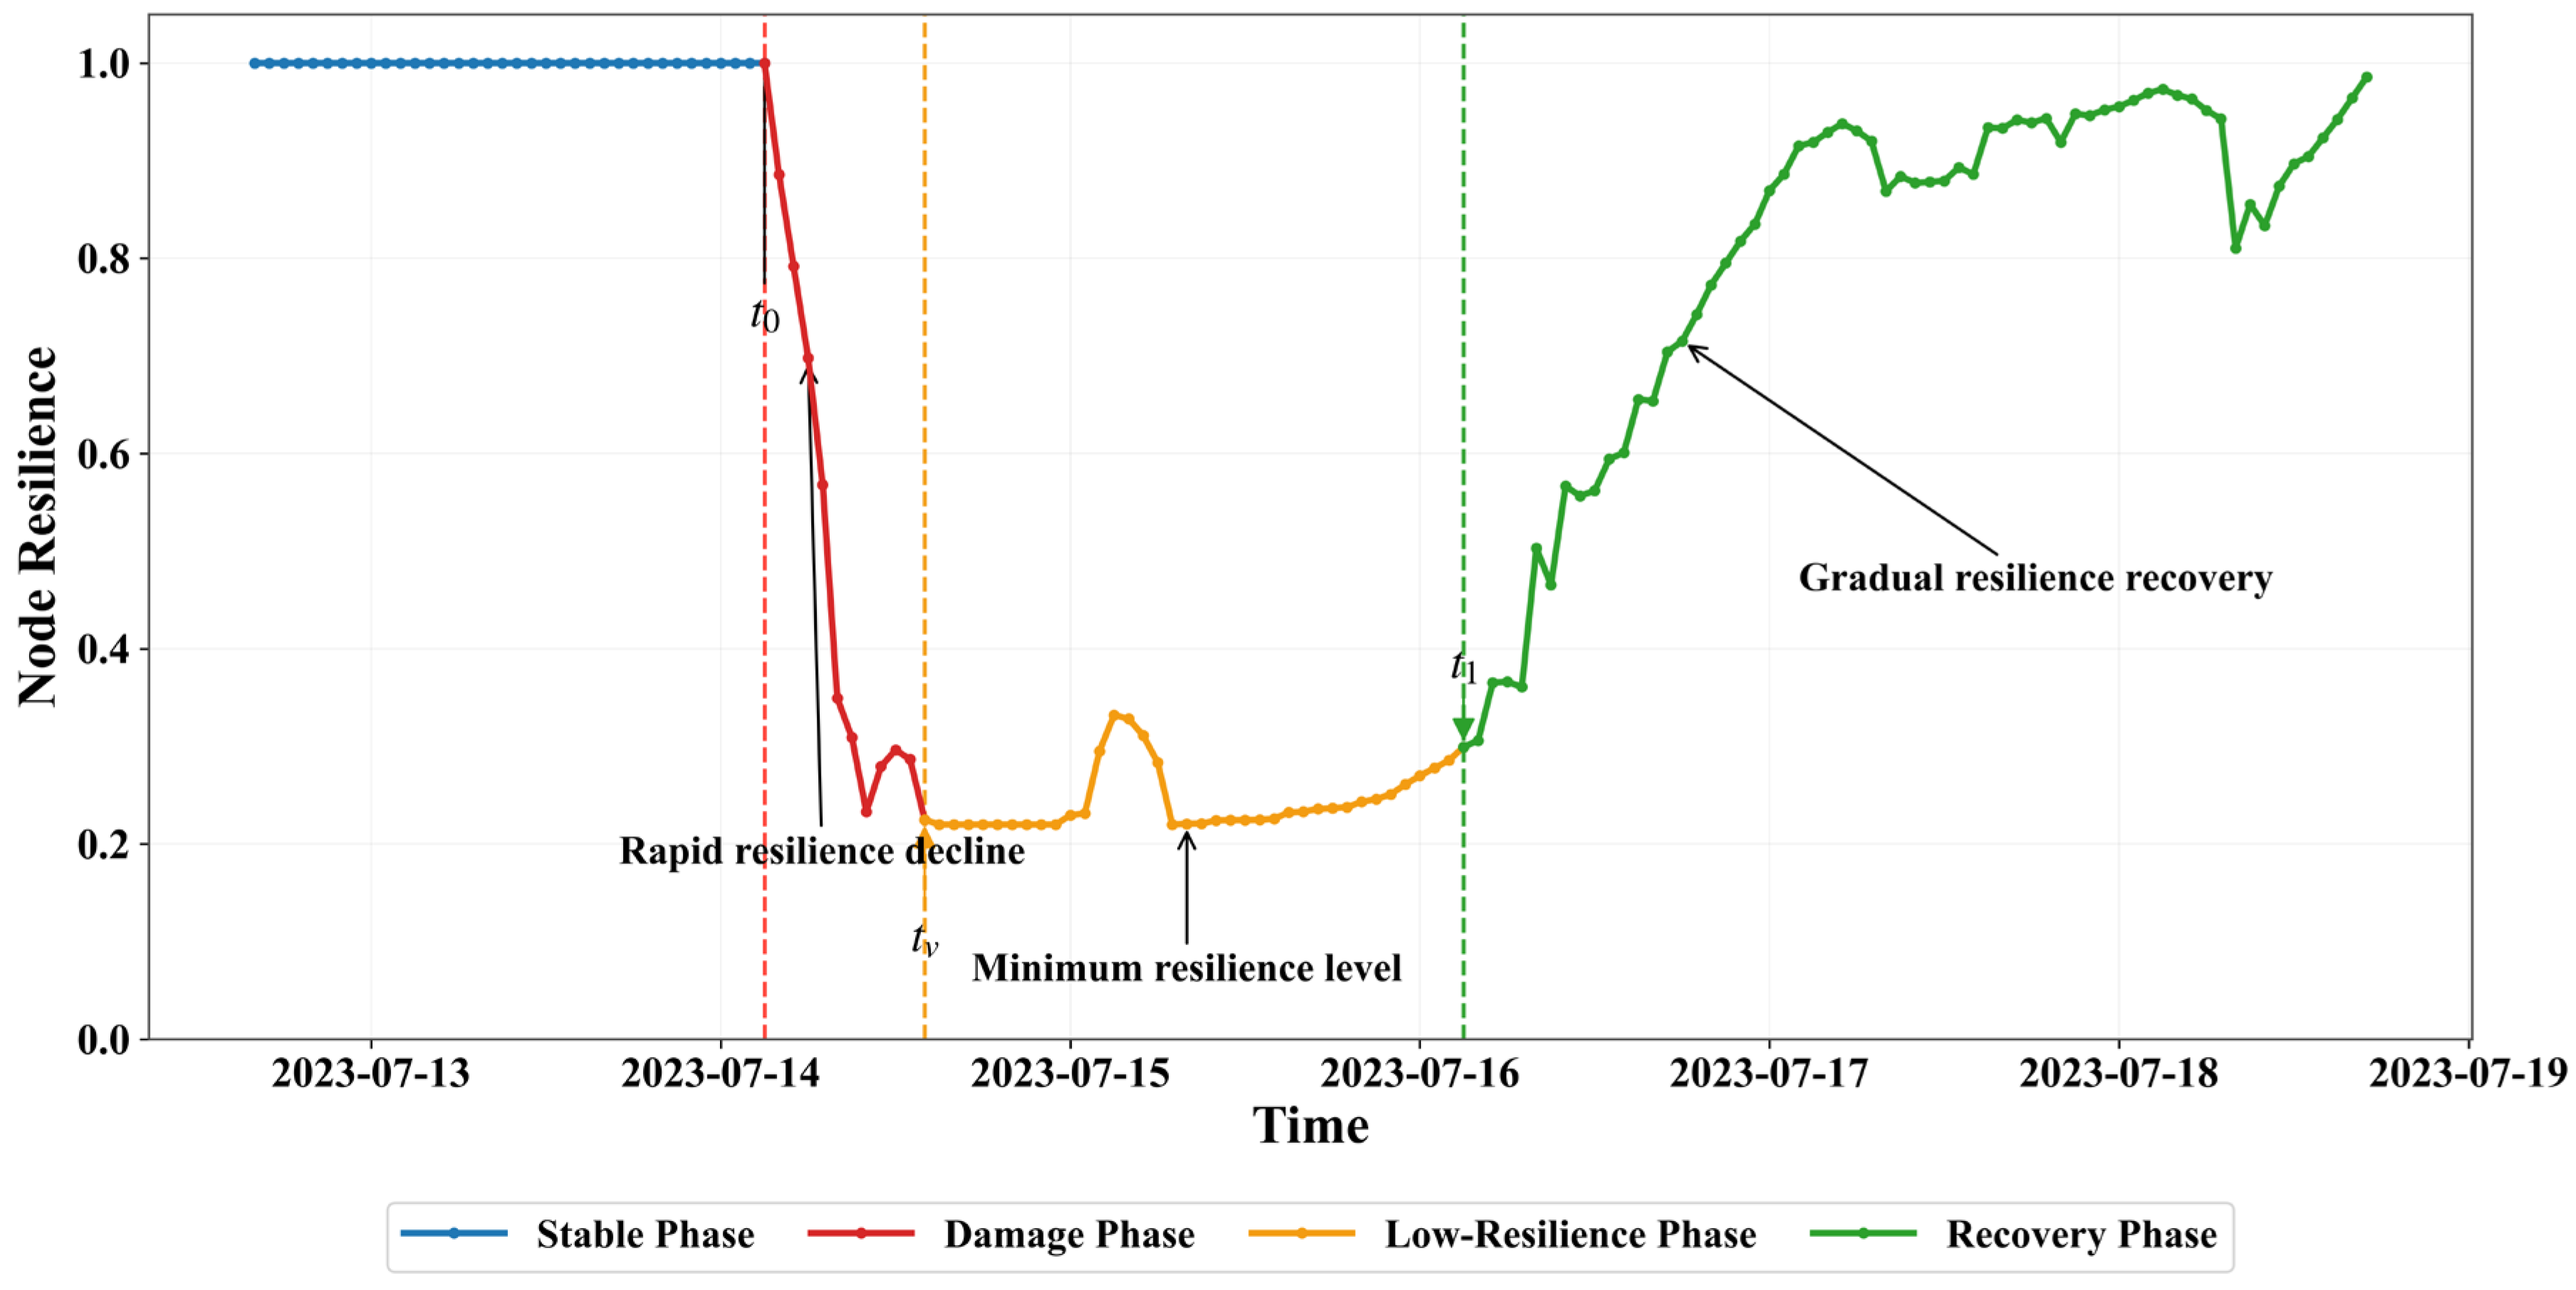
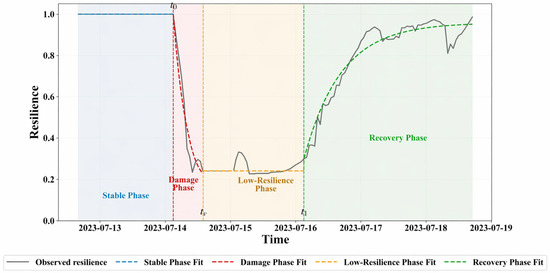
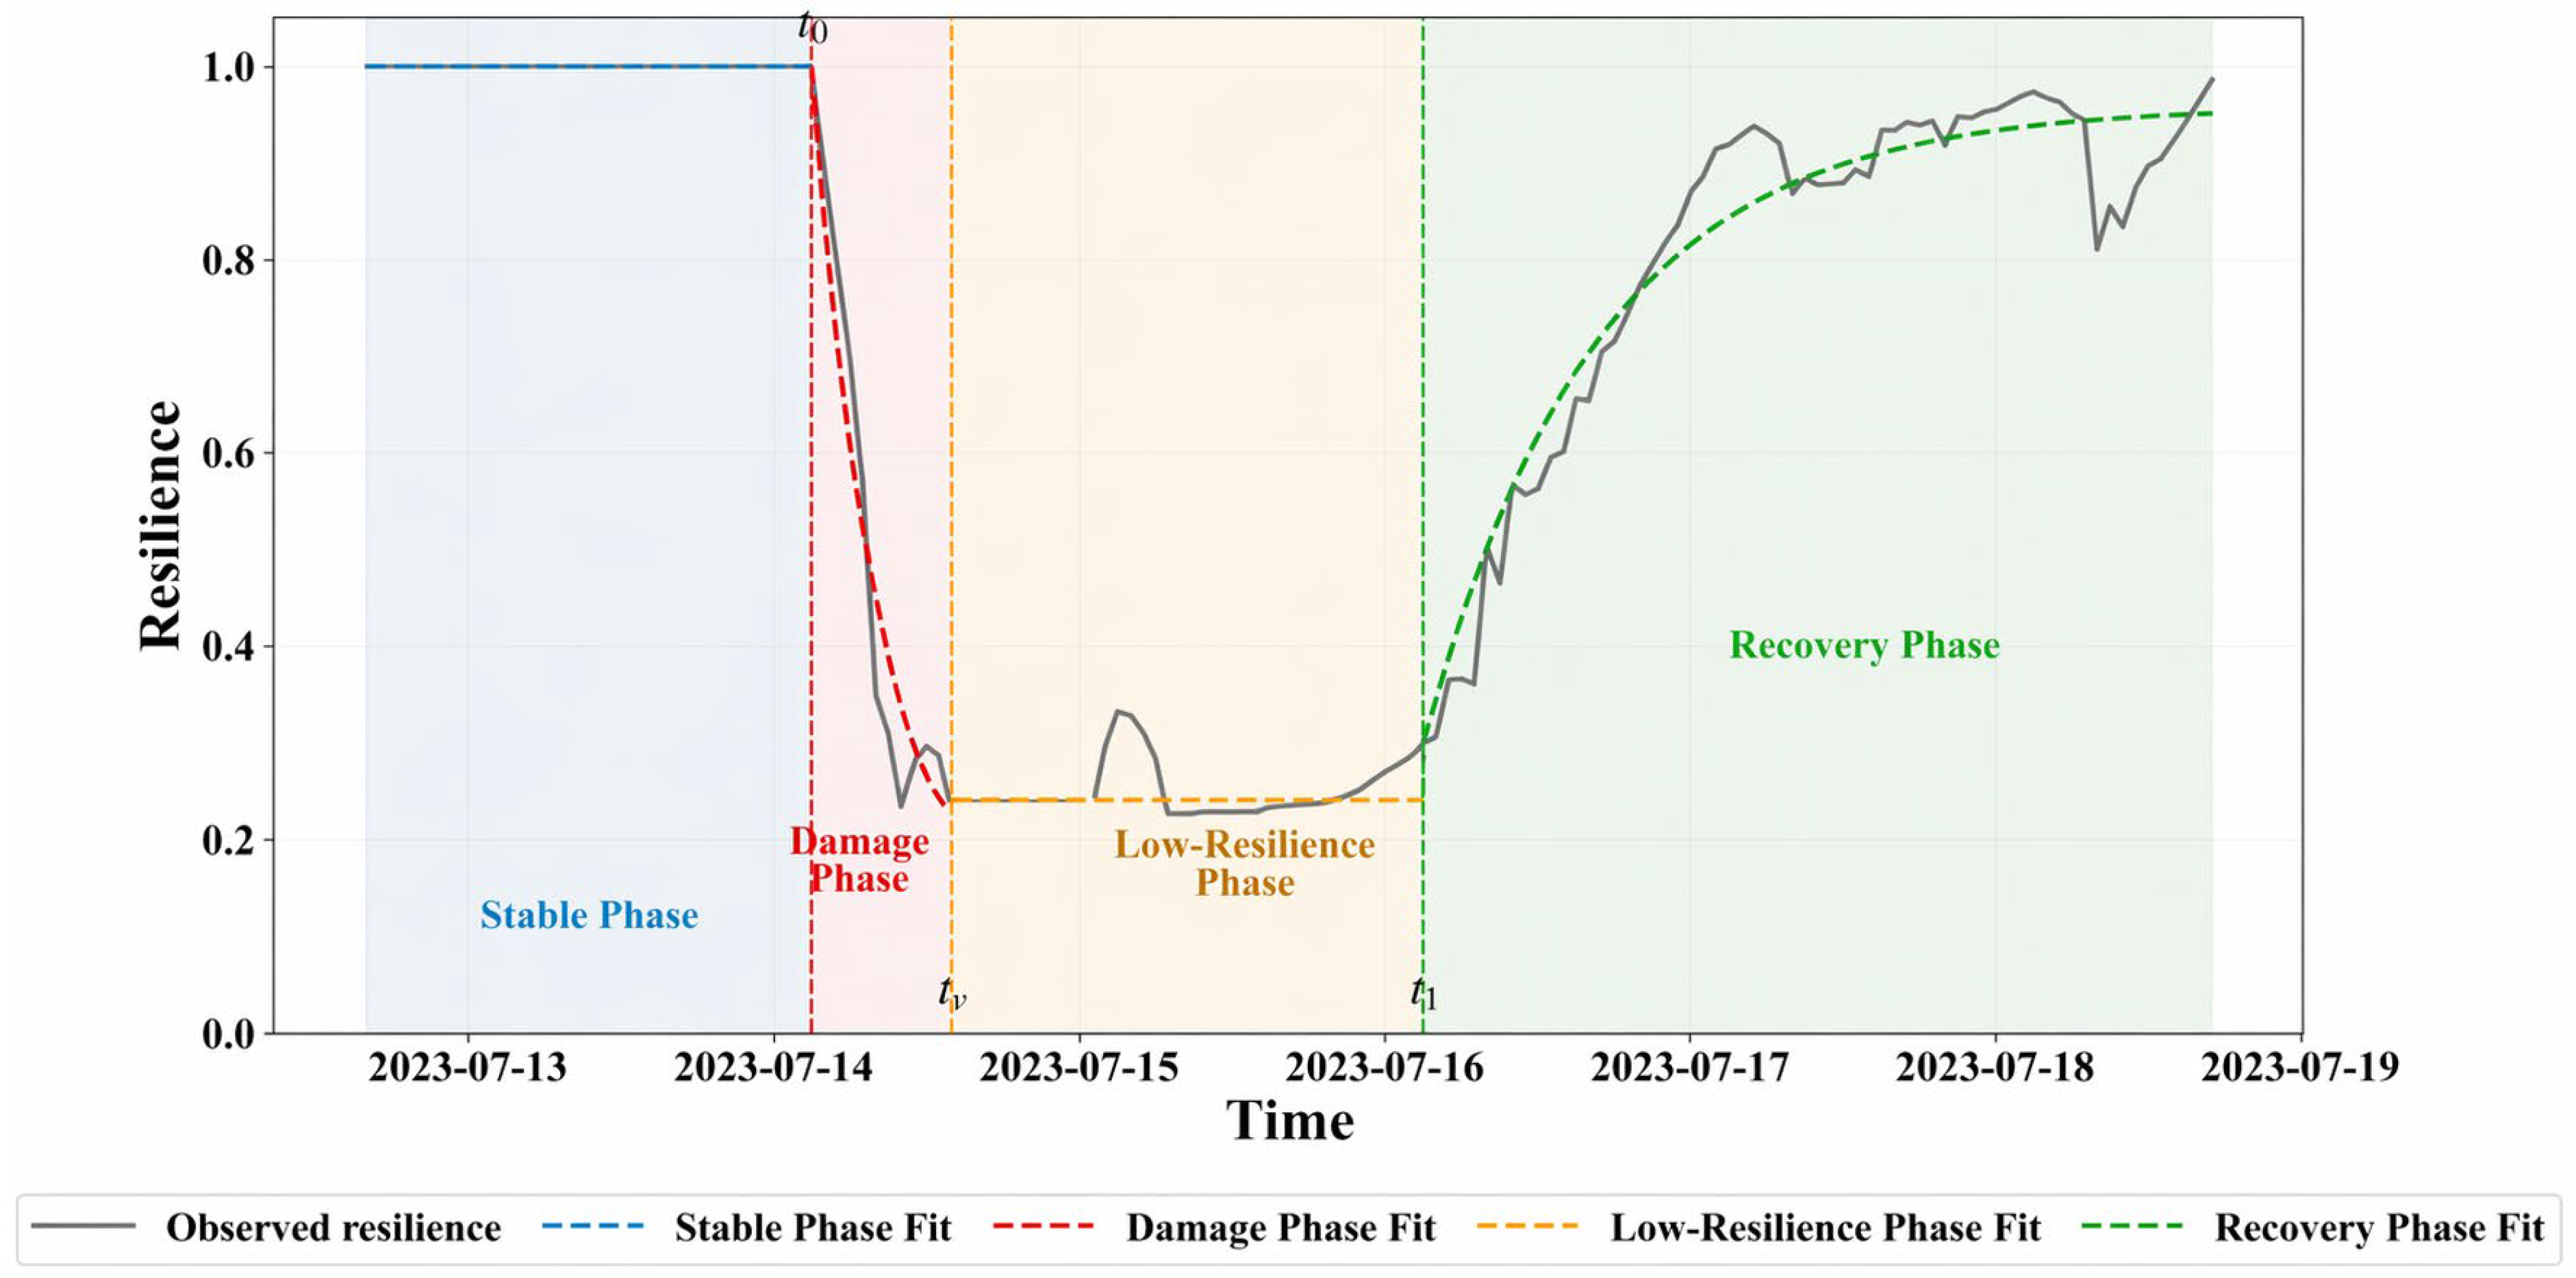
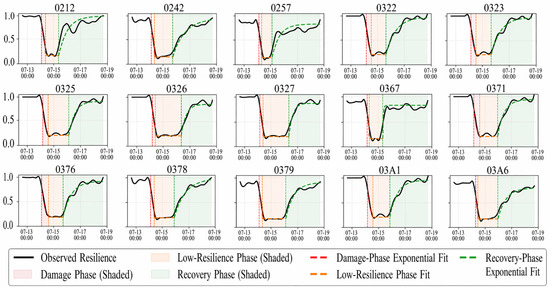
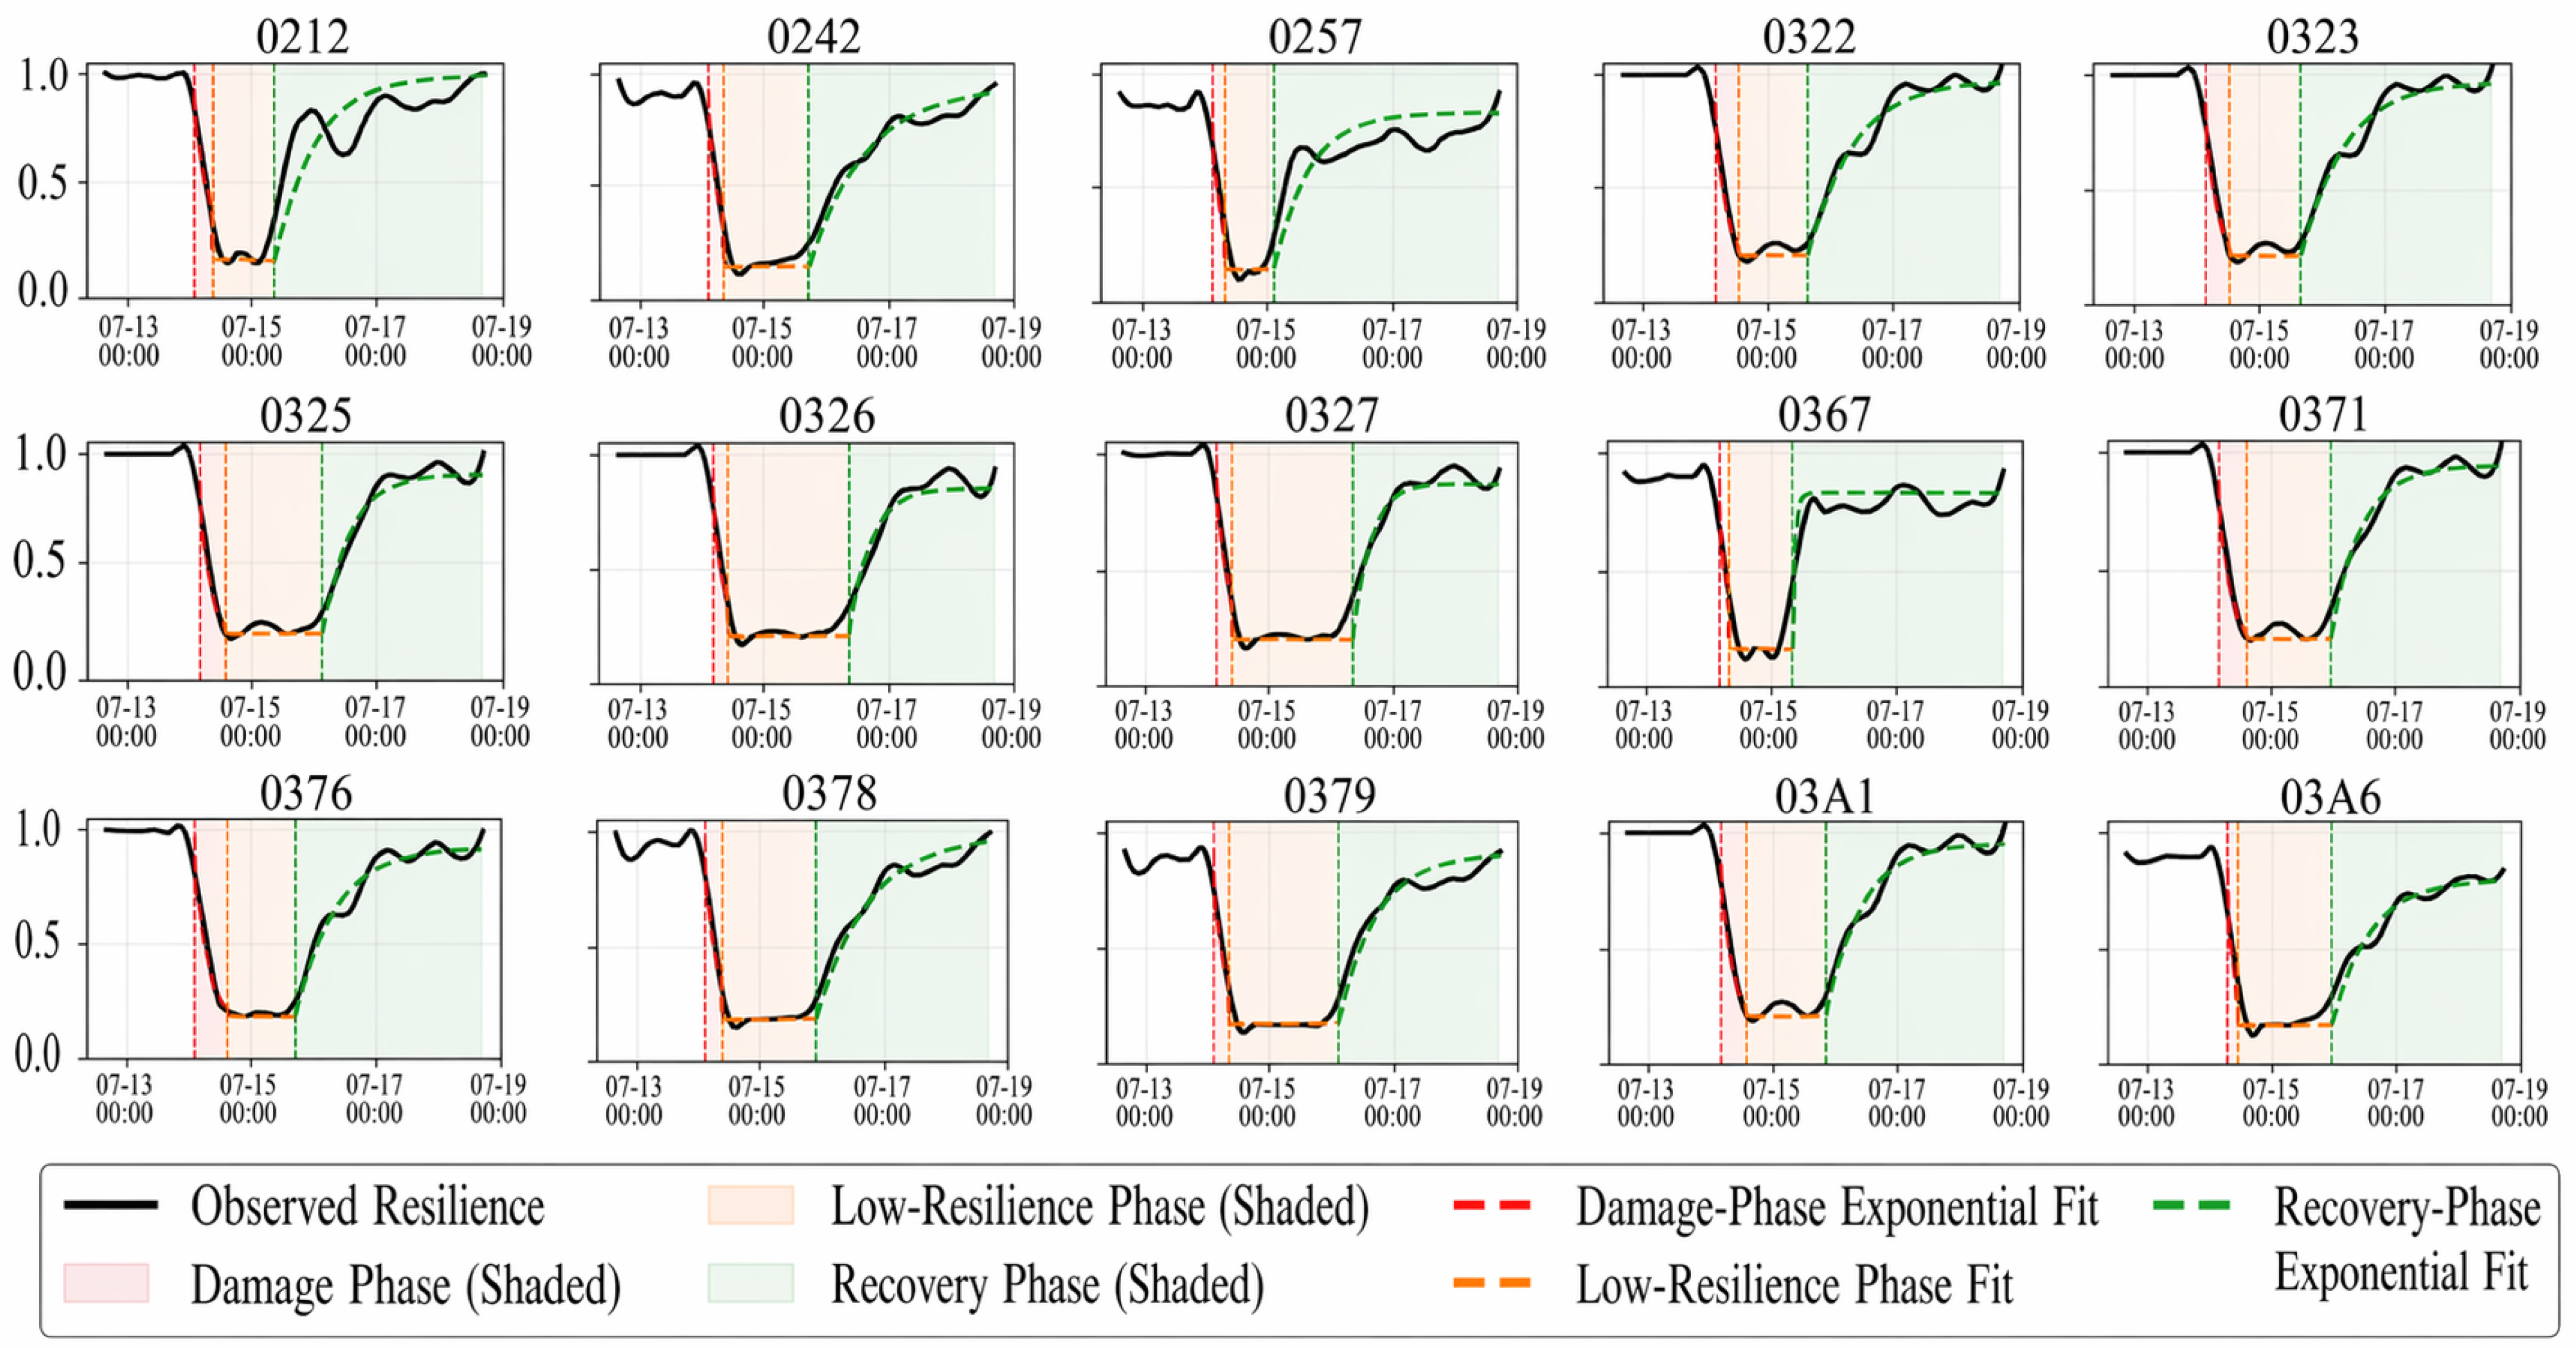
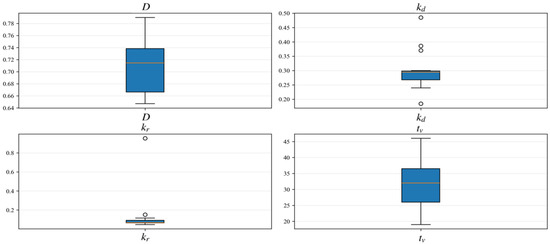
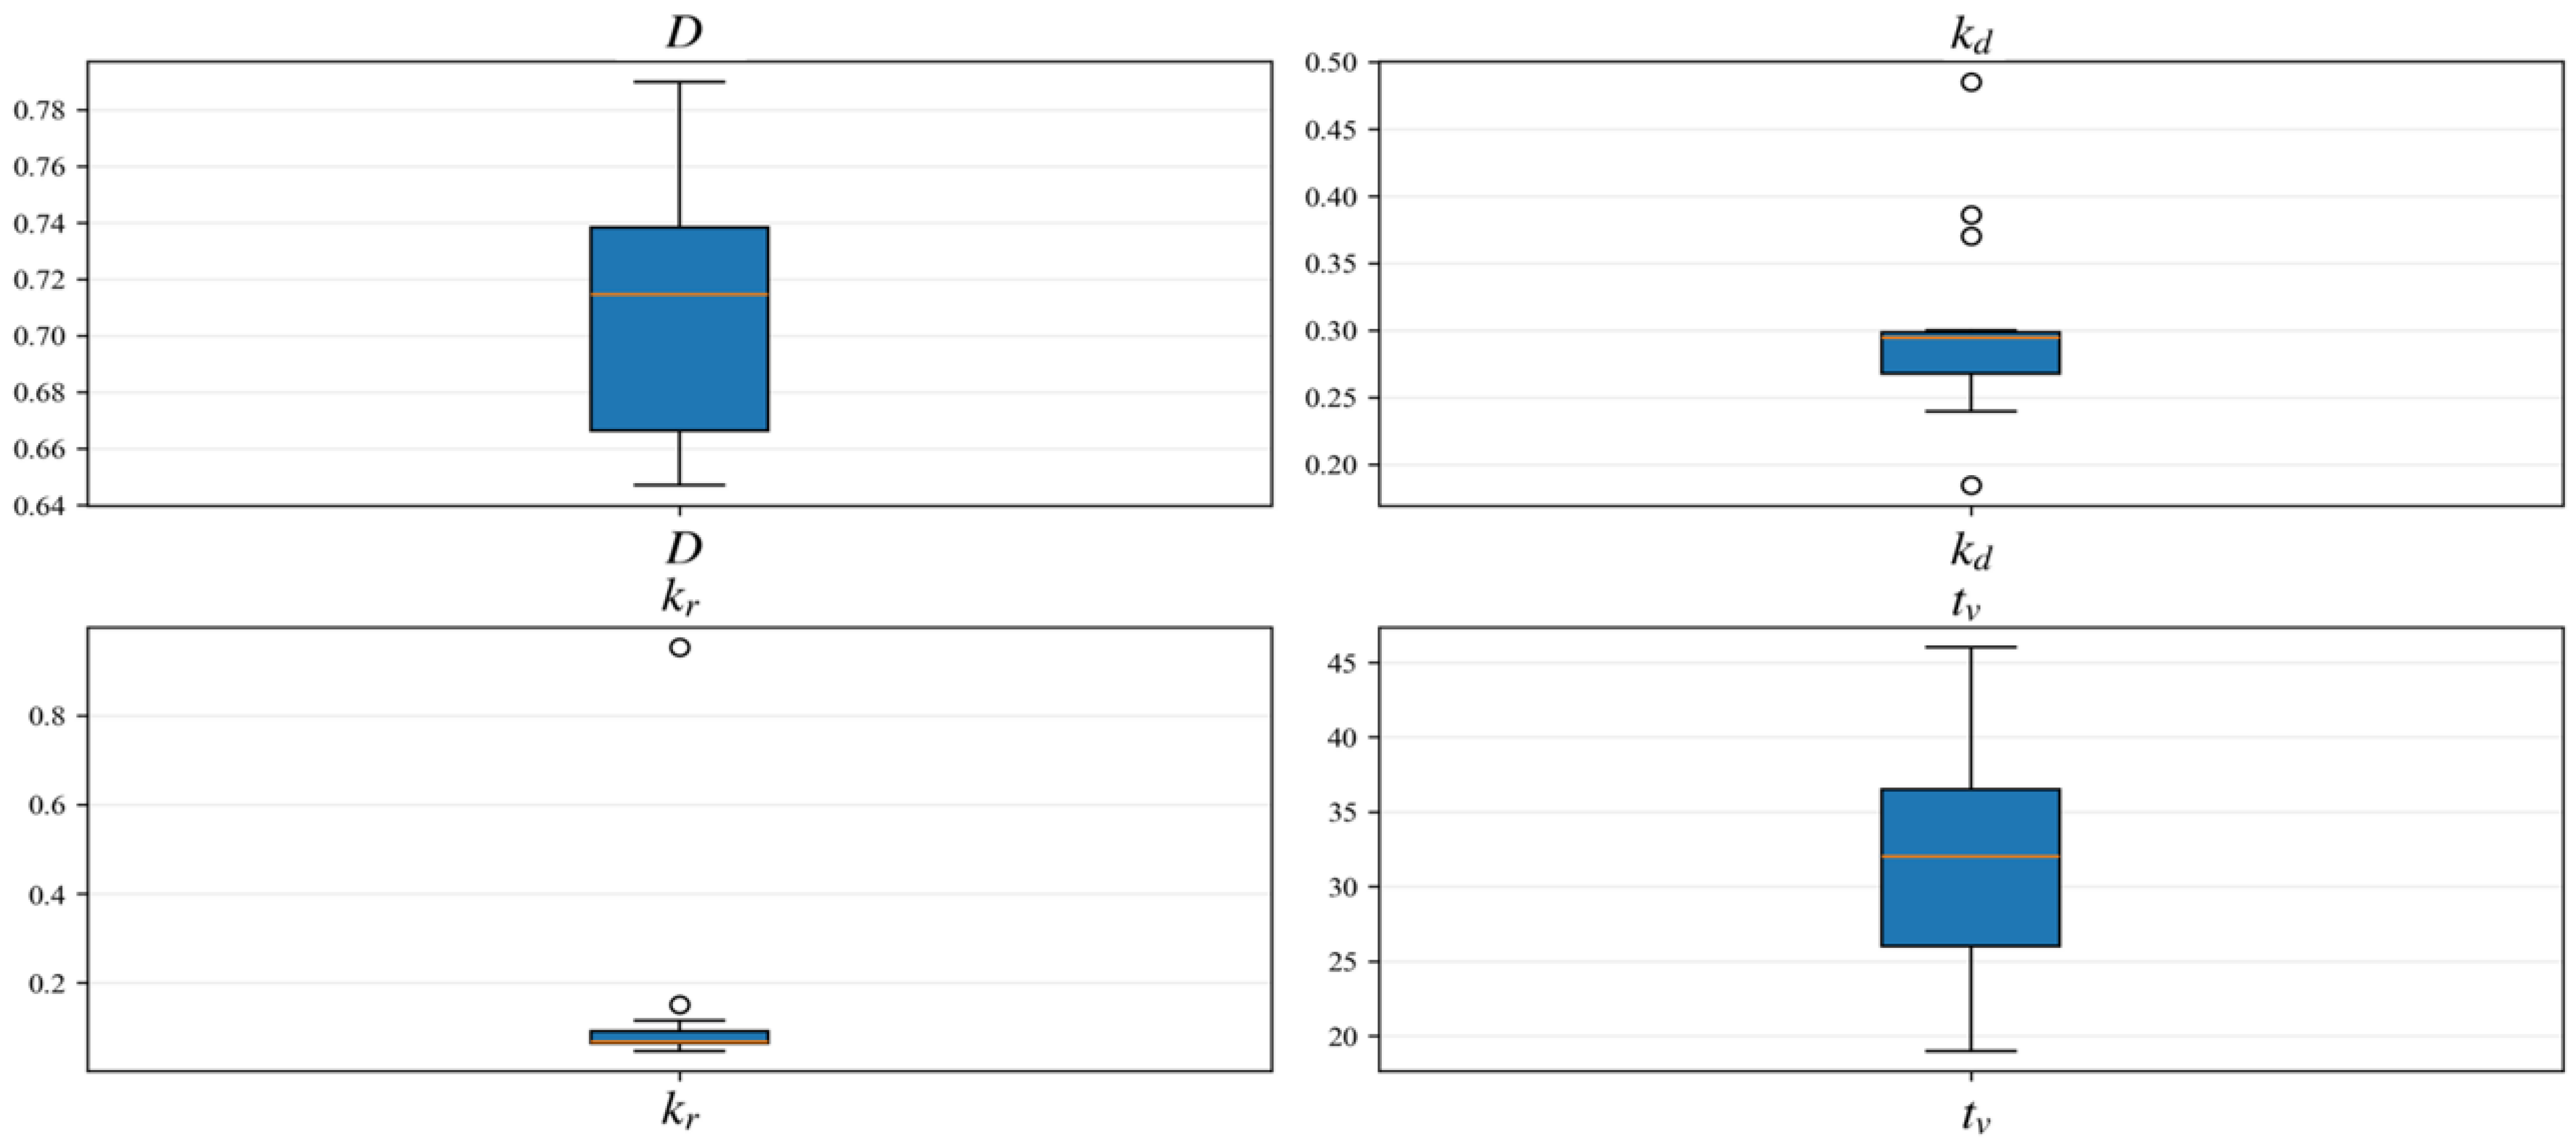
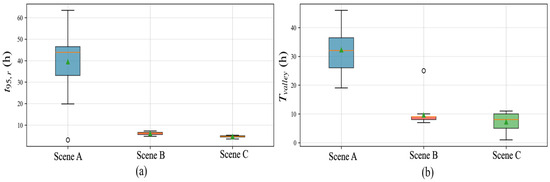
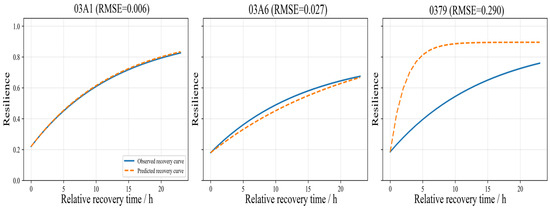
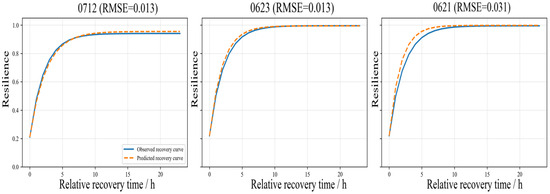
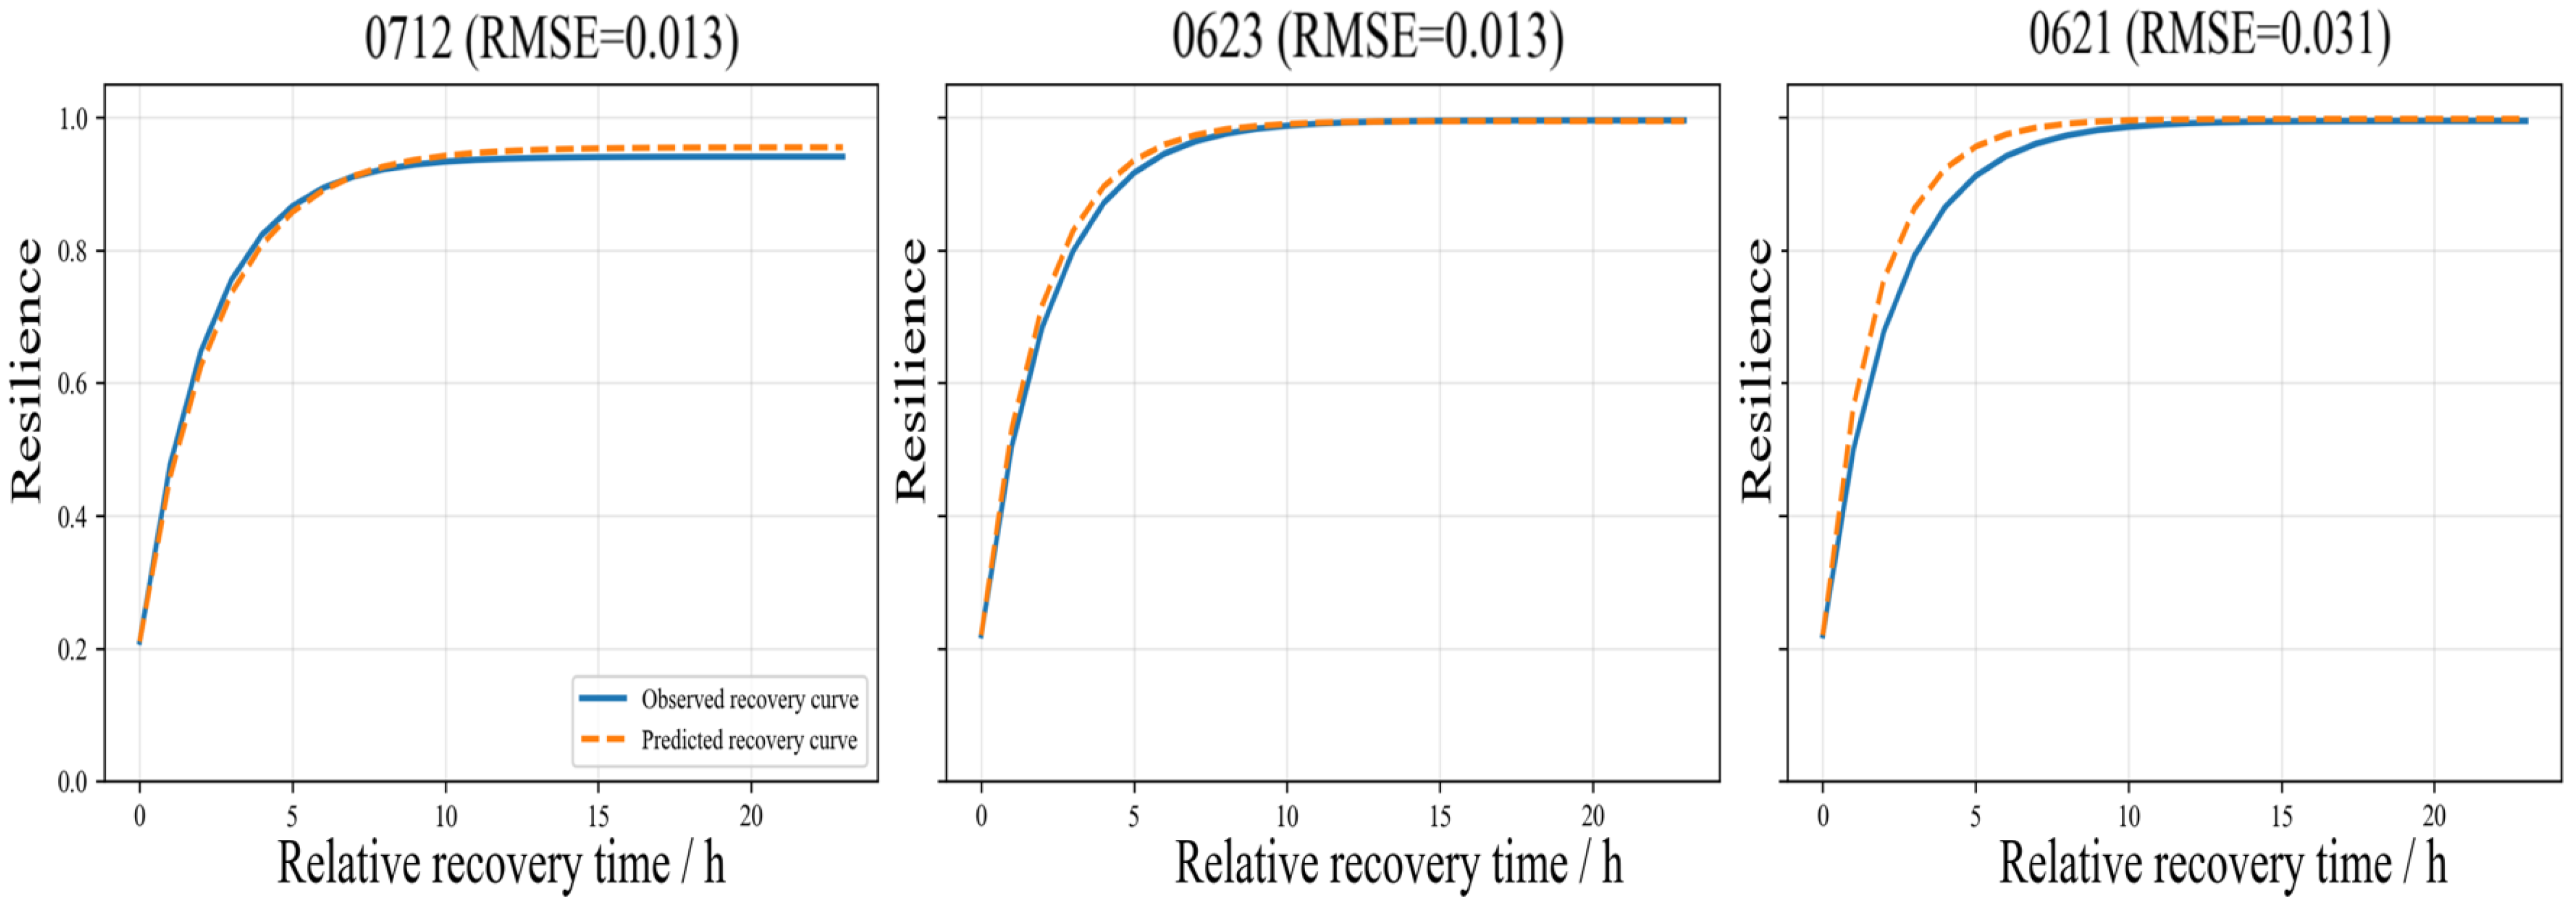
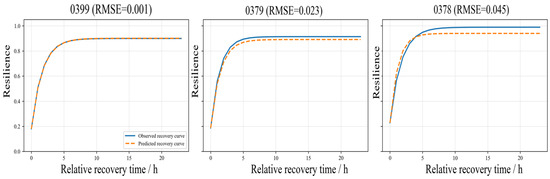
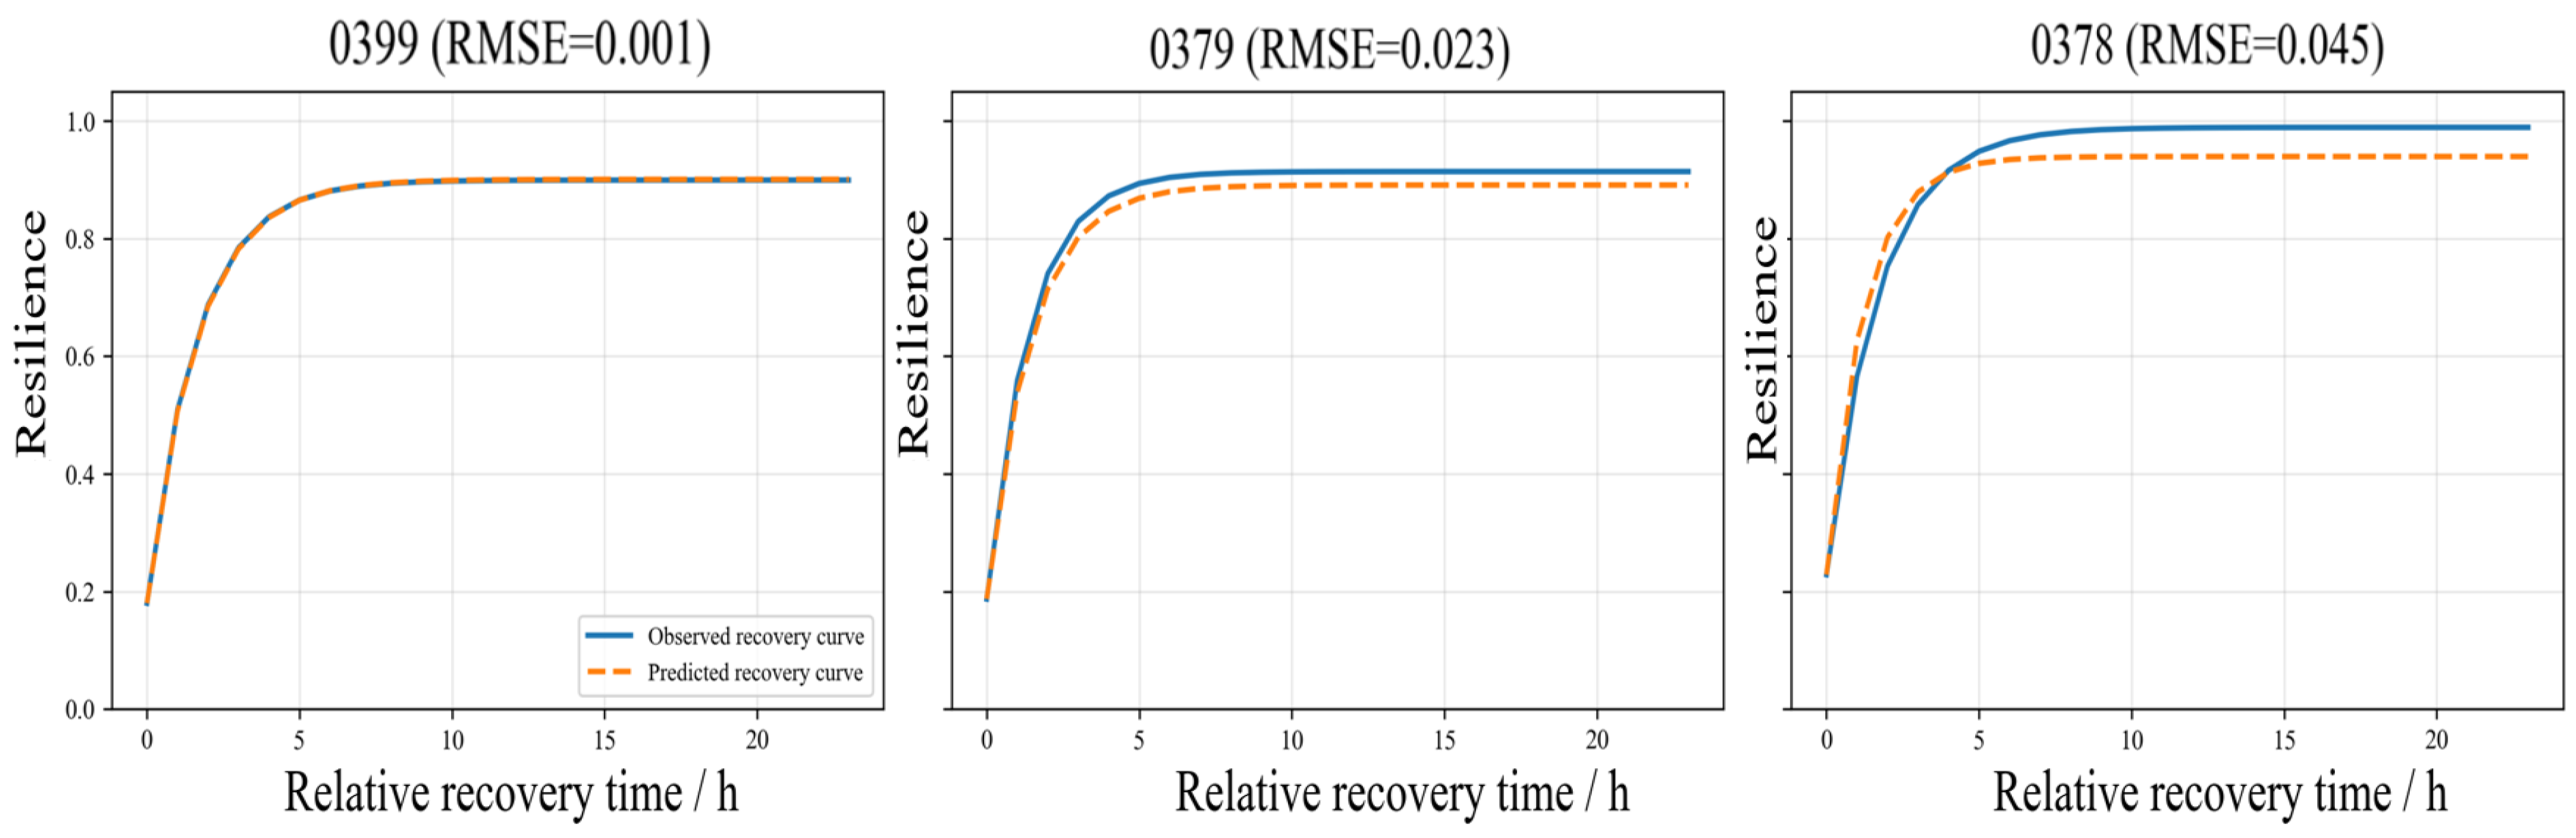

Disclaimer/Publisher’s Note: The statements, opinions and data contained in all publications are solely those of the individual author(s) and contributor(s) and not of MDPI and/or the editor(s). MDPI and/or the editor(s) disclaim responsibility for any injury to people or property resulting from any ideas, methods, instructions or products referred to in the content. |
© 2026 by the authors. Licensee MDPI, Basel, Switzerland. This article is an open access article distributed under the terms and conditions of the Creative Commons Attribution (CC BY) license.