


Abstract
With the rapid advancement of urbanization in China, the issue of imbalanced regional distribution of EFI has become increasingly prominent, given its role as a core component of ecological civilization construction. To scientifically identify spatial disparities in environmental facility development across China’s urban agglomerations, this study examines 138 cities within China’s ten major urban agglomerations. By constructing a multidimensional comprehensive evaluation index system, and employing entropy weighting, the Dagum Gini coefficient, kernel density estimation, and the spatial β-convergence model, this study systematically analyzes regional differences in China’s EFI development levels from 2014 to 2024. This study found that the overall level of EFI in China exhibits a gradient pattern, characterized by “higher in the east and lower in the west, stronger in the south and weaker in the north.” The Pearl River Delta and Yangtze River Delta regions consistently rank in the top tier, while the Central Plains and Guanzhong regions lag significantly behind. Regional disparities follow an inverted U-shaped trend, widening initially and then narrowing, with the gaps primarily stemming from interregional interactions. Spatial agglomeration is evident among urban agglomerations, and late-developing regions such as Chengdu–Chongqing and the Middle Yangtze River region are converging at a relatively rapid pace. Based on these findings, it is recommended to strengthen cross-regional coordination mechanisms, implement differentiated development strategies, and accelerate the transition to smart infrastructure to promote the balanced and coordinated development of EFI, thereby supporting high-quality, green, and low-carbon regional development.
1. Introduction
As China’s urbanization rate surpassed 65% (2023), Environmental Facilities and Infrastructure (hereinafter referred to as EFI), serving as the core carrier of ecological civilization construction, directly impact the achievement of the “Dual Carbon” goals and residents’ health and well-being. Understanding the distribution disparities and inequalities in EFI is crucial for promoting sustainable development. The “2022 Bulletin on the State of China’s Ecological Environment” issued by the Ministry of Ecology and Environment reveals that 24.7% of urban wastewater treatment plants nationwide operated at load rates exceeding 120% (an increase of 3.1 percentage points from 2021), with the Pearl River Delta region averaging 135%, highlighting a severe disconnect between treatment capacity and urbanization progress. EFI not only fulfills essential pollution reduction functions (e.g., wastewater treatment plants contribute 45% to COD reduction [1]) but also acts as a key node in the circular economy, exemplified by reclaimed water reuse potentially alleviating 40% of water scarcity pressure in northern cities [2]. Regional disparities in EFI are a pervasive structural issue in the global urbanization process and have been widely documented across countries and regions at various stages of development. Evidence from the United States indicates significant inequities in the distribution of infrastructure, such as water and transportation systems, between urban and rural areas and among racial groups. Core cities and advantaged groups have long monopolized more resources, while marginalized communities and ethnic minorities bear higher environmental risks [3,4]. In Mexico, household water supply services exhibit a classic “resource paradox”, water supply stability in the arid northern regions is significantly better than that in the water-rich southern regions. Mexico’s water supply intermittency appears to be driven more by regional infrastructure inequalities and socioeconomic factors than by environmental water scarcity [5]. Research by Ketchoua et al. [6] on African countries further confirms that overinvestment in infrastructure leads to diminishing returns, misallocation of resources, and widening regional disparities, with governance levels playing a key moderating role. In highly urbanized Australia, urban areas generate extremely high environmental pressures and ecological footprints, while remote regions face multiple inequalities, including insufficient infrastructure supply, poor access to public services, and disparities in living standards [7].
This spatial imbalance not only intensifies contradictions in regional environmental justice (such as transboundary pollution transfer [8]) but may also hinder the green transformation of less-developed areas through an “ecological depression effect.” Research indicates that river and air pollution are mobile; insufficient treatment capacity in upstream areas can affect downstream regions [9] (as seen in cross-provincial water pollution incidents). Balanced development is fundamental to joint prevention and control. Access to clean drinking water, wastewater treatment, and waste management are basic livelihood needs. Moreover, imbalanced development increases health risks for residents in less-developed areas (such as diseases caused by water source pollution [10]), thereby exacerbating social inequality. Previous studies have shown that, whether in developed countries such as the United States and Australia or in developing regions such as Mexico and Africa, EFI generally exhibits significant regional inequalities. The root causes of these inequalities do not lie in differences in natural endowments, but rather stem from disparities in investment allocation, governance structures, spatial spillover effects, and urban–rural development trajectories. Ensuring equitable access to infrastructure for all residents is crucial for achieving the Sustainable Development Goals [11]. Tu Ying [12], through a survey of infrastructure access disparities and their impact on health across 166 countries and regions, found that both infrastructure accessibility and inequality are associated with health outcomes, a relationship that is particularly pronounced in the context of EFI. As a major country characterized by significant regional development imbalances, China’s EFI faces challenges similar to those encountered globally, yet it also exhibits unique characteristics, such as strong policy-driven development. Although policies such as China’s “14th Five-Year Plan for Urban Sewage Treatment and Resource Utilization” emphasize balanced distribution, market-driven capital concentration continues to fuel the Matthew effect, making it urgent to quantitatively assess the spatiotemporal evolution of regional disparities. The findings of quantitative studies by Xiong, N., et al. [13] confirm that town development is a key driver of China’s new urbanization; however, there are significant disparities in development levels among different towns. Consequently, China’s rapid urbanization and pronounced regional disparities make it an ideal subject for studying regional disparities and spatial convergence. At the same time, driven by the strategy of building an ecological civilization, China’s EFI development enjoys strong policy support and a continuously improving governance system [14], making it a subject of significant research value and practical relevance. Using China as a case study not only reveals local development patterns but also provides valuable insights for other developing countries.
Based on this, the core research objective of this paper is to systematically reveal the spatiotemporal patterns, regional disparity structures, and spatial convergence characteristics of EFI development levels across China’s ten major urban agglomerations; to identify the sources of these disparities and their driving mechanisms; and ultimately to propose a regional coordination pathway tailored to China’s national conditions. Accurately identifying the patterns of EFI integration within urban agglomerations, conducting an in-depth analysis of their current status and future trends will contribute to a better understanding of the allocation methods and mechanisms of environmental resources within these agglomerations. Based on these research objectives, this study proposes to conduct the following research tasks: construct a comprehensive indicator system for EFI development levels; employ the entropy weighting method to measure the composite EFI development index for 138 cities across China’s ten major urban agglomerations; use the Dagum Gini coefficient to analyze regional disparities in EFI development levels; utilize kernel density estimation to explore the dynamic evolution of EFI distribution; and apply the spatial -convergence model to analyze the convergence of EFI development levels. The study period spans from 2014 to 2024. Given this extensive timeframe, a comprehensive evaluation index system has been selected to measure EFI development levels.
2. Literature Review
EFI refers to the physical facilities and corresponding management systems established to protect the ecological environment, promote the sustainable use of resources, reduce pollution, and address climate change [15,16]. Its connotation encompasses various treatment and disposal facilities and monitoring/regulatory systems systematically built for pollution prevention/control and for improving ecological environment quality. Such infrastructure directly or indirectly supports improvement in environmental quality [17], ensuring the coordinated development of human activities and natural ecology. It primarily includes the following types: pollution control and treatment facilities (e.g., sewage treatment plants), waste management facilities [18] (e.g., landfills, waste-to-energy plants), air pollution control facilities [19] (e.g., industrial waste gas treatment systems), ecological protection and restoration facilities [20] (e.g., wetland restoration projects, ecological slope protection), resource recycling facilities (e.g., reclaimed water reuse systems), renewable energy infrastructure [21] (e.g., solar, wind power), climate adaptation and disaster mitigation facilities [22] (e.g., flood control dams), and environmental monitoring and smart management facilities [23] (e.g., air quality monitoring stations, online water quality monitoring systems). Moon H et al. [24] indicated that EFI like sewage treatment plants and incineration plants can serve as urban energy production facilities, helping cities significantly reduce carbon emissions and enhance energy self-sufficiency. Sun XX [25] pointed out that EFI is a crucial support for protecting and improving the ecological environment, reducing pollution, restoring ecology, and enhancing resource utilization efficiency through systematic and engineered means. According to the conclusions of existing research, the core objectives of EFI are ecological protection and sustainability, typically possessing both public attributes and long-term benefits.
Current academic research on EFI exhibits a clear unidimensional tendency, with most studies focusing on specific sub-fields: on one hand, concentrating on the technical efficiency optimization and operational management improvement of traditional EFI (such as wastewater treatment systems). Li JB et al. [26] conducted a systematic review of scientific literature, grey literature, and news to explore the threats posed by climate change to wastewater infrastructure. Nazari R et al. [27] based on hydrodynamic models, studied the impacts of climate change, sea-level rise, and storm surge events on water supply and wastewater infrastructure. Research in recent years has begun to expand into multiple dimensions, involving emerging directions, such as resilience enhancement, digital empowerment, and grey-green integration. Zhou FX et al. [28], by assessing the impact of digital infrastructure on carbon neutrality, pointed out that cities with better economic development, lower resource dependency, and weaker environmental constraints experience a greater carbon neutrality dividend effect from regional digital infrastructure. Duanmu X et al. [29] showed that the development of digital infrastructure plays a crucial role in addressing regional disparities, particularly in bridging the urban–rural gap, and plays a greater role in underdeveloped areas and among vulnerable groups. Xu CQ et al. [30] developed a cost-benefit assessment framework for grey-green infrastructure projects, promoting the integration of ecological green infrastructure with traditional grey infrastructure to address urban water management challenges and security issues.
Some scholars focus on the planning, design, and ecological benefit assessment of emerging green infrastructure (such as sponge cities and ecological corridors). In the field of infrastructure planning, scholars domestically and internationally integrate ecology to construct or optimize the distribution network of green infrastructure in cities [31], or by constructing corresponding ecological evaluation indicators, analyze the sustainability of urban green infrastructure. Korkou M et al. [32] pointed out that current research on green infrastructure focuses on themes such as planning methods for urban green infrastructure, assessment methods for urban green infrastructure, ecosystem services and their benefits. Wen HW et al. [33], utilizing Chinese prefecture-level data from 2003 to 2021, proposed that new-type infrastructure significantly enhances regional green well-being and can substantially increase household income, thereby promoting economic service capacity. Chang HS et al. [34] constructed a green infrastructure spatial planning model to set three different scenarios, including planning orientation, and centralized and decentralized green infrastructure planning. In the field of management science, some scholars, by analyzing management experiences related to green stormwater infrastructure, have provided effective improvement suggestions for issues such as the fragmented distribution and management difficulties of current urban green infrastructure [35]. Nassani AA et al. [36] found that green and blue infrastructure, along with green technology, is a key factor for achieving green innovation and environmental protection. Shi CY et al. [37], through questionnaire surveys, explored public perceptions of green infrastructure in sponge cities; the study found that the public generally holds a positive attitude towards investing in sponge city green infrastructure, particularly through stormwater fees, highlighting the feasibility of diversified financing mechanisms.
On the other hand, some studies have focused on analyzing regional disparities in infrastructure. Research by Zheng S, Yao R, and others [38] concludes that, given the well-developed infrastructure and strict environmental regulations in the eastern coastal regions, polluting enterprises are more likely to relocate to inland areas with weaker infrastructure. The core findings of scholars such as Pearsall H [39] indicate that infrastructure constitutes a systemic network connecting cities, suburbs, and rural areas; its benefits and costs are unevenly distributed across urban and rural areas, population groups, and regions, directly shaping health inequalities. These studies also demonstrate that uneven infrastructure distribution across regions further exacerbates the spatial spread of pollution, ultimately leading to increased environmental inequality. Sustainable infrastructure must center on urban–rural interaction to achieve equitable distribution of benefits and risks. Findings by W H et al. [40] indicate that the overall resilience of China’s urban infrastructure has improved, with the eastern region exceeding the national average. In contrast, the levels in the central, western, and northeastern regions are slightly below the national average. Zhang, X. and Liu, Z. et al. [41] analyzed the nature of infrastructure in different regions of China and reached the following conclusions: the eastern region has strong environmental regulation and governance capabilities, with infrastructure investment directed more toward green transportation and low-carbon facilities, reinforcing balanced transformation; in the central region, development gaps between cities within provinces are smaller than in the east, making it easier for infrastructure to play an inclusive role; in the western region, cities have industrial structures that rely heavily on resources and energy, and infrastructure improvements actually accelerate resource exploitation and pollution emissions, benefiting only core cities. Liu H and Wang L [42] point out that the spatial concentration of infrastructure across China’s 31 provinces has risen significantly, exhibiting a pronounced Matthew effect, with high-quality infrastructure concentrating in urban agglomerations. This necessitates vigilance against new regional imbalances. Furthermore, infrastructure growth in the central and western regions is outpacing that in the east, serving as a key driver for narrowing regional disparities. Research by Liu R, Zhang P, et al. [43] indicates that disparities in infrastructure development levels across cities directly lead to a mismatch between the supply of green spaces and population distribution. Cities in the east, with more developed infrastructure, have long enjoyed higher levels of green exposure for their residents compared to those in the central and western regions. In cities with weak infrastructure, even when green space area increases, residents’ actual accessibility to and exposure to green spaces remain low.
In summary, existing research has examined the intrinsic link between infrastructure development and regional development disparities from perspectives such as environmental inequality, disparities in green transition, multidimensional spatial imbalances, and urban–rural equity, confirming that spatial imbalances in infrastructure are a key structural factor exacerbating environmental inequality, imbalances in green development, and disparities in residents’ well-being. However, most studies on EFI still focus on analyzing impacts from a single dimension. This research paradigm, while capable of deepening the understanding of specific issues, lacks comprehensive consideration of the synergistic effects among various EFI systems, making it difficult to fully grasp the overall mechanism through which the EFI promotes urban sustainable development. The construction level of urban EFI can not only enhance the ecological standard of individual cities but also elevate that of their surrounding cities, indicating that EFI construction level possesses a network effect. Conducting holistic research and cultivation of the urban EFI construction level within the urban system is of great significance. Significant developmental imbalances and lack of coordination persist in the EFI construction level of Chinese cities, with insufficient collaborative cooperation both between urban agglomerations and within metropolitan areas, and ecological and environmental issues in the western region still urgently require resolution. Based on the review of the literature and the current context, this paper proposes the following research hypotheses:
H1.
There are significant regional differences in the level of EFI among China’s top ten urban agglomerations. Influenced by economic development levels, fiscal capacity, and historical development foundations, the level of EFI in eastern coastal urban agglomerations is significantly higher than that in central and western inland urban agglomerations.
H2.
The level of EFI across different cities exhibits spatial network effects, with significant positive spatial spillovers between adjacent cities.
H3.
Under the influence of regional coordinated development policies, urban agglomerations and cities with relatively lower levels of EFI will gradually catch up.
3. Research Design
3.1. Indicator System Construction
EFI, as defined in this document, refers to the facilities and corresponding management systems established to prevent and control pollution, protect the ecological environment, improve resource utilization efficiency, and carry out environmental monitoring and supervision. The core function of EFI is to improve the quality of urban and rural human settlements and promote the continuous improvement of the ecological environment by establishing a complete facility network and regulatory system, including pollution control facilities and monitoring and regulatory systems [44]. To establish a clear and rigorous correspondence between core concepts and evaluation indicators, this paper strictly adheres to the functional positioning of EFI when selecting indicators. By definition, Therefore, this paper selects 20 secondary indicators from four dimensions: pollution control, public service, ecological protection, and smart management, as shown in Table 1. The indicators for pollution control directly reflect the status of EFI’s core hardware infrastructure; public service capacity reflects the region’s overall level of support in areas such as the operation of EFI; indicators for ecological protection reflect the effectiveness of ecological space maintenance and restoration; and indicators for smart management correspond to the level of digitalization in environmental monitoring and cross-regional collaborative governance.
Table 1.
The evaluation indicator system for the construction level of EFI.
The selection criteria for the 20 sub-indicators are as follows. For the pollution control dimension, the following indicators were selected: urban sewage treatment rate, sewage pipeline network density, domestic waste harmless treatment rate, industrial SO2 removal rate, medical waste centralized disposal rate, and general industrial solid waste utilization rate. These indicators directly reflect the scale of construction, coverage, and actual treatment effectiveness of EFI [45]. EFI is a typical quasi-public good characterized by non-excludability and public welfare. Its provision highly relies on government public financial investment and the support of public service systems. According to the public goods theory [46], measuring only hardware facilities cannot fully reflect the sustainable supply capacity of EFI; supportive indicators such as financial security and public service supporting facilities must be incorporated. Therefore, based on the public goods theory, for the public service capacity dimension, the following indicators were selected: science and technology expenditures as % of fiscal expenditures; education expenditures as % of fiscal expenditures; public library books per 10,000 people; licensed physicians per 10,000 people; and social security and employment expenditures as % of fiscal expenditures. Specifically, science and technology expenditures as % of fiscal expenditures directly reflects a region’s technical capacity for environmental governance; education expenditures as % of fiscal expenditures reflects the level of human capital accumulation in the region and indicates the long-term development capacity of the environmental governance system [46]; public library books per 10,000 people represents the level of public cultural access and environmental awareness in the region, and it is an important social foundation for the effective operation of the environmental governance system [47]; licensed physicians per 10,000 people reflects a region’s capacity to safeguard public health; mitigating health risks caused by pollution is one of the key functions of the EFI [48], and there is a direct functional correlation between the two; meanwhile, social security and employment expenditures as % of fiscal expenditures reflect the strength of government fiscal support, and, as a typical public facility, the sustainability of EFI is closely linked to the government’s fiscal capacity. Based on the above analysis, the dimension of public service capacity is measured across several aspects: technical support, human capital, social foundation, health benefits, and fiscal support.
In the ecological protection dimension, indicators such as the green coverage rate in built-up areas, per capita park green space area, wetland area as % of total land area, and the elimination rate of black and odorous water bodies were selected to reflect the effectiveness of urban ecological space development and water environment governance and to demonstrate the value of EFI in improving the ecosystem. The smart management dimension includes the number of ambient air quality monitoring stations, the number of key polluting enterprises with online monitoring, smart environmental platform completion rate, the number of cross-regional ecological compensation agreements, and environmental protection investment as % of GDP. This dimension focuses on depicting the level of digitalization in environmental governance and reflects the progress of EFI toward smart development [49]. All indicators are derived from the China Statistical Yearbook, the China Environmental Statistical Yearbook, and other officially published statistical data. They reflect regional public fiscal capacity, human capital accumulation, and public health security, providing fundamental conditions for the sustainable provision of EFI. These sources are authoritative, consistent in methodology, and provide strong data continuity, ensuring that the indicator calculation process is standardized and feasible.
3.2. Research Subjects
This paper selects the Beijing–Tianjin–Hebei, Yangtze River Delta, Pearl River Delta, Middle Yangtze River, Chengdu–Chongqing, Central Plains, Guanzhong, South–Central Liaoning, West Coast of the Taiwan Strait, and Shandong Peninsula urban agglomerations as the study subjects. The selection of these ten urban agglomerations primarily draws on the findings of Chen Minghua et al. [50], a study that defined the boundaries of these ten agglomerations based on officially approved national urban agglomeration development plans and has been widely adopted in academic circles. Liu ZB et al. [51] and Gong, Z et al. [52] both adopted this definition in their studies on spatial inequality in Chinese urban agglomerations. Existing literature has validated that this classification method comprehensively reflects the spatial patterns and characteristics of regional development in China [53,54]. Furthermore, these ten urban agglomerations possess the following characteristics that make them suitable for this study: (1) They are all key urban agglomerations explicitly identified in the national strategy for coordinated regional development, covering the four major regions of eastern, central, western, and northeastern China, and thus exhibit strong spatial representativeness. (2) They account for over 60% of the country’s urban population while occupying only about 20% of the national land area, making them the regions with the most concentrated pressure for pollution control (data from the Ministry of Housing and Urban–Rural Development, Statistical Yearbook of Urban and Rural Construction, 2024). (3) They exhibit a complete development gradient, encompassing high-level, medium-level, and catch-up-type urban agglomerations. (4) They have clear boundaries and continuous data: the scope of the cities is well defined, data is readily available, and they meet the requirements for quantitative analysis.
The ten major urban agglomerations selected for this study are key regions for the development of pollution control systems, and the study area covers various types of pollution scenarios, including air, water, and solid waste. In 2024, the average PM2.5 concentration in prefecture-level and higher cities nationwide was 29.3 μg/m3, while PM2.5 concentrations in the Beijing–Tianjin–Hebei, Central Plains, Guanzhong, and South-Central Liaoning regions were generally higher than the national average (data from the National Environmental Monitoring Station of the Ministry of Ecology and Environment, National Urban Air Quality Report (historical data)), highlighting significant pressure for air pollution control. In the Pearl River Delta and Yangtze River Delta, the load rates of urban sewage treatment plants exceed 100%, indicating strained facility capacity; the wastewater reuse rate in eastern urban agglomerations reaches 28.9%, while in western regions it is only 12.4% (data from the Ministry of Ecology and Environment of the People’s Republic of China, 2023 China Ecological and Environmental Status Bulletin), revealing a significant imbalance in the supply of environmental facilities between urban and rural areas, as well as across regions. In the Beijing–Tianjin–Hebei, Yangtze River Delta, and Pearl River Delta regions, the incineration rate for municipal solid waste approaches 100%. In contrast, the levels of comprehensive utilization of industrial solid waste and hazardous waste disposal in Central-Southern Liaoning, the Central Plains, and the Guanzhong region remain relatively low (data from the Ministry of Ecology and Environment of the People’s Republic of China, 2024 China Ecological and Environmental Status Bulletin). The contradiction between environmental governance needs and infrastructure development is pronounced, and the selection of these regions aligns closely with this paper’s focus on environmental sustainability. The specific urban boundaries are shown in Table 2. The boundaries of the ten major urban agglomerations are depicted in Figure 1.
Table 2.
Scope of the ten major urban agglomerations.
Figure 1.
Schematic diagram of the top ten urban agglomerations.
3.3. Research Methods
3.3.1. Entropy Weighting Method
This paper employs the entropy weight method to calculate a composite index for measuring the development level of EFI. The calculation steps are as follows:
First, standardize the raw values.
Here, represents the city; denotes the measurement indicator; is the raw value of indicator for city ; is the raw value of indicator ; and is the standardized value of indicator for city ().
Second, calculate the information entropy of indicator .
Third, calculate the weight of indicator .
Fourth, calculate the composite score for the level of EFI of city .
3.3.2. Dagum Gini Coefficient and Its Decomposition
Drawing on Dagum’s decomposition method for the Gini coefficient, we measure regional disparities in the EFI development levels of China’s ten major urban agglomerations. These disparities are decomposed into intra-regional differences , net inter-regional differences , and inter-regional excess density , i.e., . The calculation process is as follows:
First, calculate the Gini coefficient. Using Equation (5), the overall Gini coefficient for the EFI development levels across the ten major urban agglomerations can be computed.
Among these, () is the comprehensive index of EFI development level for a city within urban agglomerations ; is the total number of cities; is the average EFI development level of cities; is the total number of urban agglomerations; and is the number of cities included in urban agglomerations ().
Second, decompose the Gini coefficient. Equation (6) calculates the Gini coefficient for the EFI development level of urban agglomeration . Equation (7) determines the contribution of intra-regional variation. Equation (8) calculates the Gini coefficient between urban agglomerations and . Equations (9) and (10), respectively, determine the contributions of inter-regional net variation and inter-regional excess density.
Among these, represents the relative influence of EFI development levels between urban agglomeration and urban agglomeration .
3.3.3. Kernel Density Estimation Methods
The kernel density curve reflects the characteristics of the distribution of urban agglomeration EFI development levels, including their shape, location, and extent, such as the height, width, number, and position of peaks [55]. The density function of urban EFI development levels can be expressed as:
Here, denotes bandwidth, represents the number of cities, is the kernel density function, and signifies the average level of EFI development. This paper employs a Gaussian kernel density function to estimate the distribution dynamics of EFI development levels across urban agglomerations.
3.3.4. β Convergence Analysis
β convergence refers to the phenomenon where cities with lower levels of EFI development eventually catch up to those with higher levels, with the gap between them narrowing over time. convergence encompasses absolute convergence and conditional convergence.
- (1)
- Absolute convergence
Absolute convergence refers to the tendency for EFI development levels among cities to converge, disregarding factors influencing EFI development levels. In examining the evolution of EFI development levels within Chinese urban agglomerations, this study not only establishes an OLS model for absolute convergence but also accounts for potential spatial correlation in EFI development levels by formulating a spatial absolute convergence model. The OLS, SAR, SEM, and SDM models for absolute convergence are, respectively, defined as Equations (12)–(15):
where denotes the EFI development level of city in year ; denotes the EFI development level of city in year ; denotes the growth rate of city EFI development level in year ; is the absolute convergence coefficient, with being positive indicating a divergent trend in the city’s EFI development level, and being negative indicating a convergent trend; represents the weight of the Queen adjacency space between cities; , , and denote the city fixed effect, time fixed effect, and random disturbance term, respectively.
- (2)
- Conditional -Convergence
By incorporating control variables into the absolute -convergence model, we derive the conditional -convergence model. The OLS, SAR, SEM, and SDM models for the conditional -convergence model are specified as Equations (16)–(19), respectively.
Among these, represents the control variables influencing the level of EFI development (EFI) [56]. These control variables should encompass both demand-side factors (such as pollution pressure and population density) and supply-side factors (such as fiscal capacity and technology) affecting EFI development [57]. Extensive economic growth (high energy consumption, high pollution) may drive rapid EFI construction but often comes with low efficiency [58]; while intensive economic growth (green technological innovation, clean energy utilization) may prioritize long-term planning and high-quality operation of EFI [59].
Therefore, economic growth quality factors are selected to reflect the “demand-side” drivers of EFI development across regions, including industrial value-added as a percentage of GDP, tertiary industry value-added as a percentage of GDP, polluting industries’ output value as a percentage of total industrial output value, and urban population as a percentage of total population. Supply-side factors determine whether a region possesses sufficient resources and technical capabilities to deliver high-quality environmental public services. Urban investment capacity and technological level factors were selected to reflect “supply-side” drivers, including per capita real GDP growth rate (%), per capita disposable income (RMB 104), and number of green patents (items). These data are sourced from the China Urban Statistical Yearbook and the National Intellectual Property Administration’s patent database.
4. Measurement and Analysis of EFI Development Levels
4.1. Comprehensive Analysis of EFI Development Levels
From the composite index perspective, the EFI development levels across China’s ten major urban agglomerations exhibit a gradient distribution characterized by “higher in the east, lower in the west; stronger in the south, weaker in the north.” This conclusion is consistent with research hypothesis H1. As shown in Table 3, in 2024, the Pearl River Delta (0.9411) and Yangtze River Delta (0.9201) urban agglomerations firmly maintained their positions in the first tier, with index values reaching 1.18 times and 1.15 times the national average, respectively. The Beijing–Tianjin–Hebei (0.8601), Shandong Peninsula (0.8223), and West Coast of Taiwan Strait (0.8005) clusters form the second tier, slightly exceeding the national average. The Middle Yangtze River (0.7810), Chengdu–Chongqing (0.7631), and Central-Southern Liaoning (0.7202) clusters formed the third tier, while the Central Plains (0.7015) and Guanzhong (0.6843) clusters lagged significantly. Notably, the Guanzhong cluster’s index value was only 72.3% of the Pearl River Delta’s, highlighting pronounced regional imbalances. During the study period (2014–2024), all urban agglomerations demonstrated an upward trend in EFI development levels. The Chengdu–Chongqing agglomeration showed the most pronounced improvement, rising from 0.4801 in 2014 to 0.7631 in 2024—a 58% increase. The Yangtze River Delta urban agglomerations showed a relatively smaller increase, rising from 0.6843 in 2014 to 0.9201 in 2024, a 34% growth rate. This reflects the characteristic of slower growth in eastern developed regions starting from a higher baseline. The South-Central Liaoning urban agglomeration experienced slower growth due to economic restructuring. The national average rose from 0.5893 to 0.7994, achieving an annual growth rate of 3.6%. This period included a high-growth phase from 2014 to 2019 (4.1% annual average), followed by a deceleration to 3.2% after 2020. This shift reflects the transition in EFI development from scale expansion to quality enhancement.
Table 3.
Gradient classification of EFI development levels in ten major urban agglomerations.
In summary, between 2014 and 2024, the comprehensive index of EFI development across the ten major urban agglomerations exhibited a pattern of “universal improvement and solidified gradient.” The spatial distribution characteristics of the comprehensive EFI development level index for these ten urban agglomerations are as follows:
- (1)
- The eastern coastal region has formed a “Golden Triangle”: the Pearl River Delta (0.9411), the Yangtze River Delta (0.9201), and the Beijing–Tianjin–Hebei region (0.8601) constitute the core driving zone. Zhang et al. [41] note that significant spatiotemporal inequalities exist in regional green development, with factors such as fiscal resources, innovation, and industrial structure serving as key drivers. An analysis of the existing literature reveals that the eastern coastal “Golden Triangle,” leveraging ample fiscal investment and relatively advanced technological innovation, has long maintained a first-mover advantage in areas such as pollution control and public services, thereby forming a stable pattern of high-level agglomeration.
- (2)
- The central region exhibits “polarization”: the gap between the middle Yangtze River (0.7810) and the Central Plains (0.7015) reaches 10%. Zheng et al. [38] demonstrate that market-based environmental policies trigger the spatial relocation of polluting enterprises, thereby exacerbating regional environmental inequality. At the same time, fiscal imbalances, investment disparities, and differences in industrial structure are key factors contributing to the uneven supply of regional EFI. An analysis of existing literature on the causes of polarization reveals that the Middle Yangtze River urban agglomeration has benefited from the policy dividends of the Yangtze River Economic Belt, leading to faster progress in EFI. In contrast, the Central Plains urban agglomeration has been constrained by limited investment intensity and the occurrence of pollution transfer, resulting in a significant regional disparity.
- (3)
- The western region has developed a “Chengdu-Chongqing hub”: Chengdu–Chongqing (0.7631) significantly outperforms Guanzhong (0.6843), with pronounced internal regional disparities. This finding was also confirmed in the study by Liu et al. [42]. Liu et al. [42] note in their paper that a marked divergence emerged within the western region. Thanks to the support of national strategies, such as the Western Development Strategy and the Chengdu–Chongqing Economic Circle, infrastructure development in central and western regions has accelerated, whereas in the Guanzhong region and parts of Northwest China, progress in EFI has been relatively slow due to constraints imposed by geographical location and insufficient capital investment. Drawing on existing literature, the reasons for the emergence of the “Chengdu-Chongqing Hub” can be summarized as follows: the Chengdu–Chongqing urban agglomeration has benefited from major strategies such as the Western Development Strategy and the Chengdu–Chongqing Dual-City Economic Circle, leading to rapid growth in environmental protection investment. In contrast, the Guanzhong urban agglomeration has experienced relatively slow development due to constraints related to geographical location and insufficient capital investment.
- (4)
- The northeast region remains persistently sluggish: Central-Southern Liaoning (0.7202) recorded growth (3.7%) below the national average. Liu et al. [43] measured spatial inequality across China’s regions. Their findings indicate that growth rates for all indicators in the Northeast region are below the national average, with the region lagging significantly in economic development, infrastructure, and innovation, while unemployment rates are rising rapidly. This suggests that revitalization policies targeting the Northeast in recent years have had limited effectiveness, the region’s development is clearly in decline, and multidimensional spatial inequality continues to widen. An analysis of the causes behind the Northeast’s persistent economic slump reveals that, due to slowing economic growth and insufficient fiscal capacity, the region has lagged in the upgrading and renovation of EFI. Consequently, it has remained in a state of low growth for an extended period, struggling to keep pace with the national average.
4.2. Analysis of EFI Development Levels Across Dimensions
Figure 2 displays the average values across each dimension of the Environmental and Ecological Governance Index (EFI) for the top ten urban agglomerations from 2014 to 2024. Regarding pollution control levels, the Pearl River Delta urban agglomeration ranked highest (0.9234), followed by the Yangtze River Delta (0.9012), the Beijing–Tianjin–Hebei region (0.8427), and the Shandong Peninsula (0.8015). The Middle Yangtze River urban agglomeration (0.7812), Chengdu–Chongqing urban agglomeration (0.7638), and West Coast of Taiwan Strait urban agglomeration (0.7826) were at intermediate levels, while the Central-Southern Liaoning urban agglomeration (0.5215), Central Plains urban agglomeration (0.4018), and Guanzhong urban agglomeration (0.3832) were relatively low. Regarding public service capacity, the Beijing–Tianjin–Hebei urban agglomeration (0.9016) performed best, followed by the Yangtze River Delta urban agglomeration (0.8823) and the Pearl River Delta urban agglomeration (0.8527). The Middle Yangtze River urban agglomeration (0.7514), Shandong Peninsula urban agglomeration (0.7819), and Chengdu–Chongqing urban agglomeration (0.7426) follow.
Figure 2.
Average EFI composite index scores across dimensions, 2014–2024.
The West Coast of Taiwan Strait urban agglomeration (0.7632), the South-Central Liaoning urban agglomeration (0.6015), the Central Plains urban agglomeration (0.4824), and the Guanzhong urban agglomeration (0.3528) lag behind. Regarding the ecological protection levels, the Yangtze River Delta urban agglomeration (0.8927) and the Middle Yangtze River urban agglomeration (0.8531) ranked highest. The Pearl River Delta urban agglomeration (0.8715), the Beijing–Tianjin–Hebei urban agglomeration (0.8236), and the Shandong Peninsula urban agglomeration (0.7924) formed the second tier. The Chengdu–Chongqing urban agglomeration (0.8018), the West Coast of the Taiwan Strait urban agglomeration (0.6723), and the Central Plains urban agglomeration (0.6216) show moderate performance, while the Central-Southern Liaoning urban agglomeration (0.4835) and the Guanzhong urban agglomeration (0.4012) lag behind. Regarding smart management capabilities, the Pearl River Delta urban agglomeration (0.9628) and Yangtze River Delta urban agglomeration (0.9524) hold significant advantages, followed by the Beijing–Tianjin–Hebei urban agglomeration (0.8532) and the Shandong Peninsula urban agglomeration (0.7536). The Middle Yangtze River urban agglomeration (0.7218), the Chengdu–Chongqing urban agglomeration (0.7032), and the West Coast of Taiwan Strait urban agglomeration (0.7327) are at mid-range levels, while the Central and Southern Liaoning urban agglomeration (0.3524), the Central Plains urban agglomeration (0.3017), and the Guanzhong urban agglomeration (0.2823) lag significantly.
Overall, the Yangtze River Delta and the Pearl River Delta urban agglomerations maintain leading positions across all four dimensions. The Beijing–Tianjin–Hebei urban agglomeration excels in public service capacity but lags in smart management. The Middle Yangtze River urban agglomeration demonstrates significant achievements in ecological protection but faces delays in intelligent infrastructure development. The Chengdu–Chongqing urban agglomeration exhibits moderate performance across all indicators but shows rapid growth. The South-Central Liaoning, Central Plains, and Guanzhong urban agglomerations remain relatively underdeveloped in multiple dimensions.
In summary, the index characteristics of EFI development across the ten major urban agglomerations are as follows:
- (1)
- The Yangtze River Delta excels in balanced development, ranking among the top two in all four dimensions. It holds a distinct advantage in smart management and pollution control. Its EFI has entered an optimization and upgrading phase, with growth rates moderating. An analysis of the reasons revealed the following: This region exhibits a high degree of coordinated development, resulting in balanced progress across all dimensions. Furthermore, efforts to develop ecological and public service infrastructure began early and involved substantial investment. As a result, EFI has now entered a mature and optimized phase, leading to a natural slowdown in growth [60,61].
- (2)
- The Pearl River Delta leads through innovation-driven development, boasting the nation’s highest level of smart management. Core cities such as Shenzhen and Guangzhou demonstrate significant spillover effects. However, its ecological protection lags slightly behind the Yangtze River Delta, exhibiting a tendency to prioritize remediation over restoration. A study by Liu, Z., et al. [62] found that core cities such as Shenzhen and Guangzhou exhibit significant economies of scale in innovation and rank first nationally in smart management, and it confirmed a trend of decoupling between the region’s economy and its ecology and public services. Based on an analysis of the literature and actual conditions, the core cities of the Pearl River Delta exert a powerful driving force; however, early rapid industrialization led to an approach to ecological governance that focused primarily on end-of-pipe treatment, resulting in somewhat lagging investment in ecological restoration.
- (3)
- The Beijing–Tianjin–Hebei region features “outstanding public services but weak smart infrastructure.” Beijing’s role as the political center creates a resource aggregation effect, making its public service capacity (0.9016) the highest nationwide. Yet, the smart infrastructure development of the surrounding cities (0.7511) significantly trails that of the Yangtze River Delta. An analysis of the reasons revealed the following: as a core city, Beijing is home to a high concentration of public service resources, with the nation’s best healthcare, education, and administrative resources, which raises the standard of public services in the region [63].
- (4)
- The Middle Yangtze River region highlights ecological protection but suffers from severe smart development lag, with significant disparities between central cities such as Wuhan and Changsha and surrounding areas. A study by Zhang et al. [64] on the urban agglomeration in the middle reaches of the Yangtze River indicates that educational attainment, human capital, and scientific and technological resources in this region are primarily concentrated in Wuhan and Changsha. In contrast, surrounding cities have few higher education institutions, low levels of R&D investment, and insufficient technological innovation. According to this analysis, while the region has achieved notable success in ecological protection, the high concentration of advanced factors, such as educational resources, technological innovation capabilities, and human capital in central cities, such as Wuhan and Changsha, has led to delays in the development of smart infrastructure.
- (5)
- Chengdu–Chongqing exhibits “high growth rate, low baseline” characteristics, representing the fastest growth in western China but remaining constrained primarily by pollution control levels. The findings of Ding et al. [65] indicate that the industrial structure of the Chengdu–Chongqing urban agglomeration is dominated by the secondary sector, with industry accounting for a high proportion of the economy and serving as the core driver of economic growth. However, this has also led to significant environmental pressures, and the EFI in the outlying cities of Chengdu and Chongqing is inadequate. According to the literature cited in Ding et al. [65], the Chengdu–Chongqing metropolitan area has achieved rapid catch-up growth with the support of national strategies; however, because its economic growth has long relied on the secondary sector, the level of pollution control has not kept pace with economic growth.
- (6)
- The Shandong Peninsula follows an “industrial-dominated” model, with pollution control surpassing central and western regions but ecological protection constrained by traditional industries. Jiang et al. [66] confirmed through their study of the Shandong Peninsula urban agglomeration that the region relies on the secondary sector as its pillar, featuring a typical industrial-dominated economic structure. Furthermore, the proportion of government environmental protection investment in the Shandong Peninsula urban agglomeration is high, with environmental expenditures significantly exceeding the average levels in central and western China. This study effectively helps explain why, while the Shandong Peninsula has achieved outstanding results in environmental governance, its potential for improving regional ecological protection remains limited due to constraints imposed by path dependence on traditional industrial models and a high-energy-consumption industrial structure.
- (7)
- The West Coast of the Taiwan Strait shows balanced but unremarkable indicators across all metrics, with limited dual-core driving effect from Xiamen and Fuzhou. Lin et al. [67] reached the following conclusions regarding the West Coast of the Taiwan Strait urban agglomerations: the region features a light industrial structure with no heavy industry; the weights of the four subsystems of ecological and environmental pressure (resources, energy consumption, pollution emissions, and environmental response) are very close, with no single factor holding an absolute advantage; the internal structure of urbanization quality is balanced; and core cities have not generated innovation spillovers. According to the study by Lin et al. [67], it is evident that the region is dominated by light industry and lacks high-level industries. While economic urbanization makes the greatest contribution, its intensity is insufficient. Consequently, the region’s development exhibits an overall characteristic of being “balanced but unremarkable.” Furthermore, although Fuzhou and Xiamen serve as the regional core cities, their capacity for radiating and driving development is limited.
- (8)
- Central and Southern Liaoning lags comprehensively across all four dimensions due to difficulties in transforming its old industrial base, with particularly weak smart development. A study by Zhang et al. [68] on the Central-Southern Liaoning Urban agglomerations confirms that, as a traditional industrial base, the region has long faced transformation challenges, such as a rigid industrial structure and a continuous outflow of talent, and the long-term impact of policies aimed at revitalizing Northeast China has been limited. As a result, the Central-Southern Liaoning urban agglomerations lag behind major urban agglomerations nationwide across all dimensions, exhibiting a pattern of comprehensive underdevelopment. At the same time, its R&D investment, higher education resources, and science and technology expenditure are all lower than those of urban agglomerations nationwide [68], indicating a comprehensive shortage of the talent, capital, and technology most essential for intelligent transformation.
- (9)
- As development laggards, the Central Plains and Guanzhong regions heavily rely on policy support for infrastructure construction, with Guanzhong’s smart development deficiencies being most pronounced. Both the Central Plains urban agglomerations and the Guanzhong Plain urban agglomerations are lagging regions in China’s regional development, characterized by weak overall economic foundations and urbanization rates below the national average. Furthermore, their infrastructure development relies heavily on national policy support and fiscal transfers from higher-level governments, and they possess limited capacity for independent development and self-renewal [69]. Furthermore, Xi An dominates the region, while surrounding cities have virtually no smart infrastructure. Resources in scientific and technological innovation and higher education have not been transformed into digital capabilities, resulting in a lack of technological foundations for smart development [70].
5. Regional Variations in EFI Development Levels
Based on the calculated levels of EFI development, this study further computed the overall mean Gini coefficient for the EFI development levels of China’s ten major urban agglomerations from 2014 to 2024, which stood at 0.3126. The trend exhibited an inverted U-shape, rising initially before declining, as shown in Figure 3. The coefficient reached its minimum value of 0.2984 in 2016 and its maximum value of 0.3357 in 2020. Specifically, the Gini coefficient rose steadily from 0.3052 in 2014 to its peak in 2020, then gradually declined to 0.3083 by 2024. This reflects a regional disparity that first widened and then narrowed over time.
Figure 3.
Overall Gini coefficient of EFI development levels.
5.1. Analysis of Regional Variations
Based on the average values during the study period, the Beijing–Tianjin–Hebei urban agglomerations exhibited the highest regional disparity in EFI development levels, with a Gini coefficient of 0.3215. This was followed by the Central and Southern Liaoning urban agglomeration (0.2987), the Chengdu–Chongqing urban agglomeration (0.2654), the West Coast of the Taiwan Strait urban agglomeration (0.2512), the Central Plains urban agglomeration (0.2418), the Pearl River Delta urban agglomeration (0.2365), the Middle Yangtze River urban agglomeration (0.2283), the Guanzhong urban agglomeration (0.2156), and the Shandong Peninsula urban agglomeration (0.2093). The Yangtze River Delta urban agglomeration exhibited the smallest intra-regional disparity at 0.1872.
Although the Beijing–Tianjin–Hebei urban agglomeration maintained the highest disparity level, its intra-regional Gini coefficient decreased from 0.3489 in 2014 to 0.3012 in 2024, driven by the “Capital Function Diversion” policy. During the study period, intra-regional disparities in the Liaoning Central-Southern, Central Plains, and Guanzhong urban agglomerations showed fluctuating upward trends: South-Central Liaoning (+12.37%, average annual increase of 1.24%), Central Plains (+8.92%, average annual increase of 0.89%), and Guanzhong (+6.45%, average annual increase of 0.65%). The Yangtze River Delta, Chengdu–Chongqing, Pearl River Delta, and Beijing–Tianjin–Hebei urban agglomerations exhibited declining trends: Yangtze River Delta (−15.28%, average annual decrease of 1.53%), Chengdu–Chongqing (−13.74%, average annual decrease of 1.37%), Pearl River Delta (−9.63%, average annual decrease of 0.96%), Beijing–Tianjin–Hebei urban agglomerations (−7.85%, average annual decrease of 0.79%).
The Yangtze River Delta, a model of balanced development, achieved the lowest and most sustained improvement in disparities through “infrastructure integration.” The Chengdu–Chongqing cluster saw a significant reduction in disparities (−13.74%), primarily due to coordinated resource allocation under the “dual-city economic circle” strategy. Meanwhile, older industrial zones like Central-Southern Liaoning require balanced investment in upgrading environmental facilities, while the Central Plains cluster should guard against the risk of widening regional disparities.
5.2. Interregional Variation Analysis
Table 4 presents the average regional disparities in EFI development levels across the top ten urban agglomerations from 2014 to 2024. It reveals that the Pearl River Delta and Guanzhong urban agglomerations exhibit the greatest disparity in EFI, with an average difference of 0.5123 during the sample period. Comparative analysis of the data reveals the following primary reasons: The Pearl River Delta region has long held a distinct advantage in environmental technology R&D, innovative applications, and fiscal investment, whereas the western region remains relatively weak in terms of technology transfer capabilities and financial support, resulting in a notable imbalance in resource allocation across regions. This is highly consistent with the empirical findings of scholars such as Xiong, N. [13], who used a multi-period difference-in-differences model to demonstrate that the eastern regions, leveraging stronger technological innovation capabilities and stable capital investment, can effectively amplify policy effects. The central and western regions, constrained by low technology transfer efficiency and insufficient R&D investment intensity, struggle to fully unleash their growth potential. Second, the Pearl River Delta cluster exhibits significant disparities with the Central Plains, Middle Yangtze, Chengdu–Chongqing, Liaoning Central-South, and West Coast of Taiwan Strait clusters, with annual average differences of 0.4787, 0.4628, 0.4512, 0.4372, and 0.3965, respectively. The Yangtze River Delta urban agglomerations and the Shandong Peninsula urban agglomerations exhibited the smallest EFI gap, with an average value of 0.1639.
Table 4.
Average regional differences in EFI development levels, 2014–2024.
In terms of trend changes, the Chengdu–Chongqing urban agglomerations and the Guanzhong urban agglomerations showed the largest reduction in EFI disparity at 18.25%. This improvement stemmed from the construction of the “Western Land-Sea New Channel,” which facilitated the joint development and shared use of environmental protection facilities. For instance, three cross-regional hazardous waste treatment centers were completed in 2022. The disparities between the Middle Yangtze River urban agglomeration and the Central Plains urban agglomeration, the Yangtze River Delta urban agglomeration and the Central Plains urban agglomeration, the Central Plains urban agglomeration and the South-Central Liaoning urban agglomeration, the Yangtze River Delta urban agglomeration and the Guanzhong urban agglomeration, and the Pearl River Delta urban agglomeration and the Central Plains urban agglomeration remained largely unchanged. The regional disparities in EFI between the Pearl River Delta and South-Central Liaoning, between the Yangtze River Delta and South-Central Liaoning, and between the South-Central Liaoning and Shandong Peninsula urban agglomerations showed significant increases of 28.37%, 26.15%, and 24.82%, respectively. This widening gap also reflects the challenges faced by the transformation of the Northeast’s old industrial bases.
5.3. Sources of Regional Differences and Contributions
Table 5 presents the decomposition results of regional differences in EFI development levels across China’s ten major urban agglomerations. The findings indicate that inter-regional hyper-variability density contributes the most, with an average of 68.37%. It can be observed that environmental technology spillovers from developed urban agglomerations (such as the Yangtze River Delta) exhibit a distinct distance-dependent decay pattern: the closer the geographical distance, the stronger the technology spillover and knowledge diffusion effects; conversely, the further the distance, the more significantly these spillover effects diminish. This conclusion is highly consistent with existing research: regional green technology innovation, environmental governance experience, and environmental industry spillovers all exhibit significant spatial distance-dependent decay. Neighboring regions are more likely to achieve technological catch-up through factor mobility, industrial linkages, and policy imitation, whereas distant regions struggle to fully benefit from technological spillovers. Next is the contribution from inter-regional net differences, averaging 22.15%. Intra-regional differences contributed the least, averaging 9.48%. From a dynamic perspective, the contribution rate of inter-regional hyper-variable density increased by 4.84 percentage points during the study period (rising from 65.28% in 2014 to 70.12% in 2024).
Table 5.
Regional contribution rates to EFI levels in the top ten urban agglomerations, 2014–2024.
This reflects intensifying divergence in urban agglomeration development models (e.g., the Pearl River Delta shifts toward smart environmental protection, while Central and Southern Liaoning remains in the traditional governance phase). The contribution rate of intra-regional differences decreased by 1.12 percentage points (from 10.05% in 2014 to 8.93% in 2024). Research indicates that the interactive effects between urban agglomerations are a key driver of overall EFI disparities. Studies by Zhou et al. suggest that factors such as the intensity of environmental regulations and technological innovation in neighboring cities exert significant influences on local cities through channels such as technology diffusion and knowledge spillovers. This finding is highly consistent with the conclusions of this paper, implying that overall EFI disparities are not determined by individual cities acting in isolation, but rather result from the combined effects of interactions between urban agglomerations and knowledge spillovers. This suggests that strengthening collaborative development mechanisms among urban agglomerations should be a priority in narrowing overall EFI disparities.
6. Spatial Convergence Analysis of EFI Development Levels
6.1. Spatial Correlation Test
This study calculated the global Moran’s I index for EFI level across China’s ten major urban agglomerations from 2014 to 2024. The results are presented in Table 6. The results indicate that the global Moran’s I values for EFI remained positive throughout the study period (ranging from 0.352 to 0.418) and passed statistical significance tests at the 1% level. This demonstrates a significant spatial positive correlation in EFI development levels, exhibiting distinct spatial clustering patterns: (1) “High-High” agglomeration zones are primarily distributed in the Yangtze River Delta (Moran’s I = 0.405) and Pearl River Delta urban agglomerations (Moran’s I = 0.398), forming a high-quality development cluster along the eastern coast. These regions achieve synergistic enhancement of EFI through technological innovation spillover effects and coordinated development of environmental industries. (2) “Low-Low” agglomeration zones are concentrated in the Guanzhong region (Moran’s I = 0.367) and the Central Plains urban agglomerations (Moran’s I = 0.359), reflecting the overall lag in EFI development across western China.
Table 6.
Global Moran’s I index for EFI levels, 2014–2024.
This spatial clustering pattern exhibits high consistency with regional economic development levels (a Pearson correlation coefficient of 0.82). Significant positive spatial spillover effects (, ) indicate pronounced environmental governance synergies between adjacent urban agglomerations.
6.2. Spatial -Convergence Analysis
6.2.1. Absolute -Convergence Analysis in Space
To analyze whether the EFI development level exhibits spatial absolute convergence, model selection should be conducted among OLS, SDM, SAR, and SEM models. To select an appropriate model, this study performed LM tests. The test results are shown in Table 7. The LM-lag statistic is 12.874 and significant at the 1% level; the robust LM-lag statistic is 9.621 and significant at the 1% level. The LM-err statistic is 1.843, and the robust LM-err statistic is 1.352, both of which are not significant at the 10% level. Therefore, the LM-ERR statistic fails to pass the significance test at the 10% level, while the LM-LAG statistic is significant at the 1% level. According to the selection criteria of spatial econometric models, the SAR model was chosen in this paper.
Table 7.
LM tests for spatial dependence.
Table 8 presents the spatial absolute convergence test results for China’s overall EFI development level and that of its ten major urban agglomerations. The findings reveal that: (1) Both China’s overall EFI development level and that of its ten major urban agglomerations exhibit significant spatial absolute convergence. The absolute coefficients for both China as a whole and its ten major urban agglomerations are negative and pass the significance test at the 1% level. This indicates that, without considering other external factors, the EFI development levels across urban agglomerations will gradually converge toward balanced growth. (2) Significant differences exist in the absolute convergence rates among different urban agglomerations. Among them, the Chengdu–Chongqing urban agglomeration ( = −0.218) and the Middle Yangtze River urban agglomeration ( = −0.195) exhibit the fastest absolute convergence rates, primarily benefiting from the implementation of regional coordinated development strategies. In contrast, developed regions such as the Yangtze River Delta ( = −0.087) and the Pearl River Delta ( = −0.095) exhibit relatively slower absolute convergence rates, as they have approached the frontier of development.
Table 8.
Results of spatial absolute β convergence test (SAR model).
6.2.2. Spatial Conditions Convergence Analysis
The spatial condition convergence analysis for EFI construction levels requires model selection among OLS, SDM, SAR, and SEM. To choose the appropriate model, an LM test was also conducted here. The results indicate that LM-ERR failed to pass the significance test at the 10% level, while LM-LAG passed at the 1% level. Therefore, the SAR model was selected for spatial condition convergence.
This paper estimates the spatial conditional convergence of China’s overall and ten major urban agglomerations’ EFI development levels, with results presented in Table 9. The regression results of control variables are shown in Table 10. The main conclusions are as follows: First, the spatial condition coefficients for both China as a whole and its ten major urban agglomerations are negative and pass the significance test at the 1% level. This indicates that after controlling for influencing factors such as economic development level, environmental regulation intensity, and technological innovation capacity, the EFI development levels of each urban agglomeration tend toward a steady state, exhibiting a significant convergence trend.
Table 9.
Spatial condition convergence test results (SAR model).
Table 10.
Regression results of control variables.
Second, the convergence rates of different urban agglomerations vary significantly. The Chengdu–Chongqing, Middle Yangtze River, and Central Plains urban agglomerations exhibit faster rates of conditional convergence, primarily due to improved regional collaborative governance mechanisms and sustained increases in environmental protection investments. In contrast, the Yangtze River Delta, Pearl River Delta, and Beijing–Tianjin–Hebei urban agglomerations, characterized by higher development levels and relatively limited room for improvement, demonstrate slower conditional convergence rates. This finding further validates the “catch-up effect” in EFI development, providing scientific basis for formulating targeted regional environmental policies.
Convergence rate calculation formula:
R2 values exceed 0.75, indicating good model fit.
The control variables are included.
All models control for city fixed effects and use the Queen adjacency spatial weight matrix.
The spatial lag coefficient is significantly positive at the 1% level in all regressions.
7. Discussion
Based on panel data from 138 cities across China’s top ten urban agglomerations from 2014 to 2024, this study systematically examines the spatiotemporal patterns, regional disparities, and spatial convergence characteristics of EFI development. Overall, the three research hypotheses proposed in this study were validated to varying degrees; while some conclusions align with theoretical expectations, certain divergent patterns were also observed.
From an overall spatiotemporal perspective, China’s EFI level has continued to improve and exhibits a stable gradient distribution characterized by “higher levels in the east and lower levels in the west, and stronger development in the south and weaker development in the north.” The EFI levels of the Pearl River Delta and Yangtze River Delta urban agglomerations are far above the average, while those of the Beijing–Tianjin–Hebei, Shandong Peninsula, and West Coast of the Taiwan Strait urban agglomerations are slightly above the national average. In contrast, the EFI levels of the Central Plains and Guanzhong urban agglomerations are below the average. This pattern is highly correlated with regional economic levels, fiscal investment capacity, and the stage of urbanization. These findings are largely consistent with the conclusions of studies on spatial inequality in China’s infrastructure by Zheng et al. [38], Zhang et al. [41], and Liu et al. [42], indicating that as a typical public facility, the supply level of EFI is highly dependent on local economic foundations and long-term investment accumulation, making it more prone to concentrate resources in advantaged regions. However, unlike traditional infrastructure research, this study finds that the gradient pattern of EFI is not simply determined by economic levels; regional disparities in the smart management dimension are significantly higher than in other dimensions. This suggests that smart management capabilities are becoming a key factor in reshaping regional disparities in EFI, a point that has rarely been identified separately in previous literature. This implies that future regional coordination must not only address hardware deficiencies but also accelerate the equalization of digital environmental protection capabilities.
The analysis of regional disparities and their decomposition reveals that the overall Gini coefficient follows an “inverted U-shaped” trajectory, meaning that regional disparities first widened and then narrowed. This trend aligns with the theoretical expectations of the Environmental Kuznets Curve (EKC) in the infrastructure sector and corroborates the finding by Liu et al. [43] that spatial inequality in infrastructure exhibits an inverted U-shaped pattern as development levels rise. During the period of rapid infrastructure expansion from 2014 to 2020, local governments prioritized scale growth, leading to a continuous widening of inter-regional disparities; after 2020, with the implementation of policies such as the regional coordinated development strategy, ecological compensation mechanisms, and joint prevention and control of water basins, these disparities gradually narrowed. A decomposition of the sources of disparities revealed that the contribution of inter-regional super-variation density reached 68.37%, making it the primary source of EFI gaps. This conclusion validates hypothesis H2 of this study, revealing that interactions among urban agglomerations and spatial spillovers are key factors driving inequality. According to the conclusions of existing research and the empirical results of this paper, the following reasonable inferences can be drawn: Green technology diffusion, governance experience sharing, and environmental protection investment all exhibit significant spatial distance-decay characteristics. Adjacent regions are more likely to catch up, while distant regions struggle to share such spillover benefits. The contribution rate results of this study provide direct support for this finding. This suggests that the regional imbalance in China’s EFI is not merely a horizontal gap between isolated cities. To promote balanced development, it is essential to strengthen cross-regional coordination mechanisms rather than relying solely on increased investment by individual cities.
The spatial correlation and convergence analysis reveals a significantly positive global Moran’s I for EFI levels, confirming the spatial positive spillover effect proposed in research hypothesis H2. High-value clusters are concentrated in the eastern coastal urban agglomerations, while low-value clusters are concentrated in the northwest and central plains regions; this clustering pattern has remained stable over the long term. In both the absolute convergence and conditional convergence models, all urban agglomerations exhibited significant convergence characteristics, indicating that a catch-up effect does indeed exist in regions with lower levels of development, thereby supporting research hypothesis H3. Notably, the convergence rates of central and western urban agglomerations, such as Chengdu–Chongqing and the Middle Yangtze River region, were significantly faster than those of eastern regions like the Yangtze River Delta and the Pearl River Delta. This aligns with the findings in Liu et al. [51], who concluded that infrastructure growth is faster in central and western regions, and that regional disparities are gradually narrowing. This also reflects the catalytic role of major national regional strategies in driving the development of less developed regions. However, the heterogeneity in convergence rates also suggests that eastern urban agglomerations are shifting more toward efficiency improvements and optimization, while less developed regions remain in a phase of rapid scale expansion. As these two groups follow distinct development paths, policy tools should be tailored accordingly.
Based on the empirical findings of this paper, and taking into account differences in regional development stages and the patterns of spatial spillover, we propose four targeted policy implications.
First, establish a cross-regional collaborative governance mechanism to address disparities caused by inter-regional interactions. This study’s conclusions indicate that spatial imbalances in EFI are not determined solely by the level of development within individual cities, but are jointly driven by factors such as technological spillovers between urban agglomerations. To address this, administrative boundaries should be transcended to establish a unified system for the planning, construction, operation, and monitoring of EFI at the urban agglomeration level, thereby promoting the joint construction and sharing of EFI. At the same time, high-level regions such as the Beijing–Tianjin–Hebei, the Yangtze River Delta, and the Pearl River Delta should strengthen their technological output and assistance to central and western regions.
Second, implement targeted policies tailored to the classification of urban agglomerations to promote differentiated improvements in quality and efficiency. The convergence analysis in this paper indicates that different urban agglomerations are at distinctly different stages of development, with significant variations in their pathways for improvement and areas of weakness. Eastern coastal urban agglomerations, such as the Yangtze River Delta and the Pearl River Delta, have entered a phase of high-quality optimization; policy priorities should therefore shift toward intelligent upgrading, enhanced operational efficiency, and equalization of services. The Beijing–Tianjin–Hebei region excels in public services but lags in smart city development; efforts should focus on extending smart management mechanisms to smaller cities and fostering coordination between core cities and surrounding areas. The Middle Yangtze River region is behind in smart city development and needs to address shortcomings in smart management. Lagging regions such as Chengdu–Chongqing, the Central Plains, Guanzhong, and South-Central Liaoning are converging rapidly but start from a low baseline; they should continue to expand environmental protection investments while simultaneously advancing the development of basic public service infrastructure.
Third, accelerating the transition to smart and digital systems can effectively narrow regional disparities and promote more balanced EFI development. The analysis across four dimensions reveals that regional disparities in smart management capabilities are the most pronounced and have become a key factor in widening the gap in EFI. Urban agglomerations in the eastern regions hold significant advantages in areas such as smart environmental protection platforms, while the central and western regions lag in digital capabilities. In response, the digital transformation of EFI should be incorporated into key priorities. Support should be provided to central and western regions for the deployment of smart environmental protection systems, and mature technologies and governance models from eastern regions should be promoted to narrow regional disparities in governance capabilities through technological innovation.
Fourth, institutional safeguards for the balanced development of EFI must be strengthened. The spatial econometric results in this paper confirm that EFI exhibits significant spatial agglomeration and positive spillover effects; traditional policy designs based on single administrative units struggle to fully unlock the benefits of synergy. Therefore, regional coordination indicators for EFI should be established to guide local governments in shifting from “individual development” to “collaborative win-win outcomes.” For urban agglomerations such as Central-Southern Liaoning, the Central Plains, and the Guanzhong region, where internal disparities continue to widen, provincial-level coordination should be strengthened, the proportion of fiscal funds allocated to lagging cities should be increased, and the radiating and driving role of central cities should be enhanced.
8. Conclusions
This study examines 138 cities across China’s ten major urban agglomerations and constructs a comprehensive evaluation index system for EFI encompassing four dimensions: pollution control, public services, ecological protection, and smart management. It systematically reveals the spatiotemporal patterns, regional disparities, and convergence characteristics of EFI levels from 2014 to 2024. This study found that during the sample period, the level of China’s urban EFI exhibited a stable spatial gradient characterized by “higher levels in the east and lower levels in the west, and stronger performance in the south and weaker in the north.” More importantly, this study found that regional imbalances primarily stem from spatial interactions and spillover effects among urban agglomerations, rather than isolated issues within individual regions. Additionally, the research confirmed that EFI development exhibits significant spatial positive correlations and agglomeration characteristics. Furthermore, the convergence rate in late-developing regions such as the Chengdu–Chongqing and Middle Yangtze River areas was significantly faster than that in early-developing regions such as the Yangtze River Delta and Pearl River Delta, highlighting the divergent development paths of different regions. This study clearly delineates the spatiotemporal evolution patterns of China’s EFI, identifying the key sources of regional disparities and convergence characteristics. This not only deepens theoretical understanding of the patterns of regional imbalance in EFI but also provides empirical support for the coordinated advancement of environmental governance across urban agglomerations. Based on the empirical findings, this study offers clear policy implications for promoting the balanced and coordinated development of EFI. These implications can directly guide local governments in formulating differentiated EFI development strategies tailored to their specific stages of development and structural weaknesses, thereby contributing to the achievement of high-quality, sustainable regional development. This study has certain limitations. These indicators under the public service dimension reflect broad public service support conditions rather than strictly the hardware components of EFI. Although these indicators are included based on public goods theory to represent the supporting environment, the comprehensive index may still partly capture spillover effects from general public services. Future research may further construct a more focused EFI hardware indicator system and conduct robustness checks accordingly.
Author Contributions
H.L.: conceptualization, writing—original draft. D.C.: methodology. P.L.: data curation. All authors have read and agreed to the published version of the manuscript.
Funding
This research project was funded by the Jiangsu Provincial Department of Education (fund number: 2024SJYB1614), the Zhenjiang Municipal Science and Technology Bureau (fund number: RK2025019), and the Ministry of Education of the People’s Republic of China (fund number: 25YJC630057).
Institutional Review Board Statement
Not applicable.
Informed Consent Statement
Not applicable.
Data Availability Statement
All data generated or analyzed during this study are included in this published article.
Acknowledgments
The authors would like to express sincere gratitude to the anonymous reviewers and editors for their constructive comments and suggestions, which significantly improved the quality of this paper. We also thank the research team members for their valuable contributions to the field investigation and data collection of this study, and the relevant administrative departments for providing the necessary research data and technical support.
Conflicts of Interest
The authors declare no competing interests.
References
- Li, X.J.; Liu, Y.S.; Li, M.M.; Jim, C.Y. A performance evaluation system for PPP sewage treatment plants at the operation-maintenance stage. KSCE J. Civ. Eng. 2023, 27, 1423–1440. [Google Scholar] [CrossRef] [Scilit]
- Feng, H.Y.; Xu, J.R.; Shi, J.; Wang, Z.Y.; Li, Q.; Yang, M.J.; Shi, W.; Zhang, X.B. Resource and environmental benefits of reclaimed water reuse: Evidence from the northern arid and semiarid region of China. Sustain. Cities Soc. 2025, 135, 106989. [Google Scholar] [CrossRef] [Scilit]
- Sen, K.; Pearsall, H.; Gutierrez-Velez, V.H.; Gilbert, M.R. Measuring Equity through Spatial Variability of Infrastructure Systems across the Urban-Rural Gradient. Land 2021, 10, 1202. [Google Scholar] [CrossRef] [Scilit]
- Milligan, R.; Adams, E.A.; Wheeler, C.; Raulerson, S.; Vermillion, N. The hydro-racial fix in infrastructural regions: Atlanta’s situation in a regional water governance conflict. Territ. Politics Gov. 2024, 12, 866–883. [Google Scholar] [CrossRef] [Scilit]
- Figueroa, J.L.; Velasco-Becerril, O.G.; Cole, F.; Gordon, T.; Figueroa-Morales, J.C.; Rodríguez-Atristain, A.; Boudart, Z.; Sánchez, B.; Roberts, E.F.S.; Téllez-Rojo, M.M. The two sides of water access inequality in Mexico: North vs. south, rich vs. poor. Salud Pública México 2025, 67, 738–746. [Google Scholar] [CrossRef] [Scilit]
- Ketchoua, G.S.; Arogundade, S.; Bila, S.; Nkosi, N.P. Infrastructure and the path to sustainability: How governance shapes development outcomes in Africa. Sustain. Dev. 2026, 34, 1020–1042. [Google Scholar] [CrossRef] [Scilit]
- Goodwin, K.; Li, M.; Wiedmann, T. Exploring the safe and just space for urban and regional Australia. NPJ Urban Sustain. 2025, 5, 24. [Google Scholar] [CrossRef] [Scilit]
- Wang, J.X.; Zhou, S.; Huang, T.; Ling, Z.L.; Liu, Y.; Song, S.J.; Ren, J.; Zhang, M.L.; Yang, Z.L.; Wei, Z.J.; et al. Air pollution and associated health impact and economic loss embodied in inter-provincial electricity transfer in China. Sci. Total Environ. 2023, 883, 163653. [Google Scholar] [CrossRef] [Scilit]
- Li, H.P.; Zhou, B.Q.; Li, Y.X.; Zhou, T.; Hu, M.X.; Huang, H.; Wang, Y.J.; Pang, W.H. Provincial responsibilities and compensations in water pollutant transfers in China. Process Saf. Environ. Prot. 2025, 195, 106739. [Google Scholar] [CrossRef] [Scilit]
- Wei, H.B.; Qiu, H.J.; Liu, J.; Li, W.; Zhao, C.C.; Xu, H.F. Evaluation and source identification of water pollution. Ecotoxicol. Environ. Saf. 2025, 289, 117499. [Google Scholar] [CrossRef] [Scilit]
- Fakoyede, S.J.; Babalola, F.E.; Ekundayo, S.K.; Alabi, D.O. Improving equitable access to library resources in tertiary institutions: Overcoming policy, infrastructure, and socio-cultural barriers. J. Acad. Librariansh. 2026, 52, 103219. [Google Scholar] [CrossRef] [Scilit]
- Tu, Y.; Chen, B.; Liao, C.; Wu, S.B.; An, J.F.; Lin, C.; Gong, P.; Chen, B.; Wei, H.; Xu, B. Inequality in infrastructure access and its association with health disparities. Nat. Hum. Behav. 2025, 9, 1669–1682. [Google Scholar] [CrossRef] [Scilit]
- Xiong, N.; Wong, S.W.; Ren, Y.T.; Shen, L.Y. Regional disparity in urbanizing China: Empirical study of unbalanced development phenomenon of towns in southwest China. J. Urban Plan. Dev. 2020, 146, 05020013. [Google Scholar] [CrossRef] [Scilit]
- Feng, D.Y.; Meng, X.J.; Zhang, H.Y.; Zhou, M.H.; Chai, Y.Y.; Liu, M.X. The progress and spatiotemporal heterogeneity evaluation of China’s ecological civilization. Ecol. Indic. 2026, 185, 114746. [Google Scholar] [CrossRef] [Scilit]
- Li, S.; Lin, Z.; Wu, Y.; Hu, Y. Measurement, Regional Disparities, and Spatial Convergence in the Symbiotic Level of China’s Digital Innovation Ecosystem. Systems 2025, 13, 254. [Google Scholar] [CrossRef] [Scilit]
- Tian, P.; Gao, Z.; Hao, Y. A Study on the Distribution Dynamics, Regional Disparities, and Convergence of China’s Energy Transition. Energies 2024, 17, 2842. [Google Scholar] [CrossRef] [Scilit]
- Wang, J.; Ulibarri, N.; Scott, T.A.; Davis, S.J. Environmental justice, infrastructure provisioning, and environmental impact assessment: Evidence from the California Environmental Quality Act. Environ. Sci. Policy 2023, 146, 66–75. [Google Scholar] [CrossRef] [Scilit]
- Erdogdu, S. Landfill gas to energy beyond an age of waste: A review of research trends. Curr. Opin. Green Sustain. Chem. 2025, 53, 101019. [Google Scholar] [CrossRef] [Scilit]
- Gao, C.Q.; Bian, R.X.; Jiang, H.Y.; Yin, C.Y.; Zhu, R.Z.; Han, H.R.; Sun, Y.J.; Wang, Y.N. Greenhouse gas emissions analysis from industrial hazardous waste treatment: A case study in Qingdao, China. Waste Manag. Res. 2026, 44, 65–75. [Google Scholar] [CrossRef] [Scilit]
- Alderson, R.; van Leeuwen, C.H.A.; Bakker, E.S.; Bouma, K.; Olff, H.; Reijers, V.C.; Weideveld, S.T.J.; Robroek, B.J.M.; Jin, H.; Lamers, L.P.M.; et al. Active wetland restoration kickstarts vegetation establishment, but natural development promotes greater plant diversity. J. Appl. Ecol. 2025, 62, 1166–1176. [Google Scholar] [CrossRef] [Scilit]
- Robaina, M.; Oliveira, A.; Lima, F.; Ramalho, E.; Miguel, T.; López-Maciel, M.; Roebeling, P.; Madaleno, M.; Dias, M.F.; Meireles, M.; et al. Analysis of NECP-based scenarios for the implementation of wind and solar energy facilities in Portugal. Energy 2025, 324, 135734. [Google Scholar] [CrossRef] [Scilit]
- Yu, I.; Park, K.; Lee, E.H. Flood Risk Analysis by Building Use in Urban Planning for Disaster Risk Reduction and Climate Change Adaptation. Sustainability 2021, 13, 13006. [Google Scholar] [CrossRef] [Scilit]
- Franco, A.; Crisostomi, E.; Dalmiani, S.; Poletti, R. Synergy in Action: Integrating Environmental Monitoring, Energy Efficiency, and IoT for Safer Shared Buildings. Buildings 2024, 14, 1077. [Google Scholar] [CrossRef] [Scilit]
- Moon, H.; Lee, H.Y.; Kim, B.; Kim, Y. Urban Hydrogen Production Model Using Environmental Infrastructuresto Achieve the Net Zero Goal. Energies 2022, 15, 9293. [Google Scholar] [CrossRef] [Scilit]
- Sun, X.X. The impact of digital infrastructure on energy-environmental efficiency: Empirical evidence from China. Front. Energy Res. 2023, 11, 1277333. [Google Scholar] [CrossRef] [Scilit]
- Li, J.B.; Li, X.; Liu, H.; Gao, L.; Wang, W.T.; Wang, Z.Y.; Zhou, T.; Wang, Q.L. Climate change impacts on wastewater infrastructure: A systematic review and typological adaptation strategy. Water Res. 2023, 242, 120282. [Google Scholar] [CrossRef] [Scilit]
- Nazari, R.; Vasiliadis, H.; Karimi, M.; Fahad, M.G.R.; Simon, S.; Zhang, T.; Sun, Q.; Peters, R. Hydrodynamic Study of the Impact of Extreme Flooding Events on Wastewater Treatment Plants Considering Total Water Level. Nat. Hazards Rev. 2022, 23, 04021056. [Google Scholar] [CrossRef] [Scilit]
- Zhou, F.X.; Li, L.; Wen, H.W. Regional digital infrastructure and carbon neutrality: A technology-structure-efficiency perspective. Energy Strategy Rev. 2024, 56, 101583. [Google Scholar] [CrossRef] [Scilit]
- Duanmu, X.; Yu, J.T.; Yuan, X.Y.; Zhang, X.C. How Does Digital Infrastructure Mitigate Urban-Rural Disparities? Sustainability 2025, 17, 1561. [Google Scholar] [CrossRef] [Scilit]
- Xu, C.Q.; Huang, J.R.; Xiao, Y.X.; Jia, T.Y.; Zhu, Y.F.; Li, X.F.; Jia, H.F. Stormwater management model based cost-benefit analysis of integrated grey-green infrastructure scenarios. Front. Environ. Sci. Eng. 2025, 19, 62. [Google Scholar] [CrossRef] [Scilit]
- Wang, Y.Y.; Cai, Y.P.; Xie, Y.L.; Chen, L.; Zhang, P. An integrated approach for evaluating dynamics of urban eco-resilience in urban agglomerations of China. Ecol. Indic. 2023, 146, 109859. [Google Scholar] [CrossRef] [Scilit]
- Korkou, M.; Tarigan, A.K.M.; Hanslin, H.M. The multifunctionality concept in urban green infrastructure planning: A systematic literature review. Urban For. Urban Green. 2023, 85, 127975. [Google Scholar] [CrossRef] [Scilit]
- Wen, H.W.; Shang, J.J.; Nghiem, X.H. Can new-type infrastructure lead to regional green well-being? Evidence from China. J. Environ. Manag. 2025, 373, 123915. [Google Scholar] [CrossRef] [Scilit] [PubMed]
- Chang, H.S.; Lin, Z.H.; Hsu, Y.Y. Planning for green infrastructure and mapping synergies and trade-offs: A case study in the Yanshuei River Basin, Taiwan. Urban For. Urban Green. 2021, 65, 127325. [Google Scholar] [CrossRef] [Scilit]
- Stroink, M.L. The dynamics of psycho-social-ecological resilience in the urban environment: A complex adaptive systems theory perspective. Front. Sustain. Cities 2020, 2, 31. [Google Scholar] [CrossRef] [Scilit]
- Nassani, A.A.; Yousaf, Z.; Radulescu, M.; Balsalobre-Lorente, D.; Hussain, H.; Haffar, M. Green Innovation through Green and Blue Infrastructure Development: Investigation of Pollution Reduction and Green Technology in Emerging Economy. Energies 2023, 16, 1944. [Google Scholar] [CrossRef] [Scilit]
- Shi, C.Y.; Xia, Y.; Qiu, H.; Wang, X.Y.; Zhou, Y.; Li, Y.; Liu, G.; Li, S.W.; Gao, W.J.; Xu, T.Y.; et al. Exploring public attitudes toward implementing green infrastructure for sponge city stormwater management. Sci. Rep. 2024, 14, 24252. [Google Scholar] [CrossRef] [Scilit]
- Zheng, S.; Yao, R.; Zou, K. Provincial environmental inequality in China: Measurement, influence, and policy instrument choice. Ecol. Econ. 2022, 200, 107537. [Google Scholar] [CrossRef] [Scilit]
- Pearsall, H.; Gutierrez-Velez, V.H.; Gilbert, M.R.; Hoque, S.; Eakin, H.; Brondizio, E.S.; Solecki, W.; Toran, L.; Baka, J.E.; Behm, J.E.; et al. Advancing equitable health and well-being across urban–rural sustainable infrastructure systems. npj Urban Sustain. 2021, 1, 26. [Google Scholar] [CrossRef] [Scilit]
- Wang, H.; Huang, Z.Y.; Liang, Y.Q.; Zhang, Q.X.; Hu, S.X.; Cui, L.Y.; An, X.Y. Dynamic evolution of urban infrastructure resilience and its spatial spillover effects: An empirical study from China. PLoS ONE 2023, 18, e0282194. [Google Scholar] [CrossRef] [Scilit] [PubMed]
- Zhang, X.; Liu, Z.; Rodenbiker, J.; Tao, X.; Liu, T. Spatiotemporal inequality in green urban transition: Socioeconomic drivers and differentiated impacts of cities in China. Habitat Int. 2025, 166, 103618. [Google Scholar] [CrossRef] [Scilit]
- Liu, H.M.; Wang, L.W.; Wang, J.Z.; Ming, H.T.; Wu, X.K.; Xu, G.; Zhang, S.W. Multidimensional spatial inequality in China and its relationship with economic growth. Humanit. Soc. Sci. Commun. 2024, 11, 1415. [Google Scholar] [CrossRef] [Scilit]
- Liu, R.P.; Zhang, P.; Zhou, G.X.; Li, X.B.; Zhang, D.D.; Liu, M. Long-Term Divergence in Green Exposure Trajectories and Economic Determinants in Urban China. Sustainability 2025, 17, 9345. [Google Scholar] [CrossRef] [Scilit]
- Li, L.; Zheng, Y.L.; Ma, S.J.; Li, M.Q. Environmental infrastructure and urban residents’ well-being: A system dynamics approach. J. Environ. Plan. Manag. 2023, 66, 2576–2602. [Google Scholar] [CrossRef] [Scilit]
- Guo, K.; Cao, Y.Q.; Li, Z.Y. Urban and industrial environmental pollution control in China: An analysis of capital input, efficiency and influencing factors. J. Environ. Manag. 2022, 316, 115198. [Google Scholar] [CrossRef] [Scilit]
- Yu, M.Z.; Deng, X. The inheritance of marketization level and regional human capital accumulation: Evidence from China. Financ. Res. Lett. 2021, 43, 102268. [Google Scholar] [CrossRef] [Scilit]
- Zhang, J.R.; Xue, C.X.; Hou, G.J. The Impact of Chinese Public Environmental Awareness on Environmental Behavior: An Analysis Based on China National Surveys in 2003, 2010 and 2021. Land 2024, 13, 1418. [Google Scholar] [CrossRef] [Scilit]
- Bahrami, Z.; Sato, S.; Yang, Z.S.; Maiti, M.; Kanawat, P.; Umemura, T.; Onishi, K.; Terasaki, H.; Nakayama, T.; Matsumi, Y.; et al. The perception of air pollution and its health risk: A scoping review of measures and methods. Glob. Health Action 2024, 17, 2370100. [Google Scholar] [CrossRef] [Scilit]
- Zaharia, M.H. A smart environment infrastructure. Environ. Eng. Manag. J. 2016, 15, 2285–2300. [Google Scholar] [CrossRef] [Scilit]
- Chen, M.; Liu, Y.; Wang, S.; Liu, W. Sources and Driving Factors of Livelihood Development Differences among China’s Top Ten Urban Agglomerations. Quant. Econ. Tech. Econ. Res. 2020, 37, 23–40. [Google Scholar] [CrossRef]
- Liu, Z.B.; Xiang, W.; Wang, J.J.; Chen, W.X.; Zhou, Y. Spatiotemporal patterns and regional disparities in the coupling and coordination between green finance and ecological environment in China. Front. Environ. Sci. 2025, 13, 1508830. [Google Scholar] [CrossRef] [Scilit]
- Gong, Z.; Huo, X. Assessing the impact of regional integration strategies on the development of urban green economies: A study based on an empirical analysis of ten major urban agglomerations. Sustainability 2024, 16, 3258. [Google Scholar] [CrossRef] [Scilit]
- Wang, S.F.; Xu, L.; Ge, S.J.; Jiao, J.L.; Pan, B.L.; Shu, Y. Driving force heterogeneity of urban PM2.5 pollution: Evidence from the Yangtze River Delta, China. Ecol. Indic. 2020, 113, 106210. [Google Scholar] [CrossRef] [Scilit]
- Wang, F.; Dong, M.R.; Ren, J.; Luo, S.; Zhao, H.; Liu, J. The impact of urban spatial structure on air pollution: Empirical evidence from China. Environ. Dev. Sustain. 2022, 24, 5531–5550. [Google Scholar] [CrossRef] [Scilit]
- Pu, Y.; Yao, W.B.; Li, X.Y.; Alhudhaif, A. An adaptive highly improving the accuracy of clustering algorithm based on kernel density estimation. Inf. Sci. 2024, 663, 120187. [Google Scholar] [CrossRef] [Scilit]
- Tamura, S.; Iwamoto, S.; Tanaka, T. The impact of spatial population distribution patterns on CO2 emissions and infrastructure costs in a small Japanese town. Sustain. Cities Soc. 2018, 40, 513–523. [Google Scholar] [CrossRef] [Scilit]
- González-Ruiz, J.D.; Botero-Botero, S.; Peña, A. Analysis of the capital structure in sustainable infrastructure systems: A methodological approach. Sustainability 2022, 14, 12662. [Google Scholar] [CrossRef] [Scilit]
- Sogut, Y.; Demirtas, N.; Teksan, E.; Torusdag, M.; Inal, V.; Aydin, M. Building a sustainable environment in EU countries: The critical role of infrastructure investments and institutional quality. Int. J. Sustain. Dev. World Ecol. 2025, 32, 96–109. [Google Scholar] [CrossRef] [Scilit]
- Nuta, F.M.; Sharafat, A.; Abban, O.J.; Khan, I.; Irfan, M.; Nuta, A.C.; Dankyi, A.B.; Asghar, M. The relationship among urbanization, economic growth, renewable energy consumption, and environmental degradation: A comparative view of European and Asian emerging economies. Gondwana Res. 2024, 128, 325–339. [Google Scholar] [CrossRef] [Scilit]
- Xu, A.; Qiu, K.; Jin, C.; Cheng, C.; Zhu, Y. Regional innovation ability and its inequality: Measurements and dynamic decomposition. Technol. Forecast. Soc. Change 2022, 180, 121713. [Google Scholar] [CrossRef] [Scilit]
- Zhou, R.; Zheng, Z. Characteristics and trends of regional inequality in China: A multidimensional perspective. Appl. Econ. Lett. 2024, 31, 706–711. [Google Scholar] [CrossRef] [Scilit]
- Liu, Z.; Wang, W.; Lang, W.; Chu, C.; He, F.; Dong, Q.; Liu, Y. Unveiling local dynamics of Chinese cities: A multidimensional scale-adjusted analysis. Habitat Int. 2025, 166, 103596. [Google Scholar] [CrossRef] [Scilit]
- Wu, B.W.; Xu, Y.Z. Towards sustainable development: Can industrial collaborative agglomeration become an accelerator for green and low-carbon transformation of resource-based cities in China? J. Environ. Manag. 2025, 381, 125199. [Google Scholar] [CrossRef] [Scilit]
- Zhang, Y.; Chen, S.; Wang, N. The Impact of Educational Level on Ecological Efficiency: An Empirical Analysis in the Middle Reaches of Yangtze River. J. Coast. Res. 2020, 106, 388–395. [Google Scholar] [CrossRef] [Scilit]
- Ding, R.; Fu, J.; Zhang, Y.; Zhang, T.; Yin, J.; Du, Y.; Zhou, T.; Du, L. Research on the Evolution of the Economic Spatial Pattern of Urban Agglomeration and Its Influencing Factors: Evidence from the Chengdu-Chongqing Urban Agglomeration of China. Sustainability 2022, 14, 10969. [Google Scholar] [CrossRef] [Scilit]
- Jiang, S.; Yu, H.; Li, Z.; Geng, B.; Li, T. Study on the Evolution of the Spatial-Temporal Pattern and the Influencing Mechanism of the Green Development Level of the Shandong Peninsula Urban Agglomeration. Sustainability 2022, 14, 9549. [Google Scholar] [CrossRef] [Scilit]
- Lin, X.; Lu, C.; Song, K.; Su, Y.; Lei, Y.; Zhong, L.; Gao, Y. Analysis of Coupling Coordination Variance between Urbanization Quality and Eco-Environment Pressure: A Case Study of the West Taiwan Strait Urban Agglomeration, China. Sustainability 2020, 12, 2643. [Google Scholar] [CrossRef] [Scilit]
- Zhang, W.; Zhang, Y.; Li, W. Impact of Northeast Revitalization Policy on the industrial economy: Empirical evidence from Central and southern Liaoning urban agglomeration. Appl. Econ. 2024, 56, 6648–6666. [Google Scholar] [CrossRef] [Scilit]
- Chen, J.; Wang, S.; Zou, Y. Construction of an ecological security pattern based on ecosystem sensitivity and the importance of ecological services: A case study of the Guanzhong Plain urban agglomeration, China. Ecol. Indic. 2022, 136, 108688. [Google Scholar] [CrossRef] [Scilit]
- Ma, F.; Wang, Z.; Sun, Q.; Yuen, K.F.; Zhang, Y.; Xue, H.; Zhao, S. Spatial–Temporal Evolution of Urban Resilience and Its Influencing Factors: Evidence from the Guanzhong Plain Urban Agglomeration. Sustainability 2020, 12, 2593. [Google Scholar] [CrossRef] [Scilit]
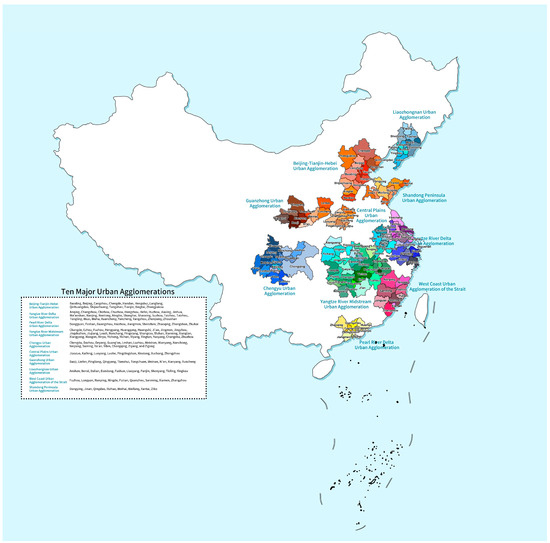
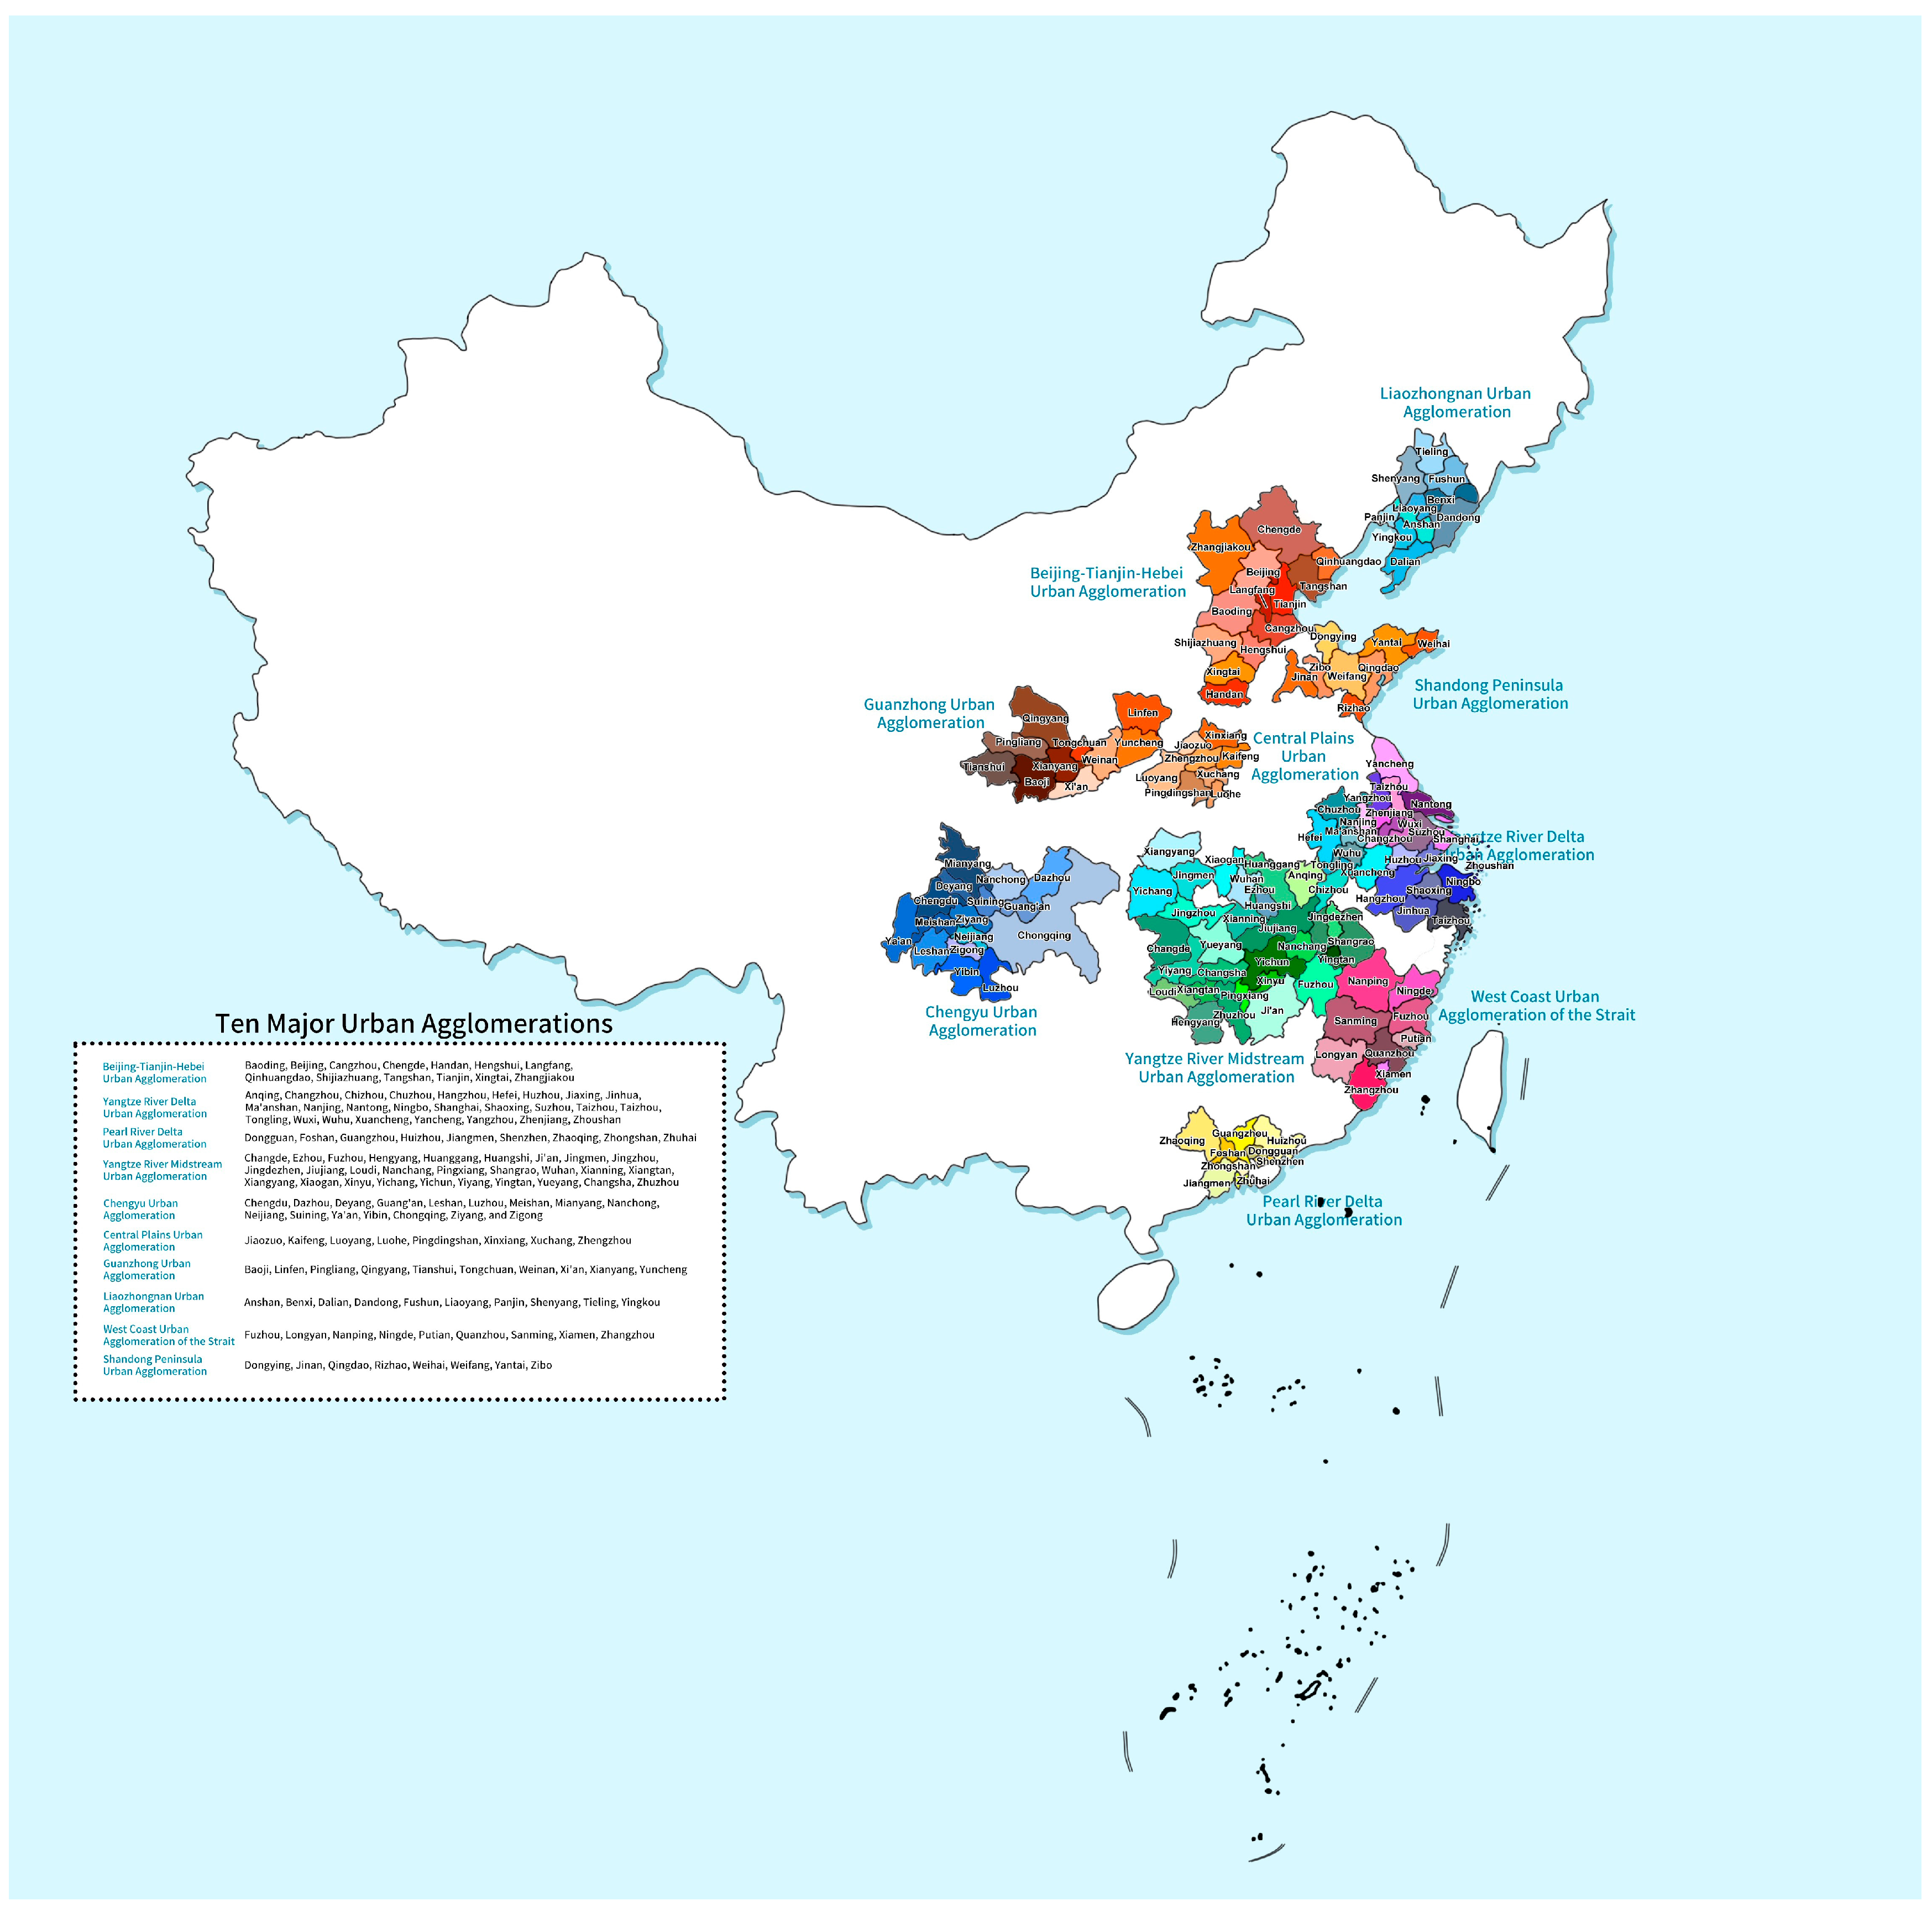
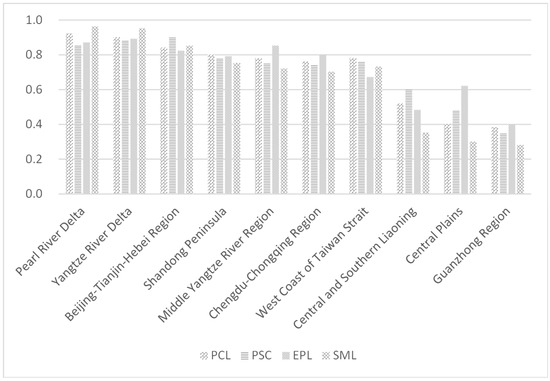
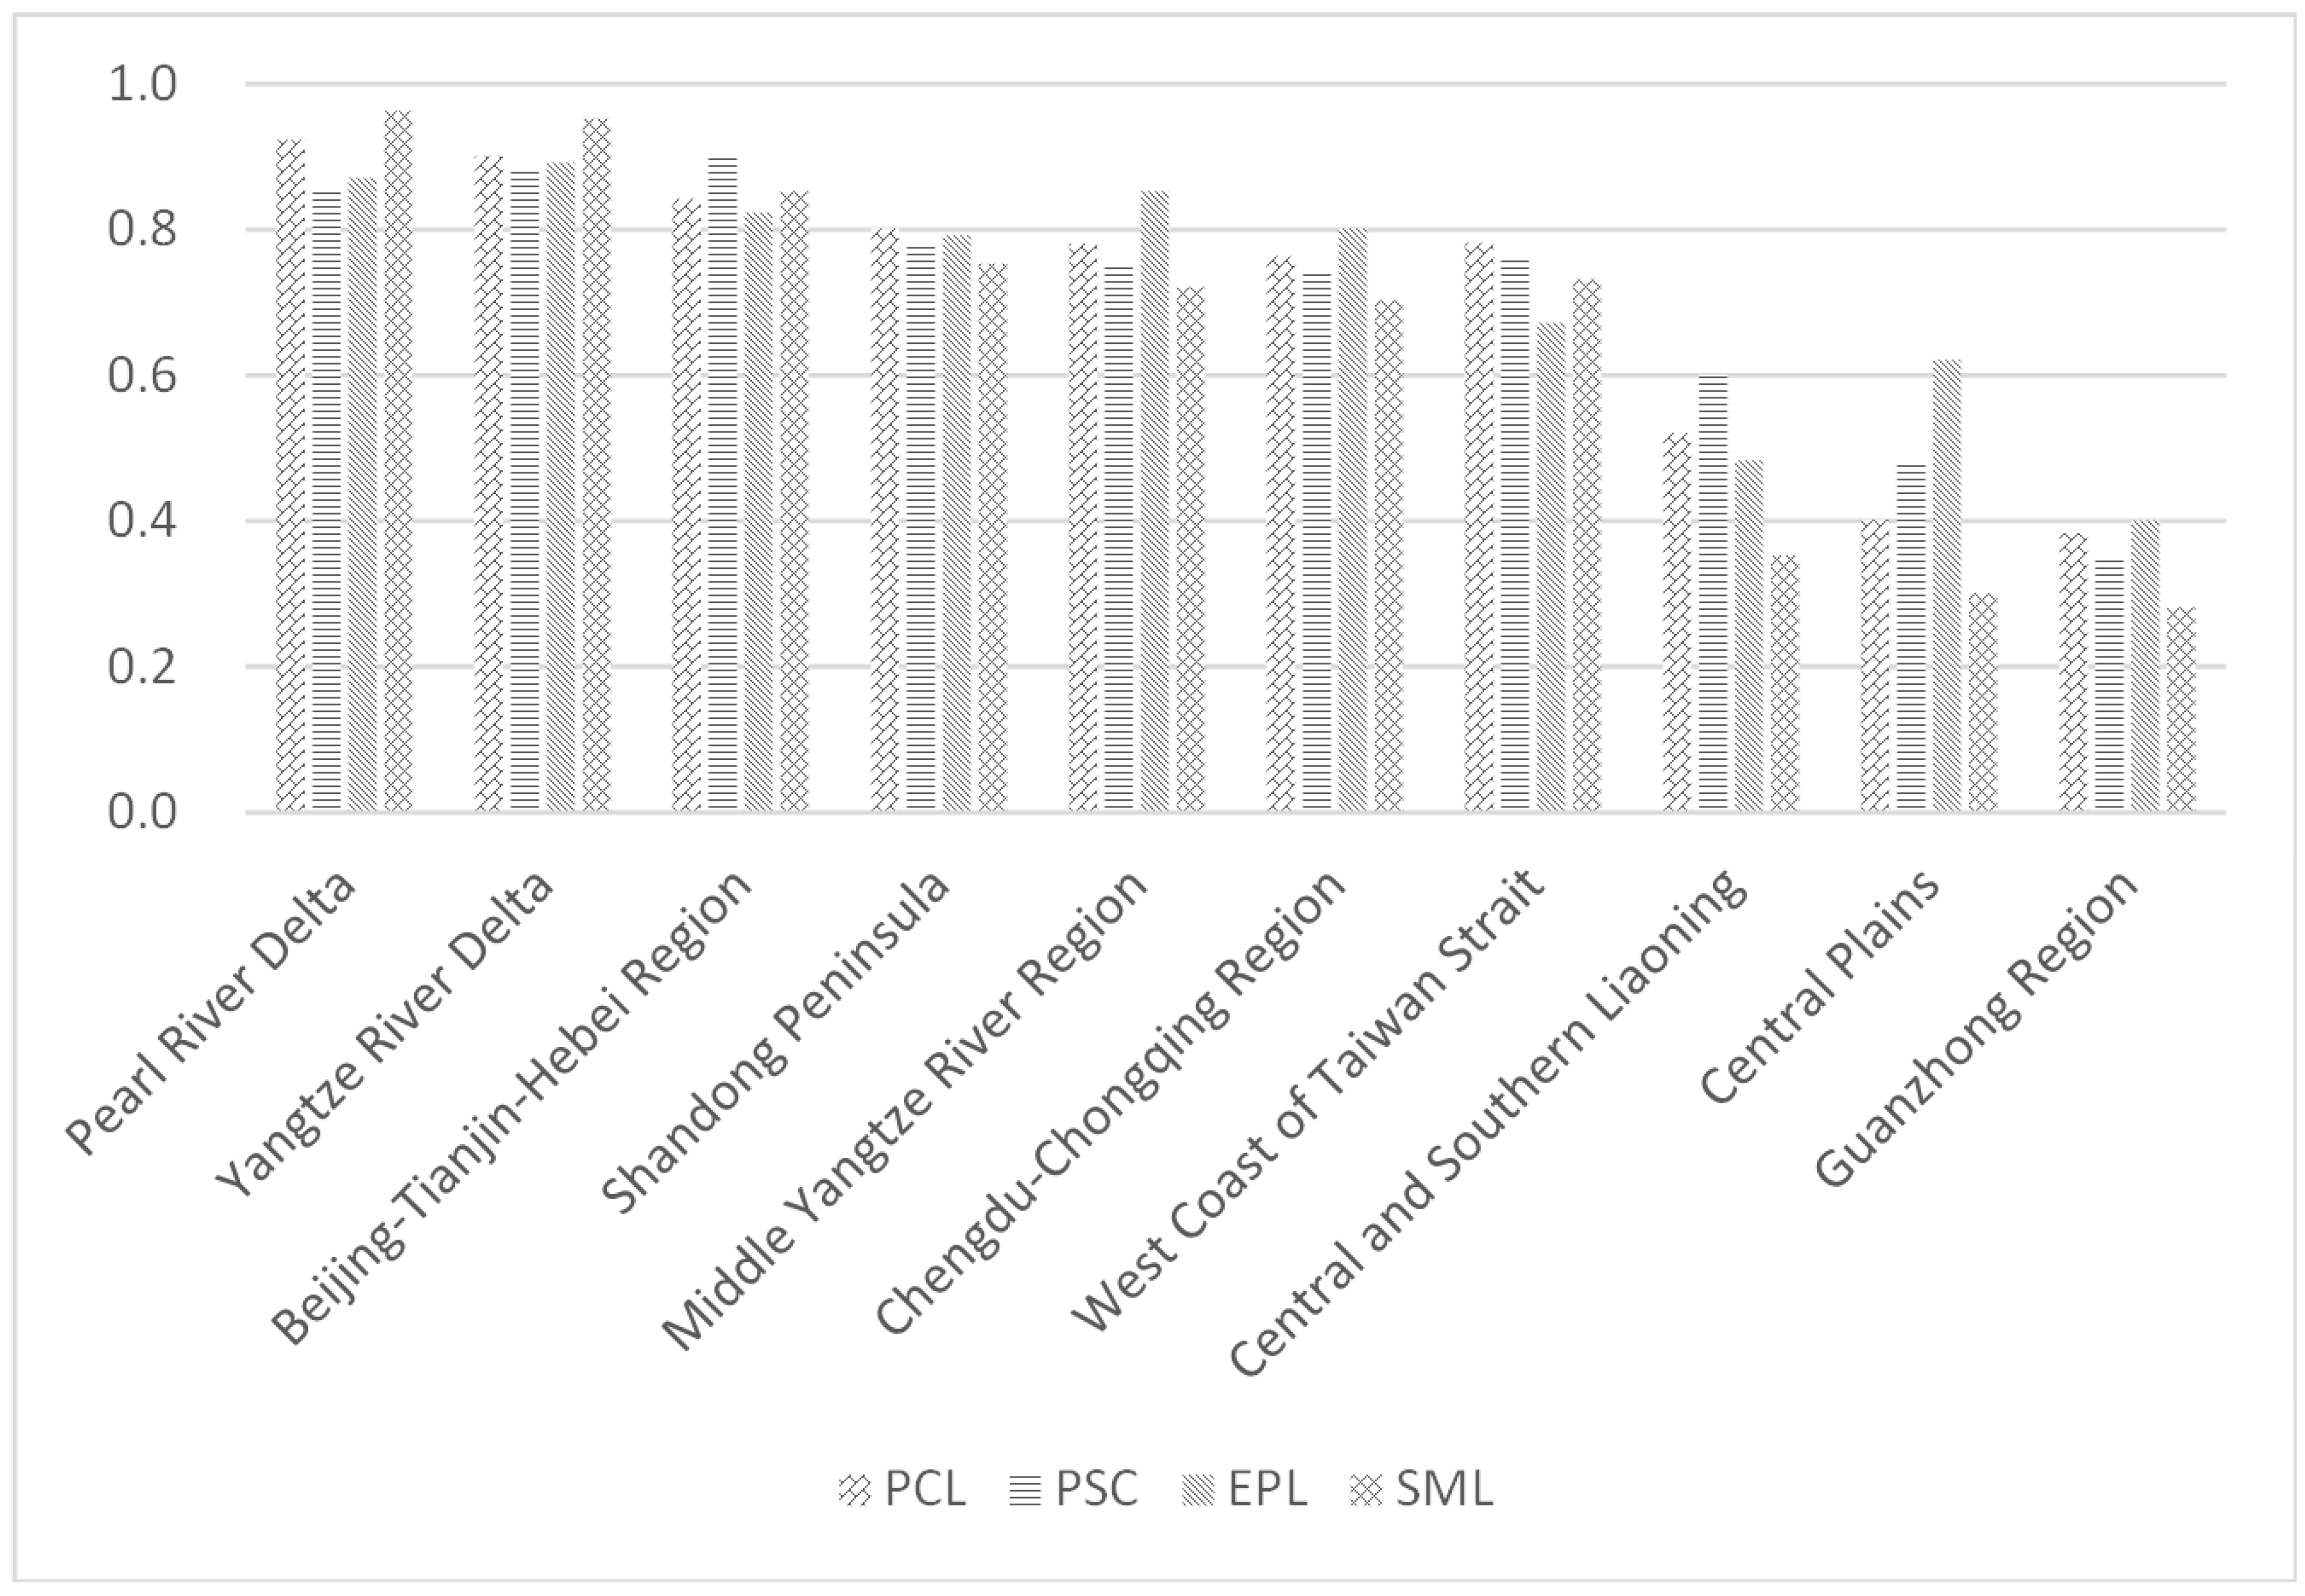
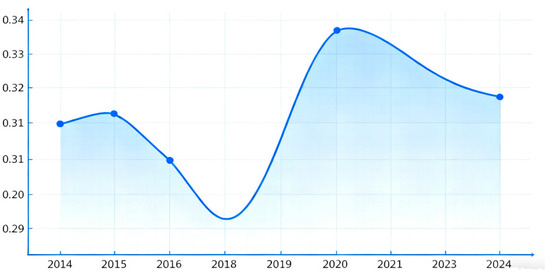
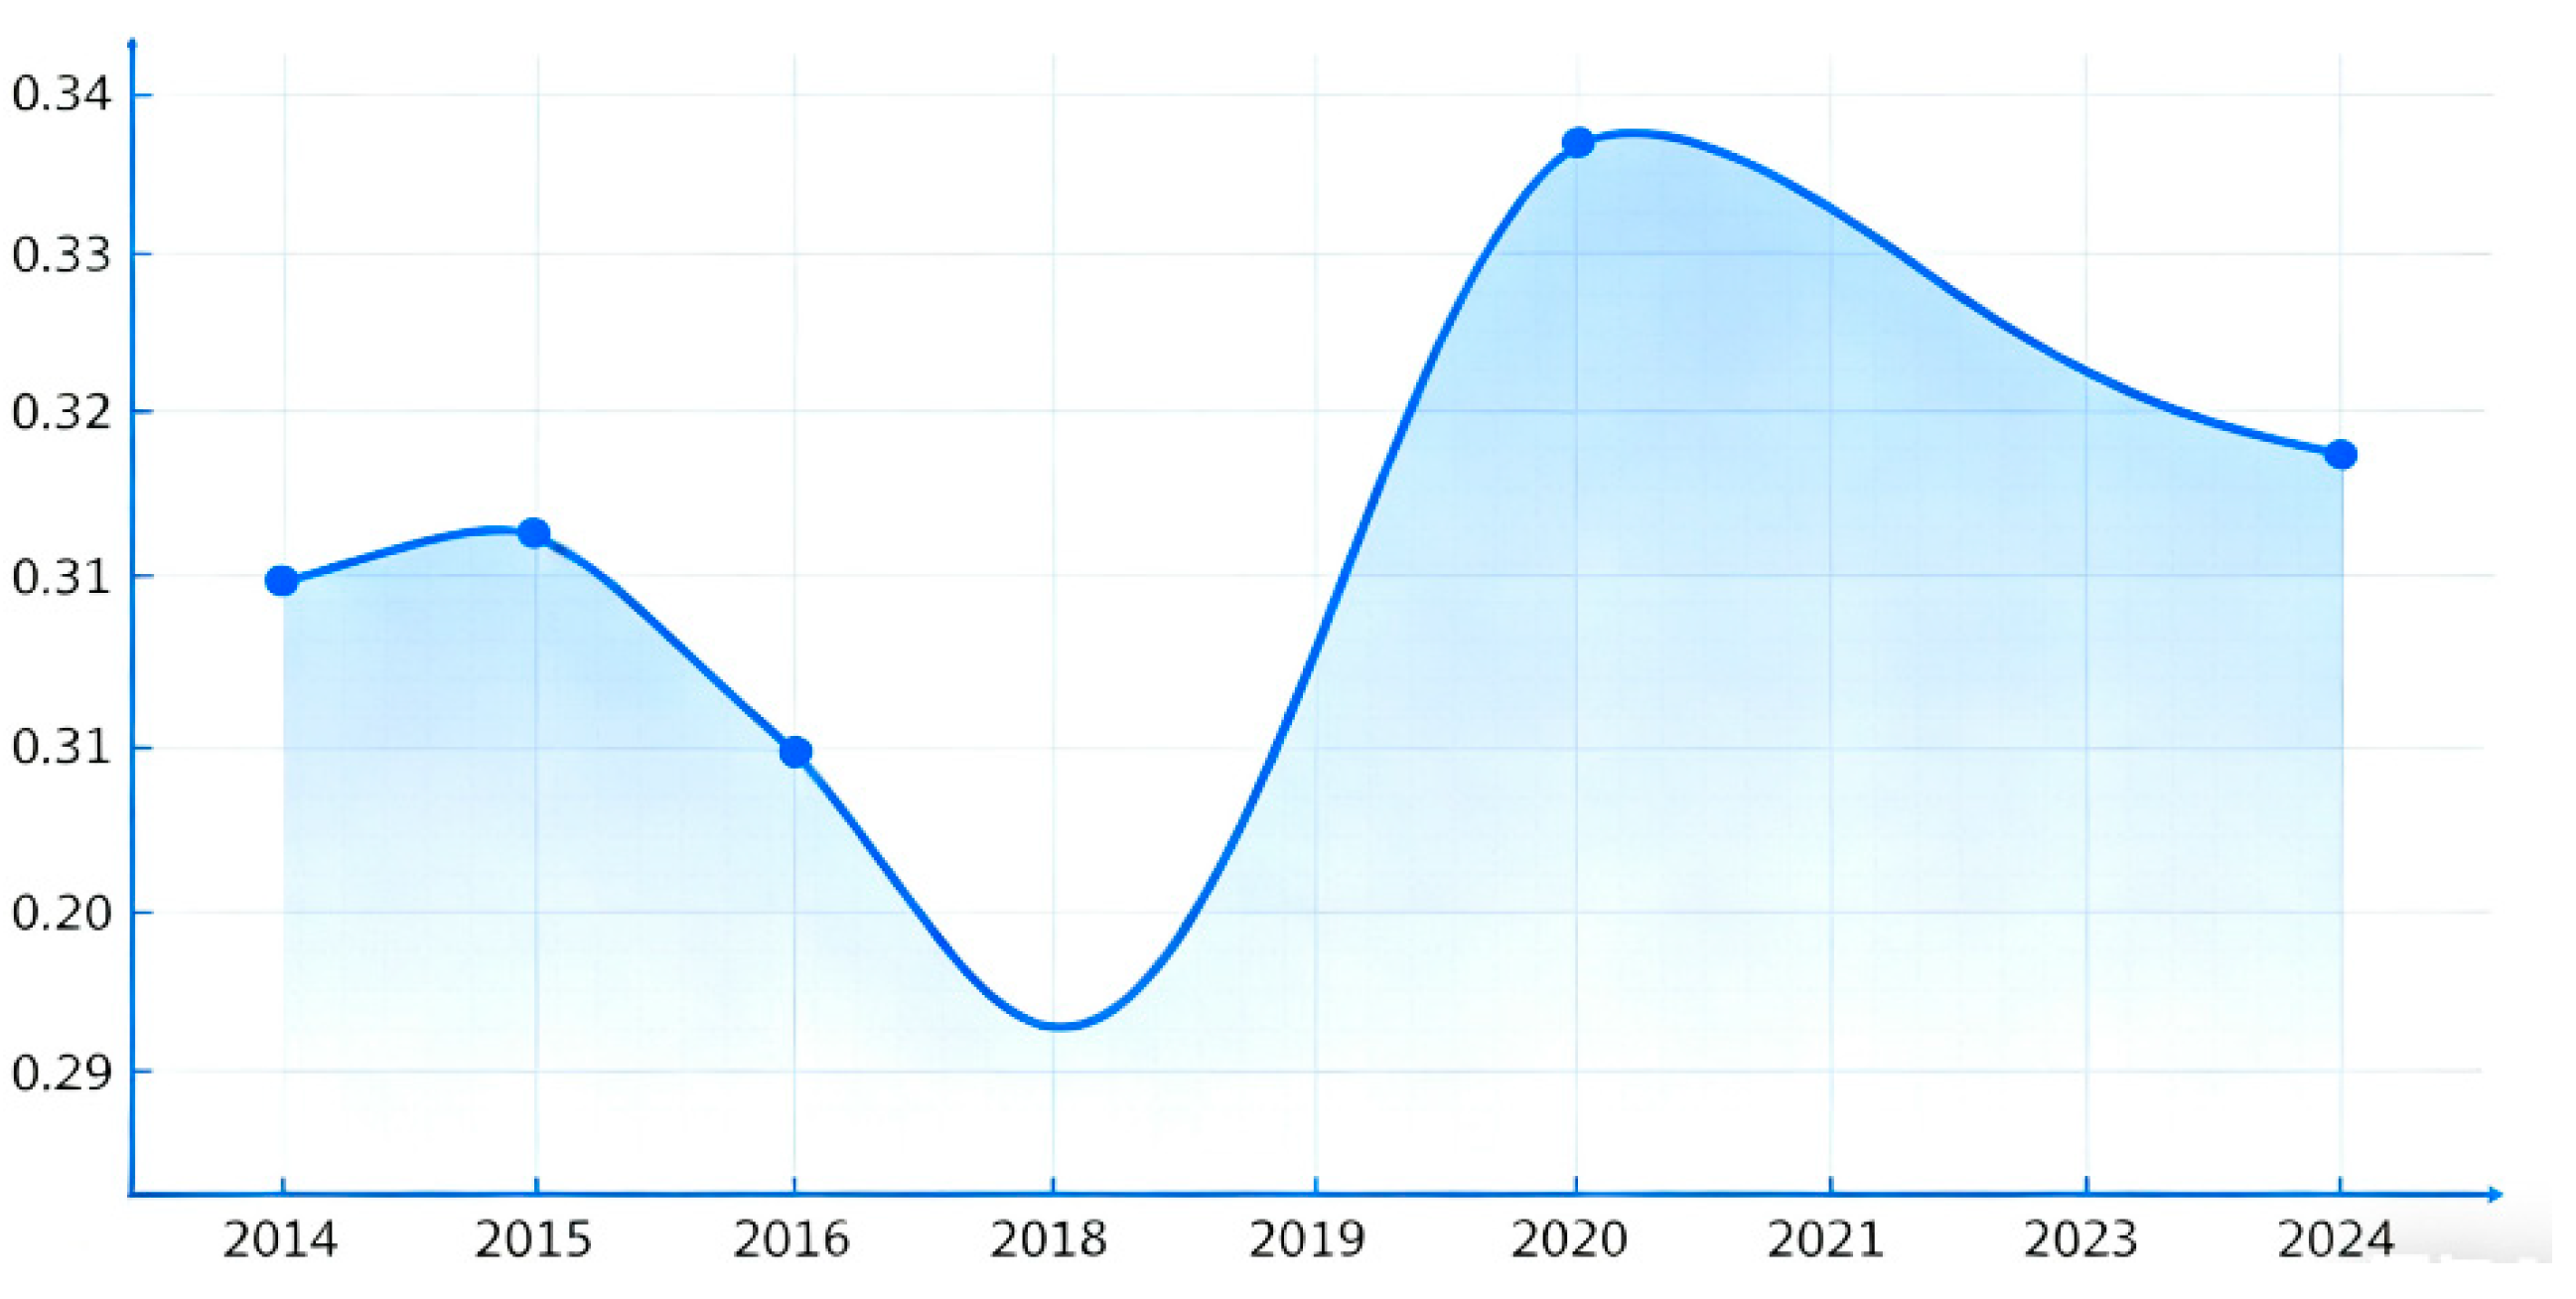

Disclaimer/Publisher’s Note: The statements, opinions and data contained in all publications are solely those of the individual author(s) and contributor(s) and not of MDPI and/or the editor(s). MDPI and/or the editor(s) disclaim responsibility for any injury to people or property resulting from any ideas, methods, instructions or products referred to in the content. |
© 2026 by the authors. Licensee MDPI, Basel, Switzerland. This article is an open access article distributed under the terms and conditions of the Creative Commons Attribution (CC BY) license.