


Abstract
This study examines sustainability investments under stressful and constrained scenarios. The study exploits a wide range of indices, ranging from sustainability, ESG, to financial. The Diebold and Yilmaz framework and the DCC-GARCH were employed. The analysis covered 2382 observations with results capturing aggregate cross-market connectedness. The total volatility index, 76.95% based on static analysis, indicates the markets are highly integrated. The predominant net volatility transmitters are the SPX, TSX, EURUSA, and S&P500, while ESG50, ESG30, CAC, and Midi are net volatility receivers. The dynamics significantly vary, reaffirming the fact that the ESG50 and ESG30 are shock absorbers with an inverse behavioral pattern seen in the S&P500. Meaningful results based on the modern portfolio theory weights and DCC-GARCH hedge ratios based on the index pairs provide substantial diversification opportunities with hedge ratios ranging from 0.23 to 0.90. Robustness checks based on sensitivity checks with respect to varying rolling windows and lag specifications confirm the stability and validity of the findings. These empirical results are relevant for the establishment of sustainable portfolio construction and portfolio risk management in the global markets.
1. Introduction
The quest for competitive solvency, relevance, persistence, and, above all, growth by organizations, sectors, economies, and countries as a whole is grossly reflected in the degree of exploitation and utilization of raw materials. These raw materials, non-renewables, tend to exert a direct as well as positive impact on their immediate environment. The continuous and persistent extraction of these inputs, though beneficial to the organization, equally exerts a negative effect. Thus, it could be said that the usage of non-renewable resources is a double-edged sword in nature. The effects on the environment are witnessed through the occurrence of global hazardous climatic changes and the proliferation of environmental issues [1]. Given the increase in popularity of this aspect relative to the mitigation of the by-products of organizational activities, policies relating to aspects such as green innovation and green technology, as well as the effective implementation of ethical regulations and sustainability practices, have been sorted out and implemented [2]. Worthy of note is the fact that, relative to sustainability practices in the financial sector, the adoption and utilization of green bonds has been the order of the day [3].
For the 21st century, the present-day analysis relative to sustainable development and corporate responsibility is subject to environmental (E), social (S), and governance (G) considerations. The aforementioned precepts have gained an overwhelming significance in recent times, given that ESG-related issues account for one of the major challenges encountered by contemporary macro-organizational functions at both the micro and macro phases of their evolution. The aggregate downturn in global climatic conditions in more ways than one has increased systemic risk. The latter is justified by the increase in ESG-related investments from $6.5 trillion in 2006 to $121 trillion in 2021, with emphasis on sustainable development [4]. ESG-related investment in the long term enhances financial resilience, most especially during a financial crisis. ESG indices, like most other conventional financial indices, measure profitability backed by returns accrual. It is worth noting that, despite being like other indices, inherent differences are subject to the dynamics of risk-returns, screening risk, systemic risk, connectedness, multi-stage derivative process methodology, and the non-financial screening criterion that differentiates them from financial market indices. In essence, ESG indices incorporate aspects relating to environmental, social, and governance considerations, whose integration results in diversified outcomes. However, its incorporation does not necessarily account for profitability, though the recent literature showcases its risk mitigative properties most especially during market failure, crisis, and downturn periods [5]. Put differently, the ESG has become of great significance given that its inclusiveness portrays a near-complete picture in assessment and classification, as well as enhances our understanding of the proliferation and philosophical ideologies responsible for the proliferation of organizational economies concerning their environment.
Objectively, this research is geared towards analyzing the behavioral patterns of the financial market index with the inclusion of the ESG proxy, primarily focusing on examining how ESG and sustainability integration redefine strategic risk management, cross-market analysis, and portfolio possibilities from a global perspective. The behavioral pattern referred to will aid in portfolio optimization, which is one of the principal decisions to be implemented by both the stakeholders and shareholders of organizations and the economy as a whole. Empirical evidence for this study will be retrieved during the time frame from 1 April 2016, to 31 December 2025, heavily buttressed by the occurrence of significant turbulences such as the 2016 Brexit, the COVID-19 pandemic, and the oil bubble, to cite just a few. It is worth noting that the novelty of this research lies in the fact that it provides mathematical inference justifying the decided course of action rather than just assessing the impact of said course of action.
Despite the proliferation in the existing literature of focal points on the assessment of ESG, green finance, energy markets, and financial market index volatility spillovers, residual gaps in the aforementioned remain, which enhance a gradual but steady upsurge in prospective scientific research. To begin with, the existing literature predominantly focuses on returns and volatility spillovers of conventional trading indices with little or no attention given to ascertaining the extent to which ESG-related spillovers account for strategic sustainable growth and financial resilience. This in itself fosters discontinuity considerations between ESG-related analysis and probable sustainable macroeconomic outcomes. Again, most of the existing literature is based on either ESG-related market indices or the traditional financial market indices, with relatively few based on the comprehensive interactions between ESG and financial market indices relative to structural transformations such as the advent of financial technology (Fintech) and global environmental changes such as Brexit, COVID-19, and the Russia–Ukraine war, to name a few. These redundancies create a large vacuum in the literature, hence causing inadequacies in the long-term shock analysis subject to volatility spillovers and portfolio optimization. Also, there exists inadequate evidence from the existing literature for comparative purposes, subject to the behavioral pattern of ESG-related market indices across different economic frontiers. Lastly, given the existence of inter-country studies from the available literature, said studies sparingly connect volatility spillover to climate changes, sustainable finance development, and institutional quality.
This academic research examines the relationship between the ESG proxy index and related financial market indices for the selected countries, as well as constraining factors, making use of the DY and DCC-GARCH. The aforementioned methodologies are fairly close to market connectedness, risk management, and portfolio optimization through the identification of time-varying net volatility transmitters and receivers using the DY and of the optimal weights, hedge ratio, investor sentiment, and diversification possibilities with the aid of the DCC-GARCH. Based on this study, our research questions would be to investigate the extent to which ESG and sustainability indices absorb and emit volatility spillover against conventional financial market indices and implications for risk management and portfolio diversification.
The contribution of this study to existing studies could be seen in many ways. Firstly, unlike preceding studies, this study provides analytical procedures and volatility spillover mechanics subject to the integration of ESG indices from a global perspective. Simply put, the study gives insights into how ESG indices transmit and receive risk across developed and emerging markets. Secondly, the study introduces a two-level econometric analytical framework, DY and the DCC-GARCH. These simultaneously examine market-level spillovers and investor sentiment portfolio optimization, contrary to traditional studies typically reliant on a single econometric analytical procedure. Furthermore, the study goes a step further to highlight the existence of a non-linear and time-dependent nature subject to static and dynamic analysis due to ESG integration. In addition, the study provides a geographical standpoint on which comparative analysis relative to developed and emerging markets can be adequately carried out over long periods. Moreover, the results of this research quantify the integration of ESG in portfolio optimization, which in the long run minimizes risk and uncertainty, thus accounting for near-stable returns and effective hedging against the unknown, given that the market is volatile. Finally, the study provides a comparative multifaceted scenario illustrative of the resultant behavioral patterns of the ESG and financial market index in terms of the net volatility transmitters and receivers, inclusive of the static and dynamic scenarios and the estimated total volatility index.
2. Literature Review
This section provides the theoretical framework and reviews the existing related literature.
2.1. Theoretical Framework
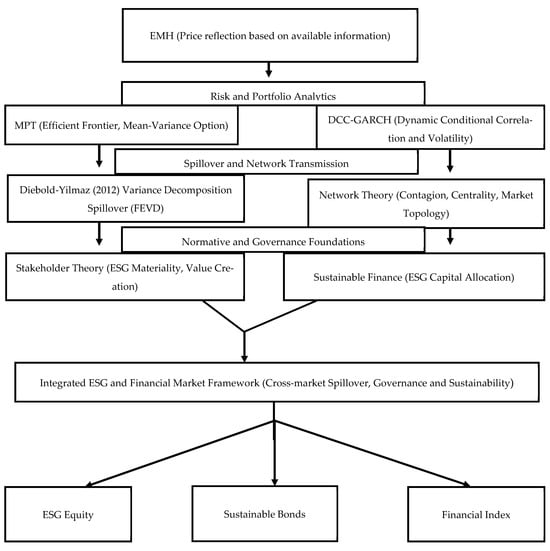
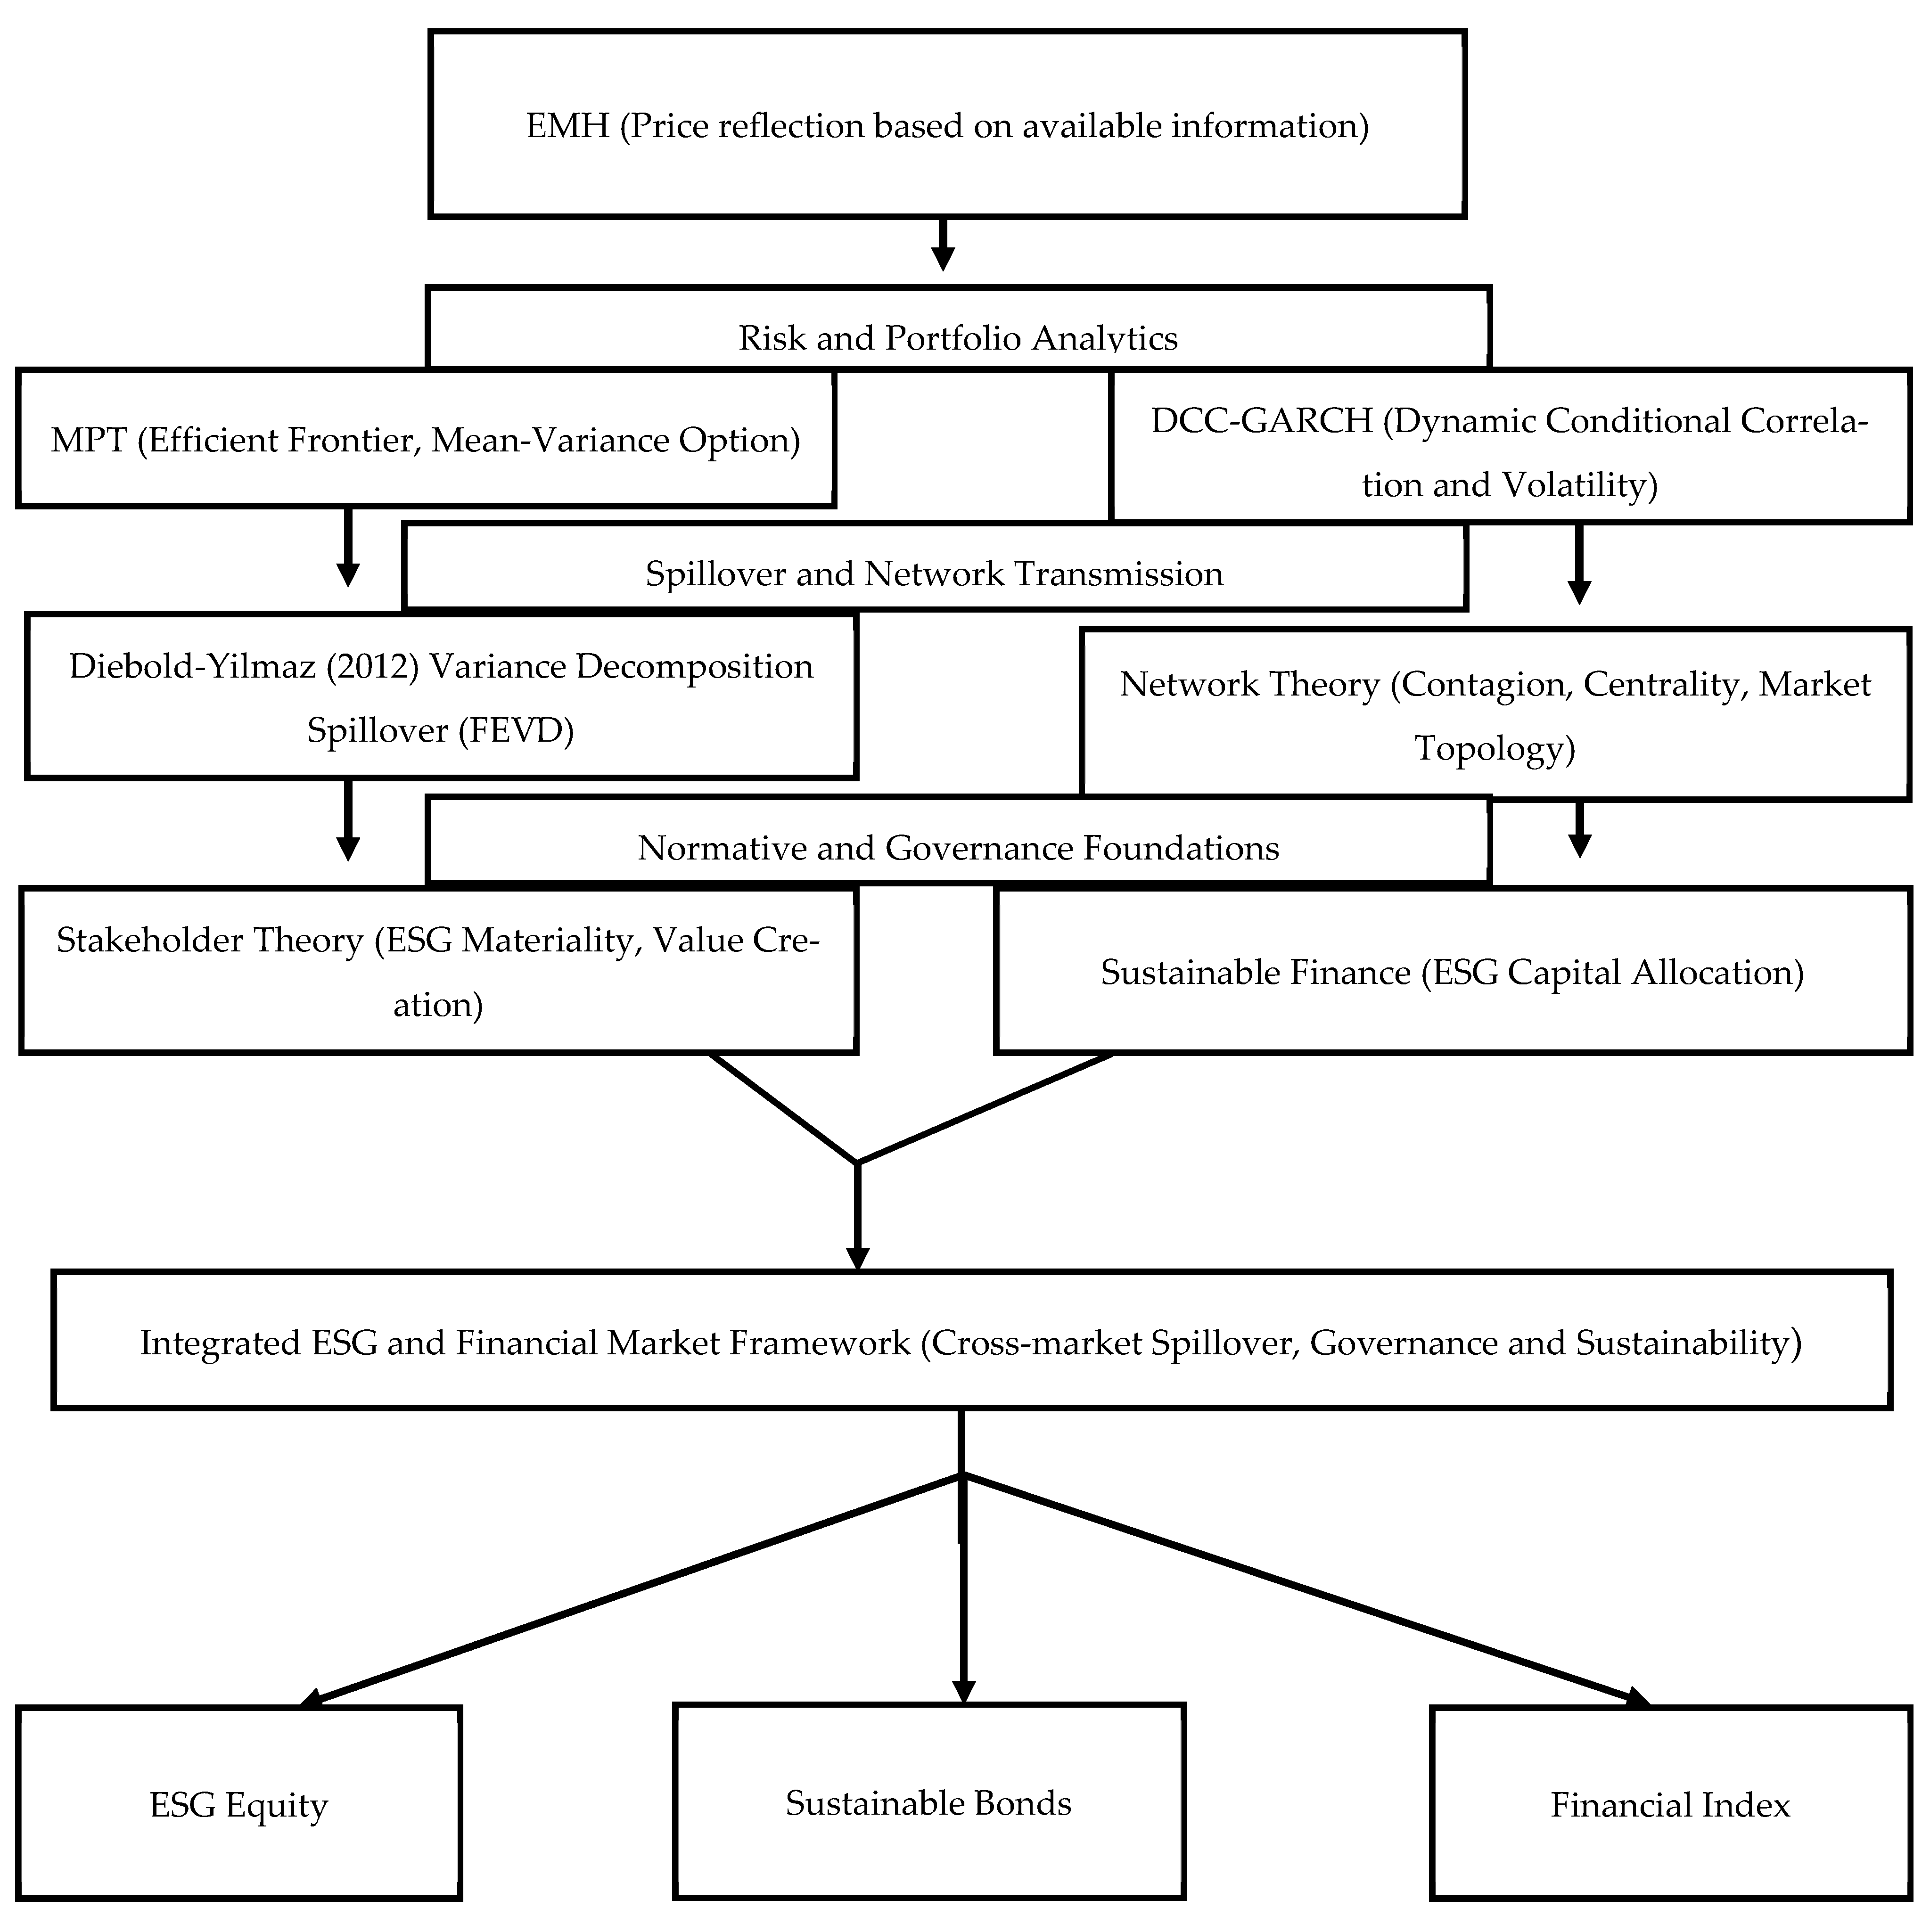
This segment provides the core concepts and theoretical basis relevant to the study. Multiple theoretical and empirical conceptual frameworks underpin the mechanics relative to volatility spillovers, connectedness, and portfolio optimization from a global perspective. Firstly, the research examines both connectedness and the resultant volatility spillovers with the use of the DY framework. The aforementioned framework, derived from the generalized vector autoregression framework, efficiently estimates the latter based on the employment of natural variance decomposition. The DY frameworks determine the direction and magnitude of transmitted shocks between indices based on the total and spillover index [6]. Moreover, the study gives an insight into the estimates relative to portfolio diversification by using the DCC model. The DCC model uses the GARCH variance to capture the time-varying co-movement between the different indices [7]. The model’s relevance cannot be understated, given that it enhances the derivation of optimal time-varying weights based on its provision of time-varying conditional variances, covariance, diversification strategies and benefits, market interdependence, and contagion effects. Secondly, there is the modern portfolio theory (MPT), which happens to be one of the foundational finance theories, as well as investment-related concepts. This modern portfolio theory (MPT) emphasizes the utilization of diversification as a risk mitigation and reduction tool. The MPT is based on the Sharpe ratio, and the frontier shift identifies the constraint portfolios with respect to losses or gains based on diversification benefits [8]. ESG-related indices, compared to conventional traditional finance indices, exhibit different risk characteristics. The theory thus reinforces the portfolio optimization tradeoff between risk and returns, aggregately providing theoretical testing grounds on risk mitigation and high returns accrual, subject to ESG integration in the portfolio, given the correct modeling of spillovers and correlations at global levels. In addition, another conceptual framework susceptible to the aforementioned is the network theory, which provides theoretical insights subject to the potential existing interconnections between different nodes. It identifies the nodes that either induce or absorb systemic risk [9]. It conceptualizes financial markets and indices as interconnected nodes heavily reliant on dependent structures. It facilitates systemic risk and ESG spillovers given its adequacy in centrality, density, and clustering measures, further enhancing relevant contagion channels, which strategically account for global financial stability. This accentuates ESG interconnectedness beyond pairwise correlations.
Moreover, the sustainable finance and stakeholder theory asserts the interrelationship between shareholders and stakeholders. The premise here is that the value maximization objective of an organization is inclusive of shareholders and stakeholders [10]. This theory propounds that global market connectedness and volatility spillovers are by-products of ESG-reliant firms. Relatively, the observed residual volatility spillovers and cross-market interdependence are the end products of common sustainability shocks and the international diffusion of ESG standards. The integration of ESG averagely alters the risk transmissive propensities for all markets, given that all beta coefficients invariably change. Hence, comparatively analyzing ESG and conventional financial market indices, especially during a global financial crisis or environmental crisis, the CAPM facilitates the derivation of systemic risk exposure and, to a large extent, uncertainty basis. The Efficient Market Hypothesis (EMH) is based on the working principle that, at any point in time, the underlying asset price is representative of the available information; hence, abnormal returns accrual is impossible. The EMH measures how quickly ESG, sustainable, and financial indices reflect the available price with reference to either the weak, semi-strong, or strong form [11]. The integration of ESG in a portfolio challenges the strong-form EMH, given its premise that non-financial factors may not be fully priced. The occurrence of spillovers and connectedness is a result of the gradual circulation of information, which eventually leads to delayed market adjustment and inter-market transmissive tendencies, as well as the unpredictability in price movement usually referred to as the random walk principle. This study thus provides empirical testing regarding grounds for market efficiency subject to ESG portfolio integration relative to the global scenario (Figure 1).
Figure 1.
Integrated visual model [6].
2.2. Empirical Literature
This section of the paper relates to the review of existing literature.
2.2.1. Sustainability Index and Volatility Spillover
To begin with, ref. [12] in their study investigated the relationship between sustainability and stability by ascertaining the ESG investment effect on the return and volatility spillover in the Chinese financial markets. With the usage of TVP-VAR and the DY, the findings show that when the ESG stock index replaces the general stock index, the total, directional, and pairwise spillover effects in the Chinese financial markets decrease, making them occasionally quite volatile. Also, ref. [13] examined the effects of the continuing war between Russia and Ukraine on the transmission of return spillover among traditional/new energy, green finance, and ESG. With the aid of the DY and Barunik and Krehlik’s approaches, the results demonstrate that new energy, ESG, and green stocks are closely linked. The findings further show that new energy, ESG, and green stock are the main functioning risk transmitters in both the short and long term after the war. Ref. [14] investigated the returns and volatility among green markets, inclusive of green bonds, clean energy, and socially responsible stocks during the COVID-19 pandemic. Concerning the TVP-VAR extended joint connectedness approach, the retrieved evidence illustrates that the main net return spillover receiver is GBI, followed by ESGI, CEI, and FFFI, while GCEI is the main net return spillover transmitter. The results go a step further to show that all indices witnessed a spike after the COVID-19 pandemic outbreak. Again, ref. [15] investigated the dynamic connectedness of ESG leaders and equity indexes in emerging markets. Based on the adoption of TVP-VAR, the results show that there is transmission of shocks between equity indexes with limited commodity spillover due to the occurrence of connectedness in regional differences. Equally, no significant difference is seen between investments in either ESG leaders or conventional emerging markets, inclusive in the commodities portfolio.
Moreover, ref. [16] investigated the asymmetric spillover network connectedness of policy uncertainty, the fossil fuel energy market, and global ESG investment. With the adoption of the Markov switching autoregression, long memory and asymmetry GARCH, high-dimensional VAR with a common factor, and TVP-VAR, the retrieved empirical evidence shows that risk originating from the natural gas market has indirect spillover effects on emerging economies’ ESG when it runs smoothly. It further shows different types of spillovers when the economy is in decline, most especially due to the effects of America’s economic policy uncertainty on global ESG. The results also show that crude oil markets directly transmit peculiar risks to global ESG investments. Also, ref. [17] examined the co-movement between Fintech and ESG markets. With the use of wavelet and DCC-GARCH methodology, the results indicate a significant bidirectional relationship between Fintech and ESG indices, further inclusive of a reverting mean. Again, the correlations are found to be significant for almost all frequencies except for the 256-day frequency. Ref. [18] examined the asymmetric dynamic volatility among new energy, ESG, green bond, and carbon markets in China. Based on the application of the DCC-GARCH models, the results show the asymmetric volatility shock transmission persistence between new energy and ESG stock; ESG and green bond markets are mainly net transmitters, while new energy and carbon markets are net receivers. The interrelationship among energy commodities, clean energy equities, and ESG investment was examined by [19]. The major findings based on the use of Barunik and Krehlik and quantile coherency approaches show that clean energy equities are substantial net contributors while commodity markets are net recipients in the short-term, whereas, in the long-term, ESG investment emerges as a major contributor followed by coke and solar investment, while clean energy equities witness a downtrend in their level of significance. Equally, Ref. [20] investigated the effects of uncertainty measures on sustainability indices. Based on the use of a non-linear autoregressive distributed lag framework, the results suggest that sustainability indices may serve as valuable tools to investors and asset managers to either offset or dampen the negative impacts of local and global uncertainty measures.
Furthermore, ref. [21] studied the dynamic connectedness between the ESG stock index, renewable energy stock index, green bond stock index, sustainability index, and carbon emission futures. With the adoption of the DCC-GARCH, the empirical evidence shows that carbon futures are volatility transmitters and green bonds are volatility receivers. Ref. [22] investigated the patterns of cross-country risk spillovers of ESG stock indices. With the use of the TVP-VAR framework, the findings show that ESG indices in the European market (Germany and France) are the main risk contributors, whereas the Japanese and Canadian markets are the net receivers. The results also illustrate the fact that cross-country risk spillover of ESG indices is sensitive to climate transition risk. Moreover, ref. [23] studied information transmission and risk contagion in the global ESG stock market. Based on the employment of TVP-VAR and the time-frequency connectedness approach, the findings are illustrative of the fact that there exists a strong connectedness between ESG stock indices in terms of returns and volatility, with ESGs in Europe and North America exhibiting outward volatility spillover while those in the Asia Pacific and India display inward volatility spillover movements.
2.2.2. Financial Market Index Volatility Spillover
Firstly, ref. [24] examined the volatility spillover effect between oil prices and foreign exchange markets relative to five major oil importers and exporters. Based on the application of the DY approach, the results show that oil prices show more contribution “from” other countries as well as a lesser contribution “to” other countries. In addition, ref. [25] regarding implied volatility aimed to explore the extreme risk of oil spillover and the exchange rate of the Chinese stock market. Regarding the use of both upside and downside CoVAR, the findings confirm that the risk of uncertainty fluctuation is much more sensitive in the Chinese stock market as opposed to the oil market. Additionally, the risk spillovers from the exchange rate are more significant during the reform period. Moreover, ref. [26] ascertained the degree of interconnectedness of different financial markets over extreme volatility quantiles. With reference to quantile-VAR, the findings show a dissonance effect of the COVID-19 outbreak, energy shock, and inflation. Again, the results reveal a time-varying effect relative to significant events ranging from the Shale oil crisis to the COVID-19 outbreak, including the recent Russia–Ukraine war. Ref. [27], with empirical evidence from Latin America, examined stock market volatility spillovers. With the aid of the Diebold–Yilmaz associated with DCC-GARCH, the findings show that Brazil is a net volatility transmitter, while Chile, Colombia, and Mexico are net volatility receivers. Again, ref. [28] examined the volatility spillover across global financial markets with the aid of a generalized variance decomposition model inclusive of a fast-tractable Markov regime-switching framework. The results based on the aforementioned technique show that tumultuous periods are characterized by intense directional and total spillovers, further inclusive of net risk reception and transmission swings.
2.3. Interrelation Amongst Sustainability, ESG, and Financial Index
Recently, increase in environmental degradation, witnessed by the radical changes associated with global climatic changes in more ways than one, has radically heightened the proliferation of systemic risk. This upsurge accentuates the need for sustainable development, buttressed by the aggregate increase in ESG investments from $6.5 trillion in 2006 to $121 trillion in 2021 [4]. Sustainability and ESG investments alongside financial indices result in diversified outcomes visible in aspects related to risk reduction and optimal firm valuation. The long-term objective for the incorporation of the aforementioned is viability enhancement over the conventional benchmark with the insertion of non-financial information translated to asset valuation and pricing [29]. However, their integration relative to sectoral and regional constraints subject to countries and economies exerts differential effects, which in most scenarios are negative or insignificant in the short-run, largely due to regulatory compliance costs, and positive in the long-term given the rise of innovation, stakeholder trust, and resilience [29].
3. Data and Methodology
This section describes the data and the utilized methodology.
3.1. Data and Sample
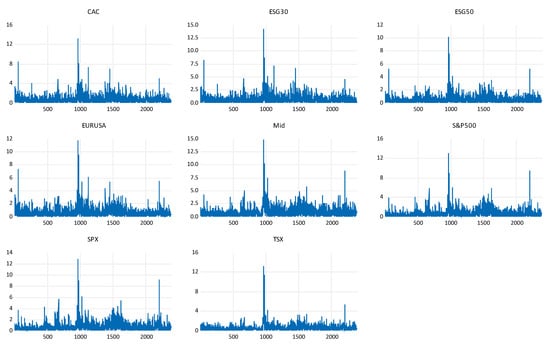
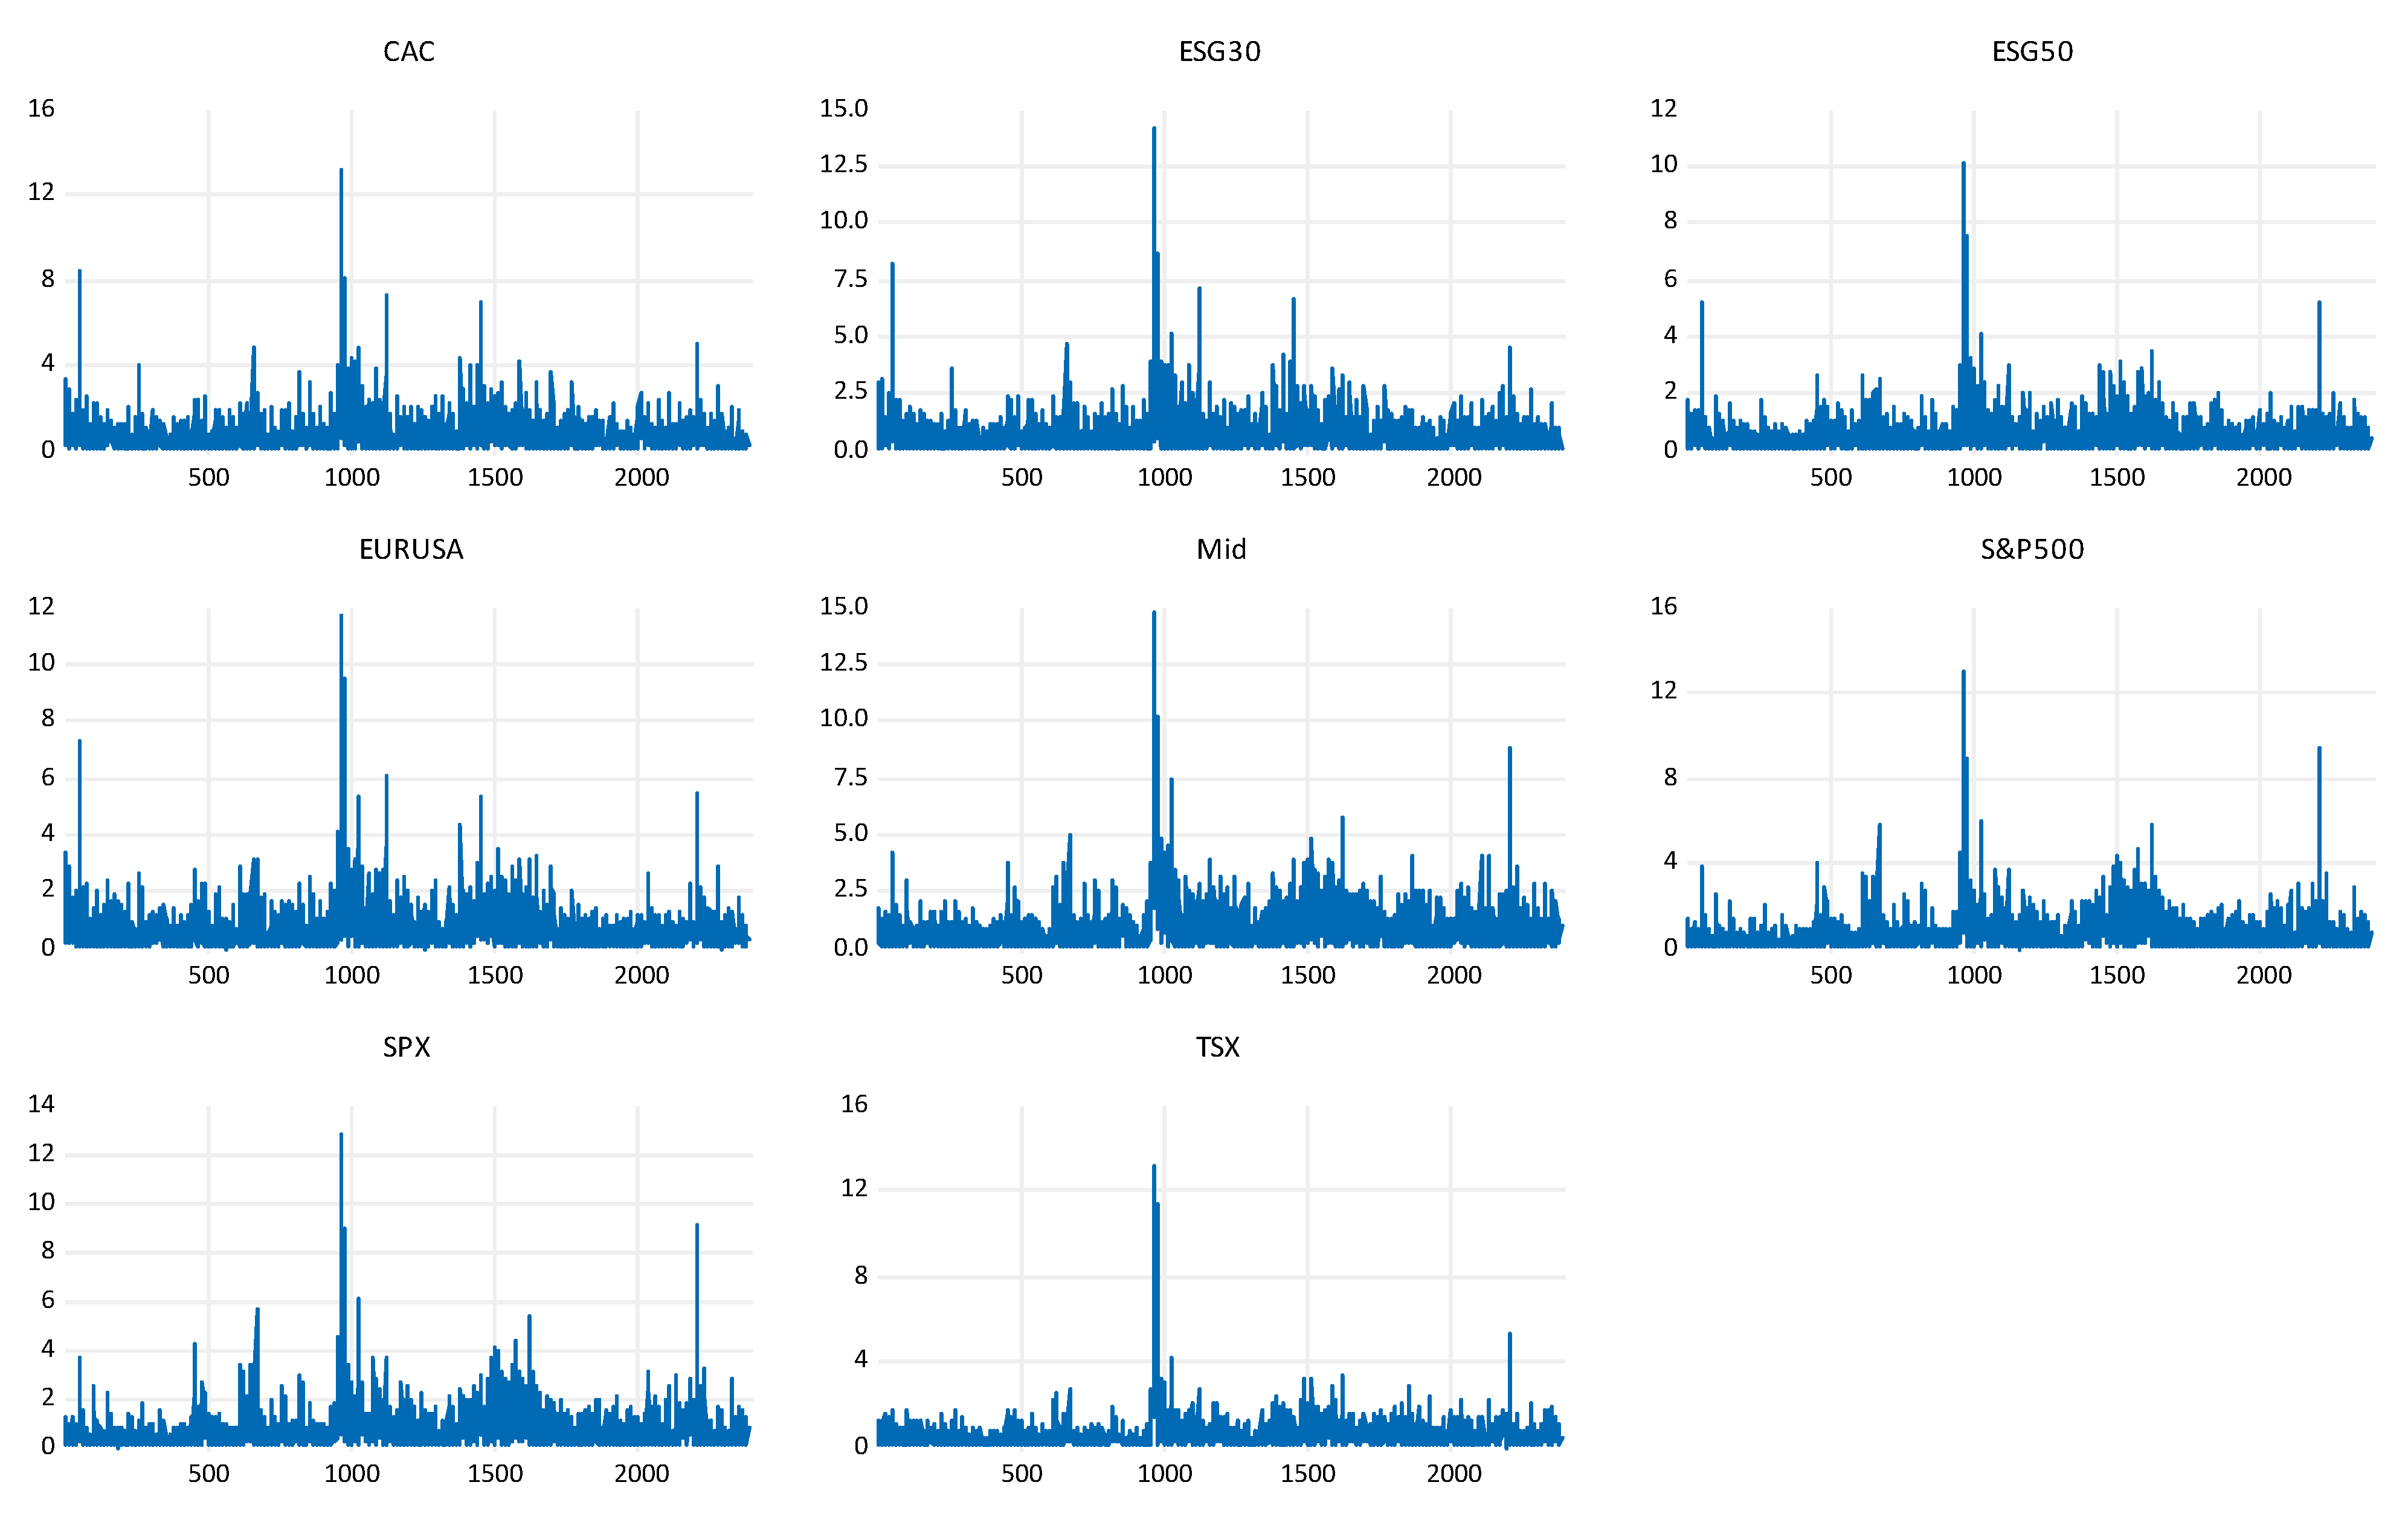
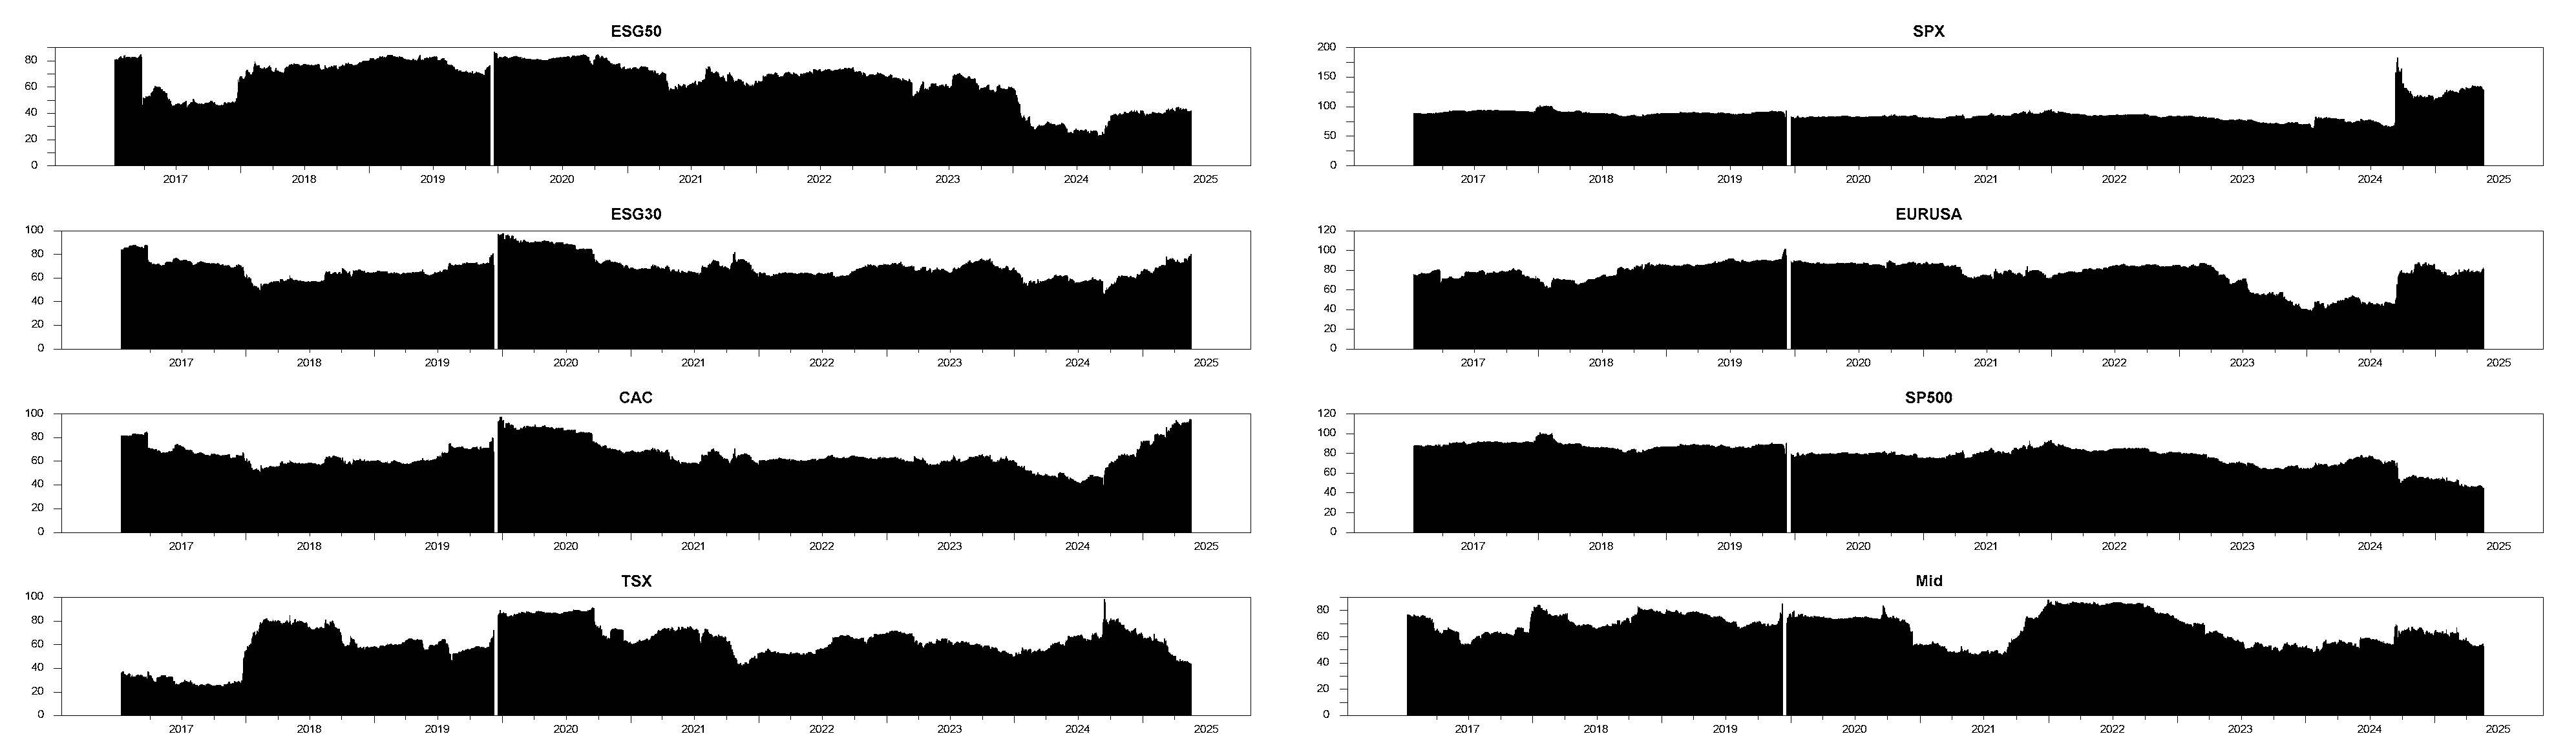
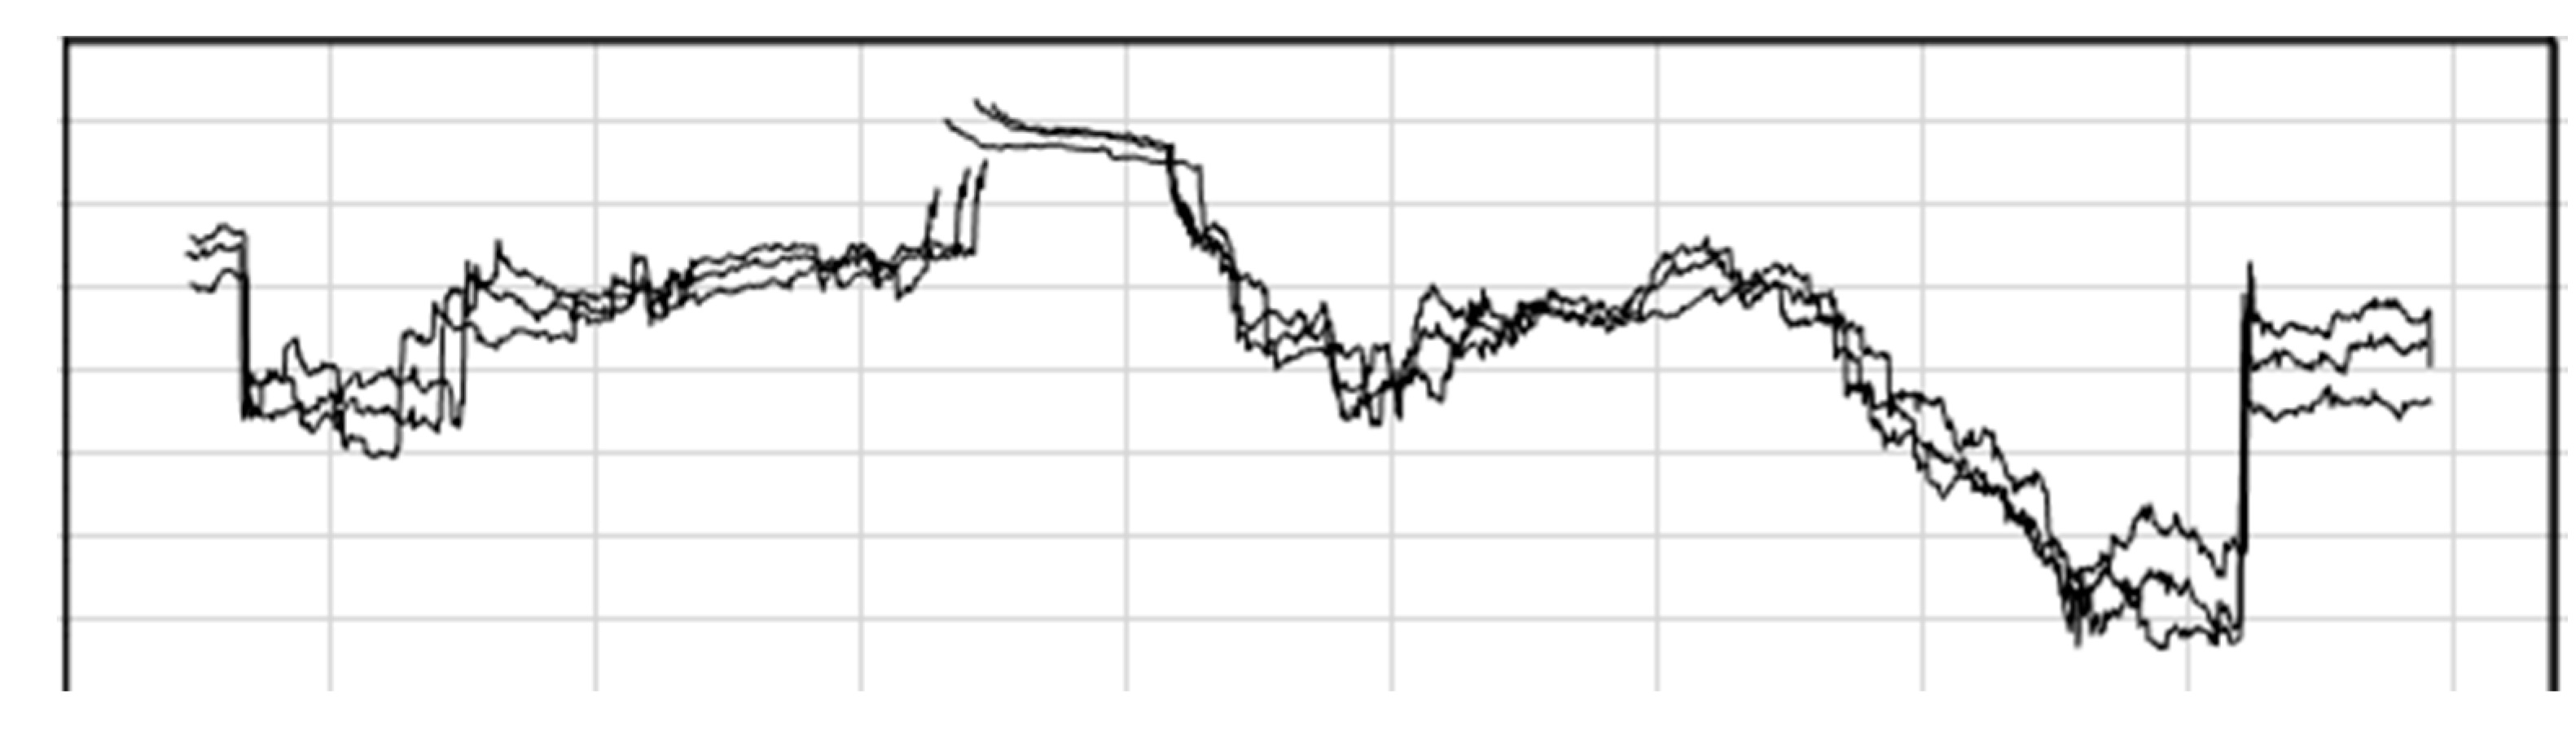
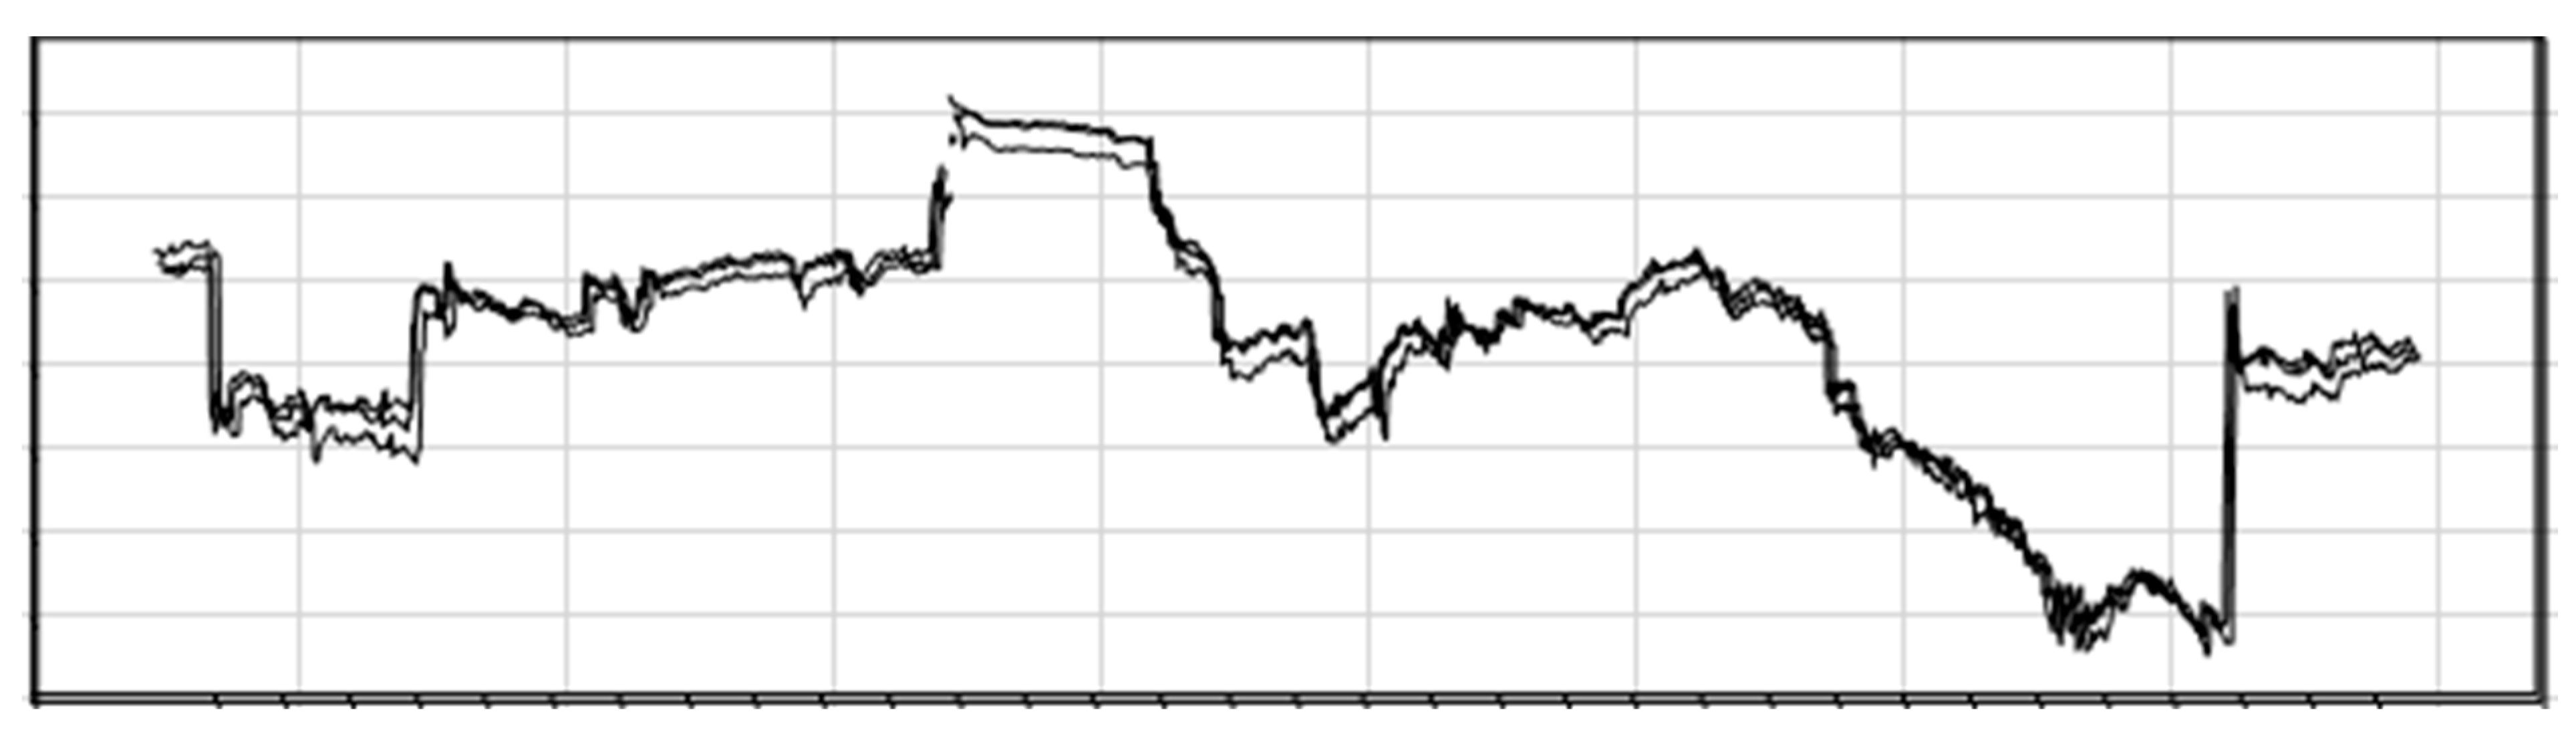
This study is heavily reliant on the use of daily data spanning from 1 April 2016 to 31 December 2025, giving a total of 2382 observations. The focus of this study is the integration of ESG (Environmental, Social, and Governance) in portfolio optimization; as such, the sample for this study will include financial, ESG, and sustainability indices. Figure 2 presents the plot of all variables. The financial indices will include: S&P Global 50 ESG Select Equal Weight Index (USD) (ESG50), S&P Eurozone 30 ESG-Momentum Select Equal Weight Index (EUR) (ESG30), S&P EuroUSA 30 Natural Resources Efficient ESG Select Equal Weight 5% Decrement Index (EUR) NTR (EURUSA), S&P 500 Sustainability Screened Index (USD) (S&P500), S&P MidCap 400 Sustainability Screened Index (USD) (Midi), Composite French Trading Index (CAC 40) (CAC), S&P 500 Composite Trading Index (SPX), and S&P/TSX Composite Trading Index (TSX) as illustrated in Table 1.
Figure 2.
Variable plot.
Table 1.
Variable description.
3.2. Econometric Framework
This study employs the Diebold and Yilmaz framework and the Dynamic Conditional Correlation model (DCC-GARCH) to comprehensively capture volatility spillover transmission and connectedness as well as portfolio optimization across global markets stemming from ESG integration.
To begin, the suitability of the DY for this study is backed by its ability to quantify directional volatility spillovers across markets using the unified vector autoregressive framework. Contrary to traditional causality–correlation testing, the DY decomposes the forecasted variance, enabling the retrieval of net shock transmitters and receivers. This further reveals the existing interdependence and systemic risks among ESG indices and the conventional indices. The DY’s ability to produce static and moving-window results captures the ever-changing market dynamics, particularly during periods of uncertainty, market failures, and structural changes, such as ESG index integration in portfolios. Hence, the DY provides an adequate and efficient mechanism relevant in the assessment of market volatility spillovers, connectedness, and global risk transmission relative to ESG portfolio integration.
Secondly, the applicability of the DCC-GARCH model in this study is justified by the variation in the conditional correlation over time in financial markets, further accentuated by the occurrence of volatility clustering. Generally, ESG and conventional indices aggregate to reflect the non-constant correlation between them, most especially during periods of global market failures and crises. These dynamics are efficiently captured by the model through its accuracy in the estimation of time-varying hedge ratios and optimal portfolio weights, including adjusted risk diversification strategies and combinations. The latter further ascertains if ESG index integration in portfolios mitigates risk and improves returns.
Generally, the joint use of the DY2012-DCC-GARCH is justified by the fact that they account for time-varying volatility dynamics and directional spillover effects, which alternative models do not possess. Individually, the DCC-GARCH’s flexible correlation asset analysis puts it a step ahead of the static models, such as the CCC-GARCH and the BEKK. The DY quantify net transmission shows systemic connectedness using the decomposed forecast error variance, while other volatility models like the stochastic volatility model and the standard VAR do not account for conditional heteroscedasticity. Hence, the DY2012-DCC-GARCH for the analysis is optimal.
3.3. Methodology
The methodologies employed in the treatment of the data and analytical procedures are explained in the sub-sections.
3.3.1. Return Derivation
The research will be quantitative with the exclusive utilization of secondary data and statistical measures. To begin with, the prices for all the aforementioned indices are set relative to make certain of no occurrence of missing figures. Worthy of note is the fact that no data fitting technique has been used for the missing variables. The data set was synchronized by common trading days only.
Given that the prices of the variables have been equalized, the returns of each of the indices are generated. This is done by logarithmic data transformation. By so doing, the mentioned indices lose an observation. This is mathematically illustrated as follows:
where Rt is the logarithmic return, ln is the natural logarithmic function, P1 is the current price, and P0 is the previous price.
3.3.2. Spillover Estimation
The spillover of the return series with reference to the DY approach is derived in its respective absolute values. The Diebold and Yilmaz model is derived from the generalized forecast error variance decomposition (GFEVD) of the vector autoregressive model postulated by [30]. The establishment of the basic VAR model is given as follows:
where Yt refers to the endogenous variables of t; w1 refers to the coefficient of the matrices; and ɛt represents the independent and identically distributed error term. The resultant dynamic changes with a system, regarding the coefficient of the moving average, tend to be a dominant factor in the understanding of this concept. The forecast error decomposition VAR overcomes this issue [31,32]. This is given as follows:
where is the standard deviation for the error term relative to the bth equation; ∑ refers to the error vector variance matrix; and αc shows the vector selection of values of 1 and otherwise 0 for the αth term. It should, however, be noted that the sum of variance decomposition elements will never be equal to 1. Hence, its further normalization is mathematically given as:
where = 1 and = N.
Thus, the total volatility spillover index based on the above elements is mathematically illustrated as follows:
The resultant directional spillovers as a function of the aggregate total spillover are reflected in both Equations (6) and (7) as follows:
The net volatility spillover is a derivative form of the difference arising from the shocks to the market and from the market. This is illustrated as follows:
If > 0, market i is a net transmitter of volatility. If < 0, it is a net receiver.
3.3.3. Dynamic Conditional Correlation (DCC) Model and Portfolio Optimization
Engle [33] developed the autoregressive heteroscedasticity model. The mathematical illustration of the model ARCH(q), inclusive of the conditional variance, is given as follows:
where εt−i denotes the lagged error term, and θ denotes the model parameters.
Bollerslev [34] developed the generalized ARCH model, also denoted as GARCH(p.q). Their version included p lags of the conditional variance in the linear ARCH(q) shown in the previous equation. The conditional variance of the simplest GARCH (1,1) is given as follows:
It is worth noting that the conventional multivariate GARCH (MGARCH) model, though linear, is unable to account for the dynamic relationship between many variables. Reference [35] developed the Constant Conditional Correlation (CCC) for such situations. The specified variance–covariance matrix for the CCC model is given as:
where Dt refers to the diagonal matrix containing the conditional standard deviation on the leading diagonal, and R denotes the conditional correlation matrix.
Worthy of note is the fact that the major drawback of the CCC model is the fact that the correlation between variables is very much constant over time, which happens to be very unrealistic in financial markets. The DCC framework proposed by [7] is better suited for financial data analysis, given its ability to aggregate and estimate time-varying correlations amongst the assets, and is equally inclusive of its non-linear nature. The DCC employs the use of the maximum likelihood estimator, which enhances the independence of the variance estimation. The DCC model further makes provision for R to be time-varying. This is illustrated below as follows:
where Rt is the time-varying conditional correlation matrix. The specified Rt in the latter is given as:
where Qt is a time-varying symmetric, positive definite matrix and diag (Qt) is a diagonal matrix composed of Qt’s diagonal elements. Hence, the Qt matrix follows the GARCH-type process given as:
where S is zt’s unconditional correlation matrix, and a and b are non-negative scalar parameters whose sum is less than unity.
Ht = Dt Rt Dt
Rt = diag (Qt)−1/2Qt diag (Qt)−1/2
The model uses the univariate GARCH model in the estimation of conditional variances of the individual variables. Furthermore, with the use of standardized residuals, it estimates the dynamic conditional variance and correlation for the variables under examination.
3.3.4. DCC-GARCH R2 Model
This study employs the use of the DCC-GARCH R2. This model was developed by [36]. The econometric framework’s suitability for this study is backed by the fact that it enhances portfolio optimization during spillover-related periods and its optimal and efficient reflection of time-varying dependence between variables. This model incorporates the Dynamic Correlation GARCH modeled by [7], the decomposed R2 model [37], and, of course, the Diebold–Yilmaz volatility spillover framework [38]. With respect to this model, the time-varying conditional variances and correlation are estimated using the multivariate DCC-GARCH, with the explanatory power amongst the variables ascertained with the aid of the Dynamic Conditional R2. The quantifiable directional spillovers with respect to the connectedness matrix are generated from the decomposed R2 coefficients. Mathematically, the DCC-GARCH R2 is specified as follows.
Firstly, the univariate GARCH specification is given as follows:
where .
The dynamics of the DCC from which R2 is computed, based on the DCC-GARCH model, are thus given:
The dynamic conditional R2 is computed as follows:
where = the Dynamic Correlation for DCC.
The total explanatory power for variable i is decomposed based on the [37] framework and is illustrated as follows:
where represents the directed connectedness that is the explanatory power of j in i.
Thus, the R2 connectedness matrix is given as follows:
The connectedness measures are given as follows below:
- (i)
- Total Connectedness Index (TCI)
- (ii)
- Directional Connectedness
From Directional Movement
To Directional Movement
- (iii)
- Net Connectedness
3.3.5. Portfolio Weight Derivation
The conditional variances and covariances from the DCC model are employed in the derivation of the optimal weights with respect to the diversification principle of the modern portfolio theory. The derivation of the optimal weight based on the MPT is mathematically illustrated below as follows:
where is the optimal portfolio weight for asset x; is the optimal portfolio weight for asset y; is the conditional variance for asset x; is the conditional variance for asset y; and is the conditional covariance of asset x and y.
where is the conditional correlation between x and y at time t; is the conditional covariance of both assets at time t; is the conditional variance of x at time t; and is the conditional variance of asset y at time t.
4. Results and Interpretation
The results of the study are presented and interpreted in this section.
4.1. Exploratory Results
This section of the research will entail the illustration of the descriptive statistics and graphical illustration of the return series.
Descriptive Statistics
Table 2 shows the descriptive features for the respective indices in the return series. The mean values are positive, with the S&P500 being the highest, with values above the median across all indices. The series is negatively skewed. The highest standard deviation is recorded by the Midi (1.347), making it the most dispersed, while the ESG50 (0.864) happens to be the most volatile. Generally speaking, ESG indices show lower dispersion tendencies indicative of risk mitigation properties when benchmarked with conventional market indices. All indices in the return series are highly leptokurtotic and not normally distributed.
Table 2.
Return series properties.
Similarly, Table 3 shows the descriptive statistics for the volatility series. The highest mean volatility is related to Midi (0.904), and the lowest in the ESG50 (0.575). The maximum volatility for all indices is the mirror reflection of the minimum returns, with the highest observable fluctuations above 14%, the ESG30 and Midi, while the calmest fluctuation is by the ESG50. The volatility series is highly leptokurtotic, with the highest index being the TSX.
Table 3.
Volatility series properties.
Aggregately, the ESG50 consistently portrays lower risk tendencies, reaffirming the defensive qualities associated with ESG-related portfolios. Both series are highly leptokurtotic and do not follow a normal distribution. Worthy of note is the fact that the non-normality feature is relevant in risk modeling relative to the Gaussian return assumption.
4.2. Empirical Results
The results from the return series analysis are illustrated in the subsequent sub-sections.
4.2.1. Cross-Market Linkages
The results retrieved from the spillover and connectedness analytical procedures, subject to time-invariable and time-variable scenarios, as well as the resultant portfolio optimization pairs, diversification possibilities, and risk mitigation through hedging, will be illustrated in this segment.
4.2.2. Static Analysis
Table 4 shows the cross-market linkages that exist among the ESG50, ESG30, CAC, TSX, SPX, EURUSA, S&P500, and Midi, representative of major ESG, sustainability, and financial market indices. The volatility transmission to the other instruments is denoted by TO, while the shocks received from other indices, inclusive of its own, are denoted by FROM. The differential in the market shock is the net volatility, that is, the difference from TO–FROM.
Table 4.
Volatility spillover among stock indices.
The estimated total volatility spillover index amongst the indices is about 76.95%. This index represents the aggregate expected shock transmission amongst the aforementioned variables. This further accounts for the residual fluctuations relative to the stock market. It is worth noting that the high volatility index estimated at 76.95% is justified by high financial global integration and crisis intensification, further accentuating volatility spillovers [39,40]. This in itself enhances the effective enactment of well-informed policies and decision-making by business stakeholders. The largest net volatility index is the SPX, 5.3%, while the lowest net volatility index is CAC (−5.8%). Based on static analysis, the SPX, TSX, EURUSA, and S&P500 are net volatility transmitters while the ESG50, ESG30, CAC, and Midi400 are net volatility receivers.
4.2.3. Dynamic Analysis
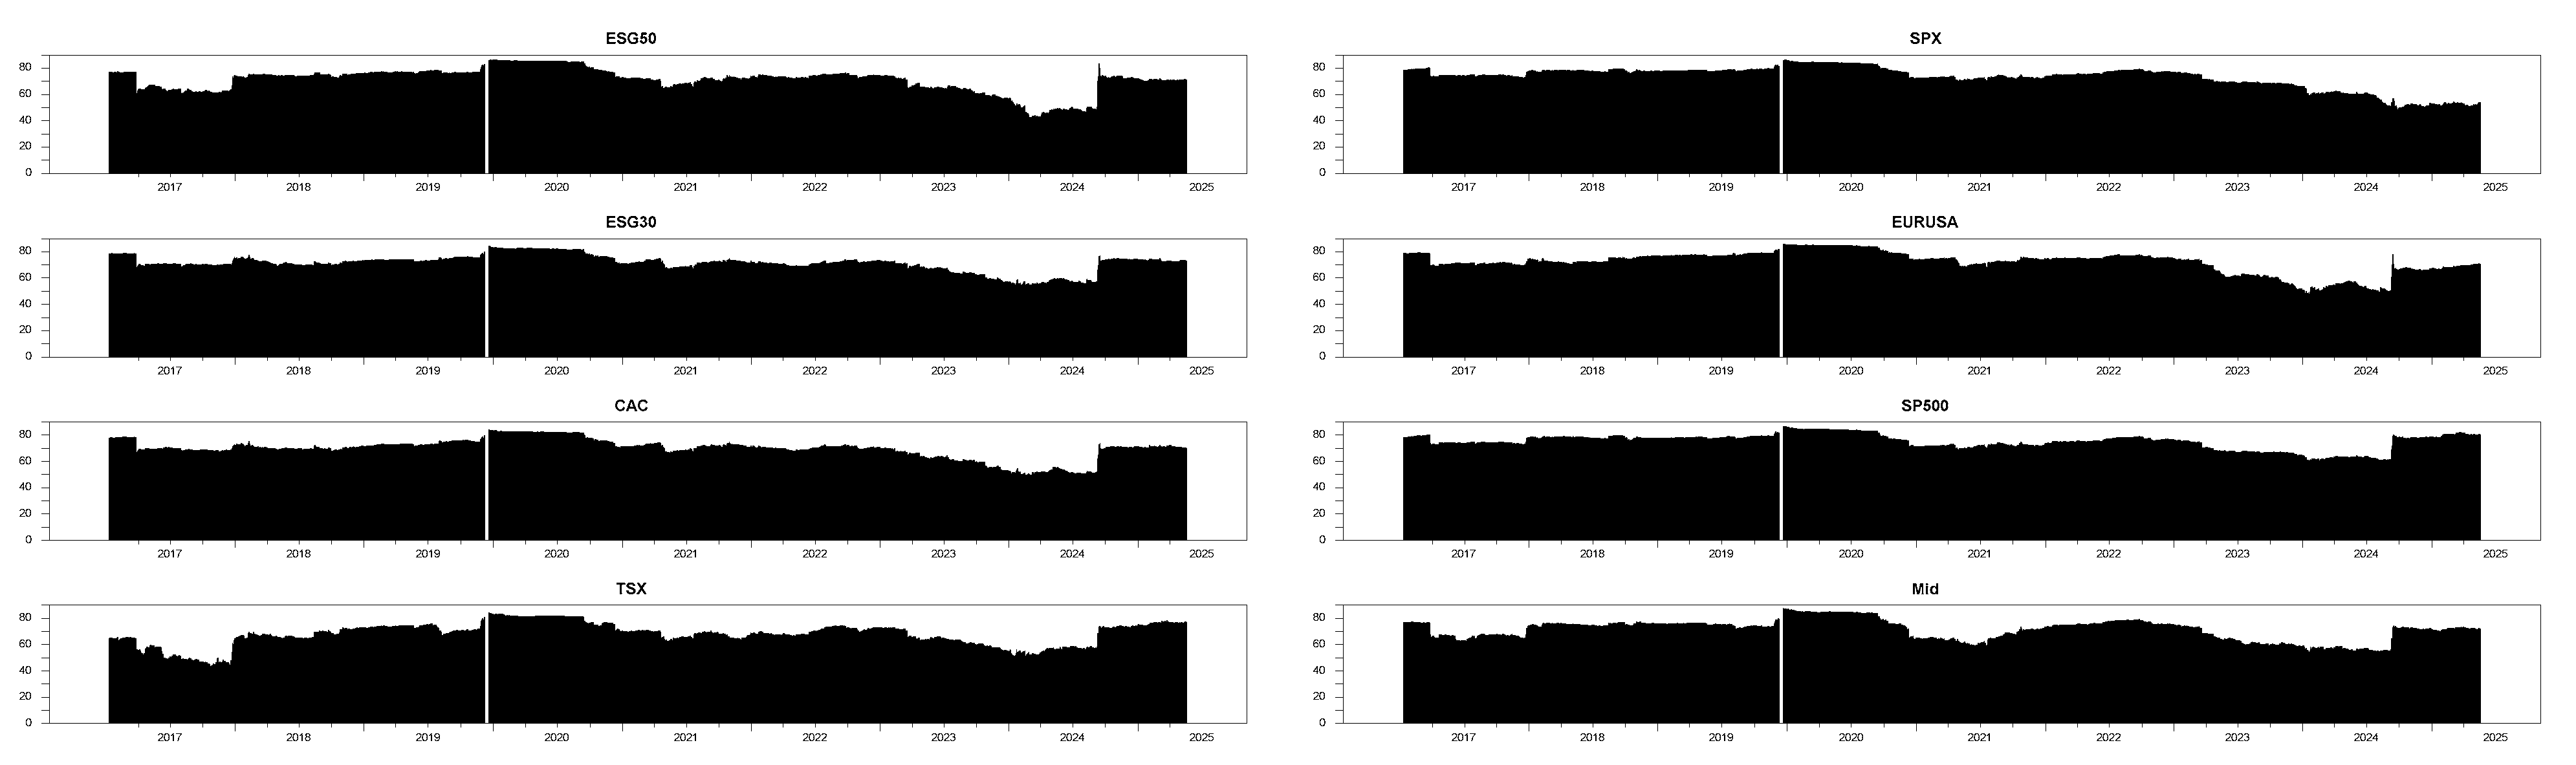
This analysis is also known as the moving window analysis. The latter is based on a set of ESG, sustainability, and financial indices comprising the ESG50, ESG30, S&P500, Midi400, TSX, SPX, and CAC, with the study period from 1 April 2016 to 31 December 2025. The study comprises 2382 observations. The graphical illustration in Figure 3 is based on a 200-day rolling window. The 200-day rolling window is buttressed by the fact that it corresponds to one trading year whose time frame incorporates business cycle volatility transmission and a stress-related period whose empirical outcome is economically viable, reliable, and unbiased. The estimated total spillover ranges from 50% to 90%. To begin, the pre-pandemic period 2016–2019, with average total spillover indices from about 65% to 75%, implies the occurrence of fluctuations characterized by little or no systemic shocks (Figure 3). Such events include the 2017 Brexit referendum and the increase in US interest rates, whose shock generated contained disturbances [26]. Equally, the increase in capital flows between countries enhanced residual volatility spillovers, though rotating around baseline fluctuations [39].
Figure 3.
Time-varying volatility returns.
Furthermore, the pandemic period, 2019–2020, featured estimated spillover indices of about 90%. This is a most unprecedented global crisis with far-reaching consequences, overshadowing the 2008 subprime mortgage crisis and the European debt crisis. The COVID-19 pandemic resulted in a liquidity crisis and global economic recessions, evidenced by the occurrence of persistent shocks in the global financial markets and meltdown points [41]. The outbreak of the pandemic accounts for the establishment of new volatility transmission channels [42].
Moreover, the post-pandemic period, 2020–2022, featured the occurrence of estimated spillover indices from about 70% to 80%. The aforementioned spillover index was due to the residual effects of the COVID-19 pandemic, coupled with the outbreak of the Russia–Ukraine war. Worthy of note is the fact that geopolitical and health-related risk equally enhance volatility spillovers [43]. The noticeable 2022 peak is backed by the outbreak of the Russia–Ukraine war, given that the system was already in distress as a result of the pandemic outbreak.
In addition, the gradual decline observed from 2022 to 2024 witnessed a sharp fall in the spillover indices from about 75% to 55%. The drastic fall in the spillover indices is associated with policy stabilization and market adaptability. A good example of such a scenario was the observed decline in interconnectedness between BRICS member countries despite the suggested partial decoupling trend with respect to political and economic intensification tendencies [44].
Lastly, a sharp increase in late 2024 of about 75% can be said to be the by-product of monetary or geopolitical policy implementation. For instance, the witnessed increase in the US unemployment rate and the second increase in the Bank of Japan’s interest rates since 2007 at the start of August 2024 directly enhance both the S&P500 and ESG measures.
The long-term decomposed directional spillover effect TO based on a 200-day rolling analysis is illustrated in Figure 4. The illustration shows significant fluctuation over the study period. Based on the illustration, the transmitted volatility is relatively moderate and stable, ranging between spillover indices of about 40% to 60%. The observable 2020 spike occurrence within the illustrations is a result of the COVID-19 pandemic outbreak. This, in effect, suggests that the ESG50 is a volatility transmitter during the crisis period, given that the spillover index ranges from about 40% to 60%. Similarly, the ESG30 exhibits an identical behavioral pattern, though it is less tense when compared with its counterpart, the ESG50.
Figure 4.
Directional volatility spillovers, TO.
Figure 5 below illustrates the long-term decomposition of the aforementioned return series. It also illustrates the transmitted volatility spillovers from other indices, including its own. The ESG index ESG50 exhibits spillover ranges between 40% and 60 characterized by an upward trend movement post 2020, indicative of an increase in ESG equity market integration. An identical behavioral pattern is observed with the ESG30 with gradual shock absorption properties.
Figure 5.
Directional volatility spillovers, FROM.
Aggregately, the ESG indices ESG50 and ESG30 are more net volatility receivers than net volatility transmitters, given the observed increase in ESG-related investment post-2020. Moreover, the spike occurrence characterized the manifestation of crises such as the COVID-19 pandemic and the Russia–Ukraine war. The residual fluctuations based on the manifestation of the events resulted in intense connectedness, attesting to the fact that high fluctuations are end-products of the global crisis.
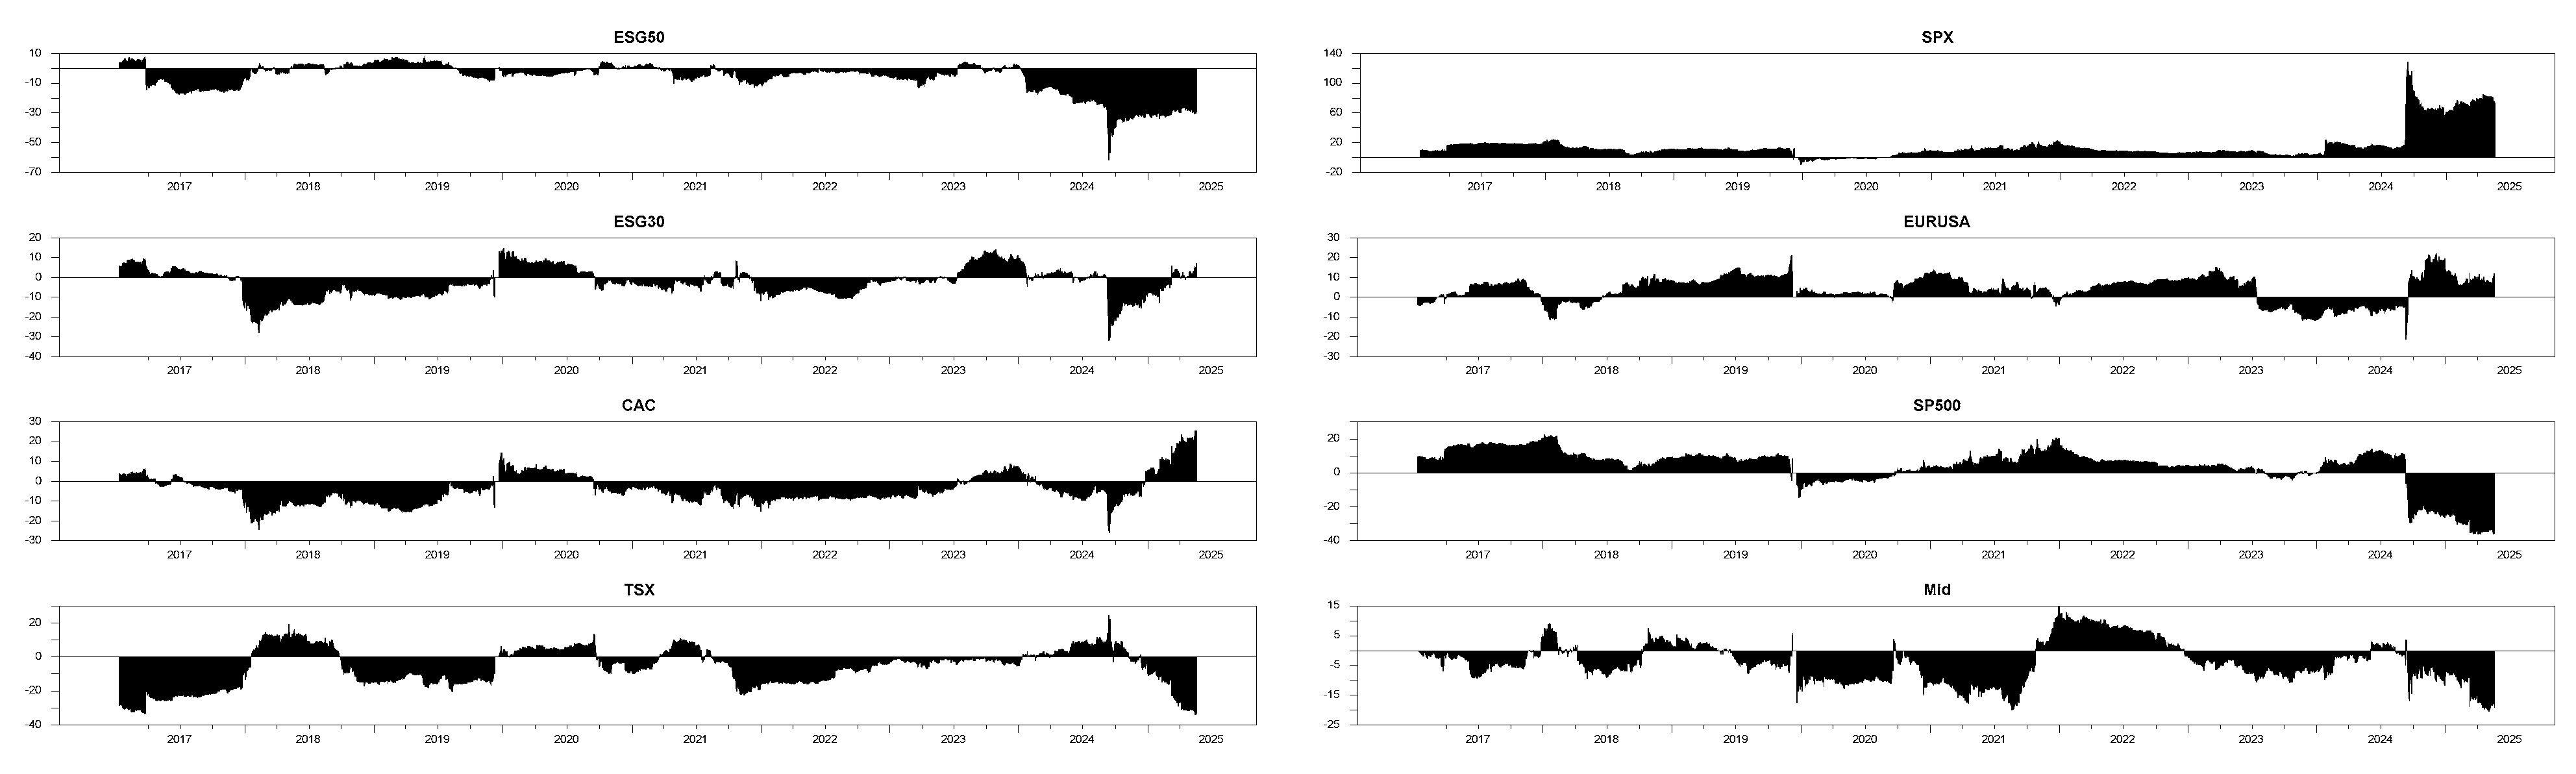
Conclusively, the moving-window analysis demonstrates that the ESG indices ESG50 and ESG30 are relatively stable in nature. Thus, both indices are net volatility transmitters as reliably illustrated by Figure 6 below. The dynamic analysis is more reliable and consistent than the static analysis because it takes into consideration changes in the immediate business environment and, to some extent, accounts for the uncertainties as well as risk quantification.
Figure 6.
Net volatility spillovers.
4.3. Robustness Checks
4.3.1. Sensitivity Analysis Rolling Windows
Robustness checks were carried out with respect to the dynamic analytical procedure, with emphasis on the rolling window analysis. The 180- and 250-day rolling windows were used. The justification for the use of the aforementioned rolling widows is backed by the fact that they capture the short-term and long-term outcomes, which, in effect, enhances the consistency and reliability of the empirical findings. With respect to the use of both the 180- and 250-day rolling windows, the retrieved empirical findings are reliable and consistent with the model, as illustrated below in Figure 7.
Figure 7.
Robustness checks for rolling window.
4.3.2. Sensitivity Analysis Lag Checks
Robustness checks were carried out with respect to the dynamic analytical procedure with emphasis on the lag structure. The 4 and 2 lag structure was used. The justification for the use of the aforementioned rolling widows is backed by the fact that they capture the short-term and long-term outcomes, which, in effect, enhances the consistency and reliability of empirical findings. With respect to the use of both the 4 and 2 rolling lag structures, the retrieved empirical findings are reliable and consistent with the model, as illustrated below in Figure 8.
Figure 8.
Robustness check for lag structure.
4.3.3. DCC-GARCH R2 Connectedness Approach
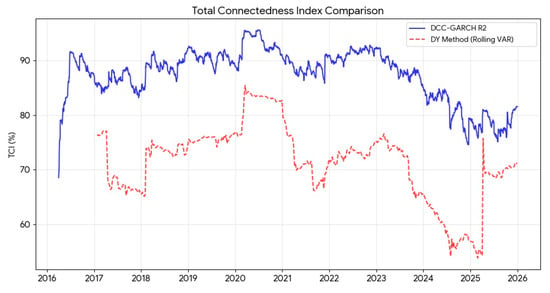
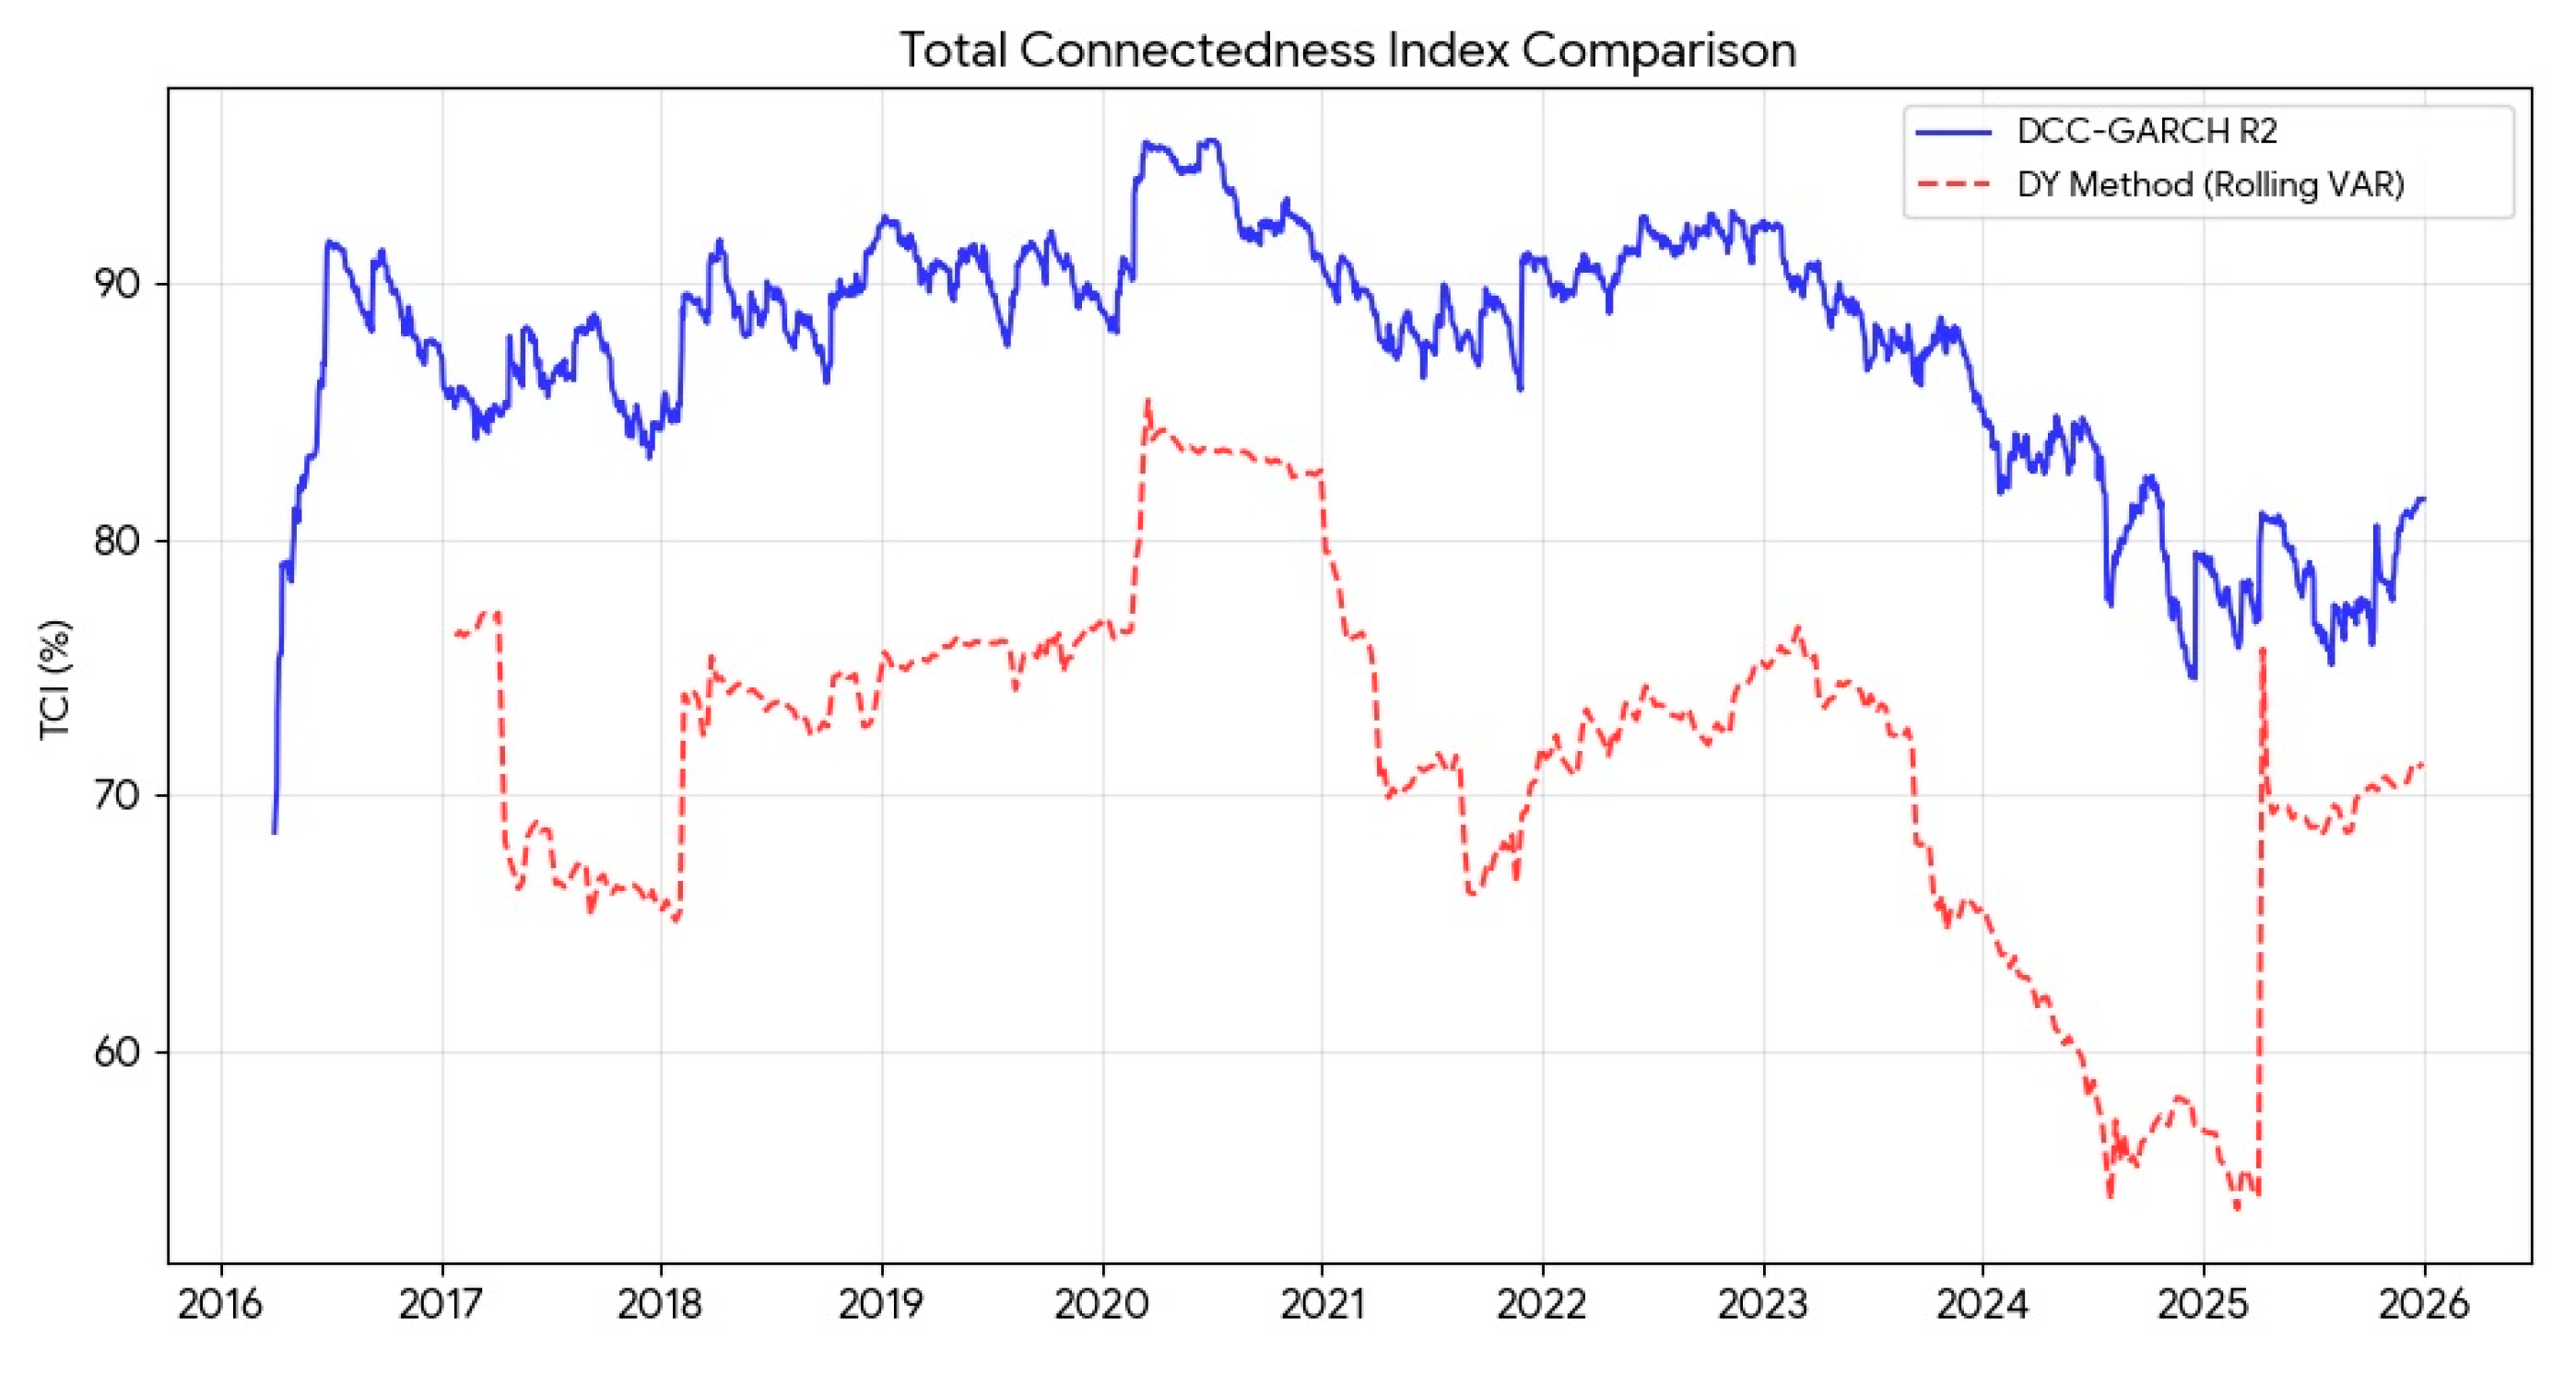
The aforementioned tables (Table 5 and Table 6) illustrate a total connectedness index of 76.09% with respect to the DY2012 framework and of about 87.39% for the DCC-GARCH R2. The results of the latter confirm the estimated total volatility index of about 76.95%. This confirms that the period under study is crisis-related with significantly high interdependency affinities. Aggregately, the tabular representations indicate that the TSX is a reliable volatility transmitter while the ESG30 and CAC, as European indices, are net volatility receivers.
Table 5.
Static analysis DCC-GARCH R2.
Table 6.
Static analysis DY2012.
Figure 9 below shows the total connectedness index comparison based on comparative trends with respect to the DY2012 and DCC-GARCH R2. Given the structurally stable nature of the DCC-GARCH R2 and the sensitive and crisis-reactive nature of the DY2012 method, the retrieved empirical outcome shows high interconnectedness throughout the sample. It is worth noting that, despite the similarity in the trends, there is significant divergence post-2022.
Figure 9.
Total connectedness index comparison.
4.4. Strategic Asset Allocation
Table 7 illustrates the average conditional correlation, optimal portfolio weights, and hedge ratios. The magnitude of the correlation movement for index pairs ranges from weak positive to strong positive. When compared with financial indices, the ESG50 exhibits higher co-movements relative to the ESG30. Specifically, the ESG50 pairs with the S&P500 (0.54) and SPX (0.53) are strong positive, while pairing with the ESG30 yields moderate correlation of 0.32 and 0.31, respectively. This implies that the ESG50 is more closely integrated to the mainstream equity market than the ESG30. The highest correlation, 0.87, is observed in the index pair ESG-CAC, which is greatly enhanced by the overwhelming weight of European ESG constituents within the ESG30. Similarly, the strong positive correlation observed between the index pairs CAC-EURUSA (0.71), ESG30-EURUSA (0.73), S&P500-Midi (0.73), and SPX-Midi (0.71) suggests the existence of a financial integration nexus between European and US equity markets. Conversely, the observed weak correlations (CAC-S&P500 (0.30), CAC-SPX (0.30), and CAC-Midi (0.29)) are observed with index pairs characterized by the association of the French composite trading index, given that the idiosyncratic risk associated with their equity markets is retained.
Table 7.
DCC coefficients, portfolio weights, risk, and uncertainty.
Based on the MPT, favorable risk-adjusted attributes based on allocation are illustrated with respect to weights. For instance, with respect to the ESG50-CAC index pair, the assigned weight for the ESG50 is 0.83 while that of the CAC is 0.17, indicative of the fact that the minimum-variance portfolio is dominated by the ESG50. This trend is repetitive for all ESG50-based index pairs, consistent with the risk-deductive assertions attributed to ESG indices. Conversely, the ESG30 portrays reverse or average portfolio weightings. For example, regarding the ESG30-SPX pair, the assigned weight for the ESG30 is 0.39 while that of the SPX is 0.69, indicative of the fact that the ESG30 plays little or no role in risk mitigation.
With respect to the hedge ratios, index pairs associated with strong co-movements such as ESG30-CAC (0.90), SPX-Midi (0.85), TSX-Midi (0.89), and S&P500 (0.84) require near proportional short positioning for optimal effective hedging. On the other hand, index portfolio pairs characterized by low hedge ratios, CAC-TSX (0.22) and CAC-SPX (0.28), less than proportionately offset the directional risk of the second asset. It should, however, be noted that the index portfolio pairs associated with low hedge ratios are equally moderately correlated.
5. Discussion
The retrieved results emanating from the analysis will be discussed in this segment.
5.1. Volatility Spillover Analysis
This study is centered on sustainability investment and ESG market portfolio implications under a volatile business environment. To begin with, the total volatility index, estimated at 76.95%, suggest that approximately 77% of the fluctuations are cross-market spillovers rather than their own. Hence, the total volatility index implies that the markets are highly integrated as well as very much prone to crisis-related scenarios. Also, the net transmissiveness portrayed by the SPX, TSX, and EURUSA based on static analysis shows the highest to be the SPX, which aligns with assertions relating to the fact that shocks emanating from energy and financial markets outwardly spread into both sustainability and ESG indices [26]. Hence, the systemic risk drivers have been the pan-regional and North American indices. However, this systemic shift in volatility spillovers as a result of global financial crises, backed by the coefficient of the total volatility index, is consistent with [28]. The net receivers are the CAC, ESG30, Midi, and ESG50. The ESG indices act as shock absorbers to financial indices. This adheres to the fact that financial contagion within a portfolio is offset by the ESG index, consistent with the existing literature, most especially during the global financial crisis [12]. Lastly, the near-neutral position showcased by the S&P500 as a net marginal volatility transmitter implies its shock receiver and absorption properties are subject to its cross-market status. The duality is it status coincides with the existing research of bidrections returns and volatility connectedness across ESG [23].
Furthermore, the noticeable volatility clustering around 2020 is justified by the COVID-19 pandemic outbreak and the 2022–2024 residual fluctuations attributed to the joint occurrence of the Russia–Ukraine war, financial market energy instabilities responsible for the increased spillover connectedness [13]. The high correlation between ESG30-CAC is attributed to green transitioning and geopolitical risk, empirically backed by the existing literature relative to sustainability investment and vulnerabilities in ESG market [3,45] integration, spillover connectedness, and portfolio optimization implications.
5.2. Portfolio Diversification
The efficiency of portfolio diversification is relative to risk minimization as a by-product of optimal capital allocation. With respect to the derived MPT weights and hedge ratios, portfolio optimization and diversification could be attained via heavy ESG allocations. Most of the ESG50-based pairs heavily favor the ESG50 index. Hence, the minimum-variance portfolio-seeking investor should weight more of their portfolios with the ESG50 than financial instruments. Thus, financial market indices require a substantial hedge through ESG relative to the long-run position. The hedging effectiveness observable by the ESG index aligns with the reductive risk properties as well as the viability of ESG investment, most especially during crisis periods [46,47]. Asymmetrically, the weight subject to the ESG30 is outperformed by financial market indices. Thus, ESG30 offers weaker risk-reductive affinities and hedging delimitation properties backed by the existing literature [15,22].
Connectedness and Portfolio Implications for Sustainable Investors
The observable high volatility spillover index in the From row shows that an enormous number of exogenous shocks are absorbed by every index. Conversely, the most influential net volatility spillover transmitters are the SPX and EURUSA, very much consistent with the leadership role of the US and pan-regional indices [48]. Furthermore, the joint evidence of the MPT, volatility spillover, and hedge ratio suggests that ESG30-based index pairs may be defensively used given their superior variance reductive attribute, while ESG50-based index pairs based on the MPT weights may be used for optimal hedging given high hedge ratios. The joint use of the latter is categorized as a layered risk management strategy.
6. Conclusions
This study investigates sustainability investment under distress and ESG market portfolio implications for the ESG50, ESG30, CAC, SPX, TSX, Midi, EURUSA, and S&P500 corresponding to ESG, financial, and sustainability indices from April 1st, 2016 to December 31st, 2025, with evidence from the DY framework and the DCC-GARCH model.
The static analysis shows that the ESG50, ESG30, CAC, and Midi are net volatility receivers while the TSX, PSX, EURUSA, and S&P500 are net volatility transmitters. The total volatility spillover is estimated at 76.95%. The dynamic analysis, given the incorporation of time and other exogenous factors, illustrates recorded peaks at different time stamps (2019–2020, 2020–2022, 2022–2024 and late 2024).
Based on the DCC-GARCH, the empirical results show that all indices exhibit positive co-movements alongside an observed stronger integration affinity for the ESG50 with financial indices than for the ESG30. The observed strong correlations illustrate the existence of an intense financial integration between European and transatlantic equity markets. Also, the minimum-variance portfolios reveal the ESG50’s risk-deductive properties relative to financial indices, while the ESG30, on the other hand, diminishes portfolio viability given its restrictive attribute. Lastly, index pairs affiliated with the CAC index feature low hedging costs as they are weakly correlated, as proven by the magnitude. Conclusively, ESG inclusiveness in portfolio construction goes beyond ethical norms and considerations, given the imperative importance of portfolio diversification, risk, and portfolio management, and efficient hedging strategies.
6.1. Theoretical Implications
This section of the study underscores the contributions relative to the earlier discussed theoretical frameworks. Based on our study, the retrieved empirical results provide insightful understandings relative to sustainability investment under stress and ESG market portfolio implications from a global perspective. To begin, with reference to the MPT, the outcome from analysis via the provisions of weights affirms that ESG inclusion portfolios relative to optimization and diversification are not uniform but depend on factors such as the market regime and geographical market composition, accounting for the expansion of the original Markowitz variance framework. However, the existence of a strong correlation between the index pairs suggests a downtrend in diversification possibilities, which is consistent with the core principles of the MPT. Equally, the DCC-GARCH showcases the non-static nature of the financial and non-financial variables, giving provisions for changes subject to market and structural changes, hence, the inadequacies in capturing the full extent of sustainability investment and ESG market portfolio implications, most especially during chaotic periods, through static methodologies. In addition, the outcome of the DY suggests that ESG-related indices are heirs to systemic volatility spillovers emitted from financial market indices, with ESG indices being more structurally embedded than peripheral relative to global financial risk.
Moreover, network theory theorizes sustainability markets as the recipients of the shocks generated by the financial market indices; as such, the stability of the network heavily depends on the financial markets, hence the asymmetrical prevalence. The logical and physical arrangement of the aforementioned nodes enhances systemic reliance due to inter-node connections relative to capital flow and otherwise—in other words, the exhibition of the hub-and-spoke topology, where ESG indices occupy the peripheral nodes. Moreover, the retrieved results align with sustainable finance, which simultaneously affirms the hypothesis integration and challenges the premise of stabilization. This previously mentioned affirmation is backed by the fully positive correlation relationship for all ESG-based index pairs and mainstream financial integration, contrary to financial market indices subject to pricing mechanisms and regulatory frameworks. Given the net receiver status of ESG indices, sustainable finance theory suggests a third-generation reformulation making provisions for regime-dependent diversifications and dynamic connectedness. Again, the findings based on stakeholder theory are complicated by the fact that ESG indices are net volatility receivers. The aforementioned theoretical framework suggests the ESG benefit delimitations at the index level featured by the influence of wide market-range factors. This enhances market stability via the implementation of sustainable-oriented finance measures based on strategic stakeholder decision-making. Lastly, the empirical results subject to the EMH are suggestive of the semi-strong form, given the overwhelming prevalence of a wide magnitude correlation range from weak positive to strong positive, coupled with the extremely high total spillover index of about 76.95%. This implies that information is asymmetrically and gradually rather than instantaneously diffused across all the markets.
6.2. Practical and Policy Implications
This study provides practical and policy implications on sustainability investments in distress and ESG market portfolios from a global perspective, with the use of the DY and the DCC-GARCH, retail and networth investors, ESG index providers, and risk managers. To begin with, with reference to the MPT weightings, relative to institutional investors, minimum-variance portfolio construction should be dominated by the ESG50 given its optimal efficiency, and the hedge ratios should be frequently calculated rather than constantly fixed, given the fact that the constant shift in correlations is most especially seen during the crisis period (2022–2024). Secondly, the possibility of a fall in portfolio diversification despite the high correlation between the European index pairs ESG30-CAC (0.87) is of great importance to retail and networth investors, given that information completeness, comprising the conditional and regime nature, allows for better and more well-informed decisions, which enhance portfolio diversification. Again, the scope, constituents, and methodology in ESG indices are of prime importance to ESG index providers. This is justified by the fact that the ESG30, though an ESG index, diminishes the viability of portfolios given that it absorbs high volatility from financial market indices relative to the MPT weightings, further backed by the low hedge ratios. Hence, the scope, methodology, and constituents relative to the ESG index should be expanded so as to ensure the risk-deductive properties within the portfolio. Lastly, its implication relative to risk managers cannot be understated, given that it enhances stress market assessments via the incorporation of cross-market transmission aspects, most especially during crisis periods.
Despite the mentioned practical implications that can be directly implemented as illustrated above, the in-depth constraints of the study associated with institutional and international investors, and ESG strategists reveal redundancies relating to policy enactment and implementation. It goes without saying that policy-wise, the witnessed fragmentations across the region under study are due to inadequacies in moving disclosure-centric models to active market stabilization endeavors. This singular act enhances the identification of additional sources of systemic risk, such as the existence of structural interconnectedness added to informational gaps. Furthermore, dynamic hedging techniques such as the DCC-GARCH and other static ESG techniques should be adopted, given that these techniques incorporate time-varying correlation, most especially during crisis periods. In addition, standard ESG design and disclosures should be put in place so as to jointly enhance the scope and constituents of ESG indices, which in the long-term enhance the risk-deductive and stabilizing affinities. Moreover, central banks and financial regulators should include ESG disclosure in the macro-prudential framework, as this enables the early detection and containment of residual systemic risk. Furthermore, the government should enact countermeasures that would protect the organization from external shocks, hence ensuring organizational adaptability and continuity.
6.3. Research Limitation
This study, like any other, is not without its shortcomings. To begin with, data inadequacies restricted the study period, given that the availability of ESG indices data is limited to April 1ST 2016. Secondly, the Diebold and Yilmaz framework is based on the linearity concept and its stationarity assumptions, which may not be consistent with financial data, most especially during periods of market deficiencies and financial crisis. Again, the study exploits ESG as a single index without dissociating its respective individual effects on spillover and portfolio optimization. Additionally, the mean-variance methodology is fairly inadequate in analytics subject to asymmetric return risk, most especially in ESG-related investment. Lastly, the study is restricted to eight indices whose results may not be representative and applicable in other countries, most especially the developing countries.
6.4. Prospective Research
Prospective research can be done at the company and firm level for more insightful results. More so, future research in this area should employ asymmetric and non-linear econometric models, such as the non-linear autoregressive distributive lag model (NARDL) and the time-variable parameter model (TVP-VAR), for a better comprehensive understanding of the nature of the existing relationships between the variables. Again, future research in this area should expand variable size to include cryptocurrencies, equity, and decentralized financial assets for a more comprehensive and complete insight into ESG integration in portfolio optimization. Furthermore, prospective research in this area should investigate how investor sentiment and behavioral patterns can be enhanced through textual ESG analytics and survey-based sentiment integration for better understanding and completeness. Also, future research in this area should include methodological frameworks such as the utility-based ESG framework or conditional value at risk (C-VAR) for reliable ESG and risk management analysis. Lastly, further research could exploit comparative ESG score index performance.
Author Contributions
Conceptualization, A.A.E., S.Z.E. and M.S.; methodology, A.A.E. and M.S.; software, A.A.E.; validation, A.A.E., S.Z.E. and M.S.; formal analysis, A.A.E.; investigation, A.A.E.; resources, A.A.E., S.Z.E. and M.S.; data curation, A.A.E.; writing—original draft preparation, A.A.E.; writing—review and editing, A.A.E., S.Z.E. and M.S.; visualization, A.A.E.; supervision, A.A.E., S.Z.E. and M.S. All authors have read and agreed to the published version of the manuscript.
Funding
This research received no external funding.
Institutional Review Board Statement
Not applicable.
Informed Consent Statement
Not applicable.
Data Availability Statement
The raw data supporting the conclusions of this article will be made available by the authors on request.
Conflicts of Interest
The authors declare no conflicts of interest.
Abbreviations
The following abbreviations are used in this manuscript:
| ADF | Augmented Dickey–Fuller Test |
| CAPM | Capital Asset Price Model |
| DCC-GARCH | Dynamic Conditional Correlation-Generalized Autoregressive Conditional Heteroskedasticity |
| DY | Diebold and Yilmaz 2012 Framework [6] |
| EMH | Efficient Market Hypothesis |
| ESG | Environmental, Social, and Governance |
| MPT | Modern Portfolio Theory |
| TVP-VAR | Time-Varying Parameter-Vector Autoregression |
References
- Liao, Z.; Xu, C.-K.; Cheng, H.; Dong, J. What drives environmental innovation? A content analysis of listed companies in China. J. Clean. Prod. 2018, 198, 1567–1573. [Google Scholar] [CrossRef] [Scilit]
- Cheah, J.S.; Ng, C.-H.; Fianto, B.A.; Teoh, A.P.; Gan, C.; Anisha, A.I.I.N. Green innovation as a strategic imperative for sustainable business performance: Evidence from Malaysian industries during the COVID-19 pandemic. J. Clean. Prod. 2024, 470, 143355. [Google Scholar] [CrossRef] [Scilit]
- Lee, C.-C.; Lee, C.-C.; Li, Y.-Y. Oil price shocks, geopolitical risks, and green bond market dynamics. N. Am. J. Econ. Financ. 2021, 55, 101309. [Google Scholar] [CrossRef] [Scilit]
- Bao, X.; Sadiq, M.; Tye, W.; Zhang, J. The impact of environmental, social, and governance (ESG) rating disparities on corporate risk: The mediating role of financing constraints. J. Environ. Manag. 2024, 371, 123113. [Google Scholar] [CrossRef] [Scilit]
- Gupta, H.; Chaudhary, R. An Analysis of Volatility and Risk-Adjusted Returns of ESG Indices in Developed and Emerging Economies. Risks 2023, 11, 182. [Google Scholar] [CrossRef] [Scilit]
- Diebold, F.X.; Yilmaz, K. Better to give than to receive: Predictive directional measurement of volatility spillovers. Int. J. Forecast. 2012, 28, 57–66. [Google Scholar] [CrossRef] [Scilit]
- Engle, R. Dynamic conditional correlation: A simple class of multivariate generalized autoregressive conditional heteroskedasticity models. J. Bus. Econ. Stat. 2002, 20, 339–350. [Google Scholar] [CrossRef] [Scilit]
- Markowitz, H.M. Portfolio Selection: Efficient Diversification of Investments; Yale University Press: New Haven, CT, USA, 2008. [Google Scholar]
- Gao, X.; Liang, X.; Guo, Z.; Yuan, Z.; Li, G.; Likulunga, L.E. The analysis of ecological network characteristics of Baiyangdian Basin in China using the complex network theory. Ecol. Indic. 2024, 167, 112650. [Google Scholar] [CrossRef] [Scilit]
- Freeman, R.E. Strategic Management: A Stakeholder Approach; Cambridge University Press: Cambridge, UK, 2010. [Google Scholar]
- Fama, E.F. Efficient capital markets: A review of theory and empirical work. J. Financ. 1970, 25, 383–417. [Google Scholar] [CrossRef] [Scilit]
- Liu, M.; Guo, T.; Ping, W.; Luo, L. Sustainability and stability: Will ESG investment reduce the return and volatility spillover effects across the Chinese financial market? Energy Econ. 2023, 121, 106674. [Google Scholar] [CrossRef] [Scilit]
- Jiang, W.; Dong, L.; Chen, Y. Time-frequency connectedness among traditional/new energy, green finance, and ESG in pre-and post-Russia-Ukraine war periods. Resour. Policy 2023, 83, 103618. [Google Scholar] [CrossRef] [Scilit]
- Lu, X.; Huang, N.; Mo, J.; Ye, Z. Dynamics of the return and volatility connectedness among green finance markets during the COVID-19 pandemic. Energy Econ. 2023, 125, 106860. [Google Scholar] [CrossRef] [Scilit]
- de Boyrie, M.E.; Pavlova, I. Connectedness with commodities in emerging markets: ESG leaders vs. conventional indexes. Res. Int. Bus. Financ. 2024, 71, 102456. [Google Scholar] [CrossRef] [Scilit]
- Lin, L.; Jiang, Y.; Zhou, Z. Asymmetric spillover and network connectedness of policy uncertainty, fossil fuel energy, and global ESG investment. Appl. Energy 2024, 368, 123432. [Google Scholar] [CrossRef] [Scilit]
- Naysary, B.; Shrestha, K. Financial technology and ESG market: A wavelet-DCC GARCH approach. Res. Int. Bus. Financ. 2024, 71, 102466. [Google Scholar] [CrossRef] [Scilit]
- Wu, R.; Qin, Z. Asymmetric volatility spillovers among new energy, ESG, green bond and carbon markets. Energy 2024, 292, 130504. [Google Scholar] [CrossRef] [Scilit]
- Fu, Y.; Qi, H.; Chen, Y.; Wang, Y. Short-term impacts vs. long-term contributions: The role of clean energy and ESG investments in China. Renew. Energy 2024, 233, 121131. [Google Scholar] [CrossRef] [Scilit]
- de Oliveira, E.M.; de Souza Cunha, F.A.F.; Palazzi, R.B.; Klotzle, M.C.; Maçaira, P.M. On the effects of uncertainty measures on sustainability indices: An empirical investigation in a nonlinear framework. Int. Rev. Financ. Anal. 2020, 70, 101505. [Google Scholar] [CrossRef] [Scilit]
- Zhang, W.; He, X.; Hamori, S. Volatility spillover and investment strategies among sustainability-related financial indexes: Evidence from the DCC-GARCH-based dynamic connectedness and DCC-GARCH t-copula approach. Int. Rev. Financ. Anal. 2022, 83, 102223. [Google Scholar] [CrossRef] [Scilit]
- Guo, K.; Li, Y.; Zhang, Y.; Chen, Y.; Ma, Y. Cross-country risk spillovers of ESG stock indices: Dynamic patterns and the role of climate transition risks. Int. Rev. Financ. Anal. 2024, 95, 103477. [Google Scholar] [CrossRef] [Scilit]
- Wan, J.; Yin, L.; Wu, Y. Return and volatility connectedness across global ESG stock indexes: Evidence from the time-frequency domain analysis. Int. Rev. Econ. Financ. 2024, 89, 397–428. [Google Scholar] [CrossRef] [Scilit]
- Hameed, Z.; Shafi, K.; Nadeem, A. Volatility spillover effect between oil prices and foreign exchange markets. Energy Strategy Rev. 2021, 38, 100712. [Google Scholar] [CrossRef] [Scilit]
- Chen, L.; Wen, F.; Li, W.; Yin, H.; Zhao, L. Extreme risk spillover of the oil, exchange rate to Chinese stock market: Evidence from implied volatility indexes. Energy Econ. 2022, 107, 105857. [Google Scholar] [CrossRef] [Scilit]
- Boubaker, S.; Karim, S.; Naeem, M.A.; Sharma, G.D. Financial markets, energy shocks, and extreme volatility spillovers. Energy Econ. 2023, 126, 107031. [Google Scholar] [CrossRef] [Scilit]
- Gamba-Santamaria, S.; Gomez-Gonzalez, J.E.; Hurtado-Guarin, J.L.; Melo-Velandia, L.F. Stock market volatility spillovers: Evidence for Latin America. Financ. Res. Lett. 2017, 20, 207–216. [Google Scholar] [CrossRef] [Scilit]
- BenSaïda, A.; Litimi, H.; Abdallah, O. Volatility spillover shifts in global financial markets. Econ. Model. 2018, 73, 343–353. [Google Scholar] [CrossRef] [Scilit]
- da Cunha, Í.G.F.; Policarpo, R.V.S.; de Oliveira, P.C.S.; Abdala, E.C.; do Nascimento Rebelatto, D.A. A systematic review of ESG indicators and corporate performance: Proposal for a conceptual framework. Future Bus. J. 2025, 11, 106. [Google Scholar] [CrossRef] [Scilit]
- Sims, C.A. Macroeconomics and reality. Econom. J. Econom. Soc. 1980, 48, 1–48. [Google Scholar] [CrossRef] [Scilit]
- Koop, G.; Pesaran, M.H.; Potter, S.M. Impulse response analysis in nonlinear multivariate models. J. Econom. 1996, 74, 119–147. [Google Scholar] [CrossRef] [Scilit]
- Pesaran, H.H.; Shin, Y. Generalized impulse response analysis in linear multivariate models. Econ. Lett. 1998, 58, 17–29. [Google Scholar] [CrossRef] [Scilit]
- Engle, R.F. Autoregressive conditional heteroscedasticity with estimates of the variance of United Kingdom inflation. Econom. J. Econom. Soc. 1982, 50, 987–1007. [Google Scholar] [CrossRef] [Scilit]
- Bollerslev, T. Generalized autoregressive conditional heteroskedasticity. J. Econom. 1986, 31, 307–327. [Google Scholar] [CrossRef] [Scilit]
- Bollerslev, T. Modelling the coherence in short-run nominal exchange rates: A multivariate generalized ARCH model. Rev. Econ. Stat. 1990, 72, 498–505. [Google Scholar] [CrossRef] [Scilit]
- Cocca, T.; Gabauer, D.; Pomberger, S. Clean energy market connectedness and investment strategies: New evidence from DCC-GARCH R2 decomposed connectedness measures. Energy Econ. 2024, 136, 107680. [Google Scholar] [CrossRef] [Scilit]
- Genizi, A. Decomposition of R 2 in multiple regression with correlated regressors. Stat. Sin. 1993, 3, 407–420. [Google Scholar]
- Diebold, F.X.; Yilmaz, K. On the past, present, and future of the Diebold–Yilmaz approach to dynamic network connectedness. J. Econom. 2023, 234, 115–120. [Google Scholar] [CrossRef] [Scilit]
- Nyopa, T.; Khumalo, S.A. Volatility spillovers in equity and foreign exchange markets: Evidence from emerging economies. J. Econ. Financ. Sci. 2022, 15, 713. [Google Scholar]
- Greenwood-Nimmo, M.; Kočenda, E.; Nguyen, V.H. Detecting statistically significant changes in connectedness: A bootstrap-based technique. Econ. Model. 2024, 140, 106843. [Google Scholar] [CrossRef] [Scilit]
- Meng, S.; Chen, Y. Market Volatility Spillover, Network Diffusion, and Financial Systemic Risk Management: Financial Modeling and Empirical Study. Mathematics 2023, 11, 1396. [Google Scholar] [CrossRef] [Scilit]
- Cheng, Z.; Li, M.; Cui, R.; Wei, Y.; Wang, S.; Hong, Y. The impact of COVID-19 on global financial markets: A multiscale volatility spillover analysis. Int. Rev. Financ. Anal. 2024, 95, 103454. [Google Scholar] [CrossRef] [Scilit]
- Sharif, A.; Aloui, C.; Yarovaya, L. COVID-19 pandemic, oil prices, stock market, geopolitical risk and policy uncertainty nexus in the US economy: Fresh evidence from the wavelet-based approach. Int. Rev. Financ. Anal. 2020, 70, 101496. [Google Scholar] [CrossRef] [Scilit]
- Vuković, D.B.; Fefelov, D.L.; Frömmel, M.; Rogova, E.M. Volatility Spillovers and Market Decoupling: Evidence from BRICS and China’s Green Sector. Risks 2025, 13, 222. [Google Scholar] [CrossRef] [Scilit]
- Kim, J.; Jaumotte, F.; Panton, A.J.; Schwerhoff, G. Energy security and the green transition. Energy Policy 2025, 198, 114409. [Google Scholar] [CrossRef] [Scilit]
- Arouri, M.; Mhadhbi, M.; Shahrour, M.H. Dynamic connectedness and hedging effectiveness between green bonds, ESG indices, and traditional assets. Eur. Financ. Manag. 2025, 31, 1704–1719. [Google Scholar] [CrossRef] [Scilit]
- Iannone, B.; Duttilo, P.; Gattone, S.A. Evaluating the resilience of ESG investments in European markets during turmoil periods. Corp. Soc. Responsib. Environ. Manag. 2025, 32, 5006–5020. [Google Scholar] [CrossRef] [Scilit]
- Marín-Rodríguez, N.J.; Gonzalez-Ruiz, J.D.; Botero, S. Connectedness between sustainable investment indexes: The QVAR approach. Economies 2024, 12, 170. [Google Scholar] [CrossRef] [Scilit]

Disclaimer/Publisher’s Note: The statements, opinions and data contained in all publications are solely those of the individual author(s) and contributor(s) and not of MDPI and/or the editor(s). MDPI and/or the editor(s) disclaim responsibility for any injury to people or property resulting from any ideas, methods, instructions or products referred to in the content. |
© 2026 by the authors. Licensee MDPI, Basel, Switzerland. This article is an open access article distributed under the terms and conditions of the Creative Commons Attribution (CC BY) license.