


Abstract
Fixed external louvers are widely used to improve the environmental performance of glass curtain wall office buildings, yet existing studies more often report preferred solutions than transferable decision ranges for early-stage design. This study develops interval-based design rules for a standard-floor prototype of a point-supported glass curtain wall office building in Tianjin, a representative cold-climate city in China. A seven-variable design space integrating spatial-scale and shading variables was evaluated for 3000 Latin hypercube samples in a Rhino–Grasshopper–Honeybee workflow linked to Radiance and EnergyPlus, using Tianjin’s typical meteorological year data and GB 55015—2021-based office schedules, including an occupant density of 10 m2/person and occupied heating/cooling setpoints of 20/26 °C. Raw-sample statistics, Bootstrap-based stability testing, and surrogate-model-assisted continuous-response analysis were used to identify dominant variables, single-objective preferred intervals, and a neutral equal-weight baseline compromise zone. Under a neutral equal-weight baseline adopted for early-stage comparison, the compromise interval is concentrated around 20–25°, with 15–30° as a practical starting range, while alternative weighting scenarios show directional shifts toward the prioritized objective.
1. Introduction
1.1. Background of the Study
Owing to their strong architectural expressiveness, relatively low structural self-weight, and high construction efficiency, glass curtain walls have been widely adopted in high-rise buildings in major Chinese cities since the 1980s [1]. China has become the world’s largest producer and consumer of glass curtain wall systems [2], and by the end of 2023 the cumulative global application area had exceeded 900 million m2 [3]. While these systems have contributed to building image enhancement and urban spatial quality, they have also intensified concerns related to energy use and environmental performance. Under the global agenda of climate-change mitigation and China’s “dual-carbon” strategy, improving the sustainability of building envelopes has become an important pathway for reducing both urban heat-island effects and building carbon emissions [4,5].
From the perspective of envelope performance, glass curtain walls are characterized by high solar transmittance and relatively low thermal inertia [6]. Under strong solar radiation, substantial solar heat can penetrate indoor spaces, increasing cooling demand while also causing overexposure in the luminous environment and deterioration in thermal comfort [7,8]. For this reason, a central issue in glass curtain wall design is how to control building energy use while maintaining acceptable indoor environmental quality.
Building shading systems are an important passive design strategy for regulating indoor thermal and luminous environments and reducing operational energy consumption [9]. However, building energy use, daylighting performance, and thermal comfort are strongly coupled and mutually constrained. Measures that improve one aspect may alter the others, so design approaches based on a single objective often have limited capacity to support balanced façade decisions under complex performance requirements. Within this coupled design context, fixed external louvers present a further difficulty at the scheme-design stage because their geometric parameters directly influence solar interception, daylight admission, and thermal-environment tendency at the same time. Designers, therefore, need interpretable parameter ranges that can support early-stage judgment before project-specific priorities and constraints are fully specified.
1.2. Literature Review
The regulation of thermal and luminous conditions through the building envelope, especially in high-window-to-wall-ratio glass curtain walls, has long been a central topic in building performance research. Existing studies have shown that curtain wall and shading design should be evaluated within an integrated environmental framework at the early design stage. Ochoa and Capeluto [10] emphasized the need to assess curtain wall and shading design against both energy performance and visual comfort in order to provide sufficient environmental evidence for subsequent decisions. Huang et al. [11] further demonstrated that glazing type and shading configuration jointly influence energy use and daylighting performance in office buildings, indicating that these parameters should be examined within a coupled thermal–daylighting framework. Studies by Freewan [12], González and Fiorito [13], Esquivias et al. [14], Dutta et al. [15], and Zhai et al. [16] likewise confirmed that shading type, geometric parameters, orientation, and window-system properties all exert significant effects on energy demand, daylight availability, thermal environment, and visual quality. Taken together, these studies indicate that envelope parameter analysis for office buildings needs to be conducted from a multi-performance perspective.
Against this background, recent research has increasingly expanded from the evaluation of individual envelope components toward parametric analysis, surrogate modeling, and adaptive façade studies. Westermann and Evins [17] pointed out that surrogate models are valuable not only for reducing simulation cost, but also for supporting design-space exploration, sensitivity identification, and performance-pattern recognition during conceptual design. Reviews by Al-Masrani and Al-Obaidi [18] and Tabadkani et al. [19] further showed that, although substantial knowledge has been accumulated on dynamic shading systems and adaptive façades, the integration of parameter systems, environmental objectives, and control strategies remains incomplete. At the same time, studies by Plörer et al. [20], Wang et al. [21], Voigt et al. [22], Nazari et al. [23], Zhang et al. [24], and Elwy and Hagishima [25] indicated that current methods have already improved the efficiency of design feedback and optimization support, bringing façade research closer to forms of analysis that can assist early-stage decision making. Reviews by Brzezicki [26], Zhangabay et al. [27], and Alsukkar et al. [28] also showed that shading and façade studies have generated abundant findings on energy, comfort, and operational performance, while their main outputs still concentrate on classification, performance testing, optimization, and preferred design solutions.
Accordingly, the key question is how louver–performance relationships can be translated into rule-oriented knowledge for early-stage sustainable design. Within specific spatial and climatic contexts, it remains necessary to clarify which parameters exert strong cross-objective control, which act as background-dependent modifiers, and whether their relationships can be expressed as interval-based rules usable in scheme design. This unresolved issue defines the main research gap addressed in the present study.
1.3. Aims and Originality
This study focuses on the standard-floor prototype of a point-supported glass curtain wall office building in Tianjin, a representative city in China’s cold climate zone, and constructs a global design space covering both spatial-scale variables and fixed external louver variables. By combining building performance simulation, raw-sample statistics, Bootstrap resampling, and surrogate-model-assisted continuous-response analysis, the study identifies single-objective preferred intervals, a neutral-baseline compromise zone, and background-dependent interval shifts for fixed external louvers with respect to three performance indicators: energy use intensity (EUI), useful daylight illuminance (UDI), and predicted mean vote (PMV).
The study makes two contributions. First, it develops a rule-extraction pathway for fixed external louvers that combines discrete sample evidence, stability testing, and continuous-response support. Within this pathway, the main output is organized as decision ranges, interval centers, and conditional shift directions for design use. Compared with studies that mainly report preferred solutions, performance ranking, or optimization-oriented parameter positions, this form of output is more suitable for scheme-stage judgment, where objective priorities and project constraints are often still being defined. Second, it clarifies the different roles of background variables within the current design space. Louver angle acts as the dominant conflict variable, WWR provides the clearest grouped evidence of conditional shift in the compromise zone, and spatial-scale variables mainly affect the applicability background and local interval distribution. On this basis, the study summarizes fixed-interval guidance and conditional modification patterns for early-stage sustainable façade design under the current prototype and boundary conditions.
2. Materials and Methods
To clarify the methodological organization of the study, the overall research framework is first presented in Figure 1. This section then introduces the research prototype and variable settings, the performance indicators and simulation boundary conditions, the sample-generation and surrogate-model procedures, and the analytical pathway for design-rule identification.
Figure 1.
Overall research framework.
2.1. Building Prototype and Design Variables
A typical standard-floor prototype of a point-supported glass curtain wall office building in Tianjin was adopted as the simulation carrier for performance analysis [29]. Adiabatic boundary conditions were applied to exclude the thermal interference associated with non-typical floors, such as roof-level and ground-floor heat transfer. The prototype was defined as a geometrically flexible design space, and the variables were divided into two categories: spatial-scale variables and shading-system variables.
The spatial-scale variables were used to characterize the basic building form and spatial attributes, thereby defining the physical background for performance simulation. These variables included:
- Spatial dimensions. To improve the realism of the parameter settings, publicly available information on a number of glass curtain wall office buildings in Tianjin was collected, as summarized in Table 1. The survey results indicate that the standard-floor area of the sampled cases is mainly concentrated in the range of approximately 1060–2200 m2, while floor-to-floor height is primarily distributed between 3.5 and 4.5 m. Since public sources typically report standard floor area and floor height, but rarely provide direct information on floor length and width, the standard floor was abstracted parametrically based on the typical layout logic of rectangular office plans. Accordingly, the ranges of floor length and width were both set to 20–40 m, and floor height was set to 3.5–4.5 m [30].Table 1. Reference samples of standard-floor dimensions from selected glass curtain wall office buildings in Tianjin.
- WWR. The WWR was varied between 0.50 and 0.80 [31]. This range was determined with reference to studies on geometric parameters of office buildings in Tianjin, optimization studies of WWR in office buildings located in cold regions, and the need to extend the parameter space to highly transparent curtain wall scenarios. Together, these variables define the solar heat gain basis and daylight penetration depth of the prototype.
The shading-system variables constituted the actively controlled design variables in this study and focused on the geometric and optical characteristics of a fixed external louver system. These variables included:
- Louver rotation angle, ranging from 0° to 90°. As the key geometric parameter governing direct solar interception, louver angle has a pronounced influence on indoor daylight distribution and cooling load.
- Louver depth and spacing, both set within the range of 0.10–0.40 m. To balance geometric simplicity and computational efficiency, louver depth and spacing were linked and assigned equal values. This parameter directly determines the shading coverage ratio and is therefore a key geometric factor affecting solar admission and visual openness.
- Louver reflectance, ranging from 0.20 to 0.80, covering typical low-, medium-, and high-reflectance materials. This parameter represents the optical property of the louver surface and can improve indoor daylighting conditions through secondary reflection between louvers [32].
Table 2 presents the ranges of the spatial-scale variables and shading-system variables, while Figure 2 illustrates the standard-floor prototype and the parameterization of the fixed external louver system.
Table 2.
Ranges and resolutions of design variables for the parameterized standard-floor model.
Figure 2.
Standard-floor prototype and design variables. (a) Spatial-scale variables; (b) shading-system variables.
A full-variable training strategy was adopted in this study, whereby both spatial-scale variables and shading-system variables were simultaneously treated as continuous inputs during sample generation and surrogate-model training. This strategy enabled the models to learn the overall coupling relationship between background building conditions and fixed external louver parameters. Subsequent analyses were conducted within the global design space: overall patterns were identified first, and conditional comparisons were then carried out according to WWR, plan dimensions, and floor height. This treatment supports the identification of parameter intervals under different performance priorities, the locations of objective conflicts, and the magnitude of interval shifts under different spatial backgrounds, thus providing conditional judgment criteria for early-stage design.
In the present study, the material-related settings were defined as performance-oriented representations within the parameterized prototype. The curtain wall was modeled as a uniform 6 mm + 12 A + 6 mm double-glazing system, while the louver system was represented through geometric variables and surface reflectance rather than by reference to one specific commercial product. Accordingly, the material inputs were used to establish a consistent façade-performance background for interval identification within the current design space.
2.2. Performance Indicators and Calculation
To identify design rules for fixed external louvers under multi-objective conditions, this study evaluated three performance indicators: energy-use intensity (EUI), useful daylight illuminance (UDI), and predicted mean vote (PMV). These indicators represent annual energy performance, daylighting effectiveness, and overall thermal comfort tendency, respectively. All three indicators were simulated on the basis of hourly weather data from a typical meteorological year. For UDI and PMV, the results from all indoor sensor points on the standard floor were further spatially averaged to obtain representative performance values for subsequent rule identification, interval comparison, and integrated evaluation.
2.2.1. Energy-Use Intensity (EUI)
EUI was used to characterize the annual operational energy demand of the building and was defined as the annual total energy consumption per unit floor area [33]. The annual total energy consumption of the standard floor consists of four components: cooling, heating, lighting, and equipment energy consumption. In this study, EUI was calculated from annual simulation results in order to reflect the influence of different design parameters on the overall energy consumption of the standard floor. Since EUI is an aggregate indicator at the whole-floor scale, it was directly used as the energy-performance metric in the subsequent rule-identification process. The corresponding equations are given in Equations (1) and (2):
where is the annual total energy consumption of the standard floor (kWh); , , and represent the annual energy consumption of heating, cooling, lighting, and equipment, respectively, for the standard floor (kWh); and is the gross floor area of the standard floor (m2).
2.2.2. Useful Daylight Illuminance (UDI)
UDI was used to evaluate the effectiveness of the indoor daylighting environment [34]. By quantifying the proportion of time during which indoor horizontal illuminance remains within a predefined comfort range, this indicator reflects the extent to which the lighting environment meets occupants’ visual needs. According to the relationship curve between illuminance and the percentage of dissatisfaction proposed by the International Commission on Illumination, visual satisfaction is relatively high when illuminance is maintained within the range of 100–2000 lx [35]. Therefore, this study adopts 100–2000 lx as the effective illuminance range for UDI. To obtain overall daylighting performance at the spatial scale, the UDI values of all sensor points were spatially averaged, thereby yielding a representative measure of the standard-floor daylighting performance under each parameter setting [36]. The corresponding equations are given in Equations (3) and (4):
where is the horizontal illuminance at sensor point at time , and is the total number of effective daylighting hours over the year.
2.2.3. Predicted Mean Vote (PMV)
PMV was employed to characterize the overall annual thermal sensation tendency of the indoor environment. Thermal comfort, as defined in ISO 7730 [37], refers to a subjective state of satisfaction with the surrounding thermal environment and is jointly influenced by activity level, clothing insulation, air temperature, mean radiant temperature, air velocity, and relative humidity.
This study uses predicted mean vote (PMV) as the indicator for evaluating the thermal comfort performance of the standard floor [38]. PMV was originally proposed by Fanger on the basis of the human heat balance principle and is used to quantitatively describe the average thermal sensation of a group of occupants in a given thermal environment. A PMV value of 0 indicates thermal neutrality, while values between −0.5 and +0.5 are generally regarded as an acceptable comfort range according to ASHRAE and related standards. Since this study focuses on the influence of different shading strategies on annual thermal-environment trends, spatially and temporally averaged PMV was adopted to represent overall thermal comfort at the whole-floor scale [39]. This treatment reduces the interference of short-term fluctuations in long-term performance trade-off analysis. The corresponding equation is given in Equation (5):
where is the metabolic rate of the human body (W/m2); is the effective mechanical power output of the human body (W/m2); is the air temperature (°C); is the mean radiant temperature (°C); is the partial pressure of water vapor in the surrounding air (Pa); is the clothing area factor; is the outer surface temperature of clothing (°C); and is the convective heat transfer coefficient (W/(m2·K)).
In the PMV simulation, the metabolic rate was set to met to represent seated office work under the operating characteristics of office buildings in Tianjin, while the mechanical work was set to . Clothing insulation was assigned dynamically according to season, with 0.5 clo in summer and 1.0 clo in winter. Considering the influence of the relatively high radiant temperature of the inner surface of the point-supported glass curtain wall on thermal sensation, the mean radiant temperature was dynamically coupled to the hourly solar-radiation simulation results.
The three indicators selected in this study are intended to support rule extraction at the scheme-design stage rather than to constitute a complete post-design performance certification framework. EUI represents annual operational energy demand at the whole-floor scale, UDI reflects the proportion of time during which indoor illuminance remains within the useful daylight range [40,41], and spatially and temporally averaged PMV describes the overall annual tendency of thermal sensation under different shading conditions [42]. Within this scope, UDI reflects useful daylight availability but does not directly assess glare risk under high luminance contrast, while average PMV captures long-term thermal tendency but does not represent short-term discomfort peaks or discomfort duration. Accordingly, the daylight-oriented, energy-oriented, and compromise-oriented rules developed in this study should be understood as interval-based decision support for early-stage sustainable façade design and should be further verified in detailed applications using supplementary indicators such as glare probability, discomfort duration, or other project-specific comfort criteria.
2.3. Simulation Platform and Boundary Conditions
The standard-floor performance model was developed in the Rhino–Grasshopper parametric environment. Rhino and Grasshopper were used to construct the geometric model with adjustable design variables, thereby enabling the parametric control of building dimensions, WWR, and louver parameters. Honeybee served as the interface platform linking the model to Radiance and EnergyPlus: Radiance was used for hourly daylight simulation based on ray-tracing algorithms, while EnergyPlus was used for dynamic thermal simulation based on an energy-balance model. Ladybug was used for the import of typical meteorological year data and the management of environmental data. In this way, a complete simulation workflow was established, covering geometric modeling, parameter input, and performance output.
To ensure the reproducibility of the simulation settings, the key boundary conditions were specified as follows. Representative meteorological data for Tianjin were obtained from the official EnergyPlus weather database and then imported into the simulation environment. The model orientation was uniformly set to a true south–north alignment. For UDI, indoor sensor points were arranged in a regular 1 m × 1 m grid at a height of 0.75 m above the floor. For PMV, indoor sensor points were arranged in a regular 3 m × 3 m grid, offset 0.5 m from the building envelope to avoid boundary effects, at a height of 1.1 m above the floor. The spatial averages of both UDI and PMV were calculated on the basis of all valid sensor points on the standard floor. External louvers were continuously arranged along all four façades, with louver depth kept equal to louver spacing, and the louver angle was defined as 0° when perpendicular to the exterior façade. The curtain wall glazing system was uniformly specified as 6 mm + 12 A + 6 mm double glazing. Building operation schedules, occupant density, internal loads, and setpoint temperatures were specified in accordance with the Chinese national standard General Code for Building Energy Efficiency and Renewable Energy Utilization (GB 55015—2021 [43]), so as to establish a fixed general-use office-building background for comparative analysis in the present prototype. The fixed simulation boundary conditions of the building’s standard floor are presented in Table 3, and the internal loads and operational parameters are presented in Table 4.
Table 3.
Fixed simulation boundary conditions and envelope parameters of the standard-floor model.
Table 4.
Internal loads and operational schedules used in the simulation.
The spatial discretization of the sensor grids was determined according to the analytical purpose of each indicator and the large parametric sample size of the study. For daylight evaluation, annual daylight analysis is commonly conducted on regular workplane grids; for example, LEED annual daylight simulations specify calculation grids no larger than 600 mm × 600 mm at a workplane height of 760 mm. In the present study, a 1 m × 1 m grid at 0.75 m height was adopted to support whole-floor comparison and spatial averaging at the scheme-design stage under large-sample simulation conditions.
For thermal comfort evaluation, ASHRAE 55 specifies representative occupied locations and a seated evaluation height of 0.6 m for PMV or operative temperature, while Honeybee thermal comfort mapping is performed on user-defined sensor grids. Since the present study focused on whole-floor thermal-environment tendency and interval identification, a 3 m × 3 m grid was used to provide representative spatial averaging with manageable computational cost. Under this setting, the PMV results should be understood as a floor-level thermal tendency indicator within the current analysis framework, while finer-grid assessment of local discomfort can be further addressed in detailed design stages.
The reliability of the simulation workflow in this study is supported at two levels. At the physical-simulation level, the thermal and daylight calculations were carried out through Honeybee using EnergyPlus and Radiance, both of which are established simulation engines with documented testing and validation backgrounds. Within the present study, these engines were applied under fixed and explicitly reported boundary conditions, including weather data, glazing construction, occupancy density, internal loads, and HVAC setpoints, in order to provide a consistent basis for comparative analysis across the 3000 parametric cases. At the data-driven level, the surrogate models derived from the simulated dataset were evaluated through an 80/20 train–test split and five-fold cross-validation during hyperparameter tuning, and their predictive performance is reported in Section 3.1.
2.4. Analytical Framework for Design-Rule Identification
2.4.1. Sample Generation
To construct high-accuracy surrogate models for building performance, this study conducted large-scale sample generation based on a design of experiments (DOE) approach within the design space defined in Section 2.1. Sample generation was implemented in the Rhino–Grasshopper platform using the Design Space Exploration (DSE) plug-in. In this study, the Latin hypercube sampling (LHS) method was adopted to generate multidimensional combinations of design parameters. Compared with conventional random sampling, LHS performs stratified sampling in each dimension, thereby ensuring good space-filling properties and orthogonality within the seven-dimensional continuous variable space and effectively avoiding statistical bias caused by parameter clustering under a limited sample size [44].
A total of 3000 valid parameter combinations were generated, and the Honeybee plug-in was used to perform building performance simulations for each sample, thereby obtaining the corresponding EUI, UDI, and PMV results. Within the present seven-dimensional continuous design space, this sample size was selected to provide a balance between space-filling coverage and computational feasibility. Sample sizes at this order of magnitude have also been commonly adopted in multivariable surrogate-modeling studies of building performance [45,46,47]. Its adequacy for the present study is further reflected in the predictive performance of the surrogate models trained on these samples. As reported in Section 3.1, the selected models achieved high predictive accuracy for EUI and PMV and acceptable predictive performance for UDI on the independent test set, while five-fold cross-validation was used during model tuning to support model generalization. Within this analytical context, the 3000-sample dataset provided sufficient support for interval identification, conditional comparison, and surrogate-assisted response interpretation, while retaining both spatial-scale variables and shading variables in the global design space.
2.4.2. Surrogate-Model Development and Screening
To improve the computational efficiency of large-sample design-space analysis and continuous-response identification, this study employed a data-driven approach to construct surrogate models for building performance, thereby replacing repeated full-process simulations using EnergyPlus and Radiance. Based on the dataset established in Section 2.4.1, independent regression models were developed in the Python environment (Python 3.14) for EUI, UDI, and PMV using the Scikit-learn, XGBoost, and LightGBM libraries. Four representative algorithms were selected for comparison: Random Forest, Support Vector Regression (SVR), Extreme Gradient Boosting, and Light Gradient Boosting Machine. These models represent different nonlinear regression mechanisms and support a comparative assessment of their suitability for surrogate-assisted prediction of building performance indicators [48,49].
To ensure the generalization performance of the prediction models and to monitor overfitting, the dataset was randomly divided into a training set and a test set at a ratio of 80% to 20%. The training set was used for model fitting and hyperparameter tuning, while the test set was used for out-of-sample evaluation. For scale-sensitive algorithms, particularly SVR, the input variables were standardized during training. The tree-based models, including Random Forest, XGBoost, and LightGBM, were trained directly on the original feature space.
To provide a benchmark and maintain transparency in the hyperparameter-tuning process, predefined baseline parameter combinations were first assigned to each candidate surrogate model for initial training. Hyperparameter tuning was then conducted within predefined search spaces using randomized searches combined with five-fold cross-validation, and the predictive performance of the baseline and optimized models on the test set was compared. During cross-validation, the training data were divided into five subsets for iterative training and validation, and the average performance across the five folds was used for model evaluation. This procedure reduced the subjectivity associated with manual parameter tuning and enhanced model generalization on unseen data [50]. The baseline parameter settings and randomized search spaces of the four candidate surrogate models are presented in Table 5.
Table 5.
Baseline settings and randomized search spaces for four candidate surrogate models.
Model predictive performance was evaluated using the coefficient of determination (R2), root mean square error (RMSE), and mean absolute error (MAE). Among these metrics, R2 measures the explanatory power of the model with respect to the variance of the target variable, RMSE is more sensitive to larger prediction errors, and MAE reflects the overall magnitude of prediction error. The corresponding equations are given in Equations (6)–(8):
For each performance indicator, the algorithm with the best overall fitting accuracy was selected as the surrogate model for subsequent continuous-response analysis and performance prediction.
2.4.3. Rule-Oriented Data Organization and Stability Testing
To improve the reproducibility of the rule-extraction process, the analytical workflow used in this study is summarized in Algorithm 1. The procedure translates the simulated dataset into interval-based design guidance through full-sample screening, high-performance subset extraction, Bootstrap-based robustness testing, composite-score construction, and conditional verification.
| Algorithm 1. Rule-extraction procedure for interval-based design guidance |
| Input: Raw simulation dataset containing seven design variables and three performance indicators (EUI, UDI, and PMV). Output: Dominant conflict variable, single-objective preferred intervals, neutral-baseline compromise interval, and conditional modification patterns. Step 1. Compute full-sample correlations between all design variables and EUI, UDI, and PMV. Step 2. Divide louver angle into 15° bins (0–15°, 15–30°, 30–45°, 45–60°, 60–75°, and 75–90°) and calculate the mean responses of EUI, UDI, and PMV in each bin. Step 3. Identify the dominant conflict variable by comparing its cross-objective influence and interval separation in the full sample. Step 4. Extract the Top 10% low-EUI samples, Top 10% high-UDI samples, and Top 10% minimum-|PMV| samples, and compare the central positions and distribution ranges of louver angle to identify the single-objective preferred intervals and their conflict relationships. Step 5. Conduct Bootstrap resampling (1000 times, with replacement) for the Top 10% subsets and recalculate Q1, median, and Q3 to test interval robustness within the sampled space. Step 6. Normalize EUI, UDI, and |PMV| using the min–max method. Apply inverse normalization to EUI and |PMV|, and positive normalization to UDI. Step 7. Construct the equal-weight composite score under the neutral baseline and extract the Top 10% composite-score samples to identify the compromise zone. Step 8. Recalculate the composite score under alternative weighting scenarios to examine directional shifts in the compromise interval. Step 9. Perform grouped comparison and surrogate-model-based continuous scanning to verify interval continuity and conditional shifts under different background conditions. |
Within this workflow, raw-sample statistics provide the primary evidence for interval identification from discrete distributions, Bootstrap resampling is used to test the robustness of quantile intervals under sample perturbation, and surrogate models support continuous-response verification and compromise-zone interpretation.
3. Interval Rules and Conditional Modifications for Fixed External Louvers
3.1. Performance Evaluation of the Surrogate Models
Before proceeding to rule extraction and the identification of integrated interval patterns, it is necessary to verify the predictive capability of the surrogate models for the three building performance indicators, so as to ensure that they can reliably replace the physical simulations performed by EnergyPlus and Radiance at substantially lower computational cost. According to the methodology described in Section 2.4, four machine-learning regression models were developed for EUI, UDI, and PMV, including Random Forest, Support Vector Regression (SVR), XGBoost, and LightGBM. All models were trained on the same training dataset and evaluated on an independent test set.
Model performance was evaluated using the coefficient of determination (R2), root mean square error (RMSE), and mean absolute error (MAE). R2 reflects the explanatory power of the model with respect to the variance of the target variable, while RMSE and MAE measure the discrepancy between predicted and true values. Because prediction error directly affects the location of high-value bands and the identification of interval boundaries in the subsequent composite-score construction, compromise-interval identification, and conditional-rule extraction, RMSE was adopted as the primary criterion for model selection, with R2 and MAE used as auxiliary indicators for judging model stability.
Figure 3 presents the predictive performance of the candidate surrogate models on the test set. The results show that the predictive performance of the four algorithms differs across the three indicators, reflecting differences in indicator structure and response characteristics.
Figure 3.
Prediction accuracy and residual distributions of four candidate surrogate models for EUI, UDI, and PMV.
For EUI, all ensemble-learning models achieved relatively high predictive accuracy, among which LightGBM obtained the best overall fitting performance, with the highest R2 (0.9915), the lowest RMSE (0.2457), and a relatively low MAE (0.1854). XGBoost also performed well and was close to the optimum, whereas SVR showed clearly weaker performance under the current sample size and variable dimensionality. For UDI, the differences among the models were smaller. Random Forest achieved the best overall performance, with the highest R2 (0.8056), the lowest RMSE (10.1233), and the lowest MAE (5.7080), while XGBoost and LightGBM produced similar results and SVR remained slightly weaker. This suggests that the UDI response contains stronger local nonlinear characteristics, for which the ensemble structure of Random Forest is more suitable in the present dataset. For PMV, all models achieved relatively high predictive accuracy overall, indicating that the relationship between PMV and the design variables can be effectively captured within the present sample space. Among them, SVR provided the best overall performance, with the lowest RMSE (0.0487), a relatively low MAE (0.0376), and the highest R2 (0.9410), while XGBoost and LightGBM performed very similarly. Overall, these results indicate that the three indicators differ in response complexity and therefore favor different surrogate-model structures.
Table 6 presents the detailed fitting results of the four candidate models for each indicator. Among the three indicators, UDI exhibits the highest RMSE, which is related to the statistical nature of the daylight metric itself. UDI is a ratio-based indicator derived from annual time-series data and threshold-based illuminance statistics at multiple sensor points, so local discontinuities are more likely to occur under parameter variation [51,52,53]. By comparison, the response surfaces of EUI and PMV are smoother, and the surrogate models therefore achieve more stable fitting performance.
Table 6.
Predictive performance of candidate surrogate models for EUI, UDI, and PMV.
In addition to the independent test-set evaluation, the final model selection was also supported by the five-fold cross-validation procedure used during hyperparameter tuning. The cross-validation results showed a ranking pattern generally consistent with the test-set evaluation, with the selected models maintaining comparatively strong predictive performance within the candidate model set. This consistency indicates that the model choice was not dependent on one random train/test split alone and provides additional support for the robustness of the surrogate-assisted analysis in the present study. Detailed cross-validation results are provided in Table S1.
Although the predictive accuracy for UDI is lower than that for EUI and PMV, the selected Random Forest model still provides a usable approximation of the overall interval structure and response tendency of daylight performance within the present sample space. Accordingly, in the subsequent analysis, the UDI surrogate is used primarily to support the identification of interval locations and broad compromise tendencies.
Based on the comparative results of R2, RMSE, and MAE on the test set, LightGBM was ultimately selected as the surrogate prediction model for EUI, Random Forest was selected for UDI, and SVR was selected for PMV. These models were then used for continuous-response support in the subsequent interval analysis.
3.2. Identification of Single-Objective Preferred Intervals
3.2.1. Correlation Structure and Dominant Parameters
To clarify the overall dependency relationships of the three performance indicators with respect to the spatial variables and shading variables, this study first compared the correlation characteristics of EUI, UDI, and PMV with all input variables on the basis of the raw sample. Table 7 presents the correlation coefficients between each variable and each performance indicator. The results show that all three performance indicators are most strongly correlated with louver angle, although the directions and relative magnitudes of these correlations differ.
Table 7.
Correlation coefficients between design variables and performance indicators.
For UDI, louver angle shows a significant negative correlation, with a correlation coefficient of −0.761. The correlations between the remaining variables and UDI are all substantially weaker. Among them, floor height Z and louver reflectance exhibit only slight positive correlations, while the absolute values of the correlation coefficients for X, Y, and WWR remain relatively small. For PMV, the dominance of louver angle is even more pronounced, with a correlation coefficient of −0.913, which is clearly higher than that of the other variables. This indicates that the annual average deviation of thermal sensation is strongly governed by the opening degree of the shading system. For EUI, louver angle also exerts a strong influence, with a correlation coefficient of −0.520, while WWR and the Y-direction spatial dimension show effects of a comparable magnitude, with correlation coefficients of 0.425 and −0.522, respectively. This suggests that the energy-response pattern is shaped jointly by the spatial background and the shading parameters.
Taken together, the overall correlation structure clarifies the focus of the subsequent analysis. For UDI and PMV, louver angle shows clear dominance, indicating that fixed external shading has direct geometric control significance for daylighting performance and annual thermal-environment tendency. For EUI, although louver angle remains important, WWR and the Y-direction spatial dimension also contribute substantially. On this basis, the subsequent analysis takes louver angle as the primary object of analysis, treats WWR and spatial dimensions as conditional modification variables, and considers louver depth and louver reflectance as auxiliary variables.
These correlation coefficients are used here to identify dominant variables and potential conflict dimensions in the global sample. They describe the strength of overall linear associations and provide an initial statistical screening of variable importance within the present dataset. Their interpretive scope should therefore be defined accordingly. First, correlation coefficients do not directly capture nonlinear response structures, local extrema, or plateau effects along the parameter dimension. Second, because several geometric and façade variables are evaluated simultaneously within the same design space, correlation coefficients alone do not fully resolve the combined influence of interacting variables or the potential overlap among related background factors. For these reasons, the correlation analysis in this study is used as a preliminary step for dominant-variable identification, while the nonlinear interval characteristics of variable effects, the locations of performance-gain plateaus, and the patterns of conditional interval migration are further examined through bin-based statistics and surrogate-model-assisted continuous-response analysis.
3.2.2. Louver-Angle Response and Preferred Intervals
After identifying louver angle as the dominant parameter, the next design-oriented question is how variation in louver angle affects the three performance indicators and where the advantageous intervals of each objective are located. To answer this question, this study first conducted a bin-based statistical analysis on the raw samples. The louver angle was divided into six intervals at 15° increments, namely 0–15°, 15–30°, 30–45°, 45–60°, 60–75°, and 75–90°, and the mean values of EUI, UDI, and PMV were calculated for each interval. The results are presented in Figure 4.
Figure 4.
Raw-sample responses of EUI, UDI, and PMV across 15° louver-angle intervals (°). The blue boxes indicate the interquartile range (Q1–Q3), representing the central 50% distribution of the raw samples within each louver-angle interval; the blue dots indicate outliers beyond the whisker range. (a) EUI; (b) UDI; (c) PMV.
Figure 4 shows that the three indicators exhibit clearly different response patterns along the louver-angle dimension. UDI follows a single-peak pattern, rising from 81.18 in the 0–15° interval to 86.89 in the 30–45° interval, and then declining sharply to 33.91 in the 75–90° interval. This indicates that useful daylight availability is concentrated in the medium-angle range, while excessive shading substantially weakens indoor daylight penetration. EUI shows a decreasing trend followed by a plateau. Its mean value decreases from 110.75 in the 0–15° interval to about 106.70 in the 45–60° interval, and then changes only slightly in the subsequent interval groups. This suggests that the main energy-saving benefit of increasing louver angle is established before the angle enters the medium-to-high range. PMV shifts continuously toward the cool side as the angle increases, changing from −0.589 in the 0–15° interval to −1.107 in the 75–90° interval. Accordingly, the more favorable interval for maintaining annual thermal sensation closer to neutrality remains in the low-angle range.
To examine whether the 15° grouping masks finer interval characteristics, an additional 5°-bin analysis was conducted along the louver-angle dimension. As shown in Figure S1, the refined grouping does not change the overall interval structure identified in the main text. UDI remains concentrated in the medium-angle region, EUI still shows a plateau-like tendency after the mid-angle range, and minimum PMV remains located in the low-angle region. The 5° grouping therefore mainly refines the local boundaries of the preferred intervals rather than altering their overall positional relationships, and the 15° grouping remains suitable for rule-oriented presentation in the main text.
Taken together, these three response patterns indicate that the preferred louver-angle intervals under single-objective conditions are clearly separated: UDI is concentrated in 15–45°, EUI in 45–75°, and PMV in 0–15°. Figure 4 therefore provides the first direct evidence that fixed external shading cannot be organized around one shared angle interval, and that subsequent analysis needs to focus on the separation and possible coordination of these objective-specific preferred regions.
3.2.3. Objective Separation in High-Performance Samples
To further verify the parameter preferences identified in the bin-based analysis, high-performance quantile subsets were extracted from the three original datasets and compared under single-objective conditions. For UDI, the top 10% highest-value samples were selected. For EUI, the top 10% lowest-value samples were selected. For PMV, considering that thermal neutrality corresponds to 0, the top 10% samples with the minimum |PMV| values were defined as the top 10% high-performance samples. Under this treatment, the definition of top 10% high-performance samples for the three indicators retains a consistent physical meaning.
Figure 5 presents the distribution of louver angle in these three sample groups. Compared with the full-sample results in Section 3.2.2, the separation becomes more concentrated after the high-performance subsets are extracted. For the top 10% UDI samples, the mean louver angle is 34.04°, with an interquartile range of approximately 30–38°, indicating a concentrated distribution in the medium-angle zone. For the top 10% EUI samples, the mean louver angle is 60.98°, and the interquartile range expands to approximately 48–74°, showing that energy-favorable samples are mainly distributed in the medium-to-high angle range. For the top 10% samples with the minimum |PMV| values, the mean louver angle is 5.34°, with an interquartile range of approximately 2–8°, indicating a strong concentration in the low-angle range. Taken together, the preferred centers of the three objectives are located around 34°, 61°, and 5°, respectively. This confirms that once the sample space is reorganized by objective-specific performance priority, louver angle is driven toward clearly separated regions.
Figure 5.
Distribution of louver angles in the top 10% high-performance samples under single-objective conditions. The blue boxes indicate the interquartile range (Q1–Q3), representing the central 50% distribution of louver angles in each top 10% high-performance sample group; the blue dots indicate outliers beyond the whisker range. For EUI, the lowest 10% samples were selected; for UDI, the highest 10% samples were selected; for PMV, the 10% samples with the minimum |PMV| were selected.
The distributions of the remaining variables show a different pattern. As shown in Figure 6, louver depth, louver reflectance, and WWR all vary across the three high-performance subsets, but their separation is much weaker than that of louver angle. Among them, WWR shows the clearest tendency, with a mean value of 0.677 in the high-performance UDI samples, compared with 0.593 in the high-performance EUI samples and 0.663 in the high-performance PMV samples. Even so, the overall overlap remains substantial, so these variables are better interpreted as auxiliary or conditional variables within the present design space, while louver angle remains the core conflict variable.
Figure 6.
Distributions of secondary variables in the top 10% high-performance samples under single-objective conditions.
To test whether the above interval centers are sensitive to the selection threshold, the louver-angle distributions of the Top 5%, Top 10%, and Top 15% subsets were further compared. The corresponding results are presented in Table 8. The results show that the central positions change only slightly as the threshold changes. For EUI, the mean louver angles of the Top 5%, Top 10%, and Top 15% subsets are 60.51°, 60.98°, and 60.48°, respectively, with medians remaining around 60–61°. For UDI, the corresponding mean values are 35.52°, 34.04°, and 32.59°, showing only a slight downward shift as the threshold expands. For optimal |PMV|, the mean louver angles are 3.35°, 5.32°, and 7.33°, respectively. Although the interval width increases as the threshold broadens, the preferred samples remain concentrated in the low-angle region overall. This comparison indicates that the identified preferred positions do not depend on one specific quantile threshold and therefore show robustness within the present sample space.
Table 8.
Stability of single-objective preferred louver-angle distributions under different high-performance quantile thresholds.
The threshold comparison in Table 8 shows that the preferred angular centers remain generally consistent across the Top 5%, Top 10%, and Top 15% subsets. For EUI, the mean louver angle remains close to 60°; for UDI, it remains concentrated in the medium-angle range around the low-to-mid 30s; and for minimum |PMV|, it remains in the low-angle range below 10°. This consistency indicates that the identified interval positions are robust within the sampled space and do not depend on one specific quantile threshold. Taken together, these results confirm that the three single-objective preferred intervals are already clearly separated along the louver-angle dimension, which provides the basis for the subsequent Bootstrap-based stability analysis.
3.2.4. Stability Test of the Preferred Intervals
To test the sensitivity of the single-objective preferred louver-angle intervals to sample perturbation, this study conducted a Bootstrap resampling analysis of the louver-angle distributions in the UDI high-value samples, EUI low-value samples, and optimal |PMV| samples. Specifically, 1000 resamples with replacement were drawn from each of the three types of top 10% high-performance samples, and the first quartile (Q1), median, and third quartile (Q3) of the louver angle were recalculated for each resample.
Figure 7 presents the angular distribution ranges of the three types of top 10% high-performance samples after Bootstrap resampling analysis. The points indicate the original quartile estimates, and the error bars indicate the 95% Bootstrap confidence intervals. The results show that the key statistical measures of the louver-angle distributions remain generally consistent with the original estimates, indicating that the identified single-objective preferred intervals are robust within the sampled space. Among the three objectives, the UDI-preferred interval remains concentrated in the medium–low angle range, the EUI-preferred interval remains in the medium–high angle range with a wider plateau-like spread, and the optimal |PMV| interval remains most concentrated in the low-angle range.
Figure 7.
Bootstrap-based quartile estimates and 95% confidence intervals of louver angle (°) for the Top 10% high-performance samples under the three single-objective conditions. Points indicate the original estimates of Q1, median, and Q3, and error bars indicate the 95% Bootstrap confidence intervals.
Overall, the Bootstrap results do not alter the relative positional relationships among the three objectives along the louver-angle dimension. UDI remains concentrated in the medium–low angle range, EUI in the medium–high angle range, and optimal |PMV| in the low-angle range. These findings are consistent with the bin-based statistical analysis and the high-performance sample comparison presented above, and they further support the identification of louver angle as the dominant conflict variable in fixed external shading design. On this basis, the next step is to identify the integrated high-value compromise band from the perspective of the continuous design space.
3.3. Identification of Multi-Objective Compromise Intervals
3.3.1. Continuous Angular Response Under Controlled Variables
On this basis, a further question can be addressed: after controlling the remaining variables, what continuous-response patterns does louver angle exhibit for the three performance indicators, and do peak regions, plateau regions, or monotonic intervals exist? To answer this question, conditional response curves for EUI, UDI, and PMV were constructed using the best-performing surrogate models identified in Section 3.1. Under fixed conditions of WWR, spatial dimensions, and the remaining shading parameters, only louver angle was allowed to vary continuously within the range of 0–90°, so that the response peaks, benefit plateaus, and slope-change characteristics associated with different objectives could be examined.
Figure 8 presents the variation trends of the three performance indicators with changing louver angle as predicted by the surrogate models. For EUI, the conditional response shows a typical pattern of rapid decrease followed by gradual stabilization. As the louver angle increases from low values to the medium–high range, annual total energy consumption decreases markedly; once the angle exceeds approximately 45°, the curve becomes much flatter and the energy-saving benefit enters a plateau region. This result is consistent with the raw-sample interval pattern and indicates that the main energy benefit of fixed external shading is established before the angle enters the higher range.
Figure 8.
Continuous-response curves of EUI, UDI, and PMV along louver angle (°) predicted by the selected surrogate models under fixed background conditions.
The conditional response of UDI shows a clear single-peak pattern under most background conditions, with the high-value region located in the medium-angle range. This indicates that daylighting performance does not improve continuously with increasing angle, but reaches a relative optimum at medium angles and then declines once the angle deviates from this interval. As WWR and spatial dimensions increase, the peak width becomes narrower, indicating greater sensitivity of the daylighting optimum to angular deviation.
The conditional response of PMV maintains a continuous downward trend under all background conditions. As the louver angle increases, the annual average PMV steadily shifts in the more negative direction. This indicates that thermal-environment deviation follows a largely monotonic response to louver opening, and further supports the judgment that the low-angle range is more favorable for maintaining annual thermal conditions closer to neutrality.
Overall, the three indicators exhibit different response forms under controlled-variable conditions: UDI corresponds to a medium-angle peak region, EUI to a medium-to-high-angle plateau region, and PMV to a monotonic response favoring the low-angle range. These results further verify that the integrated evaluation of the three indicators cannot be reduced to a direct combination of the single-objective optima and that the next step should focus on identifying a compromise band in the continuous design space.
3.3.2. Extraction of the Integrated High-Value Band and Compromise Interval
On the basis of the single-objective response patterns identified above, this study further constructed an equally weighted composite score for the three performance indicators. This equal-weight setting serves as a neutral analytical baseline for locating the integrated high-value zone of louver angle under balanced comparison across the three objectives [54,55,56]. The resulting interval is therefore interpreted as a neutral-baseline compromise zone within the current design space and can serve as a reference starting point for subsequent project-specific adjustment.
To construct the composite score, EUI, UDI, and |PMV| were first normalized separately. Since lower EUI values indicate better performance, inverse normalization was applied to EUI. UDI was normalized using a positive normalization scheme. Because thermal neutrality for PMV corresponds to 0, PMV was first transformed into |PMV| and then normalized inversely. All normalization procedures were based on the minimum and maximum values of the raw sample, and the corresponding equations are given in Equations (9)–(11). The three normalized scores were then averaged with equal weights to construct the composite score, as shown in Equation (12):
A higher composite score indicates better overall balanced performance across daylighting, energy consumption, and thermal environment. On this basis, the top 10% of samples ranked by the composite score were extracted as the top 10% composite-score samples.
In this study, equal weighting was adopted as a neutral analytical baseline for early-stage comparison, because project-specific priorities are often not yet fully defined at the scheme-design stage. Within this context, the equal-weight setting serves to identify a reference compromise zone for preliminary design judgment. To examine the sensitivity of the compromise interval to weighting assumptions, three additional priority scenarios were tested by assigning a weight of 0.50 in turn to EUI, UDI, and |PMV|, while the remaining two indicators were each assigned a weight of 0.25. Accordingly, in addition to the equal-weight baseline (0.33/0.33/0.33), an energy-priority scenario (0.50/0.25/0.25), a daylight-priority scenario (0.25/0.50/0.25), and a thermal-priority scenario (0.25/0.25/0.50) were compared. For each scenario, the composite score was recalculated using the same normalization procedure, and the top 10% composite-score samples were re-extracted to identify the corresponding louver-angle distribution.
After the three original datasets were merged according to their common input variables, the top 10% composite-score samples under the equal-weight baseline showed a concentration toward medium–low louver angles. The mean louver angle is 21.82°, the median is 22.5°, and the interquartile range is 8.75–33.25°, indicating that the integrated high-value samples cluster within an intermediate angular zone between the daylighting-oriented and thermal-neutrality-oriented preference regions. This result can therefore be interpreted as the positional center of a neutral-baseline compromise zone within the current design space.
When alternative weighting scenarios are introduced, the position of this compromise zone shifts in a clear directional manner. Under the energy-priority scenario, the mean louver angle increases to 31.84°, with an interquartile range of 23.00–42.00°, indicating an upward migration toward the energy-oriented interval. Under the daylight-priority scenario, the mean louver angle is 22.65°, with an interquartile range of 11.00–33.00°, remaining close to the neutral baseline. Under the thermal-priority scenario, the mean louver angle decreases to 9.82°, with an interquartile range of 3.00–14.00°, indicating a downward migration toward the low-angle thermal-neutrality interval. These results show that the compromise zone is weight-sensitive in position, and that its shift remains bounded within the current sampled space. The corresponding results are presented in Table 9.
Table 9.
Sensitivity of the compromise interval under different weighting scenarios.
To further verify this tendency in the continuous design space, surrogate-model-based continuous scanning was conducted along the louver-angle dimension under representative fixed background conditions. The corresponding results are presented in Figure 9. Under the equal-weight baseline, the composite score remains relatively high within a medium–low angle band and reaches its most concentrated region around 20–25°. From the perspective of interval identification, this band can be interpreted as the center of the neutral-baseline compromise zone under the current boundary conditions. For early-stage comparison and preliminary parameter screening, 15–30° may be used as a practical reference range with reasonable tolerance under the neutral baseline. When project priorities shift toward energy control or thermal neutrality, the center of the compromise zone should be adjusted accordingly.
Figure 9.
Composite-score response along louver angle (°) under the neutral equal-weight baseline.
These results indicate that the integrated compromise zone emerges from the overlap of three different response structures within the continuous design space. Under the current prototype and boundary conditions, approximately 20–25° can be regarded as the central compromise interval under the neutral equal-weight baseline, while 15–30° can be used as a practical starting range before project-specific weighting is introduced. The additional weighting scenarios further show that this interval shifts upward under energy-priority weighting, remains close to the neutral baseline under daylight-priority weighting, and shifts downward under thermal-priority weighting.
3.4. Conditional Modifications and Rule Integration
3.4.1. Shifts in Single-Objective Intervals and the Compromise Interval Under Different WWRs
After identifying the single-objective preferred intervals and the integrated compromise zone, the next step is to examine whether their central positions shift under different background conditions. Within the present variable system, WWR is the most suitable variable for grouped comparison because it directly affects daylight penetration and façade heat gain, shows a visible association with EUI, and is also linked to variation in the center of the compromise zone among the top 10% composite-score samples. The grouped comparison in Figure 10 is therefore organized around WWR.
Figure 10.
Shifts in louver-angle intervals (°) across WWR groups.
Figure 10a shows that WWR affects the central position of the louver angle differently across the three objectives. For UDI, the mean louver angle increases from 32.13° to 35.20° as WWR rises from 0.50–0.60 to 0.70–0.80, indicating a slight upward shift in the daylighting-preferred interval. For PMV, the mean louver angle changes only from 4.74° to 5.77°, showing that the preferred interval remains concentrated in the low-angle range. For EUI, the mean louver angle decreases from 65.57° to 57.29° when WWR increases from 0.50–0.60 to 0.60–0.70, while remaining within the medium-to-high angle range overall. Since the 0.70–0.80 group contains relatively few high-performance EUI samples, this result is treated only as a supplementary observation.
Compared with the single-objective grouped results, the grouped comparison of the high-scoring integrated samples is closer to the way early-stage design rules are actually expressed, as shown in Figure 10b. Within the top 10% composite-score samples, the mean compromise angle increases from 20.22° to 24.19° when WWR rises from 0.50–0.60 to 0.60–0.70, indicating an upward shift of approximately 4°. At the present stage, this result is interpreted as a descriptive conditional trend derived from grouped comparison, because the grouped distributions are still affected by sample composition within each WWR interval. Even so, the observed migration suggests that a larger façade opening ratio tends to move the compromise center toward a slightly larger louver angle. WWR can therefore be summarized as a first-layer background variable that modifies the position of the compromise interval, while the dominant conflict structure remains governed by louver angle.
3.4.2. Contextual Effects of Spatial-Scale Variables
Compared with WWR, the influence of the spatial-scale variables X, Y, and Z is expressed mainly through applicability background, local distribution change, and tolerance width of the interval patterns. Figure 11 compares the mean values and degrees of dispersion of the three types of single-objective top 10% high-performance samples along the X, Y, and Z dimensions. Their effects are visible in several grouped comparisons, especially for Y in relation to EUI, but they do not generate a cross-objective interval separation comparable to that of louver angle and do not provide grouped evidence as clear as that of WWR for the compromise zone.
Figure 11.
Means and dispersions of spatial-scale variables in the Top 10% single-objective high-performance samples.
As shown in Figure 11, the spatial-scale variables mainly influence the background conditions under which the interval guidance is interpreted, rather than reconstructing the interval structure itself. Among them, Y shows the clearest association with the objective-specific sample background, especially for EUI, where the mean value of the high-performance samples reaches 36.83, compared with 28.16 for UDI and 30.49 for PMV. By comparison, X shows only limited variation across the three objective-specific sample groups, and Z remains the most concentrated variable, with all three means staying close to 4.0 m. Taken together, these results indicate that X, Y, and Z function primarily as contextual variables for interval application within the current design space, while their influence remains weaker than that of louver angle and less direct than that of WWR in compromise-zone adjustment.
3.4.3. Integrated Expression of Fixed Rules and Conditional Rules
By synthesizing the results presented in Section 3.2, Section 3.3 and Section 3.4, the interval-based guidance for fixed external louvers can be expressed in two complementary forms, as shown in Table 10 and Table 11.
Table 10.
Interval-based guidance for fixed external louvers.
Table 11.
WWR-based conditional adjustment of the compromise zone for fixed external louvers.
The first form consists of fixed-interval rules for single-objective design and neutral-baseline comparison, including 45–75° for EUI-oriented design, 15–45° for UDI-oriented design, 0–15° for PMV-oriented design, and 15–30° as the starting range for balanced comparison under the neutral equal-weight baseline. The second form consists of conditional adjustment rules, which preserve the overall direction of the preferred intervals while refining the position of the compromise interval according to the background variable. In the present study, WWR functions as the clearest first-layer modifying variable, with the compromise zone shifting slightly downward for WWR = 0.50–0.60 and slightly upward for WWR = 0.60–0.70.
4. Discussion
4.1. Conflict Structure and Rule Extraction
The fixed external shading rules identified in this study are grounded in the shared control effect of louver angle on multi-objective performance. Correlation analysis shows that louver angle is significantly associated with all three performance indicators and exhibits the strongest cross-objective influence among the design variables. Combined with the bin-based statistical analysis, the reorganization of the top 10% high-performance samples, and the Bootstrap tests, these results further indicate that louver angle governs both the direction of variation in the three indicators and the separation among the preferred intervals under different performance priorities. The principal conflict in fixed external shading design lies in the fact that the same geometric parameter is driven toward different interval positions by different objectives. This conflict structure provides the analytical basis for extracting interval-based design guidance from performance results.
From the perspective of physical mechanisms, louver angle becomes the dominant conflict variable because it simultaneously affects direct solar interception, skylight admission paths, and heat gain at the envelope interface. On the thermal side, as the angle increases, direct solar radiation and part of the diffuse radiation entering the indoor space are more strongly suppressed, which helps reduce cooling demand and weaken radiant heat gain. On the daylight side, the same geometric change also alters sky exposure, the reflected daylight path from the louver surface, and indoor daylight admission. Medium angles can still preserve useful daylight through controlled admission and partial redirection, whereas excessive shading shortens the duration of useful daylight and weakens the daylight benefit [57,58,59]. The interval separation identified in this study is therefore a direct reflection of the different response directions of energy, daylighting, and thermal-environment tendency under the same geometric control parameter.
Existing shading studies have generated substantial knowledge on preferred parameter combinations, performance improvement, and variable sensitivity. In the current prototype and boundary conditions, the present study further organizes performance evidence into interval centers, interval widths, and conditional shift directions for design use. This output form is particularly relevant to early-stage façade design, where designers often need a manageable decision range before project-specific constraints and objective priorities are fully fixed.
4.2. Design Implications of the Compromise Interval
Under the neutral equal-weight baseline, the integrated analysis shows that the high-value performance of fixed external shading remains distributed within the medium–low louver-angle range. Within the present sample space, the high-scoring integrated samples cluster around a mean louver angle of 21.82°, and the surrogate-model-based continuous scanning further supports approximately 20–25° as the positional center of the neutral-baseline compromise zone, with 15–30° serving as a practical reference range for early-stage comparison. This compromise zone can therefore serve as a baseline reference for early-stage scheme screening and sustainable façade parameter preselection.
From the perspective of design interpretation, this compromise zone is located between the preferred positions of the three objectives. Under the present prototype and boundary conditions, lower angles are more favorable for maintaining PMV closer to neutrality, medium angles are more advantageous for useful daylight performance, and medium-to-high angles are more beneficial for annual energy control.
The grouped analysis further shows that the position of the compromise zone varies with background design conditions. Among the variables considered in this study, WWR provides the clearest grouped shift in the center of the compromise zone. When WWR increases from 0.50–0.60 to 0.60–0.70, the mean compromise angle increases from 20.22° to 24.19°, indicating an upward shift of approximately 4°. This result supports the use of WWR for conditional adjustment in early-stage design [60,61,62]. By comparison, the spatial-scale variables mainly contribute to the interpretation of the applicability background and local distribution differences within the current sample space.
From the perspective of rule application, the daylight-favorable interval should be interpreted as a daylight-availability range under the current indicator system rather than as a complete visual-comfort guarantee. Although medium louver angles improve useful daylight performance, bright louver surfaces or residual sky-view openings may still produce uncomfortable glare under specific luminous conditions. Accordingly, daylight-oriented use of the 15–45° interval should be followed by supplementary glare verification in detailed design.
4.3. Research Limitations and Applicable Boundaries
The interval-based guidance summarized in this study is applicable within the current cold-climate context of Tianjin, the standard-floor prototype of a point-supported glass curtain wall office building, the adopted operational settings, the tested parameter ranges, and the present indicator framework. The simulation model was uniformly aligned with the true south–north orientation as a fixed prototype condition. Accordingly, the reported interval centers and interval widths should be understood as orientation-specific design references derived under this prototype setting. When the climatic region, building typology, façade system, operation mode, or building orientation changes, the positional relationships among the recommended intervals may also change, and renewed verification is therefore necessary before direct transfer to other project contexts.
The present indicator system supports interval identification at the scheme-design stage, and its scope of interpretation should be understood accordingly. UDI describes useful daylight availability but does not directly represent visual comfort under high-luminance contrast, because uncomfortable glare may still occur at medium louver angles when bright louver surfaces or sky-view openings remain visible. In parallel, the annual average PMV used in this study reflects the long-term directional tendency of thermal sensation at the floor level. Its low-angle preference, therefore, indicates a tendency toward annual thermal neutrality within the sampled space, while it does not exclude short-term overheating during summer high-radiation periods or stronger cool-side deviation during winter occupied periods. Accordingly, the interval rules developed here are suitable for early-stage comparison and rule-based screening, while project-specific verification can be further conducted using supplementary assessments such as glare-related indicators, seasonal or extreme-period thermal checks, and other comfort criteria required by the design task.
From a methodological perspective, the identified interval positions still depend on the current sample distribution, variable ranges, and the prediction accuracy of the selected surrogate models. This issue is particularly relevant to UDI, whose statistical form makes local response discreteness more evident than that of EUI and PMV. Under these conditions, surrogate-model error is unlikely to alter the overall location of the preferred interval structure, but it may still affect the fine positioning of compromise boundaries and boundary-adjacent samples. For this reason, the rules proposed in this study are most appropriately used as interval-based judgment criteria for scheme design, and additional back-substitution simulations at representative center points and boundary points remain advisable in detailed engineering applications. In addition, conditional interval shifts are identified here mainly through grouped comparison and continuous-response interpretation within the sampled space, while specific interaction effects such as WWR × louver angle were not separately quantified and can be further examined in subsequent studies.
5. Conclusions
This study identified interval-based louver-angle guidance for the standard-floor prototype of a point-supported glass curtain wall office building in Tianjin’s cold climate under the current operational and boundary conditions. Focusing on EUI, UDI, and PMV, the results clarify the single-objective preferred intervals, the neutral-baseline compromise zone, and the background-dependent shift in that zone. The main conclusions are as follows:
- Louver angle is the dominant conflict variable in fixed external shading design and governs the separation among the preferred intervals of daylighting, energy use, and annual thermal-sensation tendency.
- The three performance objectives lead to clearly different preferred louver-angle intervals: 15–45° for UDI, with the main concentration in 30–45°; 45–75° for EUI, with a plateau emerging after 45°; and 0–15° for PMV, with the center concentrated in the low-angle range. The comparison across the Top 5%, Top 10%, and Top 15% subsets further shows that these preferred angular centers change only slightly within the sampled space.
- Under the neutral equal-weight baseline, the integrated high-value zone remains in the medium–low angle range. The mean louver angle of the high-scoring integrated samples is 21.82°, and 15–30° can be used as a practical starting range for early-stage balanced comparison.
- WWR provides the clearest grouped evidence for conditional adjustment of the compromise zone. As WWR increases, the compromise angle tends to shift upward, while spatial-scale variables mainly affect the applicability background and local distribution of the interval patterns.
Compared with conventional surrogate-assisted shading optimization studies that mainly report isolated high-performance parameter combinations, the present study expresses the results as interval centers, interval widths, and conditional shifts that remain usable before project-specific priorities are fully fixed.
For the standard-floor prototype of point-supported glass curtain wall office buildings in Tianjin’s cold climate zone, the results provide a rule-based reference for the preliminary setting and scheme screening of fixed external louvers in early-stage design. In practical terms, 0–15° can be used as the reference interval for thermal-neutrality-oriented schemes, 15–45° for daylight-oriented schemes, and 45–75° for energy-oriented schemes. Under the neutral equal-weight baseline, 15–30° can be used as the starting range for balanced comparison, with its center adjusted downward or upward according to project priorities and WWR conditions. For daylight-oriented applications, the recommended interval should be followed by supplementary glare verification in detailed design. These conclusions apply within the current climatic context, building prototype, operational settings, parameter ranges, indicator framework, and south–north orientation setting, and their transfer to other climates, orientations, or building scenarios requires renewed verification.
Supplementary Materials
The following supporting information can be downloaded at: https://www.mdpi.com/article/10.3390/su18094296/s1; Figure S1: Raw-sample responses of EUI, UDI, and PMV across 15° louver-angle intervals (°). (a) EUI; (b) UDI; (c) PMV. Table S1: Five-fold cross-validation results of the candidate surrogate models for EUI, UDI, and PMV.
Author Contributions
Conceptualization, J.S. and M.Z.; methodology, J.S. and M.Z.; software, J.S.; validation, J.S. and M.Z.; formal analysis, J.S.; investigation, J.S.; resources, M.Z.; data curation, J.S.; writing—original draft preparation, J.S.; writing—review and editing, M.Z.; visualization, J.S.; supervision, M.Z.; project administration, M.Z.; funding acquisition, M.Z. All authors have read and agreed to the published version of the manuscript.
Funding
This research received no external funding.
Institutional Review Board Statement
Not applicable.
Informed Consent Statement
Not applicable.
Data Availability Statement
The data are contained within the article or the Supplementary Materials.
Conflicts of Interest
The authors declare no conflicts of interest.
Abbreviations
The following abbreviations are used in this manuscript:
| EUI | Energy-use intensity |
| UDI | Useful daylight illuminance |
| PMV | Predicted mean vote |
| U-value | Thermal transmittance |
| WWR | Window-to-wall ratio |
| DOE | Design of experiments |
| DSE | Design space exploration |
| LightGBM | Light gradient boosting model |
| XGBoost | Extreme gradient boosting |
| SVR | Support vector regression |
| R2 | Coefficient of determination |
| MAE | Mean absolute error |
| RMSE | Root mean squared error |
| LHS | Latin hypercube sampling |
References
- Marquis, P.; Mirahadi, F.; Ali, H.; McCabe, B.; Shahi, A.; De Berardis, P.; Lyall, R. Window Wall and Curtain Wall: An Objective Review. In Proceedings of the CSCE/CRC International Construction Specialty Conference, Vancouver, BC, Canada, 31 May–3 June 2017. [Google Scholar]
- China Curtain Wall Network (CCWN). Report on Research and Development Analysis of the Doors, Windows and Curtain Walls Industry in China, 2022–2023. Available online: http://www.52mqw.com/info/2023-3-17/49877-1.htm (accessed on 10 February 2024).
- Shanghai Municipal Commission of Housing and Urban-Rural Development. Post-Legislative Evaluation Report on the Measures for the Administration of Architectural Glass Curtain Walls in Shanghai. 2022. Available online: https://zjw.sh.gov.cn/zcjd/20220126/fc6c50d80ad94c84824b969c43ad76be.html (accessed on 26 January 2022). (In Chinese)
- Ministry of Housing and Urban-Rural Development of the People’s Republic of China. Reply to Proposal No. 01159 of the Fifth Session of the 13th CPPCC National Committee (Urban and Rural Construction Category No. 031). 2023. Available online: https://www.mohurd.gov.cn/gongkai/fdzdgknr/jyta/gkzhudongtian/art/2022/art_18372_769733.html (accessed on 9 January 2023). (In Chinese)
- General Office of the State Council of the People’s Republic of China. Circular on Forwarding the Work Plan for Promoting Energy Conservation and Carbon Reduction in the Building Sector Issued by the National Development and Reform Commission and the Ministry of Housing and Urban-Rural Development. 2024. Available online: https://www.mee.gov.cn/zcwj/gwywj/202403/t20240318_1068599.shtml (accessed on 18 March 2024). (In Chinese)
- Respondek, Z. Heat Transfer Through Insulating Glass Units Subjected to Climatic Loads. Materials 2020, 13, 286. [Google Scholar] [CrossRef] [Scilit]
- Buratti, C.; Moretti, E.; Zinzi, M. High Energy-Efficient Windows with Silica Aerogel for Building Refurbishment: Experimental Characterization and Preliminary Simulations in Different Climate Conditions. Buildings 2017, 7, 8. [Google Scholar] [CrossRef] [Scilit]
- Pan, J.; Li, N.; Zhang, W.; He, Y.; Hu, X. Investigation Based on Physiological Parameters of Human Thermal Sensation and Comfort Zone on Indoor Solar Radiation Conditions in Summer. Build. Environ. 2022, 226, 109780. [Google Scholar] [CrossRef] [Scilit]
- Tzempelikos, A.; Athienitis, A.K. The Impact of Shading Design and Control on Building Cooling and Lighting Demand. Sol. Energy 2007, 81, 369–382. [Google Scholar] [CrossRef] [Scilit]
- Ochoa, C.E.; Capeluto, I.G. Advice Tool for Early Design Stages of Intelligent Facades Based on Energy and Visual Comfort Approach. Energy Build. 2009, 41, 480–488. [Google Scholar] [CrossRef] [Scilit]
- Huang, Y.; Niu, J.; Chung, T. Comprehensive Analysis on Thermal and Daylighting Performance of Glazing and Shading Designs on Office Building Envelope in Cooling-Dominant Climates. Appl. Energy 2014, 134, 215–228. [Google Scholar] [CrossRef] [Scilit]
- Freewan, A.A.Y. Impact of External Shading Devices on Thermal and Daylighting Performance of Offices in Hot Climate Regions. Sol. Energy 2014, 102, 14–30. [Google Scholar] [CrossRef] [Scilit]
- González, J.; Fiorito, F. Daylight Design of Office Buildings: Optimisation of External Solar Shadings by Using Combined Simulation Methods. Buildings 2015, 5, 560–580. [Google Scholar] [CrossRef] [Scilit]
- Esquivias, P.; Munoz, C.; Acosta, I.; Moreno, D.; Navarro, J. Climate-Based Daylight Analysis of Fixed Shading Devices in an Open-Plan Office. Light. Res. Technol. 2016, 48, 205–220. [Google Scholar] [CrossRef] [Scilit]
- Dutta, A.; Samanta, A.; Neogi, S. Influence of Orientation and the Impact of External Window Shading on Building Thermal Performance in Tropical Climate. Energy Build. 2017, 139, 680–689. [Google Scholar] [CrossRef] [Scilit]
- Zhai, Y.; Wang, Y.; Huang, Y.; Meng, X. A Multi-Objective Optimization Methodology for Window Design Considering Energy Consumption, Thermal Environment and Visual Performance. Renew. Energy 2019, 134, 1190–1199. [Google Scholar] [CrossRef] [Scilit]
- Westermann, P.; Evins, R. Surrogate Modelling for Sustainable Building Design—A Review. Energy Build. 2019, 198, 170–186. [Google Scholar] [CrossRef] [Scilit]
- Al-Masrani, S.M.; Al-Obaidi, K.M. Dynamic Shading Systems: A Review of Design Parameters, Platforms and Evaluation Strategies. Autom. Constr. 2019, 102, 195–216. [Google Scholar] [CrossRef] [Scilit]
- Tabadkani, A.; Roetzel, A.; Li, H.X.; Tsangrassoulis, A. Design Approaches and Typologies of Adaptive Facades: A Review. Autom. Constr. 2021, 121, 103450. [Google Scholar] [CrossRef] [Scilit]
- Plörer, D.; Hammes, S.; Hauer, M.; Van Karsbergen, V.; Pfluger, R. Control Strategies for Daylight and Artificial Lighting in Office Buildings—A Bibliometrically Assisted Review. Energies 2021, 14, 3852. [Google Scholar] [CrossRef] [Scilit]
- Wang, S.; Zhang, Q.; Liu, P.; Liang, R.; Fu, Z. A Parameterized Design Method for Building a Shading System Based on Climate Adaptability. Atmosphere 2022, 13, 1244. [Google Scholar] [CrossRef] [Scilit]
- Voigt, M.P.; Chwalek, K.; Roth, D.; Kreimeyer, M.; Blandini, L. The Integrated Design Process of Adaptive Façades—A Comprehensive Perspective. J. Build. Eng. 2023, 67, 106043. [Google Scholar] [CrossRef] [Scilit]
- Nazari, S.; Keshavarz Mirza Mohammadi, P.; Sareh, P. A Multi-objective Optimization Approach to Designing Window and Shading Systems Considering Building Energy Consumption and Occupant Comfort. Eng. Rep. 2023, 5, e12726. [Google Scholar] [CrossRef] [Scilit]
- Zhang, H.; Cui, Y.; Cai, H.; Chen, Z. Optimization and Prediction of Office Building Shading Devices for Energy, Daylight, and View Consideration Using Genetic and BO-LGBM Algorithms. Energy Build. 2024, 324, 114939. [Google Scholar] [CrossRef] [Scilit]
- Elwy, I.; Hagishima, A. The Artificial Intelligence Reformation of Sustainable Building Design Approach: A Systematic Review on Building Design Optimization Methods Using Surrogate Models. Energy Build. 2024, 323, 114769. [Google Scholar] [CrossRef] [Scilit]
- Brzezicki, M. A Systematic Review of the Most Recent Concepts in Kinetic Shading Systems with a Focus on Biomimetics: A Motion/Deformation Analysis. Sustainability 2024, 16, 5697. [Google Scholar] [CrossRef] [Scilit]
- Zhangabay, N.; Tursunkululy, T.; Ibraimova, U.; Abdikerova, U. Energy-Efficient Adaptive Dynamic Building Facades: A Review of Their Energy Efficiency and Operating Loads. Appl. Sci. 2024, 14, 10979. [Google Scholar] [CrossRef] [Scilit]
- Alsukkar, M.; Ibrahim, A.; Eltaweel, A. Multi-Objective Optimization of Daylighting Systems for Energy Efficiency and Thermal-Visual Comfort in Buildings: A Review. Build. Environ. 2026, 288, 113921. [Google Scholar] [CrossRef] [Scilit]
- Hong, T.; Yan, D.; D’Oca, S.; Chen, C. Ten Questions Concerning Occupant Behavior in Buildings: The Big Picture. Build. Environ. 2017, 114, 518–530. [Google Scholar] [CrossRef] [Scilit]
- Feng, W.; Chen, J.; Yang, Y.; Gao, W.; Zhao, Q.; Xing, H.; Yu, S. The Impact of Building Morphology on Energy Use Intensity of High-Rise Residential Clusters: A Case Study of Hangzhou, China. Buildings 2024, 14, 2245. [Google Scholar] [CrossRef] [Scilit]
- Sayadi, S.; Hayati, A.; Salmanzadeh, M. Optimization of Window-to-Wall Ratio for Buildings Located in Different Climates: An IDA-Indoor Climate and Energy Simulation Study. Energies 2021, 14, 1974. [Google Scholar] [CrossRef] [Scilit]
- Alsukkar, M.; Hu, M.; Gadi, M.; Su, Y. A Study on Daylighting Performance of Split Louver with Simplified Parametric Control. Buildings 2022, 12, 594. [Google Scholar] [CrossRef] [Scilit]
- Lee, K.; Lim, H.; Hwang, J.; Lee, D. Development of Building Benchmarking Index for Improving Gross-Floor-Area-Based Energy Use Intensity. Energy Build. 2025, 328, 115103. [Google Scholar] [CrossRef] [Scilit]
- Li, S.; Li, D.H.W.; Chen, W.; Lou, S.; Tsang, E.K.W. Simple Mathematical Models to Link Climate-Based Daylight Metrics with Daylight Factor Metrics and Daylighting Design Implications. Heliyon 2023, 9, e15786. [Google Scholar] [CrossRef] [Scilit]
- Yan, H.; Ji, G.; Cao, S.; Zhang, B. Developing an Integrated Prediction Model for Daylighting, Thermal Comfort, and Energy Consumption in Residential Buildings Based on the Stacking Ensemble Learning Algorithm. Build. Simul. 2024, 17, 2125–2143. [Google Scholar] [CrossRef] [Scilit]
- Atthaillah; Mangkuto, R.A.; Koerniawan, M.D.; Subramaniam, S.; Yuliarto, B. Formulation of Climate-Based Daylighting Design Prediction Model for High Performance Tropical School Classrooms. Energy Build. 2024, 304, 113849. [Google Scholar] [CrossRef] [Scilit]
- ISO 7730:2005; Ergonomics of the Thermal Environment—Analytical Determination and Interpretation of Thermal Comfort Using Calculation of the PMV and PPD Indices and Local Thermal Comfort Criteria. International Organization for Standardization: Geneva, Switzerland, 2005.
- Ovando-Chacon, G.E.; Cruz-Octaviano, E.; Rodriguez-Leon, A.; Ovando-Chacon, S.L.; Martinez-Gonzalez, R.F. Numerical Analysis of the Impact of Air Conditioning Operating Parameters on Thermal Comfort in a Classroom in Hot Climate Regions. Buildings 2026, 16, 400. [Google Scholar] [CrossRef] [Scilit]
- Rakotoarivelo, T.; Malet-Damour, B. Exploring the Interplay between Thermal and Visual Perception: A Critical Review of Studies from 1926 to 2022. Buildings 2023, 13, 879. [Google Scholar] [CrossRef] [Scilit]
- Chaloeytoy, K.; Ichinose, M.; Chien, S.-C. Determination of the Simplified Daylight Glare Probability (DGPs) Criteria for Daylit Office Spaces in Thailand. Buildings 2020, 10, 180. [Google Scholar] [CrossRef] [Scilit]
- Shafavi, N.S.; Tahsildoost, M.; Zomorodian, Z.S. Investigation of Illuminance-Based Metrics in Predicting Occupants’ Visual Comfort (Case Study: Architecture Design Studios). Sol. Energy 2020, 197, 111–125. [Google Scholar] [CrossRef] [Scilit]
- Favero, M.; Sartori, I.; Carlucci, S. Human Thermal Comfort under Dynamic Conditions: An Experimental Study. Build. Environ. 2021, 204, 108144. [Google Scholar] [CrossRef] [Scilit]
- GB 55015-2021; General Code for Building Energy Efficiency and Renewable Energy Utilization. China Architecture & Building Press: Beijing, China, 2021.
- Choi, Y.; Song, D.; Yoon, S.; Koo, J. Comparison of Factorial and Latin Hypercube Sampling Designs for Meta-Models of Building Heating and Cooling Loads. Energies 2021, 14, 512. [Google Scholar] [CrossRef] [Scilit]
- Ali, A.; Jayaraman, R.; Mayyas, A.; Alaifan, B.; Azar, E. Machine Learning as a Surrogate to Building Performance Simulation: Predicting Energy Consumption under Different Operational Settings. Energy Build. 2023, 286, 112940. [Google Scholar] [CrossRef] [Scilit]
- Shirzadi, N.; Lau, D.; Stylianou, M. Surrogate Modeling for Building Design: Energy and Cost Prediction Compared to Simulation-Based Methods. Buildings 2025, 15, 2361. [Google Scholar] [CrossRef] [Scilit]
- Singh, M.M.; Deb, C.; Geyer, P. Early-Stage Design Support Combining Machine Learning and Building Information Modelling. Autom. Constr. 2022, 136, 104147. [Google Scholar] [CrossRef] [Scilit]
- Yue, N.; Caini, M.; Li, L.; Zhao, Y.; Li, Y. A Comparison of Six Metamodeling Techniques Applied to Multi Building Performance Vectors Prediction on Gymnasiums under Multiple Climate Conditions. Appl. Energy 2023, 332, 120481. [Google Scholar] [CrossRef] [Scilit]
- Tien, P.W.; Wei, S.; Darkwa, J.; Wood, C.; Calautit, J.K. Machine Learning and Deep Learning Methods for Enhancing Building Energy Efficiency and Indoor Environmental Quality—A Review. Energy AI 2022, 10, 100198. [Google Scholar] [CrossRef] [Scilit]
- Seyedzadeh, S.; Pour Rahimian, F.; Rastogi, P.; Glesk, I. Tuning Machine Learning Models for Prediction of Building Energy Loads. Sustain. Cities Soc. 2019, 47, 101484. [Google Scholar] [CrossRef] [Scilit]
- Maltais, L.-G.; Gosselin, L. Daylighting ‘Energy and Comfort’ Performance in Office Buildings: Sensitivity Analysis, Metamodel and Pareto Front. J. Build. Eng. 2017, 14, 61–72. [Google Scholar] [CrossRef] [Scilit]
- Lin, C.-H.; Tsay, Y.-S. A Metamodel Based on Intermediary Features for Daylight Performance Prediction of Façade Design. Build. Environ. 2021, 206, 108371. [Google Scholar] [CrossRef] [Scilit]
- Le-Thanh, L.; Nguyen-Thi-Viet, H.; Lee, J.; Nguyen-Xuan, H. Machine Learning-Based Real-Time Daylight Analysis in Buildings. J. Build. Eng. 2022, 52, 104374. [Google Scholar] [CrossRef] [Scilit]
- Khadra, A.; Hugosson, M.; Akander, J.; Myhren, J.A. Development of a Weight Factor Method for Sustainability Decisions in Building Renovation. Case Study Using Renobuild. Sustainability 2020, 12, 7194. [Google Scholar] [CrossRef] [Scilit]
- Pilechiha, P.; Mahdavinejad, M.; Pour Rahimian, F.; Carnemolla, P.; Seyedzadeh, S. Multi-Objective Optimisation Framework for Designing Office Windows: Quality of View, Daylight and Energy Efficiency. Appl. Energy 2020, 261, 114356. [Google Scholar] [CrossRef] [Scilit]
- Setyantho, G.; Park, H.; Chang, S. Multi-Criteria Performance Assessment for Semi-Transparent Photovoltaic Windows in Different Climate Contexts. Sustainability 2021, 13, 2198. [Google Scholar] [CrossRef] [Scilit]
- Atzeri, A.; Cappelletti, F.; Gasparella, A. Internal Versus External Shading Devices Performance in Office Buildings. Energy Procedia 2014, 45, 463–472. [Google Scholar] [CrossRef] [Scilit]
- Liu, Y.; Wang, W.; Li, Z.; Song, J.; Fang, Z.; Pang, D.; Chen, Y. Daylighting Performance and Thermal Comfort Performance Analysis of West-Facing External Shading for School Office Buildings in Cold and Severe Cold Regions of China. Sustainability 2023, 15, 14458. [Google Scholar] [CrossRef] [Scilit]
- Nazari, S.; MirzaMohammadi, P.K.; Sajadi, B.; Pilehchi Ha, P.; Talatahari, S.; Sareh, P. Designing Energy-Efficient and Visually-Thermally Comfortable Shading Systems for Office Buildings in a Cooling-Dominant Climate. Energy Rep. 2023, 10, 3863–3881. [Google Scholar] [CrossRef] [Scilit]
- Xue, P.; Li, Q.; Xie, J.; Zhao, M.; Liu, J. Optimization of Window-to-Wall Ratio with Sunshades in China Low Latitude Region Considering Daylighting and Energy Saving Requirements. Appl. Energy 2019, 233–234, 62–70. [Google Scholar] [CrossRef] [Scilit]
- Goia, F. Search for the Optimal Window-to-Wall Ratio in Office Buildings in Different European Climates and the Implications on Total Energy Saving Potential. Sol. Energy 2016, 132, 467–492. [Google Scholar] [CrossRef] [Scilit]
- Wu, Z.; Xu, Y.; Wang, Z. Multi-Objective Optimization of Energy, View, Daylight and Thermal Comfort for Building’s Fenestration and Shading System in Hot-Humid Climates. PLoS ONE 2025, 20, e0325290. [Google Scholar] [CrossRef] [Scilit] [PubMed]
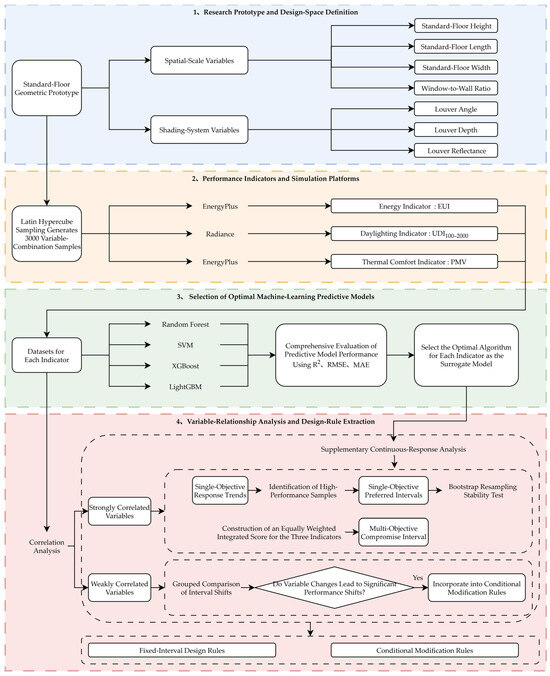
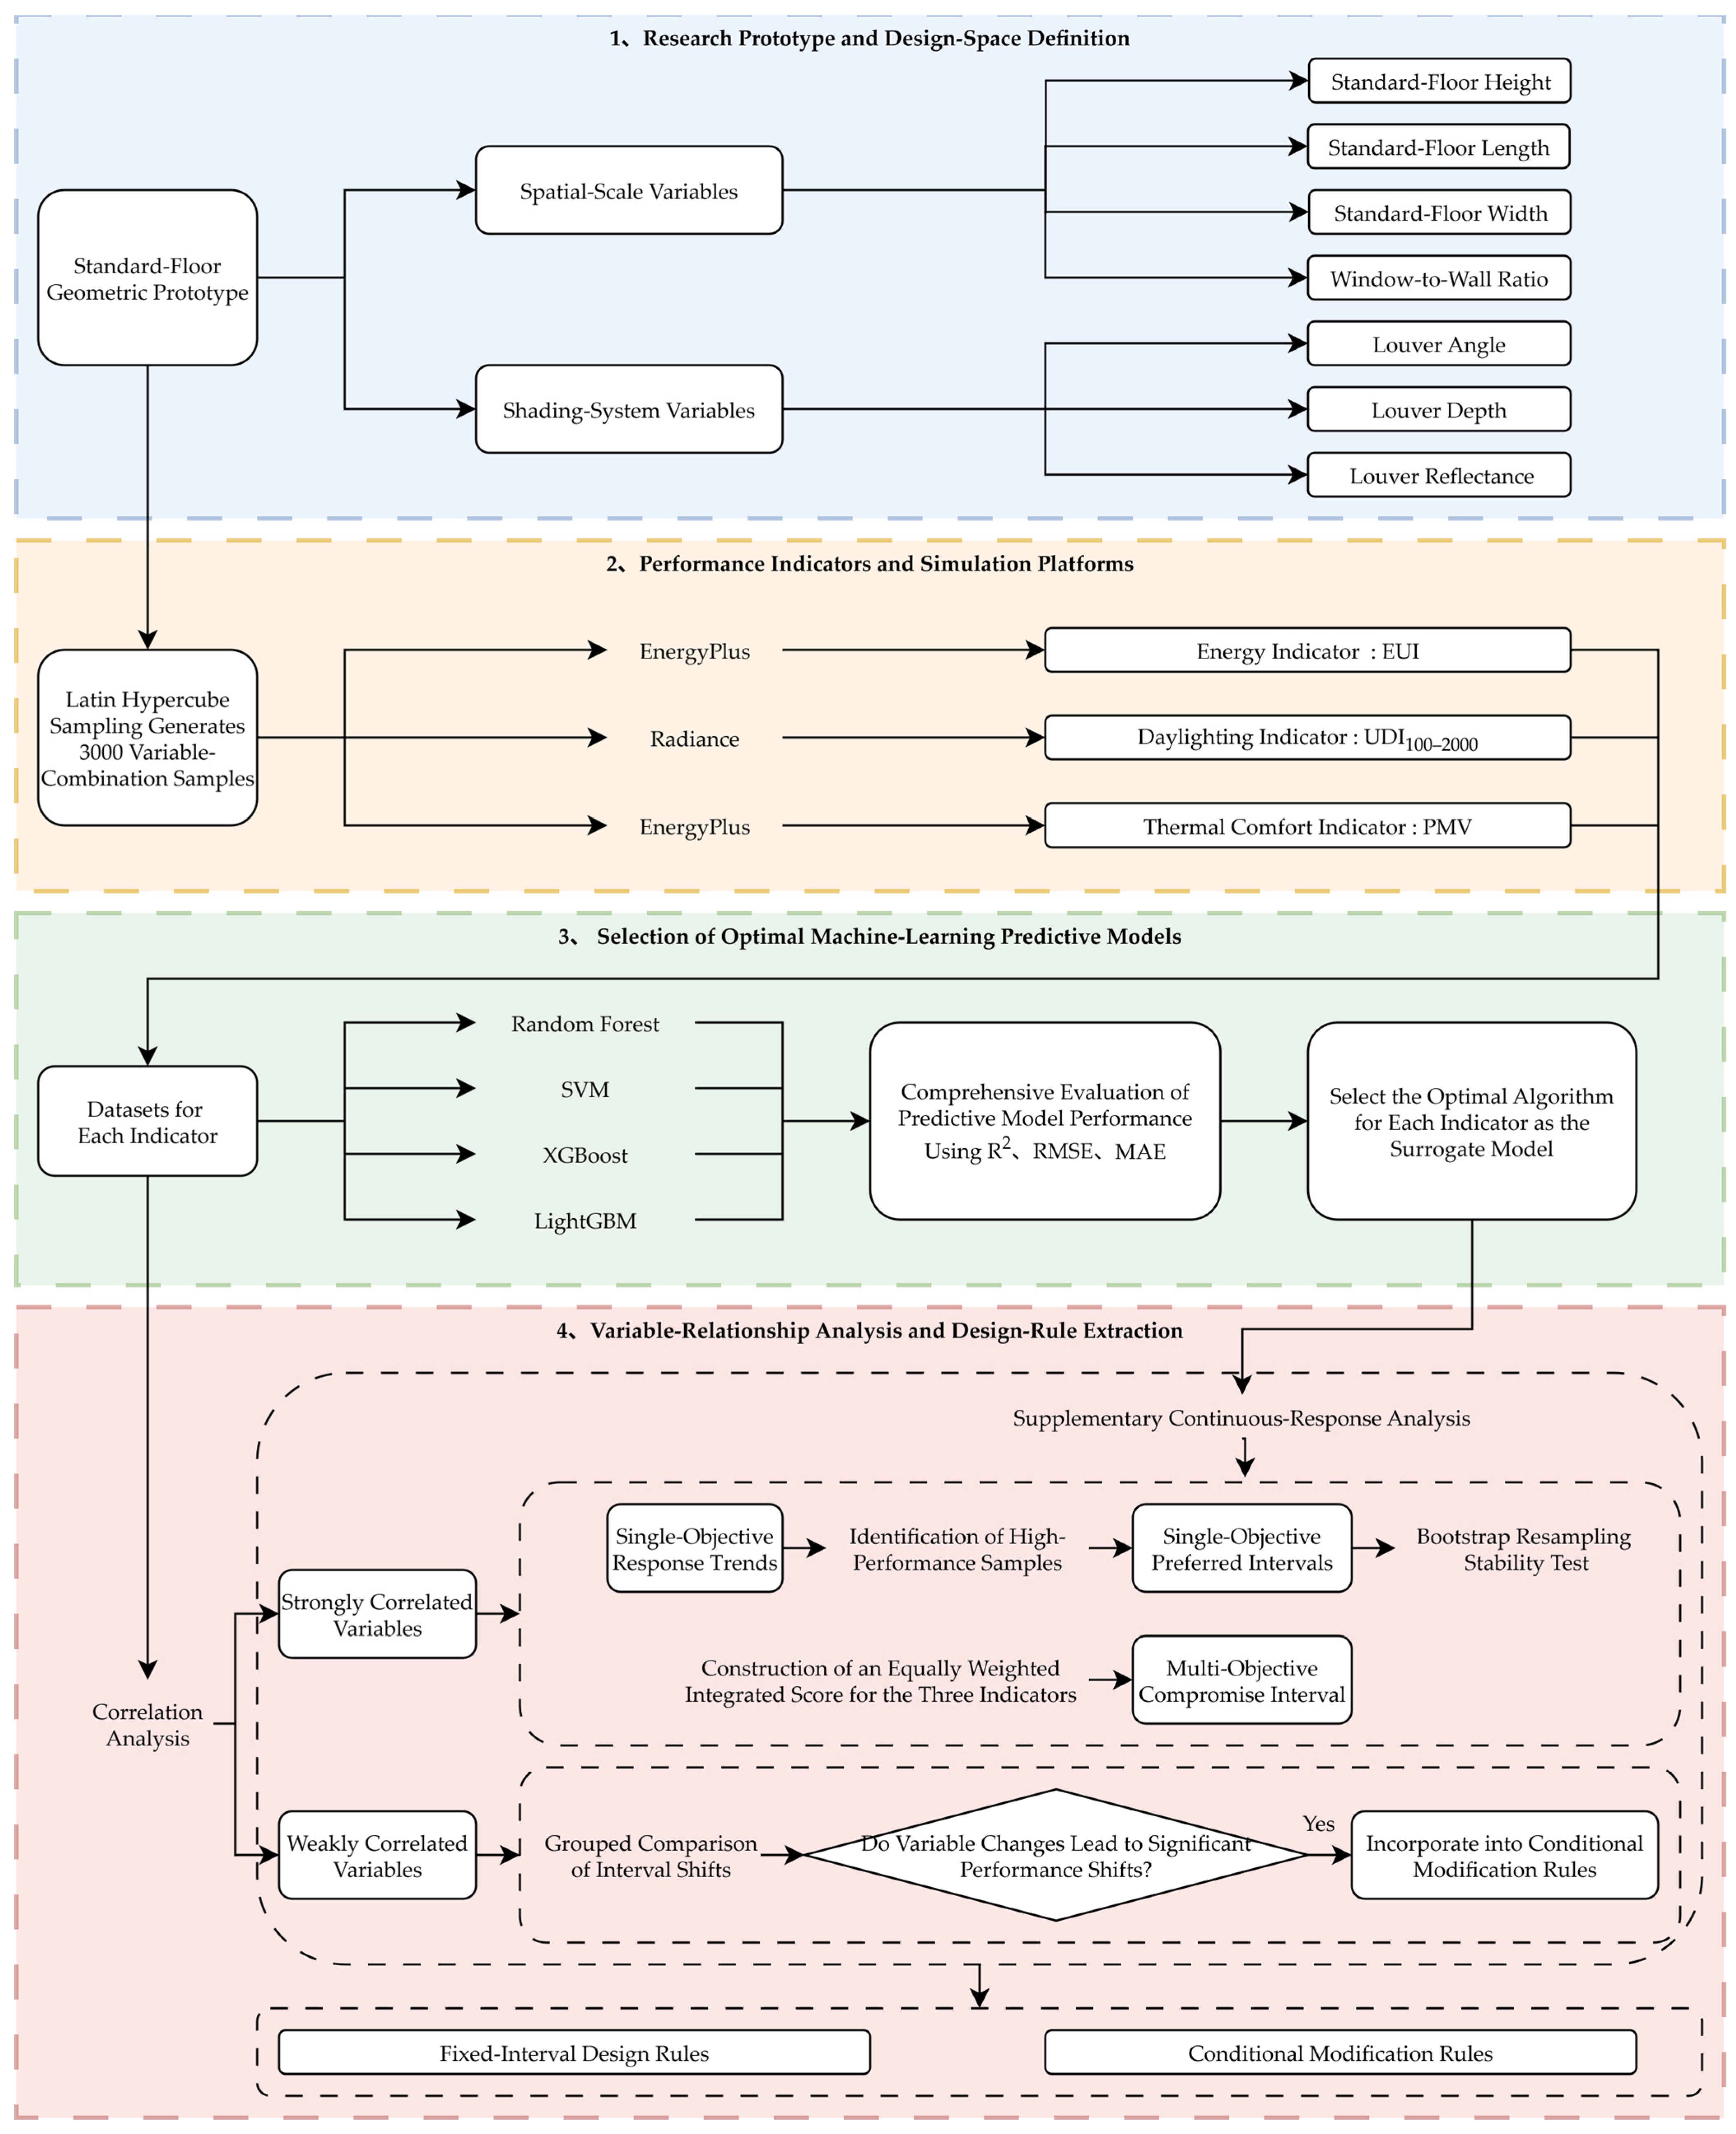
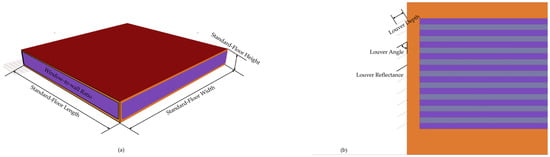
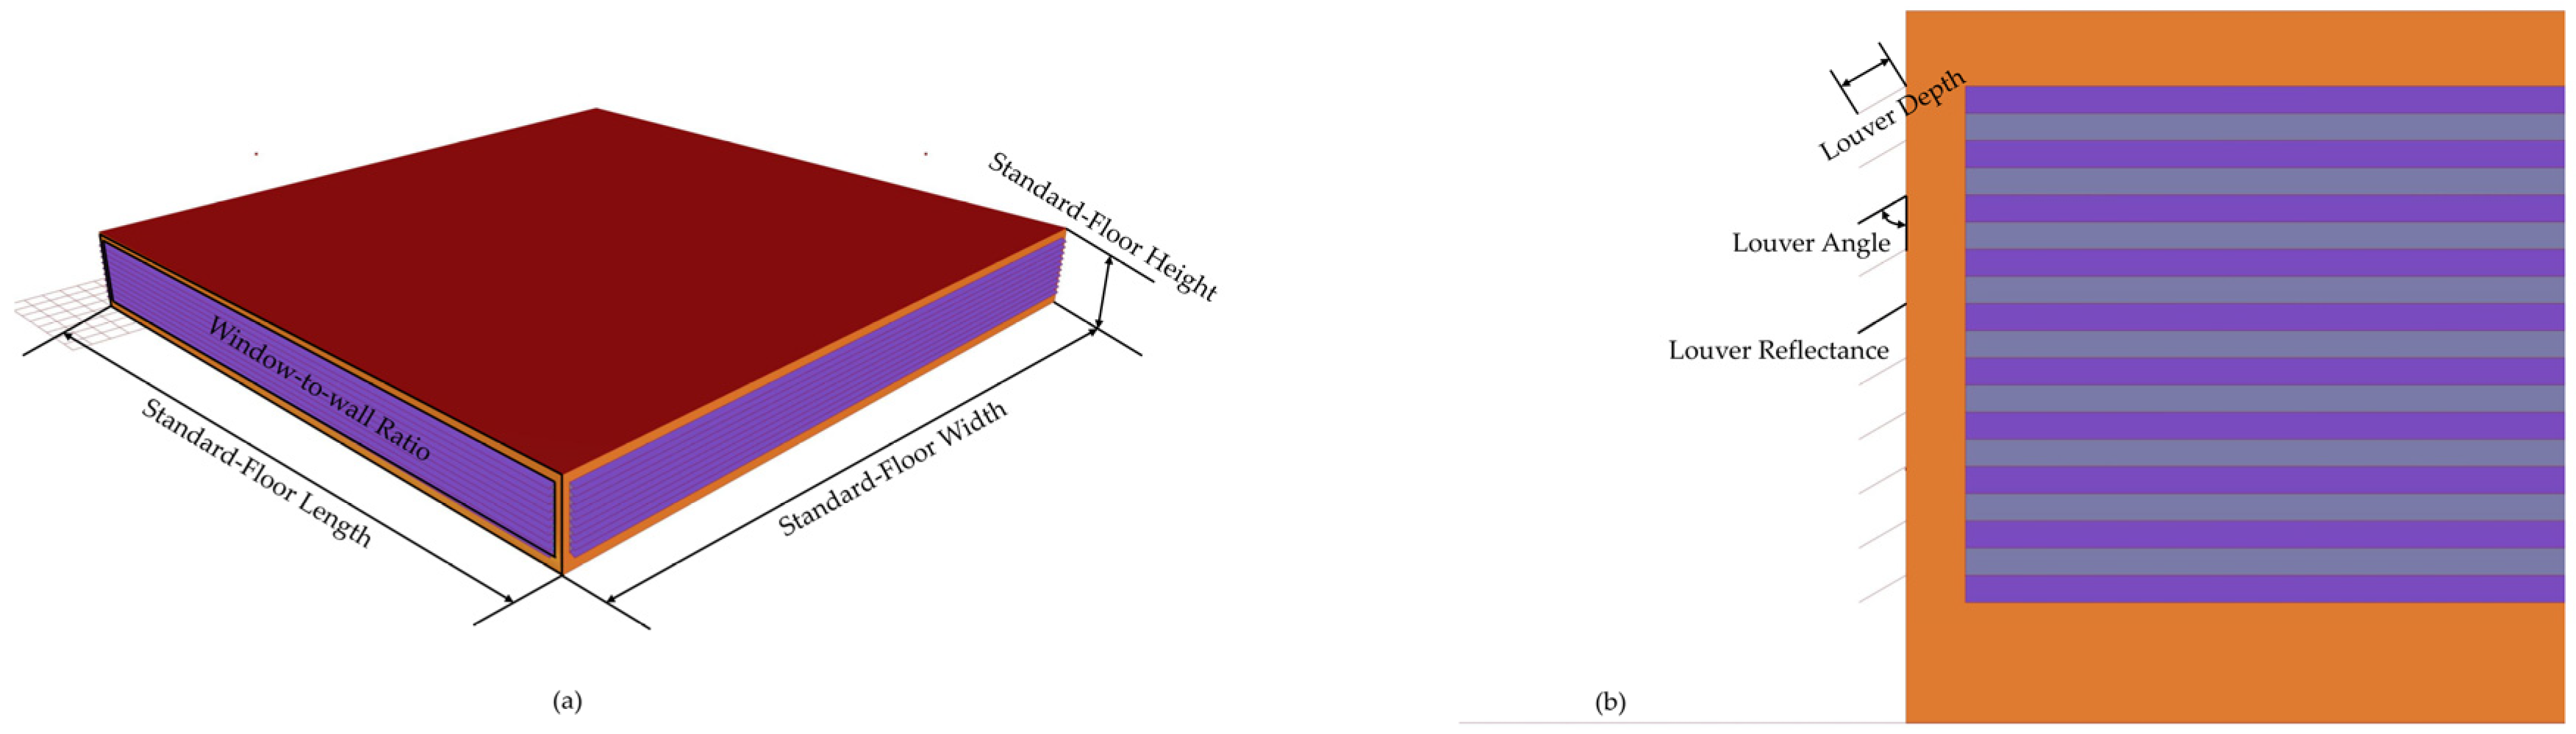
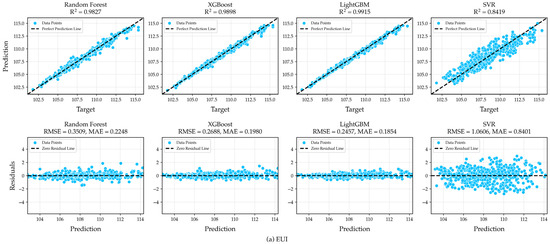
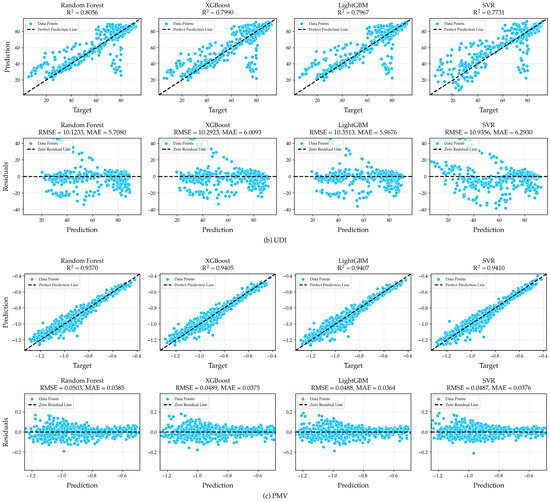
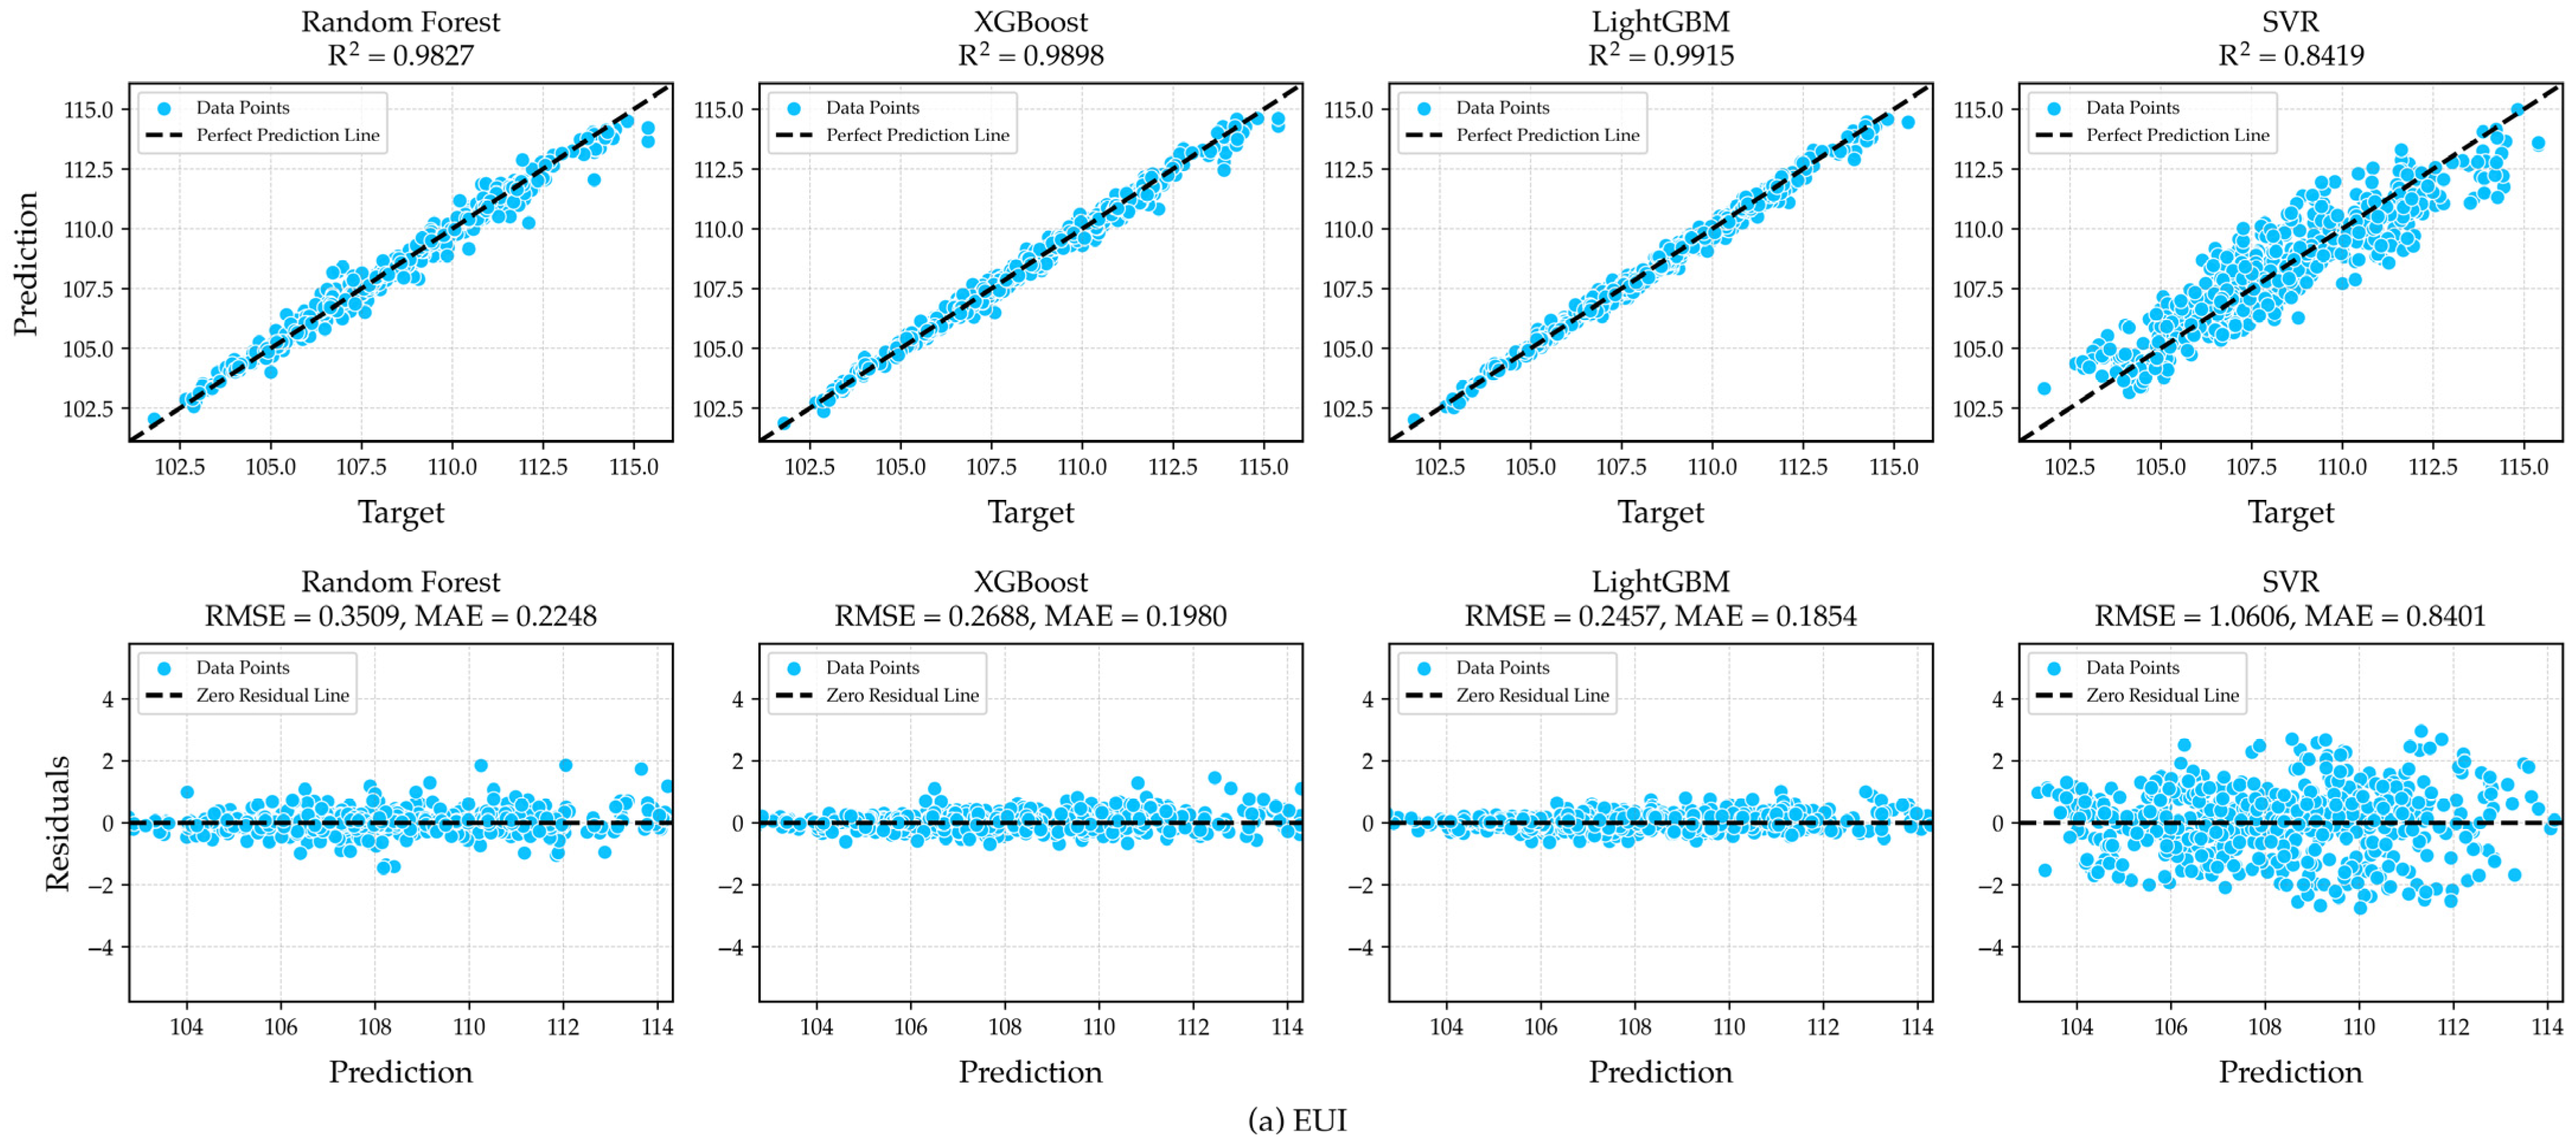
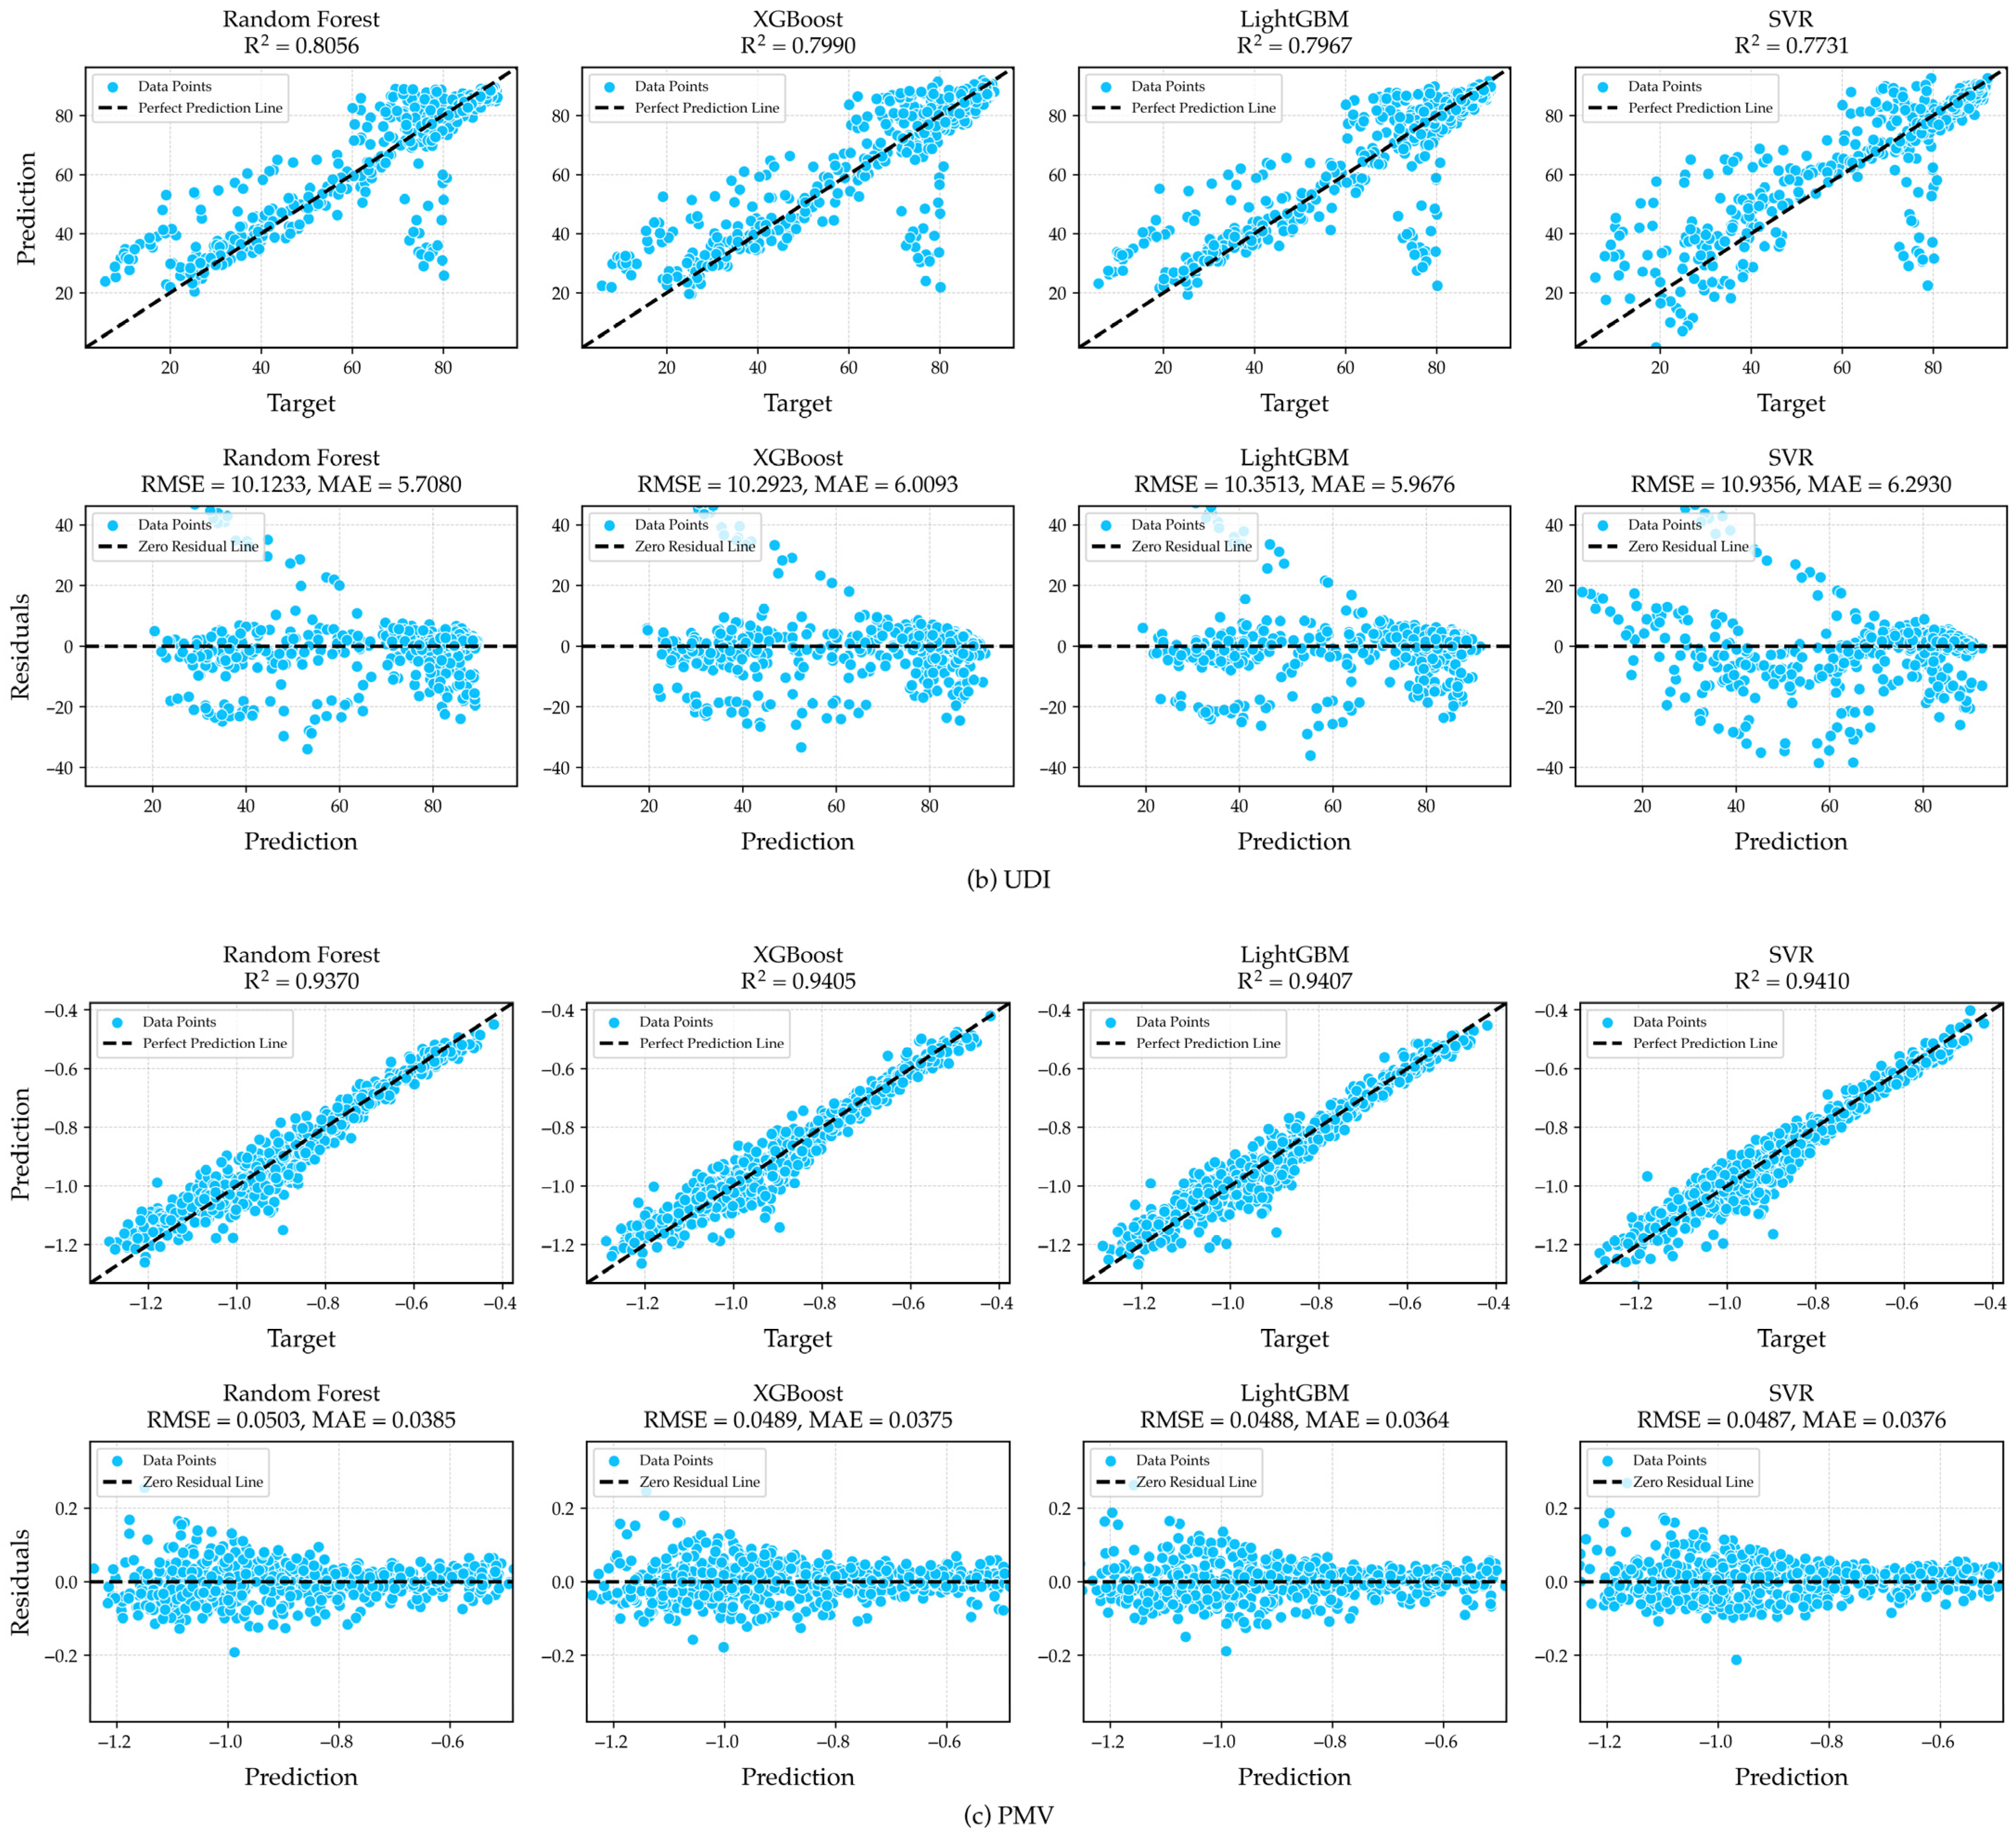
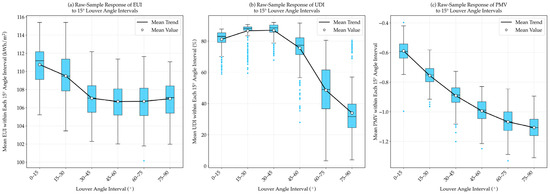
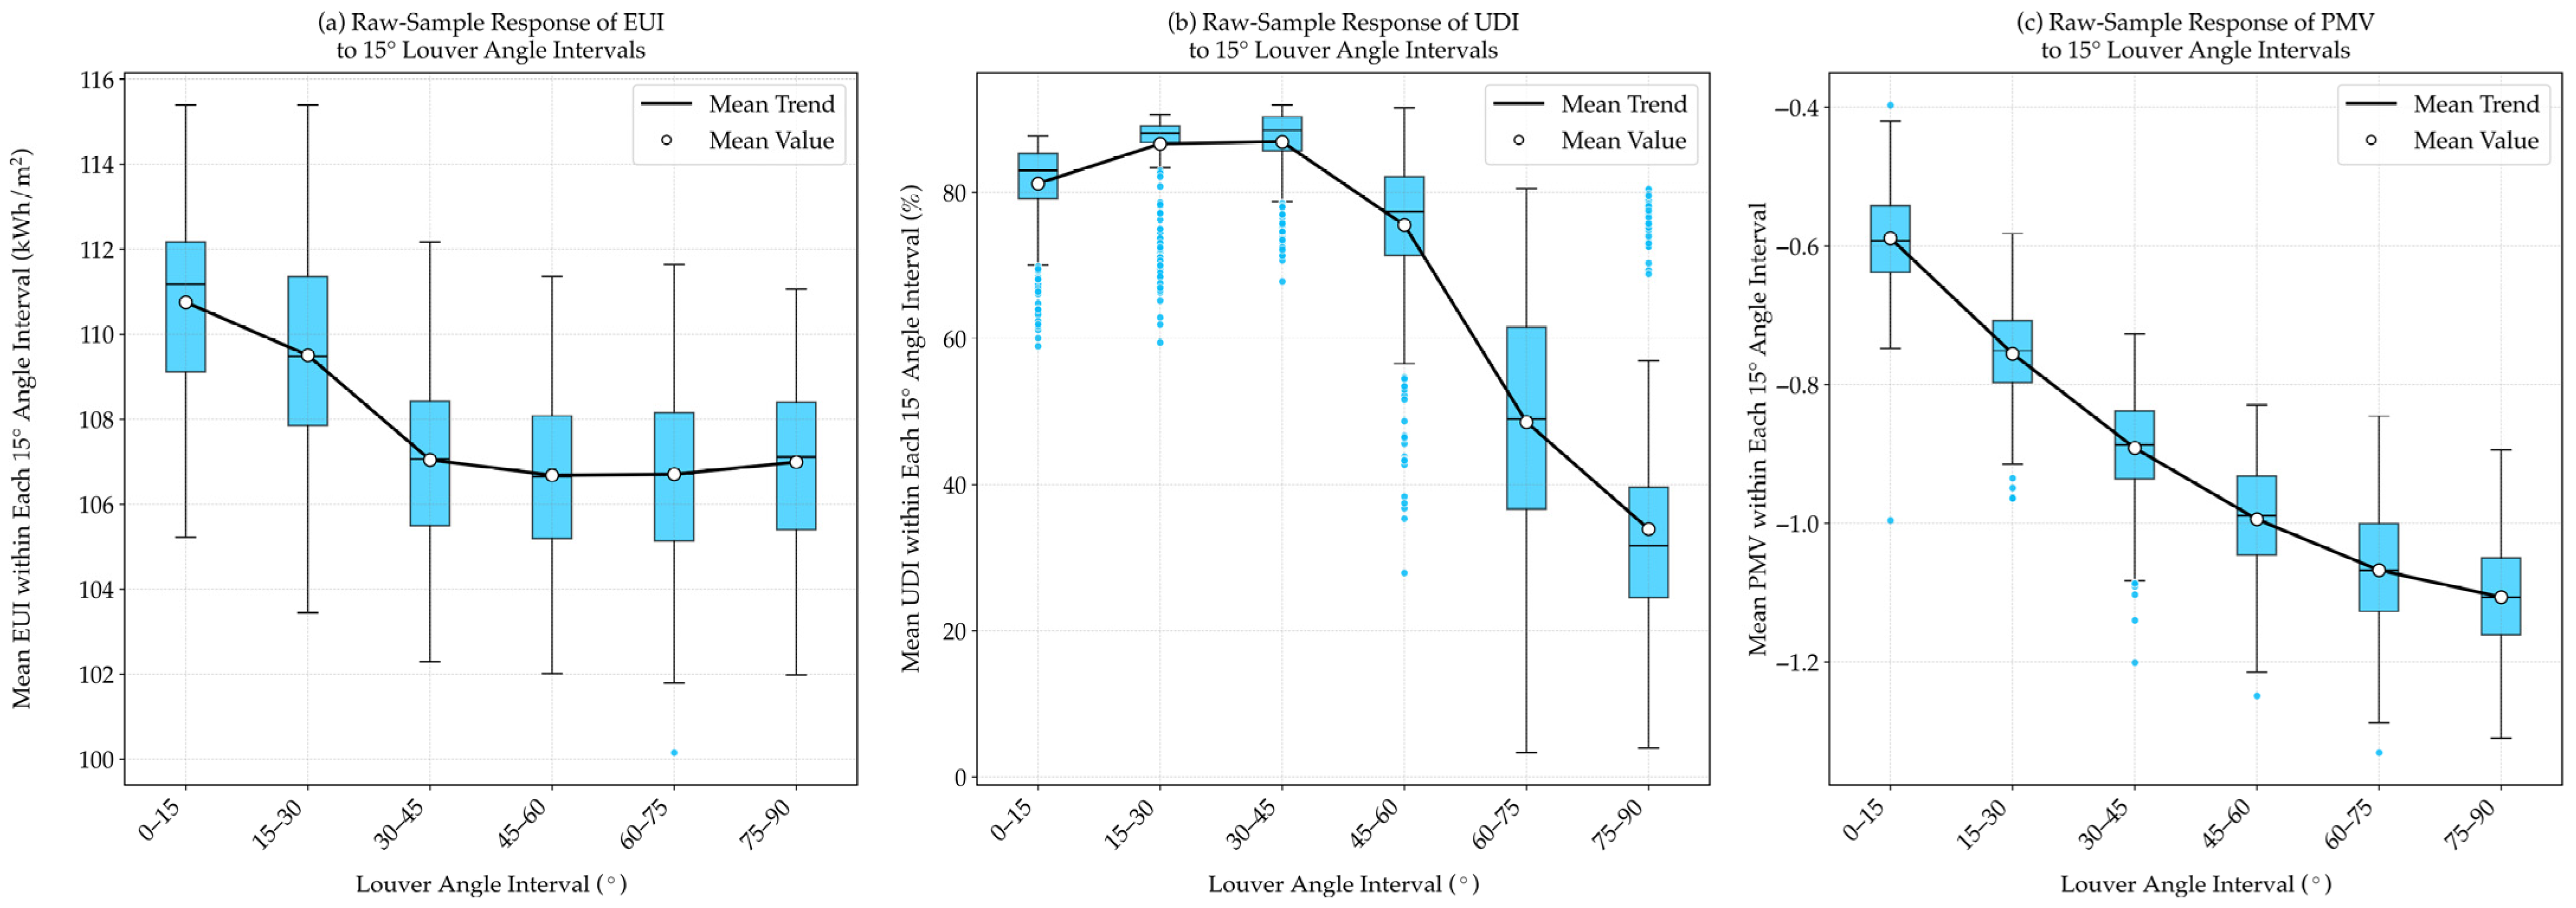
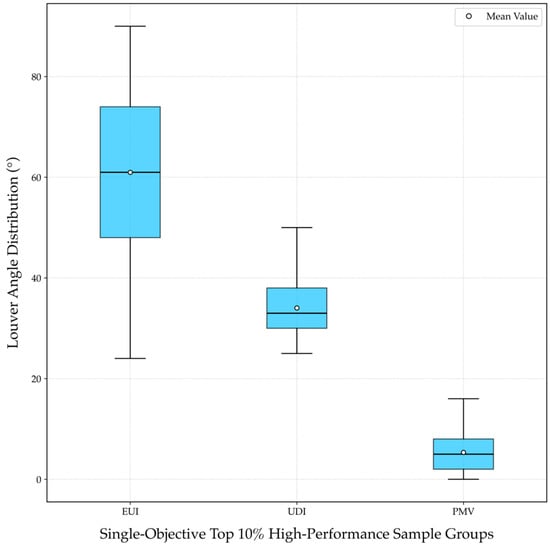
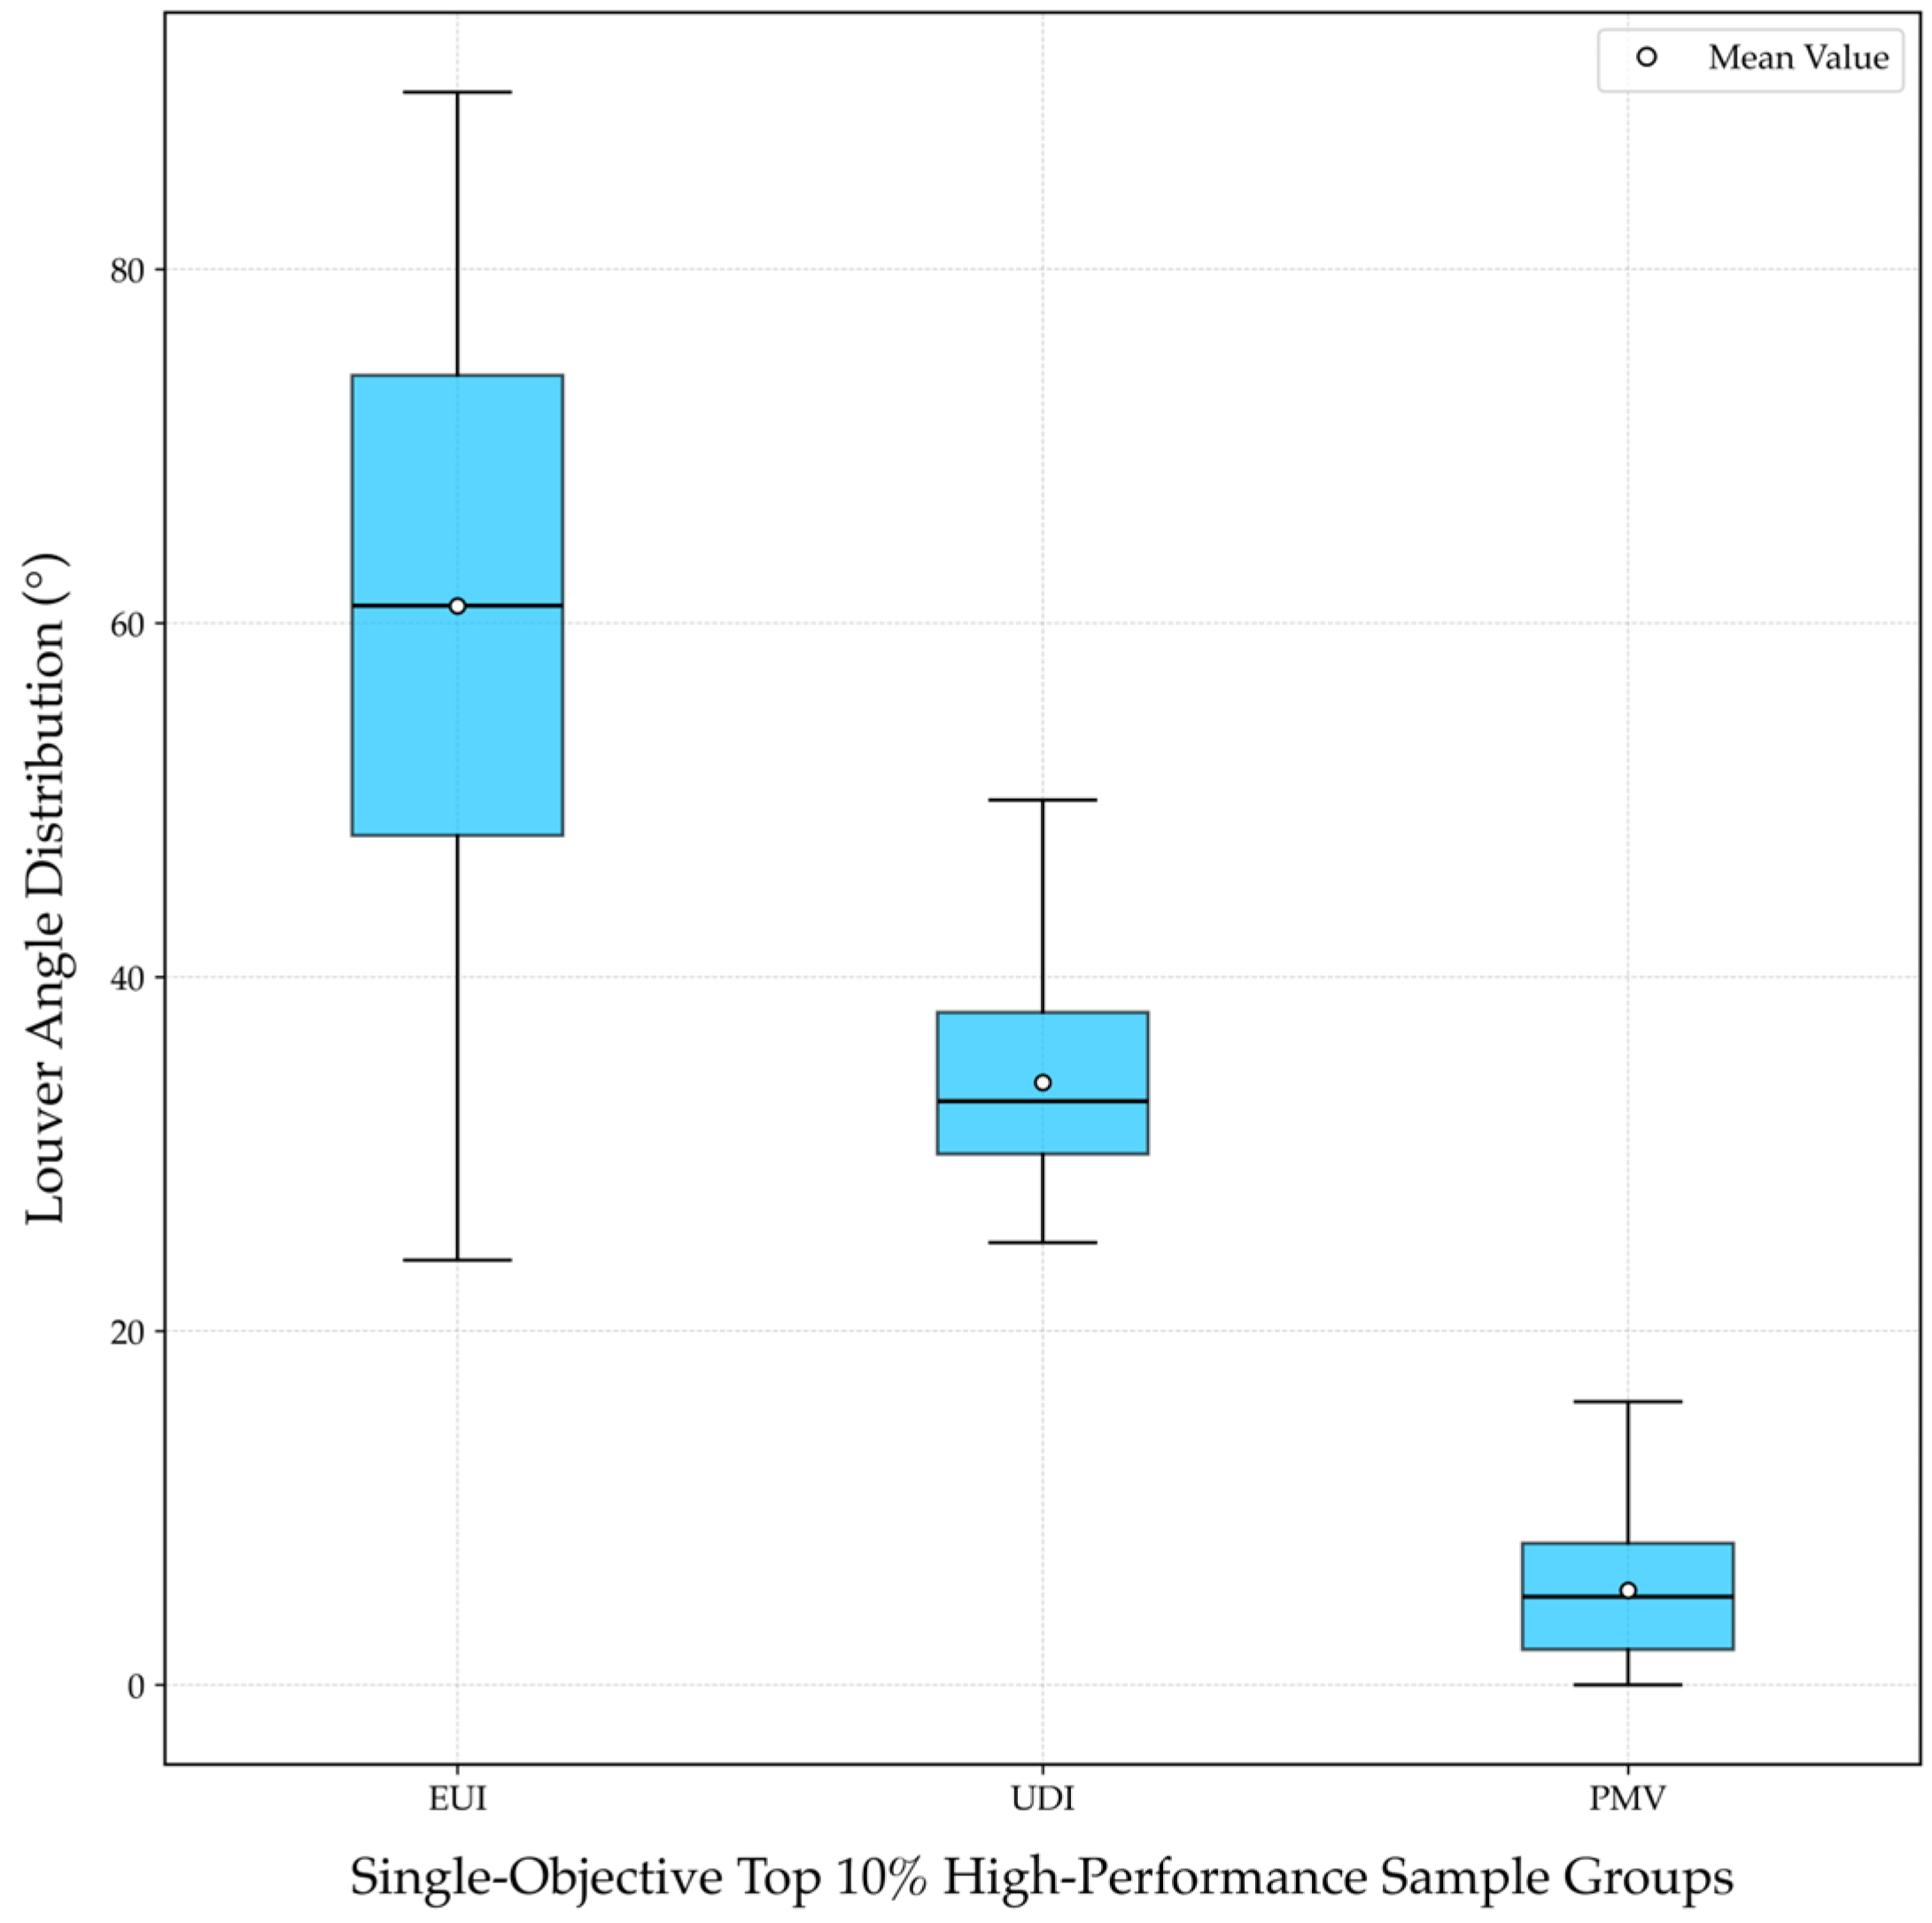
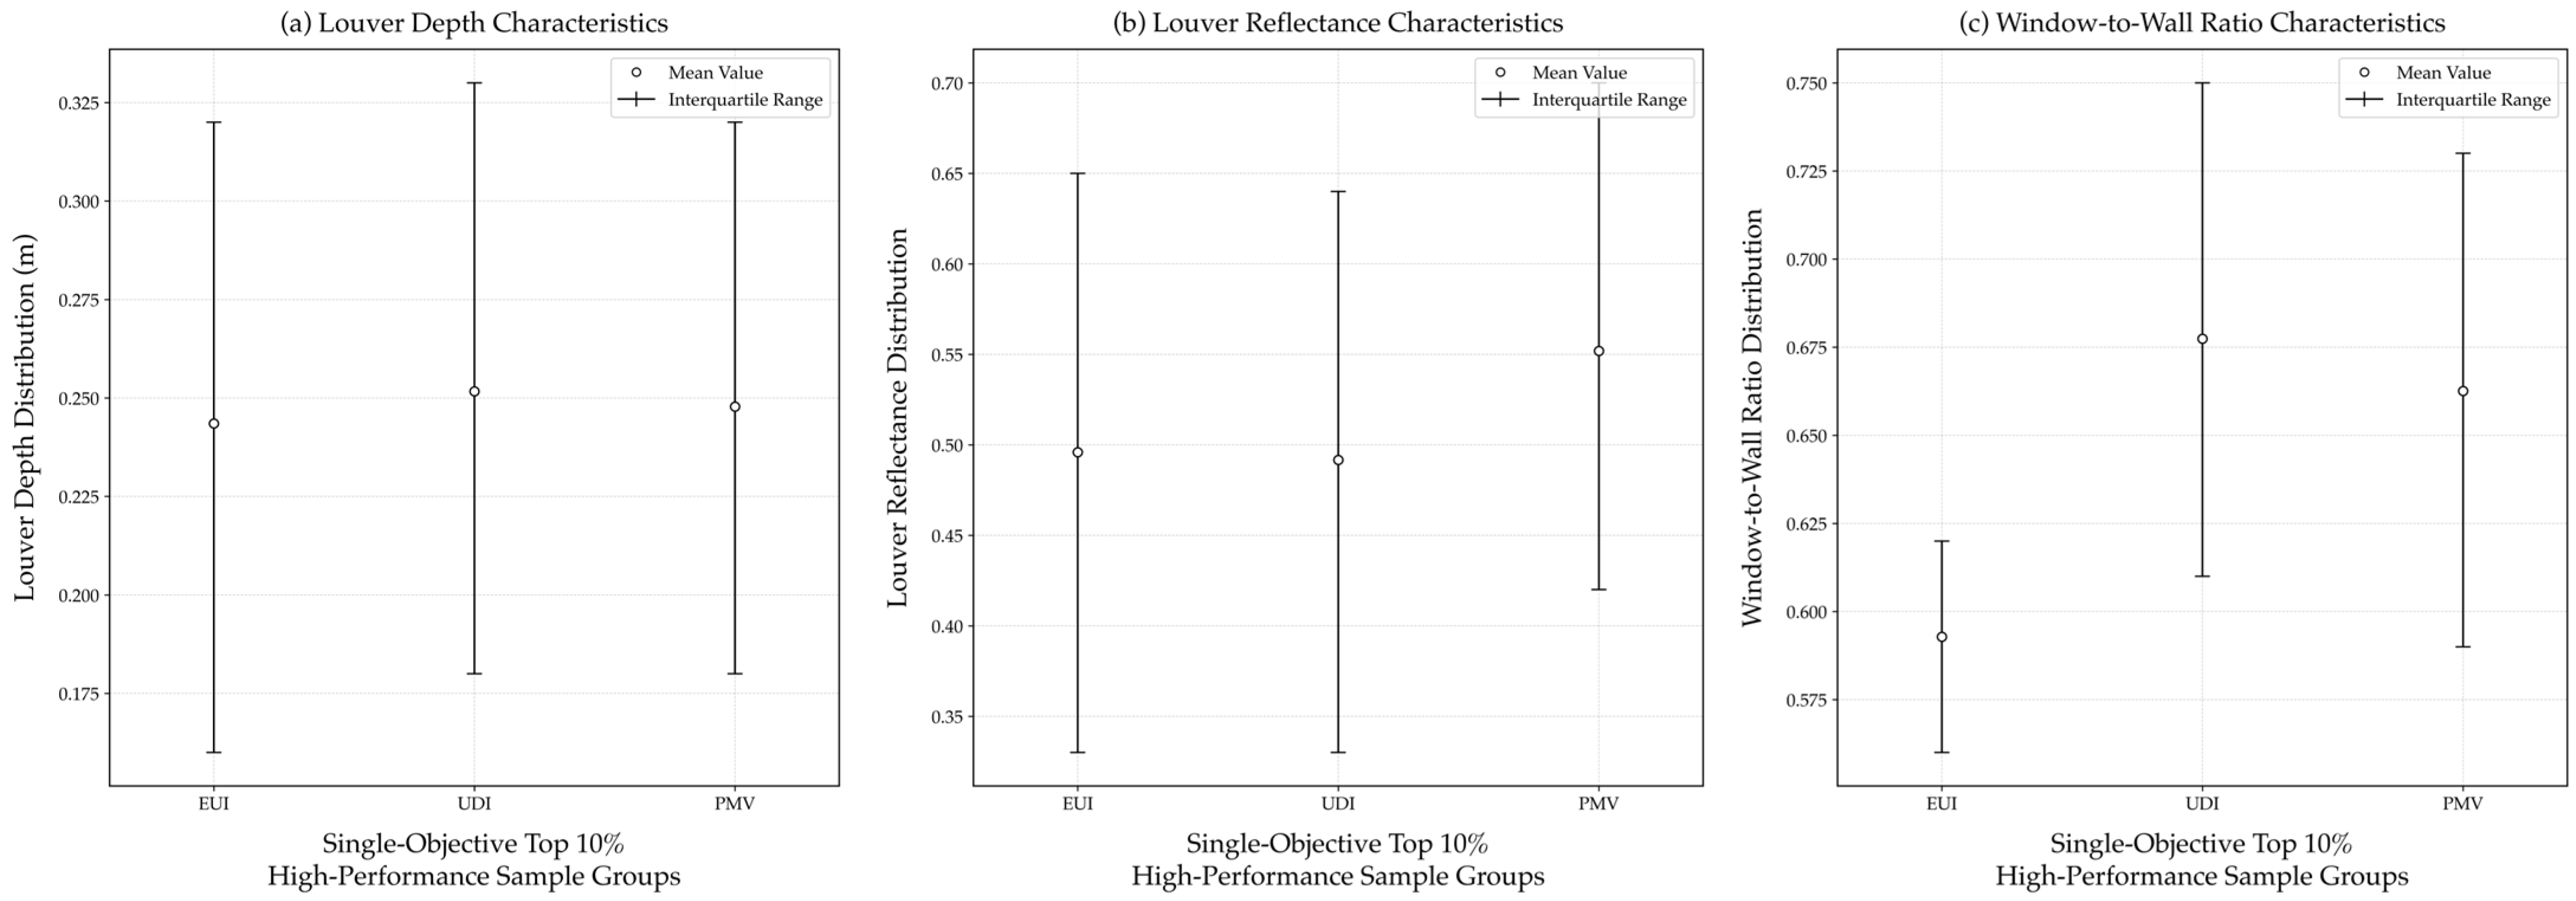
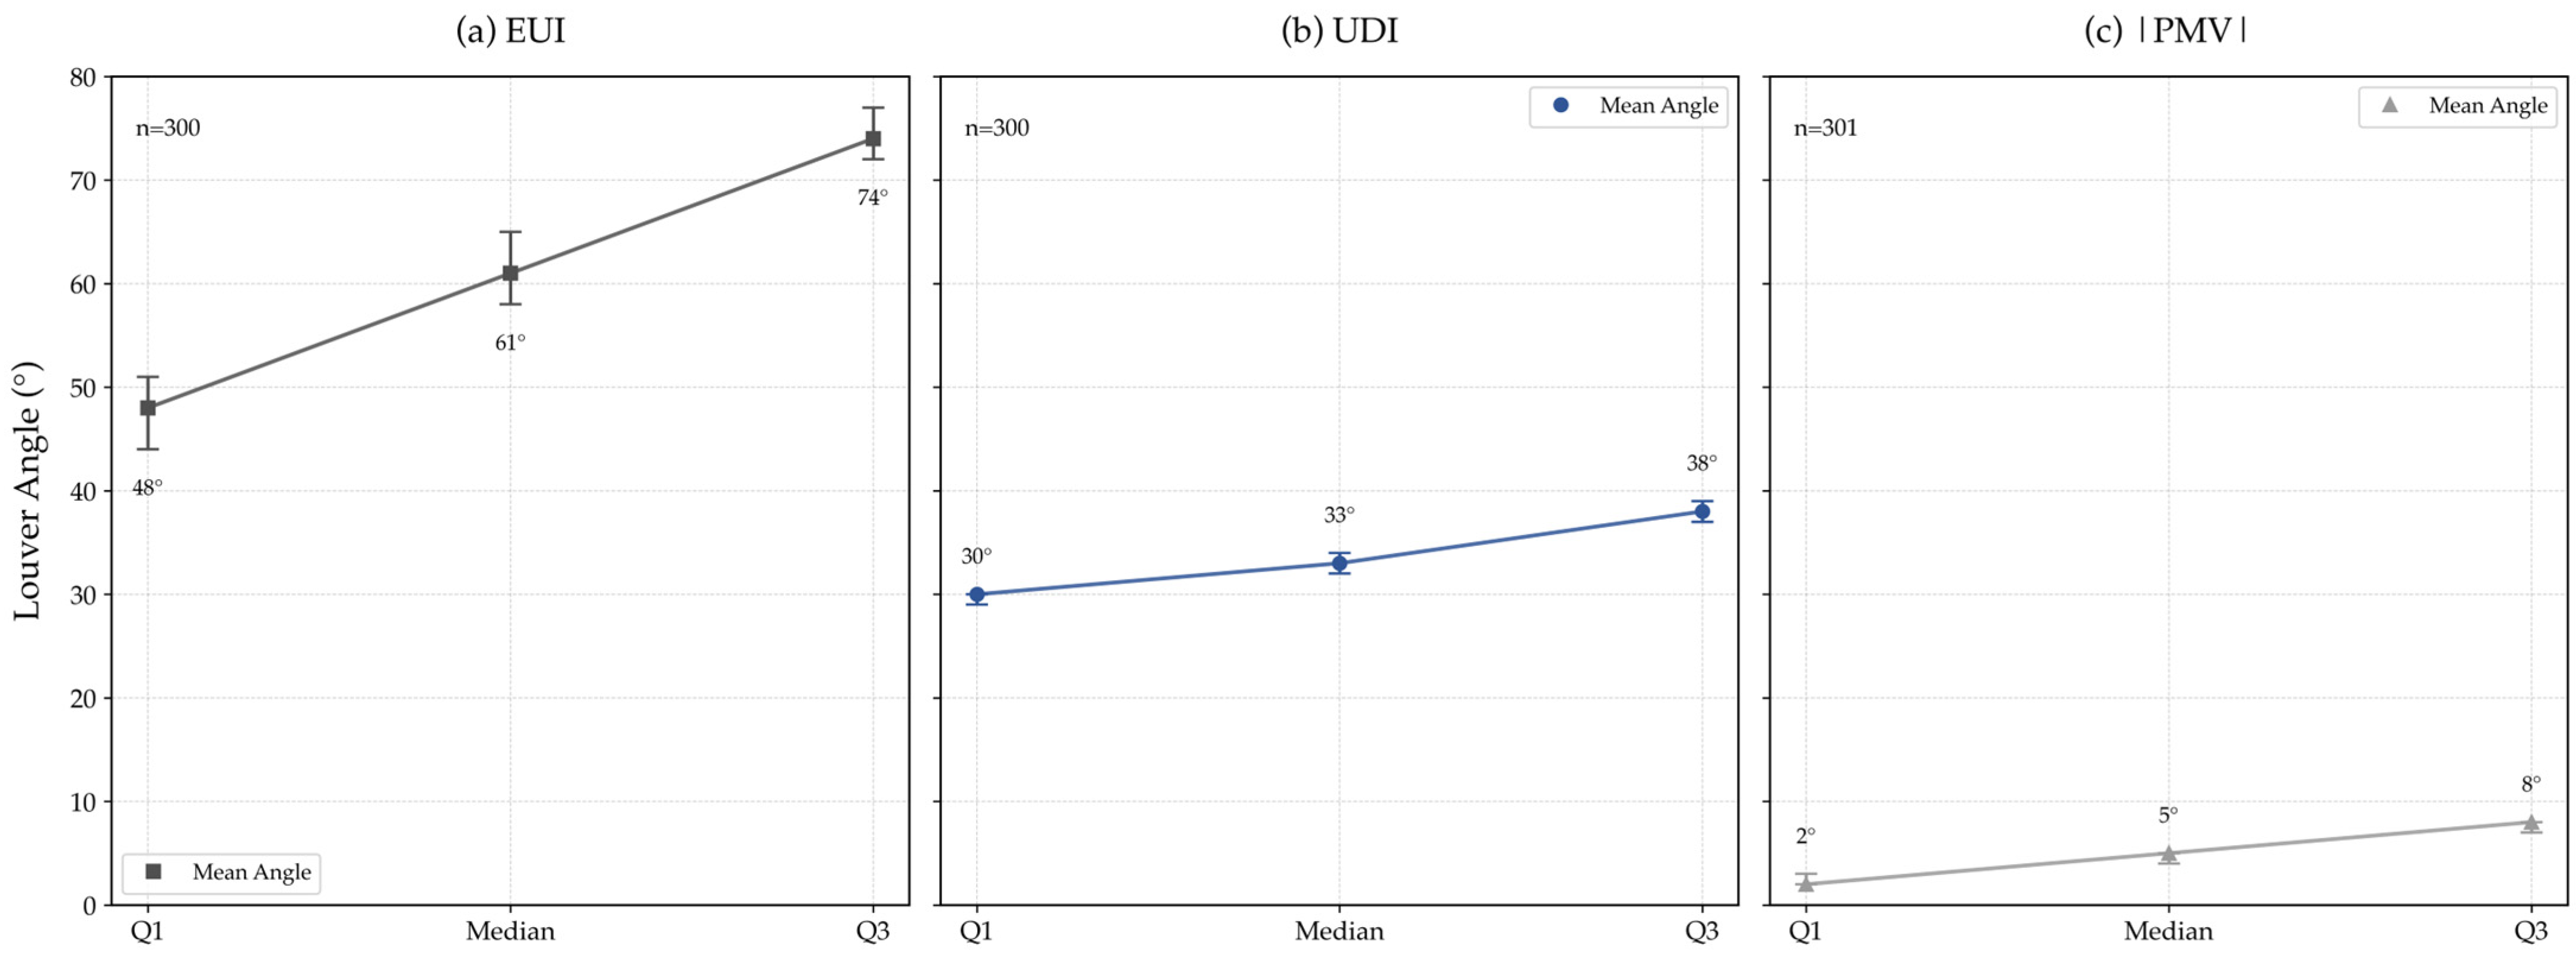
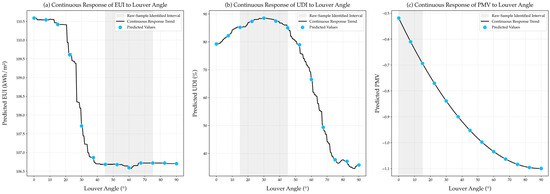
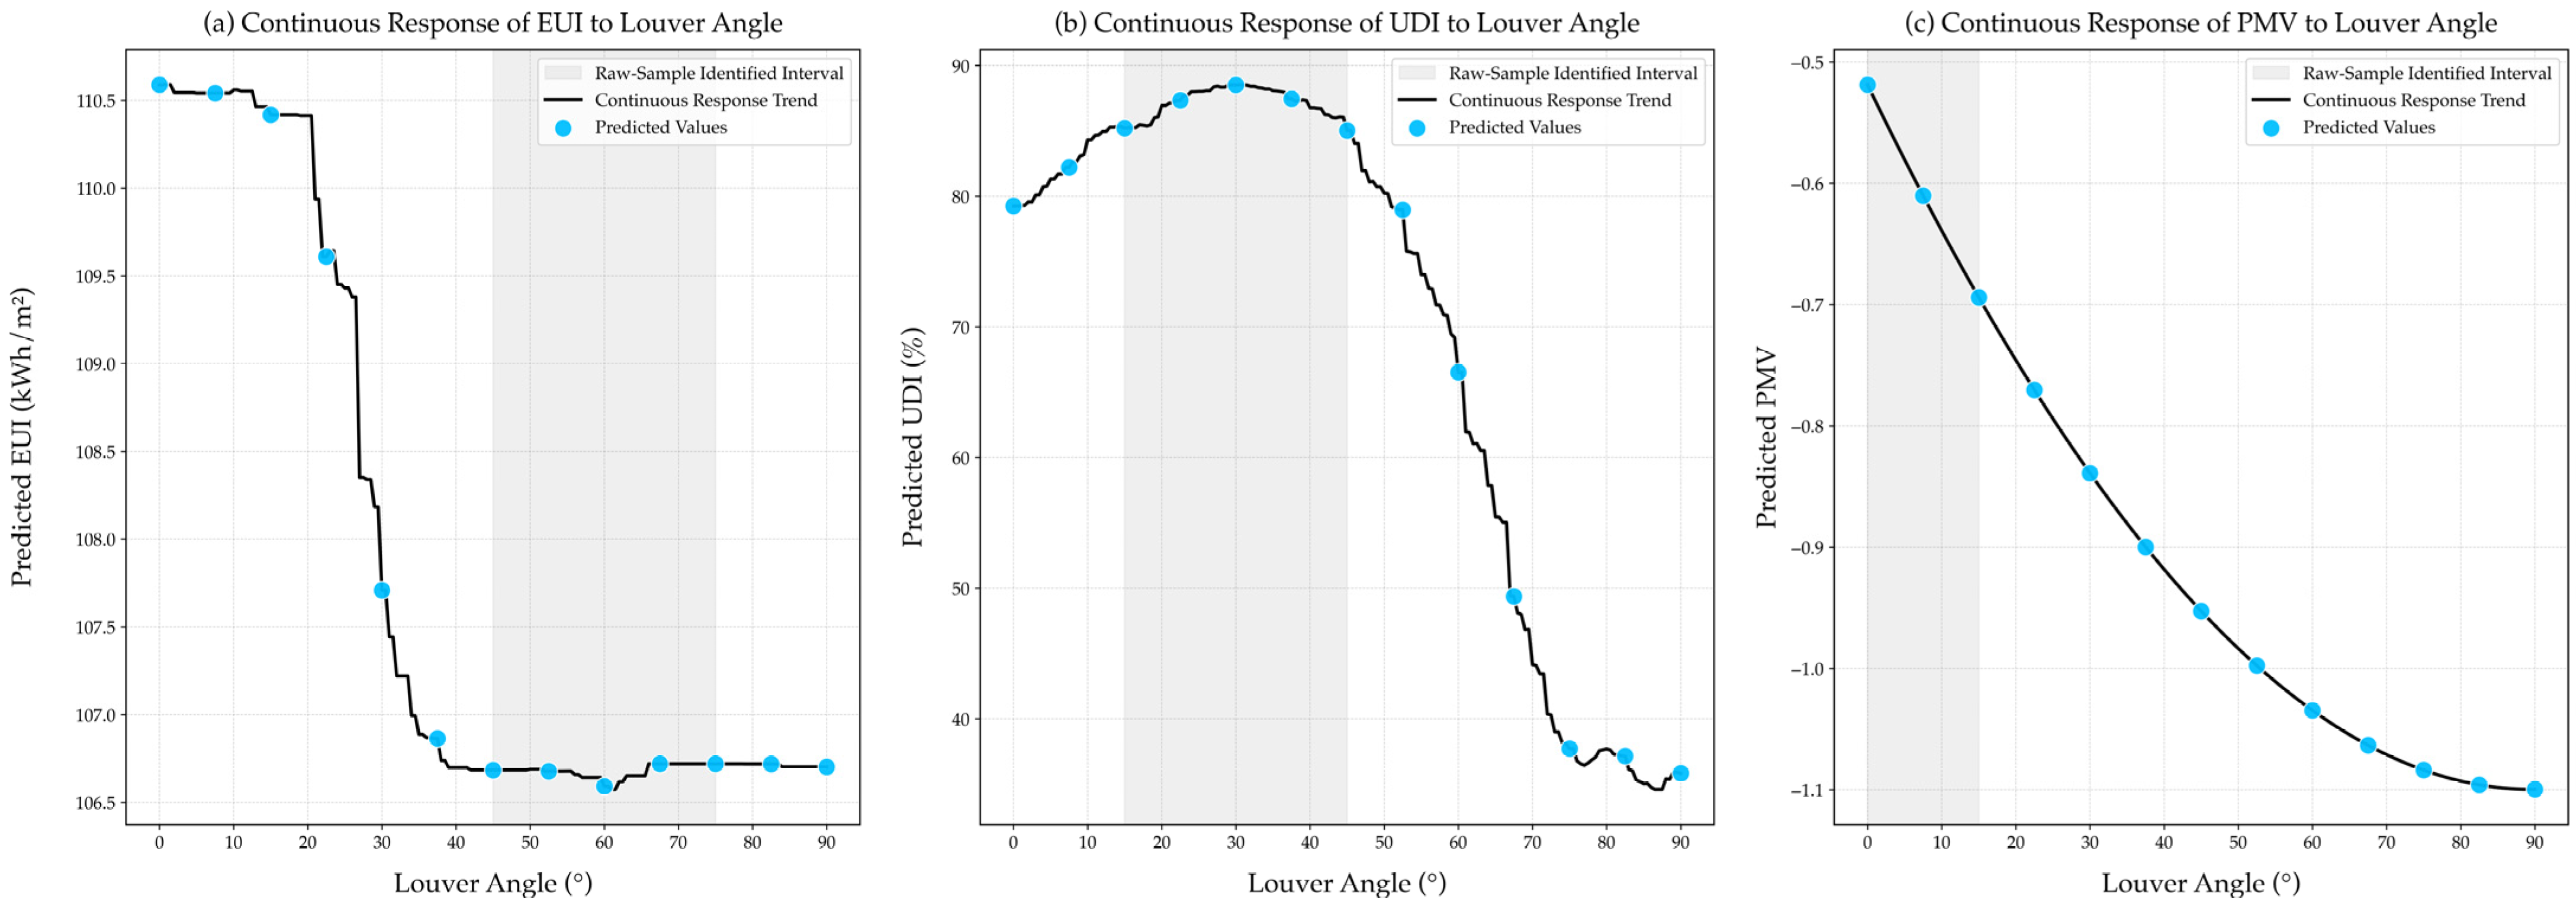
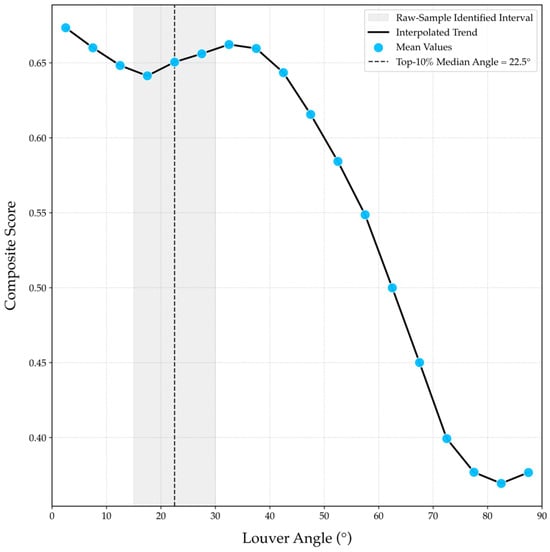
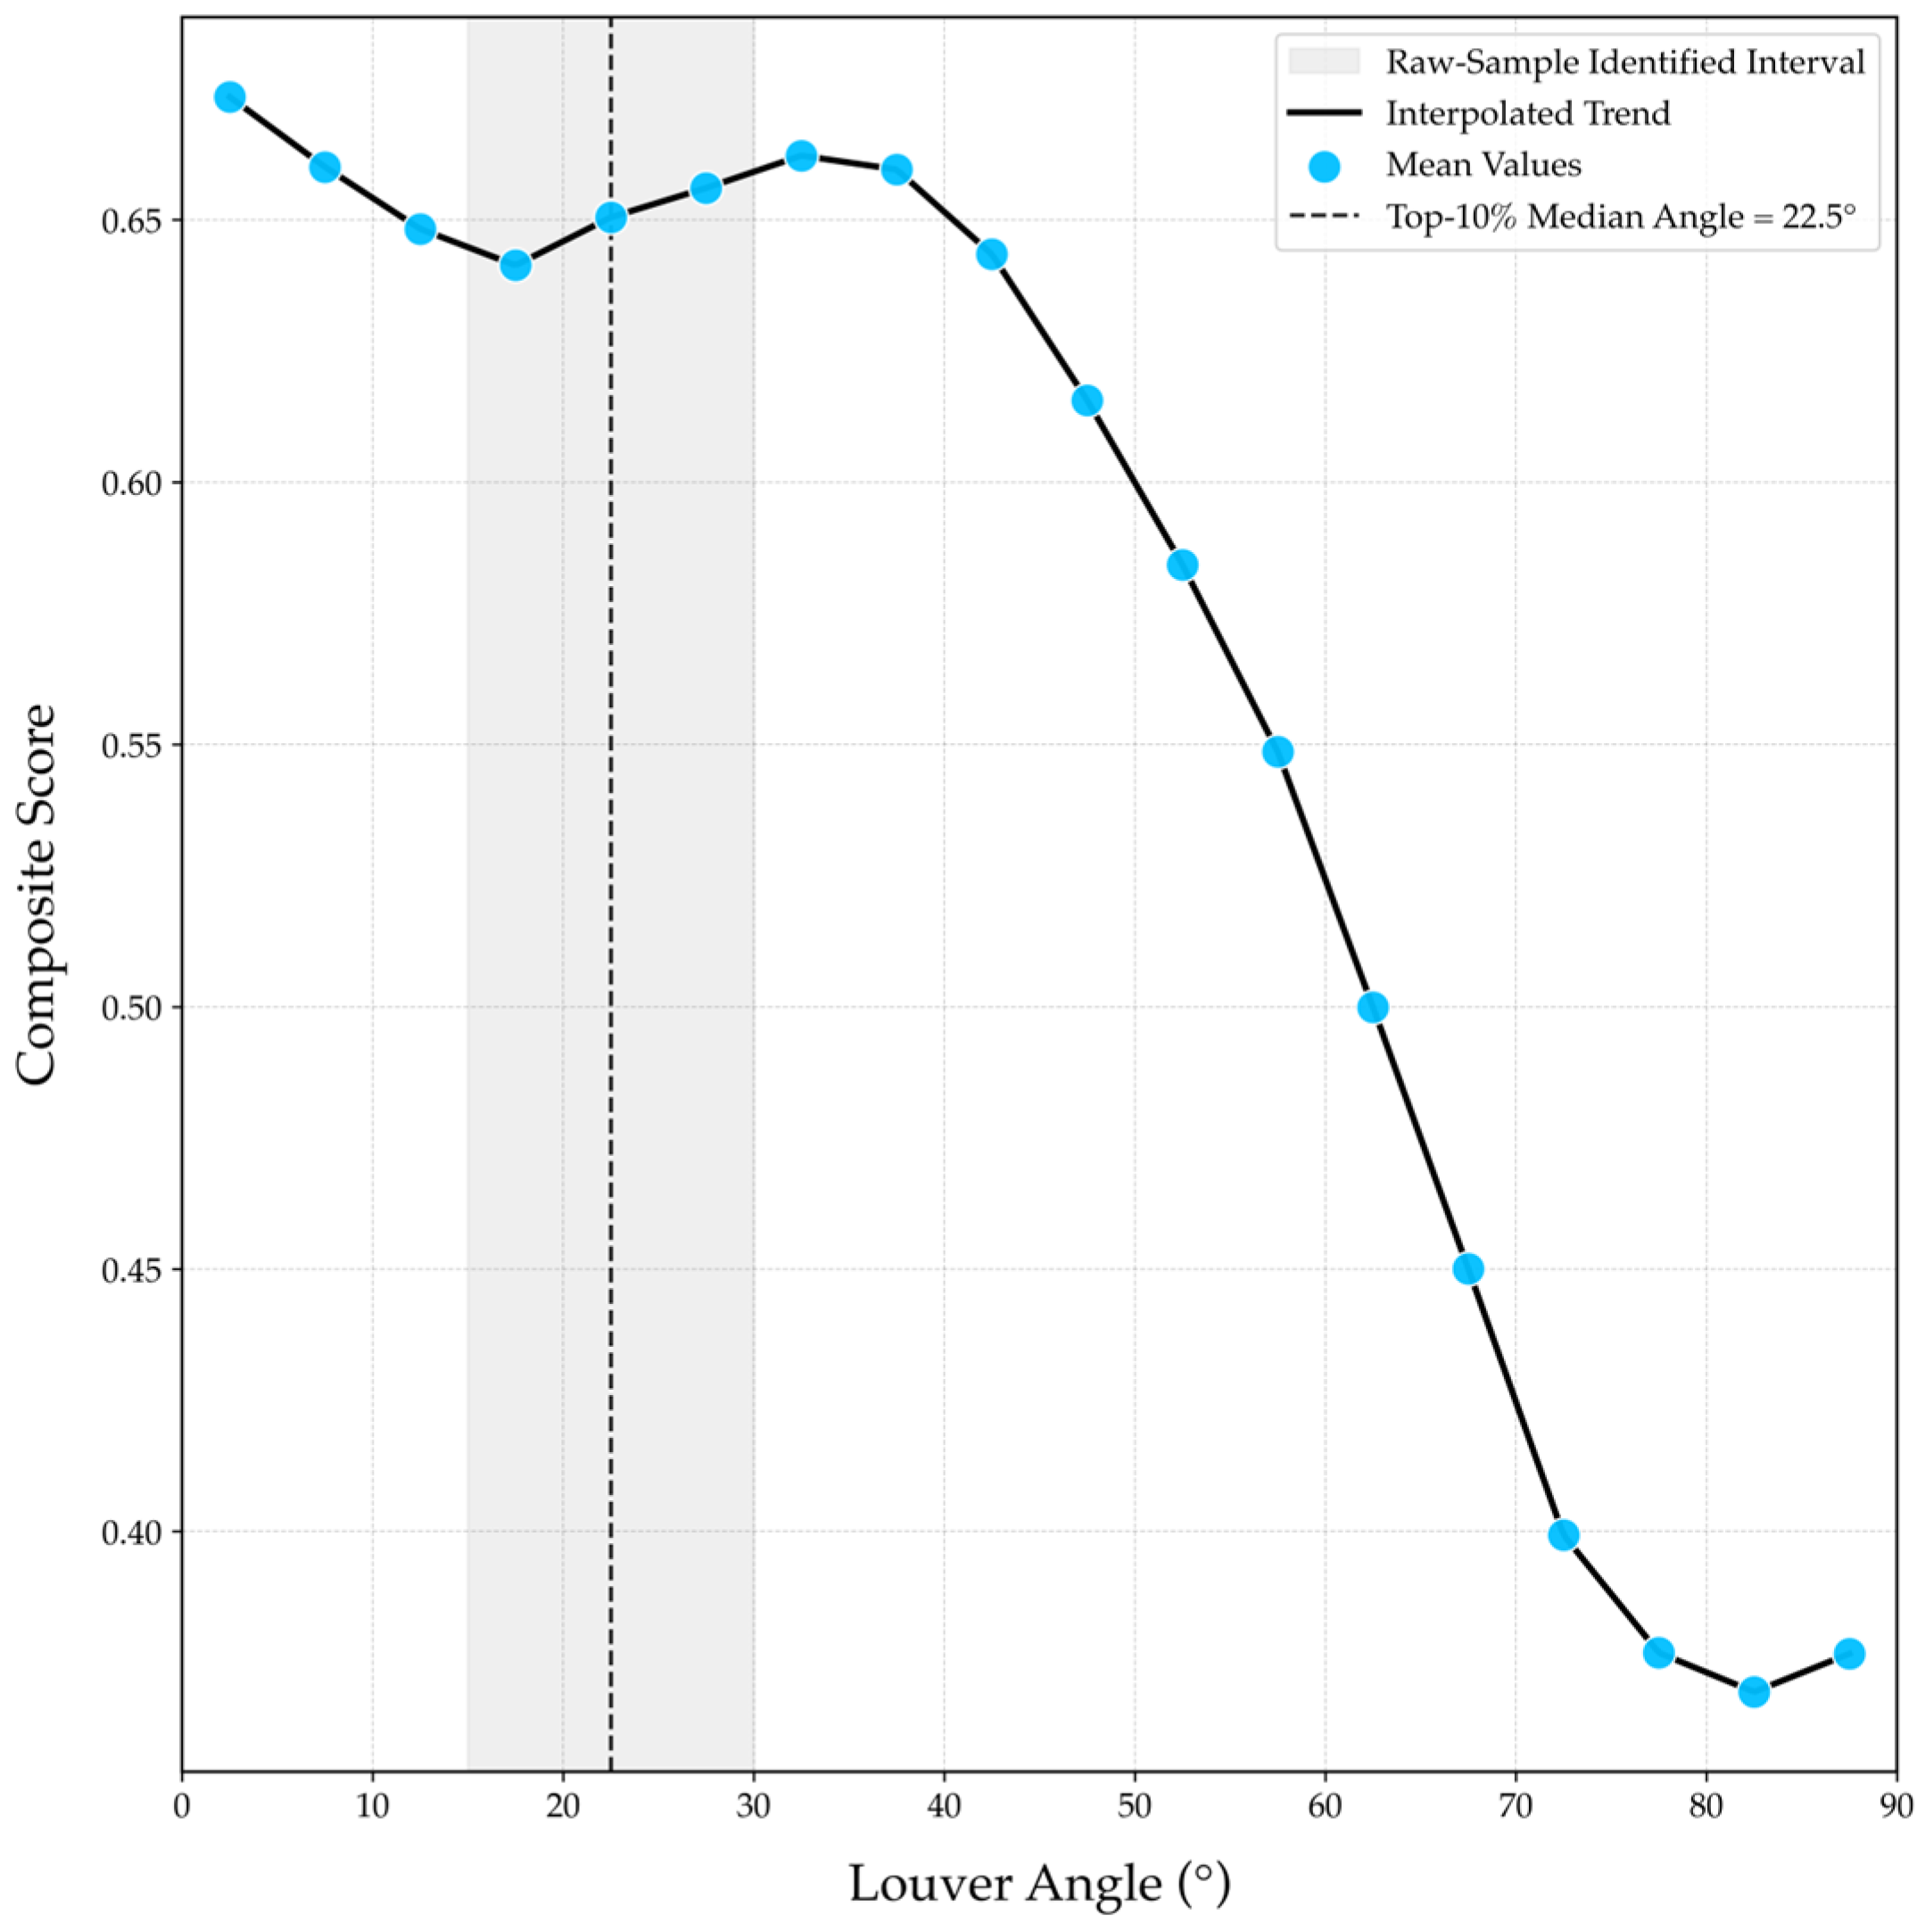
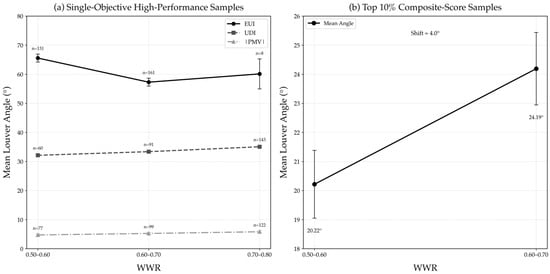
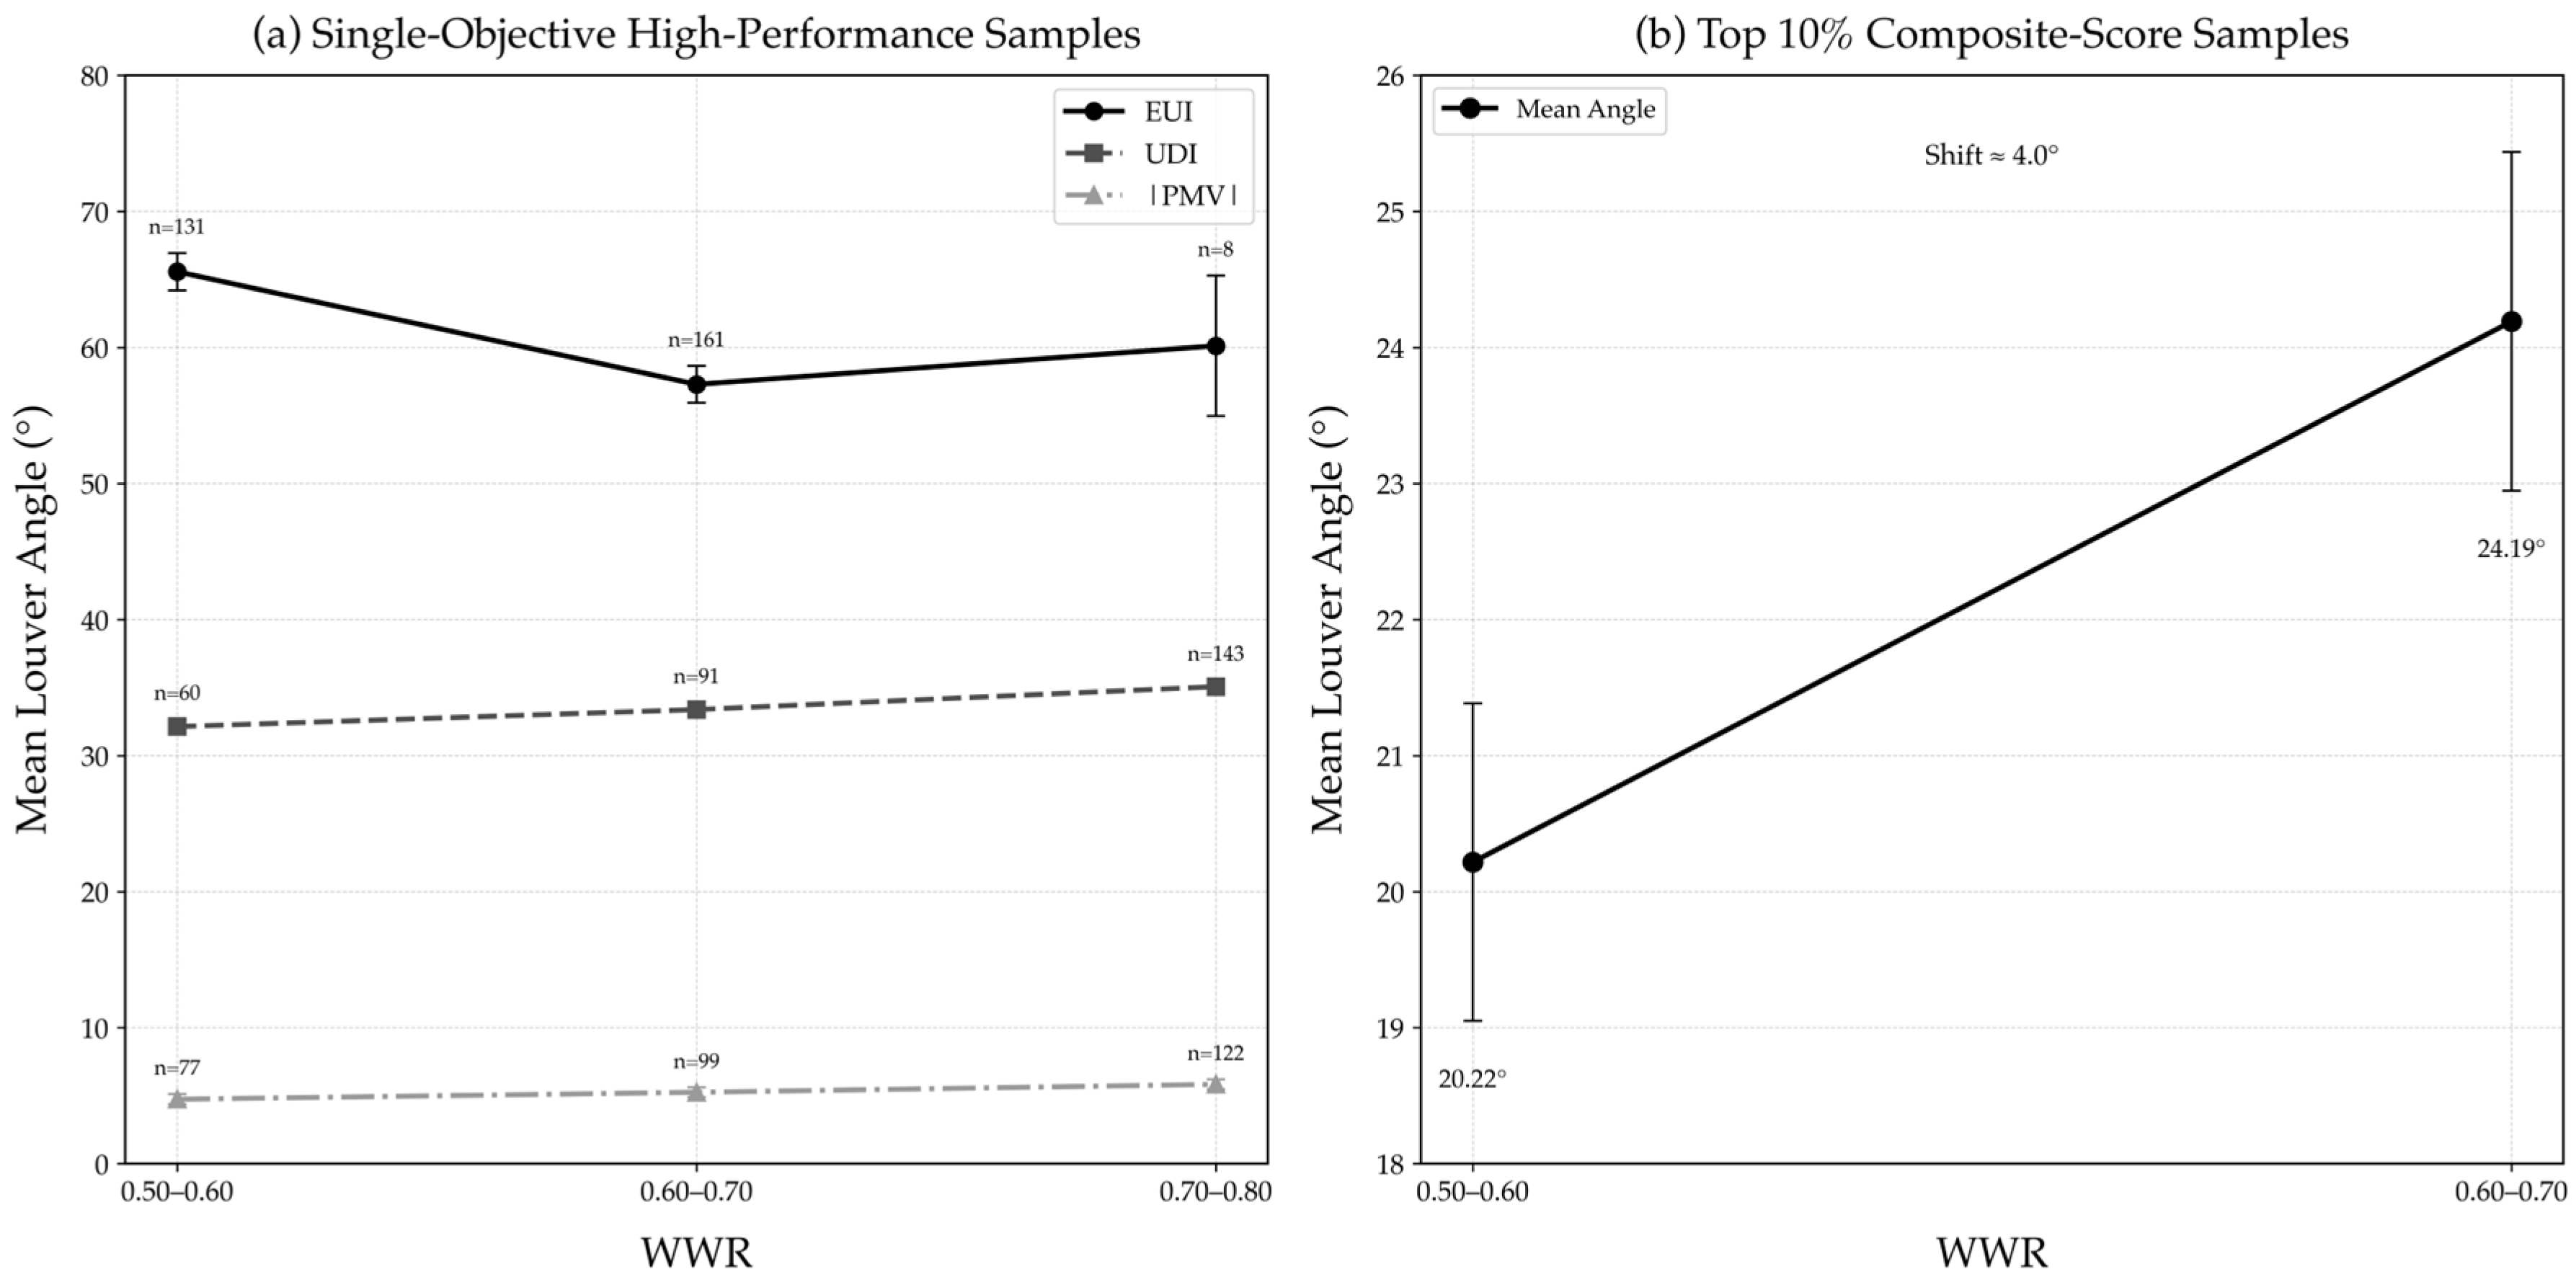
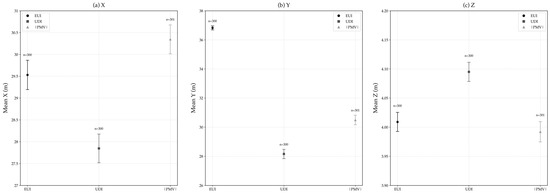
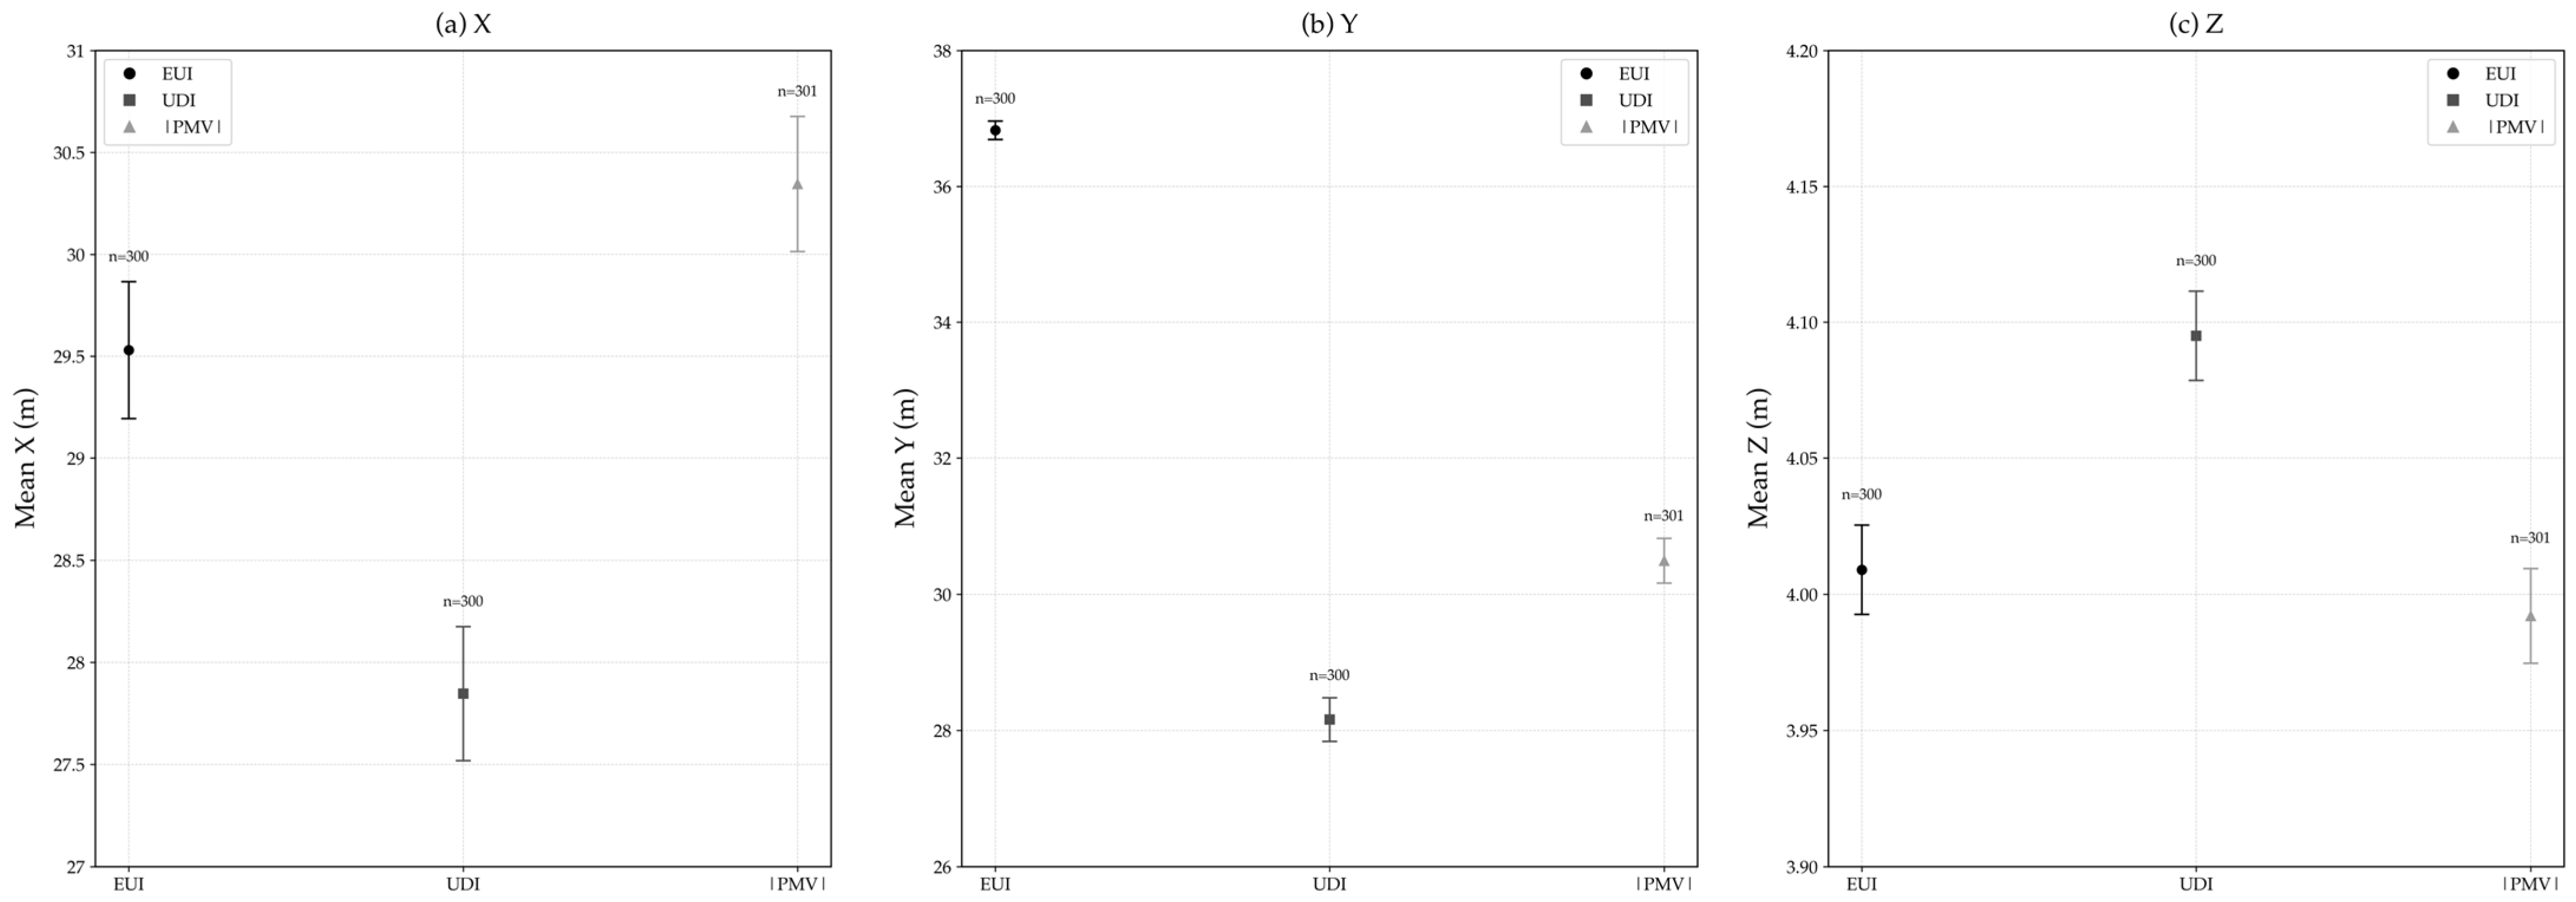

Disclaimer/Publisher’s Note: The statements, opinions and data contained in all publications are solely those of the individual author(s) and contributor(s) and not of MDPI and/or the editor(s). MDPI and/or the editor(s) disclaim responsibility for any injury to people or property resulting from any ideas, methods, instructions or products referred to in the content. |
© 2026 by the authors. Licensee MDPI, Basel, Switzerland. This article is an open access article distributed under the terms and conditions of the Creative Commons Attribution (CC BY) license.