


Abstract
Catfish is a major commercial and subsistence species in Malawi, making its sustainability vital for local livelihoods and food security. However, limited evidence exists on the long-term biological and economic depletion of commercial catfish stocks. This study assessed the depletion status of the catfish fishery in the southeast arm of Lake Malawi using secondary catch and effort data from 2000 to 2023 obtained from the Malawi Department of Fisheries, and price and cost data obtained from the field study. Applying the bioeconomic Gordon–Schaefer model, the study estimated biological depletion and economic depreciation to quantify resource losses and evaluate the fishery’s sustainability. Constant and periodic harvesting strategies were examined to determine sustainable harvest thresholds. Results show that depletion occurred in 15 of the 24 years analysed, with a cumulative biomass loss of 446.1 tonnes and an estimated total depreciation of about MK 1.5 billion. These findings indicate exploitation beyond sustainable levels both biologically and economically, threatening stock recovery, long-term productivity, and economic viability. The study highlights the value of bioeconomic modelling in fishery assessment and underscores the urgent need for improved management, including strengthened monitoring, effort regulation, and enhanced enforcement, to ensure sustainable utilisation of catfish resources and protect dependent livelihoods.
1. Introduction
Sustainable fisheries are critical for food security, livelihoods, and ecosystem health worldwide [1]. Inland fisheries, in particular, provide protein, income, and employment to millions of people in developing countries [2]. However, many fish populations are declining due to overexploitation, poor management, and environmental change [1,2,3,4]. Maintaining sustainable fishery levels requires effective monitoring and management of fishery resources, including the assessment of stock depletion [3] and the implementation of sustainable harvesting strategies [2].
In Malawi, the fish sector is a vital component of the national economy, contributing to food security, income, and employment [5]. The sector supplies about 40% of the country’s protein needs [6] and provides both direct employment through fishing and indirect employment through activities such as boat building, fish processing, net making, and engine repairs [5]. Fish exports generate over USD 24 million annually, and the sector contributes approximately 4% of Malawi’s GDP [7]. Lake Malawi, the largest lake in the country and the ninth largest globally, harbours extraordinary biodiversity, with over 1000 estimated fish species, most of which are endemic [8,9]. The lake accounts for more fish landings than any other in Malawi [10], making it a critical region for fishery management. Geographically, Lake Malawi is divided into three main zones: the southeast arm, the southwest arm, and the upper Shire system, which includes Lake Malombe and the upper Shire River [11]. Among these, the southeast arm is the most productive fishery region, extending across the southern portion of the lake and linking to Lake Malombe [4,11].
The Malawian fishery sector comprises capture fisheries and aquaculture [12]. Capture fisheries, which are divided into artisanal and commercial subsectors, contribute over 90% of national fish landings [4]. While artisanal fisheries dominate the sector, commercial fishing activities have increased in recent years [4,7]. As a result of this growth, there are increasing concerns regarding the sustainability of fish populations in Malawi [11], reflecting global trends [3]. Overfishing, exacerbated by open-access regimes and poor management strategies, has led to declining fish stocks, reduced catch rates, and potential ecosystem disruptions [1,2,3,4]. Indicators such as declining catch per unit effort (CPUE) and rising prices of commercially important fish species, resulting from market scarcity, support the notion of overfishing in Malawi [4]. Increased fishing pressure has led to the overexploitation of most fish species [13], including Engraulicypris sardella (usipa) [11] and Oreochromis species (chambo) [4]. Effective management strategies are therefore essential to rebuild and maintain fish stocks.
Among the commercially important fish species in Malawi, catfish (Clarias gariepinus) plays a key role in both domestic consumption and export markets [13]. Demand for catfish is particularly high among high-income households in Malawi and neighbouring countries [14,15]. Catfish is also important to local communities, providing food security, nutrition, and income through fishing, processing, and selling [7]. Despite its economic significance, no empirical assessment of the depletion status of the commercial catfish fishery in the southeast arm of Lake Malawi exists, creating a critical knowledge gap for fishery management and policy formulation. Without such information, the fishery remains at risk of overexploitation, which could ultimately lead to the collapse of the catfish stock.
The Gordon–Schaefer (GS) model, a bioeconomic surplus production model based on the logistic equation, integrates biological and economic parameters to assess fish population stocks, estimate sustainable catch levels, and calculate the depletion and economic depreciation of fishery resources [2,7,11,16,17,18]. Advantages of the GS model include its simplicity, cost-effectiveness, and reliance on readily available catch and effort data, making it suitable for data-limited contexts such as Malawi [7]. Previous applications of the GS model in Malawi focused on species such as Oreochromis species (chambo) and Engraulicypris sardella (usipa) [4,11,19,20], but no study has assessed catfish fisheries. Furthermore, prior studies did not quantify biological depletion or economic depreciation of fish resources, nor did they evaluate sustainable harvesting strategies using a bioeconomic framework. As a result, information on the depletion and depreciation of catfish resources in Malawi remains unknown.
Depletion refers to the reduction in fish population abundance or biomass to levels that hinder natural replenishment [16]. In this study, depreciation is defined as a consequence of depletion, whereby the loss of fish biomass (natural capital) is expressed in monetary terms [3,16]. High fishing rates can reduce populations below sustainable capacity, resulting in declining stock biomass, reduced catches, and ecosystem disruption [3,16]. Understanding depletion and depreciation is essential for preventing overexploitation and biodiversity loss, as highlighted by studies in other regions [1,3].
This study aims to estimate the depletion of the commercial catfish fishery in the southeast arm of Lake Malawi using catch and effort data from 2000 to 2023. Employing the GS model, the study calculates annual depletion by comparing actual catches with sustainable yields and derives economic depreciation to quantify monetary losses. Additionally, the study examines constant and periodic harvesting strategies to identify sustainable catch levels. By applying the GS bioeconomic model to catfish fisheries for the first time in Malawi, this study provides critical insights into the ecological and economic impacts of overfishing, management inefficiencies, and environmental change. The findings inform evidence-based management policies and support sustainable harvesting practices, thereby promoting both conservation and economic benefits.
2. Materials and Methods
2.1. Study Area
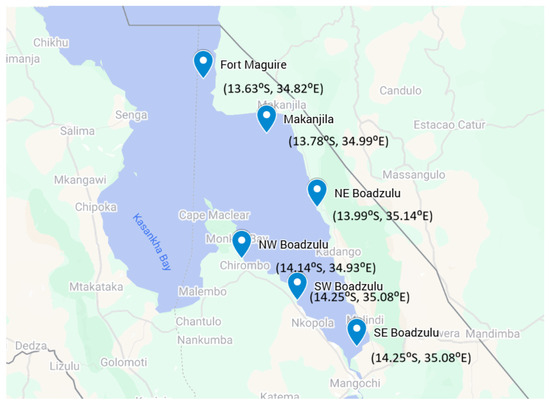
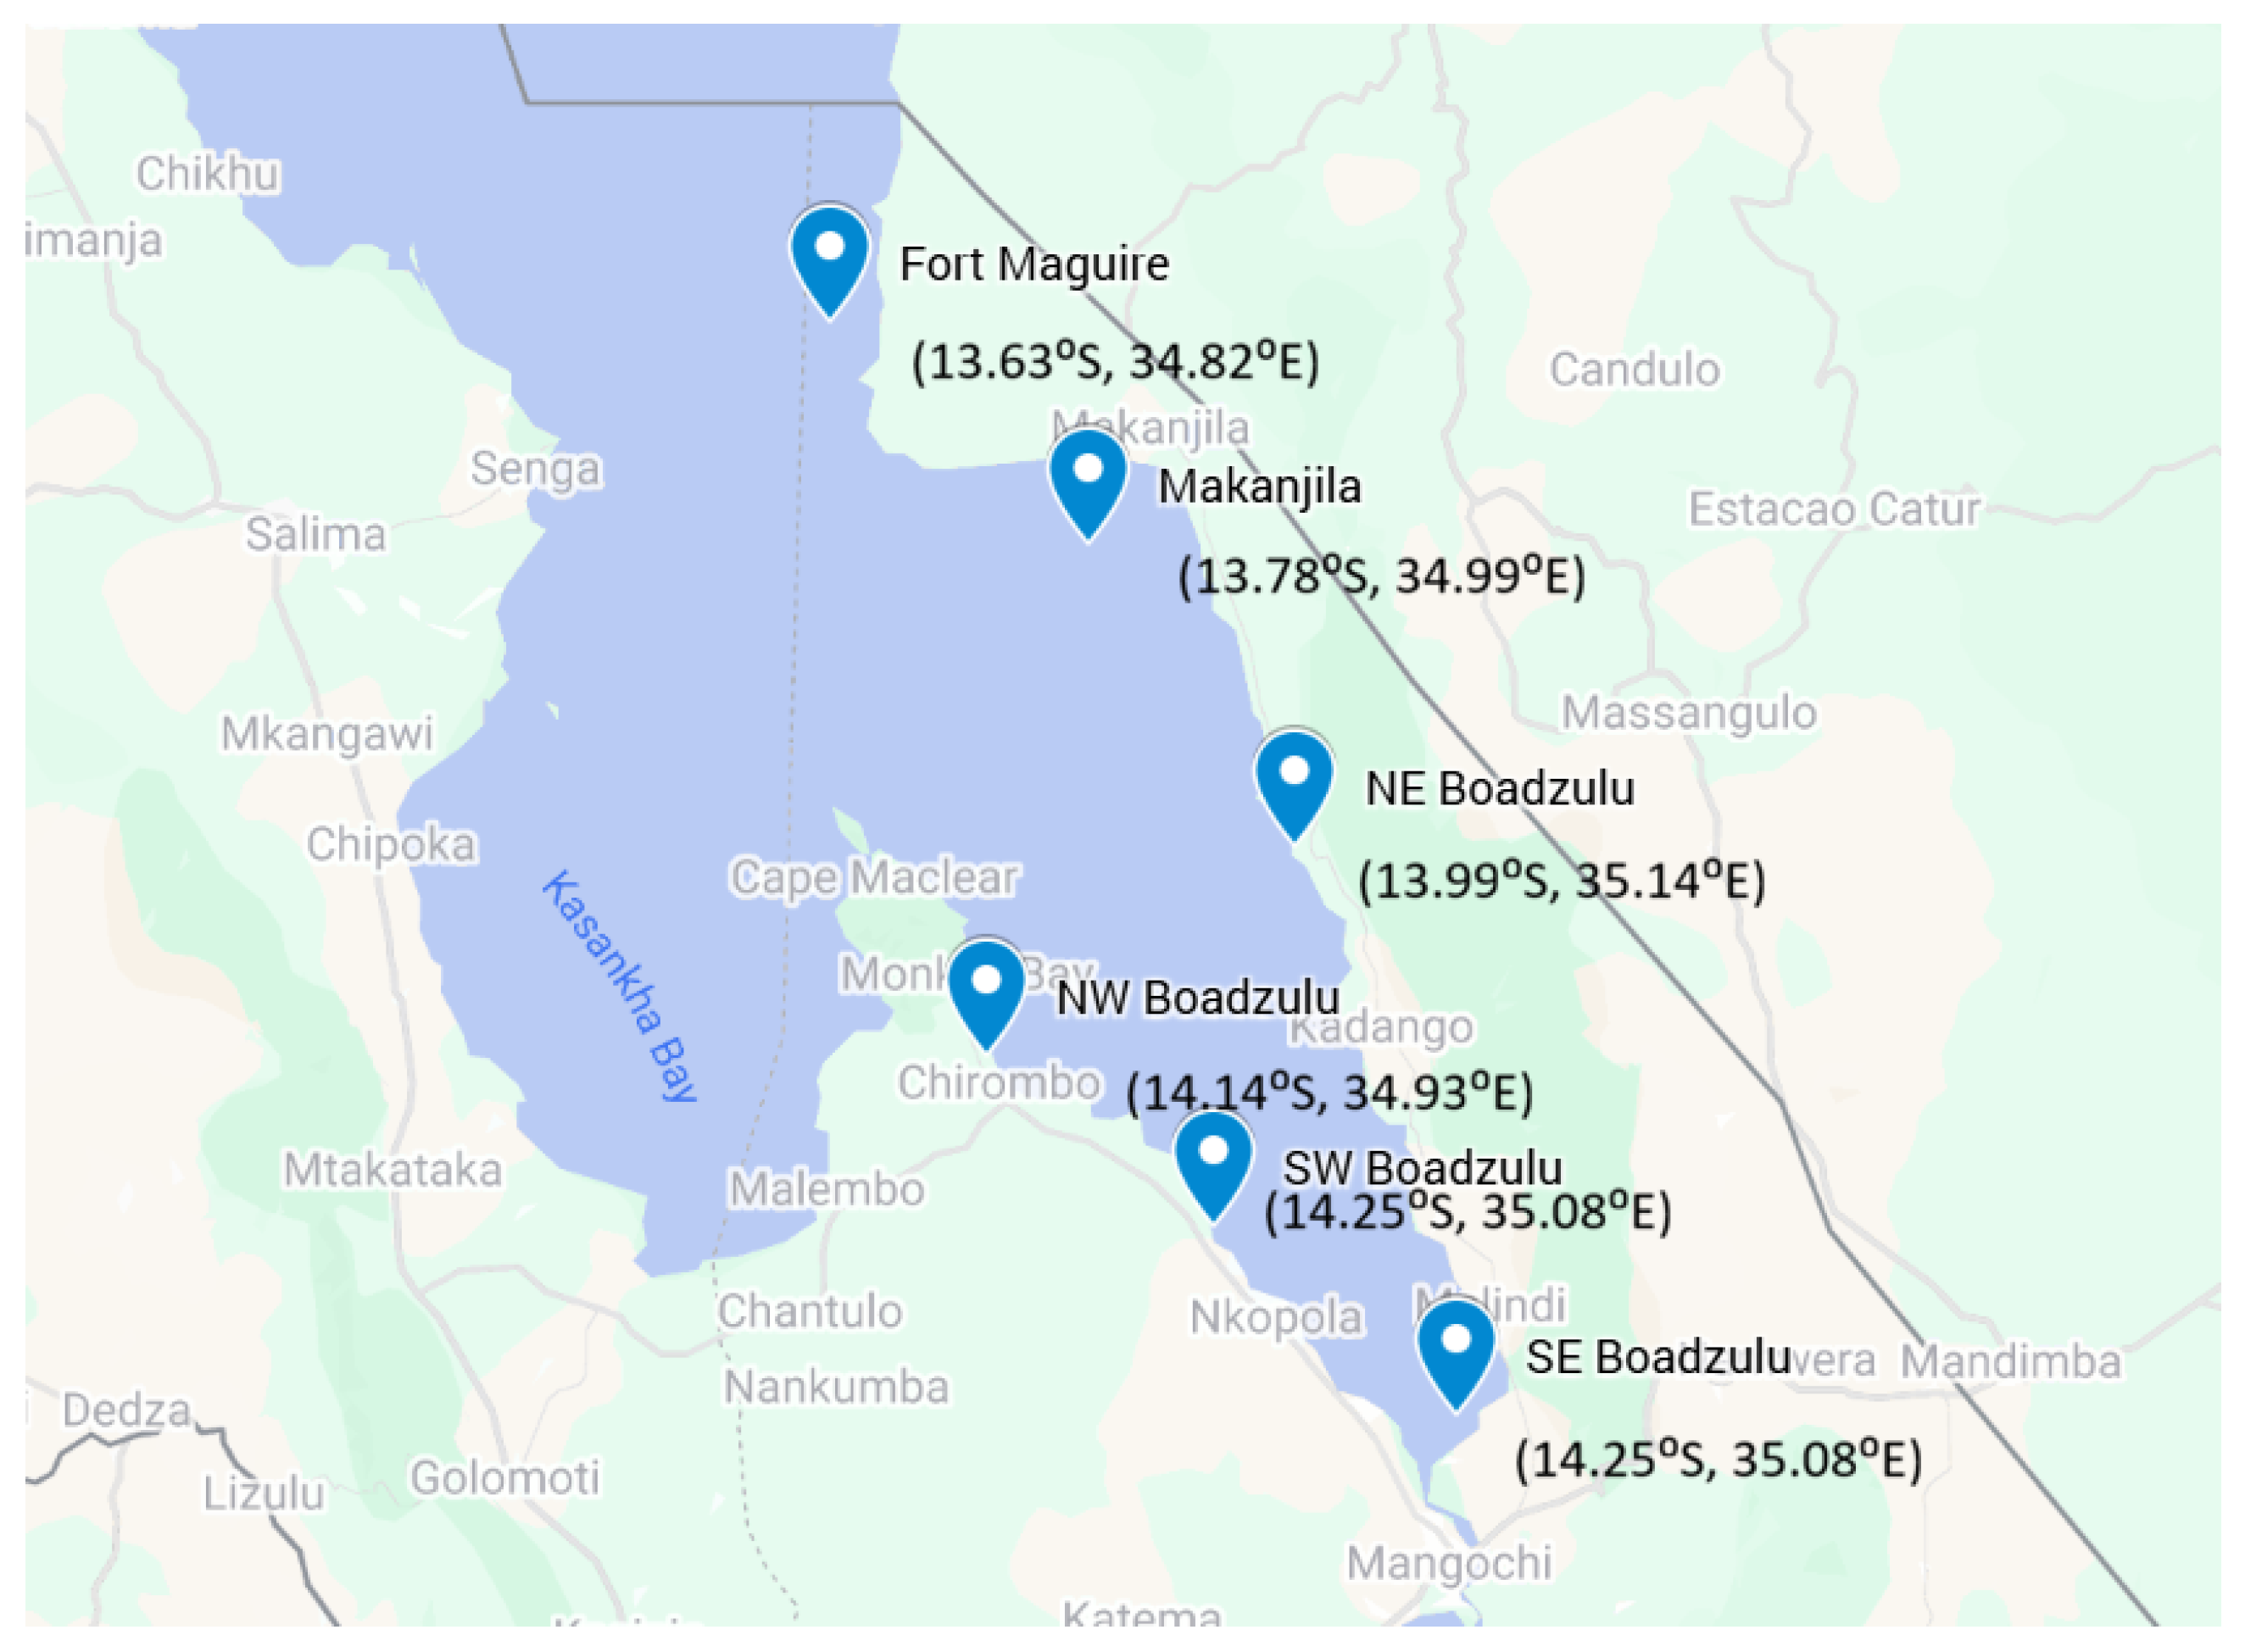
The data used in this study pertain to catfish from the southeast arm of Lake Malawi, which encompasses the southern portion of the lake and connects to Lake Malombe via the Upper Shire River. Among the three major regions of Lake Malawi, the southeast arm is the most productive. For monitoring and management purposes, this area is divided into six strata: Southeast Boadzulu, Southwest Boadzulu, Northeast Boadzulu, Northwest Boadzulu, Fort Maguire, and Makanjira [11]. Data were collected and analysed across all six strata. Figure 1 is the map of the southeast arm of Lake Malawi.
Figure 1.
Map of the southeast arm of Lake Malawi.
2.2. Data Sources
This study utilised both secondary and field data. The secondary data consisted of time-series records of catch (tonnes) and effort (trips) for the commercial catfish fishery in the southeast arm of Lake Malawi from 2000 to 2023. Effort values represent the total number of fishing trips by commercial fishers in a given year, while catch values correspond to the aggregated landings from all six strata of the southeast arm. These data were obtained from the Malawi Department of Fisheries, located in Mangochi District.
Price and cost data were collected through a field study conducted in the southeast arm of Lake Malawi between June and December 2023. A total of 142 commercial fishers participated by completing a structured questionnaire. Written informed consent was obtained from all participants. Participation was voluntary and followed an explanation of the study’s objectives, including participants’ right to withdraw at any time. To ensure confidentiality, no personal identifiers were recorded during data collection.
The snowball sampling technique was used to recruit participants. Although non-random sampling may introduce bias by overrepresenting certain categories of fishers, this approach allowed the researchers to identify and engage experienced commercial fishers who were actively operating in the study area [11].
The price value used in this study represents the average price, in Malawi Kwacha (MK) per tonne, of catfish (Clarias gariepinus) in 2023. The total cost was determined by summing up fixed, variable, and opportunity costs associated with the fishing activity. Fixed costs refer to expenses that remain constant regardless of the quantity of fish caught; they are not influenced by day-to-day fishing operations. For commercial fishers in the southeast arm of Lake Malawi, these include the cost of purchasing trawlers, fishing licenses, and depreciation. Variable costs, on the other hand, fluctuate with fishing effort and include expenses for fuel, food, and crew labour during fishing trips. Opportunity costs represent the potential benefits or income fishers forego when they engage in fishing instead of pursuing alternative economic activities. All these cost components are essential to consider when estimating the total cost of fishing [21,22]. All cost values are expressed in Malawi Kwacha (MK).
2.3. The Gordon–Schaefer Model
The Gordon–Schaefer (GS) model was selected for this study to analyse the depletion status of the catfish fishery in the southeast arm of Lake Malawi. The GS model is represented by the differential equation
where represents the stock biomass or the size of the fish population, denotes the initial population size, r is the intrinsic growth rate of the fish biomass, q is the catchability coefficient, E is the fishing effort, and K is the carrying capacity, which is the maximum number of fish that the environment can sustain without adversely affecting the population [18,23,24]. The harvest or yield is expressed as
The GS model assumes logistic population growth and a closed population, thereby ignoring species interactions such as competition and predation [25]. It further assumes that both biological parameters, namely the intrinsic growth rate, carrying capacity, and catchability coefficient, and economic parameters, including price and cost, remain constant over time [21]. Additional assumptions include that catch per unit of effort (CPUE) is proportional to biomass, there is no immigration or emigration, gear efficiency is constant, environmental variability does not affect the fish population, and fishing and natural mortality occur simultaneously [7,22].
In this study, catch and effort data were available for a 24-year period, whereas historical price and cost data were not available. Economic data were therefore obtained from a field survey conducted in 2023. The use of single-year economic data is consistent with the GS model’s assumption that prices and costs remain constant over time. Accordingly, the 2023 price and cost values were assumed to be representative of the entire study period and were applied uniformly across the analysis.
Parameter Estimation
Biological parameters were estimated using the Walters–Hilborn method, which involves regressing catch per unit effort (CPUE) [7]. Following [26], the dependent variable was , defined as the ratio of catch per unit effort in the subsequent year to that in the current year , minus one. The independent variables were catch per unit effort in the current year and total fishing effort in the current year . The multiple linear equation takes the form
To obtain parameter estimates, Equation (3) was compared with the general multiple linear equation
and the biological parameters were derived as follows:
The multiple linear regression analysis was performed using JASP version 0.95.4. The Walters–Hilborn method was preferred due to its illustrative potential [20].
2.4. Annual Sustainable Production, Depletion and Depreciation
Annual sustainable production for a fishery resource is the maximum quantity of fish that can be harvested from a stock each year without causing depletion of the population. In other words, it is the level of annual catch that allows the fish population to replenish itself naturally through growth and reproduction, ensuring that future generations can be harvested at the same rate. Mathematically, annual sustainable production corresponds to the maximum sustainable yield (MSY), which is the equilibrium point at which the natural growth of the fish population equals the annual fish catch.
For the GS model, the annual sustainable production function is given by the following equation [1,18]:
Annual sustainable production for each year was calculated by substituting that year’s fishing effort and the estimated biological parameters (r, q, and K) into Equation (6). The resulting sustainable production estimates were then compared with the corresponding actual production values to assess whether annual catch levels were within sustainable limits. In this context, actual production, also referred to as actual catch, denotes the total annual landings from all strata of the southeast arm of Lake Malawi.
Depletion refers to the reduction in fish population due to overfishing. The following equation is used to calculate depletion of the fishery resource [7]:
At equilibrium, resource rent, measured in Malawi Kwacha, is given by the following equation [23]:
where is the total revenue and is the total cost (). Resource rent for each year was calculated using the corresponding price, cost, fishing effort, and catch (harvest) data. The unit rent was then obtained by dividing resource rent by the actual catch:
In this context, depreciation of fish resources is defined as the decrease in the total economic value of fish that can be sustainably harvested as a direct consequence of depletion. Economically, depreciation is viewed as a decline in the natural capital stock of a fishery resource. Depreciation is calculated from the depletion of fish resources using the following equation [3,16]:
2.5. Constant and Periodic Harvesting GS Models
The Gordon–Schaefer model without fishing is given by the following equation [23]:
where x is the biomass level or fish population, r is intrinsic growth rate, and K is the carrying capacity. Equating the right hand side of Equation (11) to 0 gives two equilibrium points and . This means that if the population starts at 0, it remains at the same point. Similarly, if the population starts at K it will also remain at K.
2.5.1. Constant Harvesting GS Model
Constant harvesting removes a fixed number of fish each year [27]. The Gordon–Schaefer model with constant harvesting is given by
where H is a constant.
To determine equilibrium points we equate the right hand side of Equation (12) to 0:
Comparing this with the general quadratic equation , we have , , and . Solving for x yields
Thus, there are two equilibrium points associated with the system in Equation (12) when the rate of harvesting is less than the bifurcation point:
2.5.2. Periodic Harvesting GS Model
Periodic harvesting is a sequence of periodic closure and openings of different fishing grounds [27]. The Gordon–Schaefer model with periodic harvesting is given by the following equation [28,29]:
where
The term represents the contribution of the sine wave to the periodic function. In other words, it is the coefficient that dictates the total rate of periodic harvesting with the period of one year [27,30,31]. Note that the mean harvesting rate of the periodic harvesting function is H.
The presence of the time-dependent function in Equation (15) makes this a non-autonomous differential equation. Technically, such systems do not have fixed equilibrium points. However, by setting the right-hand side of Equation (15) to 0 and solving for x, we obtain
which are time-dependent quasi-equilibrium points representing biomass levels where growth temporarily balances harvesting. For harvesting rates below the bifurcation point, there are two quasi-equilibrium points associated with the model in Equation (15):
The bifurcation point is found by setting the expression under the radical to 0, giving
Note that when , the quasi-equilibrium and bifurcation points reduce to the classical equilibrium points of the autonomous model in Equation (12).
The model in (15) is a non-autonomous differential equation, and its solutions are therefore periodic and follow the same general trend as those of the model in (12). Consequently, the stability analysis for periodic harvesting can also be assessed graphically. In the logistic growth model with constant harvesting, we previously concluded that represents a bifurcation point. For the function in (15), we can only infer that a bifurcation is likely to occur at a value close to [31]. To explore this, we plotted solution curves for , and to examine whether the population persists or converges relative to the equilibrium points at each harvesting level. Python version 3.14.0 was used to generate the solution curves.
3. Results
3.1. Estimated Biological and Economic Parameters
Table 1 presents the biological data used in this study. These consist of time-series catch and effort data for the catfish fishery in the southeast arm of Lake Malawi from 2000 to 2023.
Table 1.
Catch and effort of the commercial catfish (Clarias gariepinus) fishery.
Based on the data presented in Table 1, the biological parameters were estimated using the Walters–Hilborn method. Results of the regression analysis are presented in Table 2.
Table 2.
Regression Analysis Results.
The multiple linear regression analysis yielded the following equation:
The estimated values of the biological parameters r, q and K are presented in Table 3.
Table 3.
Estimated Parameters.
Table 3 also presents the economic price and cost data. The price represents the average price of catfish in the southeast arm of Lake Malawi in 2023 (in Malawi Kwacha, MK). The cost corresponds to the total of fixed, variable, and opportunity costs associated with the catfish fishery in the same region, also expressed in Malawi Kwacha.
3.2. Annual Sustainable Production
Using the biological parameters in Table 3, the annual sustainable production function in Equation (6) becomes
By substituting the fishing effort values for each year from Table 1 into Equation (18), the corresponding annual sustainable production values were calculated and are presented in Table 4.
Table 4.
Sustainable catch of the commercial catfish (Clarias gariepinus) fishery.
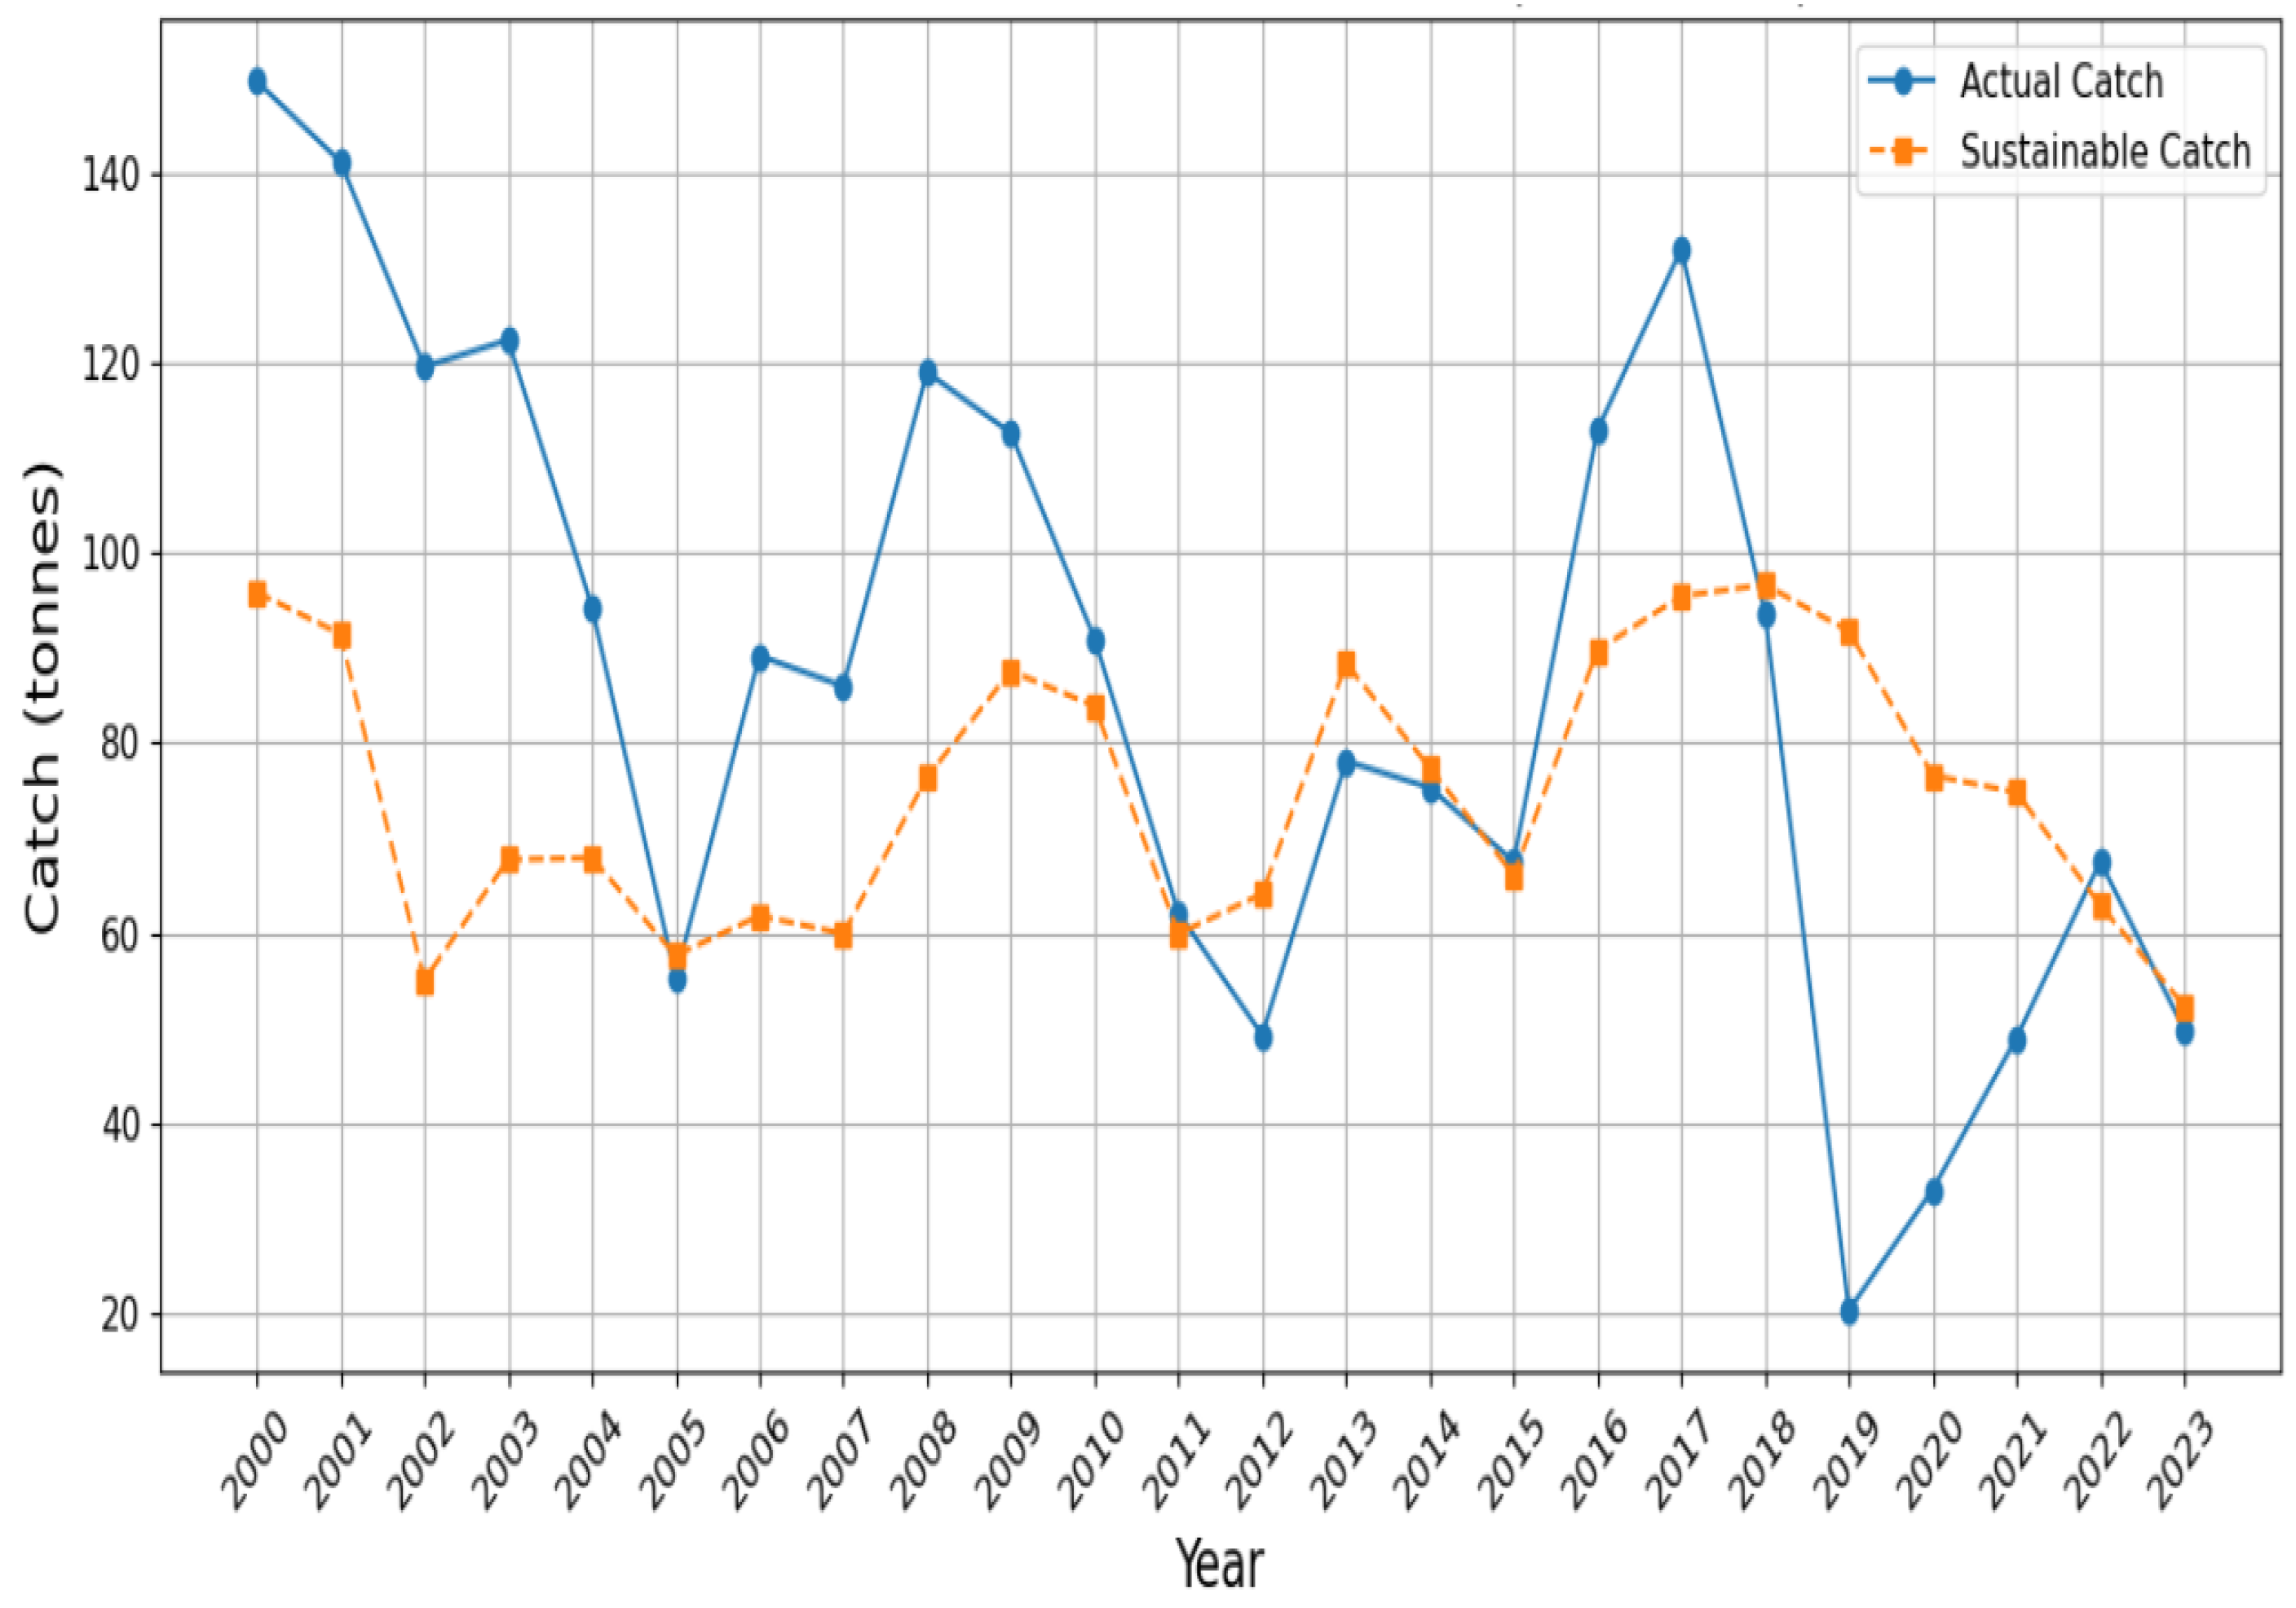
According to Table 4, the total actual catch of the commercial catfish fishery from 2000 to 2023 was 2071 tonnes, whereas the total sustainable catch over the same period was 1801.5 tonnes. The highest actual catch during the study period was 149.8 tonnes, recorded in 2000. Other years in which actual catch exceeded 100 tonnes include 2001, 2002, 2003, 2008, 2009, 2016, and 2017; in contrast, sustainable catch values remained below 100 tonnes in all years. The average actual and sustainable catches were 86.3 tonnes and 75.1 tonnes, respectively.
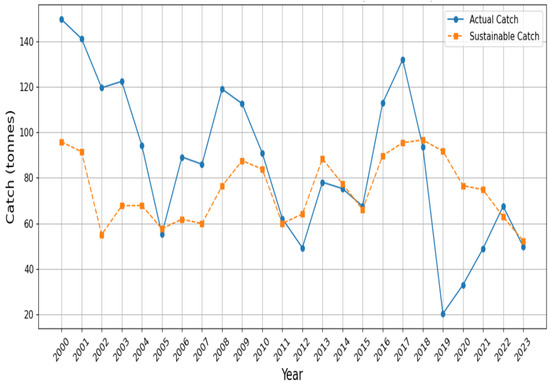
Figure 2 shows both the actual and sustainable catches for the commercial catfish fishery in the southeast arm of Lake Malawi from 2000 to 2023. The figure indicates that actual catch values were generally higher than sustainable catch values throughout most of the period.
Figure 2.
Actual and sustainable catch of the commercial catfish fishery from the southeast arm of Lake Malawi.
3.3. Depletion and Depreciation
Table 5 shows that depletion occurred in 15 out of 24 years studied. Depletion did not occur in 9 years out of 24 years (2005, 2012, 2013, 2014, 2018, 2019, 2020, 2021 and 2023). The highest depletion occurred in 2002 with a depletion value of 64.7 tonnes. Total depletion over the study period is 446.1 tonnes.
Table 5.
Depletion of the commercial catfish (Clarias gariepinus) fishery.
Table 6 presents the resource rent and unit rent for the commercial catfish fishery in the southeast arm of Lake Malawi from 2000 to 2023. For each observed effort level (E), the corresponding catch, total revenue, total cost, and resulting rent values are reported. It is evident that negative resource rent occurred in 18 of the 24 years analysed.
Table 6.
Resource rent of the commercial catfish (Clarias gariepinus) fishery.
Table 7 presents the depreciation for the commercial catfish fishery in the southeast arm of Lake Malawi. Since depreciation is derived from depletion, it has been calculated for the 15 years in which depletion occurred. The total estimated depreciation amounts to MK 1.5 billion.
Table 7.
Depreciation of the commercial catfish (Clarias gariepinus) fishery.
3.4. Constant Harvesting
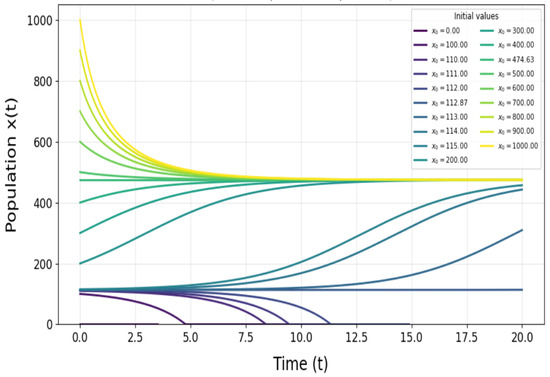
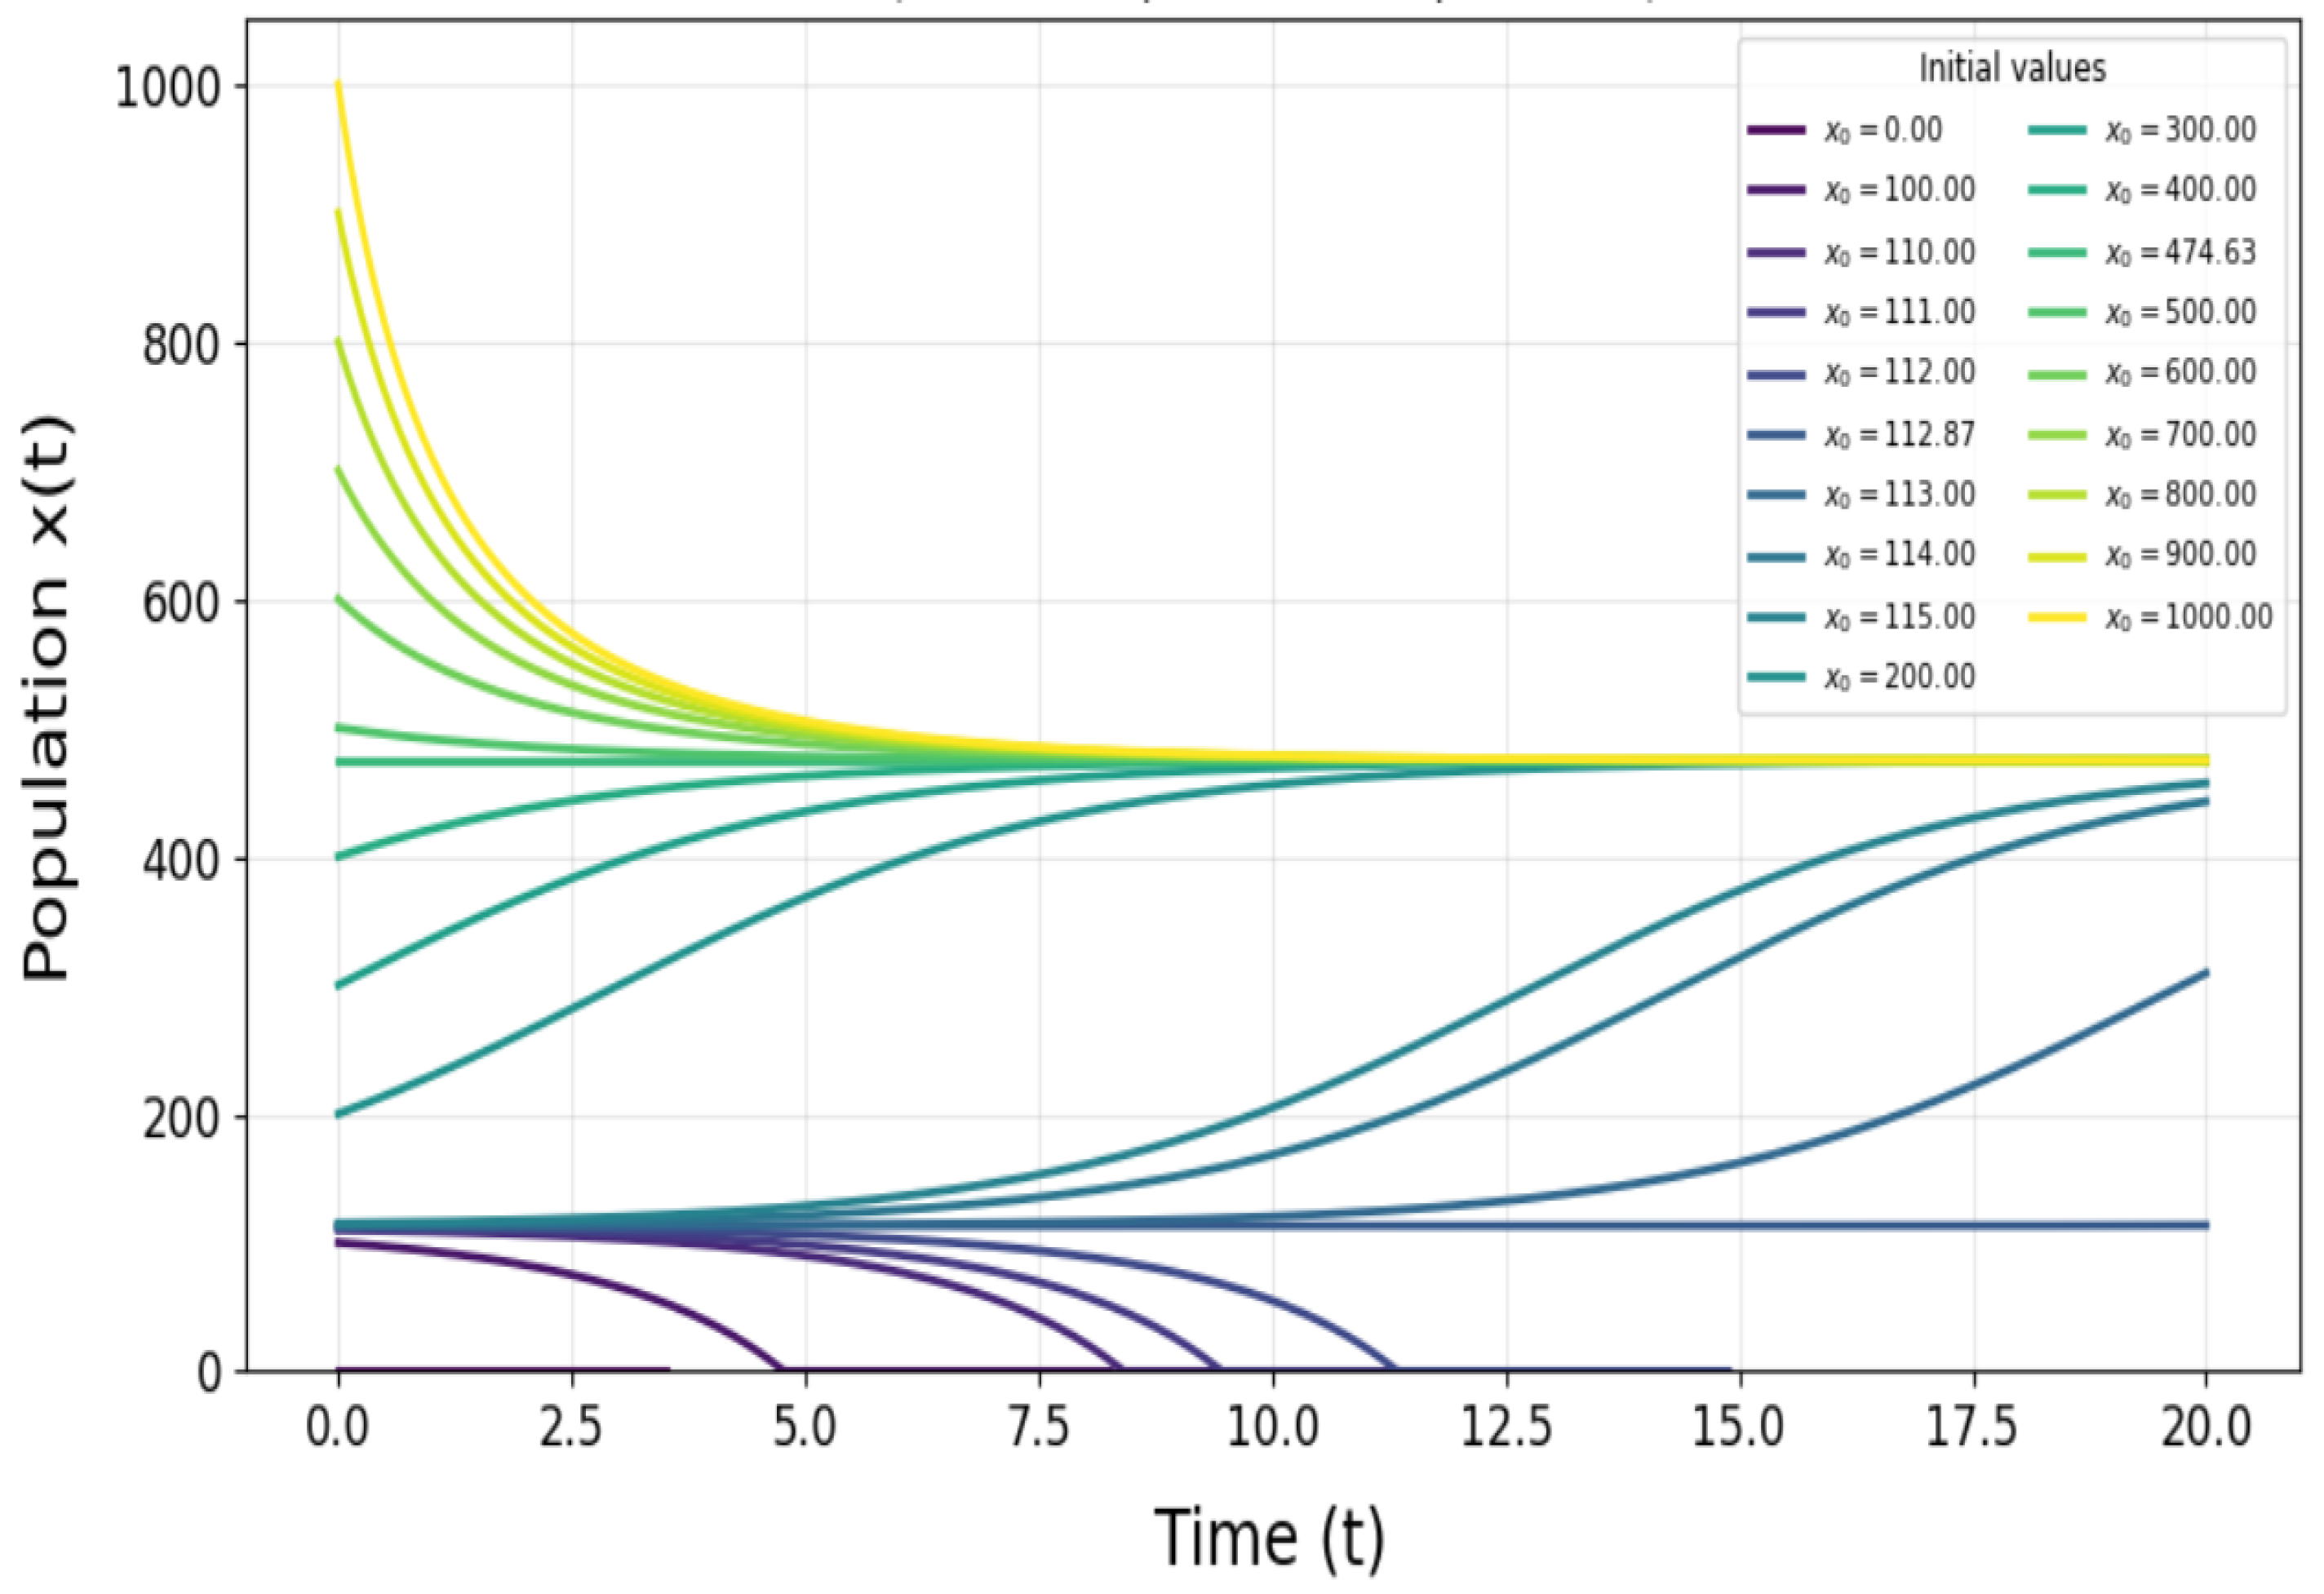
Using biological parameters in Table 3, the bifurcation point in Equation (14) is tonnes. Figure 3 shows solution curves for the case tonnes per year. It is observed that there are two equilibrium points and . According to Figure 3, population size starting at any of these equilibrium points remains there forever. For any initial biomass level or population size greater than 474.6 tonnes, the population approaches the equilibrium value 474.6 tonnes in the long run. Similarly, for any initial population between 112.9 and 474.6 tonnes, the population asymptotically approaches 474.6 tonnes. However, any initial population less than 112.9 tonnes, the population goes into extinction in finite time. Therefore, the fixed point 112.9 is unstable while 474.6 is stable.
Figure 3.
Solution curves for . Each colored line represents a population trajectory corresponding to a different initial population size.
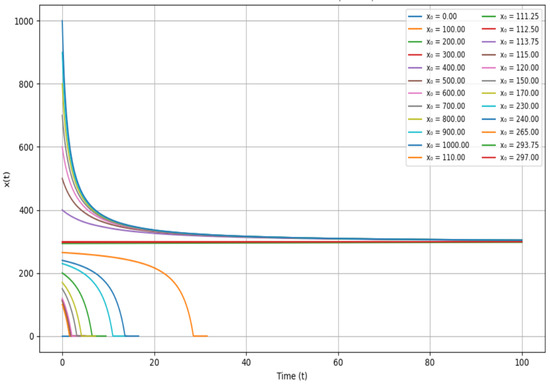
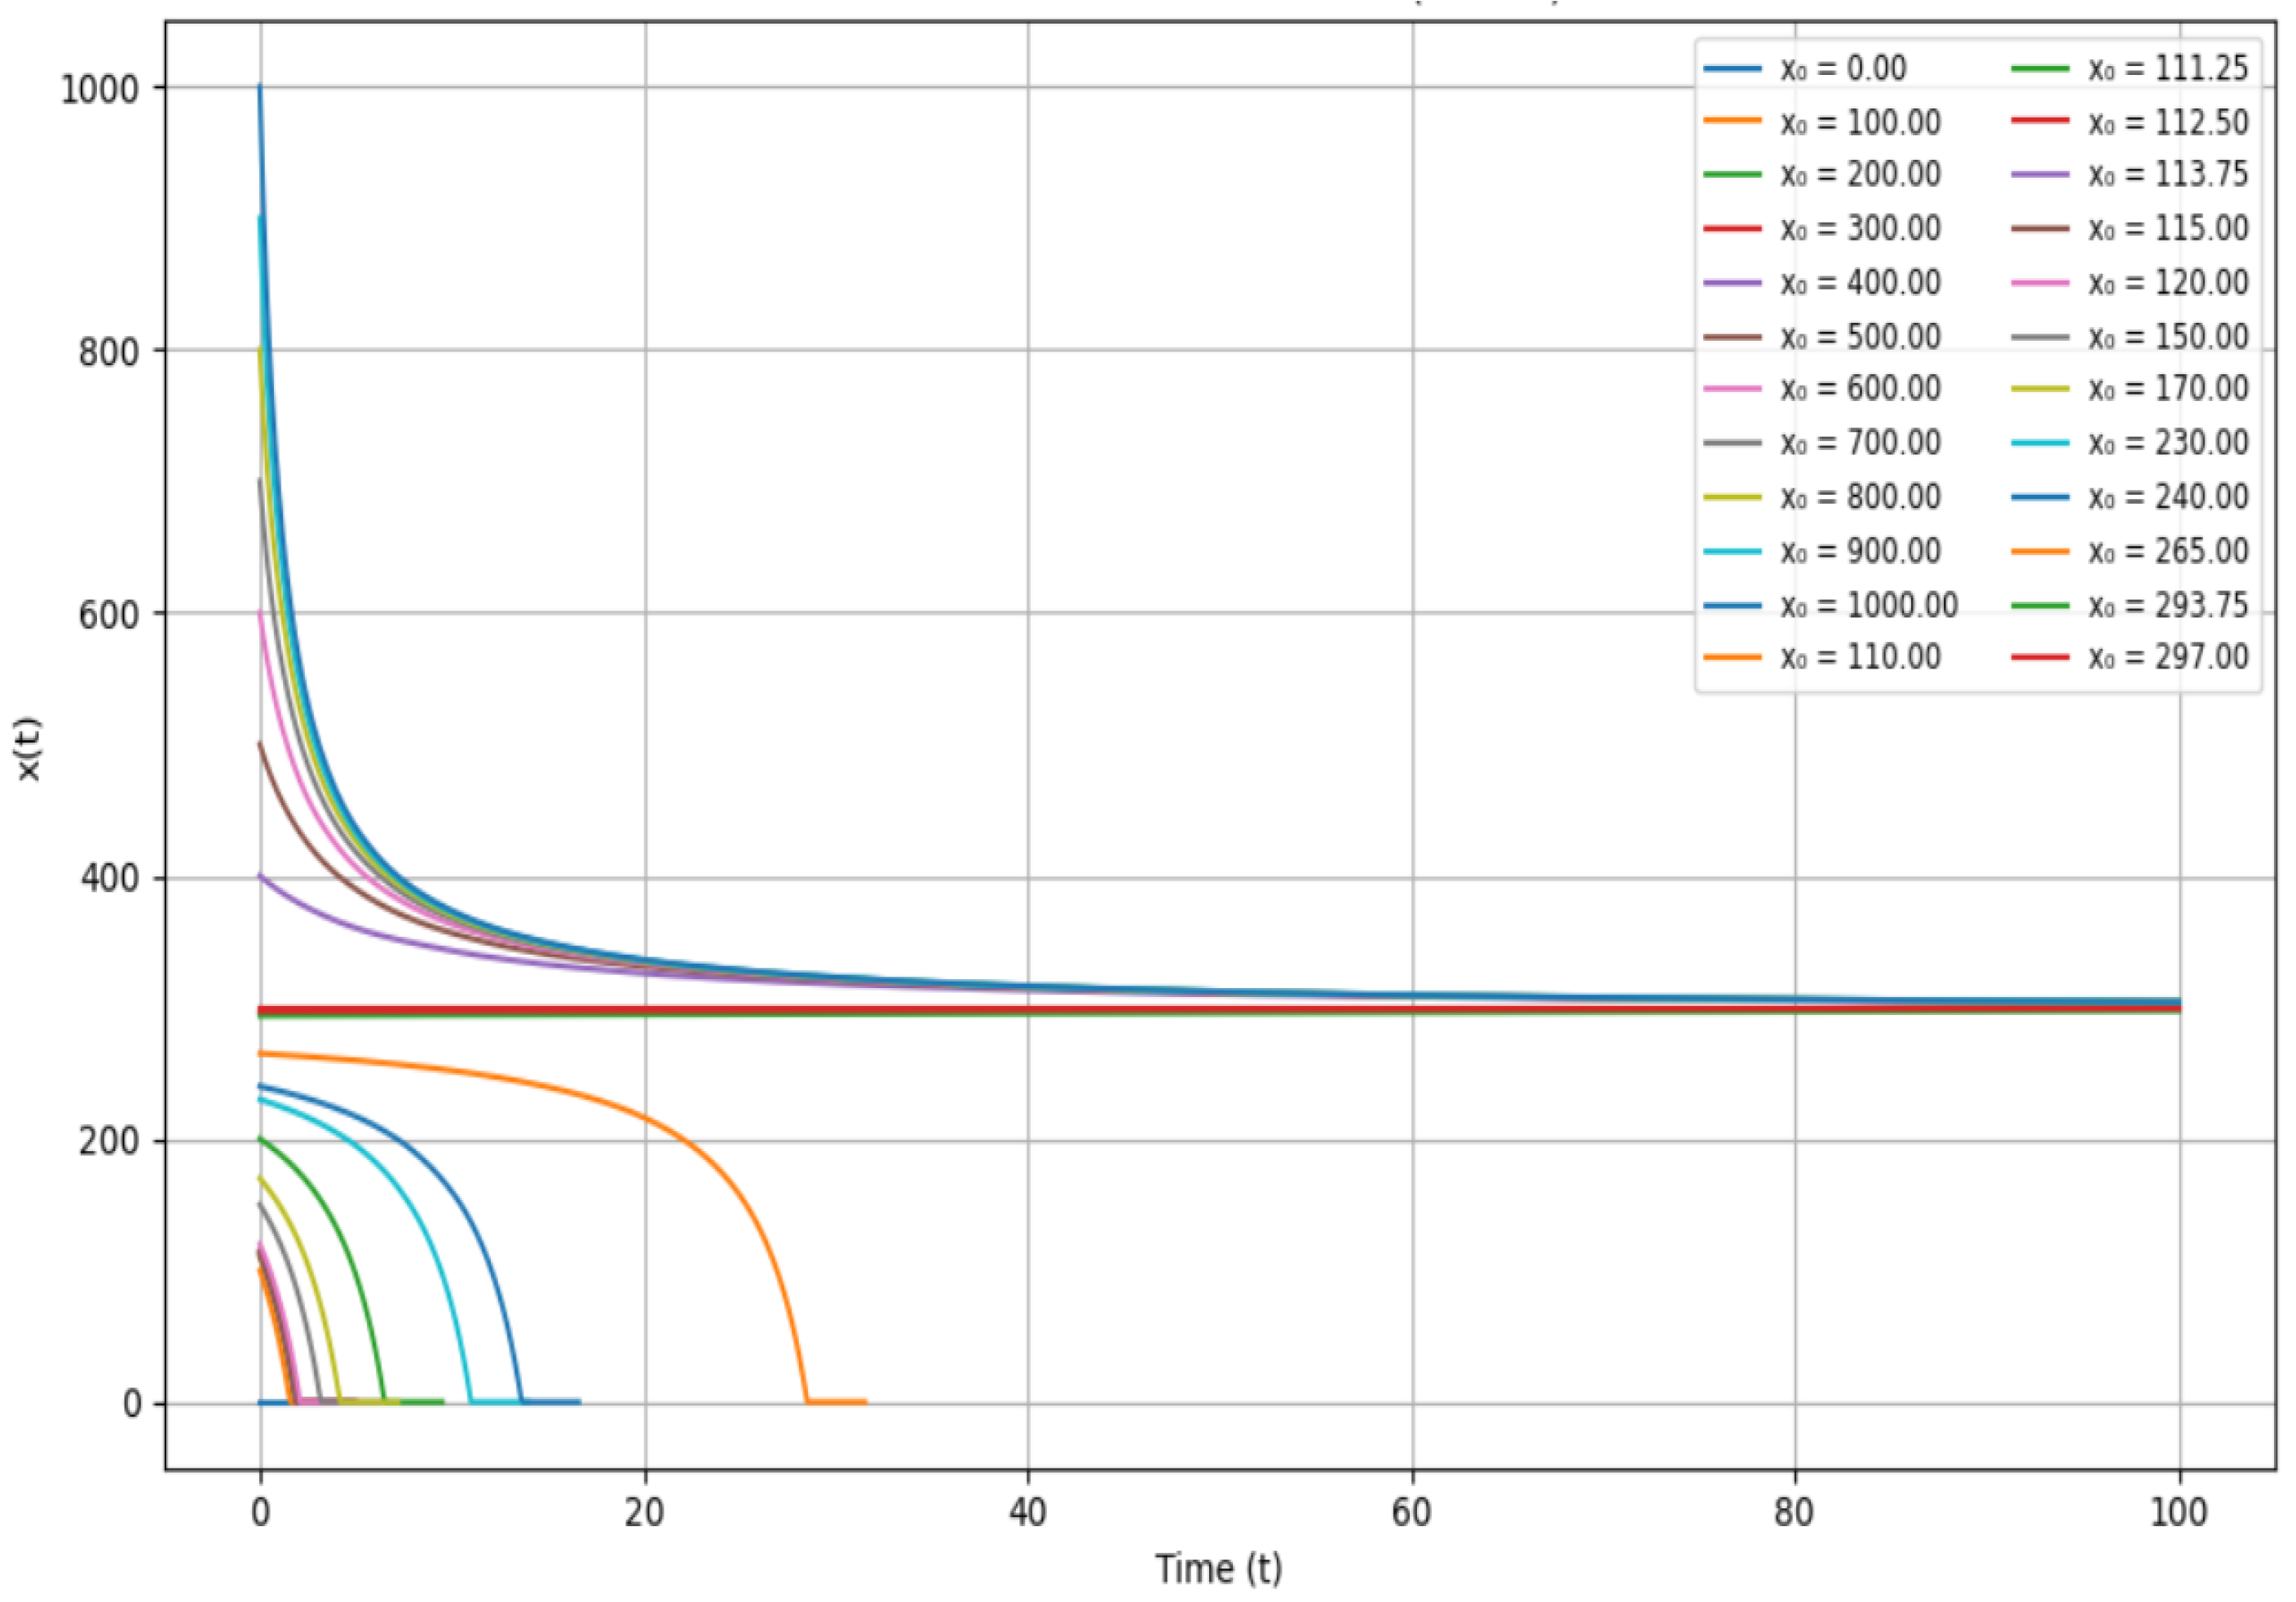
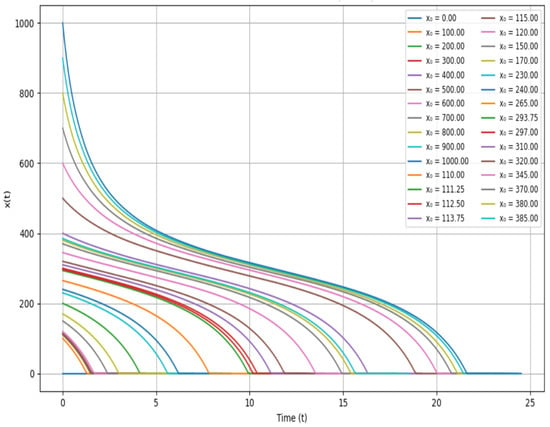
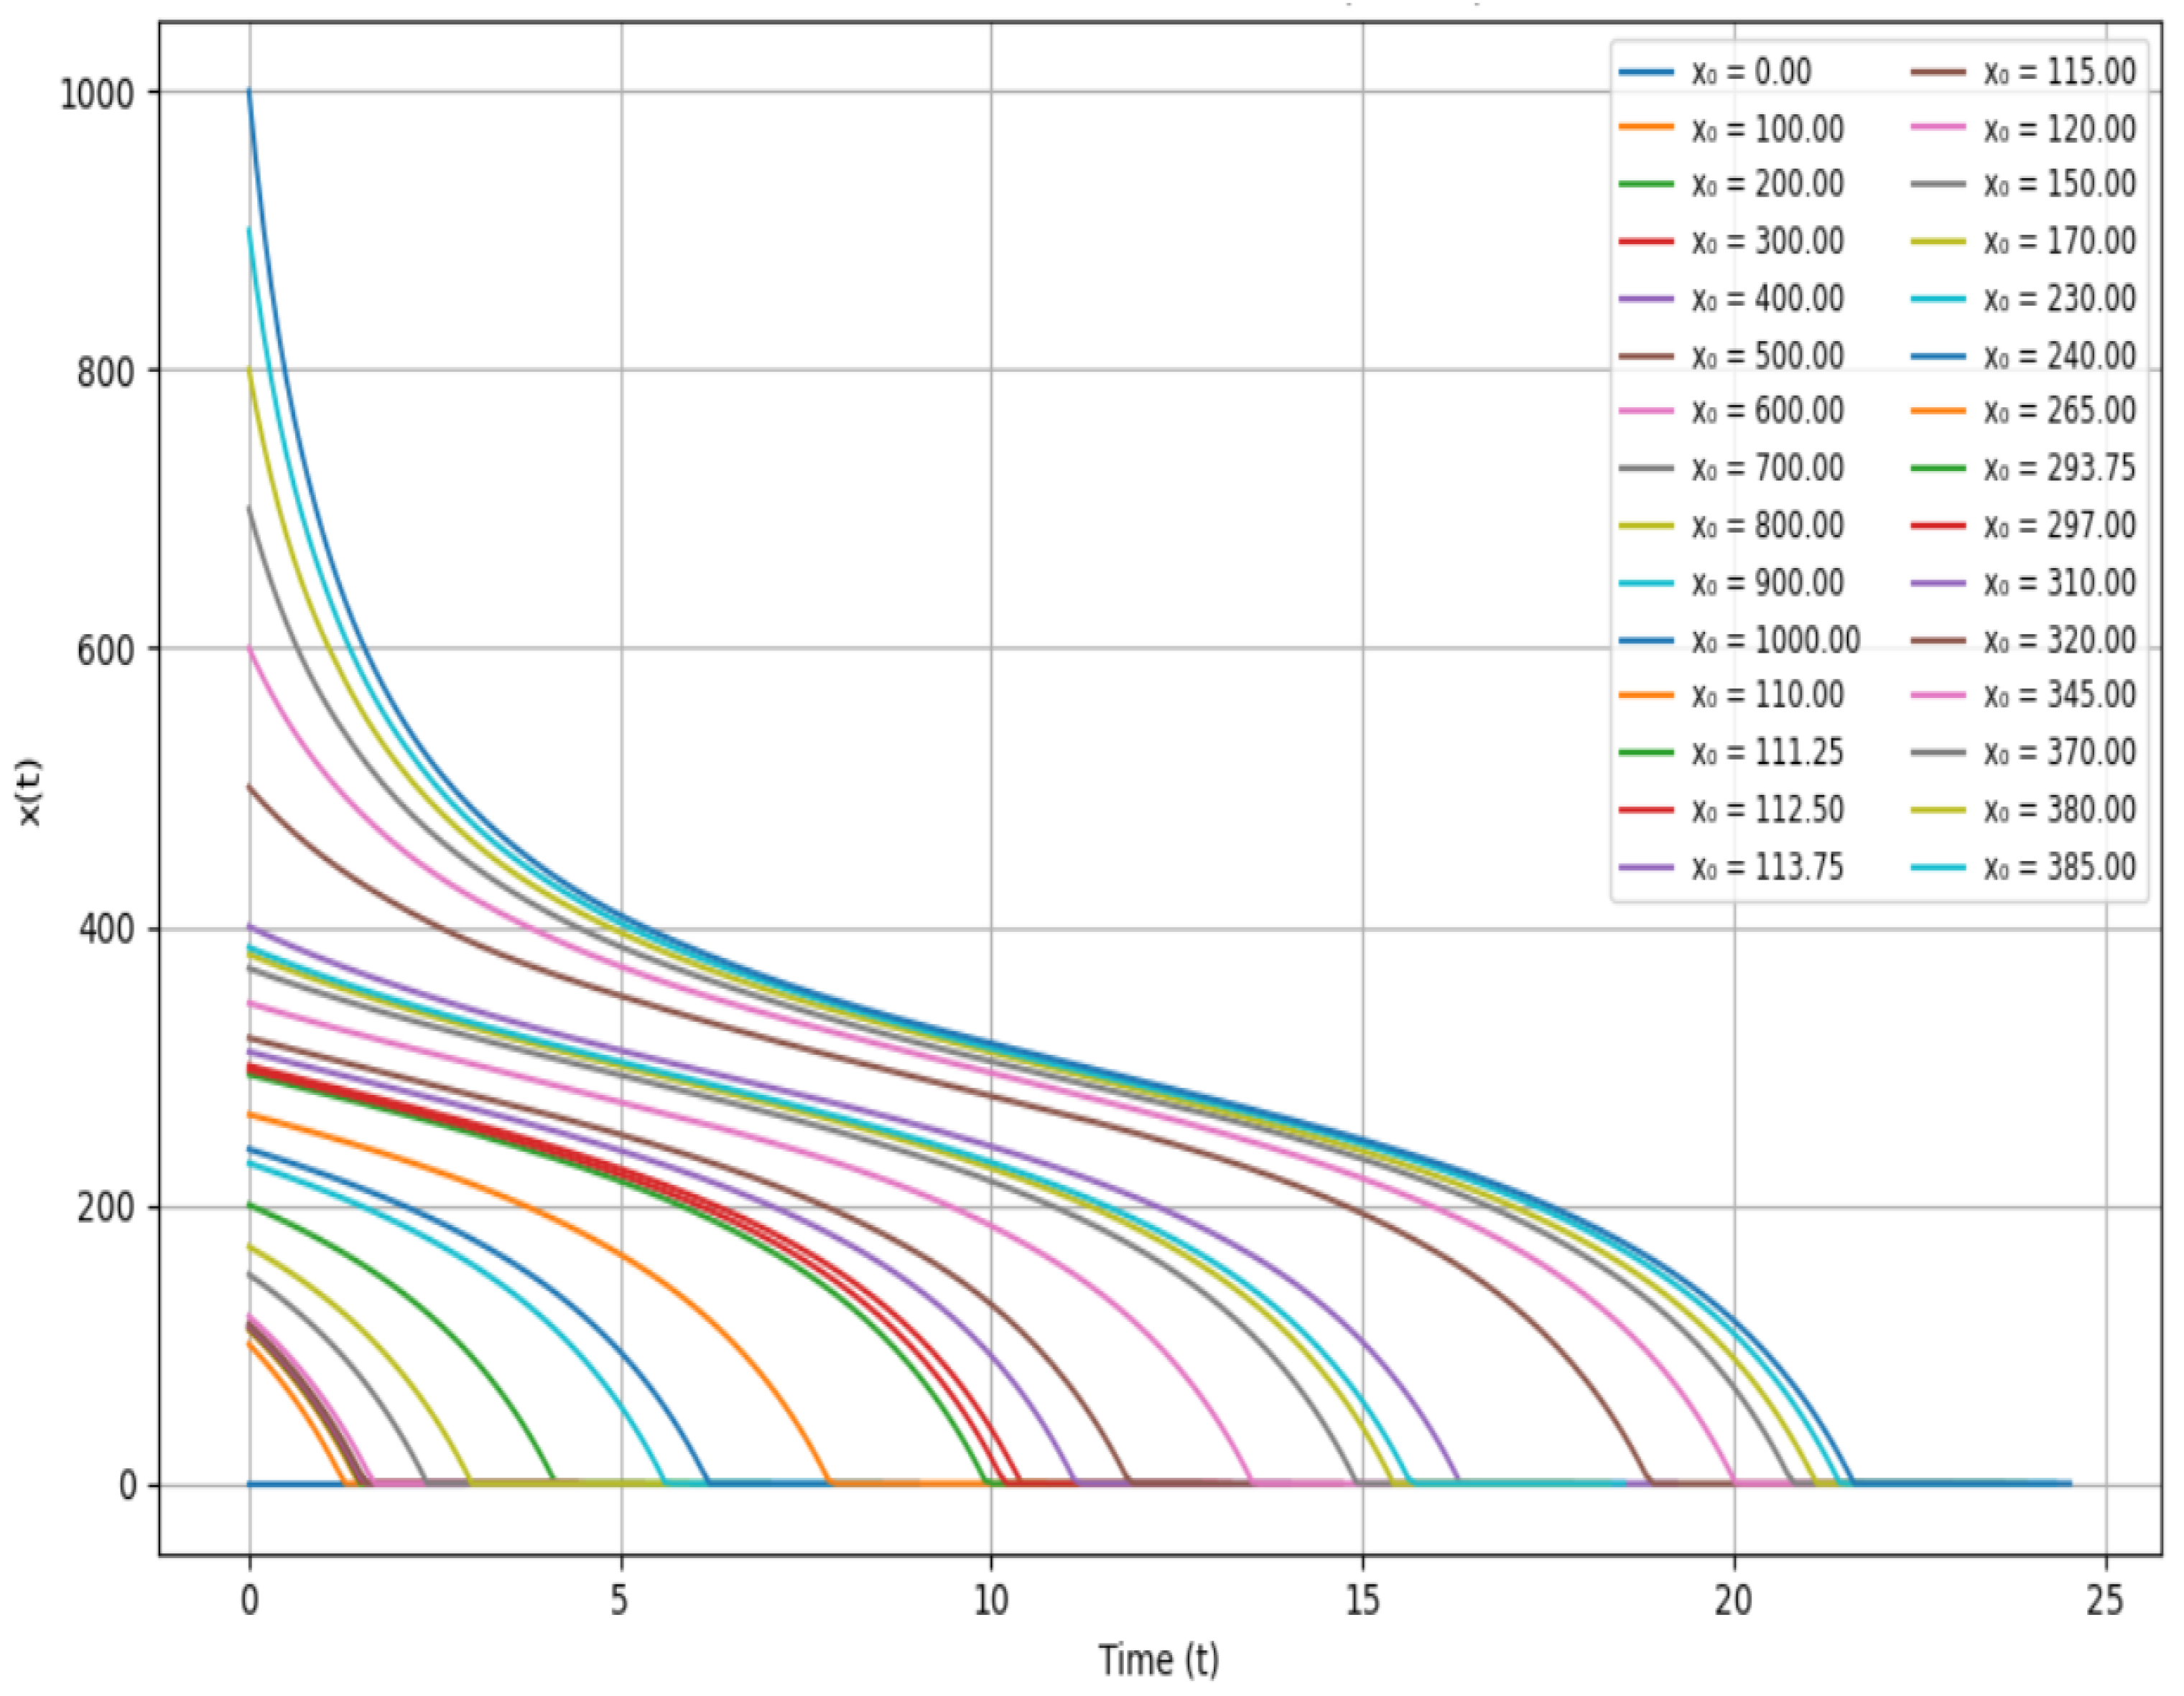
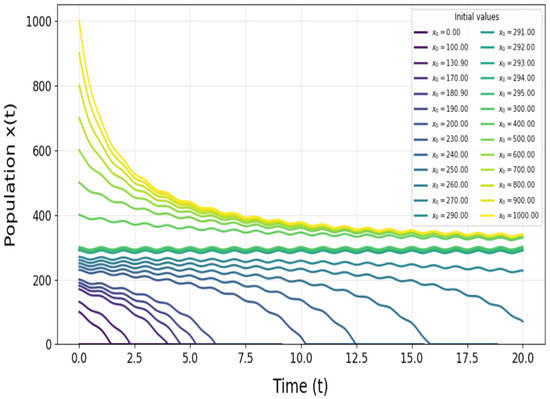
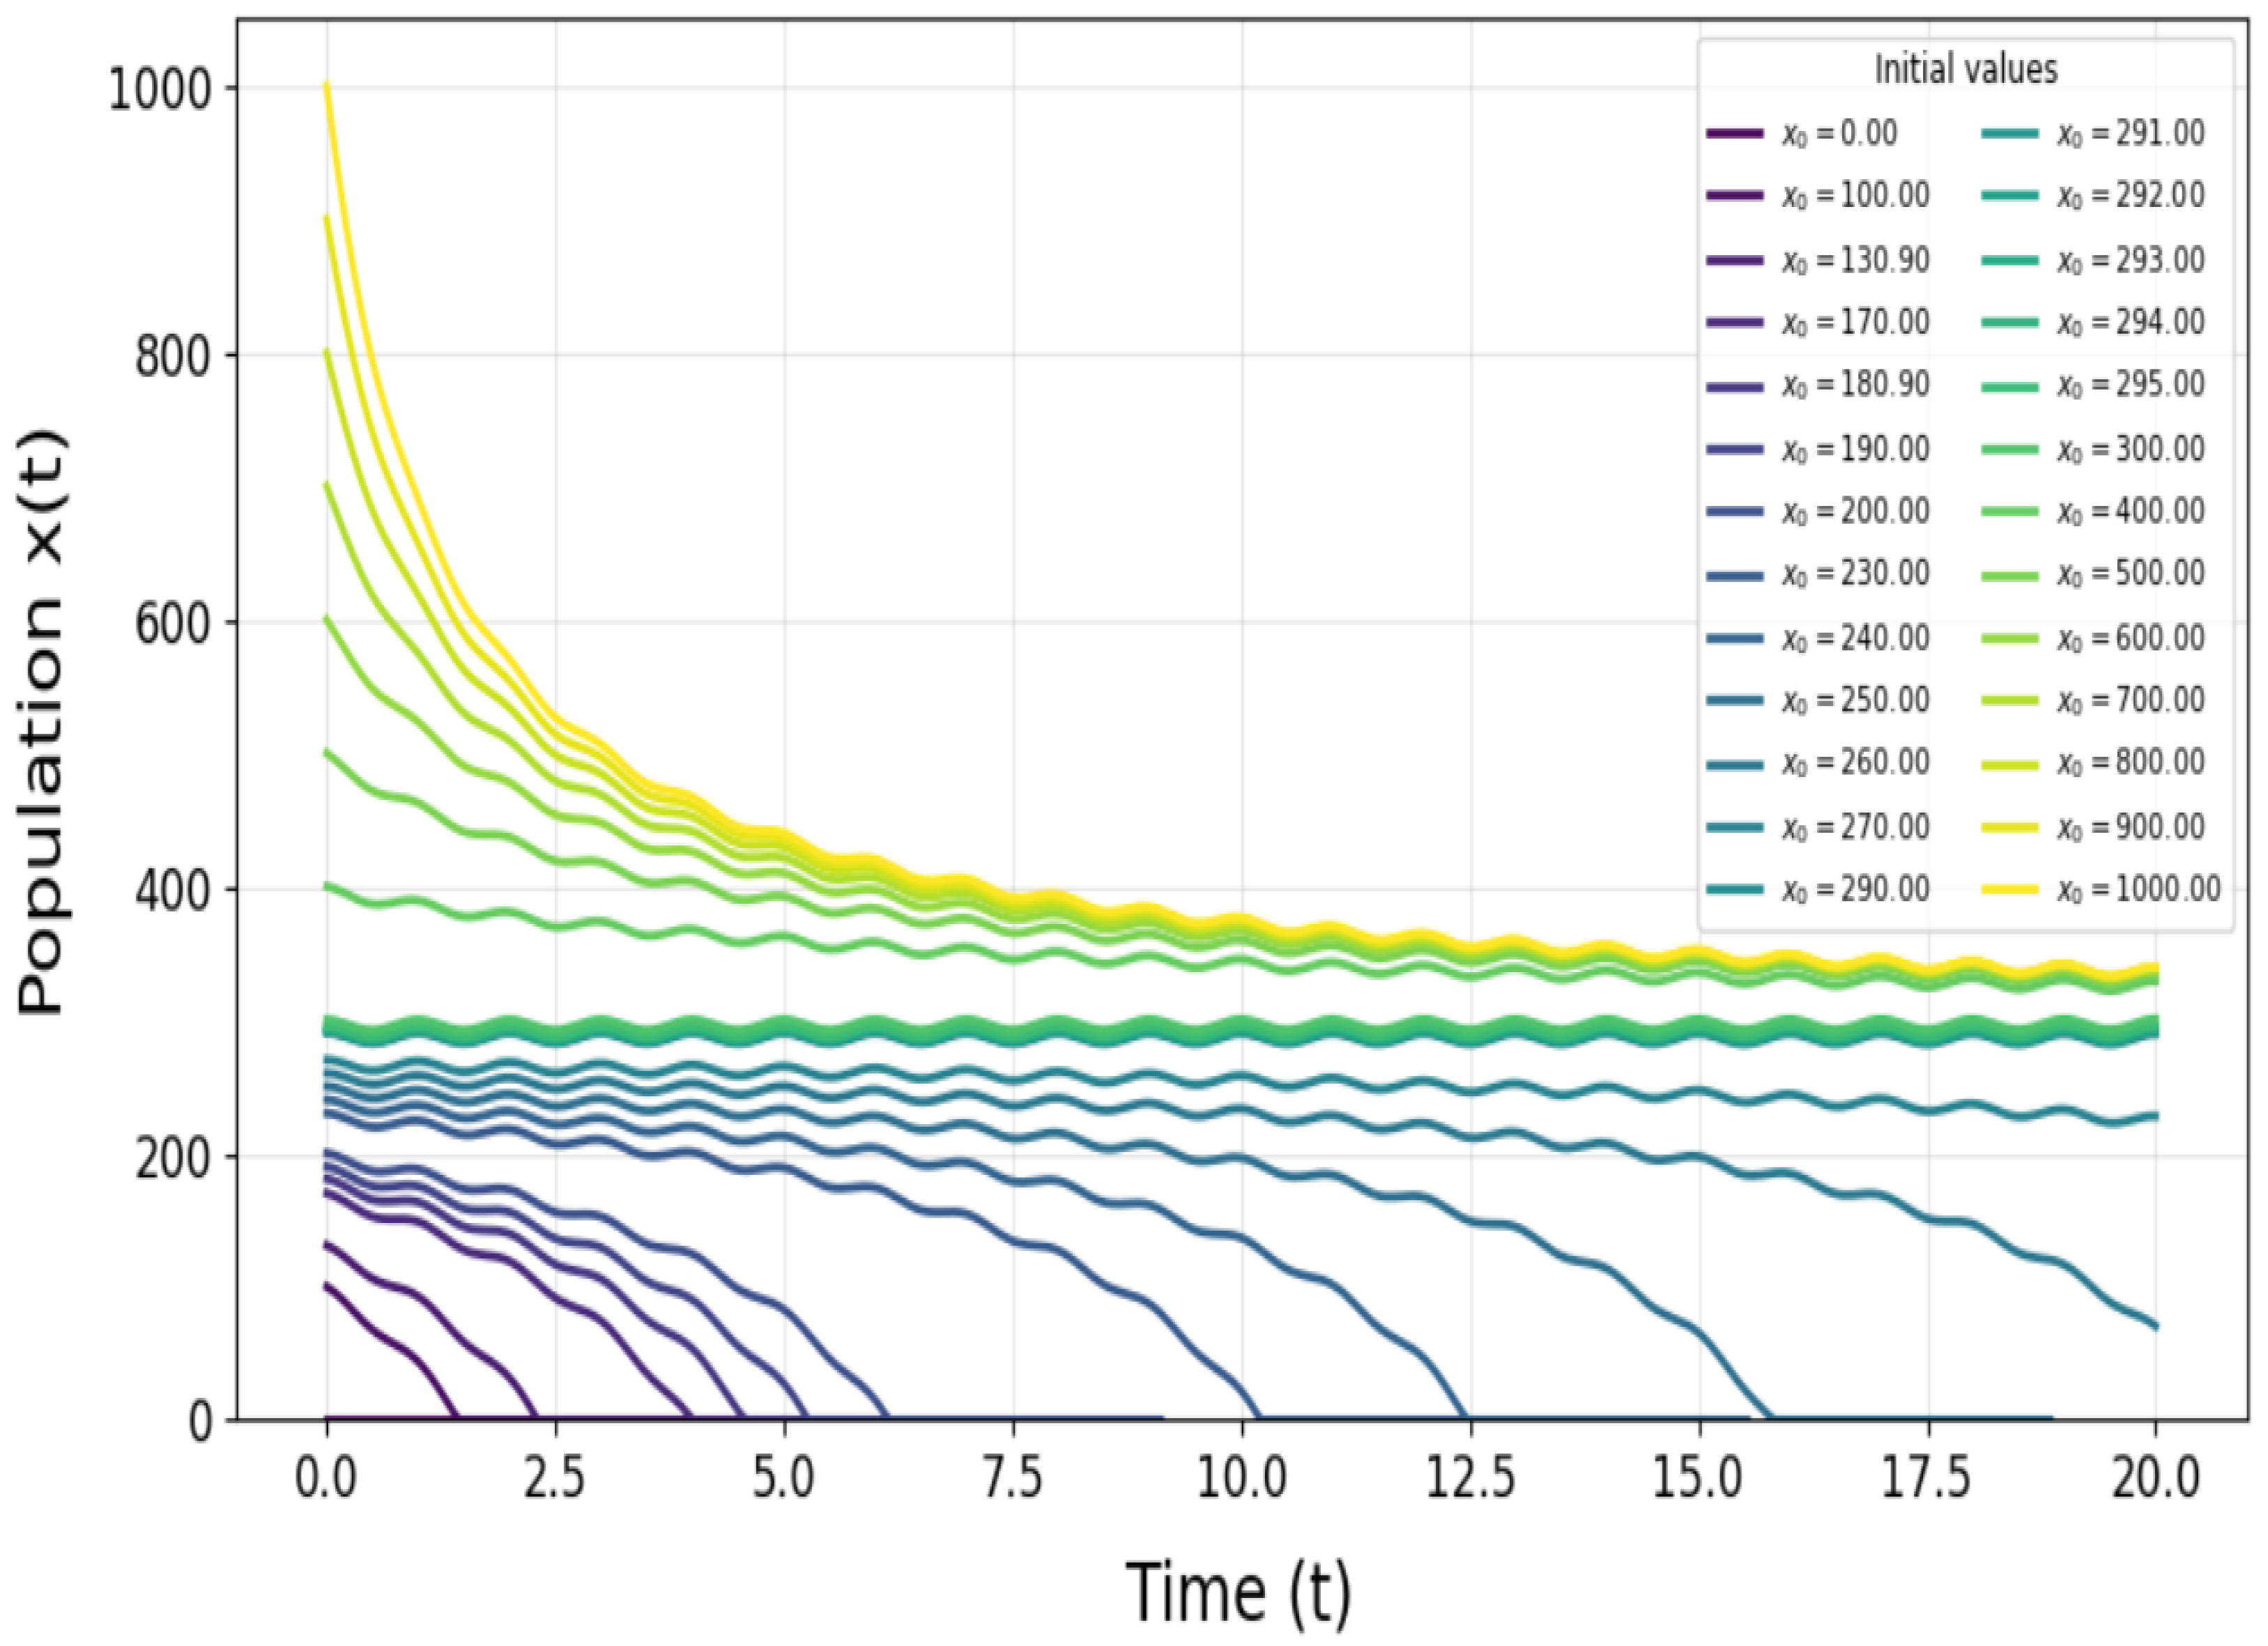
Figure 4 shows solution curves for the case tonnes, the bifurcation point. There is a single fixed point, tonnes. Population size starting at 293.8 tonnes remains there indefinitely. For any initial population size or biomass level greater than 293.8 tonnes the population approaches the equilibrium value 293.8 tonnes. However, for any initial population less than 293.8 tonnes, the population goes into extinction in finite time. Therefore the fixed point is semi-stable (making the system structurally stable). Hence, a harvest rate corresponding to tonnes triggers a long-term biomass level of exactly half the carrying capacity provided the initial population is less than 293.8 tonnes.
Figure 4.
Solution curves for . Each colored line represents a population trajectory arising from a distinct initial population size.
Figure 5 shows solution curves for the case tonnes per year. It is observed that there is no equilibrium point for this harvest rate. For any initial population size or biomass level, the population goes into extinction in finite time. Therefore, a harvest rate of tonnes per year sends the population into extinction in finite time, regardless of the initial population size or biomass.
Figure 5.
Solution curves for .
3.5. Periodic Harvesting
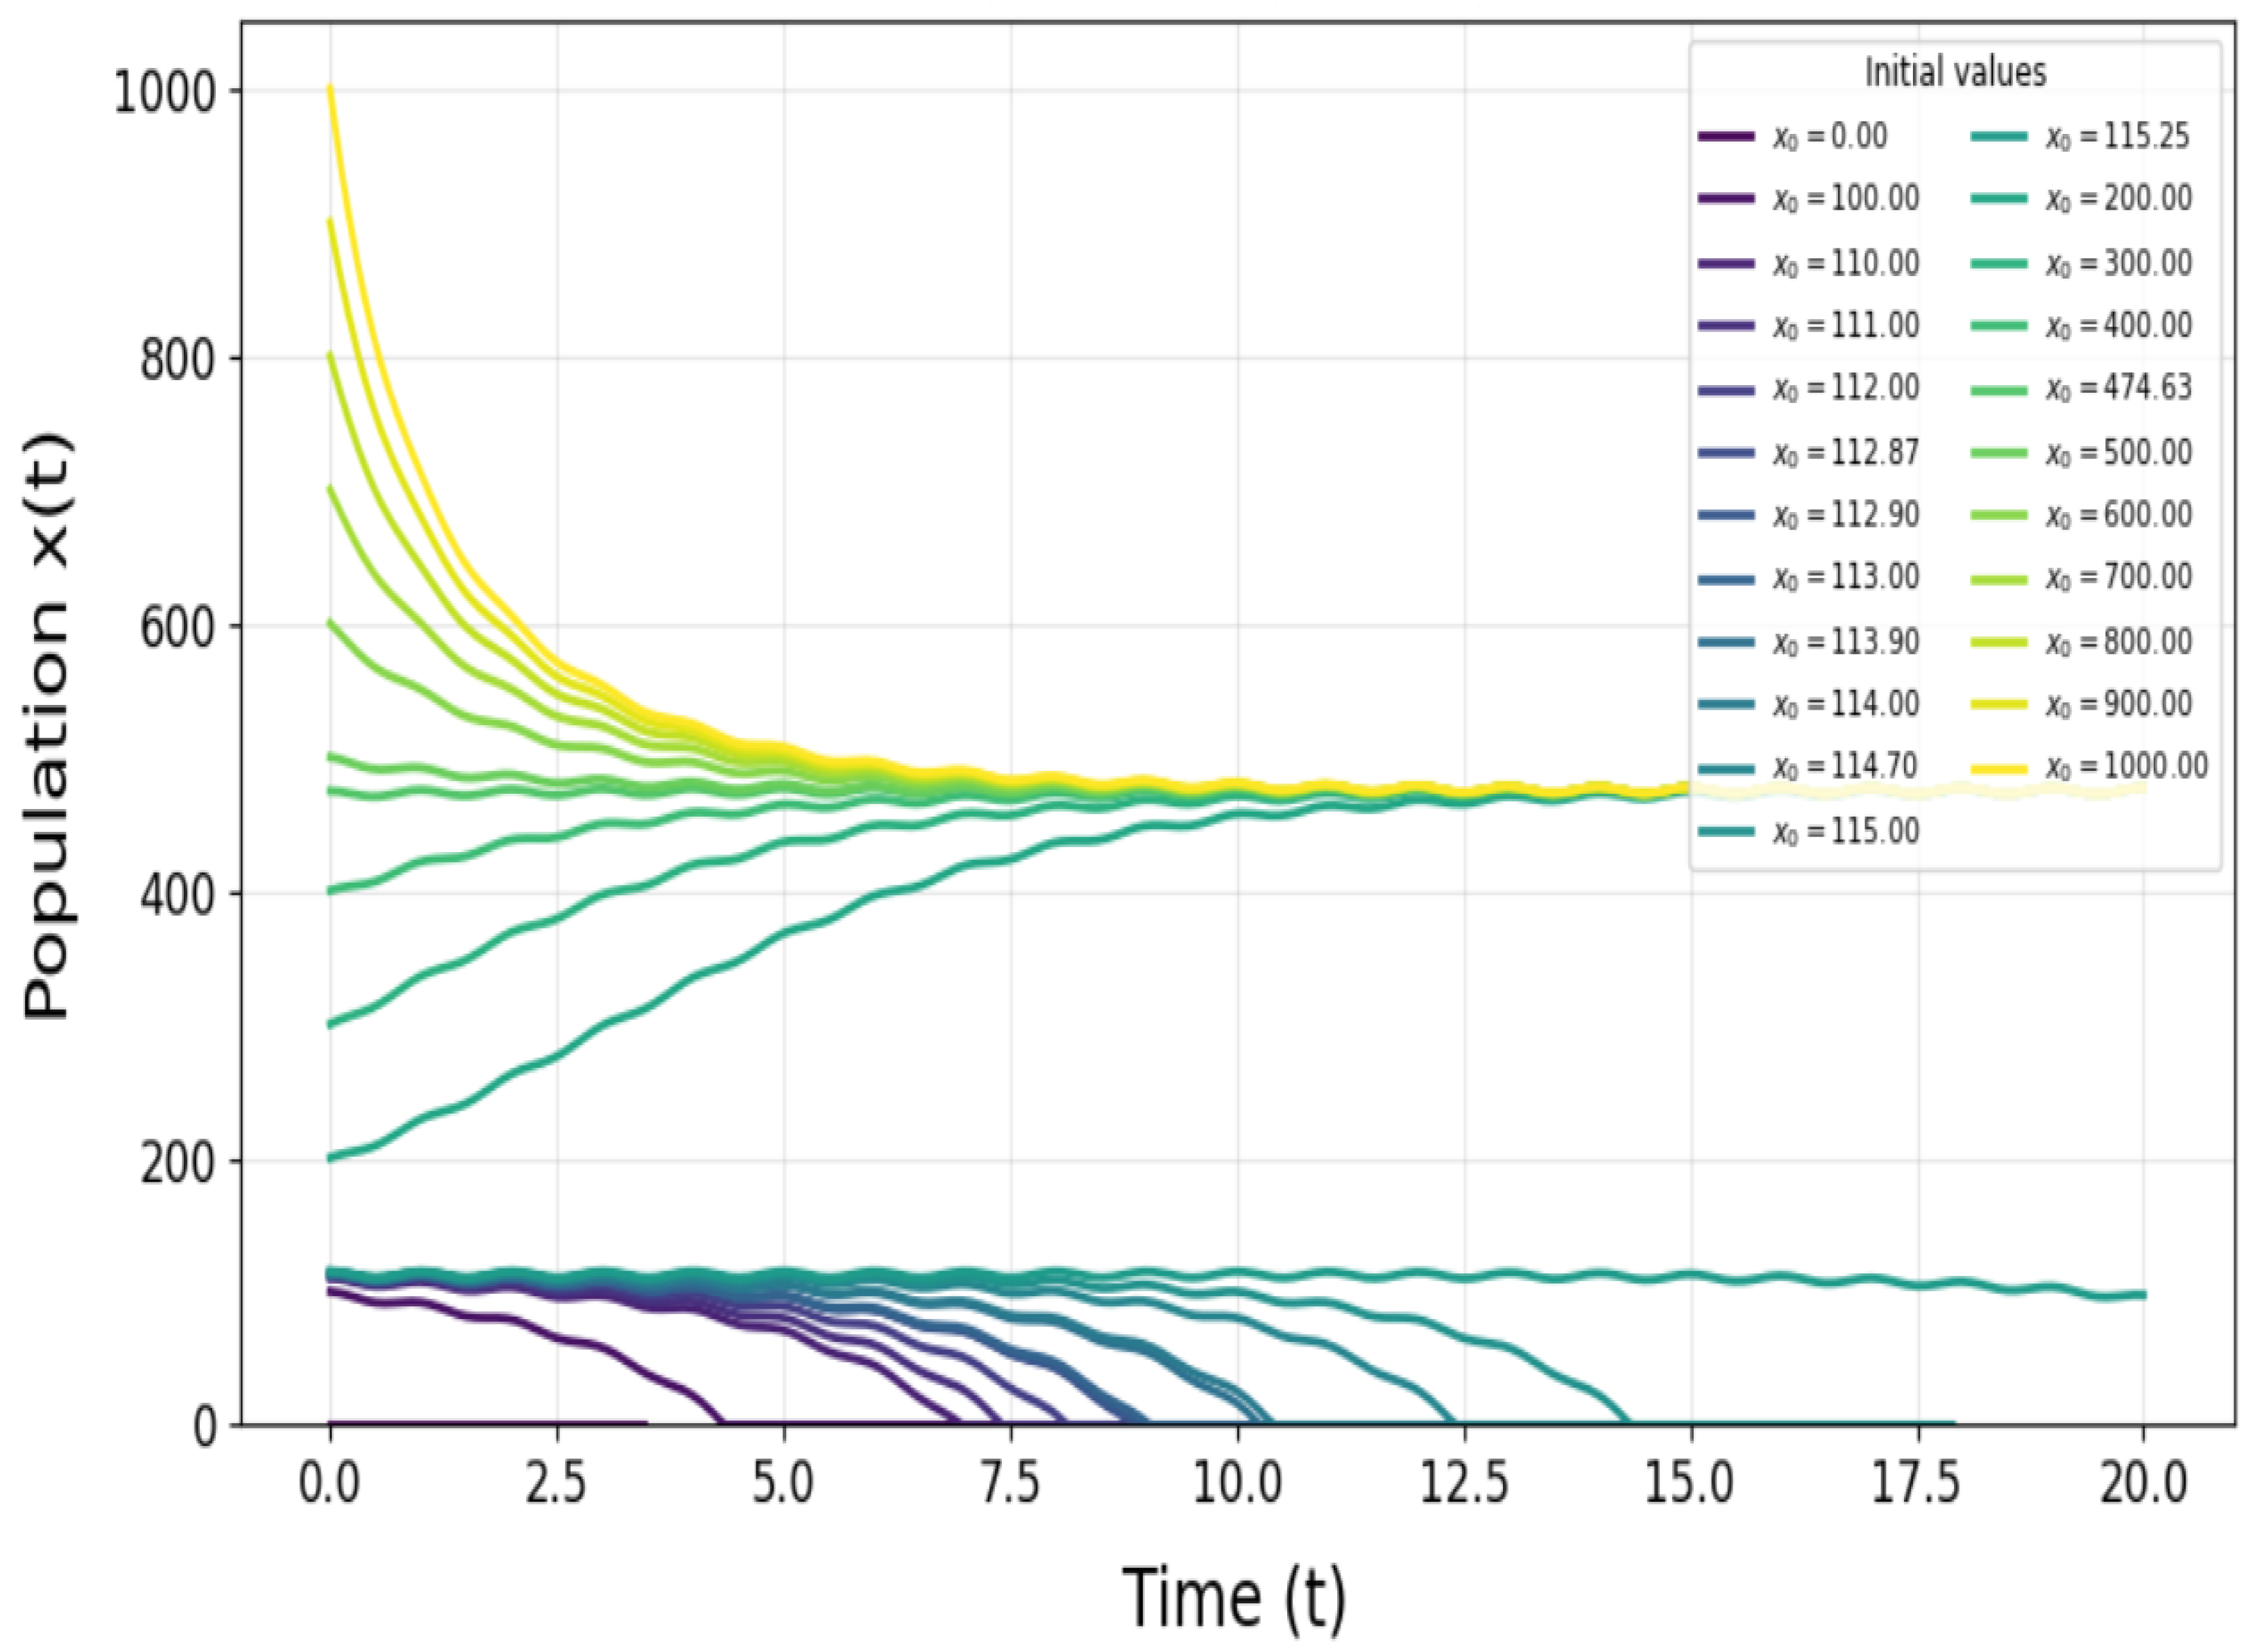
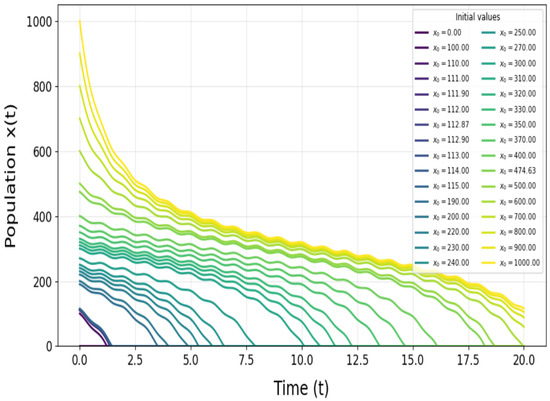
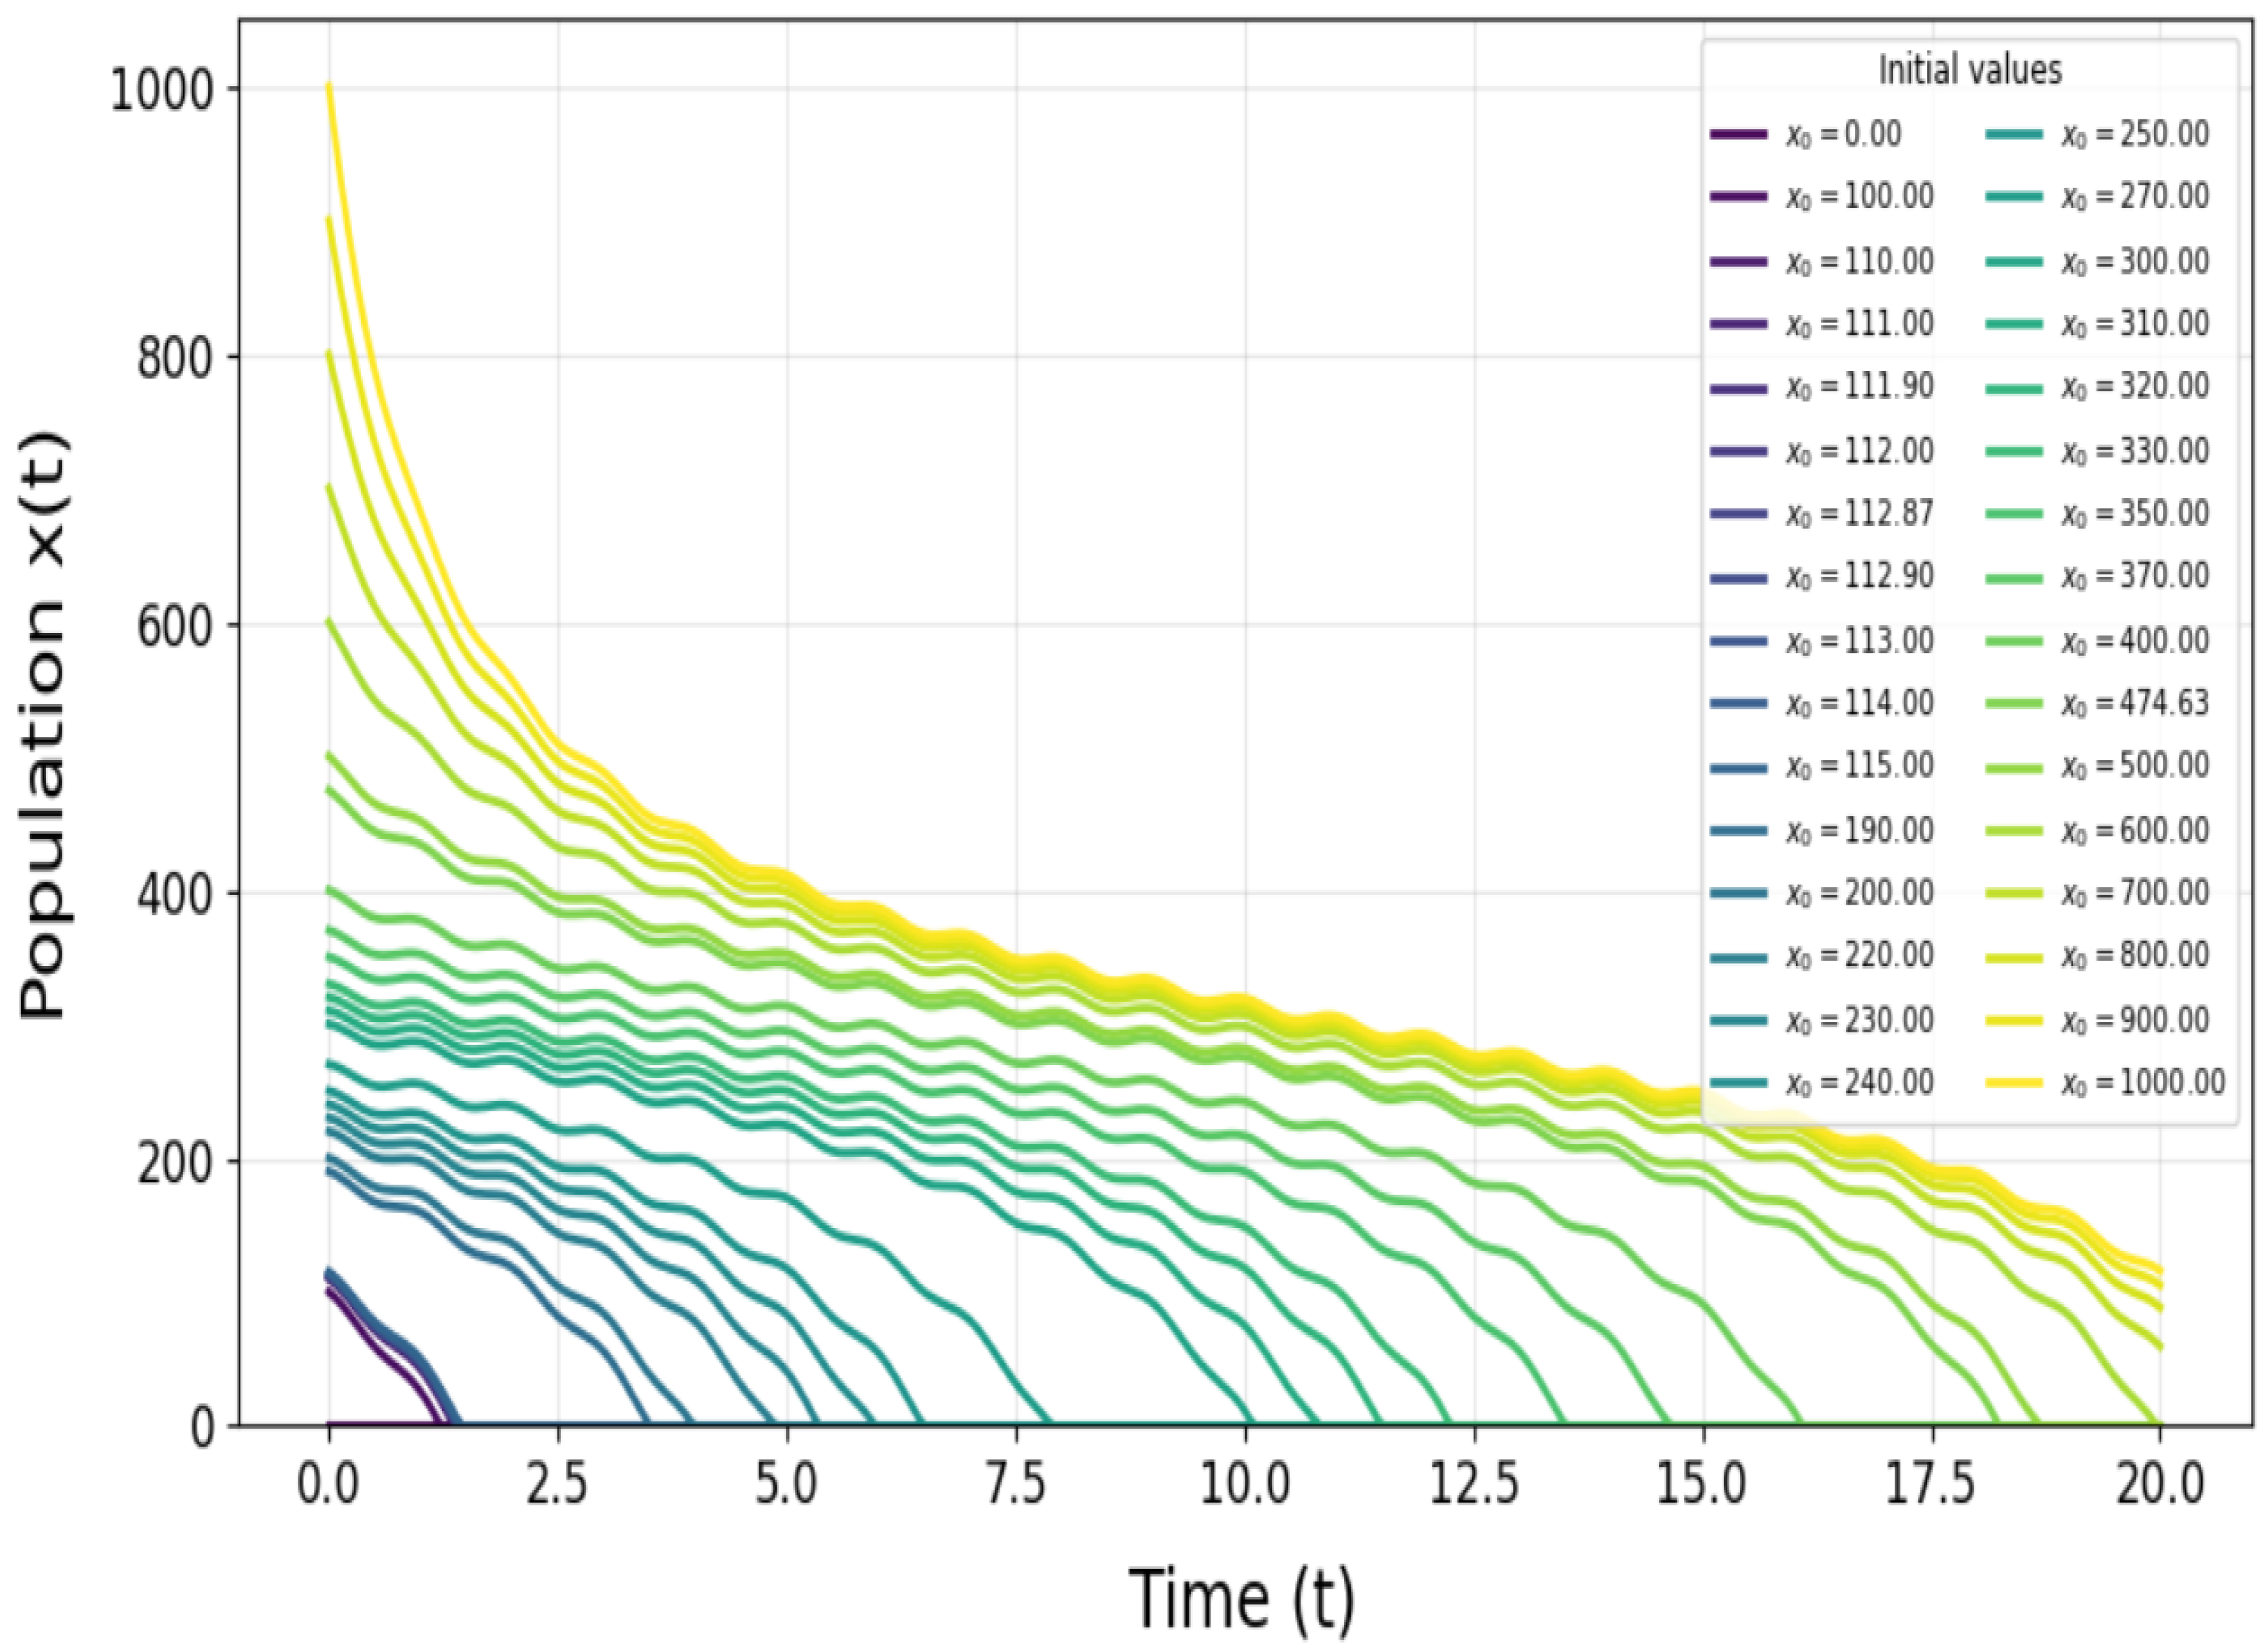
Figure 6 shows the periodic cycles for the case where tonnes per year. It is evident that there are two periodic solutions of period oscillating around the mean values: tonnes and tonnes. For any initial population starting at tonnes or at tonnes, the population remains there forever. For any initial population size above 474.6 tonnes, the population gradually converges toward the equilibrium mean level of 474.6 tonnes through sinusoidal oscillations. Similarly, for any initial population between 112.9 and 474.6 tonnes, the population asymptotically approaches 474.6 tonnes. However, for any initial population below 112.9 tonnes, the population goes extinct in a finite amount of time. Thus, the equilibrium point 112.9 is unstable while 474.6 is stable. Therefore, a harvest rate of tonnes per year results in a long-term biomass level that exceeds half of the carrying capacity provided the initial population is greater than 112.9 tonnes.
Figure 6.
Periodic Cycles for . Each colored line represents a population trajectory arising from a distinct initial population size.
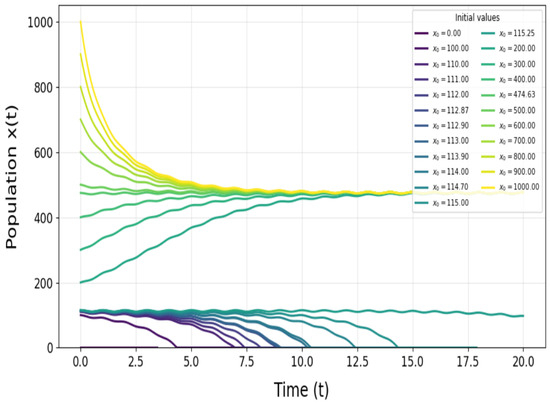
Figure 7 shows periodic cycles for the case , the bifurcation point. It is apparent that there is a single periodic solution, tonnes. Initial population or biomass levels starting from the equilibrium level tonnes, remain there indefinitely. For any initial population size above 293.8 tonnes, the population converges to the mean equilibrium level of 293.8 tonnes in the long run. However, for initial population size below 293.8, the population declines to extinction in finite time. Thus, the biomass level 293.8 tonnes is semi-stable. Hence, a harvest rate of 96.6 tonnes per year results in a long-term biomass equal to exactly half of the carrying capacity, provided the initial biomass is greater than 293.8 tonnes.
Figure 7.
Periodic Cycles for . Each colored line represents a population trajectory arising from a distinct initial population size.
Figure 8 illustrates the periodic dynamics for a harvest rate of tonnes per year. At this level of exploitation, the system has no equilibrium point, and the population declines to extinction within a finite time, regardless of the initial biomass level or population size. Consequently, a harvest rate corresponding to tonnes leads to population collapse.
Figure 8.
Periodic Cycles for . Each colored line represents a population trajectory arising from a distinct initial population size.
4. Discussion
Our analysis indicates that, overall, actual catches have consistently exceeded sustainable levels in the commercial catfish fishery of the southeast arm of Lake Malawi (Table 4 and Figure 2). Between 2000 and 2023, the cumulative actual catch surpassed the total sustainable catch, reflecting a sustained increase in fishing pressure. This pattern of overexploitation suggests that the fishery is currently operating beyond both its biological and economic limits, which may result in declining stock biomass, diminished long-term yields, and heightened risk of resource collapse. These findings underscore the urgent need for effective management interventions to ensure the sustainability of the catfish fishery and the livelihoods dependent upon it.
Depletion refers to the rate at which the stock of natural resources (particularly non-renewable resources) is reduced. In this context, it indicates that the resource stock is declining faster than the sustainable rate, meaning that exploitation exceeds the level that can be maintained over time. A negative depletion value signifies that actual production surpasses sustainable production, potentially leading to economic losses, such as forgone rent, in the commercial catfish fishery of the southeast arm of Lake Malawi. According to our results, depletion occurred in 15 of the 24 years studied, suggesting that the catfish fishery is at risk of overexploitation and potential stock collapse. This finding underscores the need for effective management strategies, including monitoring of harvest levels and enforcement of sustainable catch limits, to safeguard the long-term productivity and economic viability of the fishery.
In this study, depreciation is defined as a direct consequence of biological depletion. Accordingly, depreciation is calculated directly from changes in fish population abundance or biomass. In a broader sense, depreciation may arise from several other factors, including market dynamics and changes in prices or costs. However, this study focuses on the bioeconomic linkage rather than the broader economic context. As a result, the applicability of the depreciation estimates presented here is limited to this bioeconomic framework.
Depreciation of fish resources refers to the loss of value or productivity of a fishery over time, typically due to overfishing, environmental degradation, or natural mortality. Thus, when a fishery is depleted, that is, when the biological stock declines, the resource’s future productivity and economic value also decrease, which constitutes depreciation. Our results indicate a total depreciation of slightly over MK 1.5 billion. This implies that the commercial catfish fishery in the southeast arm of Lake Malawi, from 2000 to 2023, has lost over MK 1.5 billion in economic value. Such significant losses highlight the urgent need for effective management strategies to ensure sustainable harvesting and to safeguard both the economic and ecological viability of the fishery.
The negative resource rent values observed in this study (Table 6) suggest that the fishery may be operating under economically inefficient conditions. Such outcomes are commonly associated with overfishing, excess fishing capacity, or ineffective management, all of which can reduce stock abundance and undermine long-term sustainability. When fish stocks are depleted, harvest levels decline while fishing costs tend to rise due to increased search time and effort, resulting in revenues that are insufficient to cover operating costs [32]. Consequently, negative resource rent is often interpreted as an indicator of economic overfishing. Addressing this situation may require management interventions.
Since the fisheries sector in Malawi is open-access and enforcement of regulations is challenging, measures such as implementing catch limits and rights-based management may not be feasible in the short term. More practical strategies under these constraints are community-based co-management approaches, which include voluntary reductions in fishing effort and participatory monitoring by local stakeholders. While catch limits and rights-based management remain important long-term goals, locally-driven interventions can help improve compliance in the short term, stabilise fish stocks, and reduce economic losses in the process.
However, negative resource rent does not necessarily arise solely from biological overexploitation. Market-related factors, including declining fish prices or increasing input costs, can also lead to negative rents even when stocks are not severely depleted [32]. In addition, subsidies are known to artificially lower fishing costs, encourage excessive effort, and accelerate rent dissipation, potentially resulting in negative resource rent. Although subsidies are not reported in the Malawian fishery sector, market inefficiencies, such as price volatility, limited market access, or rising fuel and input costs, may still play a role. Importantly, the negative resource rent values reported here are derived from the Gordon–Schaefer model, which assumes that prices and costs remain constant over the entire 24-year period. Thus, these values represent model-based economic signals of fishing pressure rather than observed profits. Overall, the observed negative resource rent likely reflects a combination of biological overexploitation and economic or market-related constraints, and should be interpreted cautiously as an indicator of economic overfishing.
Analysis of the harvesting models indicates that, to ensure sustainability, the commercial catfish fishery should be harvested at a rate lower than the bifurcation point of tonnes per year. Both the constant and periodic harvesting models demonstrate that harvesting above this threshold may lead to extinction of the resource. Results in Table 1 show that this value was exceeded in 8 of the 24 years studied. This pattern of excessive harvesting highlights a persistent risk to the long-term viability of the fishery.
However, the bifurcation threshold of tonnes should be interpreted as an approximate bioeconomic reference point rather than a precise biological limit or deterministic boundary. This threshold is derived from a stylised model based on estimated parameters that are subject to uncertainty. In practice, environmental variability, parameter uncertainty, changes in fishing efficiency, and behavioural responses of both fish and fishers may influence the location of the bifurcation point. Consequently, this threshold should be viewed as a precautionary guideline, above which the risk of stock collapse increases substantially. Maintaining annual harvests below this level would enhance the biological and economic sustainability of the commercial catfish fishery in the southeast arm of Lake Malawi. Strengthening monitoring, enforcement, and adaptive management will be essential to keep harvests within sustainable bounds.
Results from this study are consistent with previous studies in Malawi that used the Gordon–Schaefer model to assess the stock status of various fish species. For example, ref. [4] reported stock decline and overexploitation of chambo species in Lake Malombe. The observed economic overfishing was attributed not to economic factors such as price increases or decreases in costs, but to excessive fishing effort. The open-access nature of the fishery in Malawi was identified as the main driver of overexploitation. Similarly, ref. [11] concluded that Engraulicypris sardella (usipa) species in the southeast arm of Lake Malawi are also overexploited. Additionally, a study employing time series analysis suggested that overexploitation of the catfish fishery in the Mangochi district could not be ruled out [13].
Consistency of our results with previous studies using the Gordon–Schaefer model [2,4,11,20,33] likely reflects shared model assumptions and data structures rather than independent validation, highlighting a limitation due to potential methodological circularity. Nevertheless, our study makes distinct contributions by applying the Gordon–Schaefer model to a novel dataset spanning 2000 to 2023, providing updated estimates of biological depletion, economic resource rent, and depreciation. Additionally, the derivation of the bifurcation threshold offers an integrated biological and economic assessment of the fishery in Malawi, representing a conceptual advancement not addressed in prior evaluations.
These results underpin the challenges confronting the fishery sector in Malawi. Most fish species in the country are reported to be overexploited [13], which has contributed to a decline in the economic efficiency and benefits of the sector [4]. To address this, there is a need to review management options and strengthen weaker areas within the sector. Such measures appear to be the only way to prevent further depletion of fishery stocks.
Fish stocks in Malawi are managed through restrictions on fishing gears, fishing areas, and fishing periods. Catch statistics and annual frame surveys of fishing effort provide the input data for stock assessment studies that inform these management recommendations [8]. However, with several stocks reported to be declining [4,9,19,20], it is evident that the current management approach has not been fully effective. Implementation of these restrictions faces numerous challenges, including limited human capacity and inadequate financial resources. Strengthening monitoring, control, and surveillance systems on the lake, supported by additional funding, could play a crucial role in preventing further depletion of the commercial catfish fishery. Enhancing these systems would not only help conserve the resource but also reduce the substantial economic losses (depreciation) associated with ongoing depletion. Ultimately, improving management effectiveness is essential for ensuring the long-term sustainability and economic viability of fisheries in the southeast arm of Lake Malawi. However, the provision of additional funding depends on government allocations, donor support, and institutional priorities.
The regression analysis yielded a relatively low coefficient of determination ( in Table 3), indicating that a limited proportion of the variability in the dependent variable is explained by the model. This may be partly attributable to fluctuations in the data arising from temporal instability in catch and fishing effort [19]. Similar low values have been reported in previous studies applying the Walters–Hilborn or Gordon–Schaefer framework [19,20,33,34]. In addition, the Gordon–Schaefer model assumes that fish population dynamics are not influenced by environmental variability. The exclusion of environmental covariates, such as rainfall and temperature, which can affect recruitment and stock productivity, may therefore have contributed to the low explanatory power of the model.
Despite the low , which indicates that the model explains only a small portion of the variability in fish catch, the estimated parameters are biologically plausible and broadly consistent with previous assessments. However, downstream results, including sustainable catch, depletion, and depreciation, should be interpreted as approximate values rather than precise predictions. The low explanatory power of the model implies that these estimates carry considerable uncertainty, so they should be treated as indicative of general trends rather than exact targets. Conducting alternative model specifications and sensitivity analyses, as well as incorporating additional covariates such as environmental factors, could improve model fit and enhance confidence in the estimated parameters.
The bioeconomic Gordon–Schaefer (GS) model provided useful insights into the biological depletion and economic depreciation of the commercial catfish fishery in the southeast arm of Lake Malawi. However, the interpretation of the results should be made in light of the model’s underlying assumptions. It is important to note that, in practice, many of these assumptions may not hold under real fishery conditions. Despite these limitations, the Gordon–Schaefer model remains widely applied as a practical tool for guiding fishery management decisions [22,25,33,34,35]. In this study, estimates of sustainable catch levels were consistent with those reported in previous studies that also applied the Gordon–Schaefer framework [1,18], providing useful benchmarks for management. Similarly, the observed patterns of depletion, economic depreciation, and harvesting strategies are in agreement with findings from earlier studies [3,16,29,30,31].
There are several sources of uncertainty in parameter estimation using the Walters–Hilborn method. First, uncertainty may arise from measurement or reporting errors in catch and effort data. Second, the Gordon–Schaefer (GS) model assumption that CPUE is directly proportional to fish population size may be violated due to variations in environmental conditions and fishing gear effectiveness. Third, parameters in the Walters–Hilborn method are estimated indirectly from the coefficients of a linear regression. Even small estimation errors in the regression coefficients can propagate and result in substantial uncertainty in the derived parameter estimates. Despite these challenges, the Walters–Hilborn method remains a reliable approach for estimating parameters of the Gordon–Schaefer model [7,19,26].
The use of single-year price and cost data to calculate depletion, resource rent, and depreciation over the 24-year period was based on the Gordon–Schaefer (GS) model assumption that these economic parameters remain constant over time. However, in practice, the cost of fishing effort and the price of landed fish may be influenced by several factors. Fish prices may vary due to changes in consumer income, preferences, and market demand and supply conditions, while fishing costs may be affected by fluctuations in fuel prices, gear costs, wages, and technological change. Such factors may lead to violations of the constant price and cost assumption. Despite this limitation, the use of single-year economic data has been widely applied in previous bioeconomic studies [4,20,21,25].
5. Conclusions
Actual catches in the commercial catfish fishery of the southeast arm of Lake Malawi exceeded sustainable levels in 15 of the 24 years examined, indicating persistent biological overfishing. Moreover, negative resource rent was recorded in 18 of the 24 years, reflecting economic overfishing and the fishery’s inability to generate sufficient revenue to cover operational costs. The study recorded a total depletion of 446 tonnes and total depreciation of approximately MK 1.5 billion. This combined evidence of depletion and depreciation underscores the risk of continued overexploitation, which could ultimately threaten the long-term viability of the stock. Harvests exceeding the threshold of 96.6 tonnes per year further jeopardise the persistence of the commercial catfish population. To ensure the sustainability of this important resource, management and enforcement measures must be strengthened, including improving patrols to prevent fishing in restricted areas, during closed periods, and with illegal or destructive gears. Implementing effective and adaptive management strategies will be critical for safeguarding both the ecological integrity and economic value of the commercial catfish fishery. Without prompt intervention, catfish stocks risk collapse, jeopardising ecosystem stability and the livelihoods of local communities.
Author Contributions
Conceptualisation, F.C. and M.K.; methodology, F.C., A.O.S. and S.K.; software, A.O.S.; validation, P.M.M., P.P. and M.K.; formal analysis, F.C. and P.P.; investigation, F.C. and S.K.; resources, M.K.; data curation, A.O.S.; writing—original draft preparation, F.C.; writing—review and editing, M.K., S.K., P.P., P.M.M. and A.O.S.; visualisation, A.O.S.; supervision, M.K., S.K., P.P., P.M.M. and A.O.S.; project administration, M.K. All authors have read and agreed to the published version of the manuscript.
Funding
This study was funded by the Lilongwe University of Agriculture and Natural Resources.
Institutional Review Board Statement
This study is waived for ethical review, as by the time this study was being conducted, the institutional review board at LIlongwe University of Agriculture and Natural Resources, was not fully operational. So the study was conducted without getting approval.
Informed Consent Statement
Informed consent for participation was obtained from all subjects involved in the study.
Data Availability Statement
The original contributions presented in this study are included in the article. Further inquiries can be directed to the corresponding author.
Acknowledgments
The authors acknowledge the support received from the administration and staff of the Lilongwe University of Agriculture and Natural Resources, including Emmanuel Kaunda, Phillip Kaonda, Judith Kamoto, Maxwell Mbweza, John Msubunda, and Salim M'balaka from the Department of Fisheries in Mangochi.
Conflicts of Interest
The authors declare no conflicts of interest.
References
- Anna, Z.; Suryana, A.A.H.; Maulina, I.; Brizal, A.; Hindayani, P. Biological parameters of fish stock estimation in Cirata Reservoir (West Java, Indonesia): A comparative analysis of bio-economic models. Biodiversitas 2017, 18, 1468–1474. [Google Scholar] [CrossRef] [Scilit]
- Ibrahim, M. An application of optimal control to the marine artisanal fisheries in Ghana. Commun. Math. Biol. Neurosci. 2019, 2019, 22. [Google Scholar] [CrossRef] [Scilit]
- Anna, Z. An analysis of capture fisheries resource depletion in cirata reservoir, west java, Indonesia. Biodiversitas 2018, 19, 927–935. [Google Scholar] [CrossRef] [Scilit]
- Maguza-Tembo, F. Bio-Economics of Common Resource Over Exploitation: Case of Lake Malombe Chambo (Oreochromis sp. cichlidae) Fishery in Malawi. Master’s Thesis, University of Tromso, Tromso, Norway, 2002. [Google Scholar]
- Government of Malawi. Analysis of Catch and Effort Data for the Fisheries of Nkhotakota 1976–1999; Department of Fisheries: Mangochi, Malawi, 2001.
- Government of Malawi. Analysis of Catch and Effort Data for the Fisheries of Southeast Arm of Lake Malawi; Department of Fisheries: Mangochi, Malawi, 2002.
- Chamera, F.; Kamndaya, M.; Kadaleka, S.; Phepa, P.; Mwamtobe, P.M.; Soko, A. Fish Stock Assessment Models for Developing Nations with Emphasis on the Use of the Classic Gordon-Schaefer Model: A Review. Fishes 2025, 10, 442. [Google Scholar] [CrossRef] [Scilit]
- Darwall, W.R.T.; Allison, E.H. Monitoring, assessing, and managing fish stocks in lake Malawi/Nyassa: Current approaches and future possibilities. Aquat. Ecosyst. Health Manag. 2002, 5, 293–305. [Google Scholar] [CrossRef] [Scilit]
- M’balaka, M.S.; Kanyerere, G.; Kawonga, D. Assessment of artisanal Chambo fisheries in Mangochi district. Int. J. Fish. Aquat. Stud. 2018, 6, 96–102. [Google Scholar]
- Government of Malawi. National Fisheries Policy 2012–2017; Department of Fisheries: Mangochi, Malawi, 2012.
- Gumulira, E.; Forrester, G.; Lazar, N. Bio-economic analysis of Engraulicypris sardella (usipa) in south east arm of lake Malawi. Int. J. Fish. Aquac. 2019, 11, 86–96. [Google Scholar]
- FAO. Management Techniques for Elasmobranch Fisheries; FAO Fisheries Technical Paper 487; FAO: Rome, Italy, 2005. [Google Scholar]
- Mulumpwa, M.; Jere, W.W.L.; Mtethiwa, A.; Kakota, T.; Kang’ombe, J. Modeling and forecasting of Catfish species yield from Mangochi artisan fisheries of Lake Malawi in Malawi. Afr. J. Food Agric. Nutr. Dev. 2020, 20, 16864–16883. [Google Scholar]
- Banda, F.M.; Edriss, A.K. Analysis of demand for fish in urban Malawi. Int. Rev. Manag. Mark. 2023, 13, 33–40. [Google Scholar] [CrossRef] [Scilit]
- Samala, L.; Kapute, F. Assessment of fish exports from Blantyre district, sourthen Malawi. J. Limnol. Fresh Water Fish. Res. 2019, 5, 70–75. [Google Scholar]
- Anna, Z.; Hindayani, P.; Suryana, A.A.H.; Ihsan, I.N.; Salsabila, A. Sustainability Study of Scalloped Hammerhead Shark (Sphyrna lewini) in Indramayu Waters. Sustainability 2020, 12, 10459. [Google Scholar] [CrossRef] [Scilit]
- Tesfaye, M.; Getahun, A. Review on fish stock assessments models with more emphasis on the use of empirical and analytical models for potential yield prediction. Acta Entomol. Zool. 2021, 2, 23–30. [Google Scholar] [CrossRef] [Scilit]
- Zainun, I.; Sofyan, S.; Fajri, F.; Bagio, B. Application of surplus production model on tuna fishery in Sabang, weh island, Indonesia. IOP Conf. Ser. Earth Environ. Sci. 2019, 348, 012109. [Google Scholar] [CrossRef] [Scilit]
- Singini, W.; Kaunda, E.; Kasulo, V.; Jere, W.; Msiska, O. Bioeconomic approach to rebuilding small haplochromine cichlids of lake malombe, malawi. Int. J. Sci. Technol. Res. 2012, 1, 10–15. [Google Scholar]
- Singini, W.; Kaunda, E.; Kasulo, V.; Jere, W. Wealth based fisheries management of chambo (Oreochromis spp.) fish stock of lake malombe in malawi. Int. J. Fish. Aquac. 2013, 5, 270–277. [Google Scholar]
- Hengbin, Y.; Mohsin, M.; Noman, M.F. Application of gordon-shaefer model to evaluate bioeconomic and management aspects of Scomberomorus sinensis fishery in Shandong, China. Indian J. Geo Mar. Sci. 2020, 47, 1250–1257. [Google Scholar]
- Mohsin, M.; Hengbin, Y.; Luyao, Z.; Shah, S.B.H. Assessment of bioeconomic and management aspects of tuner fishery resource in Pakistan. J. Anim. Plant Sci. 2020, 30, 1516–1524. [Google Scholar]
- Ibrahim, M. Optimal control of a fishery utilising compensation and critical depensation models. Appl. Math. Inf. Sci. Int. J. 2020, 14, 467–479. [Google Scholar]
- Kar, T.K.; Chakraborty, K. Bioeconomic analysis of Maryland’s Chesapeake bay oyster fishery with reference to optimal utilization and management of resource. Int. J. Eng. Sci. Technol. 2009, 1, 172–189. [Google Scholar] [CrossRef] [Scilit]
- Mohsin, M.; Guilin, D.; Zhuo, C.; Hengbin, Y.; Norman, M. Maximum sustainable yield estimates of carangoides fishery resource in Pakistan and its bioeconomic implications. Pak. J. Zool. 2019, 51, 279–287. [Google Scholar] [CrossRef] [Scilit]
- Dewantara, E.C.; Fahrudin, A.; Wahyudin, Y. Maximum economic yield (mey) of stolephorus sp fisheries in the area of fisheries sanctuary of Karang jeruk, Tegal Regency. J. Mar. Fish. Soc. Ecol. Syst. 2019, 29–34. Available online: https://www.semanticscholar.org/paper/Maximum-Economic-Yield-(MEY)-of-Stolephorus-Sp-in-Dewantara-Fahrudin/456d0af11d0e3c914c3742e5e6c0df4c6cc1f742 (accessed on 10 December 2022).
- Shehu, V.; Spaho, A.B. Birfucation analysis as a useful tool for fishery management. J. Nat. Tech. Sci. 2015, 20, 17–26. [Google Scholar]
- Ibrahim, M. An Application of Optimal Control to the Sustainable Harvesting Strategies of Ghana’s Sardinella Fishery. Ph.D. Thesis, University of Cape Coast, Cape Coast, Ghana, 2018; pp. 1–241. [Google Scholar]
- Laham, M.F.; Khrishnarajar, I.S.; Gambo, J.J.; Shariff, J.M. Fish harvesting management strategies using logistic growth model. Sains Malays. 2012, 41, 171–177. [Google Scholar]
- Daci, A. Fish harvesting models and their applications in a reservoir in saranda, albania. J. Multidiscip. Eng. Sci. Technol. (JMEST) 2016, 3, 5279–5282. [Google Scholar]
- Lola, M.S.; Alwi, W.S.W.; Ramlee, M.A.; Zulkifli, F.A.; Noor, C.N.; Ibrahim, Y.; Abdullah, M.T. A system dynamic of the harvesting strategies to sustain the population of squid using logistic growth model. J. Phys. Conf. Ser. 2020, 1613, 012072. [Google Scholar] [CrossRef] [Scilit]
- The World Bank; FAO. The Sunken Billions: The Economic Justification for Fisheries Reform; Agriculture and Rural Development Series; World Bank: Washington, DC, USA, 2009; ISBN 9780821377901. [Google Scholar]
- Dutta, S.; Al Harthy, M.; Al Jufaili, S.M.; Al Abri, I. Multispecies fisheries management of the Sultanate of Oman using bioeconomic mode. Heliyon 2025, 11, e41751. [Google Scholar] [CrossRef] [Scilit]
- Dutta, S.; Abri, I.; Paul, S. Bio-economic trends of Hilsa (Tenualosa ilisha) fishery: Perspectives of transboundary management between India and Bangladesh. Mar. Policy 2021, 128, 104483. [Google Scholar] [CrossRef] [Scilit]
- Haryanto, T.; Rahmawati, Y.; Kusumawardani, D.; Martina, A.; Ichsan, A.K.N.; Erlando, A.; Ibrahim, K.H. Balancing economic returns and conservation: A bioeconomic assessment of Sardinella lemuru fisheries management in Muncar, Banyuwangi, Indonesia. Soc. Sci. Humanit. Open 2025, 11, 101277. [Google Scholar] [CrossRef] [Scilit]

Disclaimer/Publisher’s Note: The statements, opinions and data contained in all publications are solely those of the individual author(s) and contributor(s) and not of MDPI and/or the editor(s). MDPI and/or the editor(s) disclaim responsibility for any injury to people or property resulting from any ideas, methods, instructions or products referred to in the content. |
© 2026 by the authors. Licensee MDPI, Basel, Switzerland. This article is an open access article distributed under the terms and conditions of the Creative Commons Attribution (CC BY) license.