


Abstract
The critical role of green consumption in mitigating carbon emissions is widely acknowledged. As a prerequisite for green consumption, consumer green awareness (CGA) plays a pivotal role in advancing sustainable development. This study constructs a comprehensive indicator system for CGA from the three dimensions of “antecedent-behavior-outcome” and measures the CGA levels of 30 provinces in China from 2014 to 2022. Using the Theil index, kernel density estimation, Moran’s I, and Markov chain methods, we analyze its spatiotemporal evolution characteristics. Furthermore, spatial econometric models are applied to explore its driving factors. The results show that China’s CGA exhibits sustained growth during the study period, but regional disparities are widening, driven by inter-regional rather than intra-regional differences. Moreover, China’s CGA gradually demonstrates the long-tailed and multimodal distribution, accompanied by emerging spatial clustering effects. In terms of transition dynamics, CGA demonstrates a short-term “gradient lock”, which is substantially alleviated when spatial spillover effects are incorporated. Additionally, we find that economic development, the advancement of emerging industries, accelerated urbanization, emphasis on education, and policy guidance significantly promote CGA, while overconsumption inhibits CGA. Among these factors, economic development, informatization, e-commerce, education, and policy guidance show significant spillover effects.
1. Introduction
The annual increase in carbon emissions is a major contributor to global warming, causing significant harm to the ecological environment and threatening the sustainable development of human society [1,2]. Environmental economists therefore have made various efforts to reduce carbon emissions from human activities. Notably, most existing studies focus on carbon reduction from the production side. But it is important to recognize that consumption ultimately drives production [3], shaping the direction of industrial development. In this sense, consumption is the root cause of carbon emissions in the economy.
Consumption’s role in driving emission growth is widely recognized. At the global level, in 2007, 60% of greenhouse gas emissions were generated directly or indirectly by household consumption [4]. By 2020, the United Nations Environment Programme (UNEP) notes that household consumption accounts for about two-thirds of global greenhouse gas emissions. Similarly, in China, household-related carbon emissions have already exceeded half of the total carbon emissions [5]. Consequently, Song et al. [6] conclude that residential consumption is the main driver of carbon emission growth.
Despite these findings, the literature addressing consumer-driven carbon emissions remains limited. According to Gaur et al. [7], the development of the green economy primarily involves three key stakeholders: the government, enterprises, and consumers. Much of the literature validates the importance of governments and enterprises for green development in many aspects, such as promoting green innovation [8,9], enhancing total factor productivity [10], and improving energy efficiency [11]. But literature on consumer impacts on the economic system is relatively limited. Studies have focused on the theoretical level, while empirical evidence is scarce [12,13]. This limitation largely stems from privacy-related data constraints, yet neglecting consumption renders carbon mitigation research incomplete.
Green consumption also referred to as low-carbon or sustainable consumption, was first officially introduced in The Green Consumer Guide issued by the United Kingdom in 1987. Subsequently, Agenda 21, published by the United Nations Conference on Environment and Development in 1992, recognized unsustainable consumption patterns as a root cause of environmental degradation. For consumers, green consumption awareness (CGA) is the key factor guiding purchasing behavior and determining the green level of the consumption process [14,15]. Thus, measuring CGA becomes a critical task. However, most of the existing literature on CGA uses questionnaires for individual level studies [16,17,18]. But this ignores the regional level studies and it is difficult to observe the trend of CGA by questionnaire surveys. Some scholars have chosen a single indicator to measure CGA at the city level, such as search index, environmental complaints, etc. [19,20,21]. However, a single indicator also suffers from the defect of under-representation.
Driven by these significant gaps, the primary motivation of this study is to scientifically and accurately measure CGA at the regional level, thereby shifting the focus of carbon mitigation research from the production side to the consumption side. Specifically, our study aims to address the following questions: How to scientifically and accurately measure CGA at the regional level? What are its development characteristics and influencing factors?
To fulfill this motivation, our study analyzes the entire consumption process and constructs a comprehensive indicator system. Based on attribution theory, we selected multiple variables to measure CGA at the regional level. Consequently, this paper adopts a multi-indicator approach, offering a more comprehensive and flexible assessment of CGA than single-indicator or questionnaire-based methods. And unlike questionnaires, this method focuses on the CGA of a region and allows for the exploration of trends in its evolution. Theoretically, our measurement not only addresses the issue of limited consumption data due to privacy concerns but also generalizes the evaluation techniques of environmental awareness, thus providing an alternative reference for scholars seeking to measure the subjective awareness of economic agents.
We use China as a case study based on panel data from 30 provinces from 2014 to 2022, and measure the CGA by the entropy approach. Simultaneously, by the Theil index, we estimate the regional heterogeneities in CGA. Furthermore, we show the spatiotemporal evolution characteristics of CGA using kernel density estimation, Moran’s I and Markov chain method. Finally, the analysis explores the factors influencing CGA by spatial econometric models. Crucially, while focusing on China—the world’s largest carbon emitter—this research holds significant global implications. Our multi-indicator CGA framework can be adapted to other countries, providing a valuable paradigm for emerging economies facing the dual challenges of economic growth and emission reduction. Ultimately, it offers globally applicable insights for shifting environmental policies from production-side to consumption-side interventions.
Based on these analyses, the contributions of this paper are outlined as follows. First, this paper analyzes the entire process of consumption based on the complete attribution model and proposes a theoretical framework for measuring CGA, which enriches the assessment system of CGA and expands the research on carbon emission reduction on the consumption side. Second, compared with the existing literature on CGA measurement, the measurement methodology in this paper overcomes the problems of the questionnaires’ difficulty in measuring the entire regional level and the under-representation of a single indicator. Thus, it provides an indicator system for measuring CGA at the regional level and extends the study of CGA to the macro level. Third, this paper employs panel data from 30 Chinese provinces to evaluate the development status of CGA and identify its influencing factors. It provides insights for relevant policy-making and lays the foundation for future research on the interactions between CGA and the environment.
2. Literature Review
2.1. The CGA Theory
Green consumption refers to the conscious choice and adoption of consumption behaviors and decisions that minimize negative impacts on the environment (e.g., reducing resource consumption, pollution and waste) throughout the life cycle of product acquisition, use and disposal [14]. Therefore, green consumption has become an indispensable part of environmental economics, and it is paid great attention by more and more countries as an important way to meet the goal of energy saving and emission reduction [22,23]. Generally, it is agreed that CGA is the engine of driving green consumption [24]. Empirical findings further support this connection. Lee [25] and Yue et al. [26] find that green-aware consumers have higher willingness to pay for green products and increase green consumption. Shehawy and Khan [27] also demonstrate that CGA strengthens consumers’ preference for low-carbon products and has a positive moderation effect on green consumption. Thus, CGA is considered a prerequisite for green consumption patterns, and as a variable, it is incorporated into mathematical models from multiple dimensions. For the government, subsidizing green consumption can guide consumers toward purchasing green products, increase the market share of green products for enterprises [12], and enhance corporate green innovation efforts [28]. For the industry, using the theory of complex network evolutionary games, Fan et al. [29] prove that CGA boosts the market share of new energy vehicles. For macroeconomics, CGA encourages consumers to choose products produced with low-carbon technologies [13], which provides incentives for enterprises to adopt green technologies in production and to upgrade the greening of products [30,31], playing a positive role in accelerating the green transition of economy.
These studies provide theoretical support for the positive effect of CGA on the green economy. However, less literature has empirically verified the causal relationship between CGA and ecological environment, especially at the regional level. The reason for this is the lack of measures of CGA at the regional level. There remains an urgent need to develop scientific and reasonable methods for measuring CGA and to identify incentives that can effectively enhance CGA, thereby encouraging green consumption.
2.2. Measurement Methods
Furthermore, we turn to the literature on relevant measurement methods. Since CGA is a specific form of environmental awareness in the consumption domain, its measurement methods are derived from environmental awareness. By survey questionnaires, Gadenne et al. [32], Gholami et al. [17], and Yetim and Gur [18] measure the environmental awareness of employees in corporations and conduct some static analyses, and find that environmental awareness positively affects corporate environmental performance. As pointed out in Dabbous et al. [21] and Grechyna [33], the questionnaire survey cannot capture the dynamic changes in environmental awareness. To address this limitation, Abbas et al. [34] and Abis et al. [35] extend the static analysis to the dynamic case with the help of a single economic indicator, such as solid waste or environmental petitions. However, solid waste only reflects environmental awareness at the end of consumption, and the small sample size of environmental petitions may lead to biased estimates. With the development of the internet, search index methods for measuring environmental awareness have gained prominence and are now widely used in empirical studies. Representative works include Kahn and Kochen [20], Dabbous et al. [21] and Tao et al. [36], they measure environmental awareness at the regional level using word frequency of web search terms.
In these papers, environmental awareness refers to public concern for environment issues. There is also some literature has turned their attention to residential consumption and have begun to study CGA. In the same way as measuring environmental awareness, most scholars have used questionnaires to identify individual-level CGA [37,38]. At the regional level, Cao and Gao [39] explore the effect of CGA on residents’ green lifestyles by using the ratio of the bus number to the total number of buses and taxis, extending the discussion of CGA to the city level. Whereas, Cao and Gao’s method only considers green transportation, failing to comprehensively measure CGA. Further, Li and Wang [40] conclude that CGA involves three aspects that are consumption content, consumption concept, and consumption process. Drawing on the methodology of Zheng et al. [41], they use the Baidu index to measure residents’ low-carbon literacy and identify the mediating effect of CGA on green innovation. Although the Baidu index can more comprehensively reflect consumers’ cognitive ability for green consumption relative to Cao and Gao’s method, it is somewhat subjective in terms of search keywords selection. The underlying reason for this is that behavior is a product of awareness and consumption behavior can well reflect CGA, but the Baidu index is not enough to portray consumption behavior.
Summarizing the existing literature, questionnaires have irreplaceable advantages at the micro level, but it is difficult to cope with macro level research. The methods of single economic variable and internet search index have also been tried to be used by some scholars, but there are still some shortcomings. In contrast, this paper makes use of internet keywords search volume, economic indicators and environmental quality indicators to establish the CGA measurement system. This provides a more comprehensive and scientific measure that provides a data base for studying CGA development at the regional level.
2.3. Measurement Dimensions of CGA
Measuring CGA requires knowing which indicators reflect the level of CGA. Survey studies of the past literature can provide some help. First, green cognitive ability, which refers to the extent to which consumers are aware of green knowledge and green products, is considered to be an antecedent of CGA. Pagiaslis and Krontalis [42] and Lin and Niu [43] argue that consumers’ concern about environmental issues and knowledge about the environment directly affect their behavioral intentions, making consumers more inclined to purchase green products. Tan et al. [15] also find that lack of specialized knowledge is a deterrent for consumers to purchase green products. Therefore, by capturing consumers’ knowledge of the environment and green products, it can reflect their green awareness to a certain extent. Second, whether consumers are green aware is also reflected in their behavioral decisions. CGA is an intrinsic driver of green consumption, and higher CGA leads to more green behaviors [44,45]. Similarly, the greener the consumption choices of a region’s residents, the higher the CGA of the region in general. Finally, if a region has a higher level of CGA, i.e., if consumers pay attention to environmental protection in the consumption process, the most direct reflection at the macro level is a cleaner living environment. Studies have shown that consumers with CGA who perceive environmental stress significantly increase their green purchasing behavior to reduce the negative impact on the environment [38,46].
These studies hint at the aspects that can be thought about to measure CGA. Past literature measuring CGA at the regional level has tended to consider only one of these dimensions. Therefore, for the first time, this paper incorporates “cognition-behavior-outcome” into a unified analytical framework, using multiple variables to comprehensively reflect the level of CGA. This not only expands the work at the macro level, but also echoes and complements existing research at the micro level. Specific variable selection and indicator construction will be shown in Section 3.
Research in CGA has yielded some results, but some limitations remain. First, theoretical research on CGA has developed rapidly and has been shown to have important implications for regional economic systems. However, the absence of a unified evaluation method has left empirical evidence scarce. Second, the literature on CGA identification and application at the micro-individual level is well established and many valuable conclusions have been found. However, its research methodology is difficult to extend to the macro level. Finally, a small amount of literature tries to measure CGA at the regional level with some proxy variables, but this cannot fully reflect the level of CGA. In conclusion, the measurement of CGA at the regional level is still in the experimental stage, and the construction of a comprehensive scientific indicator system is the basis for further research on its impact on the economy and society. Therefore, this paper integrates existing studies and proposes an indicator system that comprehensively measures CGA from multiple dimensions. The availability of the indicator system is also examined using China as a case study, thus providing a reference for policy formulation to promote CGA.
3. Materials and Methods
In this section, the construction of the index system, data source and processing, and methods and models used are described in detail.
3.1. The Construction of Evaluation Index System
The basic principles of measuring CGA are grounded in the theory of plain attribution, which attributes the causes of people’s actions in daily life to personal abilities and external environments [47]. Typically, personal cognition drives social behavior, which in turn leads to consequences, and learning from these consequences reshapes cognition, constructing a cognitive loop [48]. This loop is commonly used to analyze the entire process of behavioral attribution [49]. In this study, we operationalize this loop into a logically consistent CGA indicator system. Green consumption cognition ability (GCCA) is the internal prerequisite, representing the psychological attribution of environmental responsibility and knowledge. Green consumption behavior choice (GCBC) is the specific manifestation, where internal cognition is transformed into observable actions under the influence of the external environment. Green consumption environment outcome (GCEO) is the final consequence, reflecting the objective efficacy and environmental feedback of these behaviors. As seen in Figure 1, these three dimensions are not isolated but are theoretically aligned: cognition functions as the internal driver, behavior serves as the medium of expression, and environmental outcome acts as the terminal reflection of the greening process. Moreover, these environmental outcomes offer the necessary feedback to reshape and strengthen consumer cognition. This cognitive loop ensures that each indicator aligns with its dimension’s functional role.
Figure 1.
The entire consumption process under the cognitive loop theory.
Thus, we evaluate CGA from three stages that include GCCA, GCBC and GCEO. Because the consumption behavior includes buying, using, and disposing, GCBC is subdivided into product selection, lifestyle adjustment, and resource usage. Considering variable hierarchy structure and data availability, 14 variables are selected for establishing a comprehensive evaluation index system for CGA (see Table 1).
Table 1.
The index system of CGA.
In the digital era, online search data provides a reliable and objective proxy for capturing individuals’ cognitive focus and information acquisition regarding specific social issues. We employ the Baidu search index to measure GCCA, as it dominated over 80% of China’s search engine market in 2022. Based on government reports (Here, government documents contain the Guidelines on Promoting Green Consumption and the Action Plan for Promoting Green Consumption; research report is the 2016 China Green Consumer Report by Alibaba Research Institute.) and literature [40,50], 59 keywords spanning clothing, food, housing, and transport were selected to capture consumer attention to environmental issues and green products (see Table A1 in Appendix A). Since some keywords (e.g., renewable resource and energy) are highly correlated, a simple summation would compromise measurement accuracy. Therefore, principal component analysis (PCA) is utilized to reconfigure these original variables into a smaller set of uncorrelated comprehensive indexes [51], ensuring that the maximum variance is explained while minimizing redundant information.
GCBC consists of three components. First, green product selection involves green food and electric vehicles (EV). To quantify consumer demand, we compile the provincial counts of officially certified green food products. However, due to the scarcity of officially disclosed EV data, public charging stations are employed as a proxy variable, as their density and infrastructure availability indirectly reflect the regional adoption and usage volume of electric vehicles [52,53]. Second, green lifestyle choices cover transportation and agriculture. We measure transport engagement via electric buses per capita [54,55] and agricultural sustainability through the reduced usage of pesticides and plastic films [56]. Third, green resource utilization emphasizes cleaner alternatives. This is evaluated by the shift from coal and oil to natural gas, the substitution of thermal power with clean energy (hydro, wind, and nuclear), and the reduction in water waste. Consequently, we calculate provincial consumption of coal, gasoline, natural gas, water, and clean power.
CGA is ultimately reflected in the environmental quality. Following the environmental externality theory, we align GCEO with the objective feedback of the consumption process. Specifically, negative indicators are designed to capture the environmental burdens or negative byproducts generated within the consumption loop, while positive indicators reflect the systemic improvements in environmental state and the enhancement of ecological carrying capacity driven by the aggregation of green practices. Following Chen et al. [10] and Peng and Yu [57], we measure the living environment’s quality through the green coverage rate in built-up areas and the total area of green parks, both of which are essential criteria for urban greening levels. Furthermore, domestic waste is regarded as a direct environmental byproduct of the entire consumption process. Grounded in the “3R” principles of sustainable consumption, reducing domestic waste is a critical link in achieving consumption-side reduction [58]. In the Chinese context, the decrease in per capita waste removal effectively reflects consumers’ proactive efforts in waste minimization and resource conservation during and after consumption, serving as an objective measure of the macro-environmental benefits generated by the aggregation of green behaviors [59,60]. Therefore, we employ the volume of domestic waste removal to assess the degree of environmental protection at the consumption endpoint.
3.2. Data Source and Processing
Due to data availability, this study excludes Hong Kong, Macau, Taiwan, and Tibet, focusing on 30 Chinese provinces categorized into four regions (see Figure A1 in the Appendix). Data were synthesized from multiple official sources: Baidu Indexes (mobile and PC combined) were retrieved from Baidu’s official website; green food and charging station data were manually compiled from the Green Food Statistical Yearbook and the China EV Charging Infrastructure Promotion Alliance. Energy, electricity, and environmental metrics (e.g., coal, clean power, electric buses, and waste removal) were sourced from the China Energy Statistical Yearbook, the China Electric Power Statistical Yearbook and the China Environmental Statistical Yearbook. Other data, such as residential water usage and population, are gathered from the China Statistical Yearbook.
In balancing the comprehensiveness of the indicator system with data availability, we select the period from 2014 to 2022. The data undergo the following treatments: First, PCA was used to reduce the dimensionality of Baidu index keywords into a single green awareness level. Second, missing values were filled using local government reports or linear interpolation. Third, population-dependent variables, such as energy usage and charging stations, were converted to per capita values to reflect relative regional levels. Finally, we have panel data for 30 provinces in China from 2014 to 2022.
3.3. Methods
Figure 2 shows the research framework. First, the CGA index for each province is calculated based on the entropy method, and a preliminary analysis is conducted according to the results. Second, kernel density estimation is employed to depict the temporal evolution trend of CGA, and Moran’s I is used to measure its spatial characteristics. The spatial Markov chain is then applied to assess the impact of spatial features on the gradient transfer of CGA. Finally, the Ordinary Least Squares fixed-effects (OLS fe) model and spatial econometric models are used to analyze the influencing factors of CGA.
Figure 2.
The research framework.
3.3.1. Index Measurement
To accurately measure CGA, this study employs the entropy method to assign objective weights to the sub-indicators, inherently reflecting the amount of information contained in the data [61,62].
The specific operation is as follows: The first step is dimensionless processing:
if aij is positively related with CGA,
if aij is negatively related with CGA,
where i and j represent the province and the indicator, respectively; aij′ indicates the indicator after dimensionless quantification.
In the second step, the weights are given by Equation (3)
where
where xij shows the proportion of indicator, sj denotes the information entropy redundancy.
The final step is to calculate the CGA index according to Equation (6)
3.3.2. Regional Disparity Measurement
Building on Theil [63], this paper uses the Theil index to measure intra- and inter-regional disparities in CGA across regions. All provinces are divided into K major regions. nk is the number of provinces in region k, gk is the set of provinces in region k and ACGAk is the average CGA in region k. Denote the inter-regional disparity by Tb, the intra-regional disparity by Tw, and the intra-regional disparity for region k by Tk. The Theil index T for CGA is
where
Further, Equations (11) and (12) demonstrate the contribution rates of intra-regional and inter-regional disparity, respectively,
3.3.3. Kernel Density Estimation
This paper utilizes kernel density estimation to investigate the dynamic distribution characteristics and evolution patterns of CGA. The density function f (CGA) is
where d is the bandwidth, and the Gaussian function is
3.3.4. Spatial Autocorrelation Estimation
Spatial correlation is measured using global Moran’s I (GMI) for overall regional patterns and local Moran’s I (LMI) for individual regions and their neighbors.
where σij is the element in the ith row and the jth column of the standardized spatial weight matrix (σij)n×n. In this paper, we choose the neighbor distance matrix as the spatial weight matrix because, given the relatively small sample size (30 provinces), it effectively captures spatial correlations and offers a more direct economic interpretation of neighboring interactions (For robustness, geographic and economic distance matrices were also employed in the spatial analysis. Detailed results are available upon request).
3.3.5. Spatial Markov Chain
Spatial Markov chain model extends the traditional Markov chain framework by incorporating a spatial lag term, which accounts for the conditional transition probabilities of province i from period t to t + 1 under different spatial contexts. In doing so, it reveals the spatial spillover effects influencing regional development [64]. The specific calculation formula is as follows:
where Ui denotes the number of provinces in state i during period t; Uij represents the number of provinces that are in state i in period t and transfer to state j in period t + 1; and Pij indicates the probability of transfer from state i to state j. In addition, SLi is the spatial lag operator, which is used to calculate the spatial lag value of province i, reflecting the influence of neighboring regions on its state transfers.
3.3.6. Econometric Model
In order to further study the influencing factors of CGA, we construct model (19) as the causal inference benchmark,
where Xjit is the influencing factor j, δt is the year fixed effect, θi is the individual fixed effect, and μit is the error term. Since spatial interactions have an important impact on the influencing factors, we further build the spatial model to obtain robust results. Referring to LeSage and Pace [65] and Wu et al. [66], we need to select an appropriate spatial model from the spatial autoregressive model (SAR), the spatial error model (SEM) and the spatial Durbin model (SDM), where the SAR is
the SEM is
and the SDM is
with W is the spatial weight matrix and εit is a spatially auto-correlated error term. And ρ is the spatial autoregressive coefficient and λ is the coefficient of the spatial error term, which expresses the extent to which changes in variables in one region spill over to neighboring regions.
4. Results and Discussion
4.1. The General Change and Regional Disparity of CGA
The CGA index, calculated using Stata 17.0 and visualized via Python 3.13 (Figure 3), reveals a consistent upward trend across all regions from 2014 to 2022. This growth stems from the strategic emphasis placed on green consumption during the 12th and 13th Five-Year Plans, where incentive policies—including subsidies, carbon trading, and taxation—gradually matured. The marked improvement post-2020 underscores the cumulative effectiveness of Chinese government regulations in institutionalizing sustainable consumption patterns.
Figure 3.
The general change trend of CGA from 2014 to 2022.
However, the spatiotemporal distribution uncovers a widening regional disparity, characterized by a distinct “Matthew effect”. The eastern region’s leadership is driven by the radiation effect of political and economic hubs like Beijing and Shanghai. As early adopters of high-quality development, these centers foster mature green markets and lifestyles, with their CGA values exceeding 0.6 by 2022. This implies that economic capacity and policy pilot programs create a positive feedback loop: advanced economies provide the infrastructure for green choices, which in turn accelerates the cultivation of consumer awareness. In stark contrast, the northeast and western regions remain constrained by structural and environmental barriers. The decline of the three northeastern provinces from the national average in 2014 to lower levels by 2022 reflects a structural inertia common in old industrial bases; their slow industrial transformation hinders the transition from production-oriented to consumption-oriented greening. Meanwhile, the western region exhibits internal divergence. While resource-rich provinces like Sichuan and Yunnan benefit from high ecological endowments, others like Xinjiang and Gansu are hindered by fragile ecosystems and poor infrastructure. This implies that CGA formation is not only driven by income but is also restricted by environmental accessibility—the physical and infrastructural ease of practicing green consumption. Consequently, regional disparities are rooted in the uneven distribution of economic capacity, policy implementation intensity, and market development levels.
Using the Theil index calculated via R 4.3.1, we further decompose the disparity into intra-regional and inter-regional contributions, as illustrated in Figure 4a,b.
Figure 4.
Results of Theil index. Note: the bar graph is the Theil index value, and the line graph is the contribution rate.
By combining Figure 3 with Figure 4a, we observe that while the CGA level is improving nationwide, the growth rates vary across regions, leading to a worsening regional imbalance in CGA. This is consistent with the overall Theil index, which increased over time from 0.0267 in 2014 to 0.0430 in 2022. The increment is caused by the inter-regional disparity of CGA mainly, since the Theil index value of intra-regional disparity fluctuates around 0.02, broadly remaining unchanged. In contrast, the inter-regional disparity of CGA has gradually increased over time, contributing nearly 60% to the overall Theil index by 2022. In each of the four regions, the Theil index of intra-regional disparity fluctuates slightly but the magnitude is minimal (see Figure 4b), which means that the intra-regional disparity of CGA is relatively stable. Additionally, the contribution rate of the intra-regional disparity to the total regional disparity shows a downward trend. In short, the inter-regional disparity in CGA is widening annually, gradually surpassing the intra-regional disparity as the main cause for the overall regional disparity. This indicates that China’s regional policies have fostered synergistic development of CGA within regions, but the synergistic effect between regions needs to be improved. Therefore, subsequent sensitization and outreach to the lagging regions of CGA should be stepped up to prevent the gap from widening further.
4.2. The Dynamic Evolution of CGA
To discover the dynamic evolution of the regional disparity of CGA, this section explores the distribution dynamics and evolutionary trends both nationally and regionally by examining the kernel density estimation using R, with the results as depicted in Figure 5a,b. From 2014 to 2022, the national distribution curve’s center notably shifted to the right, a trend that was mirrored in all four regions, indicating an enhancement in CGA. This proves that the result in Figure 3 is robust.
Figure 5.
Dynamic evolution of CGA.
Between 2014 and 2015, the national CGA exhibited an evenly distributed unimodal pattern, indicating minimal regional disparities. However, following the 2016 NDRC Guidance on Promoting Green Consumption, the implementation’s varying effectiveness across regions catalyzed a structural shift. From 2016, the distribution transitioned toward a bimodal pattern with an emerging long-tail feature, which further evolved into a trimodal distribution after 2020. This dynamic evolution reflects the gradual expansion of regional disparities alongside the emergence of significant regional agglomeration in green awareness.
The evolution toward a multimodal and long-tailed distribution, as illustrated in Figure 5b, reveals increasing regional heterogeneity in CGA driven by divergent development speeds. In the eastern region, although policy responsiveness is high, internal imbalances persist due to distinct strategic positioning. For instance, under the 2014 Cooperative Development Strategy, Beijing and Tianjin have leveraged high-end services and innovation to lead CGA growth, whereas Hebei’s focus on supporting agriculture and traditional industry has resulted in slower progress, illustrating an intra-regional CGA gap. Conversely, the central and western regions exhibit dispersed, bimodal patterns; while the center shows even growth, the west is characterized by a thick left tail, with only a few hubs like Sichuan and Chongqing achieving high CGA levels. In the northeast, the distribution remains concentrated at lower levels without prominent leading provinces, indicating a lack of regional growth poles.
This divergence reflects the differential timing of policy adoption and the varying industrial capabilities across regions. For instance, while the eastern region capitalizes on its high-end service industries to lead the green transition, the northeast and parts of the west face a path dependency trap due to their reliance on traditional heavy industry. This suggests that policy interventions should not only focus on awareness promotion but also on structural industrial upgrades to facilitate a nationwide green transition.
4.3. The Spatial Correlation of CGA
The kernel density estimations with multimodal distribution suggest the regional agglomeration of CGA in China, and the agglomeration effect is an important instrument for analyzing the spatial correlation pattern in ecological economics. In the following, we calculate Moran’s I using Stata 17.0 to test the spatial correlation of CGA. The global Moran’s I is computed in Table 2. The global Moran’s I remains positive and increases annually from 0.117 in 2014 to 0.447 in 2022, which is consistent with Chinese reality. The gradual improvement of infrastructure has shortened the spatial distance between provinces. As a result, neighboring provinces increasingly cooperate in green development [67], leading to an increase in the spatial correlation of CGA. During 2014–2022, the document of the 2016 Guidance on Promoting Green Consumption acts as a catalyst that accounts for the significance of spatial correlation in CGA. This indicates that after 2016, CGA exhibited a pronounced spatial clustering effect.
Table 2.
The global Moran’s I of CGA.
By calculating the local Moran’s I, regions are categorized into four quadrants (see Figure 6). Over time, there is a noticeable increase in the number of regions in the HH and LL quadrants, and a decrease in the HL and LH quadrants. It suggests that neighboring regions’ CGA is becoming more homogenous and the CGA shows a significant HH and LL spatial club phenomenon.
Figure 6.
The scatterplots of local Moran’s I. Note: High-High (HH) areas, Low-High (LH) areas, Low-Low (LL) areas, and High-Low (HL) areas are located in the first, second, third, and fourth quadrants in sequence. Regions in HH have high CGA and the surrounding regions have high CGA, regions in LH have low CGA but the surrounding regions have high CGA, regions in LL have low CGA and the surrounding regions also have low CGA, and regions in HL have high CGA and the surrounding regions have low CGA.
Using the natural breaks classification method, CGA is divided into four classifications that are low, lower-middle, upper-middle, and high, with CGA index intervals respectively [0.1242, 0.2250], (0.2250, 0.3181], (0.3181, 0.4337], and (0.4337, 0.6643]. The spatial distribution maps are plotted in Figure 7 by ArcGIS Desktop 10.8. In 2014, the majority of provinces had low CGA levels, with only a few reaching the lower-middle level, and no club effect was observed. By 2017, more provinces achieved the lower-middle CGA level, and at the lower-middle level, agglomeration occurred in the eastern coastal and central-western provinces. By 2020, the number of upper-middle level provinces increased, with Beijing and Shanghai evolving into high-level provinces, while most provinces in the northwest and northeast remained at low and lower-middle levels, and agglomeration became more pronounced in the eastern region. By 2022, several high-level provinces had emerged in the eastern coastal area, and central provinces mostly transitioned from lower-middle to upper-middle level.
Figure 7.
The spatial distribution maps of CGA.
In contrast, the northwest and northeast regions remained at the lower-middle level, with Xinjiang as the only province at the low level. Intuitively, the club pattern of China’s CGA development has formed, with high in the east and low in the west. This may be due to the more developed economy and green market in the eastern coastal areas, which encourages consumers to accelerate the formation of green awareness. Moreover, with the concept of “innovation, coordination, greenness, openness and sharing” and the strategy of coordinated regional development being put forward one after another, the integrated development of the region is constantly being promoted, resulting in the phenomenon of spatial agglomeration and reaffirming the significant regional disparity in CGA in China.
4.4. Spatiotemporal Transfer of CGA
After examining the dynamic evolution and spatial distribution of CGA, this section further investigates the spatiotemporal transfer characteristics of CGA from 2014 to 2022 using a Markov chain method. Following the method used by [68], CGA values are divided into four levels (I–IV) from low to high based on the natural breaks classification method (The paper also uses the quartile method as a robustness check, and the conclusions remain consistent. Due to space limitations, the corresponding results are not reported, but are available upon request). Using MATLAB R2022b, Table 3 reports the Markov transfer matrix. The diagonal elements represent the probability that a province maintains its current level in the following year, while the upper and lower triangular matrices indicate the probabilities of upward and downward transfers, respectively. Overall, the transfer probabilities of CGA across all levels are mainly concentrated along the diagonal, suggesting that the transfer process exhibits strong stability and path dependence [69]. Nevertheless, a certain degree of upward mobility still exists among the different levels. Specifically, CGA demonstrates a steadily improving trend, with downward transfers being extremely rare. The diagonal probabilities of the four levels are 76.54%, 80.36%, 63.89%, and 100%, respectively, revealing a clear “gradient lock” effect. Moreover, almost no cross-gradient transfers occur, indicating that regions with low CGA levels can hardly achieve substantial improvement in the short term.
Table 3.
Markov transfer matrix of CGA.
Based on the spatial Markov chain, Table 4 further illustrates the state transfer characteristics after incorporating spatial effects. Overall, the differences in transfer probabilities under various types of spatial lags indicate that the evolution of CGA exhibits significant spatial heterogeneity. The development of each region is not isolated but is influenced by the states of its neighboring areas. It can be observed that when neighboring provinces are at higher development levels, the probability of upward transfer from lower levels increases substantially. For instance, when the neighboring level is in stage III, the probabilities of transferring from lower to higher levels are 100%, 45.45%, and 55.56%, respectively—considerably higher than those when the neighboring level is lower. These analyses indicate that CGA exhibits significant path dependence and neighborhood effects, echoing the demonstration effect in environmental economics. Provinces with high-level neighbors benefit from shared green infrastructure and cross-border information flows, which significantly facilitate the diffusion of green values. However, the observed “gradient lock” also warns of a spatial poverty trap: regions surrounded by low-CGA neighbors may struggle to escape their status without external intervention. This underscores the necessity of moving beyond localized policies to embrace integrated regional governance.
Table 4.
Spatial Markov transfer matrix of CGA.
4.5. The Influencing Factors of CGA
In order to determine the optimal spatial econometric model, referring to Zou et al. [70] and Liu et al. [61], the LM test is performed on the OLS regression to determine whether there is a spatial lag term or a spatial error term.
In Table 5, significant LM-error and LM-lag indicate that the spatial lag term and the spatial error term coexist, and significant Robust LM-error and insignificant Robust LM-lag show that SEM is more appropriate than SAR. Notably, SEM and SAR can be evolved from SDM. According to Bai et al. [71] and Weng et al. [72], the Wald and LR tests confirm that SDM is more applicable than SEM. Hence, we finally use SDM to diagnose the influencing factors of CGA. Considering the robustness of the results, SEM is also employed as a suboptimal model. The goodness of fit for both models is evaluated using the AIC and maximum likelihood estimation [33,73].
Table 5.
The spatial econometric model specification.
Based on government documents (The government documents include the Guidelines on Promoting Green Consumption, China’s Green Consumption, the Implementation Plan for Promoting Green Consumption, the 2016 China Green Consumer Report and the Environmental Impact Report of E-commerce) and previous papers [74,75,76,77,78,79,80,81,82,83], the explanatory variables selected include the level of economic development (Econ), the level of informatization (Infor), the level of e-commerce development (E_com), the emphasis degree on education (Edu), the urbanization level (Urban), the industrial structure (Str), the population size (Pop), the social consumption level (Consum), and the policy guidance (Gpolicy). Table A2 and Table A3 in the Appendix A present the measurement, data source, and descriptive statistics of the explanatory variables. Using Stata 17.0, a collinearity analysis is performed in Table 6, and it indicates that the variance inflation factors are all below 10 [84].
Table 6.
VIF test.
In column (1) in Table 7, the results in the OLS FE model reveal that all explanatory variables are statistically significant, where economic development level, informatization, e-commerce development, emphasis on education, industrial structure upgrade, policy guidance, and social consumption level are found to positively influence CGA, whereas urbanization level and population size have a negative impact. Typically, green consumption, a more advanced consumption pattern, only emerges when social consumption reaches a certain level, yet overconsumption contradicts the essence of green consumption [85]. While urbanization has been controversial for its environmental impacts, on one hand, it reduces energy use and carbon emissions through enhanced public infrastructure and promotion of public transportation [86]; on the other hand, urbanization increases energy demand, leading to higher carbon emissions [87]. These imply a non-linear relationship between urbanization (or social consumption) and CGA. To explore such nonlinearity, quadratic terms for social consumption level and urbanization are introduced in the OLS FE model (see column (2) in Table 7). It finds that CGA exhibits a U-shaped relationship with urbanization and an inverted U-shaped relationship with social consumption.
Table 7.
Results of factors influencing CGA.
Based on the OLS regression results, the turning point of urbanization is 5.27, and that of consumption is 0.45. Marginal effects plots were then drawn for both variables (Figure 8). The results show that the national average urbanization remains below its turning point, indicating that urbanization is still insufficient and in a rough expansion phase, with its positive effect on CGA yet to be fully realized. Accelerating the development of urban infrastructure and green public services is therefore necessary to cross the turning point and further enhance CGA. Although consumption is also below its turning point, the marginal effect curve shows that its positive impact on CGA is gradually declining, suggesting that excessive consumption may begin to undermine green awareness. Policies should thus promote rational consumption to prevent potential negative effects.
Figure 8.
Marginal effects plots. Note: Red lines is the turning point values, and the blue lines is the actual mean values.
Further, we use spatial econometric models to verify the robustness of the results when the spatial lag term is considered. Columns (3) and (4) show that the SDM has smaller AIC and larger log-likelihood value, proving that the SDM is the better model again. In the SDM, except for policy guidance (This may be due to the fact that policy effects are generally synergistic, and the promotion effect of policies is diluted by the spatial lag term and thus becomes insignificant), other influences remain significant, and ρ is significantly positive, indicating that CGA in one region has a significant positive spillover to CGA in its neighboring regions.
When the model includes a spatial lag term, the coefficients of the explanatory variables overlook the feedback effect, where a region’s independent variables influence local CGA by affecting the CGA of neighboring regions. Therefore, we further decompose the effects of the SDM (see columns (1)–(3) of Table 8). It can be obtained that all variables in the direct effect have significant effects on the CGA with the same sign as the benchmark regression.
Table 8.
SDM decomposition.
Furthermore, the SDM decomposition results show that economic development, informatization, e-commerce development, education, and policy guidance have a positive impact on the CGA of neighboring provinces. These positive spillover effects appear to operate through multiple channels. Economic development in one province can generate income and industrial spillovers that enhance access to green products and services in neighboring regions, thereby promoting CGA. Informatization and e-commerce overcome geographic constraints, facilitating the flow of information, technology, and green commodities across regions, which supports the diffusion of green consumption practices [81]. Similarly, higher emphasis on education and coordinated policy guidance can influence neighboring provinces through knowledge dissemination and cultural communication, reinforcing local awareness and environmentally friendly behavior [33]. In contrast, variables with strong local specificity—such as urbanization, social consumption, industrial structure, and population size—primarily affect CGA within the province, with limited or negligible impact on neighboring regions.
In summary, economic development accelerates the formation of regional CGA, being consistent with Maslow’s hierarchy of needs. In regions with high economic development, consumers who have met their basic material needs begin to care about green development and shape green environmental awareness. Conversely, population density increases the pressure on the regional resources and inhibits the development of CGA. Since informatization plays a critical role in enhancing CGA [88], it raises awareness of environmental issues by disseminating eco-friendly knowledge, prompting changes in consumer awareness, and providing easier access to green products. The development of e-commerce gives green products a better platform for publicity and e-commerce platforms respond to the country’s call to actively practice green philosophy (e.g., green venues and subsidies for green products on Alibaba and JD) to promote green products and drive the formation of CGA. Because an advanced industrial structure offers more green products and services, and gives consumers a greener market, industrial structural upgrade has a positive impact on CGA. Education level and policy guidance influence CGA by moderating their cognition. The higher the level of policy advocacy and education, the more sensitive consumers are to environmental information, making them more willing to accept green consumption patterns and thus engage in green consumption behavior, which is consistent with the findings through a questionnaire survey [37]. However, consumption should be moderate; otherwise, it will weaken CGA. Accelerating the urbanization process, crossing the inflection point, can reduce the negative impact of urbanization on CGA, which aligns with [89]. In addition, economic development level, informatization, e-commerce development, policy guidance and education in a region have a significant impact on the CGA level in neighboring regions. That is, the CGA of one region has the spillover effect on the CGA of its neighboring regions, gradually forming spatial agglomeration.
5. Final Considerations
5.1. Discussion and Main Conclusions
To explore sustainable development from the consumer side, this study developed a multi-dimensional indicator system for CGA encompassing green cognition, behavior, and outcomes. Using China (2014–2022) as a case study to validate this framework, our findings reveal that while national CGA shows a sustained upward trend, a prominent “Matthew effect” has emerged, with widening disparities between the leading eastern region and the lagging western region. The spatial distribution has shifted from centralized to discrete, forming distinct “spatial club effects”—specifically, HH agglomerations in the east and center, and LL agglomerations in the northeast and west. Despite a notable “gradient lock” in short-term state transfers, positive spatial spillover effects significantly enhance the probability of regions transitioning to higher CGA levels. Furthermore, econometric results identify economic development, informatization, e-commerce, education, industrial upgrades, and policy guidance as key positive drivers, whereas overconsumption and population size act as inhibiting factors.
These findings provide deep insights into the underlying mechanisms of CGA formation through the lens of regional heterogeneity and diverse driving factors. The observed “spatial club effect” and “gradient lock” suggest that green awareness is not merely an individual choice but is deeply embedded in regional economic structures and path dependencies. In advanced eastern regions, high levels of informatization and e-commerce act as powerful catalysts, lowering the costs of green information acquisition and fostering a mature green market. Conversely, the lagging CGA in the northeast and west reflects a mismatch between traditional industrial structures and modern ecological needs. Furthermore, the non-linear U-shaped and inverted U-shaped patterns of urbanization and consumption reveal a critical “transformation threshold”: as regions modernize, they initially experience a decline in relative green consciousness due to rapid material expansion, before reaching a pivot point where economic capacity, enhanced by education and policy guidance, aligns with ecological civilization. This underscores that a “one-size-fits-all” approach is insufficient; instead, the evolution of CGA must be viewed as a dynamic interplay between internal resource endowments and external spatial spillovers.
5.2. Policy Recommendations
Based on the empirical findings, several targeted policy recommendations are proposed to foster sustainable consumer behavior. First, it is imperative to implement differentiated regional strategies to mitigate the “Matthew effect” and address the widening inter-regional disparities. For the leading eastern regions, the focus should shift toward high-end incentive mechanisms, such as “Green Credit Points”, to prevent the potential erosion of green awareness caused by overconsumption as incomes rise. Simultaneously, these regions should leverage their advanced e-commerce and information infrastructure to function as regional green product distribution hubs, reinforcing their roles as HH cluster cores. In contrast, for the lagging northeast and western regions, policy efforts must prioritize “filling the gap” by investing in foundational green infrastructure, such as public charging stations and urban green parks, to lower the practical barriers to green behavior. Targeted financial transfers and technical support are also essential to facilitate industrial restructuring in these “old industrial areas”, helping them break out of the current “gradient lock”.
Second, governments should navigate the non-linear transitions of urbanization and consumption by adopting phased intervention strategies based on the identified U-shaped and inverted U-shaped thresholds. As most provinces currently reside on the left side of the urbanization U-shaped turning point, it is necessary to accelerate the transition from “quantity-based” to “quality-based” urbanization. This involves prioritizing green public services and low-carbon transport systems, such as electric buses, to reach the positive-effect zone more efficiently. To address the inverted U-shaped relationship with social consumption, policies should advocate for “rational consumption”. As consumption levels approach the critical turning point, the strategic focus must shift from stimulating volume to enhancing the “green quality” and lifespan of products to prevent awareness erosion.
Third, building on the significant positive spillover effects and “neighboring effects” identified in this study, the establishment of cross-regional coordination mechanisms is essential to break regional isolation. Integrated regional platforms, such as a “Green Consumption Alliance” for the Beijing-Tianjin-Hebei or Yangtze River Delta regions, should be created to facilitate the seamless flow of green technology, information, and educational resources. Furthermore, a spatial compensation mechanism should be developed where CGA-leading provinces provide technical expertise and subsidy support to neighboring lagging provinces. This collaborative approach leverages the spillover power of policy guidance and education to increase the probability of LL clusters transitioning into higher-level development gradients.
Lastly, digitalization and targeted public education must be utilized as primary catalysts to reshape consumer cognition and behavior. Since informatization and e-commerce are proven positive drivers, e-commerce platforms should be encouraged to establish dedicated green product venues and provide digital subsidies, thereby reducing search costs and amplifying the reach of green commodities. Moreover, governments should utilize both traditional and online media to conduct in-depth environmental responsibility education. In areas characterized by high population density or resource stress, advocacy should specifically emphasize the urgency of waste minimization and resource conservation, effectively transforming population pressure into a proactive driver for regional green transitions.
5.3. Limitations and Future Lines of Research
While this study offers meaningful insights into regional CGA, several limitations remain. First of all, due to data availability, new energy vehicles, which symbolize green products, can only be measured using charging stations as a proxy variable, which may affect accuracy. Second, the indicator system in this paper is universal, but the specific selection of indicators is not fixed. The policy recommendations in this paper are based on Chinese data only, which can provide a reference for research in other countries. However, the specific analysis still needs to be combined with the actual situation of the analyzed countries to choose the appropriate data for measurement. Finally, it is worth mentioning that although the indicator system in this paper solves the problem of questionnaire data being difficult to apply to regional studies, both have their own advantages and are complementary rather than substitutes. Despite these limitations, this paper provides insights into the development of regional CGA and constructs a research framework for a consumption-side green economy. Future research could extend the conclusions by refining the indicators to the city level or by applying the indicators to empirical studies.
Several directions merit further investigation in future research. First, future research could draw on the increasingly rich user-generated content available from social media platforms, employing natural language processing (NLP) techniques to profile green preferences across different population segments and thereby illuminate the mechanisms through which CGA propagates and diffuses across social networks. Second, subsequent studies could exploit exogenous green policy shocks as quasi-natural experimental settings, such as green product subsidy schemes or carbon inclusivity program pilots. Building on this, rigorous policy analysis could be applied to identify the causal effects of such interventions on regional CGA. Third, future research could further examine how improvements in CGA feed back into economic sustainable development and environmental quality. This would help situate consumer-side green transitions within the broader framework of ecological civilization and sustainable development goals, ultimately illuminating the bidirectional interactions between CGA and the macroeconomic environment.
Author Contributions
Conceptualization, M.W., Z.T. and C.X.; methodology, Z.T., C.X. and Y.H.; software, Z.T., C.X. and Y.H.; formal analysis, M.W. and Z.T.; investigation, Z.T. and C.X.; data curation, Z.T.; writing—original draft preparation, Z.T.; writing—review and editing, M.W., C.X. and Y.H.; visualization, M.W., Z.T. and C.X.; supervision, M.W. and Y.H.; funding acquisition, M.W. All authors have read and agreed to the published version of the manuscript.
Funding
This research was funded by the National Natural Science Foundation of China (No. 71971062, 72473132).
Institutional Review Board Statement
Not applicable.
Informed Consent Statement
Not applicable.
Data Availability Statement
The data presented in this study are available on request from the corresponding author.
Conflicts of Interest
The authors declare no conflicts of interest.
Appendix A
Table A1.
Keywords selection.
Figure A1.
The four geographical regions in China.
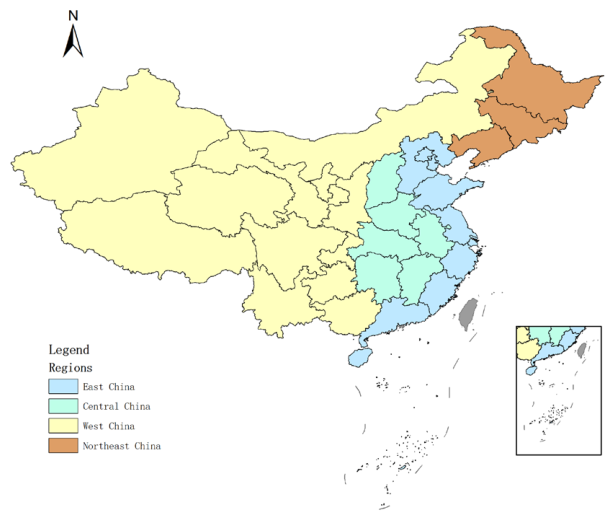
Table A2.
The list of explanatory variables.
Table A3.
Descriptive statistics of influencing factors.
References
- Rode, A.; Carleton, T.; Delgado, M.; Greenstone, M.; Houser, T.; Hsiang, S.; Hultgren, A.; Jina, A.; Kopp, R.E.; McCusker, K.E.; et al. Estimating a social cost of carbon for global energy consumption. Nature 2021, 598, 308–314. [Google Scholar] [CrossRef] [Scilit]
- Zhao, X.; Lu, W.J.; Wang, W.; Hu, S. The impact of carbon emission trading on green innovation of China’s power industry. Environ. Impact Assess. Rev. 2023, 99, 107040. [Google Scholar]
- Shao, C.; Lin, S. Do psychological costs matter? The mechanism of perceived value on green consumption behaviour. Humanit. Soc. Sci. Commun. 2024, 11, 1490. [Google Scholar] [CrossRef] [Scilit]
- Ivanova, D.; Stadler, K.; Steen-Olsen, K.; Wood, R.; Vita, G.; Tukker, A.; Hertwich, E.G. Environmental impact assessment of household consumption. J. Ind. Ecol. 2016, 20, 526–536. [Google Scholar] [CrossRef] [Scilit]
- Lian, Y.; Lin, X.; Luo, H.; Zhang, J.; Sun, X. Distribution characteristics and influencing factors of household consumption carbon emissions in China from a spatial perspective. J. Environ. Manag. 2024, 351, 119564. [Google Scholar] [CrossRef] [Scilit] [PubMed]
- Song, K.; Qu, S.; Taiebat, M.; Liang, S.; Xu, M. Scale, distribution and variations of global greenhouse gas emissions driven by US households. Environ. Int. 2019, 133, 105137. [Google Scholar] [CrossRef] [Scilit]
- Gaur, J.; Pandey, I.; Hungund, S. Adoption of circular economy: Data-driven strategies based on empirical evidence from Indian consumers. J. Strateg. Mark. 2024, 32, 823–841. [Google Scholar] [CrossRef] [Scilit]
- Liu, L.; Wang, Z.; Xu, J.; Zhang, Z. Green baton: How government interventions advance green technological innovation. Environ. Dev. Sustain. 2023, 25, 11121–11152. [Google Scholar] [CrossRef] [Scilit]
- Li, H.; Lu, J. Driving effect of digital government policy on synergy in corporate pollution reduction, carbon reduction, and green expansion. J. Environ. Manag. 2024, 369, 122301. [Google Scholar] [CrossRef] [Scilit]
- Chen, X.L.; Meng, Q.G.; Wang, K.K.; Liu, Y.F.; Shen, W.F. Spatial patterns and evolution trend of coupling coordination of pollution reduction and carbon reduction along the Yellow River Basin, China. Ecol. Indic. 2023, 154, 110797. [Google Scholar] [CrossRef] [Scilit]
- Bu, C.Q.; Zhang, K.X.; Shi, D.Q.; Wang, S.Y. Does environmental information disclosure improve energy efficiency. Energy Policy 2022, 164, 112919. [Google Scholar] [CrossRef] [Scilit]
- Zhang, Q.; Zhao, Q.H.; Zhao, X.; Tang, L. On the introduction of green product to a market with environmentally conscious consumers. Comput. Ind. Eng. 2020, 139, 106190. [Google Scholar] [CrossRef] [Scilit]
- Busato, F.; Chiarini, B.; Cisco, G.; Ferrara, M. Green preferences. Environ. Dev. Sustain. 2023, 25, 3211–3253. [Google Scholar] [CrossRef] [Scilit]
- Peattie, K. Green consumption: Behavior and norms. Annu. Rev. Environ. Resour. 2010, 35, 195–228. [Google Scholar] [CrossRef] [Scilit]
- Tan, L.P.; Johnstone, M.L.; Yang, L. Barriers to green consumption behaviours: The roles of consumers’ green perceptions. Australas. Mark. J. 2016, 24, 288–299. [Google Scholar] [CrossRef] [Scilit]
- Nguyen, H.V.; Nguyen, C.H.; Hoang, T.T.B. Green consumption: Closing the intention-behavior gap. Sustain. Dev. 2019, 27, 118–129. [Google Scholar] [CrossRef] [Scilit]
- Gholami, R.; Sulaiman, A.B.; Ramayah, T.; Molla, A. Senior managers’ perception on green information systems (IS) adoption and environmental performance: Results from a field survey. Inf. Manag. 2013, 50, 431–438. [Google Scholar] [CrossRef] [Scilit]
- Yetim, M.A.; Gur, F.A. When they are more than just employees: Environmentally conscious decision-making in employee-owned organizations. Bus. Strategy Environ. 2024, 33, 2694–2711. [Google Scholar] [CrossRef] [Scilit]
- Dong, Y.; Ishikawa, M.; Liu, X.; Hamori, S. The determinants of citizen complaints on environmental pollution: An empirical study from China. J. Clean. Prod. 2011, 19, 1306–1314. [Google Scholar] [CrossRef] [Scilit]
- Kahn, M.E.; Kotchen, M.J. Business cycle effects on concern about climate change: The chilling effect of recession. Clim. Change Econ. 2011, 2, 257–273. [Google Scholar] [CrossRef] [Scilit]
- Dabbous, A.; Horn, M.; Croutzet, A. Measuring environmental awareness: An analysis using google search data. J. Environ. Manag. 2023, 346, 118984. [Google Scholar] [CrossRef] [Scilit] [PubMed]
- Han, G.G.; Liu, T.G.; Pang, M.C. Green credit policy and green reconfiguration of export products of Chinese enterprises. J. Quant. Technol. Econ. 2024, 41, 89–110. [Google Scholar]
- Jin, W.; Yang, J.; Wang, C.F. Cost subsidy or environmental regulation? The effects of government interventions on environmental quality and 3BL performance. Int. J. Prod. Econ. 2024, 270, 109180. [Google Scholar] [CrossRef] [Scilit]
- Liu, Z.L.; Anderson, T.D.; Cruz, J.M. Consumer environmental awareness and competition in two-stage supply chains. Eur. J. Oper. Res. 2012, 218, 602–613. [Google Scholar] [CrossRef] [Scilit]
- Lee, S. Consumers’ value, environmental consciousness, and willingness to pay more toward green-apparel products. J. Glob. Fash. Mark. 2011, 2, 161–169. [Google Scholar] [CrossRef] [Scilit]
- Yue, B.; Sheng, G.; She, S.; Xu, J. Impact of consumer environmental responsibility on green consumption behavior in China: The role of environmental concern and price sensitivity. Sustainability 2020, 12, 2074. [Google Scholar] [CrossRef] [Scilit]
- Shehawy, Y.M.; Khan, S.M.F.A. Consumer readiness for green consumption: The role of green awareness as a moderator of the relationship between green attitudes and purchase intentions. J. Retail. Consum. Serv. 2024, 78, 103739. [Google Scholar] [CrossRef] [Scilit]
- Hong, I.H.; Chiu, A.S.F.; Gandajaya, L. Impact of subsidy policies on green products with consideration of consumer behaviors: Subsidy for firms or consumers. Resour. Conserv. Recycl. 2021, 173, 105669. [Google Scholar] [CrossRef] [Scilit]
- Fan, R.J.; Bao, X.G.; Du, K.; Wang, Y.Y.; Wang, Y.T. The effect of government policies and consumer green preferences on the R&D diffusion of new energy vehicles: A perspective of complex network games. Energy 2022, 254, 124316. [Google Scholar] [CrossRef] [Scilit]
- Bi, G.B.; Jin, M.Y.; Ling, L.Y.; Yang, F. Environmental subsidy and the choice of green technology in the presence of green consumers. Ann. Oper. Res. 2017, 255, 547–568. [Google Scholar] [CrossRef] [Scilit]
- Han, X.Y.; Khouja, M.; Liu, X. A dynamic model considering consumer green awareness and environmental subsidy. Int. J. Prod. Econ. 2023, 260, 108840. [Google Scholar] [CrossRef] [Scilit]
- Gadenne, D.L.; Kennedy, J.; McKeiver, C. An empirical study of environmental awareness and practices in SMEs. J. Bus. Ethics 2009, 84, 45–63. [Google Scholar] [CrossRef] [Scilit]
- Grechyna, D. Raising awareness of climate change: Nature, activists, politicians. Ecol. Econ. 2024, 227, 108374. [Google Scholar] [CrossRef] [Scilit]
- Abbas, S.; Kirwan, K.; Lu, D. Measuring the public awareness toward household waste management in Muharraq Governorate-Kingdom of Bahrain. J. Environ. Prot. 2020, 11, 196–214. [Google Scholar] [CrossRef]
- Abis, M.; Bruno, M.; Kuchta, K.; Simon, F.G.; Grönholm, R.; Hoppe, M.; Fiore, S. Assessment of the synergy between recycling and thermal treatments in municipal solid waste management in Europe. Energies 2020, 13, 6412. [Google Scholar] [CrossRef] [Scilit]
- Tao, Y.Q.; Wang, D.J.; Ye, Y.W.; Wu, H.T.; Zhang, Y. The role of public environmental concern on corporate social responsibility: Evidence from search index of web users. Energy Econ. 2023, 126, 107041. [Google Scholar] [CrossRef] [Scilit]
- Yang, M.; Chen, H.; Long, R.; Wang, Y.; Hou, C.; Liu, B. Will the public pay for green products? Based on analysis of the influencing factors for Chinese’s public willingness to pay a price premium for green products. Environ. Sci. Pollut. Res. 2021, 28, 61408–61422. [Google Scholar] [CrossRef] [Scilit]
- Al-Swidi, A.; Saleh, R.M. How green our future would be? An investigation of the determinants of green purchasing behavior of young citizens in a developing Country. Environ. Dev. Sustain. 2021, 23, 13436–13468. [Google Scholar] [CrossRef] [Scilit]
- Cao, X.; Gao, Y. Has the policy of low-carbon city pilot led to a green life? China Popul. Resour. Environ. 2021, 31, 93–103. [Google Scholar]
- Li, S.; Wang, J.W. Low-carbon pilot cities, residents’ low-carbon literacy, and corporate green technology innovation. China Popul. Resour. Environ. 2023, 33, 93–103. [Google Scholar]
- Zheng, S.Q.; Wan, G.H.; Sun, W.Z.; Luo, D.L. Public appeal and urban environmental governance. J. Manag. World 2013, 6, 72–84. [Google Scholar]
- Pagiaslis, A.; Krontalis, A.K. Green consumption behavior antecedents: Environmental concern, knowledge, and beliefs. Psychol. Mark. 2014, 31, 335–348. [Google Scholar] [CrossRef] [Scilit]
- Lin, S.T.; Niu, H.J. Green consumption: E nvironmental knowledge, environmental consciousness, social norms, and purchasing behavior. Bus. Strategy Environ. 2018, 27, 1679–1688. [Google Scholar] [CrossRef] [Scilit]
- Shen, M.; Wang, J. The impact of pro-environmental awareness components on green consumption behavior: The moderation effect of consumer perceived cost, policy incentives, and face culture. Front. Psychol. 2022, 13, 580823. [Google Scholar] [CrossRef] [Scilit]
- Khan, A.N. Elucidating the effects of environmental consciousness and environmental attitude on green travel behavior: Moderating role of green self-efficacy. Sustain. Dev. 2024, 32, 2223–2232. [Google Scholar] [CrossRef] [Scilit]
- Sun, Y.; Liu, N.; Zhao, M. Factors and mechanisms affecting green consumption in China: A multilevel analysis. J. Clean. Prod. 2019, 209, 481–493. [Google Scholar] [CrossRef] [Scilit]
- Heider, F. The Psychology of Interpersonal Relations; John Wiley & Sons Inc.: Hoboken, NJ, USA, 1958. [Google Scholar]
- Hu, Z.; Liu, Y.F. An entire-attribution model for behavior of organization. J. Psychol. Sci. 2009, 32, 154–157. [Google Scholar]
- Yue, T.; Li, M.T.; Wang, Q.R.; Long, R.Y.; Chen, H.; Liu, J.L.; Chen, F. Will residents’ energy-conservation behavior be continued under perception of behavior outcome? The moderating role of attribution style. Resour. Conserv. Recycl. 2023, 189, 106745. [Google Scholar] [CrossRef] [Scilit]
- Wang, J.M.; Wang, J.H. A model of public low-carbon consumption patterns and government regulation policies: An exploratory study based on grounded theory. J. Manag. World 2011, 4, 58–68. [Google Scholar]
- Wang, S.R.; Huang, D.S.; Liang, C. Awareness begets action: Public climate attention and corporate green innovation. Appl. Econ. 2025, 57, 3143–3157. [Google Scholar] [CrossRef] [Scilit]
- Liu, X. The introduction and market expansion effects of green products considering network externalities. Omega 2024, 124, 103017. [Google Scholar] [CrossRef] [Scilit]
- Xiong, Y.Q.; Liu, H. The role and difference of “non-subsidized” policies in the promotion and application of NEV. Sci. Res. Manag. 2022, 43, 83–90. [Google Scholar]
- Li, J.; Gao, L.L.; Hu, X.F.; Jia, J.J.; Wang, S.Y. Effects of personal carbon trading scheme on consumers’ new energy vehicles replacement decision: An economic trade-off analysis. Environ. Impact Assess. Rev. 2023, 101, 107108. [Google Scholar] [CrossRef] [Scilit]
- Zhu, C.X.; Shou, M.H.; Zhou, Y.T.; Li, W.R. Modeling the effect of social media on older adults’ usage intention of public transport. Econ. Anal. Policy 2023, 77, 239–250. [Google Scholar] [CrossRef] [Scilit]
- Zhi, J.; Gao, J.X. Analysis of carbon emission caused by food consumption in urban and rural inhabitants in China. Prog. Geogr. 2009, 28, 429–434. [Google Scholar]
- Peng, S.Y.; Yu, Y.J. Green development efficiency measurement and influencing factors analysis in the Yangtze River economic Belt, China. Ecol. Indic. 2024, 162, 112025. [Google Scholar] [CrossRef] [Scilit]
- Feng, L.Y.; Qin, P. The practical dilemma and obligation approach of household garbage classification. China Popul. Resour. Environ. 2019, 29, 118–126. [Google Scholar]
- Long, L.J.; Wang, X. A study on Shanghai’s ecological well-being performance. China Popul. Resour. Environ. 2017, 27, 84–92. [Google Scholar]
- Ma, Q.S.; Zhang, Y.M.; Hu, F.; Zhou, H.Y. Can the energy conservation and emission reduction demonstration city policy enhance urban domestic waste control? Evidence from 283 cities in China. Cities 2024, 154, 150323. [Google Scholar] [CrossRef] [Scilit]
- Liu, X.G.; Luo, Y.X.; Zhu, Y.F.; Guo, L.Y. Research on the measurement and effects of urban-rural integration and modernization in national central cities. Soc. Indic. Res. 2024, 173, 827–866. [Google Scholar] [CrossRef] [Scilit]
- Liu, K.; Huang, J.; Su, X.; Guo, N.; Xiao, H. The Level of Digital Development in the Host Country and M&A Performance. Discret. Dyn. Nat. Soc. 2025, 2025, 5550724. [Google Scholar] [CrossRef] [Scilit]
- Theil, H. Economics and information theory. J. Oper. Res. Soc. 1967, 18, 328. [Google Scholar] [CrossRef] [Scilit]
- Zhu, B.; Jia, J.; Wang, P. Exploring the drivers for the synergy of pollutant mitigation and carbon reduction: Evidence from Chinese cities. J. Clean. Prod. 2025, 531, 146876. [Google Scholar] [CrossRef] [Scilit]
- LeSage, J.; Pace, R.K. Introduction to Spatial Econometrics; Chapman and Hall/CRC: Boca Raton, FL, USA, 2009. [Google Scholar]
- Wu, R.; Liu, Q.; Wang, H. Spatial spillover effects of ecosystem service values in northeast China tiger and leopard national park based on spatial Durbin model. Ecol. Indic. 2024, 166, 112509. [Google Scholar] [CrossRef] [Scilit]
- Wu, H.; Fang, S.M.; Zhang, C.; Hu, S.W.; Nan, D.; Yang, Y.Y. Exploring the impact of urban form on urban land use efficiency under low-carbon emission constraints: A case study in China’s Yellow River Basin. J. Environ. Manag. 2022, 311, 114866. [Google Scholar] [CrossRef] [Scilit]
- Wu, F.; Wang, C.; Ibrahim, H.; Zhao, J. Research on the spatial and temporal evolution and spatial spillover effects of regional green innovation in China under the ESG context. J. Clean. Prod. 2025, 520, 146116. [Google Scholar] [CrossRef] [Scilit]
- Li, J.; Liu, J. Comprehensive Measures, Regional Differences, and Dynamic Evolution of e-Commerce Level in China Based on the e-Commerce Data of 31 Provinces from 2013 to 2021. Discret. Dyn. Nat. Soc. 2025, 2025, 2791558. [Google Scholar] [CrossRef] [Scilit]
- Zou, Y.F.; Song, M.W.; Zhang, W.Z.; Wang, Z.J. The impact of high-speed rail construction on the development of resource-based cities: A temporal and spatial perspective. Socio-Econ. Plan. Sci. 2023, 90, 101742. [Google Scholar] [CrossRef] [Scilit]
- Bai, J.H.; Wang, Y.; Jiang, F.X.; Li, J. R&D element flow, spatial knowledge spillovers and economic growth. Econ. Res. J. 2017, 52, 109–123. [Google Scholar]
- Weng, C.F.; Huang, J.G.; Greenwood-Nimmo, M. The effect of clean energy investment on CO2 emissions: Insights from a spatial Durbin model. Energy Econ. 2023, 126, 107000. [Google Scholar] [CrossRef] [Scilit]
- Shao, X.F.; Fang, T.S. Performance analysis of government subsidies for photovoltaic industry: Based on spatial econometric model. Energy Strategy Rev. 2021, 34, 100631. [Google Scholar] [CrossRef] [Scilit]
- Meyer, A. Does education increase pro-environmental behavior? Evidence from Europe. Ecol. Econ. 2015, 116, 108–121. [Google Scholar] [CrossRef] [Scilit]
- Schneider, A.; Mertes, C.M.; Tatem, A.J.; Tan, B.; Sulla-Menashe, D.; Graves, S.J.; Patel, N.N.; Horton, J.A.; Gaughan, A.E.; Rollo, J.T.; et al. A new urban landscape in east–southeast Asia, 2000–2010. Environ. Res. Lett. 2015, 10, 034002. [Google Scholar] [CrossRef] [Scilit]
- Pisano, I.; Lubell, M. Environmental behavior in cross-national perspective: A multilevel analysis of 30 countries. Environ. Behav. 2017, 49, 31–58. [Google Scholar] [CrossRef] [Scilit]
- Bakirtas, T.; Akpolat, A.G. The relationship between energy consumption, urbanization, and economic growth in new emerging-market countries. Energy 2018, 147, 110–121. [Google Scholar] [CrossRef] [Scilit]
- Wang, W.Z.; Liu, L.C.; Liao, H.; Wei, Y.M. Impacts of urbanization on carbon emissions: An empirical analysis from OECD countries. Energy Policy 2021, 151, 112171. [Google Scholar] [CrossRef] [Scilit]
- Liu, Z.Y.; Hu, R.C. Study on the influencing factors of consumers’ green consumption behavior: From the e-commerce environment perspective. Ecol. Econ. 2022, 38, 60–67. [Google Scholar]
- Nketiah, E.; Song, H.; Adu-Gyamfi, G.; Obuobi, B.; Adjei, M.; Cudjoe, D. Does government involvement and awareness of benefit affect Ghanaian’s willingness to pay for renewable green electricity. Renew. Energy 2022, 197, 683–694. [Google Scholar] [CrossRef] [Scilit]
- Wang, X.T.; Wang, Z.C.; Li, Y. Internet use on closing intention-behavior gap in green consumption-a mediation and moderation theoretical model. Int. J. Environ. Res. Public Health 2022, 20, 365. [Google Scholar] [CrossRef] [Scilit]
- Srivastava, V.; Gupta, A.K. Price sensitivity, government green interventions, and green product availability triggers intention toward buying green products. Bus. Strategy Environ. 2023, 32, 802–819. [Google Scholar] [CrossRef] [Scilit]
- Chen, L.H.; Haider, M.J.; He, J.Y. Should “green information” be interactive? The influence of green information presentation on consumers’ green participation behavior for driving sustainable consumption of fashion brands. J. Clean. Prod. 2024, 470, 143329. [Google Scholar] [CrossRef] [Scilit]
- Huang, S.; Huang, Y.; Zhang, X.; Sheng, S.; Mao, L.; Huang, X.; Liu, R.; Huang, B. Analysis of the Spatio-Temporal Evolution and Factors Influencing the Freight Network in the Middle Reaches of the Yangtze River. Discret. Dyn. Nat. Soc. 2021, 2021, 1167950. [Google Scholar] [CrossRef] [Scilit]
- Riefler, P.; Baar, C.; Büttner, O.B.; Flachs, S. What to gain, what to lose? A taxonomy of individual-level gains and losses associated with consumption reduction. Ecol. Econ. 2024, 224, 108301. [Google Scholar] [CrossRef] [Scilit]
- Zhang, S.X.; Li, Z.F.; Ning, X.; Li, L. Gauging the impacts of urbanization on CO2 emissions from the construction industry: Evidence from China. J. Environ. Manag. 2021, 288, 112440. [Google Scholar] [CrossRef] [Scilit]
- Chen, J.; Wang, L.G.; Li, Y.Y. Research on the impact of multi-dimensional urbanization on China’s carbon emissions under the background of COP21. J. Environ. Manag. 2020, 273, 111123. [Google Scholar] [CrossRef] [Scilit]
- Wang, Q.; Liu, M.D.; Xu, J.T.; Zhang, B. Blow the lid off: Public complaints, bargaining power, and government responsiveness on social media. Environ. Resour. Econ. 2023, 85, 133–166. [Google Scholar] [CrossRef] [Scilit]
- Pan, Y.J.; Teng, T.W.; Wang, S.P.; Wang, T.T. Impact and mechanism of urbanization on urban green development in the Yangtze River Economic Belt. Ecol. Indic. 2024, 158, 111612. [Google Scholar] [CrossRef] [Scilit]
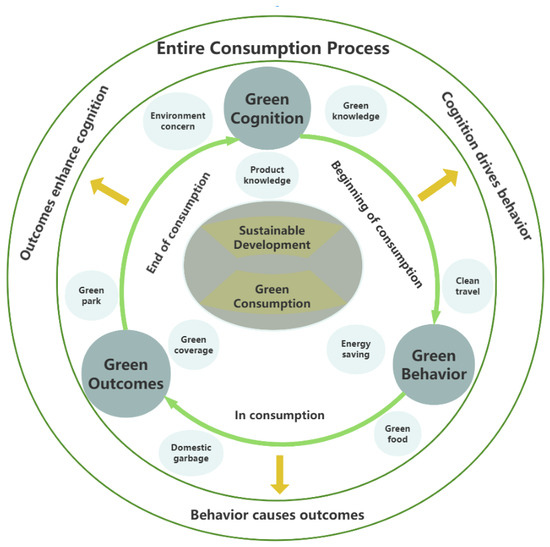
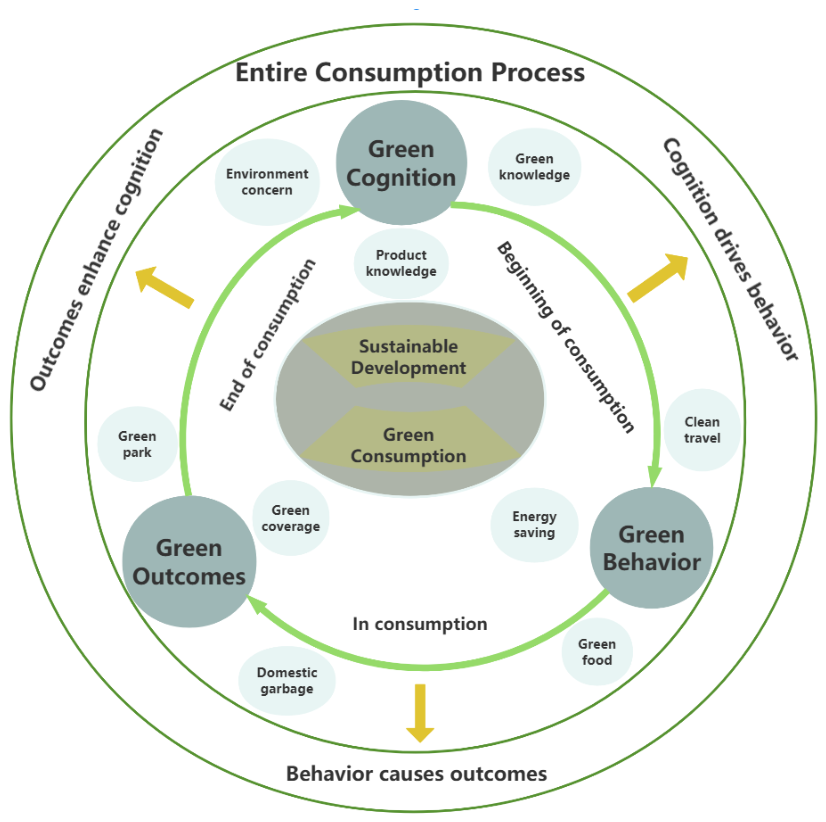
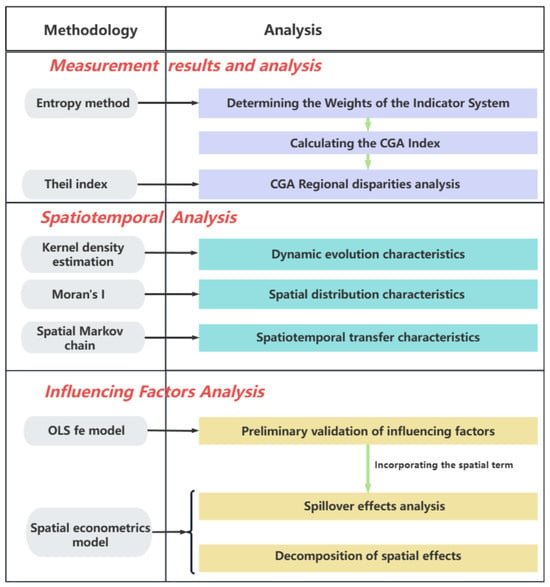
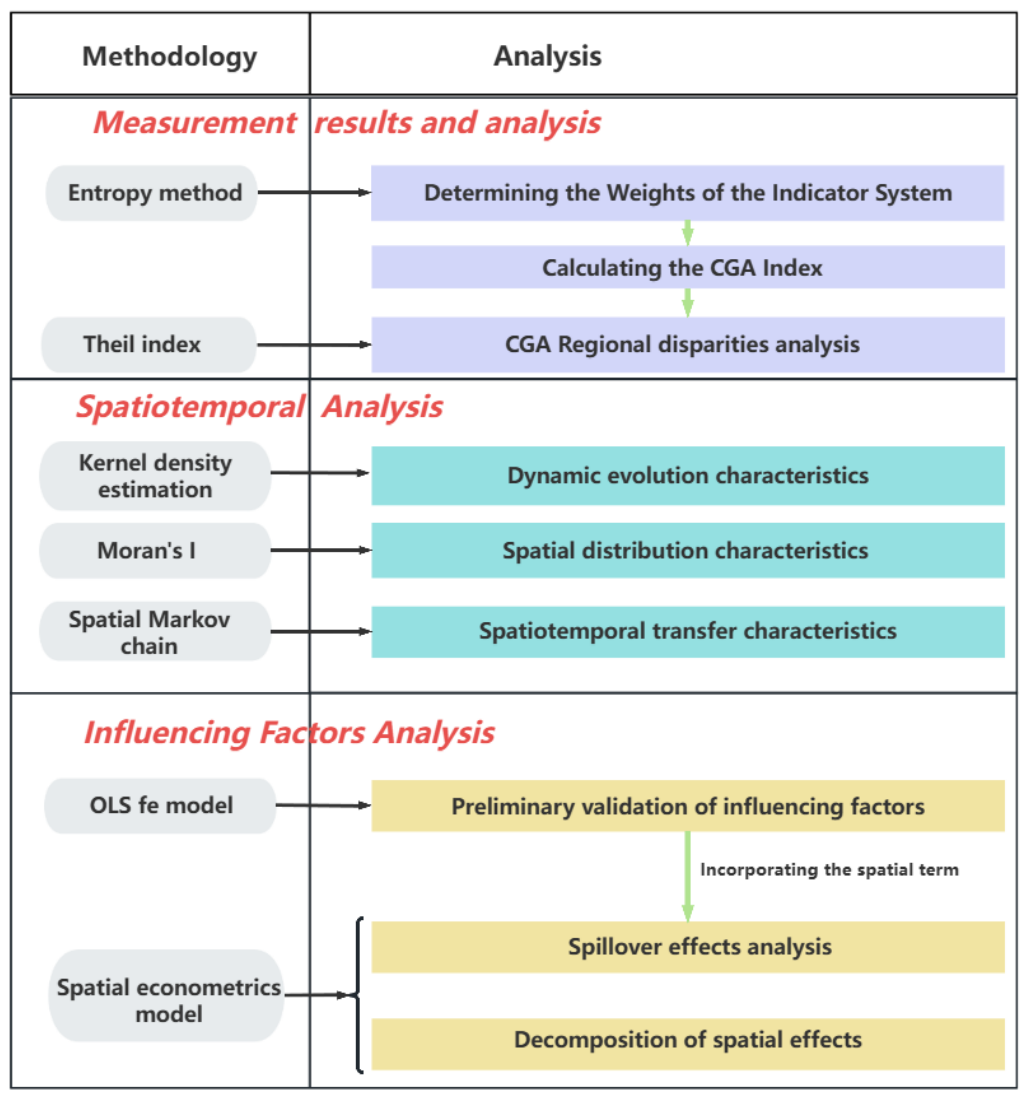
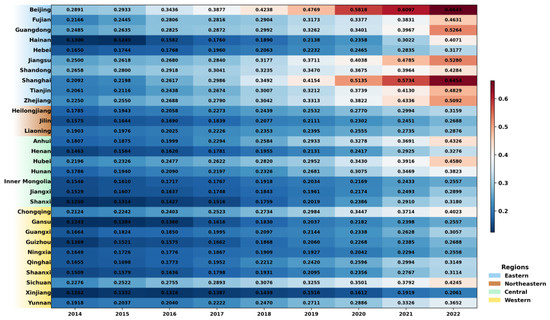
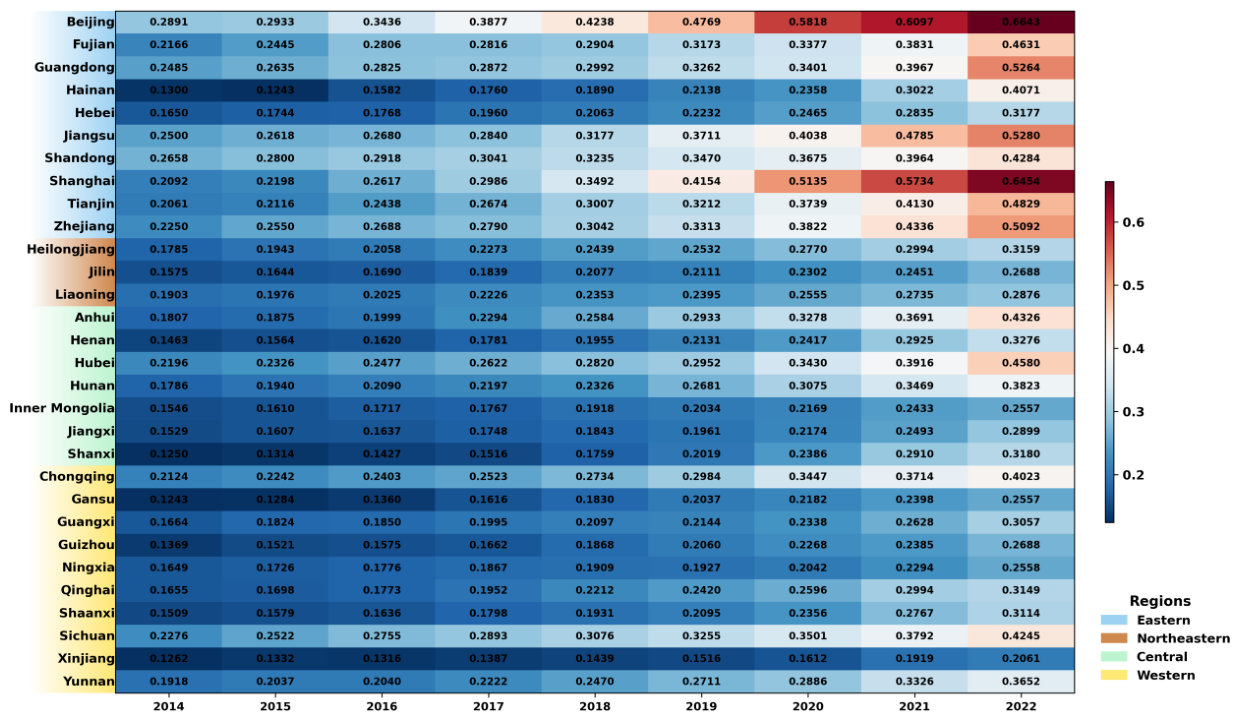
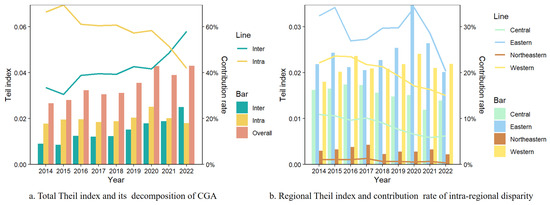
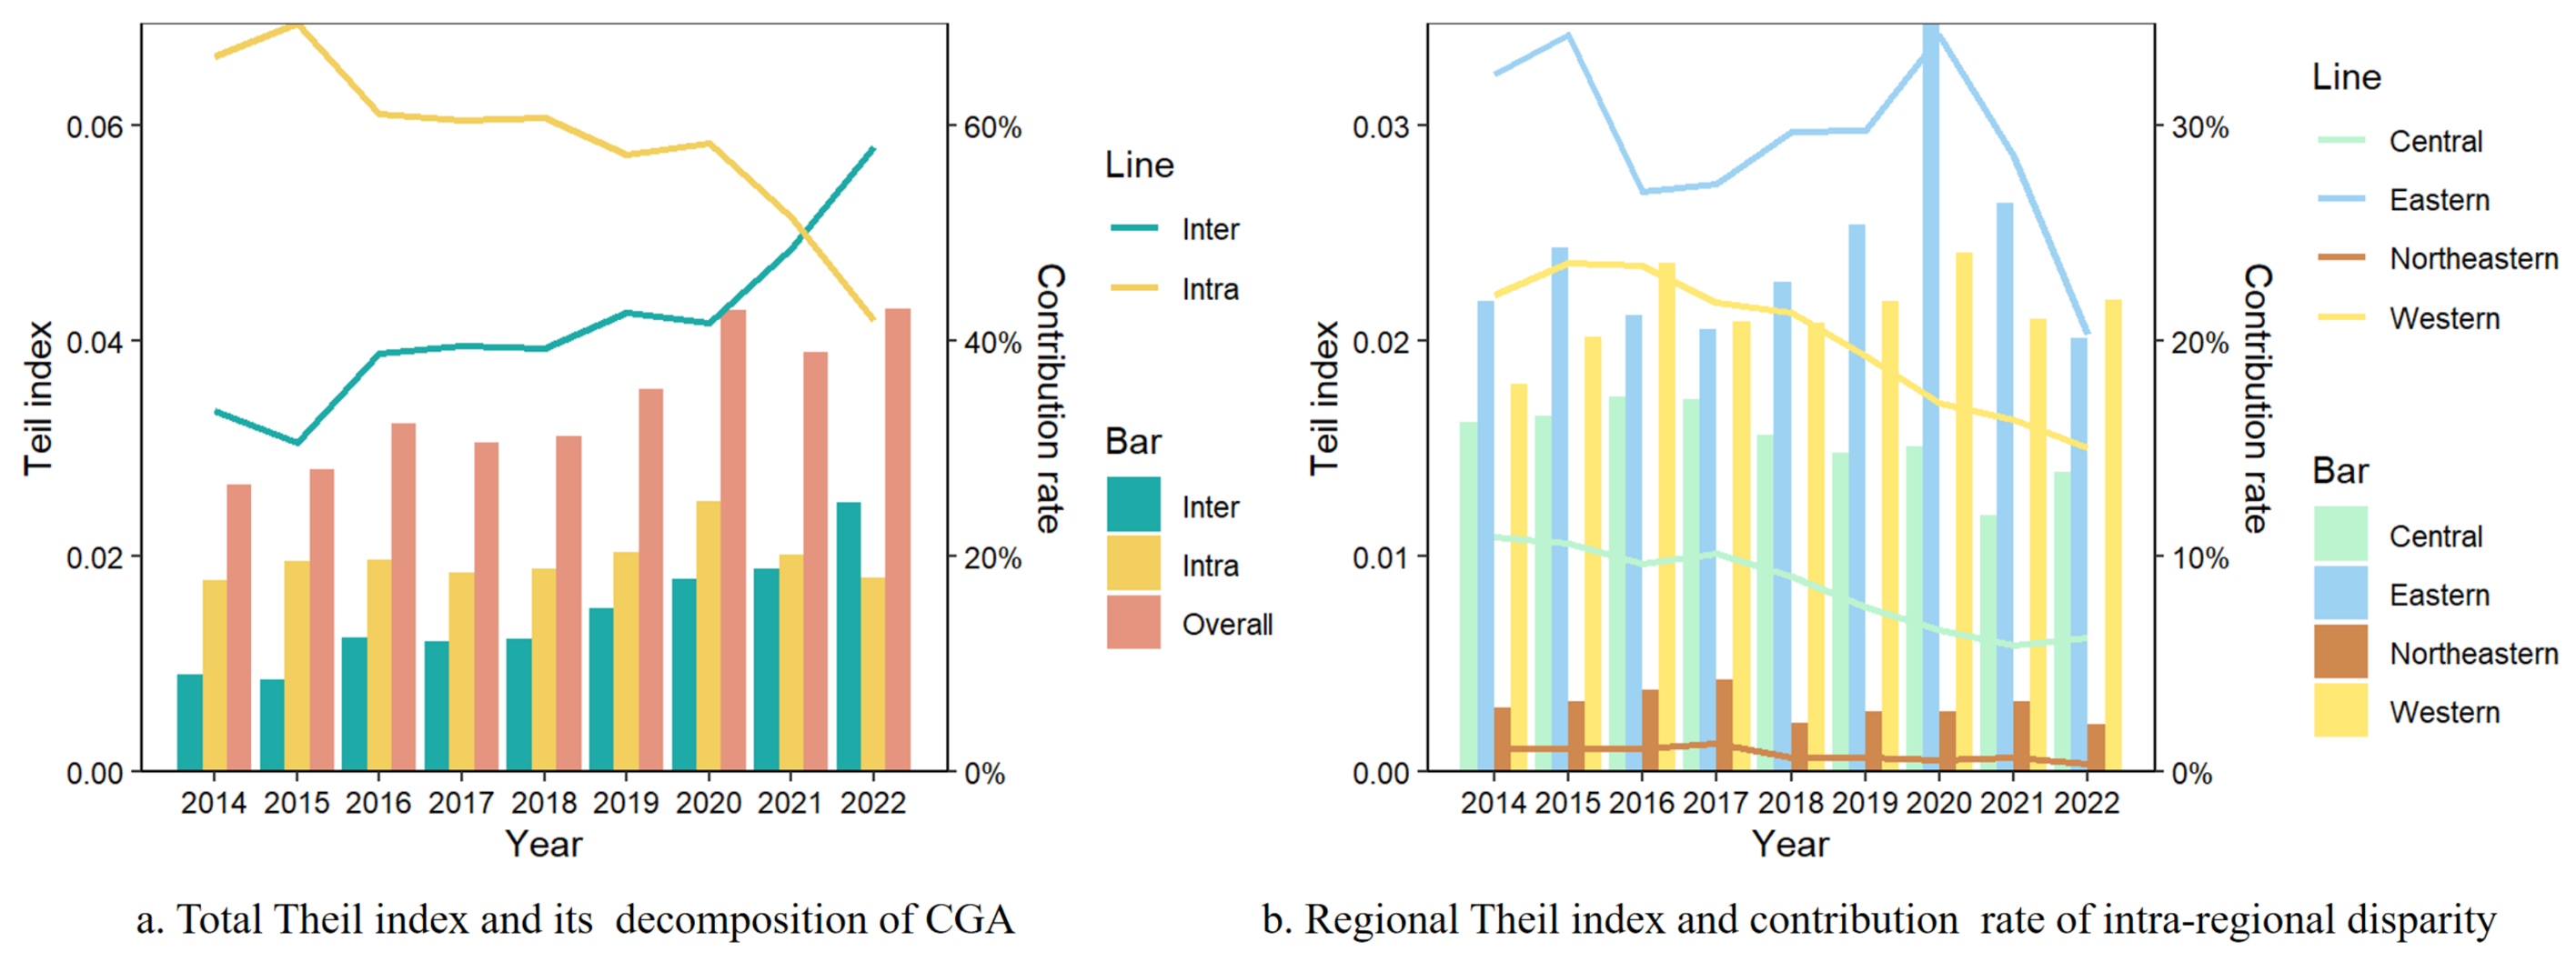
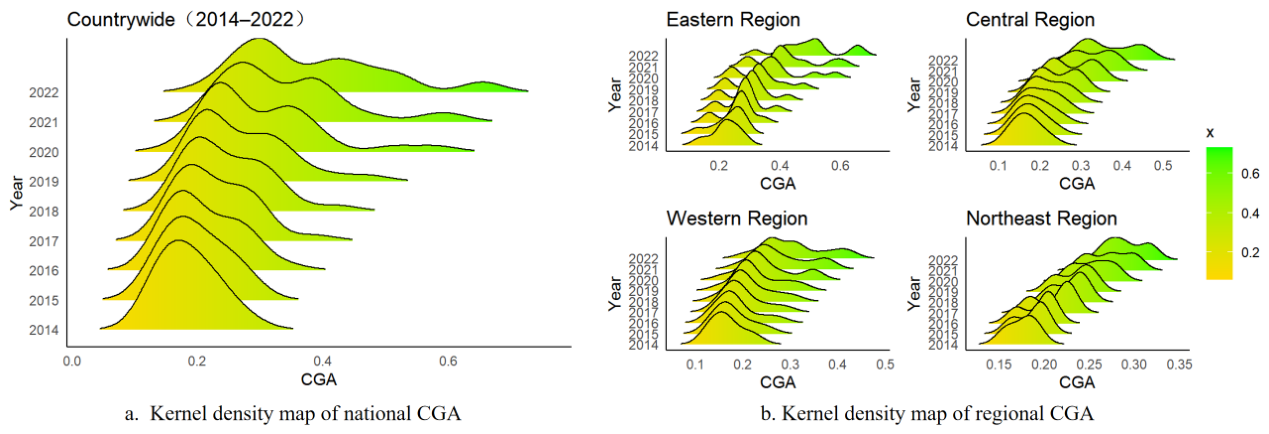
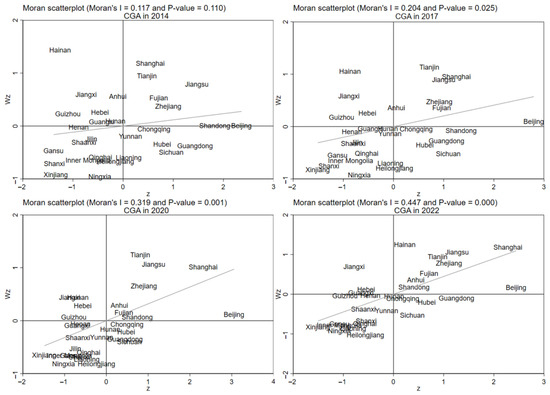
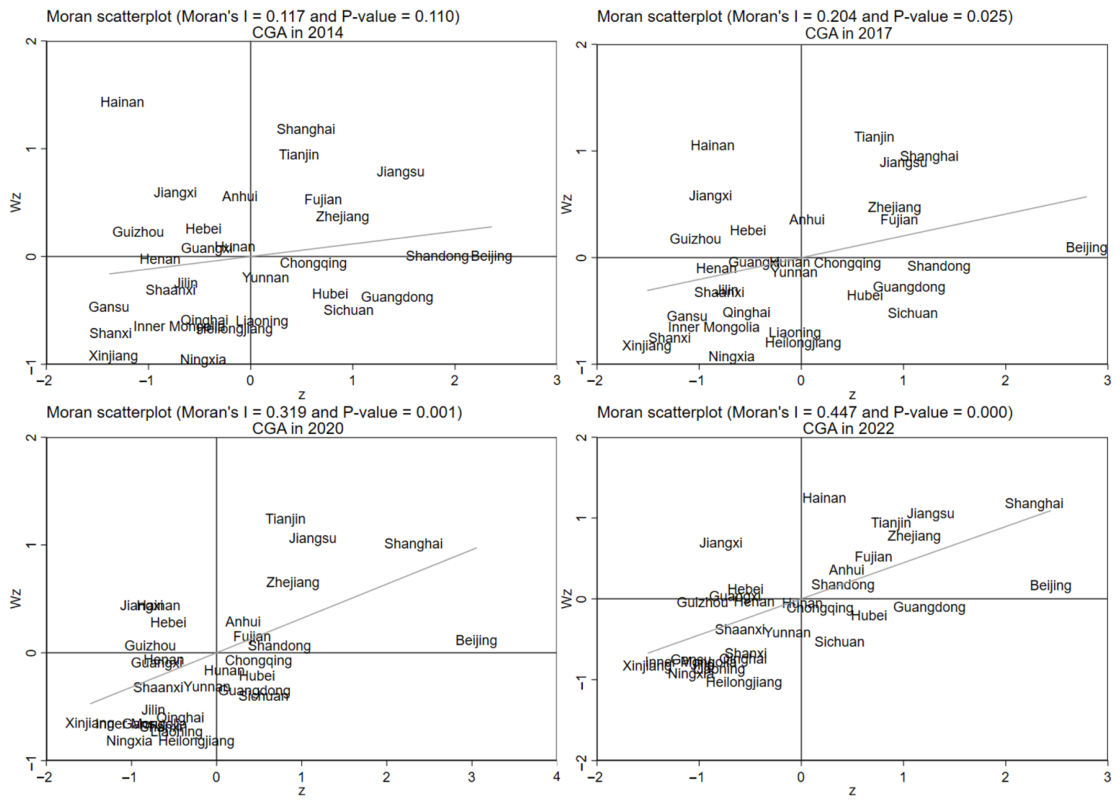
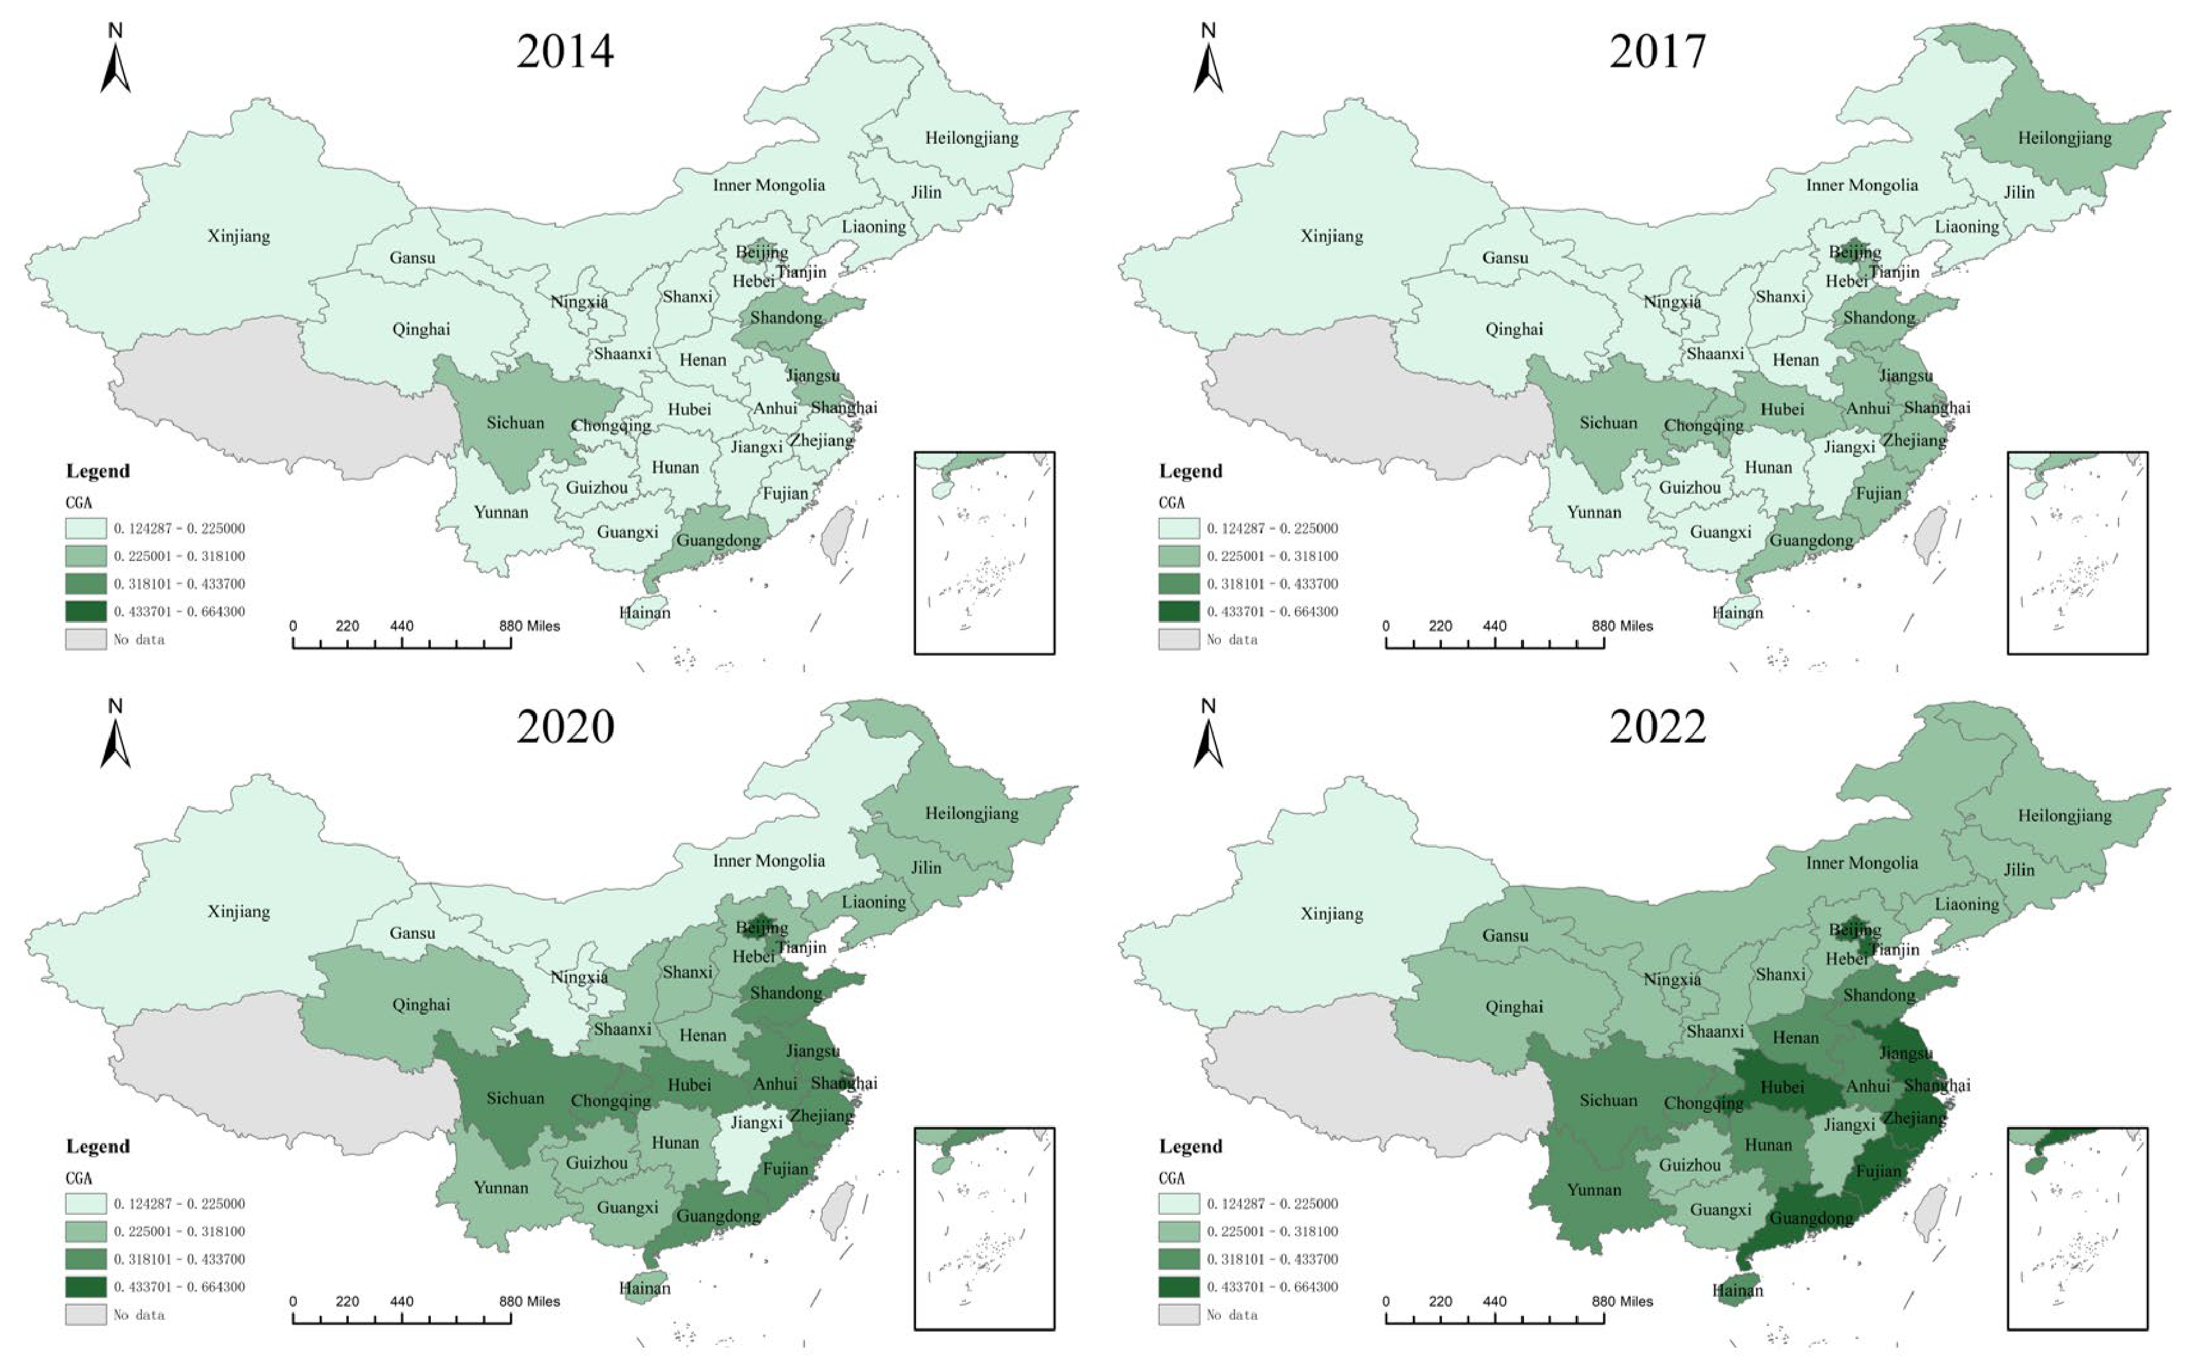
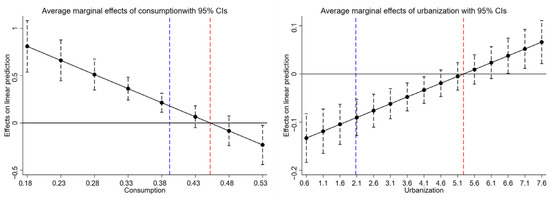
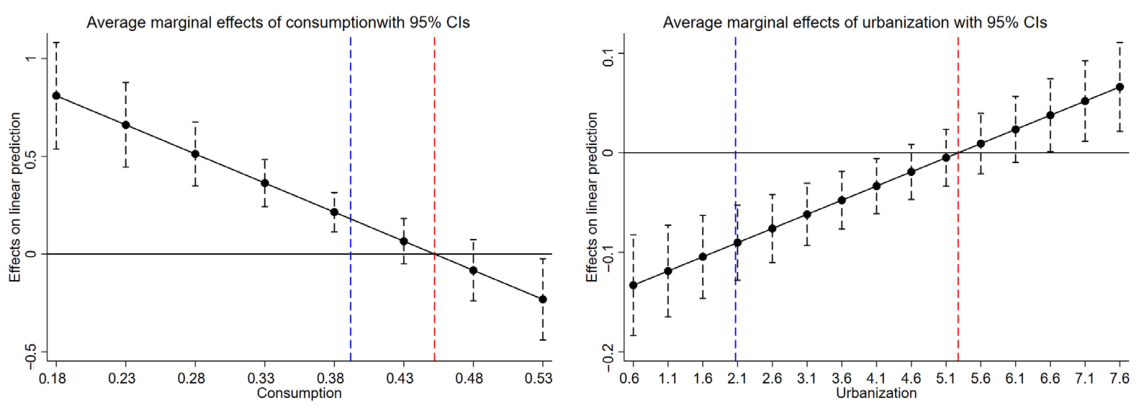

Disclaimer/Publisher’s Note: The statements, opinions and data contained in all publications are solely those of the individual author(s) and contributor(s) and not of MDPI and/or the editor(s). MDPI and/or the editor(s) disclaim responsibility for any injury to people or property resulting from any ideas, methods, instructions or products referred to in the content. |
© 2026 by the authors. Licensee MDPI, Basel, Switzerland. This article is an open access article distributed under the terms and conditions of the Creative Commons Attribution (CC BY) license.