


Abstract
To address ship-sourced water pollutant issues resulting from shipping industry growth and achieve precise supervision and effective management in coastal ports, this study develops a method for calculating and predicting the generation volume of oily sewage, domestic sewage and solid waste based on Automatic Identification System (AIS) data. First, a questionnaire survey (“Survey on Ship Water Pollutants”) is designed and implemented. Through analysis of questionnaire data, the ranges of values for the generation of oily sewage, domestic sewage, and solid waste from different ship types at China’s coastal ports are established. Additionally, onboard sampling is conducted to determine average emission factors for domestic sewage and oily sewage from typical ship types. Second, ship activities are derived from AIS data and combined with the established generation volume ranges for spatiotemporal calculation. Finally, a ConvLSTM (Convolutional Long Short-Term Memory) model is developed to predict the generation volume of water pollutant based on their spatiotemporal characteristics. Taking a major Chinese port area as a case study, the results indicate that pollutant generation volumes are significant in coastal port zones and main navigation channels, particularly between 15:00 and 16:00. chemical oxygen demand (COD), suspended solids (SS), and 5-day biochemical oxygen demand (BOD5) levels in domestic sewage exceeded China’s national regulatory limits by 0.35 times, 2.88 times and 1.07 times, respectively, which can easily lead to a decrease in dissolved oxygen content in the water, affecting the respiration and survival of aquatic organisms. Petroleum content in oily sewage remained below the standard threshold. For pollutant generation volume prediction, the proposed ConvLSTM model achieved MAE and RMSE values of 0.0824 and 0.1433, respectively, outperforming other prediction models such as LSTM and CNN-LSTM. This research provides technical support for the prevention and control of water pollution from ships in coastal ports. The proposed AIS-driven framework and ConvLSTM prediction method are transferable and globally applicable, offering a reference for the environmental sustainability of port ecosystems, the global maritime pollution prevention, and the sustainable development of the shipping industry worldwide.
1. Introduction
With the rapid development of maritime transportation, ship activities have increased substantially, and large volumes of ship-sourced water pollutants have posed serious threats to the aquatic ecological environment of water areas [1]. Pollutants discharged from ships, including oily sewage, ballast water containing hazardous substances, domestic sewage, and solid waste, are rich in volatile organic compounds (VOCs), polycyclic aromatic hydrocarbons (PAHs), and other toxic and potentially hazardous organic pollutants [2,3]. These pollutants not only directly endanger aquatic organisms such as fish and marine mammals, but may also lead to eutrophication, promoting excessive algal growth and disrupting ecological balance [4]. Quantitative evidence highlights the severity of these impacts. In the Changjiang (Yangtze) River Estuary, total phosphorus concentrations reached 0.322 mg/L, and nutrient index values ranged from 2.42 to 21.99, indicating persistent eutrophic conditions [5]. Long-term observations further showed significant increases in nutrient concentrations and chlorophyll-a levels over recent decades [6]. At a broader scale, shipping contributes to nutrient inputs in marine systems. For example, in the Baltic Sea, shipping accounted for up to 3.3% of total nitrogen inputs and could cause local biogeochemical impacts of up to 10% [7], exacerbating cyanobacterial blooms [8,9].
Beyond immediate toxicity and eutrophication, ship-sourced pollution contributes to ecosystem-level degradation. Persistent pollutants such as PAHs can accumulate in marine sediments, leading to long-term contamination of benthic habitats and altering community structure and ecosystem functioning [10]. The processes of bioaccumulation and biomagnification further amplify these risks. Bioaccumulation refers to the net uptake of contaminants exceeding metabolic elimination, resulting in increasing concentrations within organisms. This process is strongly influenced by pollutant hydrophobicity and has been widely observed for PAHs in aquatic organisms [11]. Biomagnification describes the increase in contaminant concentrations across trophic levels and is typically quantified using trophic magnification factors (TMFs). Empirical studies have confirmed biomagnification of persistent organic pollutants such as PCBs in marine food webs [12,13]. Consequently, even low-level pollutant discharges may lead to elevated concentrations in top predators, posing long-term risks to ecosystem integrity and human health.
The international community has increasingly emphasized the issue of ship-sourced water pollution, as reflected in a series of resolutions from MEPC.2(VI) to MEPC.227(64) [14,15]. These resolutions demonstrate the progressive strengthening of monitoring requirements and discharge standards for ship-sourced wastewater. To strengthen the prevention and control of ship-sourced water pollution in inland rivers and coastal waters, China has issued a series of policies and standards since 2015, including the “Discharge Standard for Water Pollutants from Ships” (GB 3552-2018) [16], which specify concrete measures to comprehensively enhance pollution prevention capabilities of ships and ports. However, most ships are currently not equipped with metering devices for water pollutants, making it difficult to accurately monitor pollutant generation and discharge. Consequently, the statistical values of ship oily sewage, domestic sewage, and solid waste obtained from over 2000 questionnaires in this study can to some extent reflect the daily production of pollutants by different types of ships. Combined with AIS data to obtain the activity and navigation trajectory of ships, the spatiotemporal patterns of pollutant production can be obtained and further predicted. This is crucial for establishing a reliable pollution inventory, supporting targeted supervision, and formulating evidence-based environmental policies. The data and methods obtained in this study can more accurately formulate pollution control plans, configure water pollutant receiving facilities in ports as needed, and ultimately improve the overall effectiveness of ship pollution prevention and control in coastal ports in China.
Oily sewage, domestic sewage, and solid waste are the main types of ship-sourced water pollutants considered in current studies on pollutant generation and discharge volume estimation. Ship oily sewage includes oily bilge water from machinery spaces and oily wastewater containing cargo oil residues [17]. The former is influenced by ship age, ship tonnage, main engine power, sailing duration and berthing, and operational time, and two estimation approaches are currently widely used in China. One is the empirical coefficient method: according to the “Design Code of Environment Protection for Port Engineering” (JTS 149-1-2007), when measured data for bilge oily sewage are unavailable, the daily generation volume can be estimated as 0.027% of the ship’s tonnage [18]. The “Specifications on Environmental Protection Design for Port and Waterway Engineering” (JTS 149-2018) further stipulates that the volume of bilge oily wastewater should preferably be determined based on measured data; in the absence of such data, calculations may refer to the values provided in the code, and interpolation may be applied to estimate wastewater generation volume for different representative ship types [19]. In addition to the empirical coefficient method, some studies have examined the relationships between factors such as ship type, engine power, and ship activity level and the generation volume of ship oily sewage [20,21]. The research results indicate that passenger ships tend to generate larger volumes of bilge oily water compared with cargo ships. Even among ships of the same type, the amount of oily wastewater produced varies, and a certain correlation has been observed between oily wastewater volume and main engine power [22]. To quantitatively analyze the relationships between ship attributes and oily wastewater generation volume, Motoyoshi et al. [23] employed Bayesian statistical methods to construct a probabilistic distribution model for oily wastewater generation volume, with model parameters calibrated using Markov chain Monte Carlo methods. Their results showed that integrated bilge treatment systems (IBTS) can effectively reduce the generation of oily sewage. Similarly, other studies have found that daily oily sewage generation is strongly influenced by random factors and exhibits a weak correlation with engine power, whereas annual average generation volume can mitigate the effects of randomness and shows a positive correlation with ship power [24]. Ship type has also been identified as an important influencing factor [25].
In terms of estimating ship-sourced domestic sewage, as early as the 1990s, scholars conducted quantitative analyses on domestic sewage pollution from ships in the Yangtze River and proposed a method for roughly calculating the annual generation volume of water pollution [26]. Since then, researchers have gradually shifted from macro-level total estimation to more refined, category-based statistical approaches. Li et al. [27] proposed a calculation method for domestic sewage generated by fishing ships in coastal cities. In this study, ships were classified and statistically analyzed based on tonnage, the number of crew members, and operating time, and the estimates were derived by combining per capita domestic sewage generation rates for ships of different tonnage classes. Xu et al. [28] investigated the actual volumes of domestic sewage generated by various types of coastal ships during operation, summarized sewage generation of typical ships, and provided reference coefficients. Özkaynak et al. [29] applied Monte Carlo simulations to represent realistic sea conditions in Antalya Bay and, in combination with linear regression, developed an estimation model to quantify sewage generation volume by ships in the bay. Shi et al. [30] developed a calculation model for the generation of water pollutants from transport ships based on AIS data. They established separate formulas for calculating the generation of black water, gray water, and oily sewage, with an empirical calculation conducted for the main stem of the Yangtze River. Wang et al. [31], based on voyage data of ships on the Yangtze River, used a ship-type classification coefficient method to estimate the generation of domestic sewage. Shu et al. [32] developed a model to estimate ship-sourced domestic sewage, including greywater and sewage, using high-resolution spatiotemporal distribution.
In addition to studies on domestic sewage generation, some researchers have also focused on concentration determination of ship-sourced domestic sewage [33] and analyzing concentration changes after preliminary treatment [34,35,36]. For example, Mujingni et al. [37] performed systematic sampling, quantification, and characterization of graywater from ships in the Baltic Sea. The geometric means of COD, BOD5, TSS, and P exceeded the guideline values of IMO MEPC.227(64). Some scholars have also noticed the hazards of microplastics in ship water pollutants and ballast water, and have conducted characteristic analyses on the distribution, sources, and potential ecological risk assessments [38,39].
Ship-sourced domestic solid waste and domestic sewage are both produced by crew members or passengers, exhibiting similar generation trends and showing a clear correlation with the duration of stay on board.
These ship-sourced water pollutants place pressure on port ecosystems, posing substantial challenges to the prevention of marine pollution as mandated by the United Nations Sustainable Development Goals (SDGs). Achieving this objective requires a shift from reactive treatment to proactive, ecosystem-based management. However, the current management strategy is often constrained by inaccurate estimates of pollutant generation, which hinders the implementation of precise governance.
Currently, most scholars conduct research based on empirical values and combined with ship activities, which limits estimation accuracy to some extent. Moreover, relatively few studies have addressed the calculation and prediction of ship-sourced pollutant generation volume within port areas. Therefore, this study first conducts surveys on the generation volume of oily sewage, domestic sewage, and solid waste from different ship types, determines corresponding emission factors, and estimates pollutant generation volume by combining AIS data. Subsequently, a predictive model for ship-sourced water pollutants in port areas is developed, with the aim of providing a scientific basis for the reception, treatment, and management of water pollutants in ports.
2. Data Collection
2.1. Questionnaire Survey on Ship-Sourced Water Pollutants
To obtain basic information on the generation volume of ship-sourced water pollutants, a large-scale questionnaire survey is conducted with the support of maritime administration authorities, yielding a total of 2353 valid responses. The questionnaire covers ship type, gross tonnage, quantities of water pollutants (including oily sewage, domestic sewage, and solid waste) and so on. The collected responses are dominated by cargo ships, followed by container ships and oil tankers.
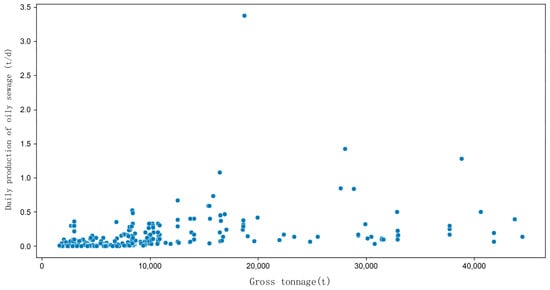
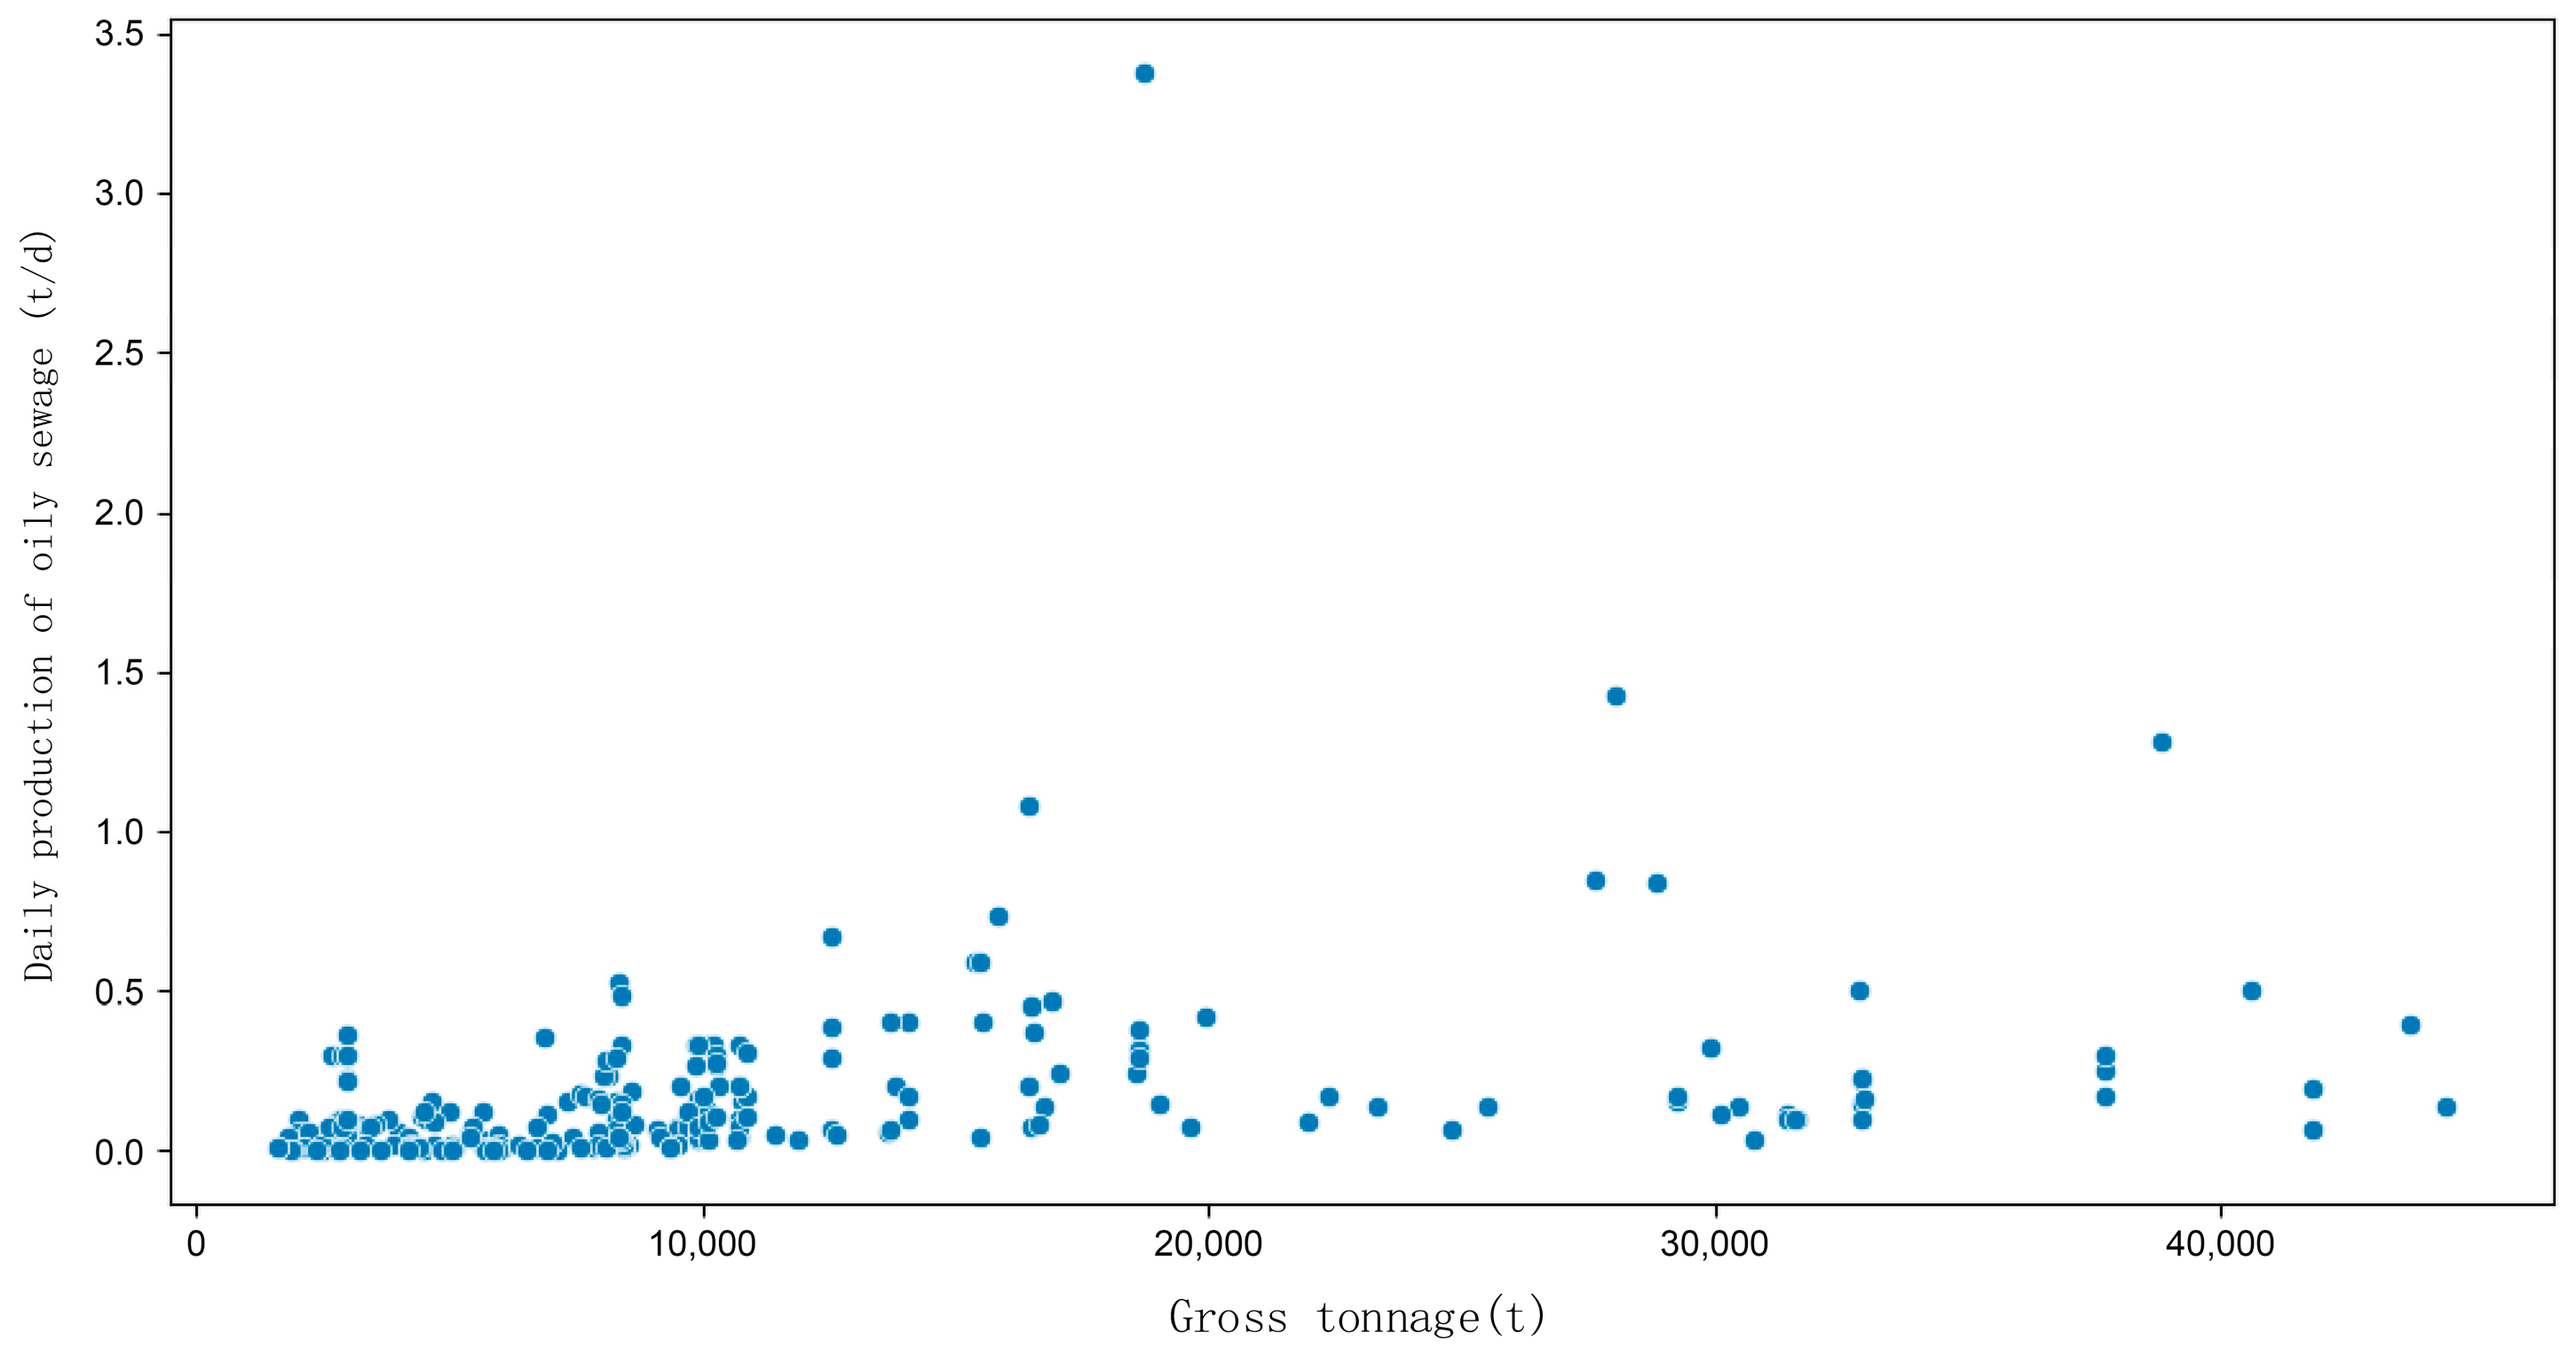
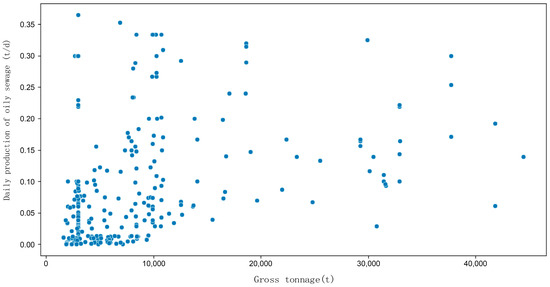
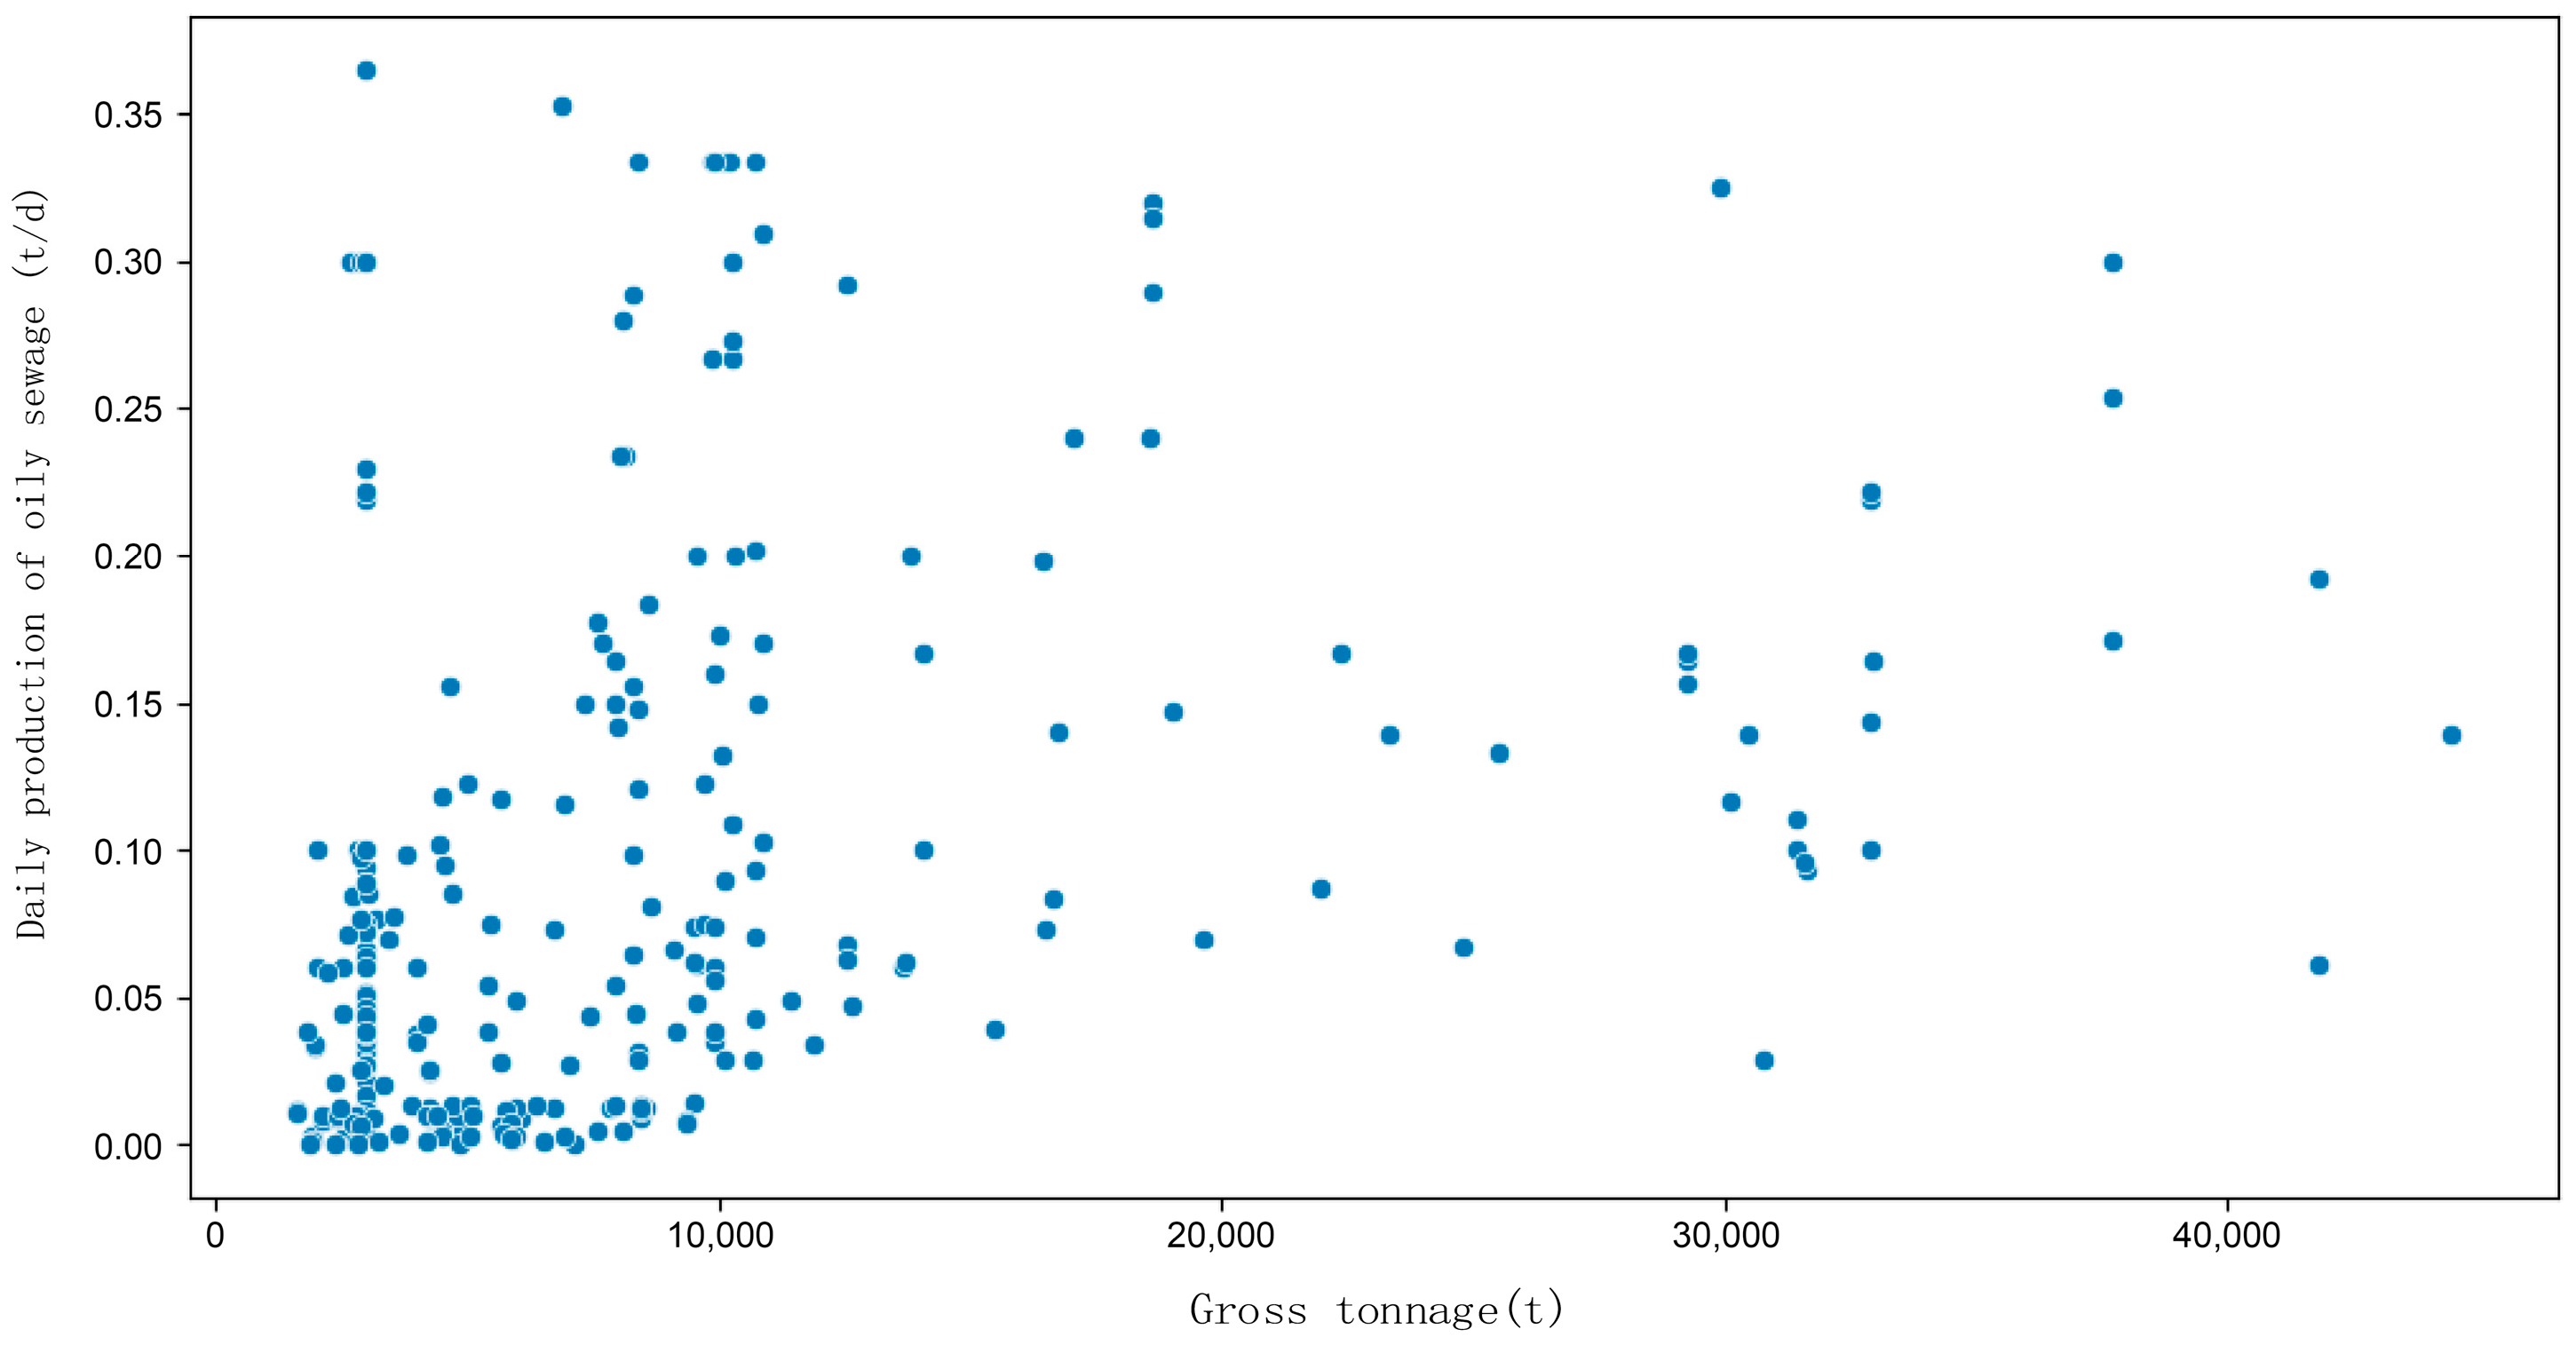
Following a preliminary analysis of the questionnaire data, several issues are identified, including incomplete responses, zero values for pollutant generation quantities, and abnormally high generation figures. Data cleaning procedures are therefore implemented. First, the ships in the questionnaire are classified according to their types (Table 1), and then the daily generation amounts of water pollutants are calculated based on the annual generation amounts of various pollutants and the annual number of sailing days. Taking ships with power ranging from 1500 kW to 4000 kW as an example, a scatter diagram (Figure 1) is plotted with the daily generation amount of oily sewage on the y-axis and gross tonnage on the x-axis, and significant outliers can be clearly identified.
Table 1.
Interval values of typical ship water pollutant generation volume at coastal ports (t/d).
Figure 1.
Scatter plot of daily production of oily wastewater before cleaning.
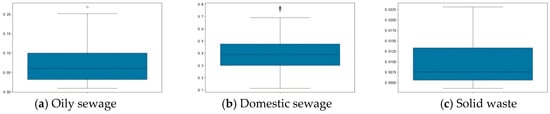
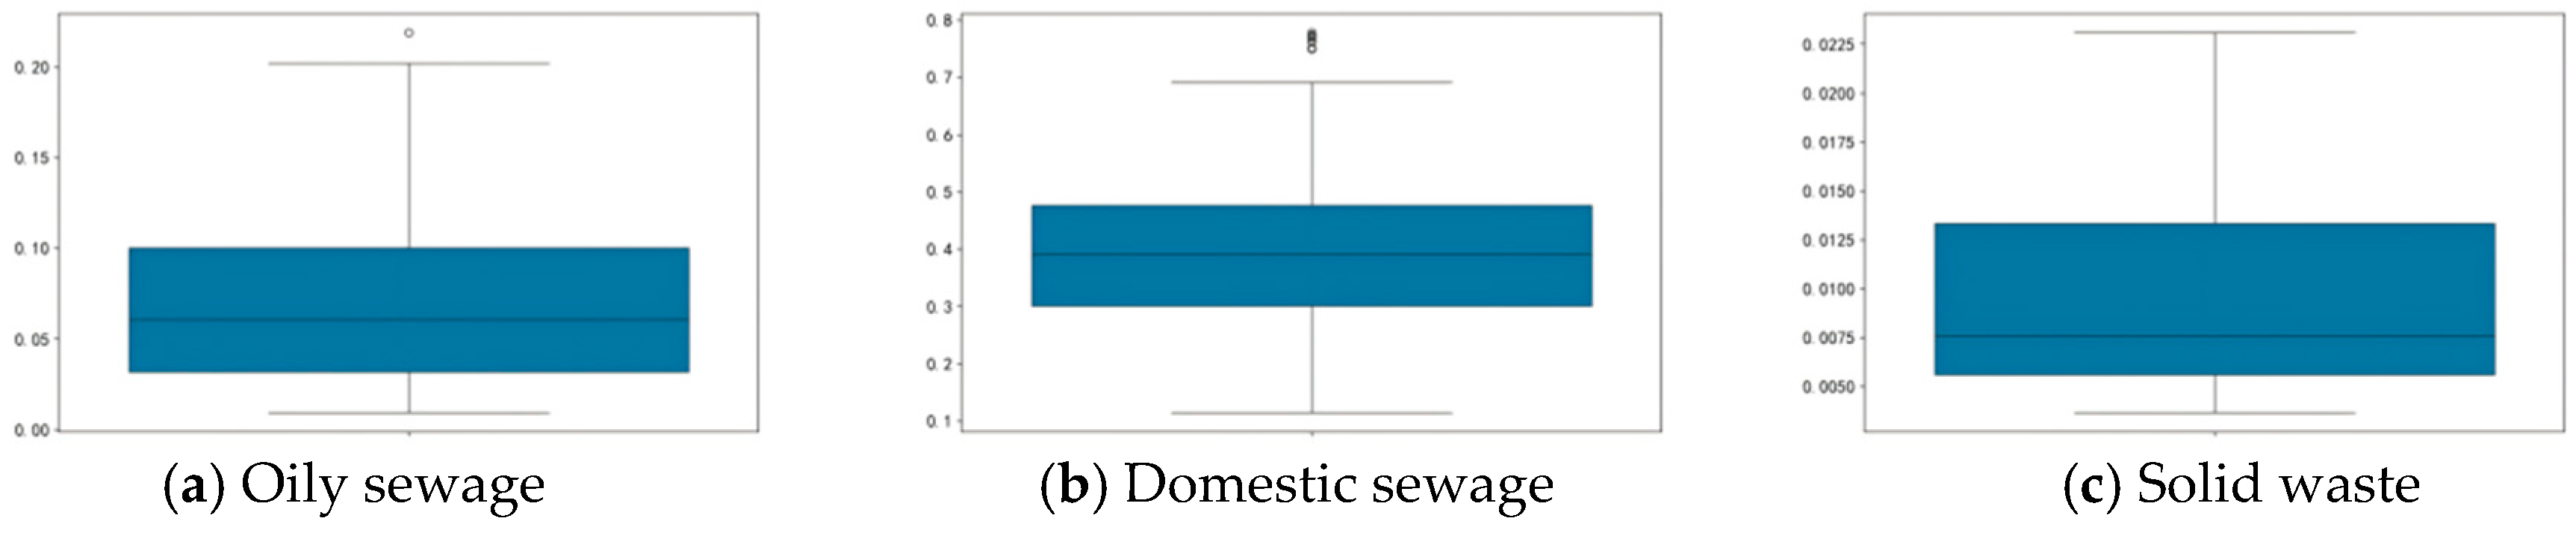
Therefore, the percentile-based filtering method is employed to clean the data with abnormal generation amounts. This method filters out extreme values by setting a reasonable percentile range (such as from the 5th percentile to the 95th percentile) and generates box plots (Figure 2). The cleaned data is shown in Figure 3. By using this method, 1824 valid questionnaires are ultimately retained.
Figure 2.
Box plot of daily production of pollutants (t/d).
Figure 3.
Scatter plot of daily production of oily wastewater after cleaning.
The correlation between the daily generation amounts of various types of ship-sourced water pollutants and ship types is analyzed. The R2 values for the generation amounts of oily wastewater, domestic sewage, and solid waste are 0.243, 0.231, and 0.126, respectively, indicating low correlations. This may be attributed to errors in the crew’s estimates of pollutant generation amounts. Therefore, the interval value method is adopted to represent pollutant generation volume. The interval value method is a statistical approach for handling uncertainty and vagueness in data and is widely applied in environmental science and resource assessment [40]. It is particularly suitable for datasets without clear functional relationships or well-defined probability distributions. Interval data represent values as ranges rather than fixed numbers, defined by lower and upper bounds. Suppose the daily generation amount of domestic sewage for a certain type of ship is [a, b], where a is the lower limit and b is the upper limit. Combining this with the aforementioned percentile-based filtering method, the 5th percentile of the questionnaire data for domestic sewage from this type of ship is denoted as a, and the 95th percentile is denoted as b. Based on the questionnaire data, Table 1 presents the interval ranges [a, b] of water pollutant generation volume for different ship types. During the estimation process, multiple random values are sampled within each interval, and the mean of these random samples is taken as the daily water pollutant generation volume for a given ship.
2.2. Measurement of Emission Factors
The emission factor for ship domestic sewage refers to the mass, concentration, or quantity of a specific pollutant per unit volume of domestic sewage discharged by a ship. The emission factor for ship oily sewage refers to the mass or concentration of oil-based substances per unit volume of oily sewage. In previous research, many scholars estimated the total amount of oily sewage and domestic sewage generated by ships while navigating in channels, but few have analyzed the emission factors of the pollutants. For port areas, it is not only necessary to pay attention to the total amount of domestic sewage and oily sewage discharged by ships, but also to analyze the specific contents of suspended solids, thermotolerant coliform bacteria, and petroleum-based substances. This will help to deeply understand the specific mechanism of the impact of ship emissions on the port’s ecosystem and provide a scientific basis for formulating targeted pollution prevention and control strategies. Therefore, in accordance with China’s emission standards, contents of suspended solids and thermotolerant coliform bacteria, 5-day biochemical oxygen demand, pH, and chemical oxygen demand in ship domestic sewage, as well as petroleum in ship oily sewage, are collected and analyzed.
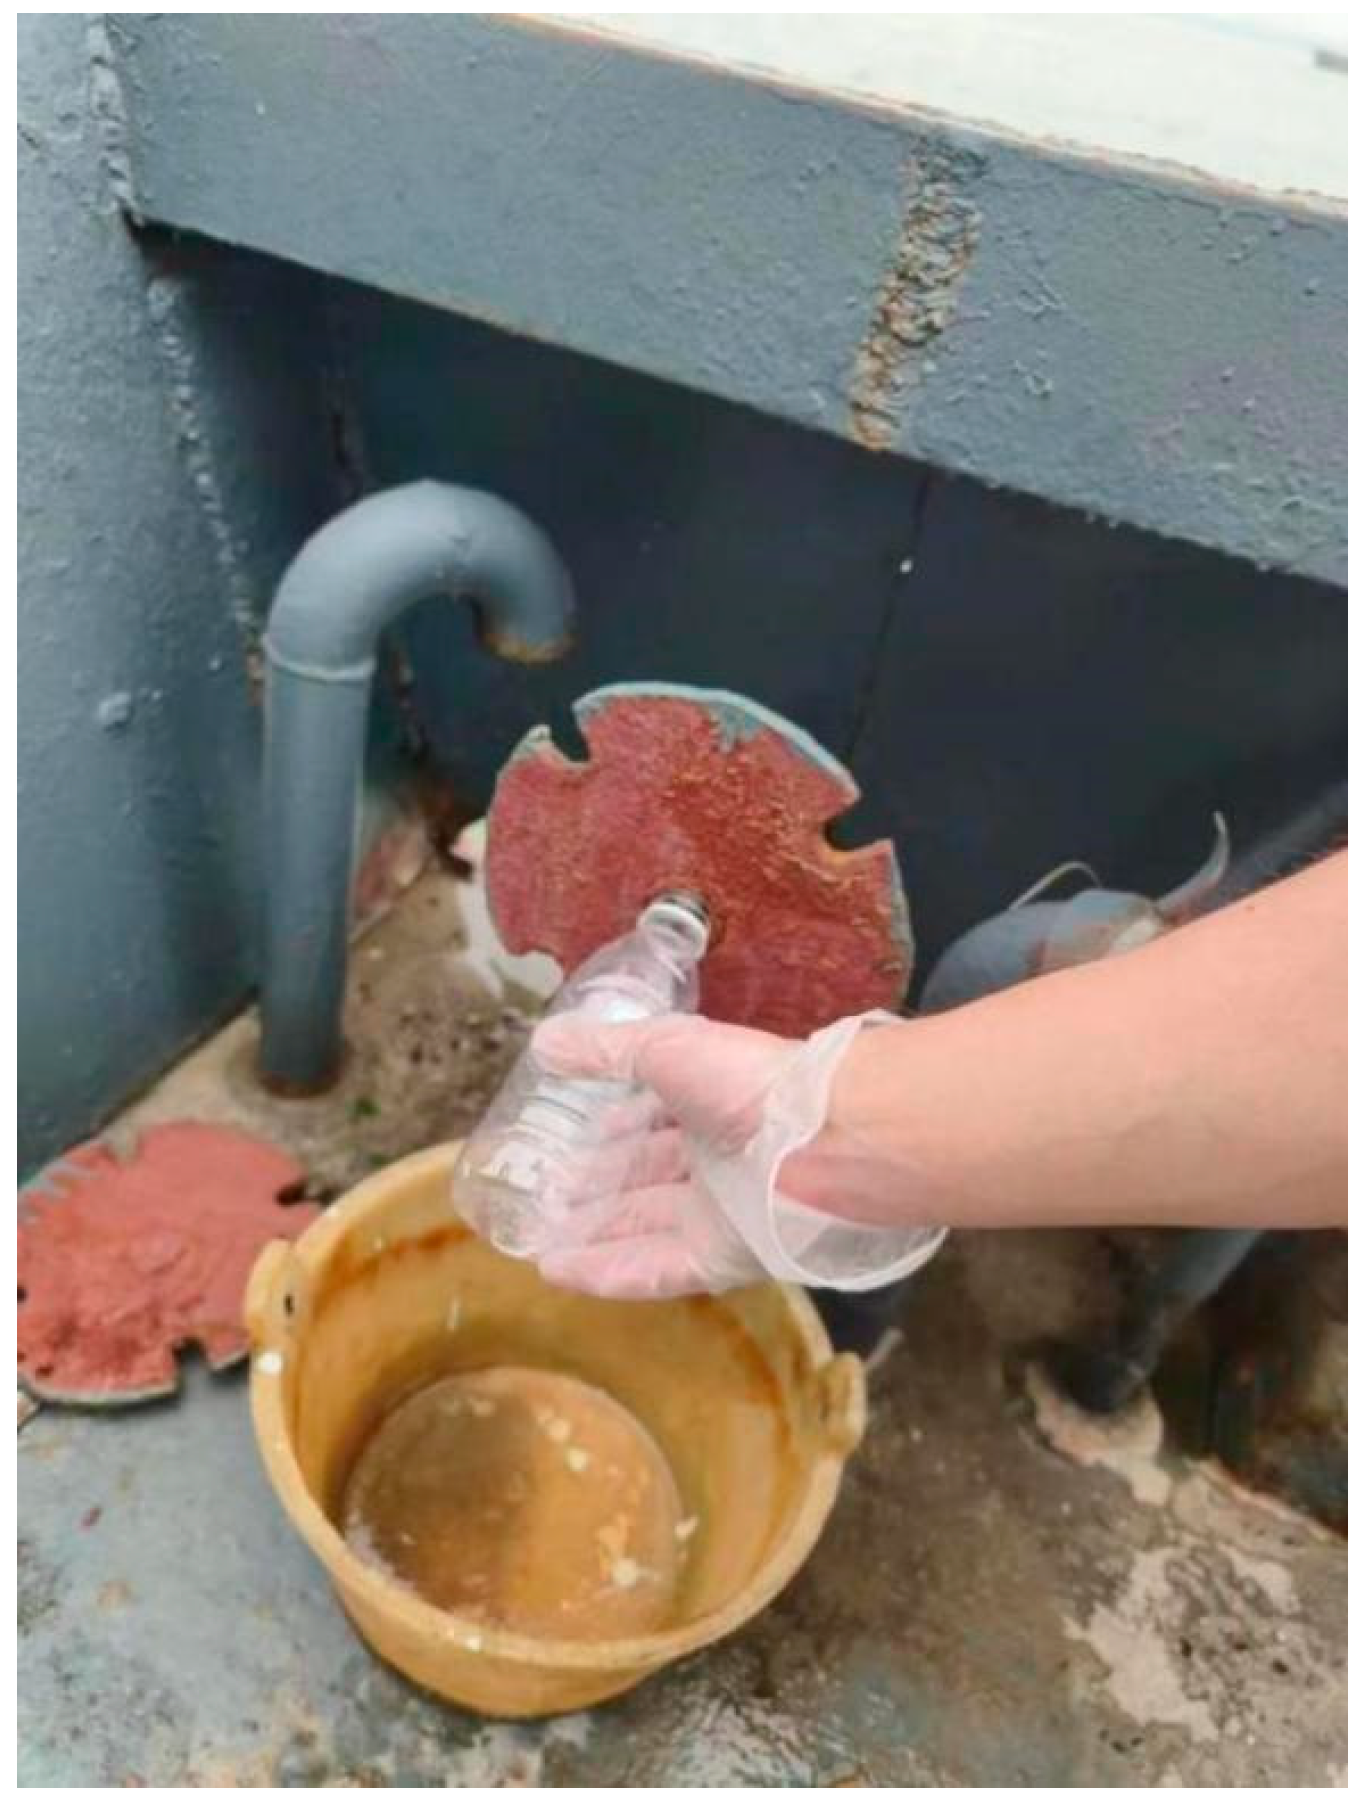
Emission factors associated with oily sewage, domestic sewage and solid waste are quantified through measurements conducted on 24 ships docked at ports along the southeastern coast of China, as illustrated in Figure 4. Samples of oily sewage and domestic sewage are collected from the sampling outlets of the oil–water separators and the domestic sewage treatment systems, respectively. A total of 30 samples encompassing both oily wastewater and domestic sewage were obtained (as some ships were found to lack suitable sampling conditions after boarding) and subsequently sent to a certified testing facility for emission factor analysis. The mean values of these measurements are presented in Table 2 and Table 3.
Figure 4.
Sampling at the drainage outlets.
Table 2.
Mean value of domestic sewage emission factor.
Table 3.
Mean value of oily sewage emission factor.
3. Methodology
3.1. Estimation Method for Ship-Sourced Water Pollutants
The generation volume of ship-sourced water pollutants is closely associated with ship activities. AIS data, which encompass ship position, speed, and other parameters, can effectively reflect ship activity patterns. They can also be used to estimate the quantity of ships for each ship type and determine the duration of ship operations [41,42], and provide data support for estimating the amount of water pollutants generated by ships [43]. Accordingly, the collected AIS data undergo an initial cleaning process to ensure data quality. Subsequently, the cleaned data are classified and sorted by Maritime Mobile Service Identity (MMSI) and timestamp, with a separate data file established for each MMSI. For any trajectory point i (the i-th sorted AIS record) within each MMSI file, the time interval tᵢ between point i and its preceding point i − 1 is calculated. Based on the interval ranges of different pollutants (Table 1), the generation volume of pollutants between two consecutive trajectory points is then estimated. Taking ship oily wastewater as an example (the same calculation principle applies to domestic sewage and domestic solid waste), the estimation method is mathematically represented by Equation (1).
where, Qi is the amount of oily wastewater generated between trajectory point i and trajectory point i − 1, measured in tons(t); ti is the time interval between trajectory point i and trajectory point i − 1, expressed in seconds(s); T is the unit time interval, which is standardized to 24 h multiplied by 3600 s, equivalent to one day; Sewageoil is the daily generation volume of oily sewage, calculated as the mean of multiple randomly sampled values within the interval range in Table 1 according to ship type, in tons per day(t/d).
When a ship is at anchor or berthed at a port, the main engine is usually shut down, and the generation volume of oily sewage can be considered negligible. In this situation, crew members generally go ashore, and the generation volume of domestic sewage and solid waste can also be assumed to be zero. However, the original trajectory data contain some abnormal records in which ship speed drops abruptly to zero, making it difficult to directly determine whether the ship is actually in a berthing or anchoring state. To improve estimation accuracy, the instantaneous speed of each record for a specific ship is examined. When a zero-speed record is detected, all records within the preceding two hours are further checked. If the ship’s speed remains consistently close to zero throughout this period and the ship is located in the waters surrounding the port, the ship is considered to be in a berthing or anchoring state during that time interval, and pollutant generation volume is assumed to be zero.
Finally, data from all MMSI-based files were aggregated by trajectory points to obtain the cumulative generation volume of pollutants, as shown in Equation (2).
where, Q(x,y) is the amount of pollutants generated at location (x, y); Fk(x,y) is the amount of pollutants generated at location (x, y) in the k-th MMSI file; m is the total number of MMSI-based files.
3.2. Prediction Model of Ship-Sourced Water Pollutants in Port Areas
In complex time series forecasting tasks, traditional single models often encounter challenges in fully capturing the multiple patterns embedded within the data, particularly when dealing with datasets characterized by complex spatiotemporal dependencies. In this domain, long-term temporal dependencies and localized spatial correlations are key factors influencing prediction accuracy. Although conventional Long Short-Term Memory (LSTM) models are effective at modeling long-term temporal dependencies [44], they have limited capability in handling spatial information. In contrast, traditional Convolutional Neural Network (CNN) models excel at extracting spatial features but lack the ability to model temporal dynamics effectively. The Convolutional LSTM (ConvLSTM) model is centered on a composite spatiotemporal feature extraction module, in which convolutional operations are integrated into LSTM units to simultaneously extract temporal and spatial features [45]. This design enables adaptive learning of both long-term dependencies and local patterns, making ConvLSTM well suited for predicting ship-sourced water pollutant emissions, which are characterized by long time series and high-dimensional feature spaces.
3.2.1. Model Architecture
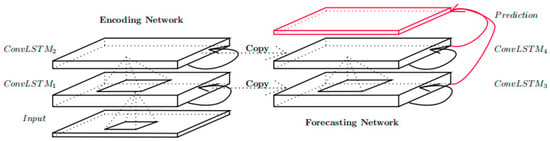
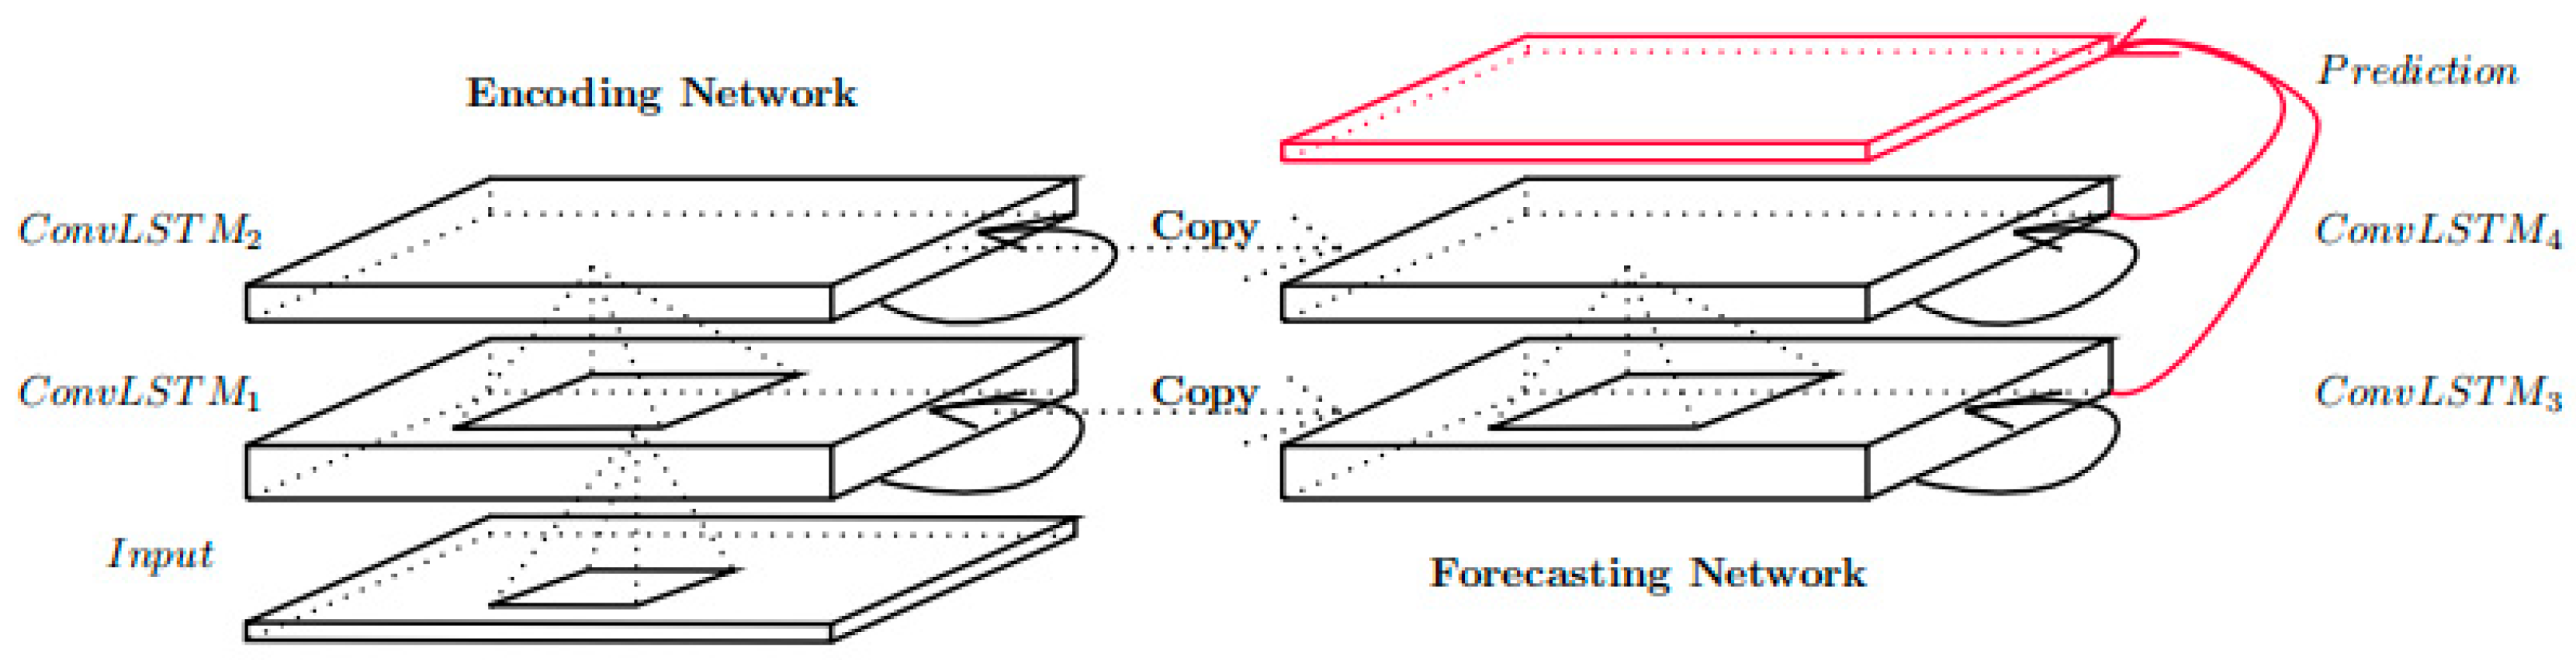
The ConvLSTM model mainly consists of two components: a composite spatiotemporal feature extraction module and an output module (as shown in Figure 5). The model takes water pollutant generation data as input, presented in the form of a time series, including time, longitude and latitude, oily sewage generation volume, domestic sewage generation volume, solid waste generation volume, etc. First, the input data are processed by the composite spatiotemporal feature extraction module, which is capable of simultaneously capturing long-term temporal dependencies and localized spatial patterns. The extracted spatiotemporal features are then fed into the output module, which is composed of one or more fully connected layers that map these features to the final prediction results. Following the fully connected layers, appropriate activation functions, such as ReLU, sigmoid, or tanh, can be applied depending on the specific prediction task.
Figure 5.
Overall architecture of the ConvLSTM model.
3.2.2. Composite Spatiotemporal Feature Extraction Layer
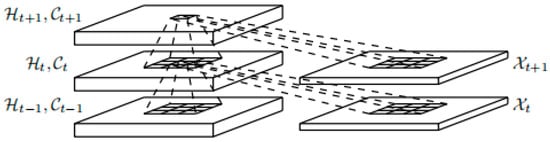
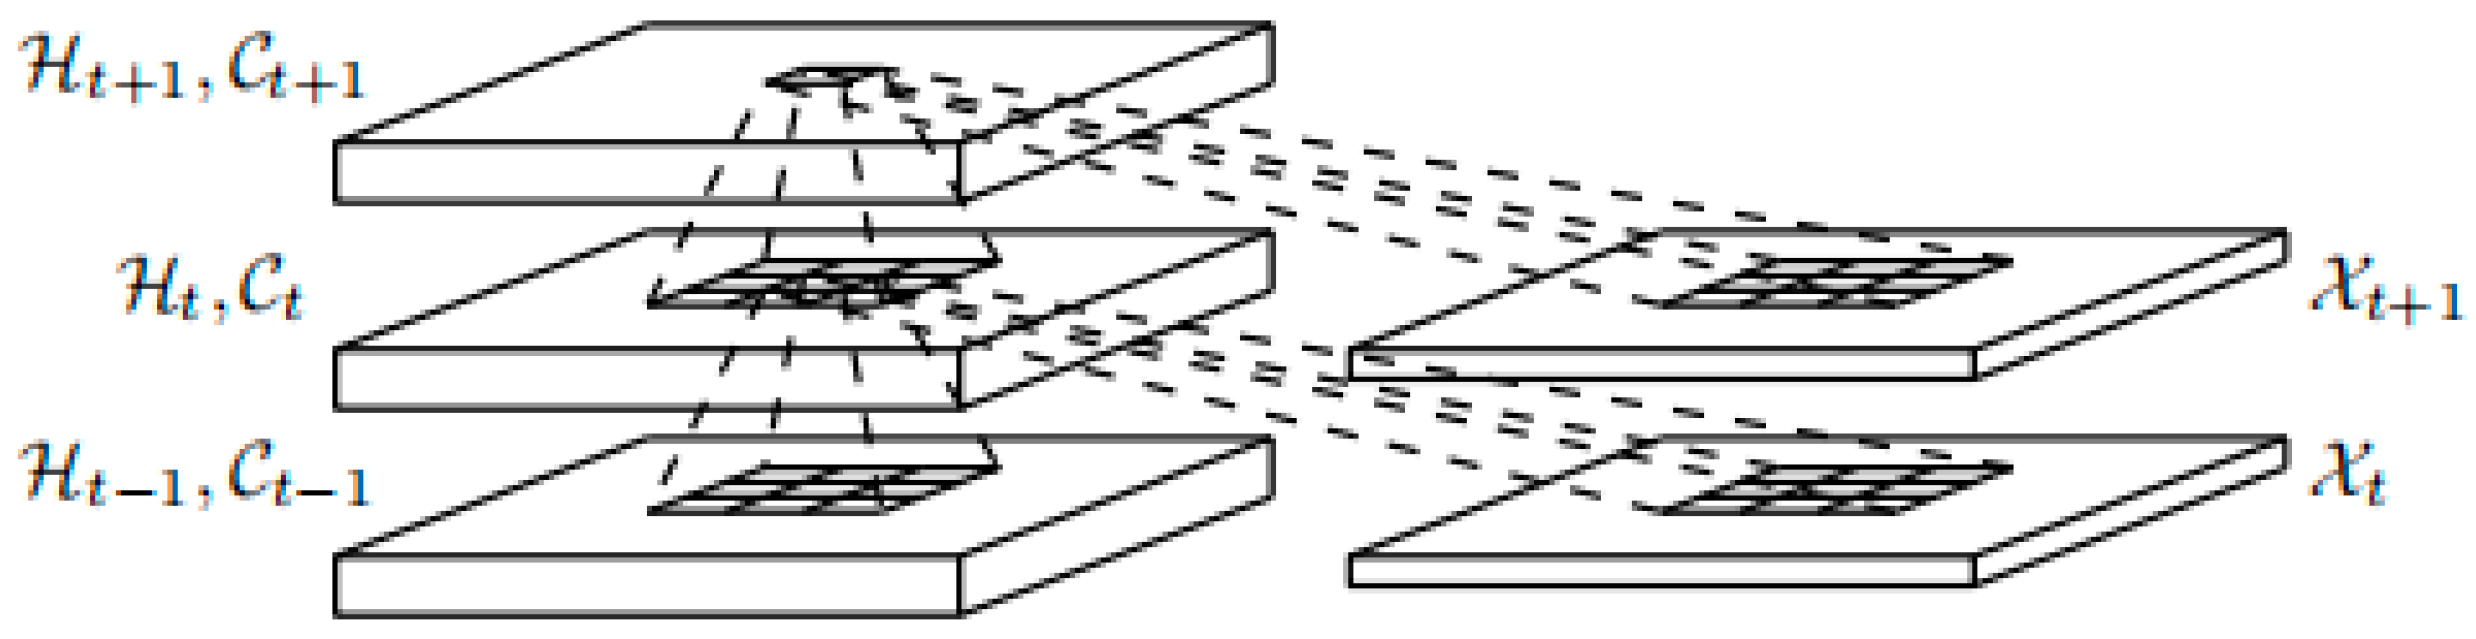
To efficiently extract complex spatiotemporal features from pollutant generation data, a composite spatiotemporal feature extraction module is constructed. The core of this module is the ConvLSTM unit, whose internal structure is illustrated in Figure 6.
Figure 6.
Structure of the ConvLSTM unit.
This module modifies the internal architecture of the LSTM by introducing convolutional operations for data processing and information propagation, while effectively controlling the number of parameters. At each time step, the input is no longer a simple vector but a feature map, enabling the model to process temporal and spatial information simultaneously. The computational formulation of a conventional LSTM unit is as follows:
In the ConvLSTM architecture, the above formulations are replaced by convolutional operations (Equation (4)), enabling the model to process temporal and spatial information simultaneously.
In this module, convolutional kernels are responsible for extracting spatial information, while the gating mechanisms selectively filter and retain temporal information. Through this design, the ConvLSTM unit is able to encode spatial features and capture the dynamic characteristics of time series simultaneously. It avoids the cumbersome process of manually designing a feature extractor in traditional LSTM models. Here, ◦ denotes the convolution operation, ⊙ represents the Hadamard product (element-wise multiplication), and ht−1, xt, and ct denote the input data.
3.2.3. Output Module
The output module is responsible for mapping the extracted feature representations to the final prediction results. In this developed model, one or more fully connected layers are added following the composite feature extraction module. These fully connected layers perform linear combinations and nonlinear transformations of the extracted features to achieve accurate prediction of the target variables. A Dropout layer is introduced before the fully connected layers to enhance the model’s generalization capability. The computation of the fully connected layers is expressed as follows:
where W denotes the weight matrix, Concat(ht, c) represents the concatenation of the outputs from the LSTM and CNN, b denotes the bias vector, and f is the activation function.
Based on the proposed estimation and prediction model for ship-sourced water pollutants, a case study will be conducted in a coastal port area of China in the future. The use of case study research has been widely recognized as an effective strategy to present empirical results, demonstrate model applicability, and improve the interpretability of complex modeling systems [46]. In water pollution prediction studies, case studies enable researchers to ground theoretical models in real-world conditions, thereby enhancing the clarity, reproducibility, and practical relevance of research findings [47,48]. A case study can also illustrate model performance, identify potential limitations, and provide practical insights for regional environmental management [49]. Therefore, a case study approach is adopted in this study to validate the developed ConvLSTM model and present its predictive capacity for water pollutant generation in a realistic regional context.
4. Results and Discussion
A case study is carried out in the port area of Shenzhen, China, with the longitude spanning from 113.47° to 114.22° and the latitude ranging from 22.03° to 22.69°. AIS data from 1 January to 25 January 2024 are selected for this region, involving 4986 ships and a total of 103,226,911 records. Based on the methods described above, the spatiotemporal distributions of ship-sourced oily sewage, domestic sewage, and solid waste in the study area are estimated.
4.1. Analysis of Pollutant Generation Volume
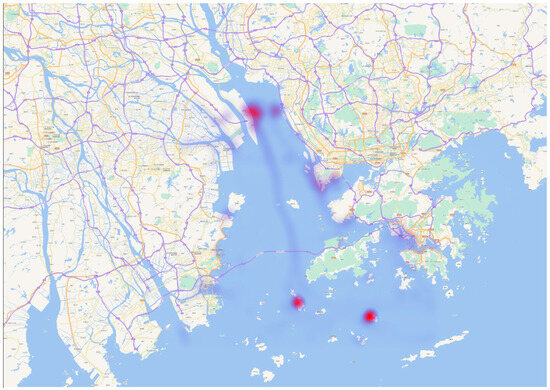
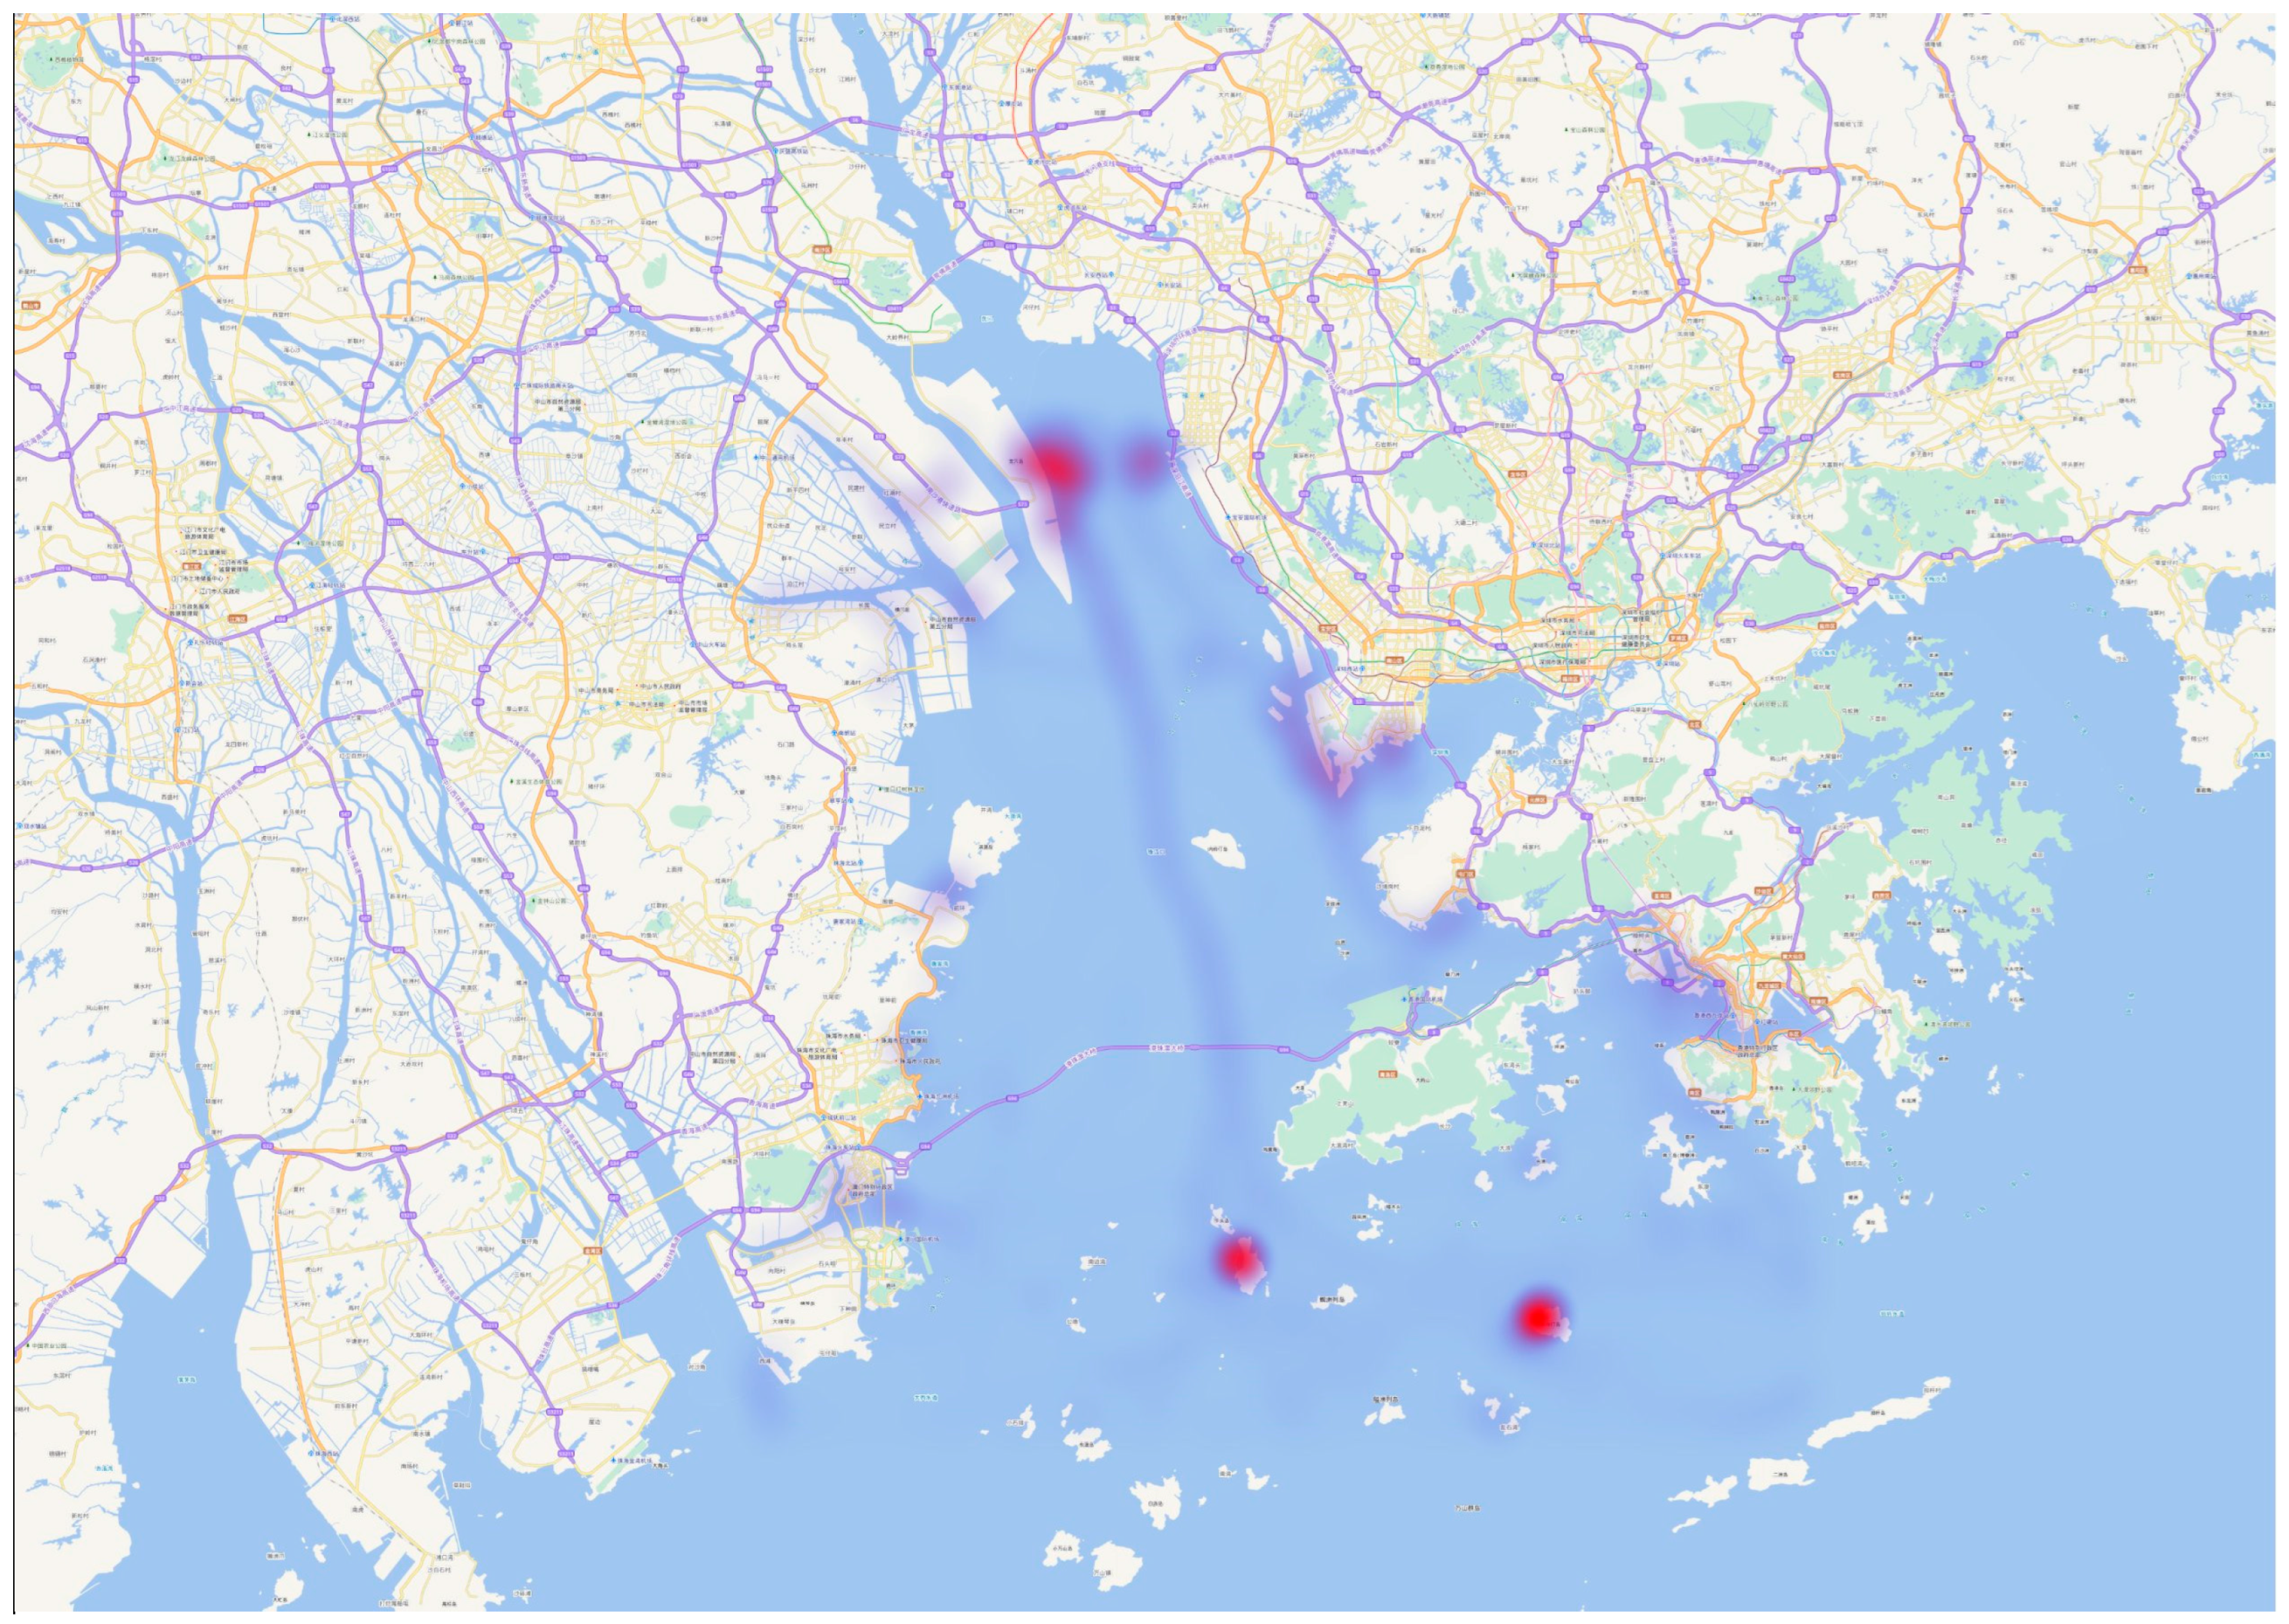
Based on the above procedures, it was estimated that between 1 January and 25 January 2024, a total of 2285.389 t of oily sewage, 27,782.39 t of domestic sewage, and 6088.028 t of solid waste were generated in the study area. As shown in the heat maps in Figure 7, the generation volume of ship oily sewage is significantly higher in areas near the port and along major waterways, where ship density is high and pollutant accumulation is pronounced. In contrast, in open waters farther from the port and main waterways, there are fewer ship activities, resulting in significantly lower pollutant generation volume.
Figure 7.
Oily sewage generation volume in the study area.
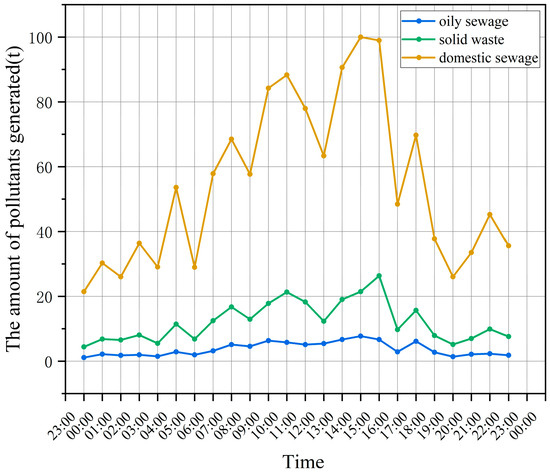
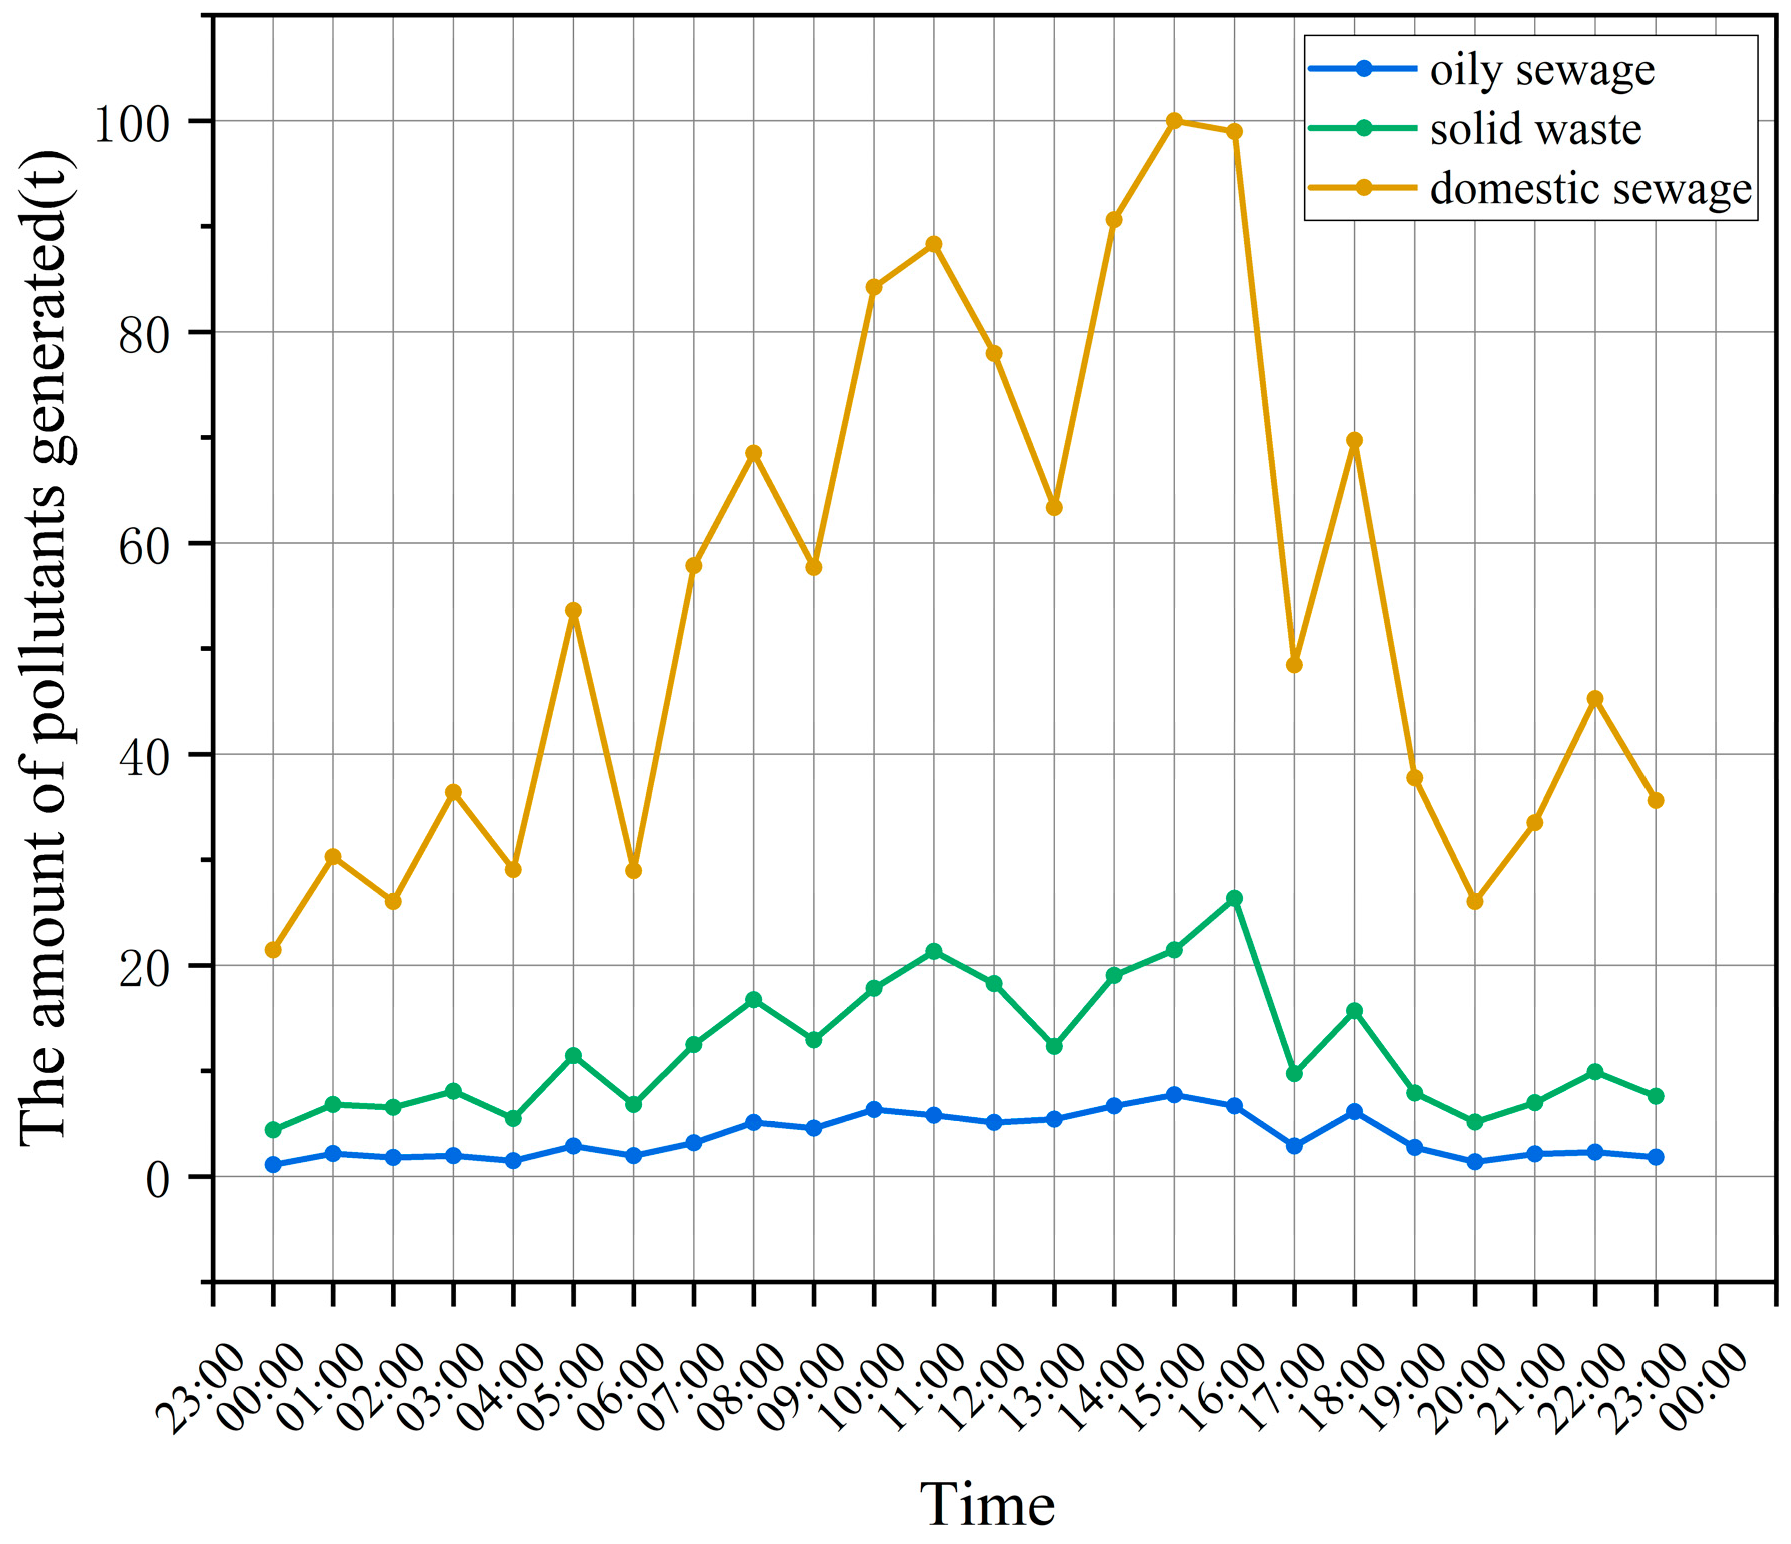
Taking 1 January 2024 as an example, the cumulative hourly generation volume of various pollutants in the study area over a single day is calculated, with the results shown in Figure 8. During this period, a total of 6296 ships are identified from the AIS data. The hourly cumulative generation volume of domestic sewage and solid waste peaked between 3:00 p.m. and 4:00 p.m. Specifically, the generation volume of domestic sewage approached 100 t. The generation pattern of domestic solid waste was broadly consistent with that of domestic sewage, with total amounts remaining below 30 t. Although slight increases are observed around midday and in the afternoon, the overall trend is relatively stable. In contrast, the generation volume of oily sewage is considerably lower, generally remaining below 5 t. A comparison with results from other dates indicates that pollutant generation volume tends to be higher overall from midday to the early evening.
Figure 8.
Hourly generation volume of water pollutants in the study area on 1 January 2024.
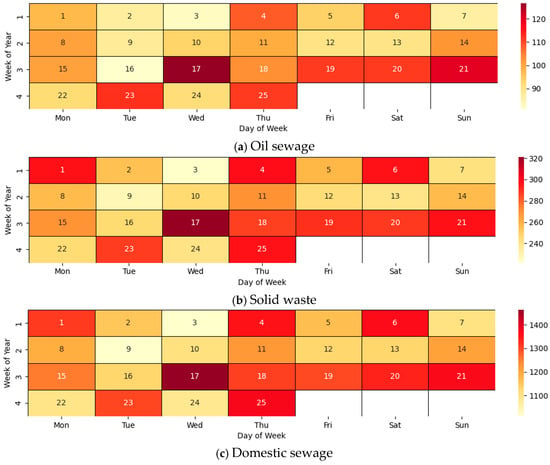
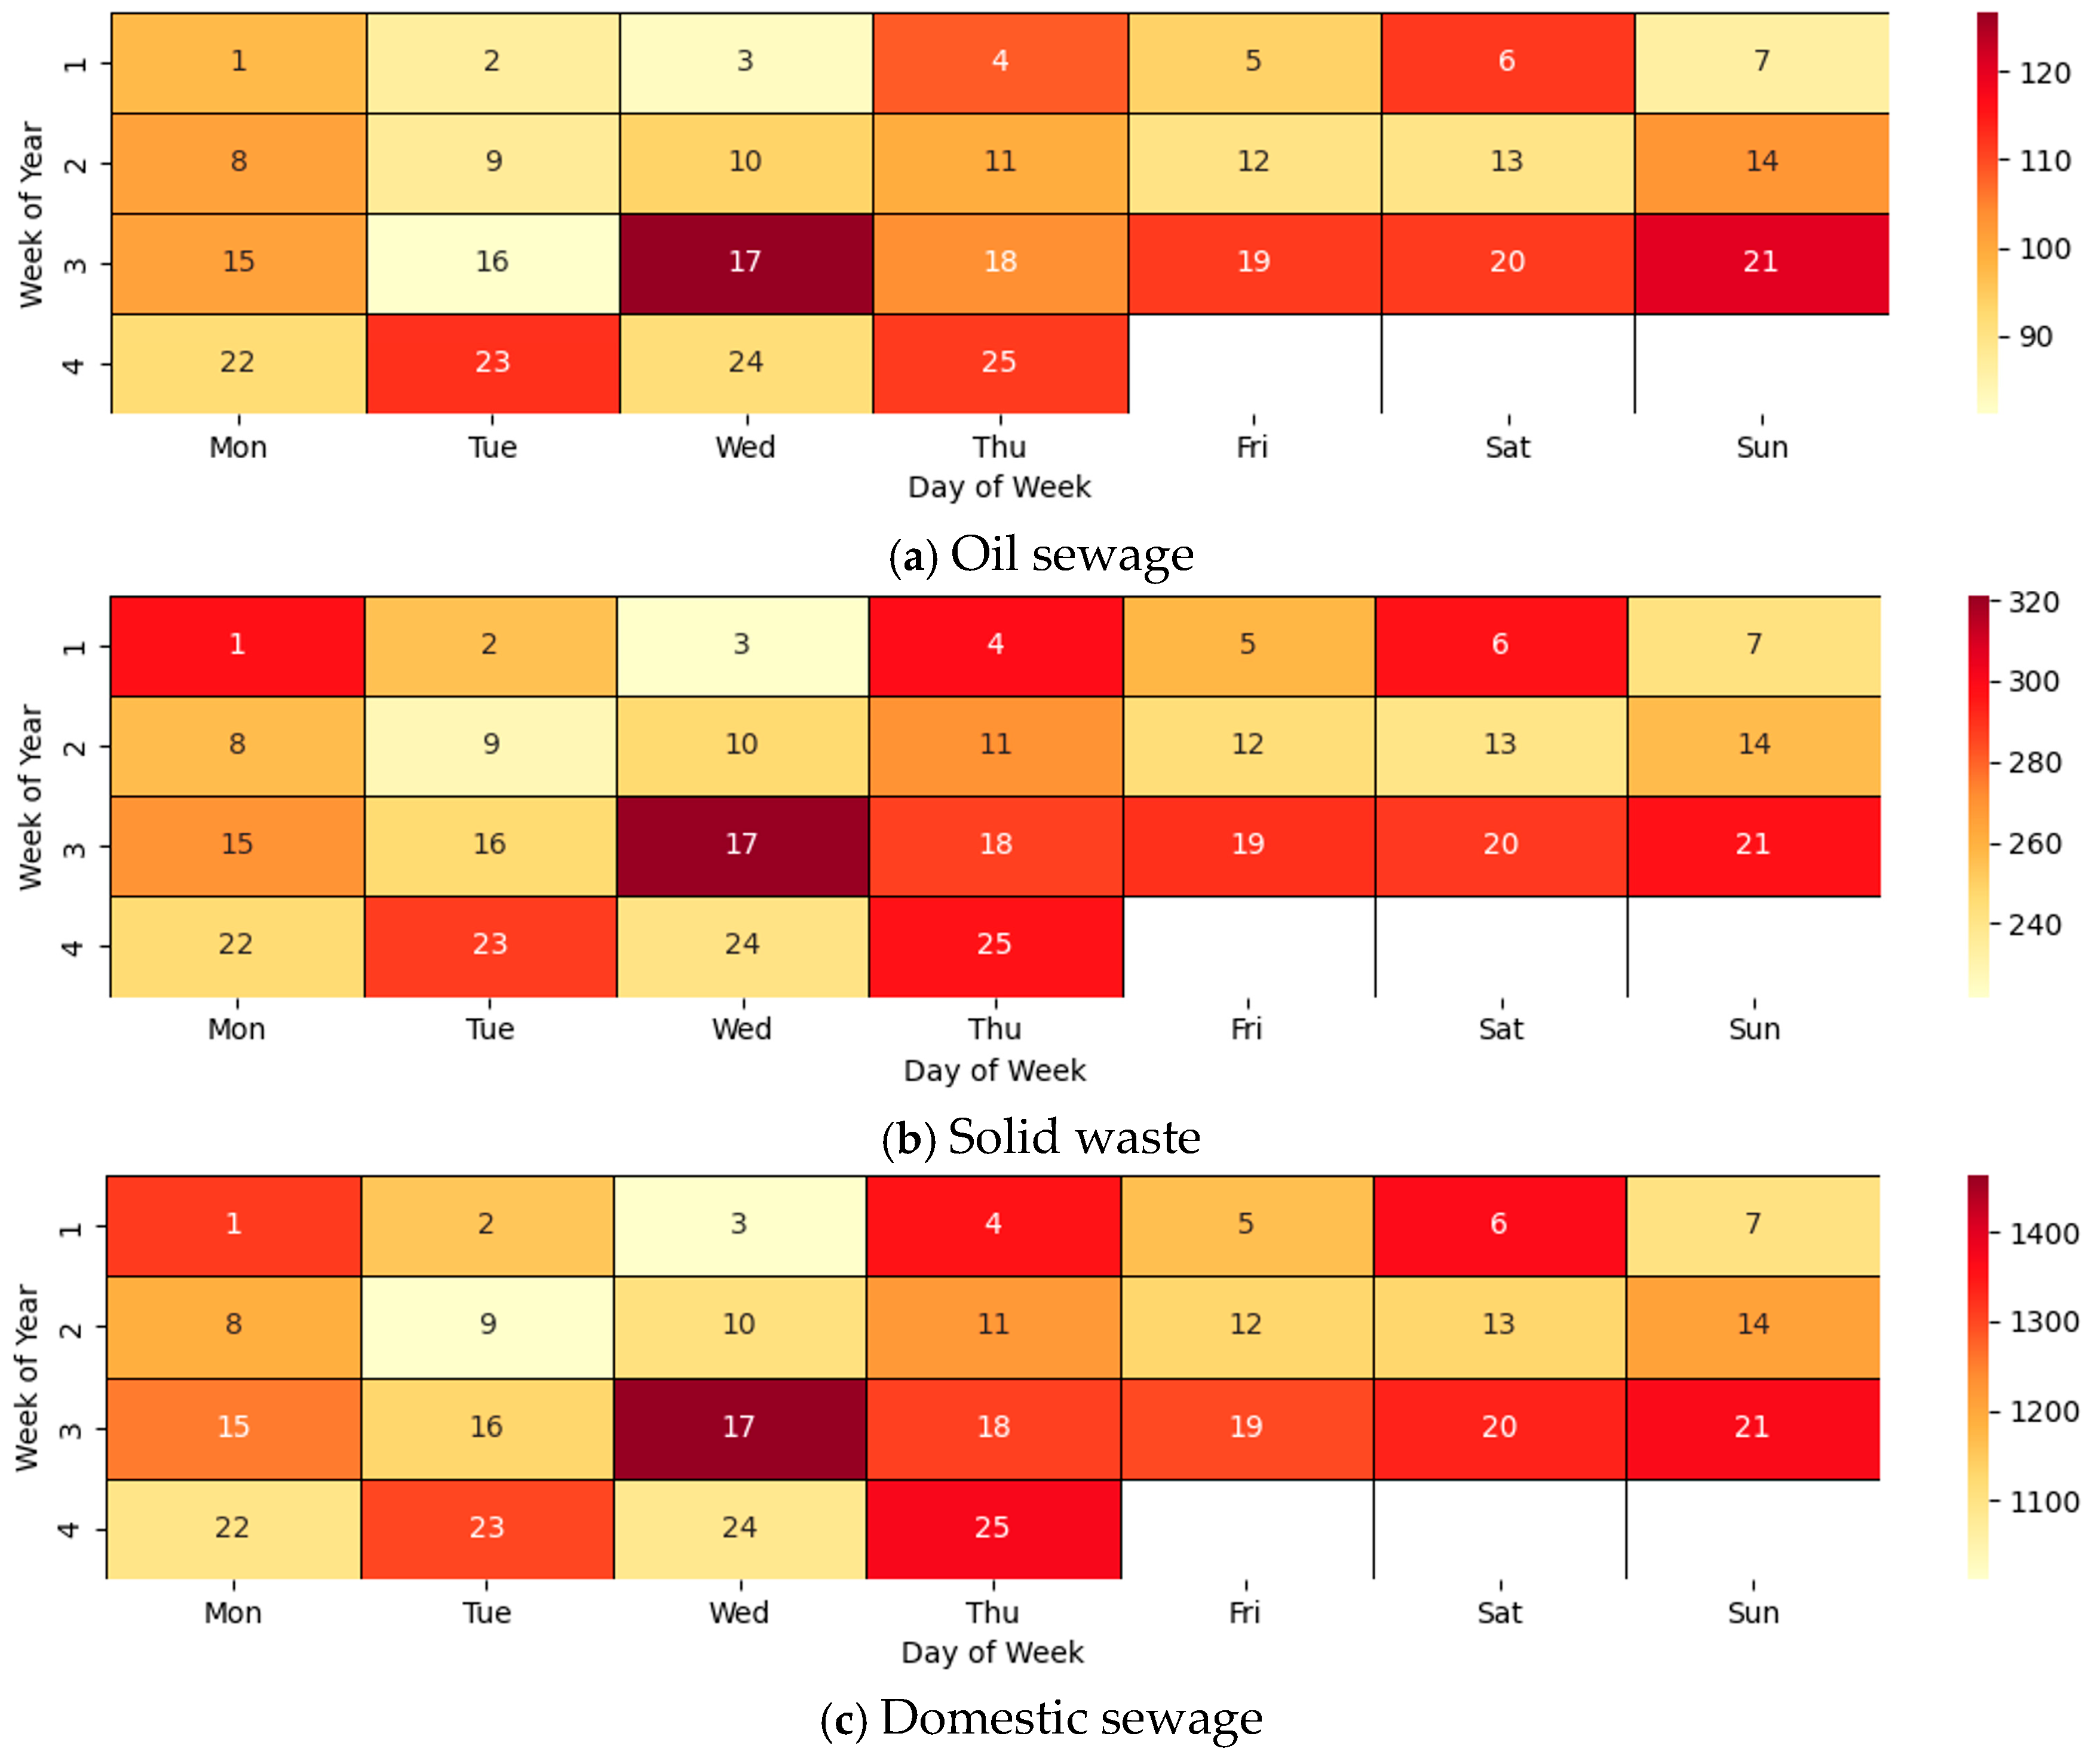
The calendar plots of daily generation volume for different types of water pollutants are shown in Figure 9. On the whole, due to frequent ship activities, pollutant generation volume remains relatively high and exhibits a generally stable pattern. Notably, 17 January represents the peak period of pollutant generation, during which the amounts of oily sewage, domestic sewage, and solid waste are all significantly higher than those on other days. This can be attributed to the higher ship traffic volume and activities on that day, which resulted in increased pollutant generation.
Figure 9.
Calendar plot of water pollutant generation volume.
4.2. Analysis of Specific Pollutant Items
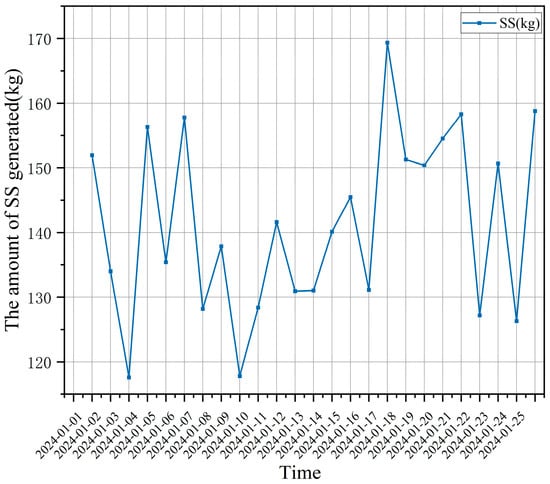
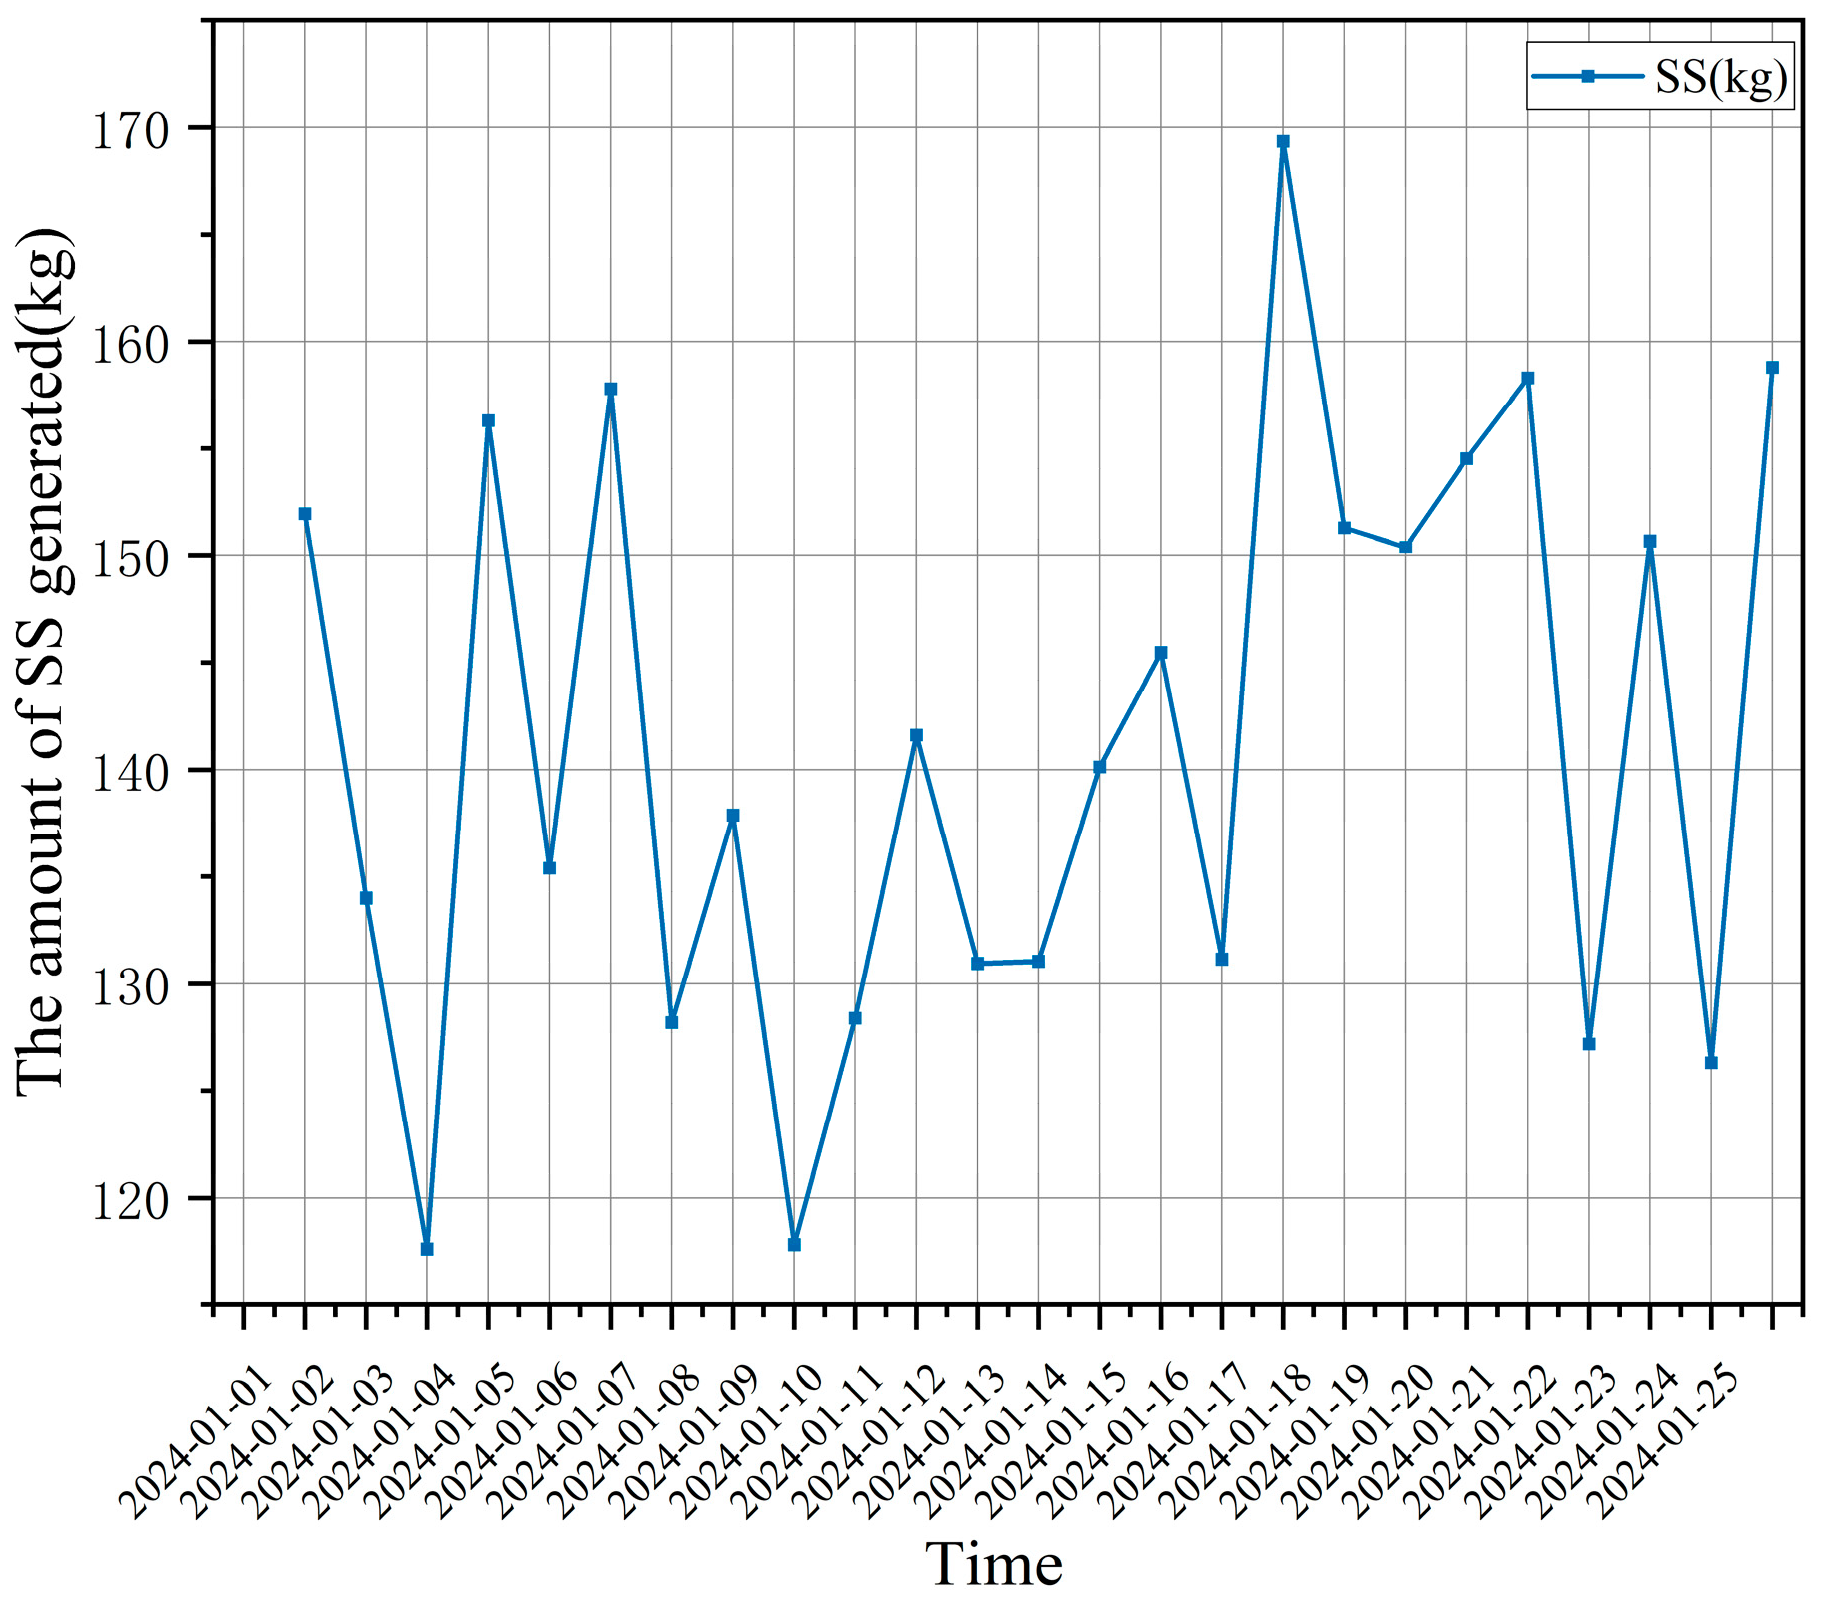
Based on the total generation volume of domestic sewage and oily sewage, together with emission factors obtained from onboard measurements, the amounts of specific pollutants in domestic sewage, including SS, BOD5, COD and so on, were calculated, as presented in Table 4. Taking SS as an example, the daily generation volume is illustrated in Figure 10.
Table 4.
Generation volume of specific pollutant items in domestic sewage during the study period.
Figure 10.
Daily generation volume of suspended solids.
When calculated using the pollutant discharge limits for domestic sewage specified in China’s “Standards for the Control of Ship-sourced Water Pollutant Discharges” (GB 3552-2018), the upper limits of these pollutant items in 27,782.39 t of domestic sewage are as follows: chemical oxygen demand (COD) at 3472.80 kg, suspended solids (SS) at 972.38 kg, biochemical oxygen demand over five days (BOD5) at 694.56 kg, and thermotolerant coliforms at 2.778 × 10⁹ organisms. Compared with the results shown in Table 4, the estimated values for all above pollutant items exceed the corresponding standard limits. The estimated petroleum hydrocarbon content in the oily wastewater (0.32 kg, in Table 5) is significantly below the national regulatory limit of 34.28 kg for a total volume of 2285.389 t. This result indicates that ship sewage is a key aspect of pollution prevention and control in China.
Table 5.
Generation volume of specific pollutant items in oily sewage during the study period.
The disposal of ship-sourced domestic solid waste involves either incineration on board or transportation to shore-based specialized facilities. Therefore, no emission factors are determined for its discharge into water.
4.3. Prediction Results of Ship-Sourced Water Pollutant Generation Volume in Port Areas
4.3.1. Dataset Construction
The pollutant generation volume at each trajectory point in the waters surrounding Shenzhen Port from 1 January to 25 January 2024 is aggregated at five-minute intervals. This procedure generated a dataset that includes three indicators, oily sewage generation volume, domestic sewage generation volume, and solid waste generation volume, as shown in Table 6. To prevent features with large numerical magnitudes from dominating the model training process, the Min–Max normalization method was applied to the data.
Table 6.
Example of the dataset.
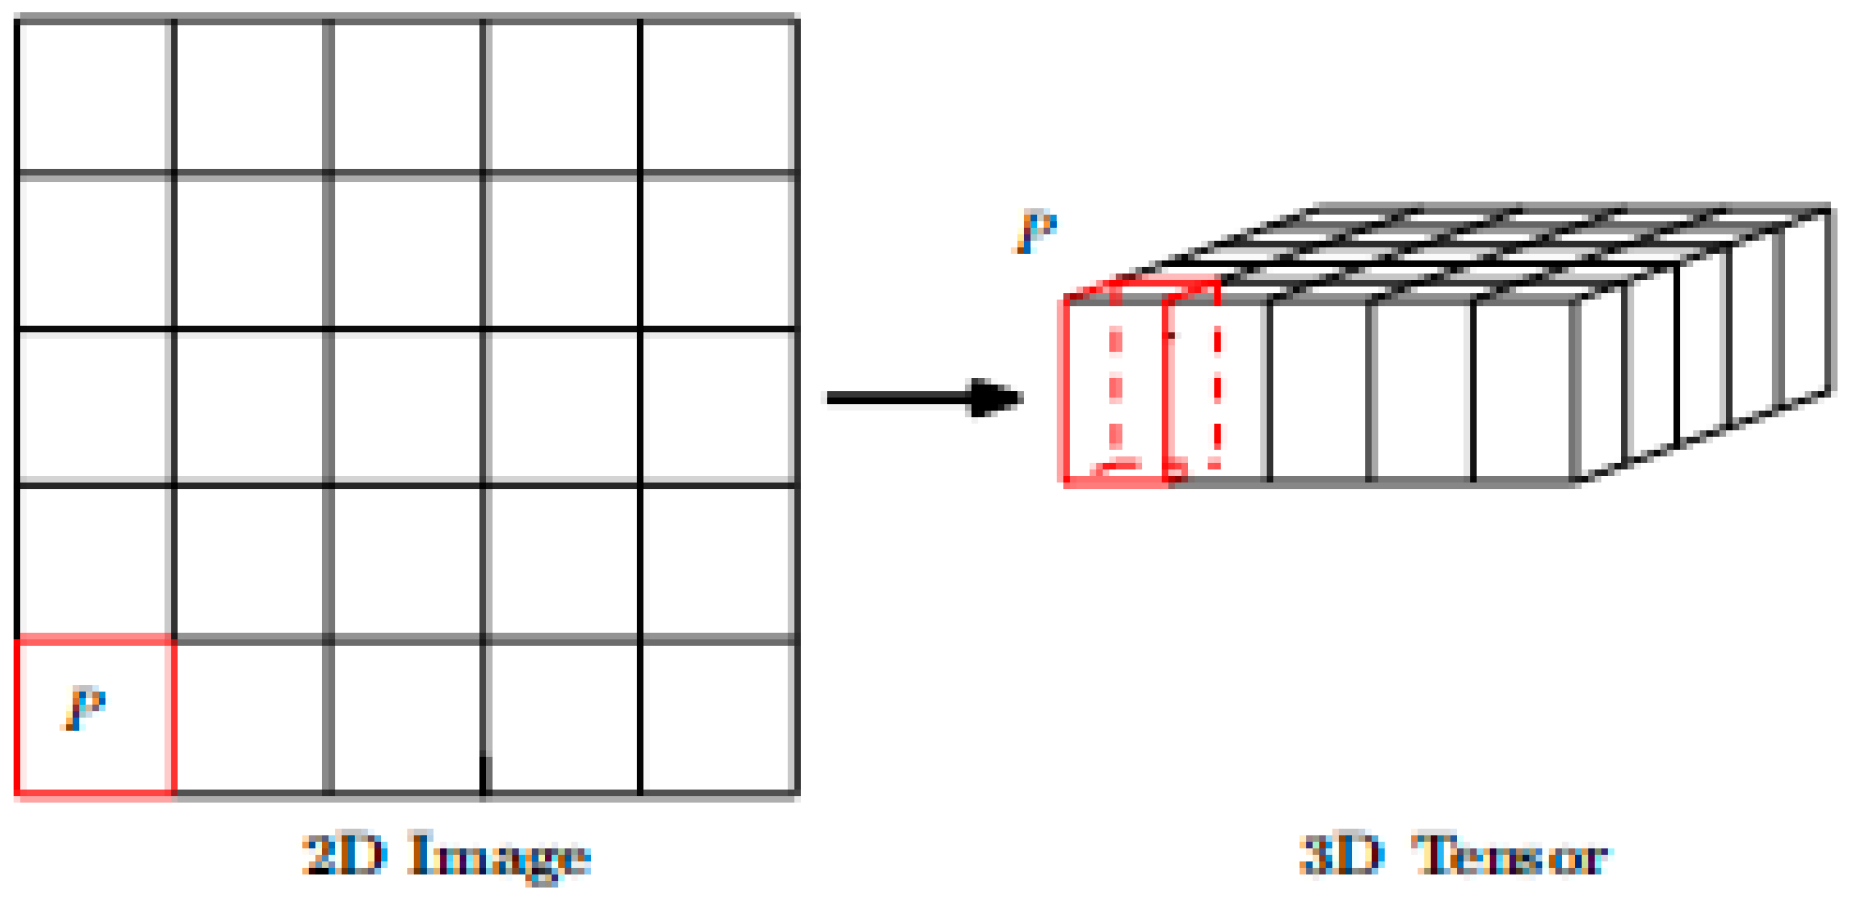
To enable the ConvLSTM model to effectively process water pollutant generation data, the original data need to be transformed into a 3D spatiotemporal tensor. As illustrated in Figure 11, the pollutant generation data at each time step are treated as a 2D image, where each grid cell represents a spatial location and the value within each cell denotes the pollutant generation volume at that location. Multiple 2D images along the time dimension are then stacked to form a 3D tensor, which can be used as the input to the ConvLSTM model.
Figure 11.
Data format transformation.
The preprocessed time series data are divided into training, validation, and test sets. Specifically, 70% of the data are used as the training set for learning model parameters, 15% as the validation set for hyperparameter tuning and optimization, and the remaining 15% as the test set for evaluating the final generalization performance of the model. To enable the deep learning model to effectively handle time series data, a sliding window approach is adopted to construct input features and corresponding labels. The time step length is set to 288, meaning that pollutant generation data from the previous 24 h (288 time steps) are used as input features to predict pollutant generation volume at the next time step.
4.3.2. Result Analysis
The configuration of network hyperparameters is driven by a systematic assessment of model convergence, computational efficiency and data characteristics. The Adam optimizer is adopted for its adaptive learning rate capability, with a minimum learning rate of 0.0001 to ensure training stability and precision. A batch size of 32 is chosen to achieve a balance between the accuracy of gradient estimation and the efficient use of computational resources. Based on the observed convergence of loss in preliminary experiments, the number of training epochs was set to 10 to avoid overfitting.
To evaluate the efficacy of the ConvLSTM model in capturing complex spatiotemporal features and achieving high prediction accuracy, comparative experiments are conducted using traditional time series models (ARIMA, linear regression (LR), and Decision Tree (DT)), classical deep learning models (GRU, LSTM), and a hybrid spatiotemporal model (CNN-LSTM). Among these, ARIMA and LR serve as baseline models representing the capability of traditional time series approaches to fit linear and stationary sequences. GRU and LSTM are employed to assess the effectiveness of gated recurrent units in capturing temporal dependencies, while CNN-LSTM, which integrates convolutional and recurrent structures, is used to further examine the potential of staged extraction of spatiotemporal features.
The evaluation metrics adopted include mean squared error (MSE), mean absolute error (MAE), and root mean squared error (RMSE). The corresponding calculation formulas are given below, and the evaluation results are presented in Table 7.
Table 7.
Model evaluation results.
The experimental results demonstrate that the ConvLSTM model exhibits a significant advantage in pollutant generation volume prediction. Its MAE (0.0824) and RMSE (0.1433) are reduced by 93.0% and 89.9% respectively, compared with the optimal traditional model, ARIMA (MAE = 1.1842, RMSE = 1.4279). Moreover, relative to the deep learning-based LSTM model (MAE = 0.3490, RMSE = 0.5691), the error reductions reach 76.4% and 74.8%, respectively. Although the hybrid spatiotemporal model CNN-LSTM approaches performance of ConvLSTM, its prediction accuracy is still inferior to ConvLSTM due to the staged modeling of convolutional and recurrent units. These results indicate that the end-to-end integration of convolutional and gating mechanisms enables ConvLSTM to more effectively capture the spatiotemporal dynamics of pollutant dispersion.
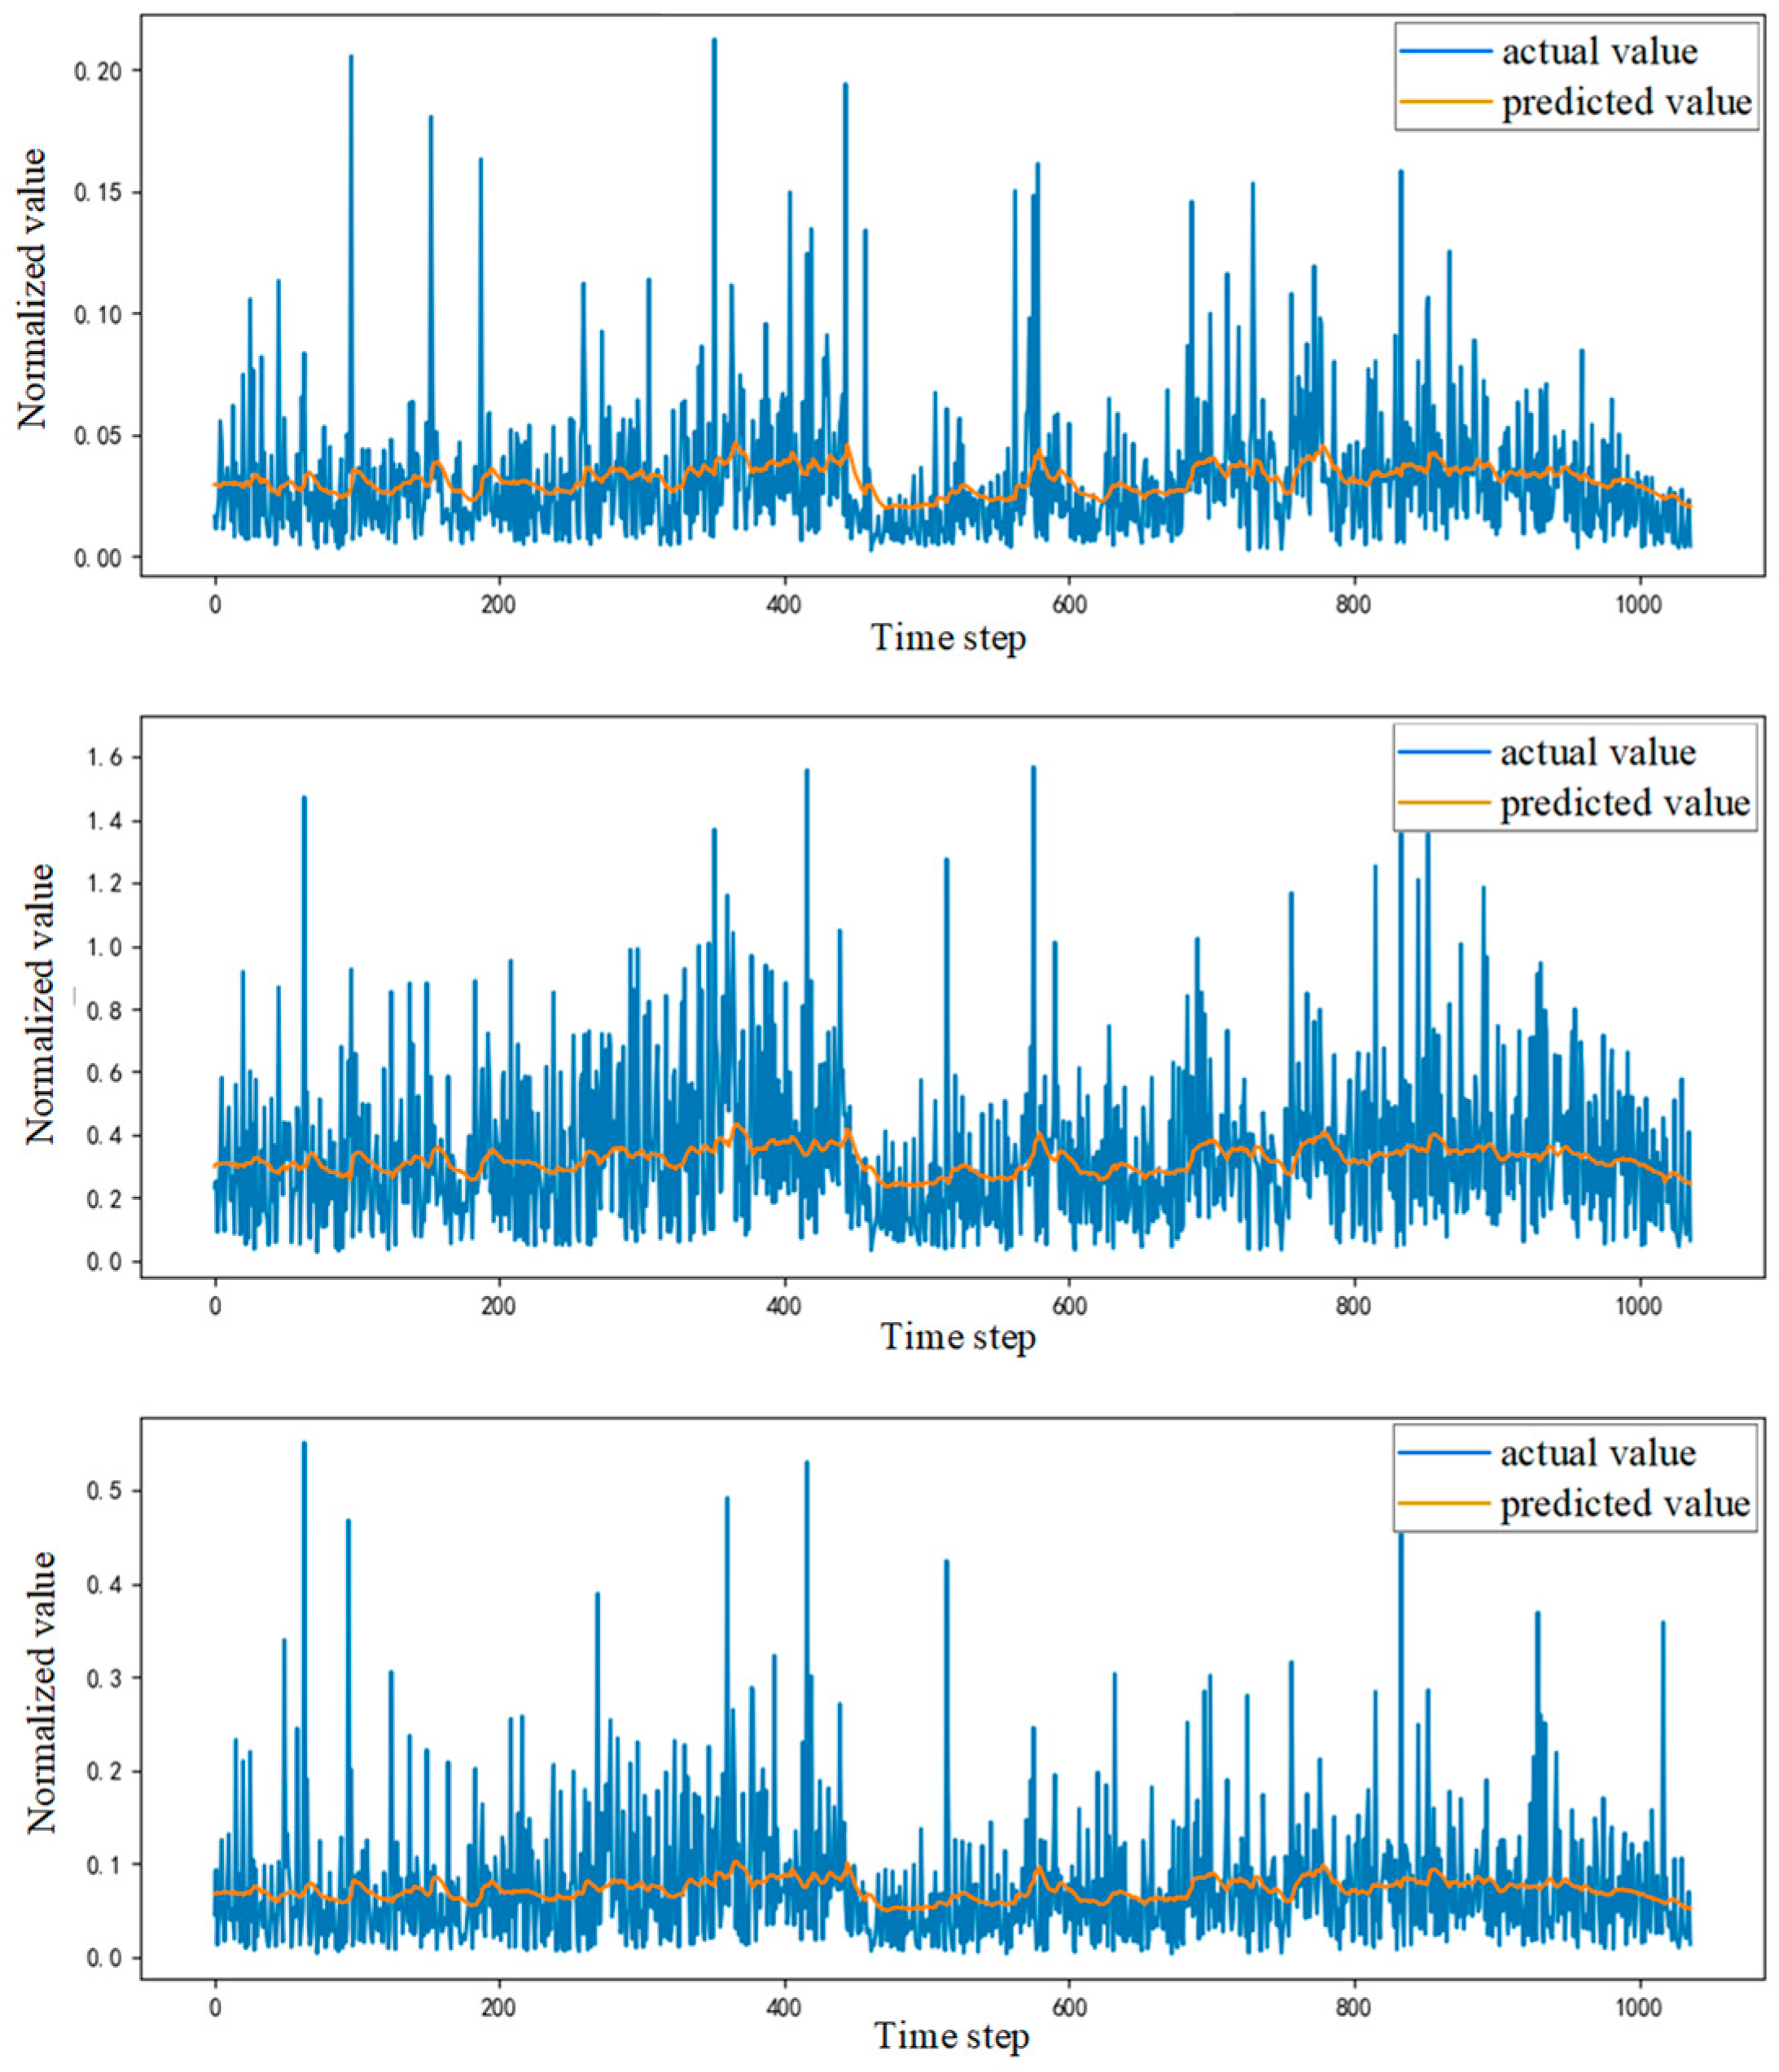
As shown in Figure 12, the ConvLSTM model is able to generally capture the long-term trends of oily sewage, domestic sewage, and solid waste, respectively. Although the actual values exhibit fluctuations, the predicted values are able to follow the overall dynamics, indicating that the model has effectively learned the temporal patterns in the data. However, the predicted curves are smoother than the observed values and fail to fully capture high-frequency fluctuations and sharp peaks, suggesting that the model still has certain limitations in representing local details and extreme events.
Figure 12.
Comparison between the predicted value and actual value.
4.4. Discussion
This study established an AIS data-based framework for calculating and predicting ship-sourced pollutant generation, which addresses the limitations of traditional statistical methods that rely on static data and lack spatiotemporal resolution [24,25]. By integrating questionnaire surveys and field sampling to determine emission factors for typical vessel types, the research improves the accuracy of pollutant quantification, which aligns with the demand for refined management of ship-sourced pollution in coastal ports [17].
Spatiotemporal analysis reveals that high-intensity pollutant generation concentrates in port waters and main navigation channels, with distinct diurnal peaks, reflecting the close correlation between ship operational activities and pollutant discharge patterns [31,39]. Excessive COD, SS, and BOD5 in domestic sewage exceed China’s discharge standards, potentially reducing waterbody dissolved oxygen, triggering eutrophication risks, and impairing the physiological activities of aquatic organisms [5,6]. In contrast, petroleum in oily sewage complies with regulatory limits, indicating that current onboard treatment measures for oily sewage are relatively effective [21]. However, long-term cumulative input of nutrients and organic pollutants still exacerbates environmental pressure in semi-enclosed coastal waters, consistent with findings on nutrient-driven eutrophication in the Baltic Sea and other marginal seas [7].
The low MAE, MSE and RMSE values of the ConvLSTM model indicate high prediction accuracy for the spatiotemporal distribution of ship-sourced pollutants. Such accuracy is important for ship pollution control in coastal ports: it ensures reliable identification of high-pollution zones, and peak hours, allowing port management department to allocate reception facilities, arrange supervision resources, and formulate emission control strategies in a targeted manner. Small prediction errors reduce the risk of under- or over-estimating pollution loads, which could otherwise lead to insufficient disposal capacity, inefficient law enforcement, or failure to curb water quality deterioration in sensitive waters.
In this study, a Chinese coastal port is selected as the research case, and the ConvLSTM model exhibits certain advantages in prediction performance compared with other alternative models under this research scenario. However, it is noteworthy that several issues should be taken into consideration when the model is extended to other regions. First, the model may show relatively weak applicability in areas with sparse ship trajectories (e.g., remote waterways). Although the method proposed in this study can be used to obtain the pollutant production of ships at certain trajectory points, due to the scarcity of ships in remote waterways, many grids have zero pollutants for a long time, which can lead to significant prediction errors. Second, this model relies on a wide range of data. Some data can be obtained from AIS data (e.g., ship location), but in order to obtain more accurate predictions, it is necessary to obtain pollutant production data of various types of ships in the port area through the port management department or maritime department.
5. Conclusions
This study proposes estimation and prediction models for the generation volume of water pollutants (oily sewage, domestic sewage, and solid waste) from ships at China’s coastal ports and conducts a case study in a specific region. Firstly, an estimation model for the generation volume of ship water pollutants is constructed based on activity data extracted from AIS (Automatic Identification System) data and generation patterns derived from the analysis of over 2000 questionnaire responses on water pollutant generation volumes. The questionnaire results indicate that while there is a certain pattern in the pollutant generation volume data obtained from the survey in relation to ship types, the correlation is not high. Therefore, the interval value method is employed to represent the generation volumes for different types of vessels. Secondly, a water pollutant prediction model based on the ConvLSTM (Convolutional Long Short-Term Memory) model is developed, taking into account the spatiotemporal distribution characteristics of water pollutants. Finally, a port region in China is selected as the research object, and nearly a month’s worth of AIS data are collected to conduct generation volume estimation and prediction analyses. The results show that the generation is relatively high during midday and afternoon hours, which is closely related to the intensive vessel entry activities during these periods. Additionally, the generation volume of domestic sewage exhibited significant fluctuations. When compared with China’s discharge standards for ship water pollutants, typical pollutants in domestic sewage, such as SS, COD and BOD5, are found to exceed the standards, while petroleum hydrocarbon in oily wastewater is below the discharge limits. This indicates that China’s coastal ports should focus on preventing and controlling ship-sourced domestic sewage pollution. The prediction results demonstrated that although the actual generation volumes fluctuated significantly, the proposed ConvLSTM model is able to track these fluctuations. Furthermore, by comparing the MAE and RMSE, it is found that the ConvLSTM model exhibited significant advantages over traditional prediction models, LSTM, and CNN-LSTM. Additionally, the following aspects identified in this study warrant further attention and research.
The calculation results revealed that the total discharge volumes of oily sewage, domestic sewage, and solid waste from ships in the study area are substantial. Although some ports in China have already acquired certain pollutant treatment capacities, the overall discharge volumes still pose a pressure on the aquatic environment. Moreover, the spatial distribution of discharges is uneven, with risks concentrated in specific areas. Vessel pollutant discharges are highly concentrated near ports and in major shipping lanes, leading to an elevated environmental risk in localized waters.
Currently, some scholars have studied the generation of vessel water pollutants across entire water bodies. However, according to China’s discharge control requirements, water pollutants can be discharged into the water beyond 12 nautical miles from ports, which does not impose a significant economic burden on shipping companies. Nevertheless, for ships approaching ports or those operating in inland waters, the generated pollutants must be delivered to ports, increasing operating costs. During our survey, we also found that a small number of ships engaged in illegal discharges. Therefore, regulatory authorities can utilize the estimated pollutant generation volume proposed in this study to monitor and regulate the delivery volumes to ports. Therefore, we suggest implementing differentiated delivery fee standards for ships with different types of pollutants and discharge levels. For ships with compliant emissions, lower delivery costs and even financial subsidies will be provided. Conversely, ships that exceed discharge standards or repeatedly violate regulations should be charged higher delivery fees and be subject to stringent supervision. This approach aims to strengthen economic incentives and encourage shipowners to proactively adopt emission reduction measures. In addition, maritime management departments can determine high-risk ships and water areas based on the spatiotemporal distribution of pollutant generation proposed in this study, and carry out targeted and precise control. In view of the high emission factor of domestic sewage found in this study, random inspections should be conducted, and ships exceeding discharge standards should be publicly disclosed to subject them to social supervision.
Overall, by accurately calculating and predicting the generation of ship-sourced oily sewage, domestic sewage and solid waste, this research can effectively identify pollution risks in the surrounding port areas. The transferable AIS-driven calculation framework and ConvLSTM prediction method can be popularized and applied in global coastal ports, helping to promote the standardized management of maritime pollution worldwide, and ultimately contribute to the realization of long-term environmental sustainability of port ecosystems.
Author Contributions
Methodology, X.M.; software, Y.L.; validation, Y.L.; investigation, Y.L.; data curation, Y.L., C.Z. and L.W.; writing—original draft preparation, H.L.; writing—review and editing, X.M. All authors have read and agreed to the published version of the manuscript.
Funding
This study was supported by Laboratory of Transport Pollution Control and Monitoring Technology (2024) JH-F005.
Institutional Review Board Statement
The study was conducted in accordance with the Declaration of Helsinki, and approved by the Institutional Review Board of Intelligent Transportation Systems Research Center, Wuhan University of Technology (protocol code 2024003, 2 March 2024).
Informed Consent Statement
Informed consent was obtained from all subjects involved in the study.
Data Availability Statement
The data in this study was collected by the Chinese coastal maritime management department, which requested that it only apply to this study. Specific data is prohibited from being used by others without permission.
Conflicts of Interest
The authors declare that there are no conflicts of interest regarding the publication of this paper.
References
- Kumar, R.; Bhushan, S.; Maurya, P.; Geenita, K.; Sawant, S.S.; Barman, M.; Choudhary, S.; Ramteke, K.; Nayak, B.B. Oil pollutants: A review on pathways in marine environments, bioavailability in various organisms and physiological disruptions in fish. Mar. Pollut. Bull. 2026, 222, 118867. [Google Scholar] [CrossRef] [Scilit] [PubMed]
- Buskey, E.J.; White, H.K.; Esbaugh, A.J. Impact of oil spills on marine life in the Gulf of Mexico: Effects on plankton, nekton, and deep-sea benthos. Oceanography 2016, 29, 174–181. [Google Scholar] [CrossRef] [Scilit]
- Beyer, J.; Trannum, H.C.; Bakke, T.; Hodson, P.V.; Collier, T.K. Environmental effects of the Deepwater Horizon oil spill: A review. Mar. Pollut. Bull. 2016, 110, 28–51. [Google Scholar] [CrossRef] [Scilit]
- Şık, E. Microplastic Pollution in Ship-Sourced Wastewater: Assessment of pollution load risk for ballast and bilgewater. J. Nav. Archit. Mar. Technol. 2026, 228, 1–10. [Google Scholar] [CrossRef] [Scilit]
- Liu, G.Q.; Xue, J.Z.; Zhang, N.H.; Wu, H.X. Seasonal variation of nutrients in the outer river section of the Pudong Airport enclosure in the South Branch of the Yangtze River Estuary. Trans. Oceanol. Limnol. 2018, 2, 67–73. [Google Scholar] [CrossRef]
- Chai, C.; Yu, Z.M.; Song, X.X.; Cao, X.H. The status and characteristics of eutrophication in the Yangtze River (Changjiang) Estuary and the adjacent East China Sea, China. Hydrobiologia 2006, 563, 313–328. [Google Scholar] [CrossRef] [Scilit]
- Raudsepp, U.; Maljutenko, I.; Kouts, M.; Granhag, L.; Wilewska-Bien, M.; Hassellöv, I.M.; Eriksson, K.M.; Johansson, L.; Jalkanen, J.P.; Karl, M.; et al. Shipborne nutrient dynamics and impact on the eutrophication in the Baltic Sea. Sci. Total Environ. 2019, 671, 189–207. [Google Scholar] [CrossRef] [Scilit] [PubMed]
- Vahtera, E.; Conley, D.J.; Gustafsson, B.G.; Kuosa, H.; Pitkanen, H.; Savchuk, O.P.; Tamminen, T.; Viitasalo, M.; Voss, M.; Wasmund, N.; et al. Internal ecosystem feedbacks enhance nitrogen-fixing cyanobacteria blooms and complicate management in the Baltic Sea. AMBIO J. Hum. Environ. 2007, 36, 186–194. [Google Scholar] [CrossRef] [Scilit]
- Funkey, C.P.; Conley, D.J.; Reuss, N.S.; Humborg, C.; Jilbert, T.; Slomp, C.P. Hypoxia sustains cyanobacteria blooms in the Baltic Sea. Environ. Sci. Technol. 2014, 48, 2598–2602. [Google Scholar] [CrossRef] [Scilit]
- Ankhi, S.D.; Rahman, M.S. Impacts of global shipping operations on marine organisms: Emerging contaminants, biodiversity monitoring, and management strategies: A 25-year review. Environ. Sci. Pollut. Res. 2026, 33, 4557–4592. [Google Scholar] [CrossRef] [Scilit]
- Li, H.Y.; Duan, D.D.; Beckingham, B.; Yang, Y.; Ran, Y.; Grathwohl, P. Impact of trophic levels on partitioning and bioaccumulation of polycyclic aromatic hydrocarbons in particulate organic matter and plankton. Mar. Pollut. Bull. 2020, 160, 111527. [Google Scholar] [CrossRef] [Scilit]
- Madgett, A.S.; Yates, K.; Webster, L.; McKenzie, C.; Brownlow, A.; Moffat, C.F. The concentration and biomagnification of PCBs and PBDEs across four trophic levels in a marine food web. Environ. Pollut. 2022, 309, 119752. [Google Scholar] [CrossRef] [Scilit] [PubMed]
- Zhu, L.; Wang, C.G.; Huang, L.L.; Ding, Y.; Cheng, Y.N.; Wu, Q.X. Tissue-specific distribution and trophic transfer of PCBs in marine organisms from the Beibu Gulf, South China Sea: Probabilistic health risk assessment via Monte Carlo simulation. Ecotoxicol. Environ. Saf. 2025, 303, 119012. [Google Scholar] [CrossRef] [Scilit]
- International Maritime Organization. Resolution MEPC.2(VI): Resolutions Adopted by the Marine Environment Protection Committee at Its Second Session; International Maritime Organization: London, UK, 1974. [Google Scholar]
- International Maritime Organization. MEPC.227(64): Guidelines on Implementation of Effluent Standards and Performance tests for Sewage Treatment Plants; International Maritime Organization: London, UK, 2012. [Google Scholar]
- GB 3552-2018; Discharge Standard for Water Pollutants from Ships. China Environmental Science Press: Beijing, China, 2018.
- Abdellaoui, B.; Ech-cheikh, H.; Sadik, M.; Rachid, A.; Lissane, E.S.; Mounadel, A. A review on ship-generated oily waste management at ports: Current practices, challenges and future directions. Environ. Dev. Sustain. 2025, 27, 5925–5980. [Google Scholar] [CrossRef] [Scilit]
- JTS 149-1-2007; Design Code of Environment Protection for Port Engineering. China Communications Press: Beijing, China, 2007.
- JTS 149-2018; Specifications on Environmental Protection Design for Port and Waterway Engineering. China Communications Press: Beijing, China, 2018.
- Senarak, C. The econometric model of ship-generated operational waste: The underlying tool for waste management in container port. Appl. Environ. Res. 2016, 38, 19–31. [Google Scholar] [CrossRef] [Scilit]
- McLaughlin, C.; Falatko, D.; Danesi, R.; Albert, R. Characterizing shipboard bilgewater effluent before and after treatment. Environ. Sci. Pollut. Res. 2014, 21, 5637–5652. [Google Scholar] [CrossRef] [Scilit]
- Ning, Z.; Zhu, K. Research on prevention and control technologies of harbor pollution. In Proceedings of the ICEET:2009 International Conference on Energy and Environment Technology, Guilin, China, 16–18 October 2009. [Google Scholar] [CrossRef] [Scilit]
- Motoyoshi, M.; Nishi, Y. Statistical modeling of bilge water discharge from ships during normal operation. J. Mar. Sci. Eng. 2020, 8, 320. [Google Scholar] [CrossRef] [Scilit]
- Ding, R.S.H. Statistical analysis and determination of volume of bilge water for inland ships. Ship Eng. 2000, 22, 25–31. (In Chinese) [Google Scholar]
- Deng, J.; Tang, X.; Liu, Y.L.; Huang, X.; Liu, S.H.Y. Analysis of pollutant generation criteria for inland cargo ships using big data. J. Saf. Environ. 2025, 2, 1175–1182. (In Chinese) [Google Scholar] [CrossRef]
- Dong, L.F.; Zhang, Z.J. Evaluation of the current status of domestic sewage pollution from ships in the Yangtze River. J. Xi’an Univ. Highw. Transp. 1999, 19, 75–76+104. (In Chinese) [Google Scholar] [CrossRef]
- Li, Q.X.; Li, Y.H.; Wei, X.Q. Investigation and evaluation of environmental damage of ship water pollutants in coastal cities. China Resour. Compr. Util. 2022, 40, 143–145. (In Chinese) [Google Scholar] [CrossRef]
- Xu, J.W.; Zhao, Y.X.; Li, J.; Huangpu, Y.H.; He, W. Quantity and rationality assessment of sewage from ships. China Mar. Saf. 2022, 8, 25–27. (In Chinese) [Google Scholar] [CrossRef]
- Özkaynak, Ö.H.; İçemer, G.T. Determining the bilge water waste risk and management in the Gulf of Antalya by the Monte Carlo method. J. Air Waste Manag. Assoc. 2021, 71, 1545–1554. [Google Scholar] [CrossRef] [Scilit]
- Shi, J.; Chen, R. Research on the calculation model of production and discharge of water pollutants from transport ships based on AIS data. In Proceedings of the International Conference on Smart Transportation and City Engineering (STCE 2022), Chongqing, China, 12–14 August 2022. [Google Scholar] [CrossRef] [Scilit]
- Wang, Y.Y.; Han, D.; Ma, X.F. Network analysis of ship domestic sewage discharge: The Yangtze River case. Water 2023, 15, 4270. [Google Scholar] [CrossRef] [Scilit]
- Shu, Y.; Wang, X.; Huang, Z.; Song, L.; Fei, Z.; Gan, L.; Xu, Y.M.; Yin, J. Estimating spatiotemporal distribution of wastewater generated by ships in coastal areas. Ocean. Coast. Manag. 2022, 222, 106133. [Google Scholar] [CrossRef] [Scilit]
- Li, Y.J.; Zhou, S.H.Y. Problems and countermeasures in the management of ship’s domestic sewage. World Shipp. 2024, 47, 27–30. (In Chinese) [Google Scholar] [CrossRef]
- Zhao, W.; Gan, S.H.W.; Wei, W. Analysis of new technical requirements for marine sewage treatment plants. Ship Ocean Eng. 2025, 54, 32–35. (In Chinese) [Google Scholar] [CrossRef]
- Huhta, H.K.; Rytkönen, J.; Sassi, J. Estimated Nutrient Load from Waste Waters Originating from Ships in the Baltic Sea Area; VTT Tied; Research Notes No. 2370; VTT Technical Research Centre of Finland: Espoo, Finland, 2007. [Google Scholar]
- Kalnina, R.; Demjanenko, I.; Gorbacenko, D.; Priednieks, V.; Baronins, J. Nutrient analysis of food waste from ships’ greywater in the Baltic Sea. Water 2021, 13, 2421. [Google Scholar] [CrossRef] [Scilit]
- Mujingni, J.T.; Ytreberg, E.; Hassellöv, I.M.; Rathnamali, G.B.M.; Hassellöv, M.; Salo, K. Sampling strategy, quantification, characterization and hazard potential assessment of greywater from ships in the Baltic Sea. Mar. Pollut. Bull. 2024, 208, 116993. [Google Scholar] [CrossRef] [Scilit]
- Su, Q.; Li, Y.X.; Lu, N.; Qu, L.; Zhou, X.; Yu, Y.; Lu, D.P.; Han, J.S.; Xu, X.T.; Wang, X.M. Abundance, characteristics and ecological risk assessment of microplastics in ship ballast water in ports around Liaodong Peninsula, China. Mar. Pollut. Bull. 2024, 207, 120755. [Google Scholar] [CrossRef] [Scilit]
- Lu, N.; Su, Q.; Li, Y.X.; Qu, L.; Kong, L.N.; Cheng, J.Y.; Wang, C.H.; Sun, J.; Han, J.B.; Wang, X.M. Characterization of microplastic distribution, sources and potential ecological risk assessment of domestic sewage from ships. Environ. Res. 2025, 268, 120755. [Google Scholar] [CrossRef] [Scilit]
- Huang, G.H.; Baetz, B.W.; Patry, G.G. A grey linear programming approach for municipal solid waste management planning under uncertainty. Civ. Eng. Environ. Syst. 1992, 9, 319–335. [Google Scholar] [CrossRef] [Scilit]
- Parks, M.; Ahmasuk, A.; Compagnoni, B.; Norris, A.; Rufe, R. Quantifying and mitigating three major vessel waste streams in the northern Bering Sea. Mar. Policy 2019, 106, 103530. [Google Scholar] [CrossRef] [Scilit]
- Ytreberg, E.; Eriksson, M.; Maljutenko, I.; Jalkanen, J.P.; Johansson, L.; Hassellov, I.M.; Granhag, L. Environmental impacts of grey water discharge from ships in the Baltic Sea. Mar. Pollut. Bull. 2020, 152, 110891. [Google Scholar] [CrossRef] [Scilit]
- Xu, Y.; Zhu, K.Z.; Zhong, H.L. Estimation method of regional tank-washing wastewater quantity based on multi-source data. Sustainability 2024, 16, 118. [Google Scholar] [CrossRef] [Scilit]
- Hochreiter, S.; Schmidhuber, J. Long Short-term Memory. Neural Comput. 1997, 9, 1735–1780. [Google Scholar] [CrossRef] [Scilit]
- Leng, J.; Gao, M.L.; Gong, H.L.; Chen, B.B.; Zhou, C.H.F.; Shi, M.; Chen, Z.H.; Li, X. Spatio-temporal prediction of regional land subsidence via ConvLSTM. J. Geogr. Sci. 2023, 10, 2131–2156. [Google Scholar] [CrossRef] [Scilit]
- Eisenhardt, K.M. Building theories from case study research. Acad. Manag. Rev. 1989, 14, 532–550. [Google Scholar] [CrossRef] [Scilit]
- White, J.T.; Foster, L.K.; Fienen, M.N.; Knowling, M.J.; Hemmings, B.; Winterle, J.R. Towards reproducible environmental modeling for decision support: A worked example. Front. Earth Sci. 2020, 8, 50. [Google Scholar] [CrossRef] [Scilit]
- Mondelli, M.L.; Peterson, A.T.; Gadelha, L.M.R. Exploring reproducibility and FAIR principles in data science using ecological niche modeling as a case study. Environ. Data Sci. 2019, 11787, 23–33. [Google Scholar] [CrossRef] [Scilit]
- Gao, J.; Li, J.; Tong, T.H.; Chao, J.Y.; Dong, Z.H.Q.; Zhan, J.M. Water quality evaluation, pollution sources apportionment, and environment management strategies in plain reservoirs: A case study of Tianhe Lake, China. Ecol. Indic. 2025, 175, 113491. [Google Scholar] [CrossRef] [Scilit]

Disclaimer/Publisher’s Note: The statements, opinions and data contained in all publications are solely those of the individual author(s) and contributor(s) and not of MDPI and/or the editor(s). MDPI and/or the editor(s) disclaim responsibility for any injury to people or property resulting from any ideas, methods, instructions or products referred to in the content. |
© 2026 by the authors. Licensee MDPI, Basel, Switzerland. This article is an open access article distributed under the terms and conditions of the Creative Commons Attribution (CC BY) license.