


Abstract
This paper addresses the issue of lighting in historic urban spaces, using Tarnow (Poland) as a case study. The aim is to assess the impact of artificial light sources on visual comfort within the area, with particular consideration given to light pollution. A comprehensive inventory of active street lighting in the Old Town was conducted. Measurements taken at ground and eye level revealed strong inconsistencies: some areas were under-lit (<1 lx), while others showed façade illuminance above 100 lx, far exceeding recommended thresholds. The highest environmental impact was shown by decorative and globe-type fixtures, with Sky Glow Contribution Index (SGCI) values of up to 0.62. Only suspended street luminaires met CIE requirements (ULR ≤ 15%). The findings reveal that several lighting installations do not meet recommended standards, adversely affecting both human comfort and ecological balance. The study proposes strategies to optimise urban lighting, such as replacing inefficient fixtures with full cut-off LED luminaires and implementing intelligent lighting control systems which could reduce energy consumption by 50-67% while preserving the architectural character of the historic centre. The results provide evidence-based strategies for sustainable lighting modernisation in heritage cities across Europe.
1. Introduction
Night-time lighting of urban spaces presents a major challenge in balancing technological, ecological, and social demands. In accordance with the principles of sustainable development, luminaires should employ appropriate correlated colour temperature and direct luminous flux exclusively downward, thereby reducing light pollution and energy use (Jägerbrand, 2020) [1]. At the same time, urban areas must remain safe, resilient, and socially inclusive, which requires adequate illumination in underlit zones to foster a sense of security (Nawalkowski and Konior, 2022) [2]. Ensuring proper design is therefore equally about limiting excessive emissions and providing sufficient lighting where needed (Czaplicka and Czaplicka, 2022) [3].
Light pollution encompasses detrimental effects of artificial light, including inappropriate timing, location, or excessive parameters (Ściężor and Kubala, 2015) [4]. Exposure to light rich in blue wavelengths disrupts circadian rhythms and poses risks to human health (Zimmerman et al., 2019) [5]. Disruption of the natural light–dark cycle has been linked to sleep disorders (Skwarło-Sońta and Żużewicz, 2023) [6] and impaired immune system function (Markus et al., 2021) [7]. It may also contribute to cardiovascular and metabolic diseases (Arble et al., 2015) [8] and conditions such as obesity (Gangwisch, 2014) [9] and depression (Jurkowlaniec, 2017) [10]. Furthermore, exposure to artificial light at night has been associated with increased risks of hormone-related cancers, including breast (Yang et al., 2014) [11] and prostate cancer (Kloog et al., 2009) [12].
Ecological impacts are also well documented. Insects are particularly sensitive to artificial light at night (Skrob, 2023) [13], as are amphibians (Hölker et al., 2010) [14], birds (Randler, 2014) [15] and bats (Lacoeuilhe et al., 2014) [16]. Other taxa, including fish, reptiles, and terrestrial mammals, also show altered behaviour and physiology under artificial illumination (Light Pollution Think Tank, 2023) [17].
Exposure of plants to artificial light at night (ALAN) can lead to premature leafing, delayed leaf fall, and extended vegetation periods (Czaja and Kołton, 2022) [18]. These changes may alter the composition of plant communities (Hölker et al., 2010) [14], disrupt the ecological balance of an area, and contribute to shifts in local biodiversity. Furthermore, continuous illumination has been associated with chlorosis and necrosis in the leaves of cultivated plants (Kołton et al., 2022) [19]. These forms of damage impair photosynthetic function (Shibaeva et al., 2023) [20], reducing the plant’s ability to fix atmospheric carbon dioxide (Haque et al., 2015) [21]. Such disturbances can result in the case of crops’ reduced yields.
Light pollution is one of the potential factors influencing the growth of algal biomass in aquatic ecosystems, as evidenced by an increased production of chlorophyll. This phenomenon is associated with a deterioration in water quality (Moore et al., 2000) [22].
The study also makes use of the World Atlas of Artificial Night Sky Brightness (Falchi et al., 2016) [23], which indicates that both Kraków and Tarnów are among the most light-polluted areas in the Małopolska region. Previous research in Kraków has shown that decorative lighting and architectural floodlights are the main sources of skyglow (Ściężor, 2018) [24]. While the scale of the problem is larger in Kraków due to its metropolitan size, the same types of problematic luminaires occur in Tarnów. This makes Tarnów a representative example of medium-sized historic cities in Central Europe, where the balance between heritage illumination and environmental protection is particularly challenging.
Although light pollution has been widely studied, existing research largely focuses on large metropolitan areas and does not adequately address medium-sized historic cities, which make up a significant proportion of Europe’s urban environments. Furthermore, current approaches primarily rely on conventional photometric indicators and rarely integrate environmental, technical and heritage-related aspects within a single approach. Therefore, there is a need for a more comprehensive and transferable methodology for analysing and mitigating light pollution in such contexts, as a way to ensure effective solutions are found.
In order to address these challenges, this study introduces the Sky Glow Contribution Index (SGCI) as a supplementary tool alongside conventional photometric metrics. This enables a more precise evaluation of the environmental impact of luminaires. In addition to its technical contribution, the research provides a transferable framework for the sustainable modernisation of lighting in heritage cities, with direct implications for urban planning practice and municipal lighting policy.
This paper investigates the causes of light pollution in Tarnów, with particular emphasis on the historic old town, where the issue is most pronounced. The analysis encompassed both municipal street lighting and the illumination of historic and public utility building façades, enabling a comprehensive assessment of the problem. The novelty of this study lies in:
- The introduction of the Sky Glow Contribution Index (SGCI) serves as a complement to traditional photometric indicators. This new index allows for a more accurate evaluation of a luminaire’s contribution to artificial skyglow.
- The study integrates technical, environmental, energy, urban planning, and cultural heritage perspectives into a single, unified framework for lighting analysis and design.
- It provides a comprehensive assessment of light pollution in a medium-sized historic city, Tarnów. This addresses a significant research gap, as existing literature is typically dominated by studies of large metropolitan areas.
- The article proposes a transferable modernization model that combines field data, simulations, and energy analysis. This model offers actionable guidelines for implementing sustainable lighting solutions in historic cities across Europe.
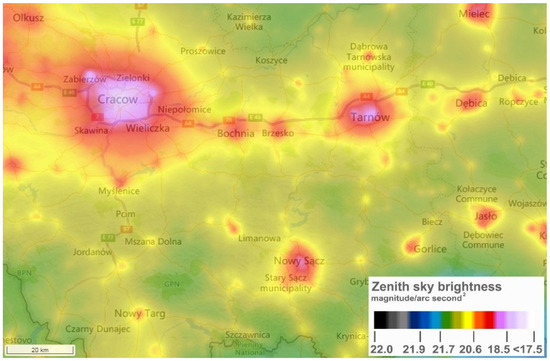
The aim of this study is to analyse light pollution in a medium-sized historic city and to develop a transferable approach for its assessment and mitigation. The regional context of light pollution in Małopolska Province, including Tarnów, is shown in Figure 1. The colours indicate different levels of zenith sky brightness (mag/arc sec2), with warmer colours corresponding to higher levels of light pollution and cooler/darker colours indicating lower levels.
Figure 1.
A model map of the level of light pollution in Malopolska Province, Poland (https://www.lightpollutionmap.info accessed on 24 July 2024).
To achieve the aim, the following research questions are addressed:
Q1: What are the main sources of light pollution in the historic urban fabric of Tarnów?
Q2: How do different types of luminaires contribute to artificial skyglow?
Q3: How can the proposed Sky Glow Contribution Index (SGCI) improve the assessment of environmental impact compared to conventional photometric indicators?
Q4: What modernisation strategies can effectively reduce light pollution while preserving safety and heritage values?
In the Polish context, where electricity production is still largely coal-based, the energy savings achieved through modernising lighting systems directly impact CO2 emissions and improve environmental quality. This study demonstrates how advanced lighting technologies can be implemented in a sustainable manner that balances the needs of residents, heritage protection and economic feasibility.
The developed solutions represent a model approach to urban lighting management. Their innovativeness lies in the integration of advanced analytical methods with practical implementation, enabling their adaptation in other cities across Poland and internationally.
2. Research Area
The research focused on the old town area of Tarnów, covering 0.214 km2, bounded by Wałowa, Szeroka, Targowa, and Bernardyńska streets, as well as the eastern section of Krakowska Street (IT Tarnów, 2024) [25]. The city was granted rights in 1330, which shaped its medieval layout with a central Market Square and narrow streets (MM Tarnów, 2024) [26].
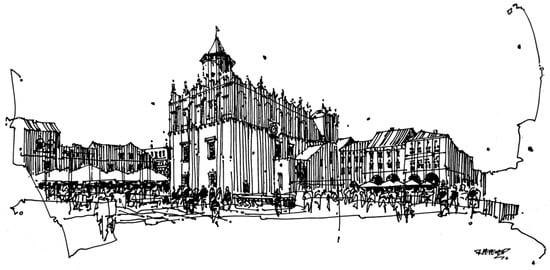
The historical, landscape, and architectural values of Tarnów constitute a significant cultural heritage of the region (Del Bianco and Montedoro, 2023) [27]. The city is notable for its Renaissance old town area, characterised by arcade tenement houses and the town hall (Figure 2), alongside the 19th-century urban layout and the modernist district of Mościce (Dutkiewicz, 1954) [28]. The towers of the town hall and the cathedral remain dominant landmarks in the city centre (Krupiński, 1986) [29].
Figure 2.
Tarnów Market Square. Drawing by Beata Malinowska-Petelenz.
Tarnów is also distinguished by its historic brick buildings, typical of private towns in the late Middle Ages, and the richly adorned interiors of its churches, setting it apart from royal towns of comparable size (Chrzanowski and Kornecki, 1982) [30]. The Jewish community played a significant role in the city’s history, settling there between the 14th and 16th centuries, primarily along what is now Żydowska Street (Krasnowolski, 2016) [31]. Owing to its long history and numerous monuments, Tarnów remains a key location on the cultural heritage map of the region (Krasnowolski, 2021) [32].
During this research, the lighting in Market Square was switched off due to renovation work, so the analysis focused only on the surrounding streets, which were equipped with street, decorative, park and architectural luminaires. This section therefore analyses the impact of Old Town lighting on light pollution in Tarnów.
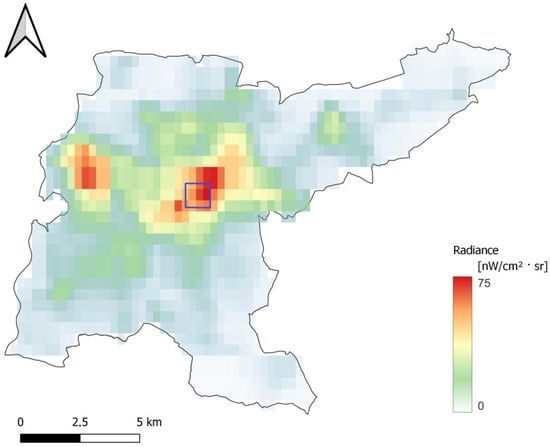
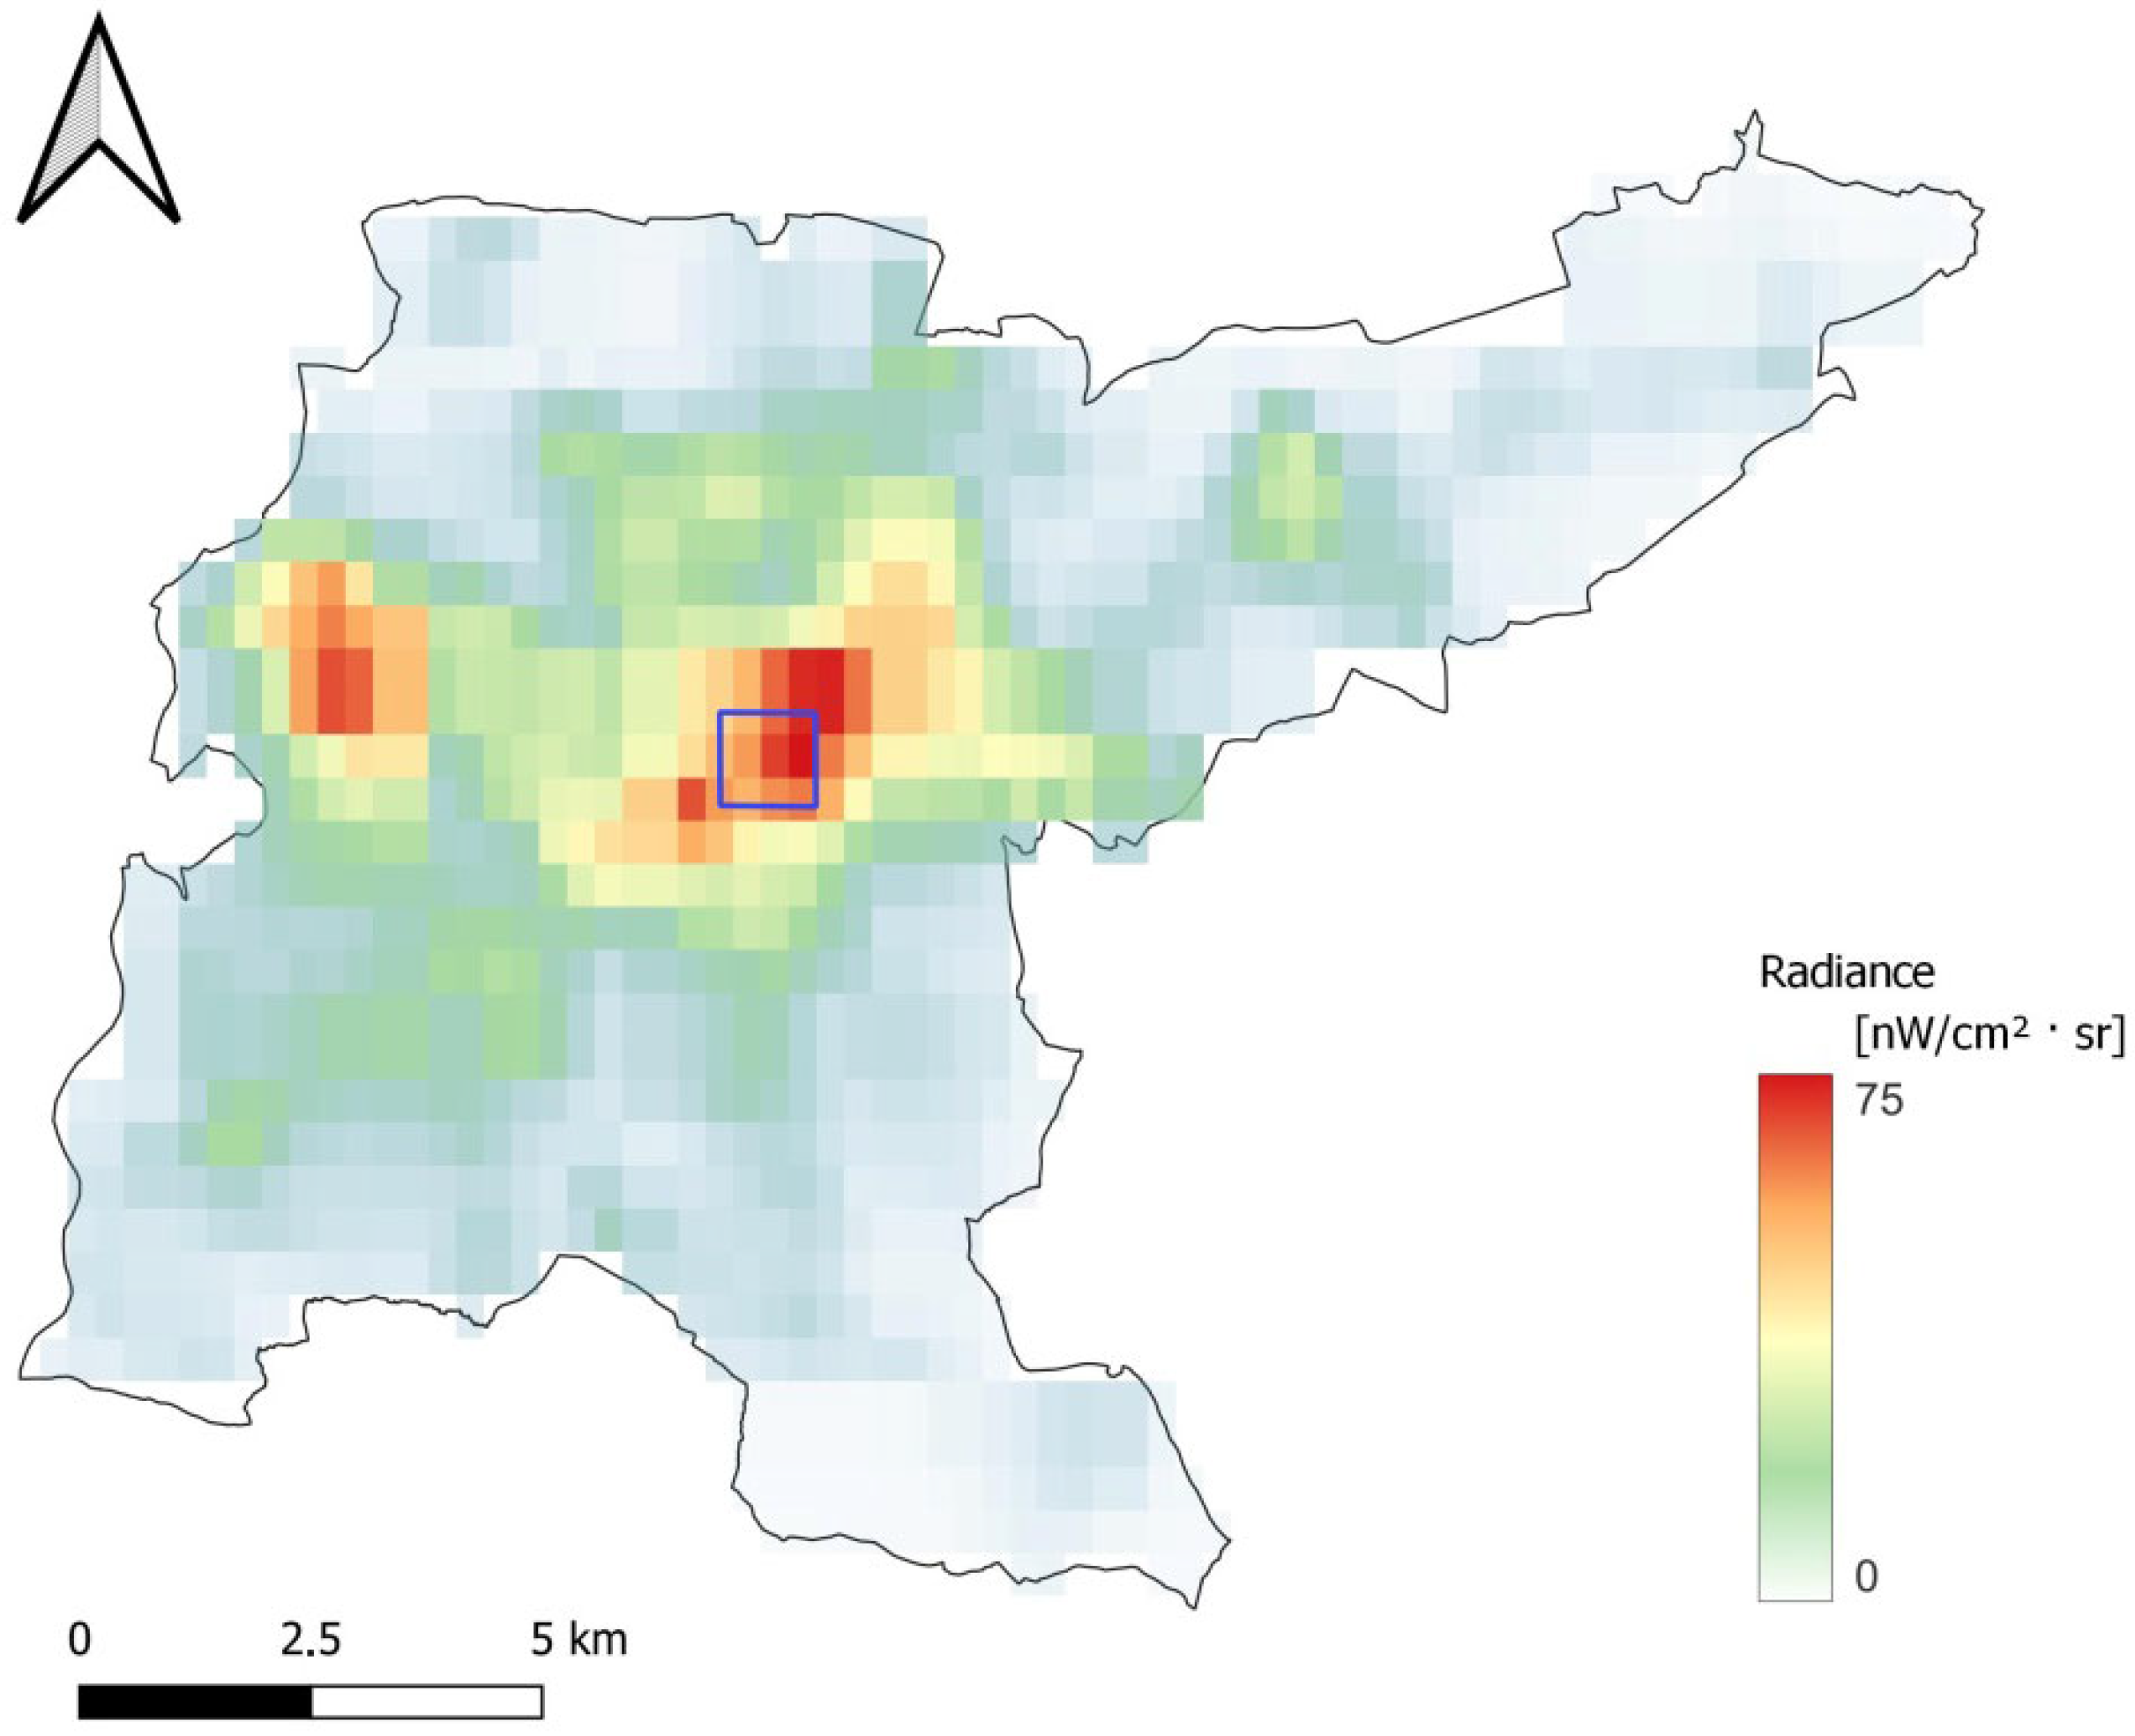
Radiance refers to the amount of light energy emitted by ground sources (Ściężor, 2021) [33]. The most commonly employed method for assessing radiance involves images captured by the VIIRS sensor aboard the Suomi NPP satellite (Elvidge et al., 2013) [34]. Both radiance images for specific nights and monthly or annual averages are available. Analysis of maps derived from VIIRS data enables the identification of radiance sources with a spatial resolution of 15 arc seconds, corresponding to approximately 500 m on the ground. In the case of Tarnów, the VIIRS images reveal two primary radiance sources: the city centre and the Grupa Azoty S.A. industrial complex in Tarnów-Mościce (Figure 3).
Figure 3.
Radiance from the Tarnów commune area. Two primary sources are visible: the Grupa Azoty S.A. industrial complex and the city centre . The study area is marked with a dark blue square.
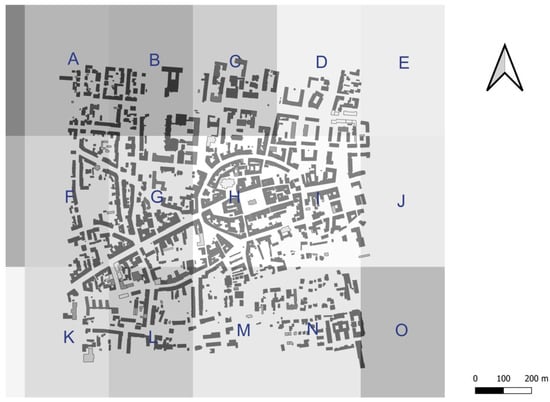
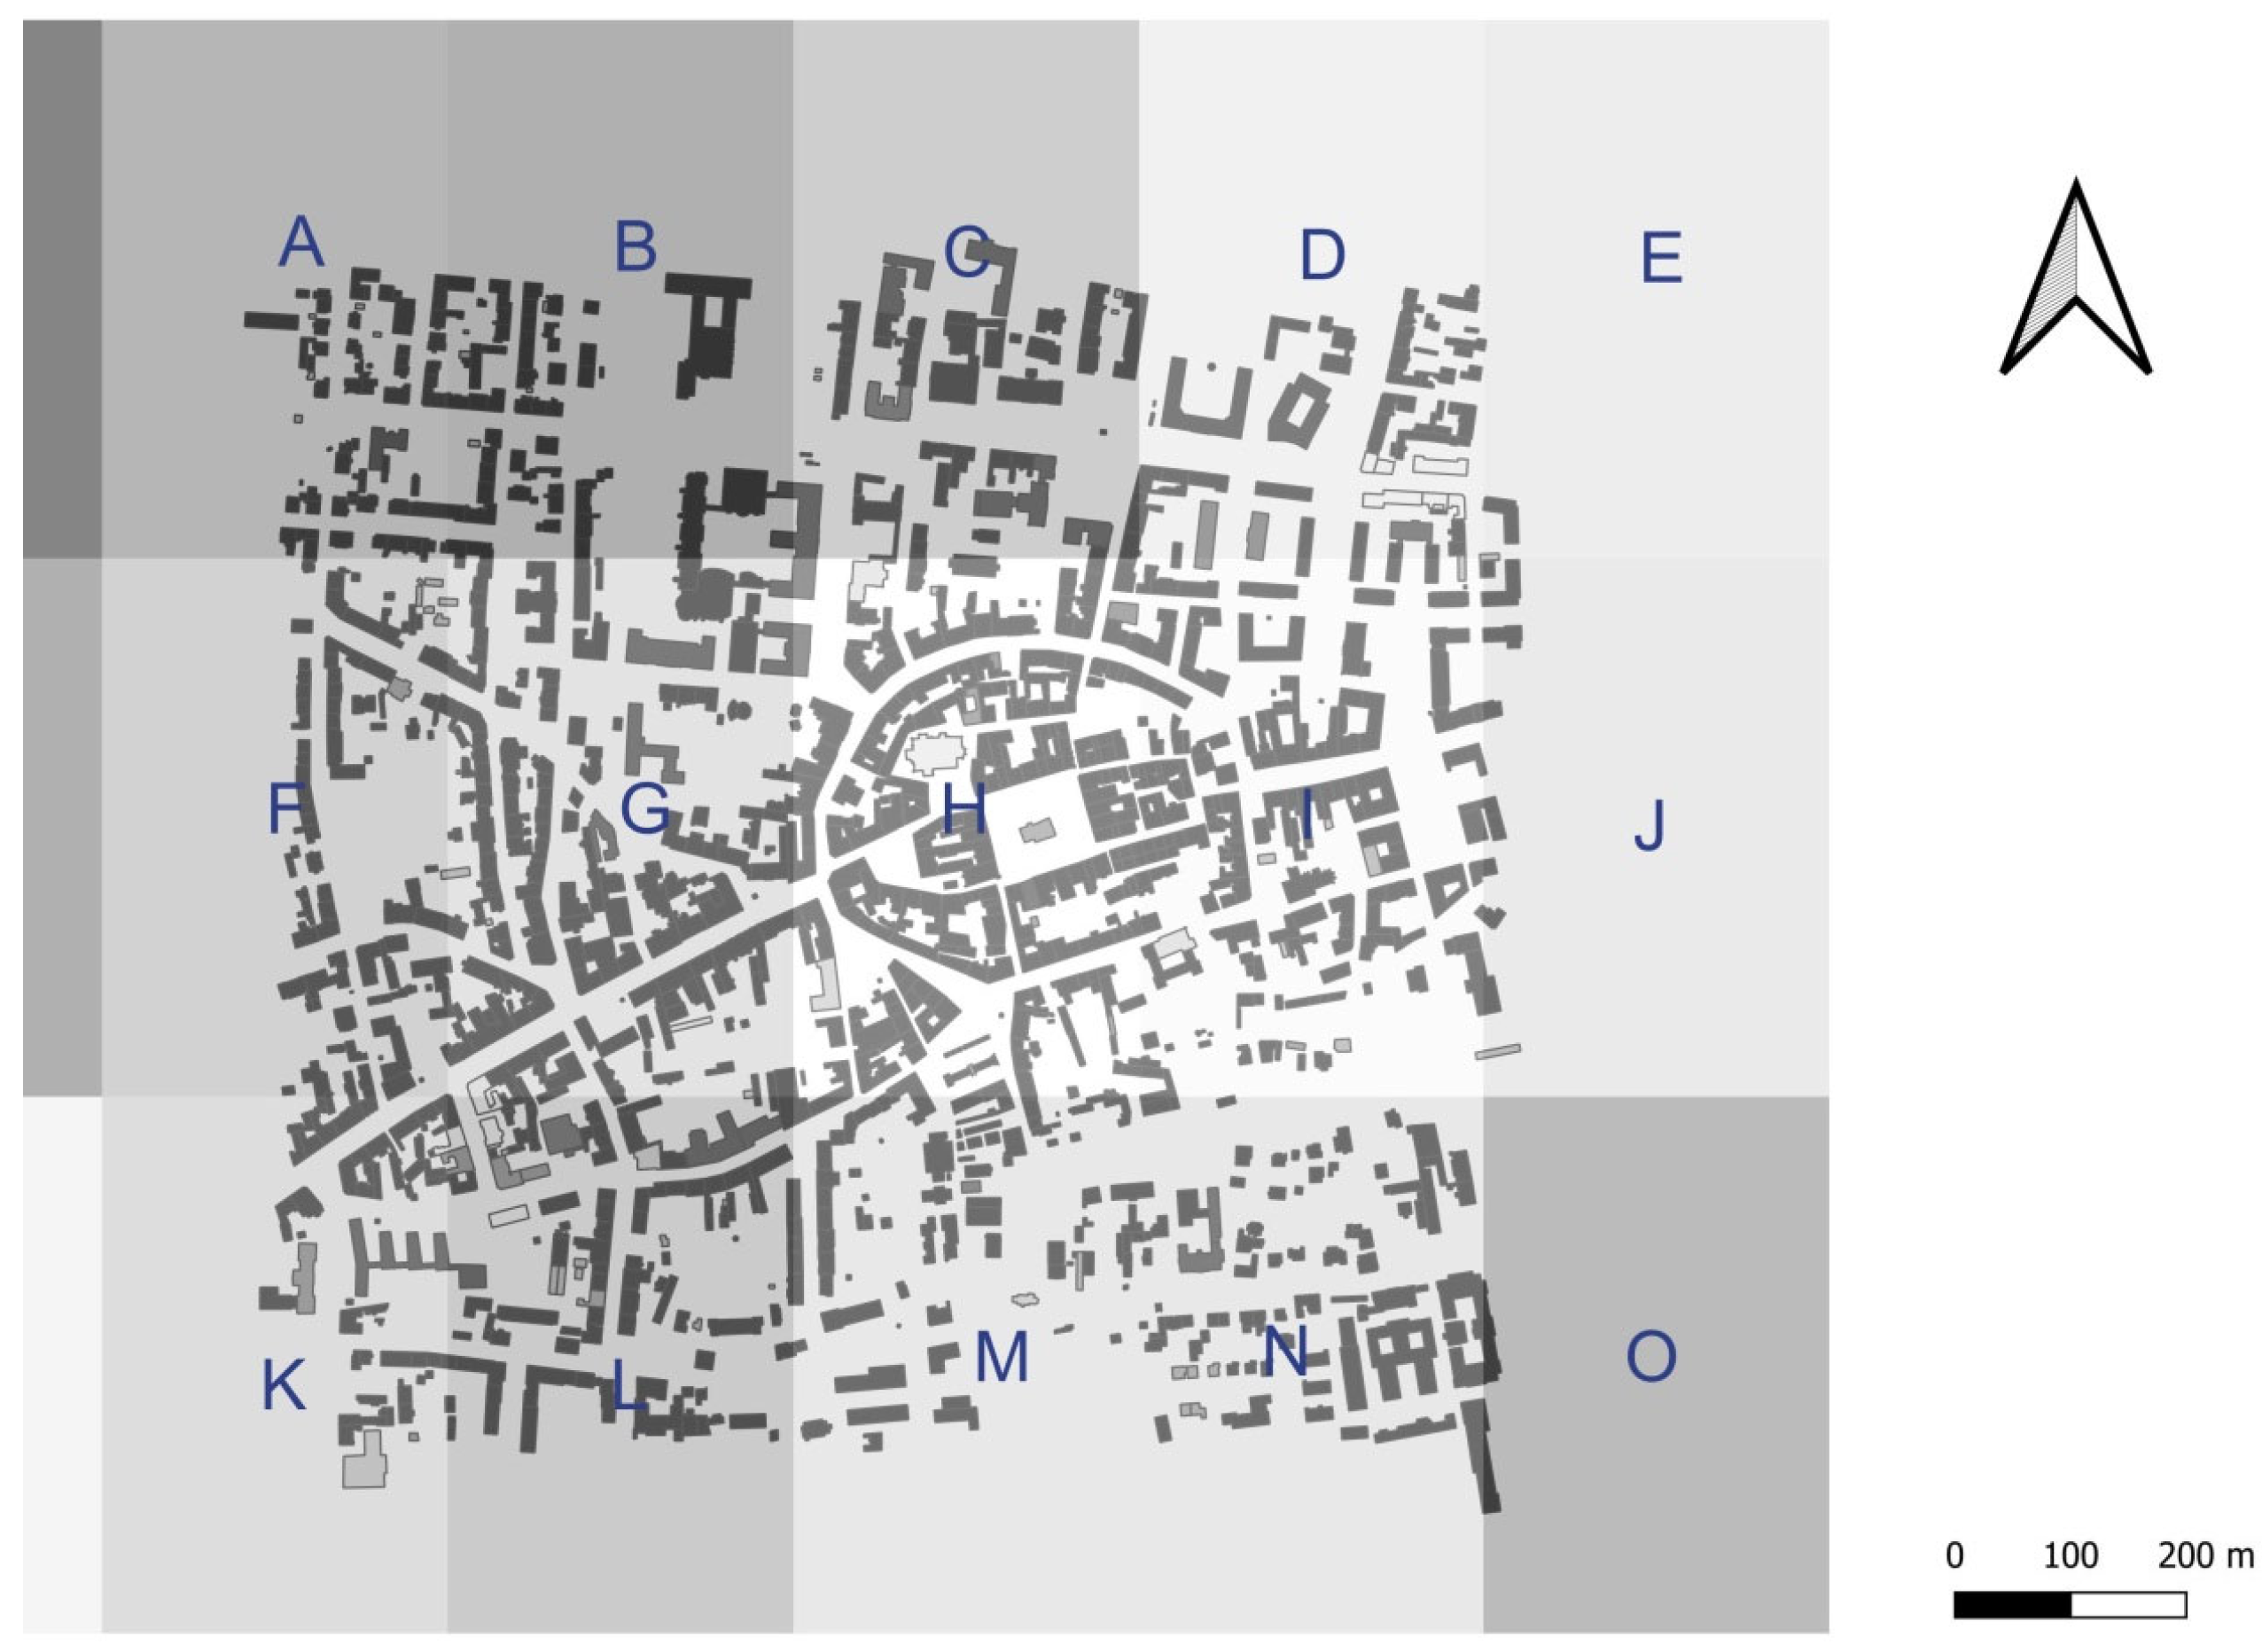
The mean annual radiance of the old town area was analysed using VIIRS satellite data from 2017 to 2021 (Zamorano et al., 2011) [35]. By overlaying night-time images of Małopolska Province captured from the International Space Station Sánchez de Miguel et al., 2019) [36] with VIIRS data, it was determined that the study area falls entirely within three VIIRS pixels (G, H, I) (Figure 4). Analysis of radiance data from these pixels indicated that the old town of Tarnów is one of the primary sources of radiance in this part of the city. The total radiance value recorded for pixels G, H, and I in 2020 was 233.7 × 10⁻⁹ W/cm2·sr.
Figure 4.
VIIRS image superimposed on a schematic plan of the study area. The letters indicate individual VIIRS pixels used in the analysis.
3. Materials and Methods
3.1. Guidelines
The photometric parameters of the existing electric lighting were evaluated for compliance with the International Commission on Illumination (CIE) guidelines, as detailed in the 2017 technical report Guide on the Limitation of the Effects of Obtrusive Light from Outdoor Lighting Installations (CIE, 2017) [37]. This report provides recommendations for assessing the impact of artificial outdoor light sources on nocturnal living organisms, including humans, and specifies permissible lighting parameters aimed at minimising light pollution. It includes various guidelines and best practices for controlling the spread of artificial light and mitigating light pollution effects. These primarily address luminaire types, their positioning, and mounting heights, while also advocating for the adjustment of light source intensity according to natural lighting conditions and regular maintenance of luminaires.
3.2. Techniques and Equipment
In this study, artificial light intensity measurements were conducted at night using a luxmeter at points located at ground level, at a height of 1.5 m above ground, and, where feasible, at window level. Analysis of the collected data enabled the identification of irregularities in the electric lighting. Additionally, both the surface brightness of the night sky and the illuminance at ground level were measured at selected locations within the old town. The surface brightness of the night sky was measured using Unihedron Sky Quality Meters (SQM-L), which have a collection angle of up to 20° from the device axis. The measured values are expressed in units of surface brightness magnitude per square arcsecond [mag/arcsec2] and denoted as Sa. Illuminance measurements were carried out with a Sonopan L-52 luxmeter, compliant with accuracy class B requirements as specified by the International Commission on Illumination (CIE, 2019) [38]. The device supports measurements across a wide range up to 199,900 lx, subdivided into four measurement sub-ranges: 1.999 lx, 19.99 lx, 199.9 lx, and 1999 lx, with corresponding reading resolutions of 0.001, 0.01, 0.1, and 1 lx, respectively. The spectral correction error of the luxmeter is ≤ 3%, and its spatial (directional) correction error is also ≤ 3%. These specifications ensure reliable and precise measurement results.
3.3. Measurement Methodology
Measurements were conducted twice on consecutive evenings, 20 and 21 February 2020, between approximately 19:00 and 21:00. During this period, the Moon was approaching its new phase, ensuring that lunar illumination did not interfere with the measurements. Although slight, transient cloud cover occurred, it did not affect the accuracy of the results. Light intensity readings were taken at predetermined points at ground level (level I), at a height of 1.5 m above ground (level II), and, where possible, on building façades at window height (level III). To minimise random errors, each measurement was repeated twice.
3.4. Measurement Points
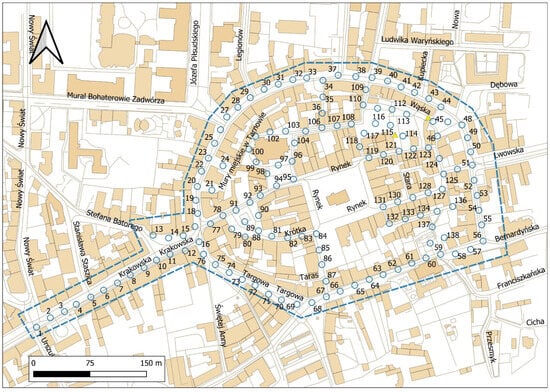
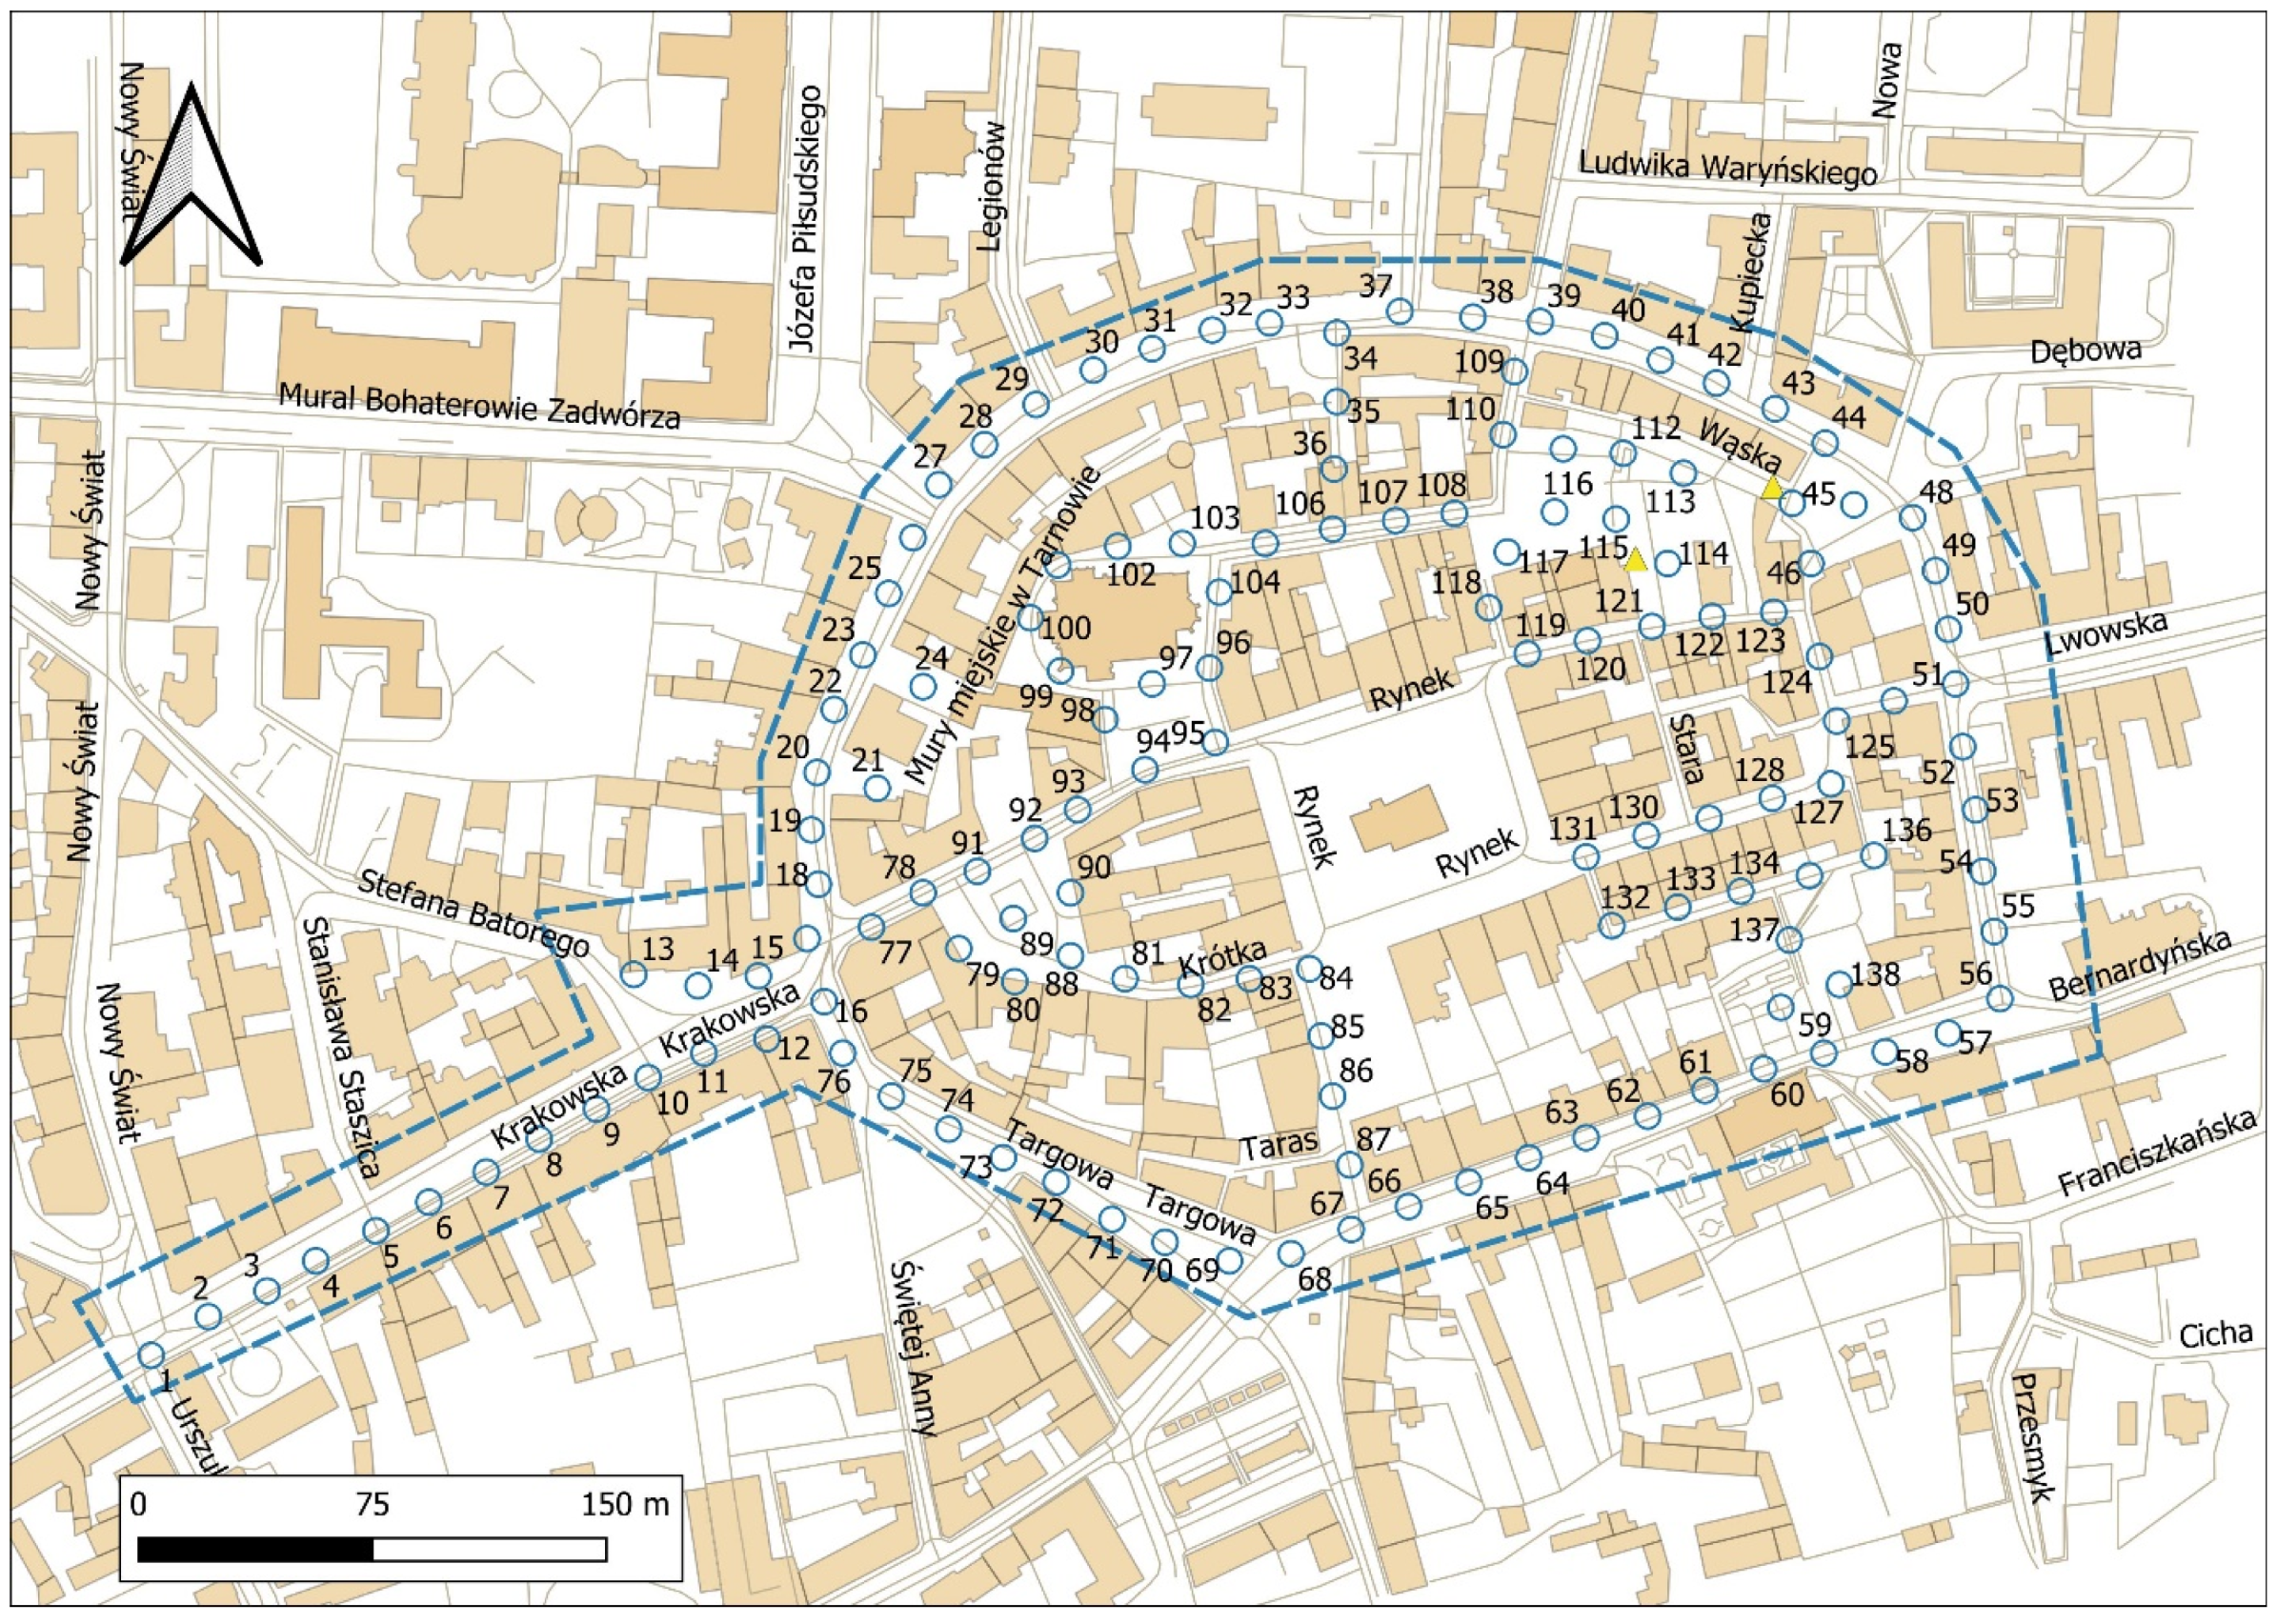
On the map of Tarnów’s old town, a uniform grid comprising 139 measurement points was established, with a spacing of 20 m between points (Figure 5). These points were located along the main streets and pedestrian pathways. Although this grid arrangement does not conform to the PN-EN 12464-2:2008 standard guidelines, similar methodologies are frequently employed in field studies of urban areas with extensive spatial coverage. Such approaches are documented in the literature, where grids with adapted geometries are used to accommodate the spatial layout and accessibility constraints of large urban environments (Kwiatkowska-Malina and Horynek, 2020; Ratajkiewicz and Michalak, 2023) [39,40]. Measurements did not include the Market Square due to ongoing renovation and restricted public access. Additionally, readings were not taken in private courtyards or other enclosed spaces at the time of measurement.
Figure 5.
Distribution of measurement points in the analysed area.
3.5. Terminology Used
The following terms relating to the types of lighting and their construction are used throughout this work:
- lampshade—the outer component of a luminaire, made from light-transmitting materials such as glass or plastic;
- body—the central, load-bearing element of the luminaire that serves as a mechanical housing and base for all components, including the light source, power supply system, lampshade, or reflector;
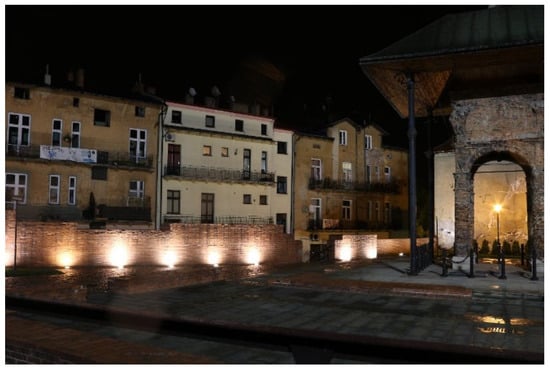
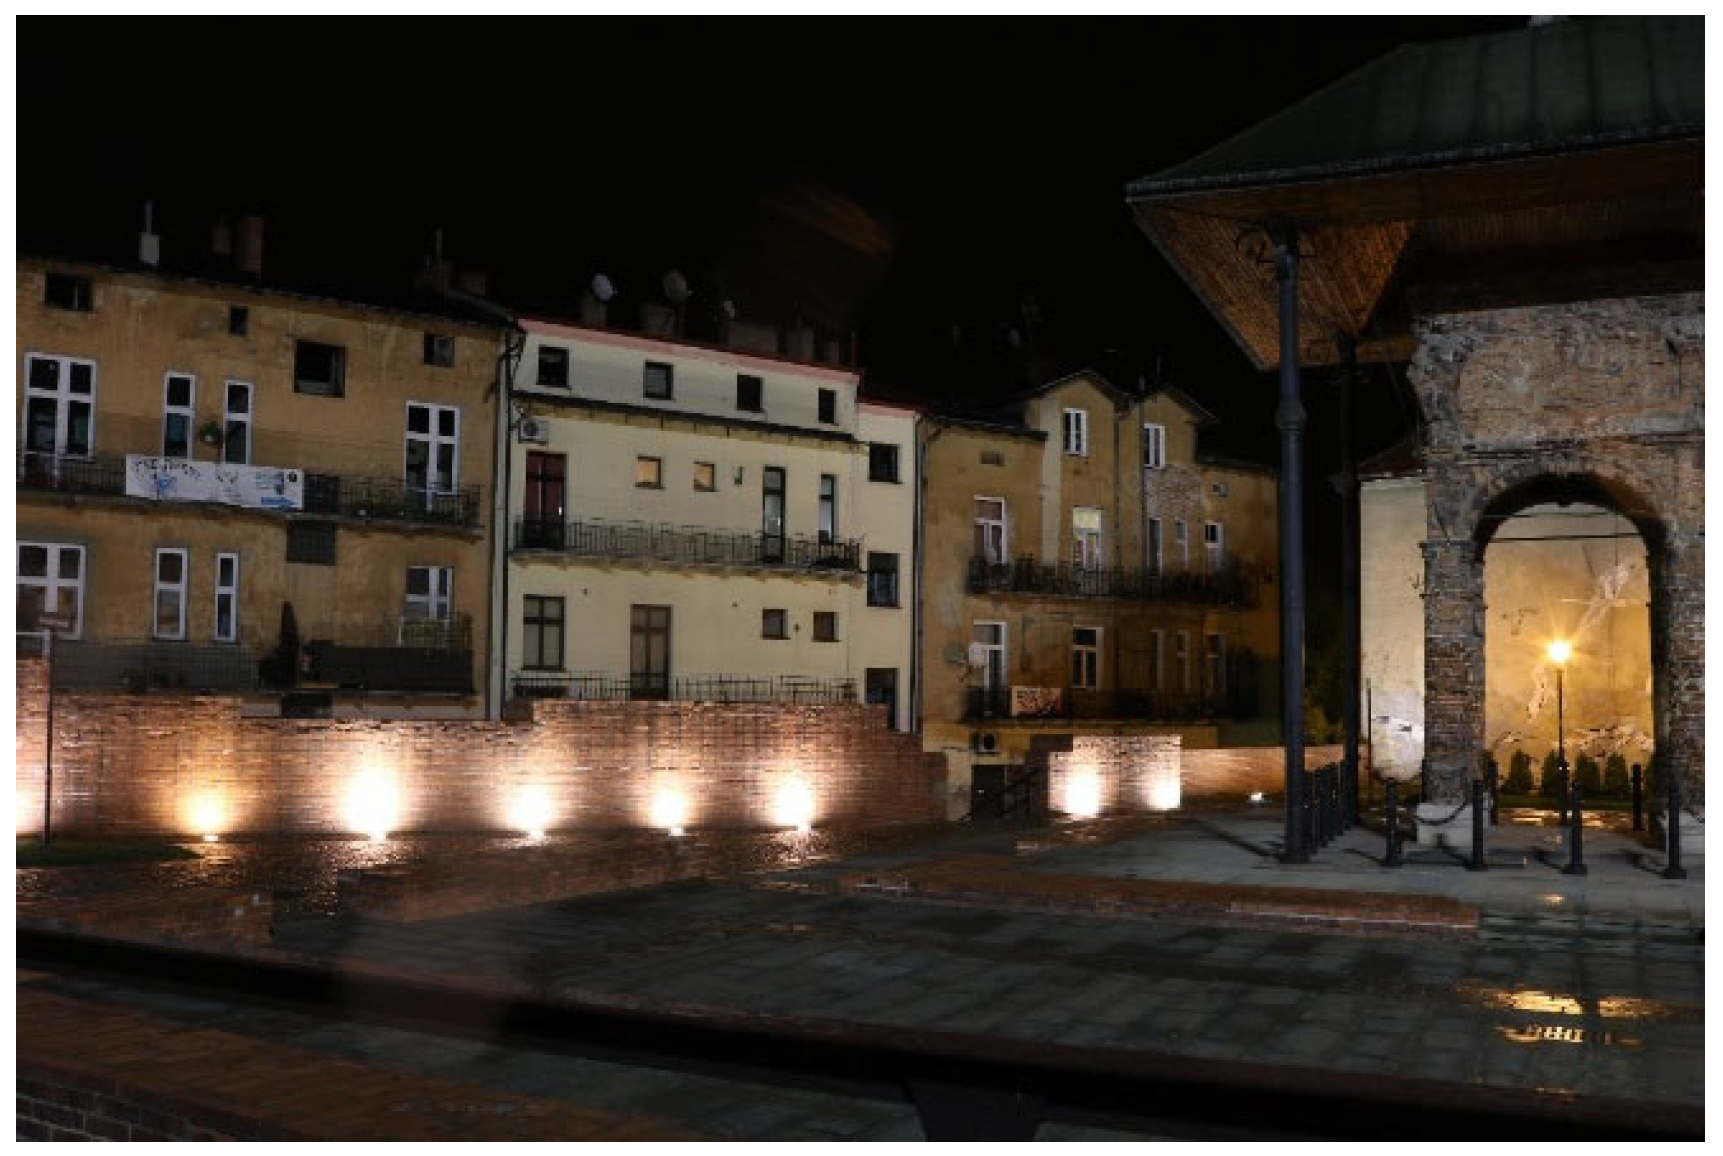
- pavement reflector—a lamp mounted at ground level, directing light upwards towards the zenith (Figure 6);
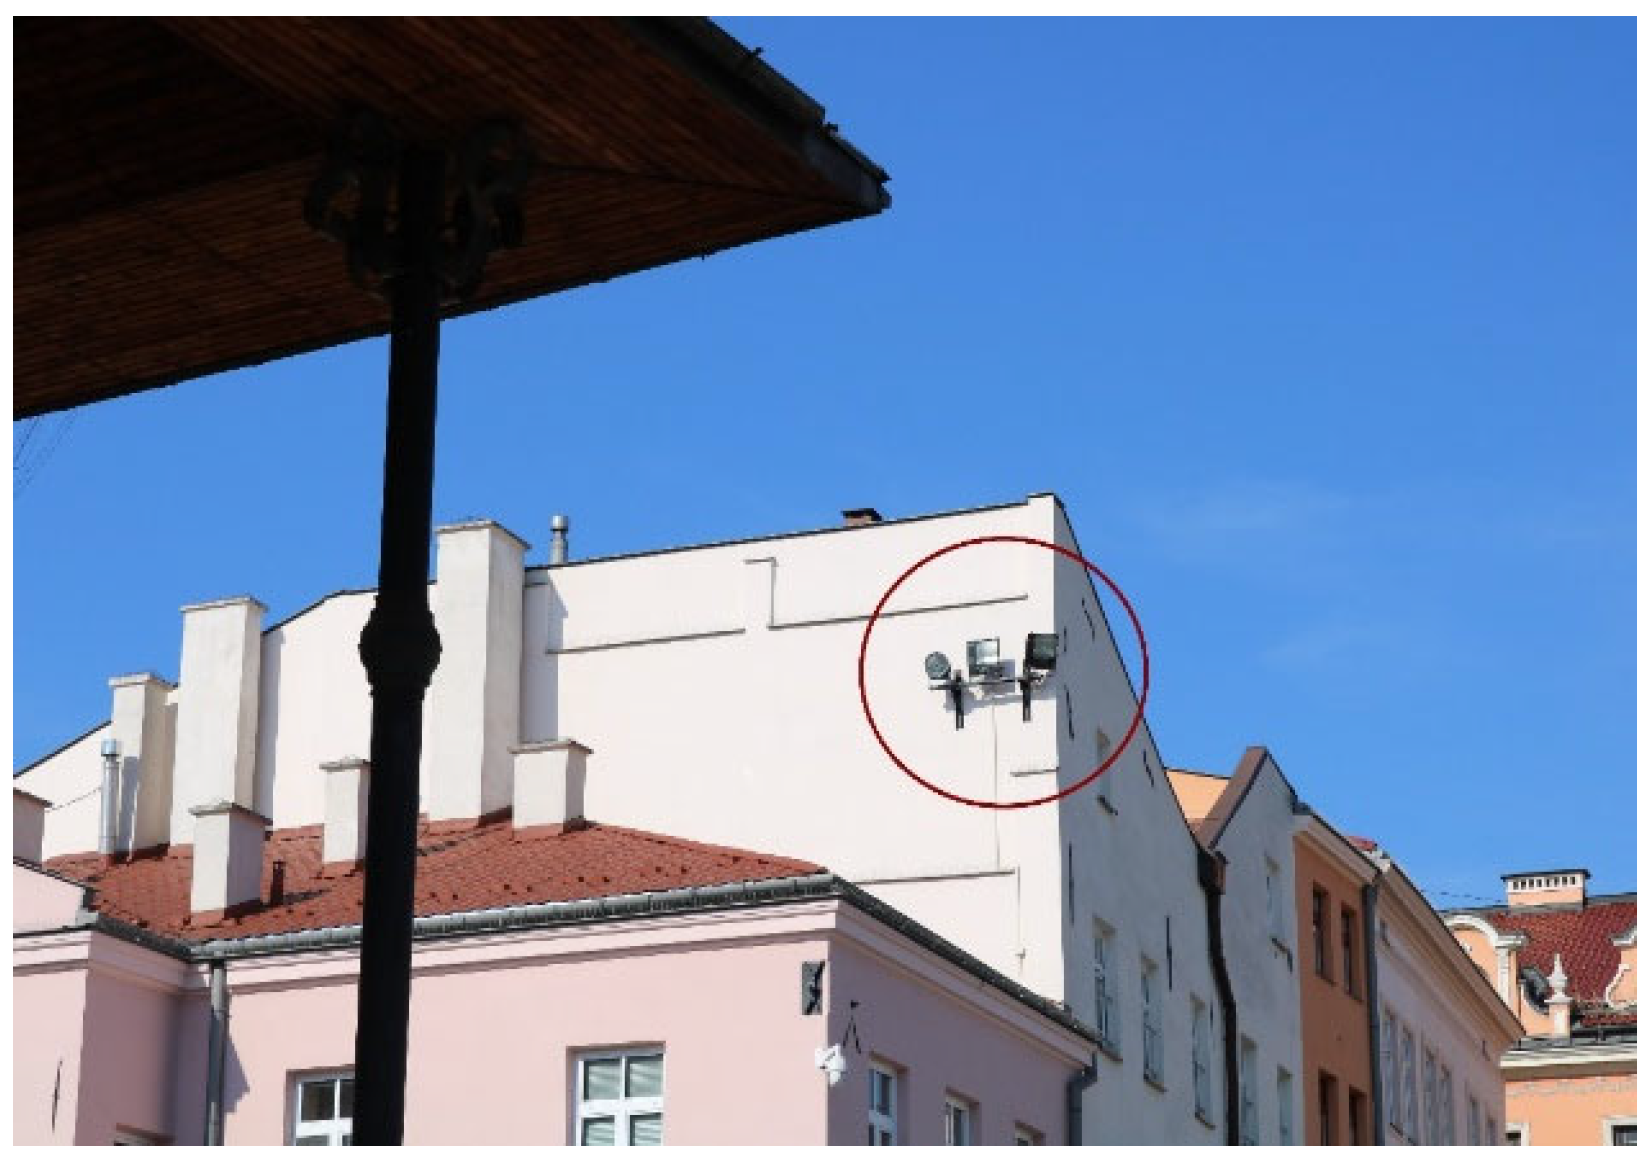
- architectural reflector—a luminaire attached to the façade of the illuminated building or an adjacent structure, intended to emphasise the architectural features of the building (Figure 7);
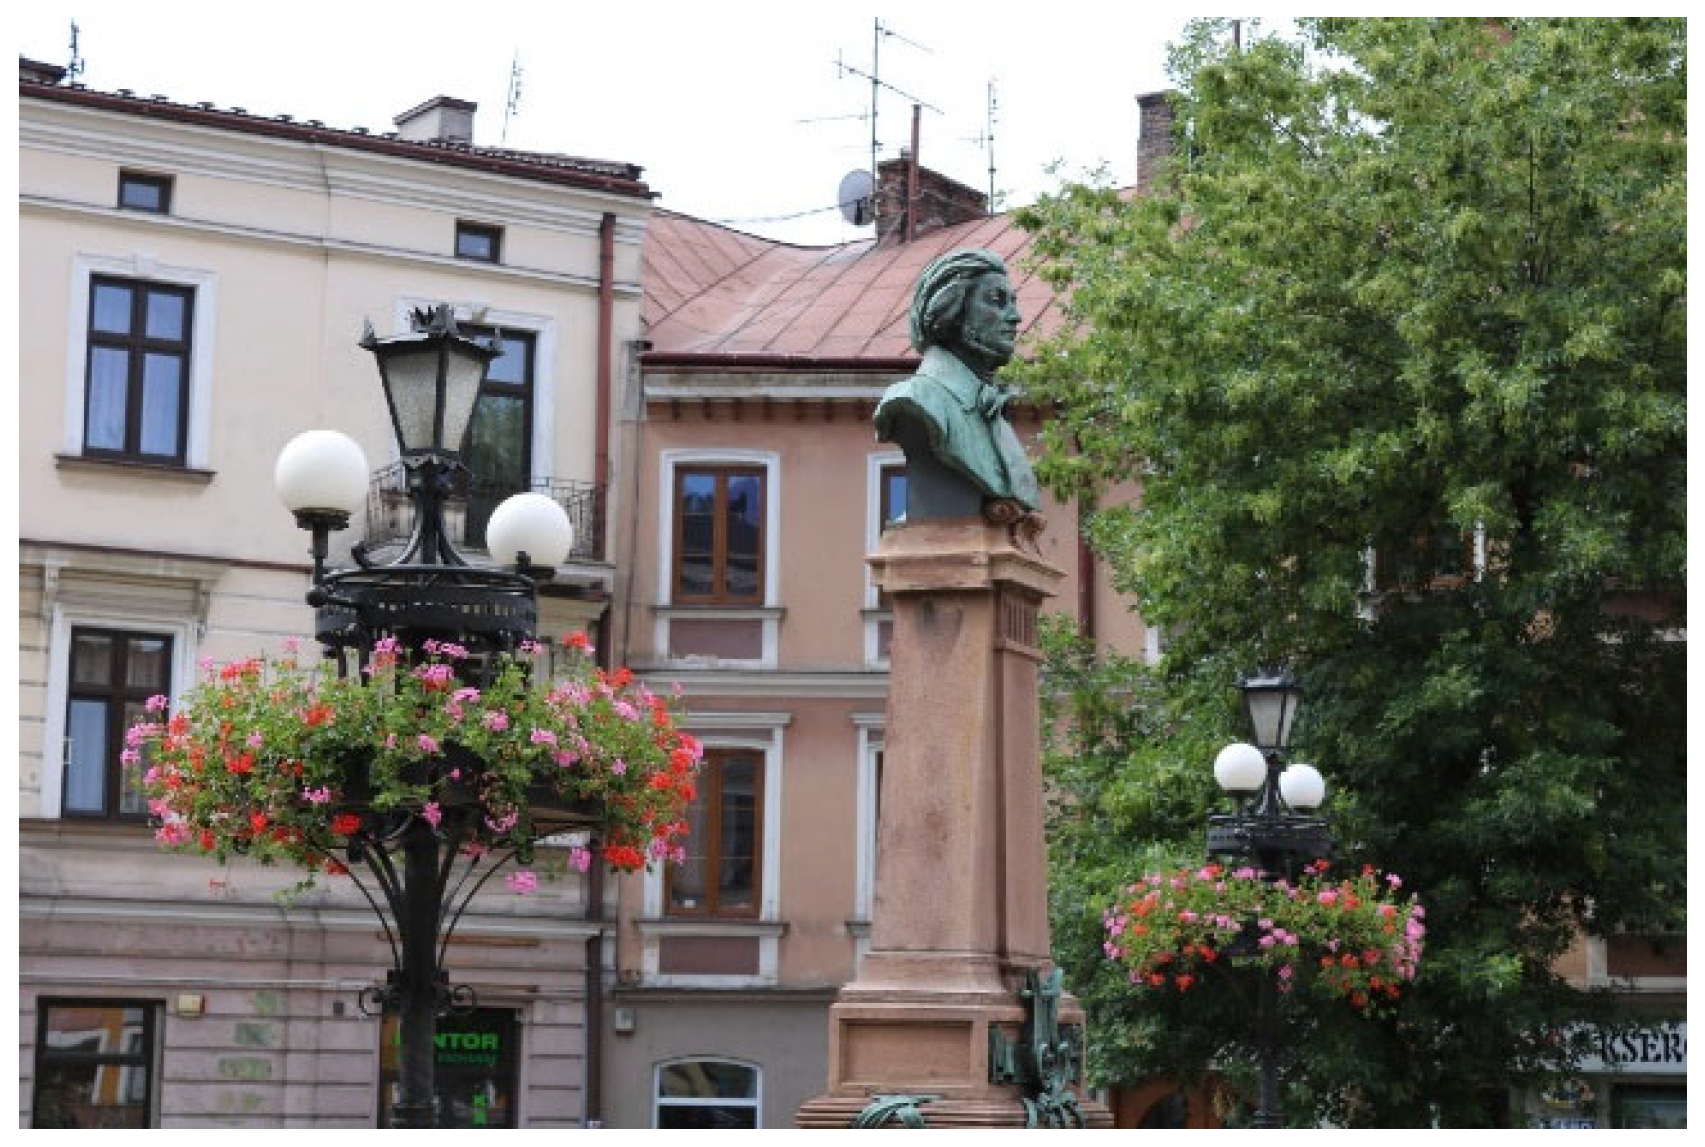
- milky globe type luminaire—a luminaire featuring a spherical lampshade made from a light-diffusing material (Figure 8);
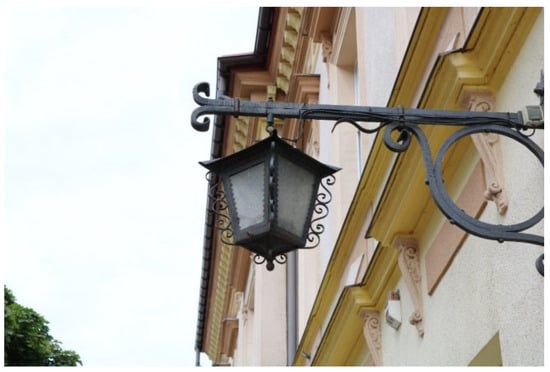
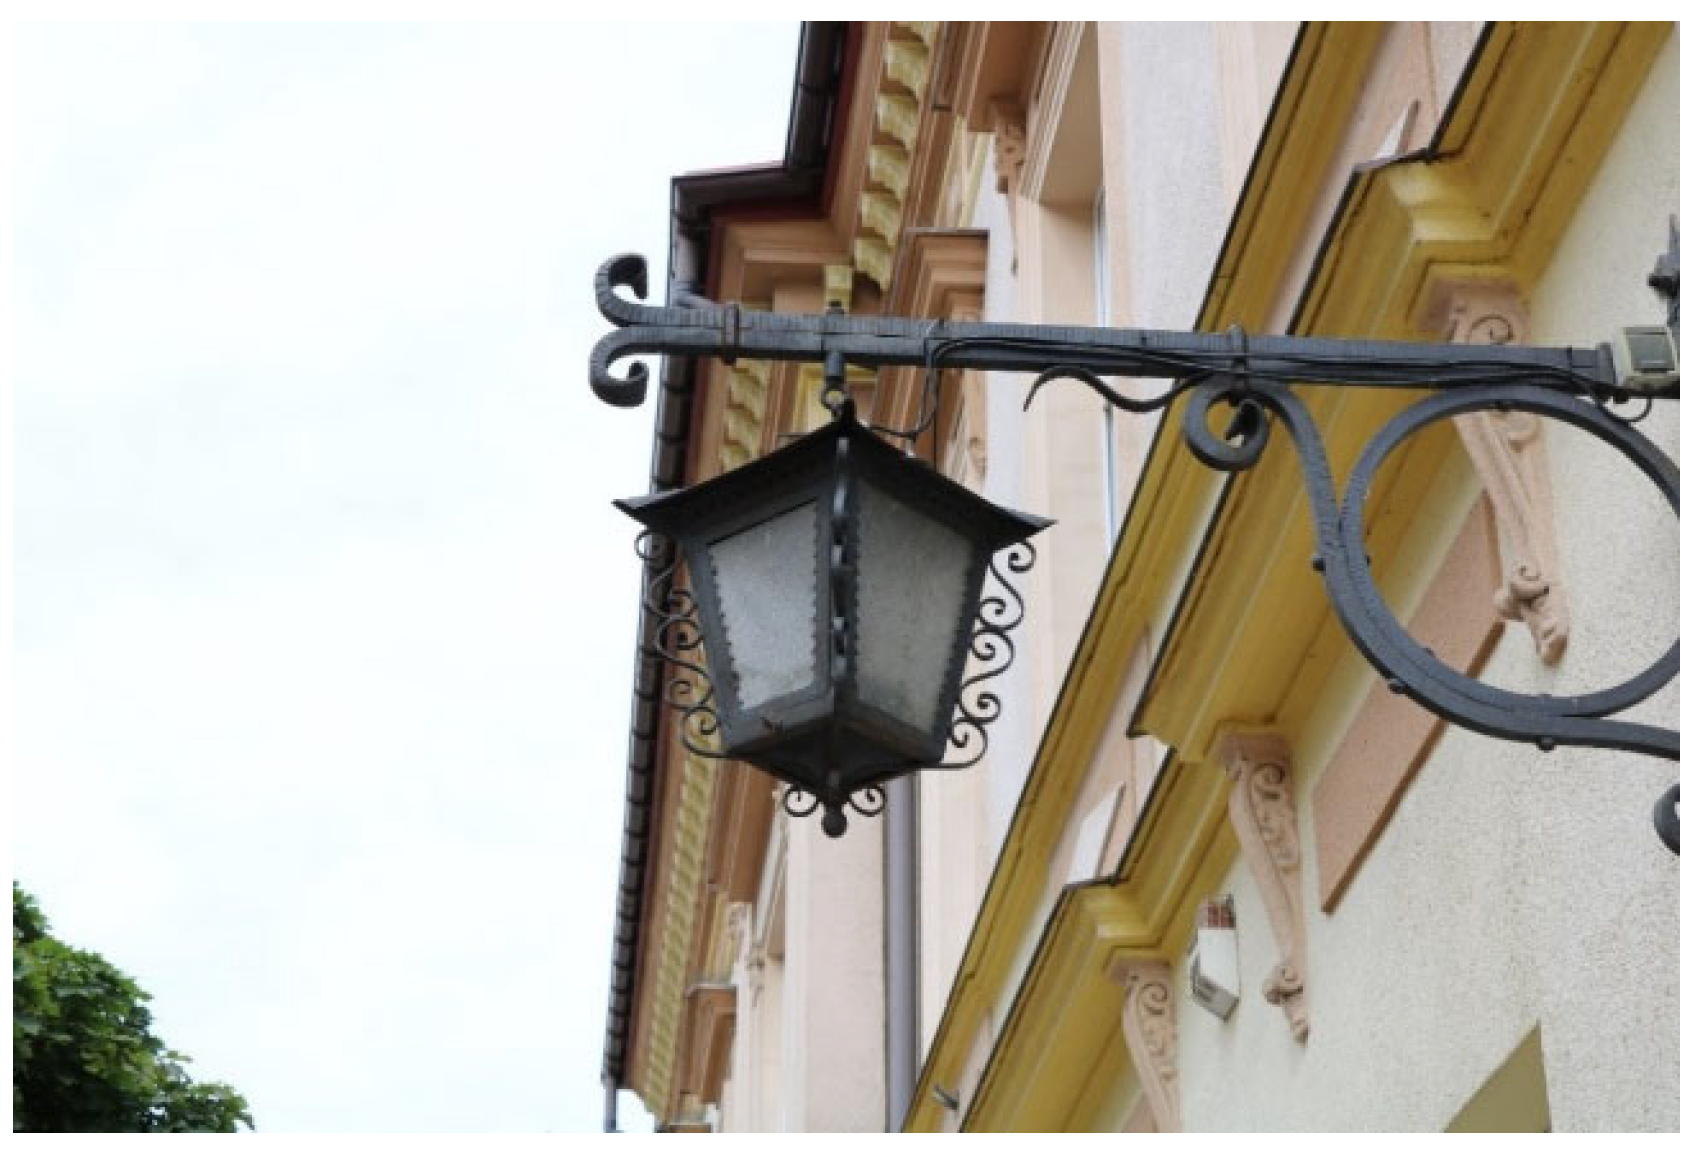
- stylish luminaire—a luminaire designed in the style of a nineteenth-century street lamp (Figure 9);
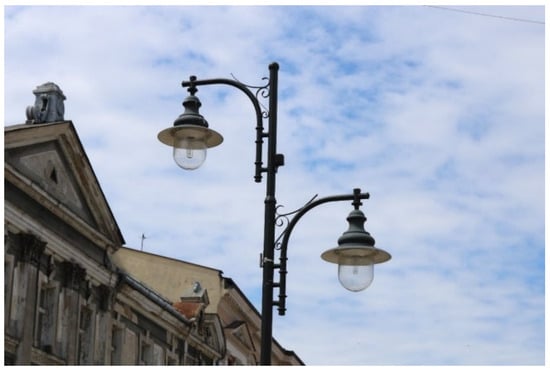
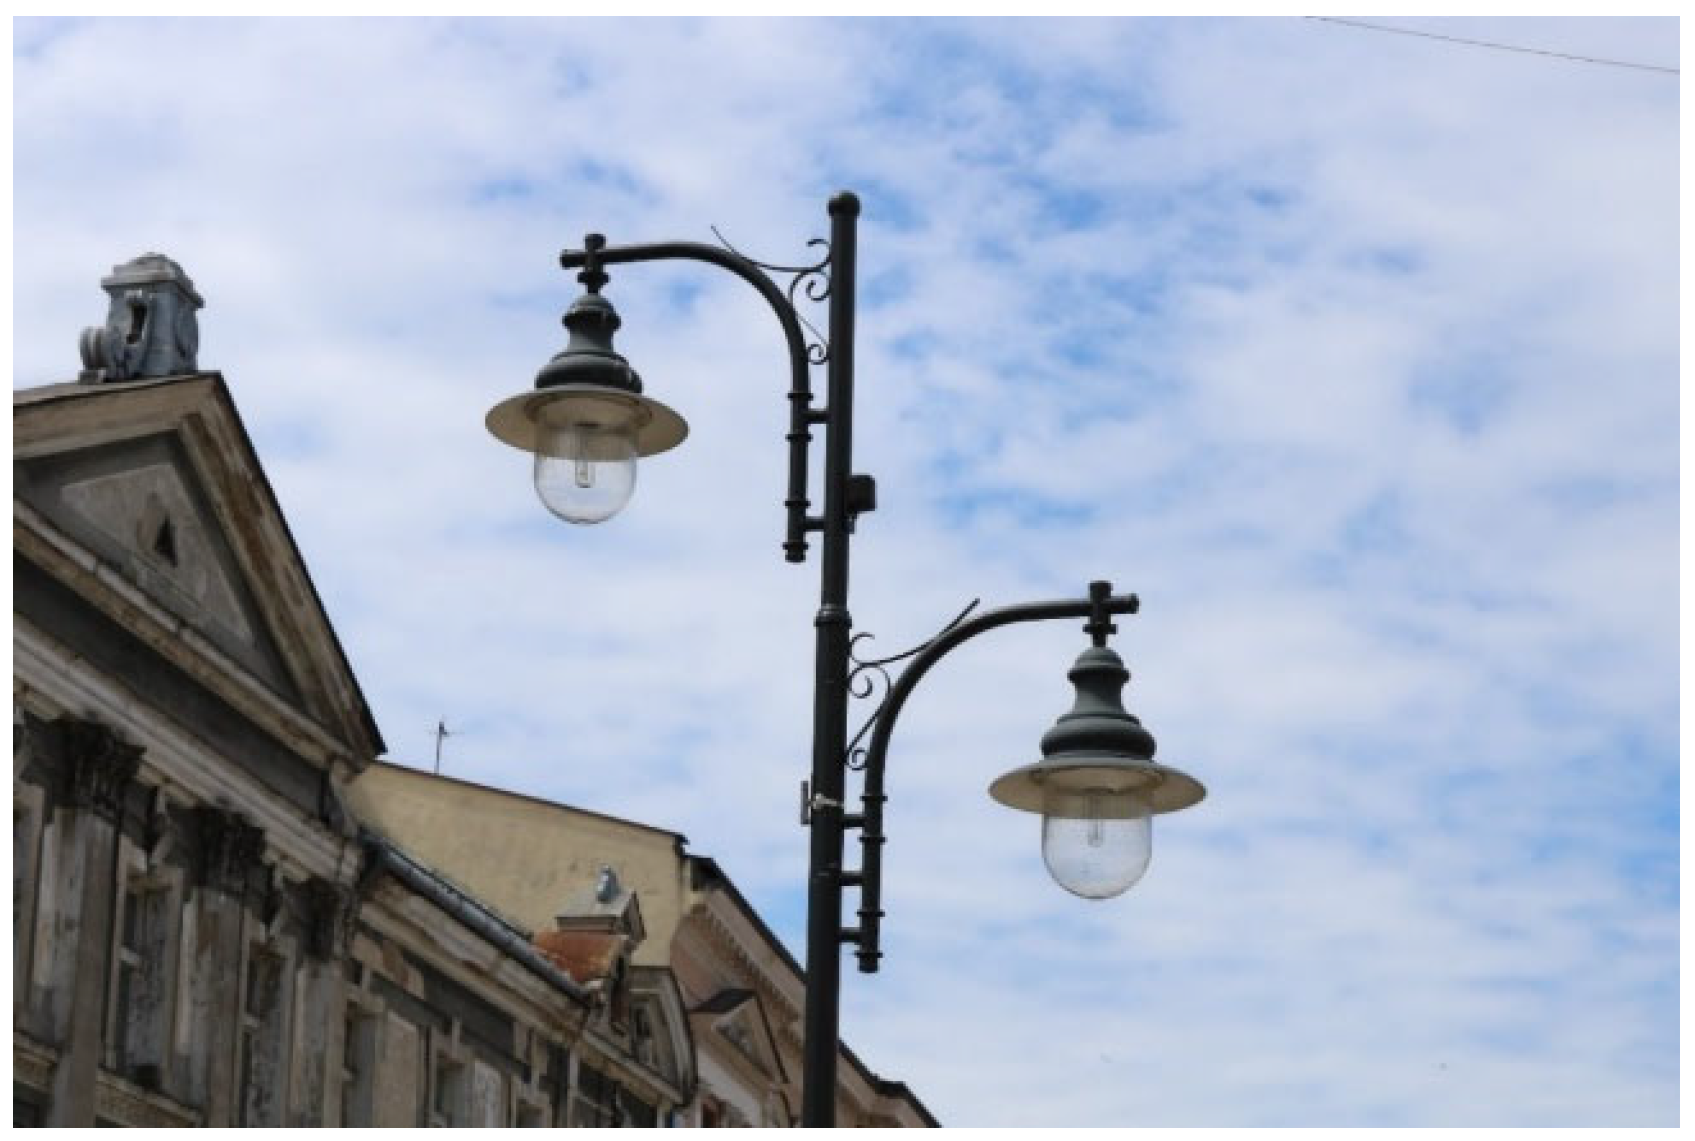
- decorative luminaire—a lamp with an ornamental design, located along the promenade-like section of Krakowska Street and on Sobieski Square (Figure 10);
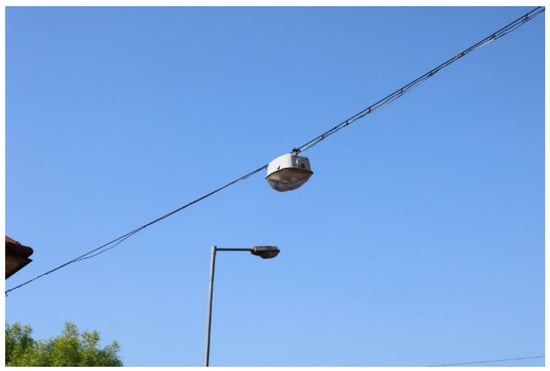
- street luminaire—a luminaire intended for street lighting, characterised by an obtuse-angled light distribution, typically mounted on poles or steel cables suspended above the street (Figure 11).
Figure 6.
Illumination of urban space using pavement spotlights, emphasising the brick structure of the wall (Old Synagogue Square).
Figure 7.
Architectural spotlights directed at the Synagogue Bimah (Old Synagogue Square).
Figure 8.
A lantern equipped with two milky ball luminaires and a centrally located stylish luminaire (Casimir the Great Square).
Figure 9.
Stylish luminaire installed on a decorative bracket (Wałowa Street).
Figure 10.
Street lamp with two decorative bell-shaped luminaires (Krakowska Street).
Figure 11.
Urban lighting infrastructure, including a suspended street light and a classic pole-mounted light (Bernardyńska Street).
4. Results
4.1. Lighting of the Old Town in Tarnów
The research focused on the interior of the historic urban space, which is predominantly illuminated by stylish luminaires. At level I (ground level), illuminance of 16.2 lx was recorded, while at level II (1.5 m above ground), illuminance reached 47.3 lx, indicating a substantial difference attributable to the light distribution method.
Katedralna Street is lit with stylish lamps, with measured illuminance ranging from 2.1 to 35.5 lx at level I, 2.0 to 58.3 lx at level II, and 5.6 to 10.4 lx at level III (window height). On Krótka Street, illuminance varied between 1.9 and 20.8 lx (level I) and 1.7 to 27.3 lx (level II), with the highest values recorded near the exit to the Market Square (18.8 lx at level I and 57.5 lx at level II).
On Old Synagogue Square, illuminance ranged from 4.7 to 21.7 lx at level I and 5.5 to 30.3 lx at level II, influenced by ground-recessed floodlights and architectural luminaires. Zakątna Street and the adjacent green area exhibited the highest illuminance value of 28.1 lx near a stylish luminaire, while the lowest recorded value was 1.7 lx at level I. Małe Schody Street remains unlit, relying on nearby luminaires for illumination.
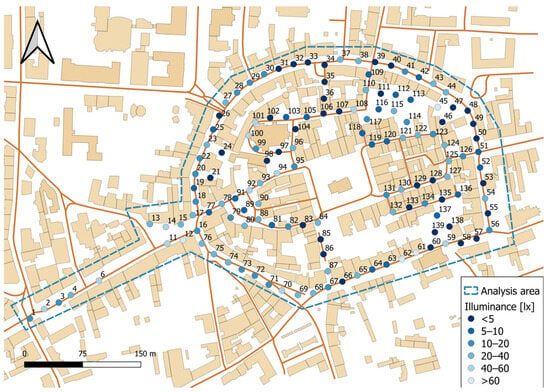
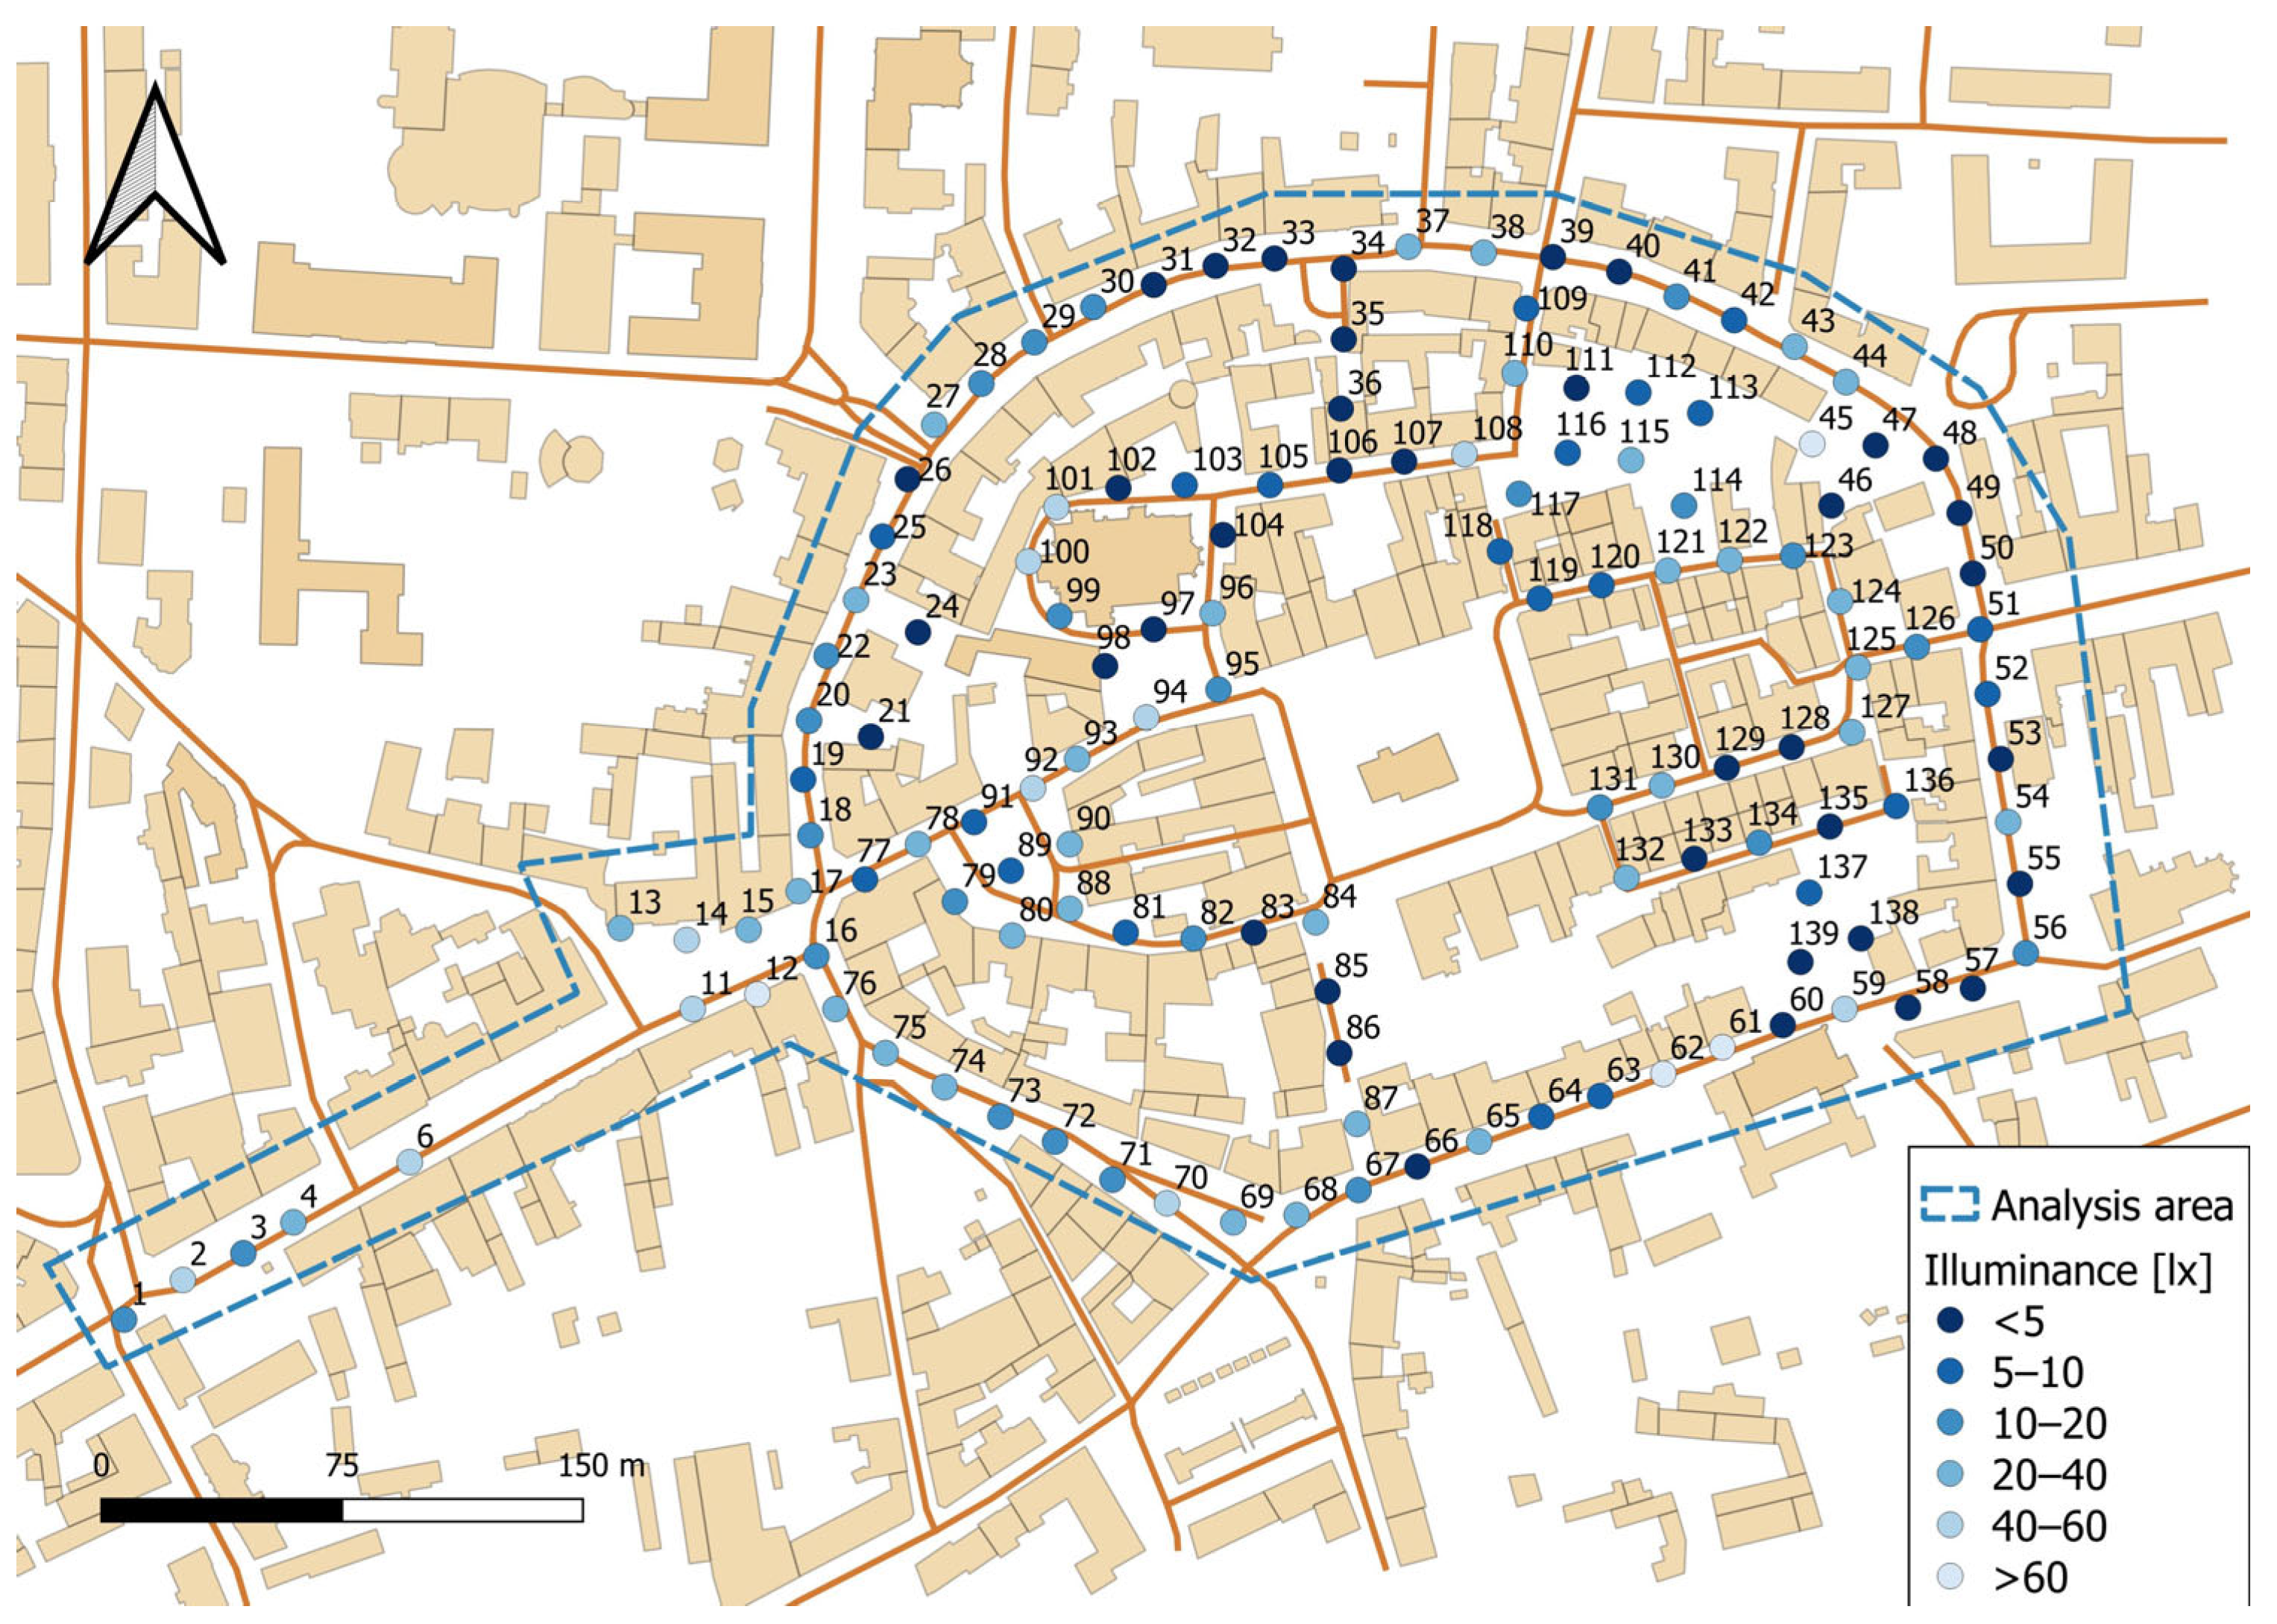
The spatial distribution of illuminance at ground level (level I) across the Old Town is shown in Figure 12.
Figure 12.
Map illustrating the obtained illuminance values at level I.
4.2. Lighting of the Streets Surrounding the Old Town in Tarnów
Along Krakowska Street, decorative luminaires are evenly spaced, with two mounted on poles on the broader side of the promenade and one on the opposite side. Lighting intensity measurements at five points revealed variability in illuminance values. The highest values recorded were 76.1 lx at level I, 107.2 lx at level II, and 94.6 lx at level III. The variations at level II can be attributed to the location of measurement points, with lower values measured between lampposts and higher values in close proximity to them.
Plac Sobieskiego, adjacent to Krakowska Street, is illuminated by decorative lamps with single luminaires. Measurements at four points showed illuminance ranging from 15.1 to 49.6 lx at level I and 12.4 to 46.3 lx at level II.
Wałowa Street, which borders the old town to the north, is lit by stylish fixtures modelled on nineteenth-century designs, mounted approximately 2 m high on building façades (Figure 9). Under one such fixture, illuminance was measured at 14.8 lx at level I and 29.0 lx at level II. A total of 34 measurement points were distributed along Wałowa Street, with illuminance ranging from 0.7 to 53.7 lx at level I, 0.7 to 63.0 lx at level II, and 4.9 to 21.0 lx at level III. The lowest illuminance of 0.7 lx was recorded at two points, comparable to urban sky glow levels.
Węgierski Square, adjacent to Wałowa Street, is illuminated by stylish luminaires and an architectural reflector highlighting the monument of General Józef Bem. Illuminance at measurement points ranged from 2.3 to 53.7 lx at level I and 1.7 to 63.0 lx at level II.
Szeroka, Bernardyńska, and Targowa Streets, which border the old town to the south, are lit by both freestanding lamps and lamps suspended on wires above the roadways. Freestanding lamps are mounted above the second-floor level of the buildings, while suspended lamps are positioned at the height of the second-floor windows. Illuminance ranged from 2.3 to 52.8 lx at level I and 2.3 to 72.0 lx at level II. The highest illuminance at window level (level III) was 46.2 lx, exceeding the limit specified in the Regulation of the Minister of Infrastructure (Ministry of Development and Technology, 2022) [41] by more than tenfold.
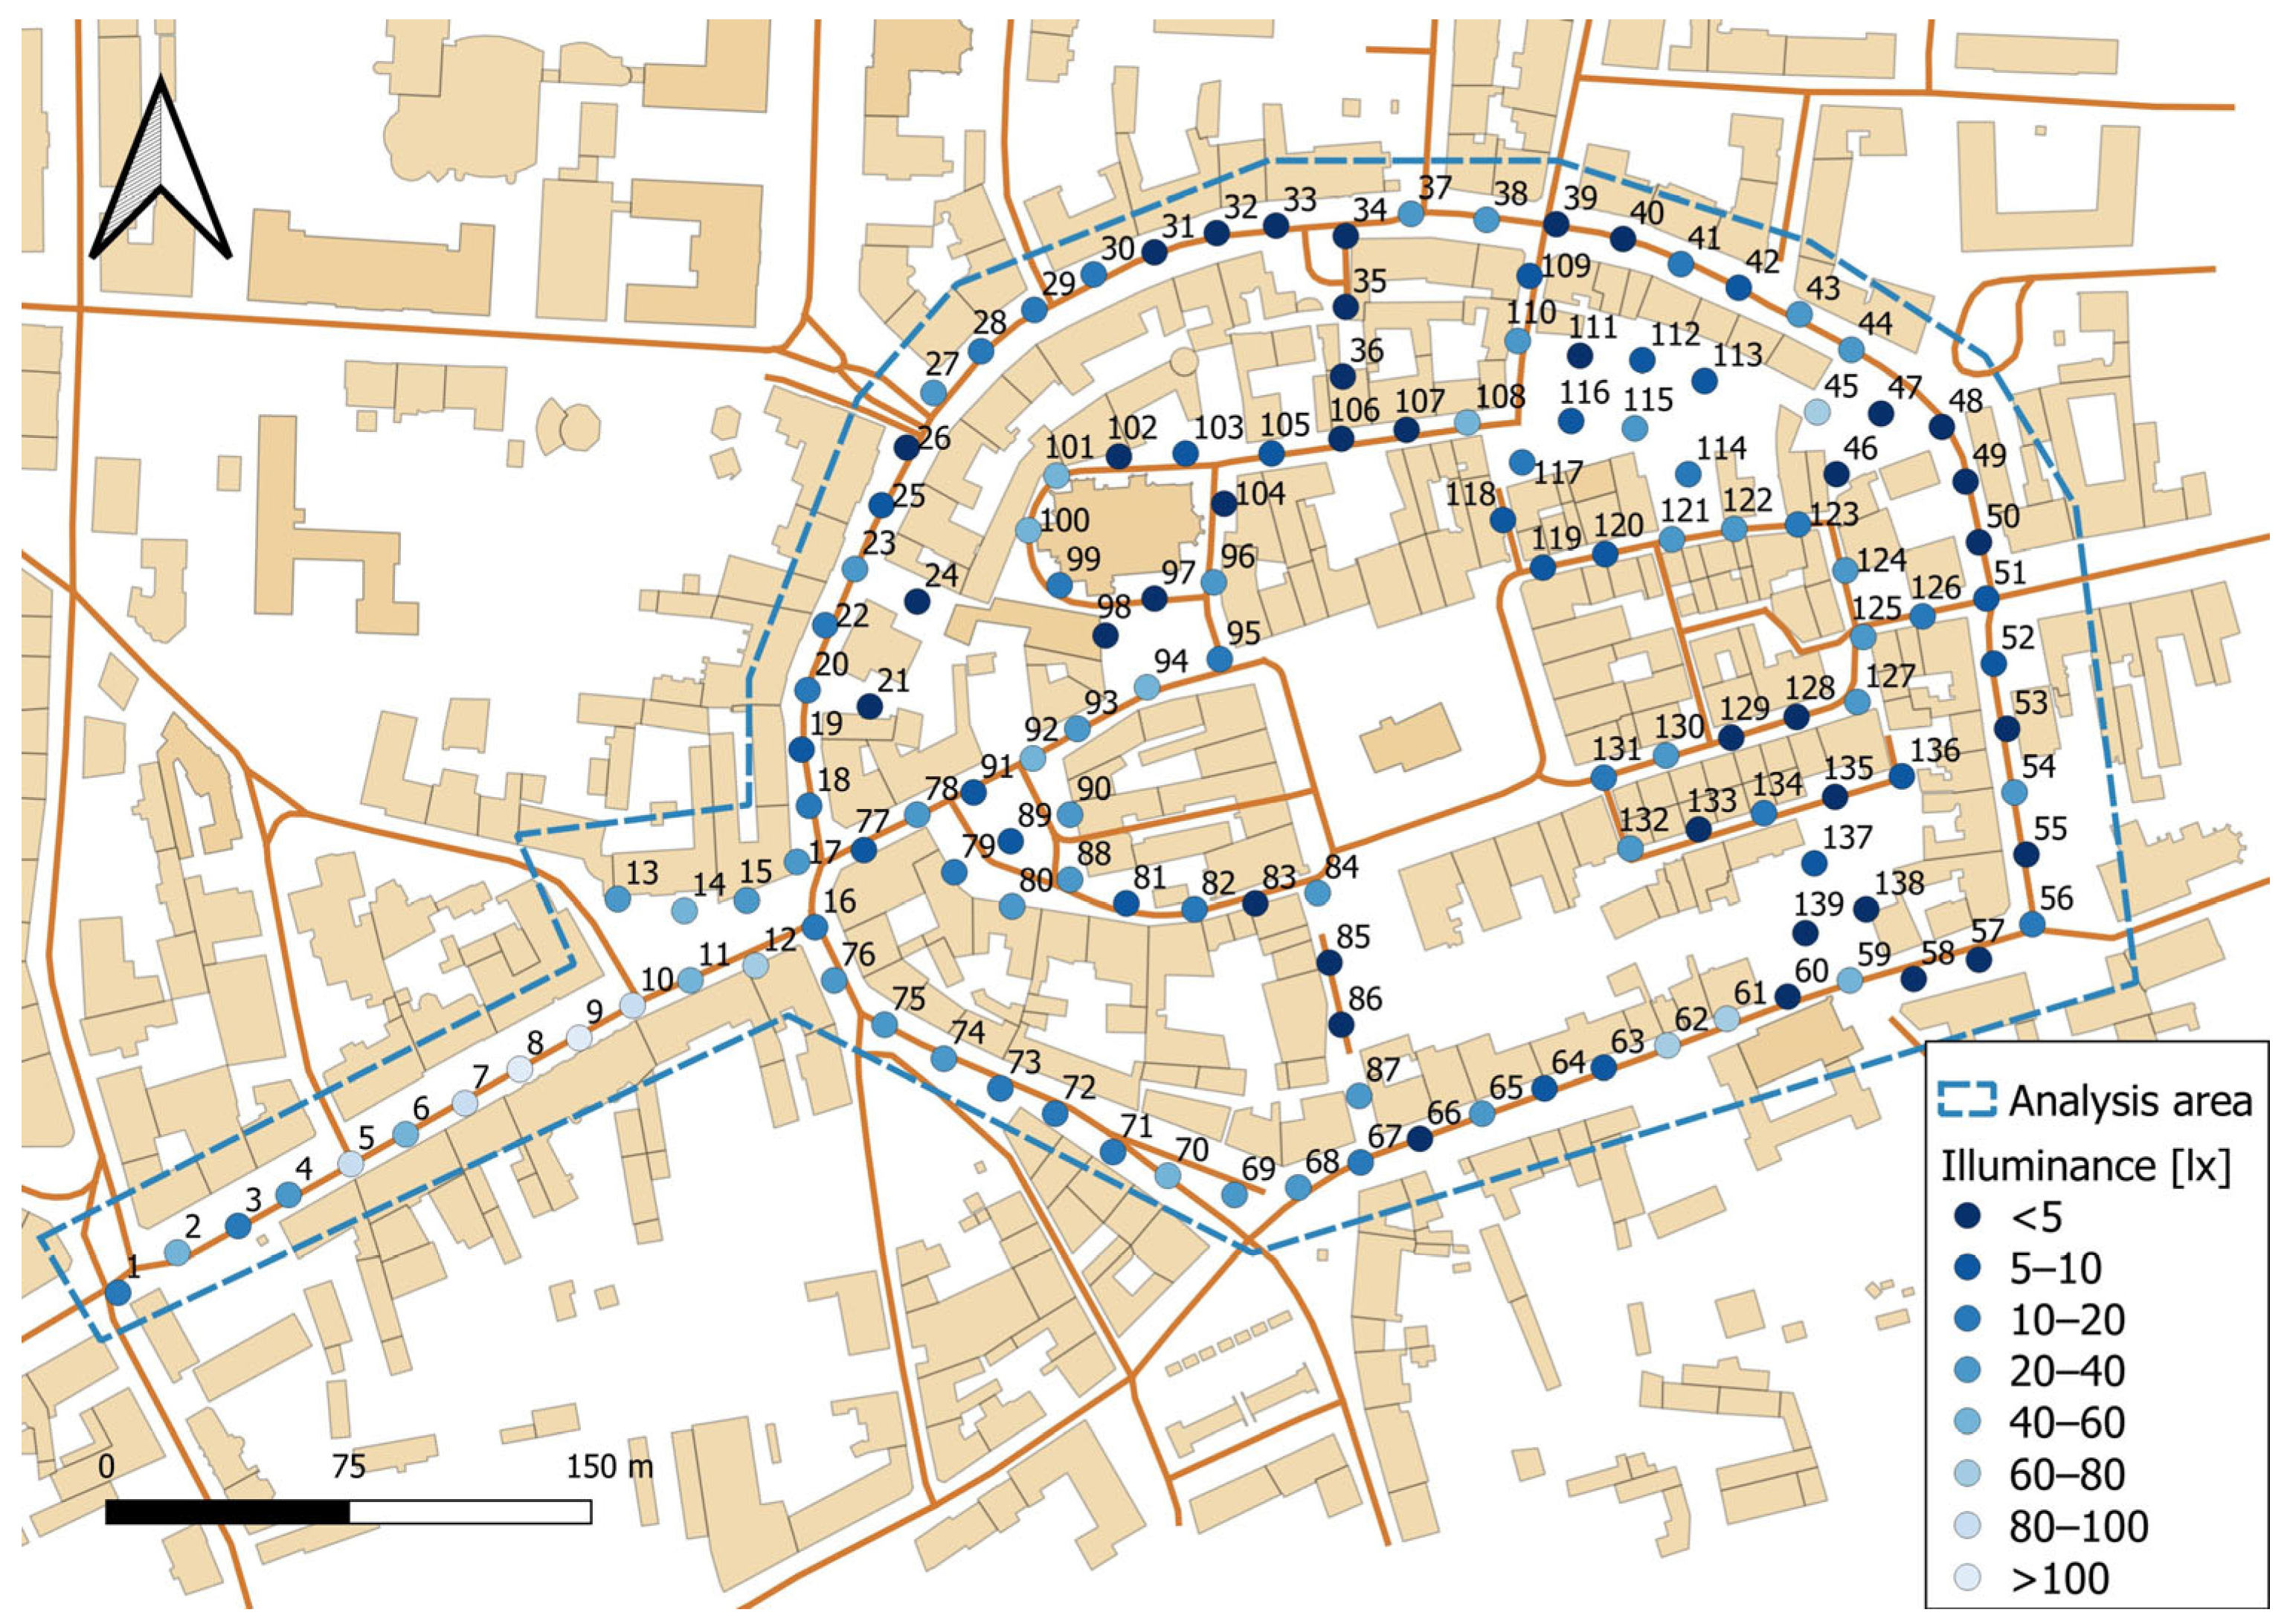
The distribution of illuminance at 1.5 m above ground (level II) is presented in Figure 13, highlighting overexposed and underlit zones along the surrounding streets.
Figure 13.
Map illustrating the obtained illuminance values at level II.
5. Discussion
5.1. Lighting Analysis
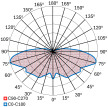
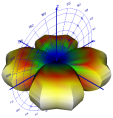
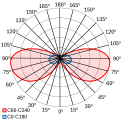
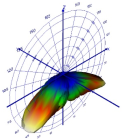
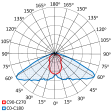
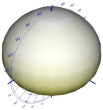
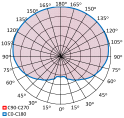
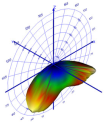
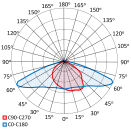
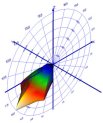
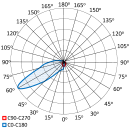
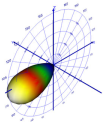
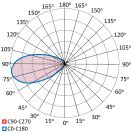
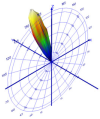
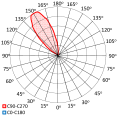
Photometric data for selected luminaires are presented in Table 1 and Table 2. The primary method for illustrating the distribution of light emitted by a fixture is the photometric solid, which manufacturers typically provide in photometric files (e.g., in EULUMDAT or IES format). To enhance clarity, the data are expressed as relative values, with the maximum intensity serving as the reference point. Alongside the three-dimensional representation of the photometric solid, light distribution curves are also displayed as polar diagrams. These graphs correspond to cross-sections of the solid along two mutually perpendicular planes: C0–C180 and C90–C270.
Table 1.
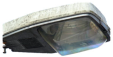
Graphical illustration of the light distribution method by luminaires.
Table 2.
The calculated parameters describing the optical properties of selected luminaires.
Due to the unique geometric characteristics of its photometric body, light intensity curves were determined for one luminaire (a stylish luminaire) in the C60–C240 plane, allowing for a more representative depiction of the light distribution.
Based on the available photometric solids, key parameters describing the optical properties of the luminaires were calculated, including: ULOR (Upward Light Output Ratio), DLOR (Downward Light Output Ratio), LOR (Light Output Ratio), TL (Trapped Light-light confined within the luminaire), and the luminous flux emitted into the upper half-space (ΦΛ) and the lower half-space (ΦV). When ΦΛ and ΦV are expressed relative to the total radiant flux emitted by the luminaire (Φtotal), their corresponding percentages can be determined. This facilitates direct comparison of the proportions of upward and downward flux among different luminaire designs.
Table 1 illustrates the light distribution of the analysed luminaires. It shows that decorative and stylish fixtures emit light in many directions, including upwards, while suspended and pole-mounted street luminaires concentrate the flux downwards. Pavement uplights direct almost all light to the upper hemisphere, making them particularly problematic in terms of light pollution.
These qualitative differences are confirmed by the quantitative parameters shown in Table 2. The most important is ULOR (Upward Light Output Ratio), indicating the proportion of light escaping into the sky; luminaires with ULOR close to 0% are preferred as they minimise skyglow. DLOR (Downward Light Output Ratio) shows how much flux is directed to usable surfaces, LOR (Light Output Ratio) reflects overall efficiency, TL (Trapped Light) quantifies internal optical losses, and ΦΛ/ΦV indicate the shares of flux emitted upwards and downwards.
According to Table 2, decorative luminaires reached the highest efficiency (LOR = 93.41%, TL = 6.59%), while stylish luminaires performed the worst (LOR = 61.20%, TL = 38.80%). From the light pollution perspective, suspended street luminaires are the most favourable (ULOR = 0.41%), qualifying as “full cut-off” solutions. By contrast, milky globe fixtures (ULOR = 45.82%) and pavement uplights (ULOR = 100%) contribute most strongly to skyglow. These results confirm that inefficient luminaires with high upward emission should be replaced with modern solutions that combine high efficiency and minimal environmental impact.
Table 3 shows the ULR (Upward Light Ratio) limits for different environmental zones defined in CIE 150:2017 [37]. For luminaires installed without tilt relative to the horizontal plane, ULR corresponds directly to ΦΛ%. This allows the values obtained from photometric solids (Table 1) to be compared with CIE recommendations.
Table 3.
Recommendations of CIE concerning the limit values of the luminous flux emitted into the upper half-space.
Assuming that the analysed area belongs to environmental zone E4 (urban areas with high lighting intensity), which is justified by the nature of development and the degree of urbanisation, then according to the recommendations of CIE 150:2017 [37], the ULR value should not exceed 15% (Table 3). According to this criterion, only the suspended street luminaire meets the requirement, while all other fixtures exceed the recommended limit. A limitation of this assessment is that suspended luminaires may temporarily change orientation due to wind, which could affect actual upward emission.
Light pollution assessment is currently based on several groups of indicators that describe different aspects of this phenomenon. First, classic photometric indicators for luminaires are used, such as the Upward Light Output Ratio (ULOR), Upward Light Ratio (ULR), Downward Light Output Ratio (DLOR), and Light Output Ratio (LOR). Their advantage is simplicity of interpretation and a direct relationship to the geometry of the light distribution and the proportion of flux emitted upward. These indicators are very useful in design and regulatory practice, but they do not take into account the spectral properties of the light source or wavelength-dependent atmospheric scattering [37,42]. Consequently, they do not allow for a full assessment of the extent to which two luminaires with similar proportions of luminous flux emitted into the upper half-space will actually differ in their impact on sky glow [42]. Second, indicators based on measuring the brightness of the night sky (Night Sky Brightness) are widely used, most often using devices such as a Sky Quality Meter (SQM). These indices accurately describe the final result observed in the field, i.e., the actual sky brightness over a given location [43,44]. At the same time, the literature indicates that NSB measurements are strongly dependent on atmospheric conditions, the presence of natural light sources, measurement geometry, and the calibration stability of the devices themselves [45]. For this reason, statistical indices, such as mean Full Width at Half Maximum (mFWHM) and Night Sky Brightness Dispersion Ratio (NSB DR), are also being developed to increase the robustness of the assessment to meteorological variability and calibration issues [43,45]. However, these are still measures that describe the sky condition at a given location and time, not the contribution of a specific type of luminaire to generating this condition. Third, spectral indices are being developed in the literature to assess the impact of light source spectral characteristics on the night environment and astronomical observations. Examples include indices such as the Spectral Light Index (SLI), Star Visibility Index (SVI), Scotopic Sky Luminance Ratio (SSLR), and Starlight Contamination Degree (SCD) [46,47]. Their common feature is the consideration of the spectral distribution of radiation, and in some cases also the sensitivity of the human eye under night vision conditions (scotopic vision) or atmospheric scattering. These indices indicate that assessing the impact of luminaires cannot be based solely on photometric parameters such as total luminous flux, or on a parameter describing the color of light, such as correlated color temperature (CCT). The spectral distribution of radiation is crucial, especially in the short wavelength range, which is subject to intense scattering in the atmosphere and has a significant impact on the formation of sky glow [46,47]. Against this background, the Sky Glow Contribution Index (SGCI) proposed in this paper occupies an intermediate position between geometric indices of luminaires and indices based on the observed sky condition. Its purpose is not to directly measure sky luminance, but to estimate the potential contribution of a given luminaire to skyglow. Unlike ULOR and ULR, SGCI takes into account not only the proportion of luminous flux directed upwards but also the spectral characteristics of the radiation and wavelength-dependent scattering in the atmosphere [42,47]. This allows two luminaires with similar flux proportions emitted into the upper half-space to achieve different SGCI values if they differ in their shortwave radiation content.
The novelty of SGCI lies primarily in the fact that it is an indicator aimed directly at assessing the skyglow potential of a luminaire, rather than describing the final sky brightness measured in the field. In this sense, SGCI can be particularly useful in comparative analyses of different types of luminaires, during the design phase of lighting modernization, and when selecting solutions that minimize light emission into the nighttime environment. It is also more environmentally informative than “geometric” measures alone, as it takes into account the spectral aspect, which, according to research, is significantly important for night sky degradation [42,46].
However, it should be emphasized that the SGCI does not replace NSB indicators or field measurements. It does not directly describe the sky luminance observed at a specific location, as such luminance also depends on atmospheric conditions, the share of light reflected from the ground and façade, the geometry of the surrounding area, and the total emission of all luminaires in the analyzed area [44,45]. In its current form, the SGCI omits the secondary radiation component, i.e., light reflected from urban surfaces, which is then scattered [42]. For this reason, this indicator should be considered a more advanced tool than the classic ULOR/ULR indicators for assessing individual luminaires, but requiring supplementation with NSB measurements when the goal is to assess the actual state of the nighttime environment.
In summary, the usefulness of the SGCI lies in bridging the gap between simple photometric indices and complex sky brightness measurements. It allows for the classification and comparison of luminaires in terms of their potential contribution to sky glow, especially in situations where classic geometric indices prove insufficient and field measurements do not allow for the unambiguous attribution of the observed effect to a specific type of luminaire working with a specific light source [42,45].
Commonly used indicators such as ULOR (Upward Light Output Ratio), DLOR (Downward Light Output Ratio), and LOR (Light Output Ratio), though valuable in everyday analyses of luminaires, are based solely on the total luminous flux and the angular distribution of light intensity. They do not take into account the spectral characteristics of the light source, which are critical for assessing the environmental impact of lighting and the extent of light pollution (skyglow). Light at shorter wavelengths, particularly within the blue range (λ < 500 nm) is scattered much more intensely in the atmosphere, in accordance with Rayleigh scattering, and is perceived more strongly by the human eye under night-adapted vision.
Consequently, there is increasing advocacy in environmental assessments to supplement traditional photometric indicators with spectral components that incorporate the spectral power distribution of the light source alongside the relative visual sensitivity curve (such as the scotopic sensitivity curve V′(λ))
Accordingly, the evaluation of a luminaire’s environmental impact should be expanded to include a spectral component and consider the physical phenomena occurring within the atmosphere. One approach that integrates these factors is the Sky Glow Contribution Index (SGCI), in which the luminous flux emitted into the upper half-space is weighted not only by the relative sensitivity of night vision (curve V′(λ)) but also by wavelength-dependent atmospheric scattering, expressed as . This enables the SGCI to reflect both the perceptual and physical effects of light on artificial sky glow, rendering it a more suitable tool for environmental analyses than traditional photometric indices.
where
ΦΛ(λ)—spectral luminous flux emitted into the upper half-space by the luminaire;
Φtotal(λ)—total spectral luminous flux emitted by the luminaire;
V’(λ)—relative sensitivity of human vision under scotopic adaptation conditions;
λ—wavelength;
a—exponent describing the scattering of light in the atmosphere.
If we assume that the spectral characteristic of the light emitted by the luminaire into the upper half-space ΦΛ(λ) is the same as the spectral characteristic of the total luminous flux Φtotal(λ), then Equation (1) can be written as follows:
where:
S(λ)—normalised spectral power distribution of a luminaire.
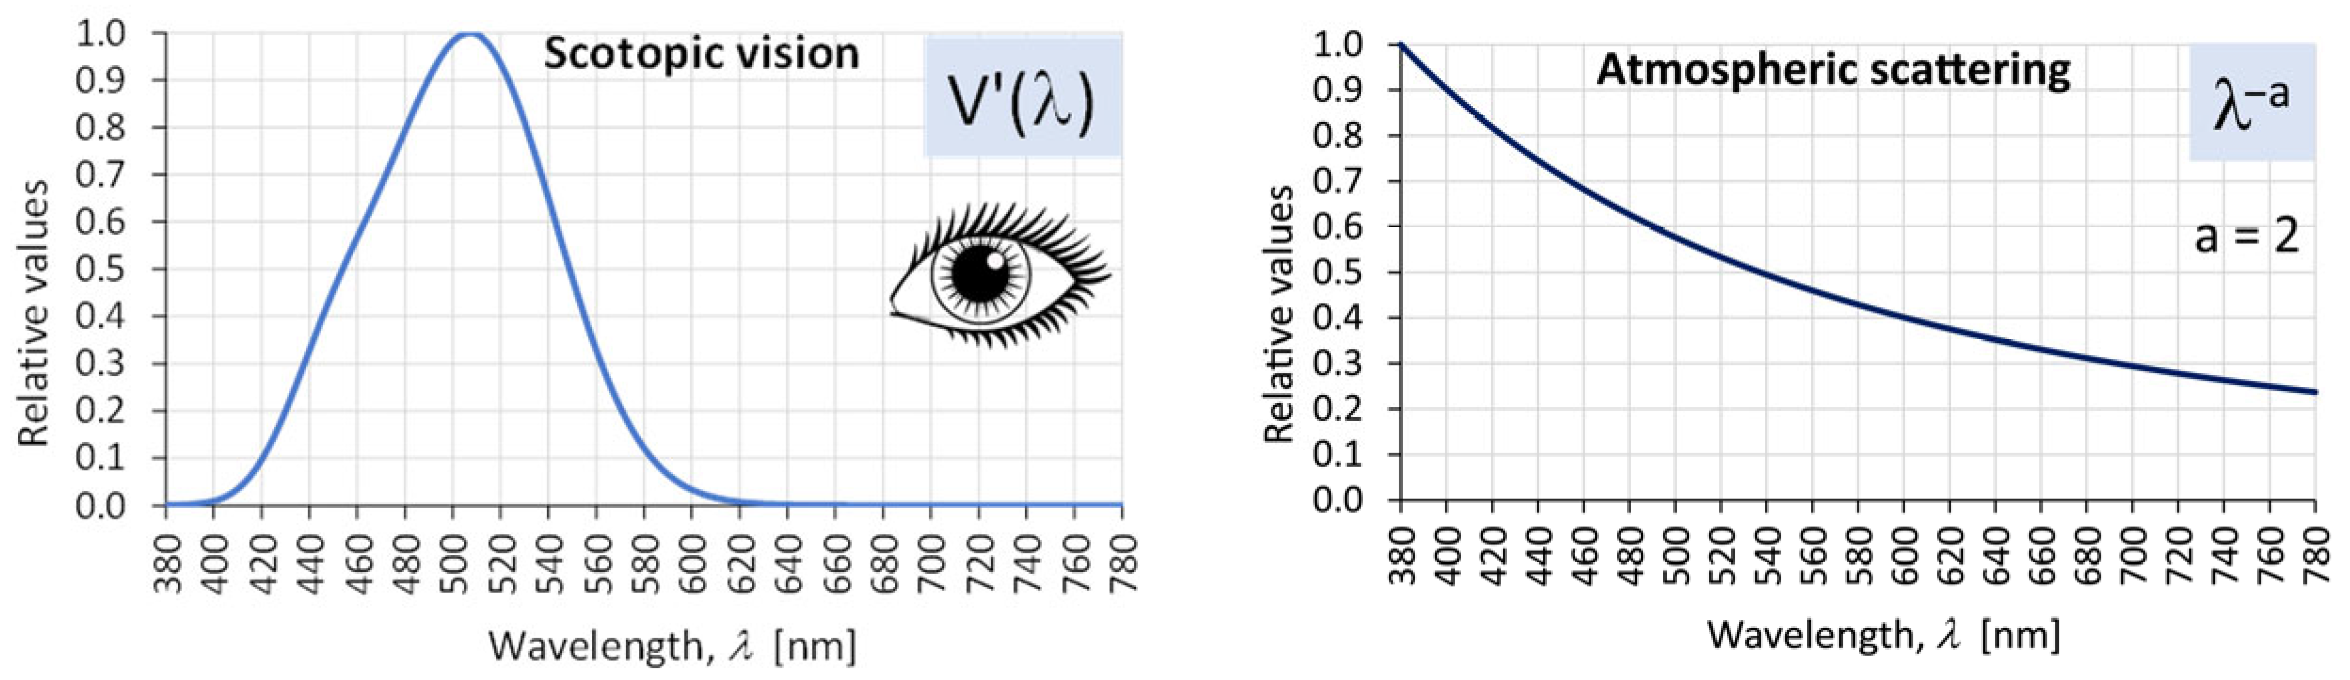
The visualisation of the quantities appearing in Equation (2) is presented in Figure 14.
Figure 14.
Graphical illustration of the quantities appearing in Equation (2).
Since the luminaires listed in Table 1 are equipped with high-pressure sodium (HPS) lamps, the spectral radiation characteristics typical of this type of light source were assumed for the calculations. However, it should be noted that the spectral distribution of an unshielded light source differs from that of the radiation emitted by the luminaire. This issue was highlighted, among others, in (Tabaka, 2021) [47], where it was shown that the optical components of the luminaire (e.g., lampshades, reflectors) can alter the light spectrum depending on the materials used. Nevertheless, to simplify the calculations, an initial assumption was made: the spectral distribution of the light emitted by the luminaire is identical to that of the light source.
The second simplification adopted in the equation defining the Sky Glow Contribution Index (SGCI) involves the omission of the secondary radiation component. In other words, the model accounts only for the light emitted directly into the upper half-space by the luminaire. Light that falls on the ground, infrastructure, façades, or other surfaces and is subsequently reflected towards the sky has not been included in this approach. Although this type of diffuse radiation can represent a significant component of overall skyglow, accurately accounting for it would require a comprehensive photometric and radiative analysis of the environment, which is beyond the scope of this study.
The value of the exponent a in Equation (2) depends on atmospheric conditions and typically ranges from 1 to 4. In areas with a higher concentration of atmospheric aerosols, such as urban environments, a common value is a = 2, which was adopted for the calculations (Tabaka and Kołomański, 2023) [48].
The calculated SGCI values for the analysed luminaires, for which photometric data were available, are presented in Table 4. This parameter indicates the proportion of light emissions that contribute directly to skyglow, complementing the photometric indicators shown in Table 2. The results reveal significant variation among fixture types. Pavement uplights reached the highest SGCI values, as their entire luminous flux is directed upwards, making them the most harmful in terms of light pollution. Milky globe fixtures and symmetrical architectural spotlights also showed high SGCI, reflecting their uncontrolled emission patterns. In contrast, suspended and pole-mounted street luminaires achieved the lowest SGCI values, confirming their suitability as “full cut-off” solutions. Decorative luminaires obtained intermediate results, with relatively high efficiency but still exceeding recommended limits. These findings demonstrate that the choice of luminaire type has a decisive impact on skyglow. Fixtures with SGCI approaching zero should be prioritised in urban lighting strategies, while uplights and globes should be systematically phased out.
Table 4.
Calculated SGCI values for selected luminaires.
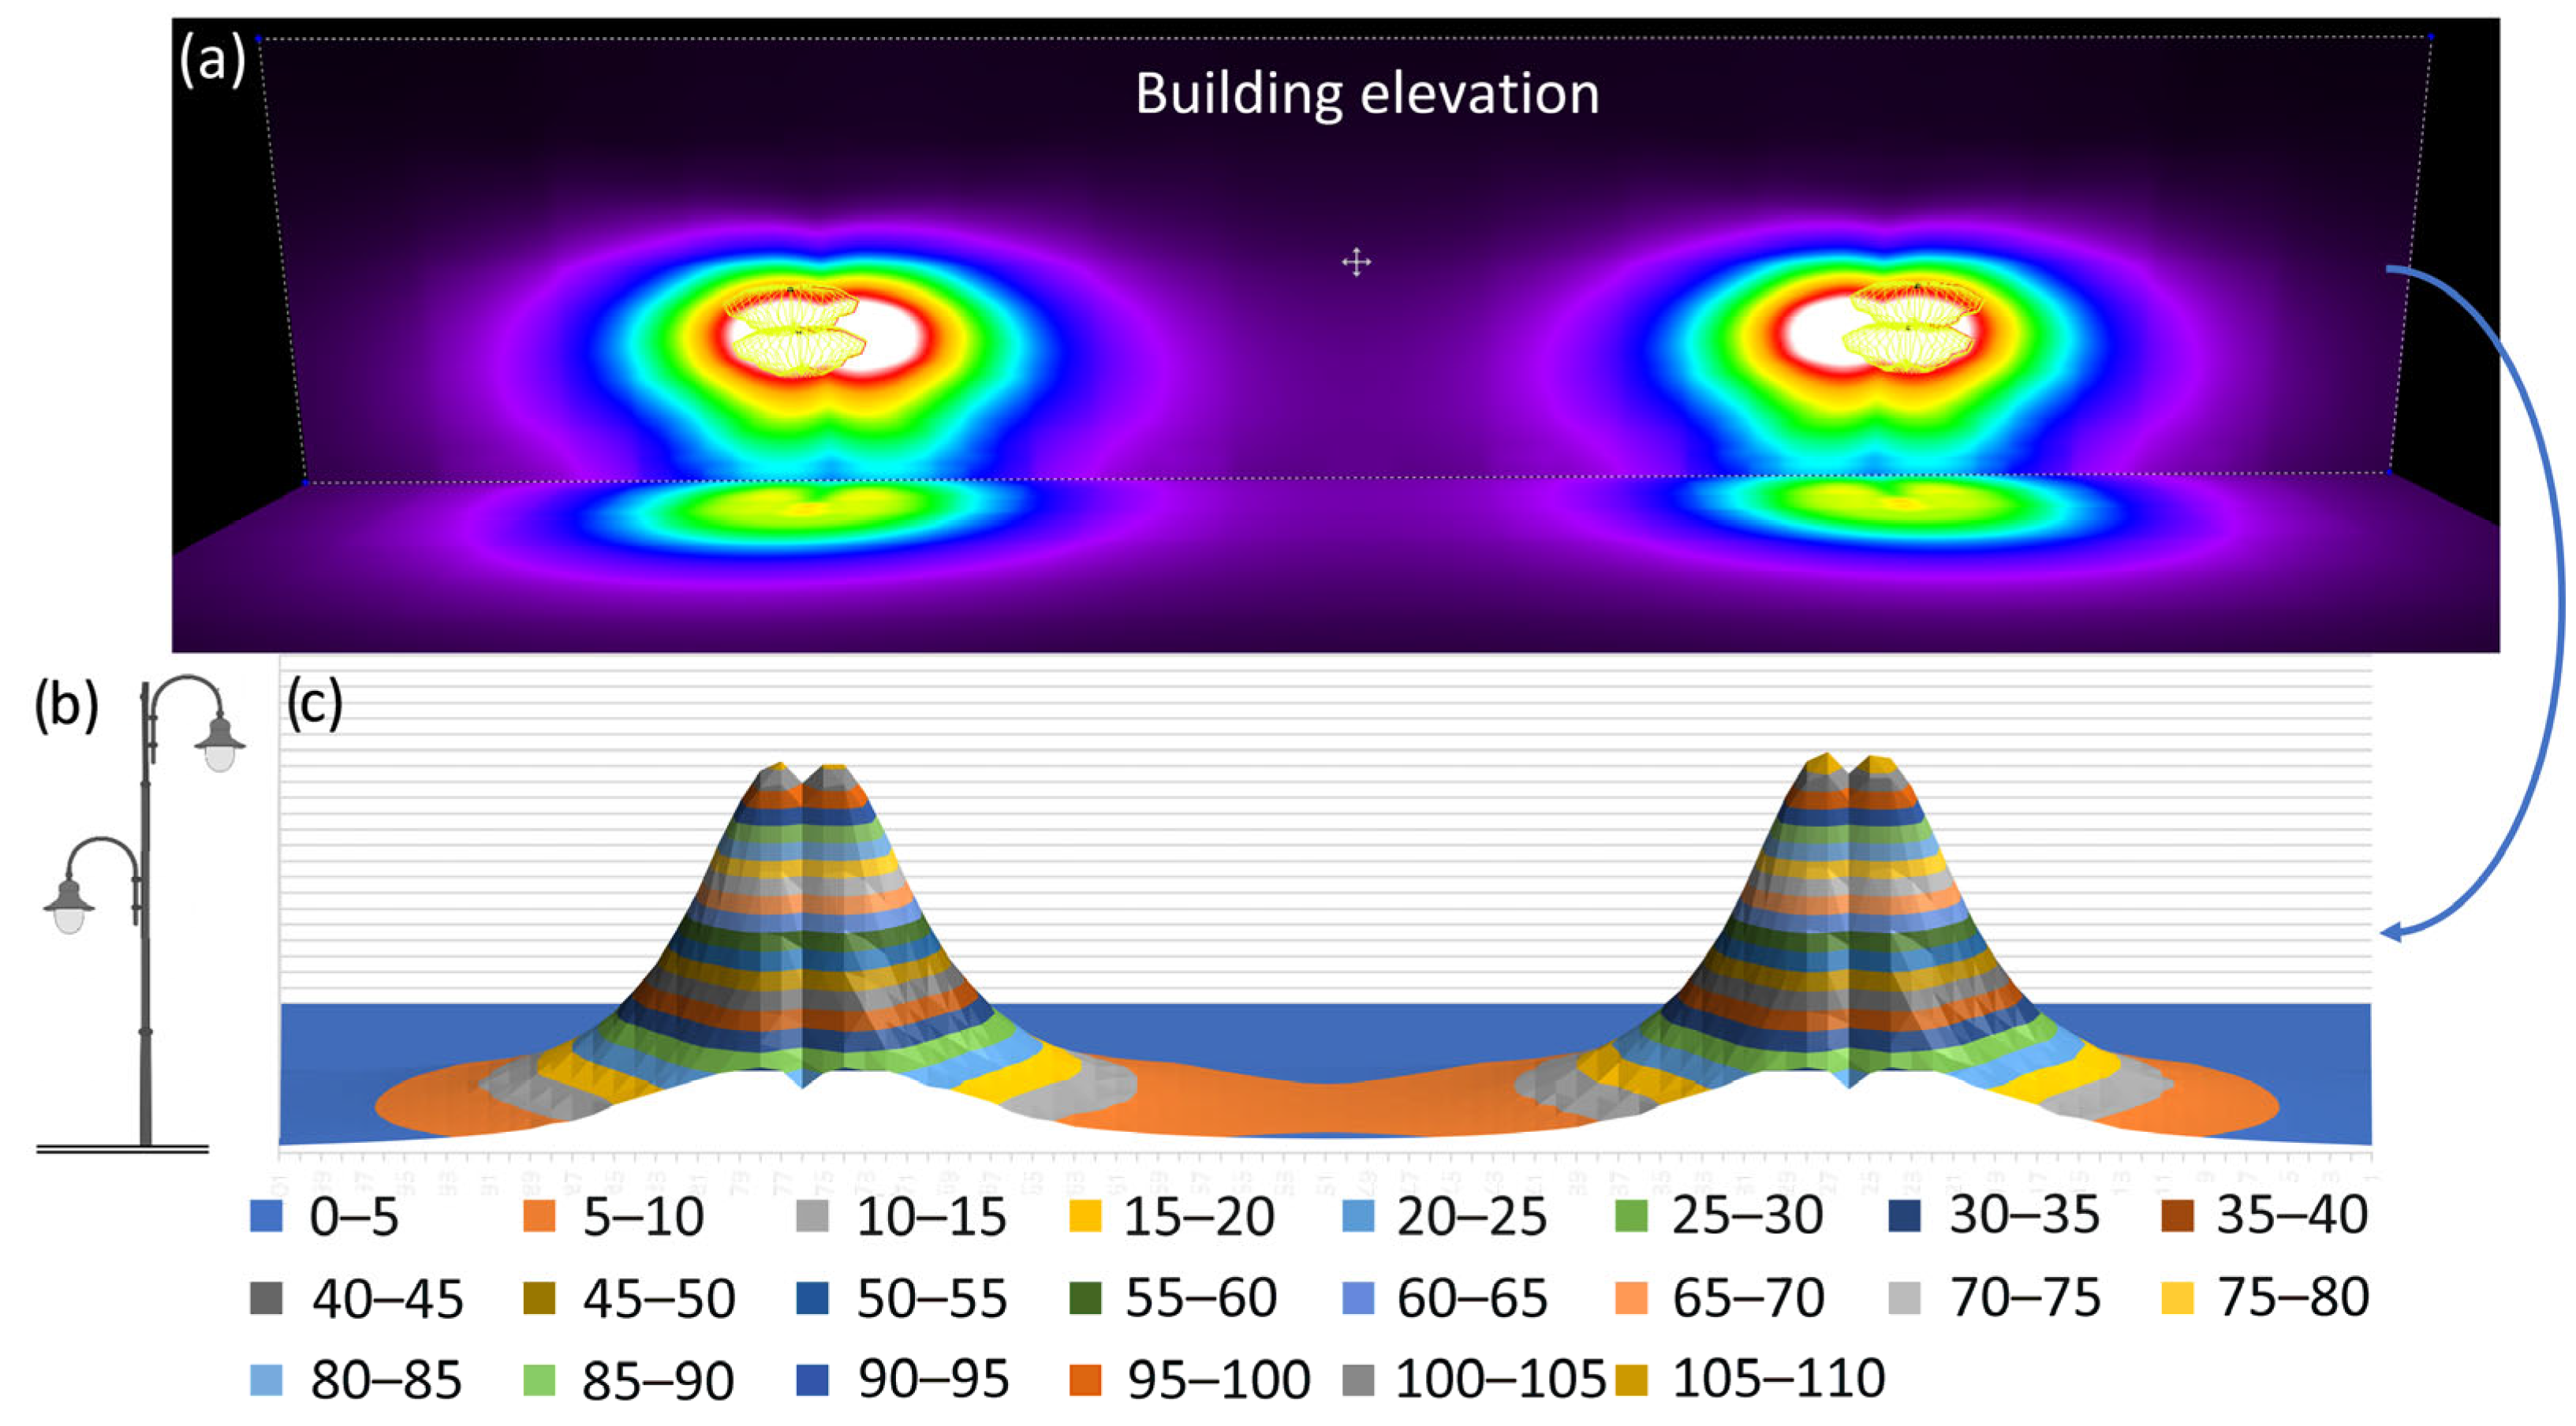
The interpretation of the Sky Glow Contribution Index (SGCI) is as follows: the higher its value, the greater the potential contribution of a given luminaire to the generation of artificial skyglow. The analysis recorded the highest SGCI value for the fixture installed at ground level, which provides decorative lighting. In addition to the increase in night sky brightness caused by lighting infrastructure, a key issue in protecting the nocturnal environment is light immission. Luminaires located near residential buildings may emit luminous flux directly towards windows. To assess this potential impact, a computer simulation was conducted to determine the expected illuminance values on the façade of a residential building. A vertical surface measuring 12.5 m in height and 50 m in length was assumed, simulating the wall of a three-storey tenement house in Tarnów—corresponding to the actual height of the building. Two lighting poles were positioned 4 metres from the wall. In accordance with real-world conditions, each pole was fitted with two luminaires: one mounted at a height of 4 m on the building side to illuminate the pavement, and another at a height of 5 m to light the roadway. The simulation employed photometric files for the fixtures (in EULUMDAT format) and was carried out using the Dialux 4.13 lighting design software. The poles were spaced 25 metres apart, reflecting typical urban infrastructure. The distribution of illuminance, along with the lamppost model, is shown in Figure 15.
Figure 15.
Computer simulation of illuminance distribution: (a) illuminance distribution on the building façade and ground surface; (b) luminaire configuration; (c) corresponding three-dimensional illuminance map.
Polish regulations concerning the protection of residential buildings from the adverse effects of lighting installations specify permissible levels of lighting intensity (light immission) on window surfaces, as set out in the Regulation of the Minister of the Environment of 1 October 2012 [41]. The results of the simulation indicate that the lighting intensity at the level of the first and second storeys of the building exceeds the permissible limit of 5 lx, as defined in the applicable regulations. In certain areas of the façade, the illuminance reaches values exceeding 100 lx representing a substantial and multiple exceedance of the reference threshold. The issue of exceeding the 5 lx limit on the windows of residential buildings has also been documented in studies from other Polish cities (Tabaka and Ściężor, 2024) [49]. This phenomenon highlights that light immission is a significant concern in Polish urban environments, particularly given the prevalence of outdated lighting infrastructure based primarily on older technologies, such as high-pressure sodium (HPS) and metal halide (MH) discharge lamps.
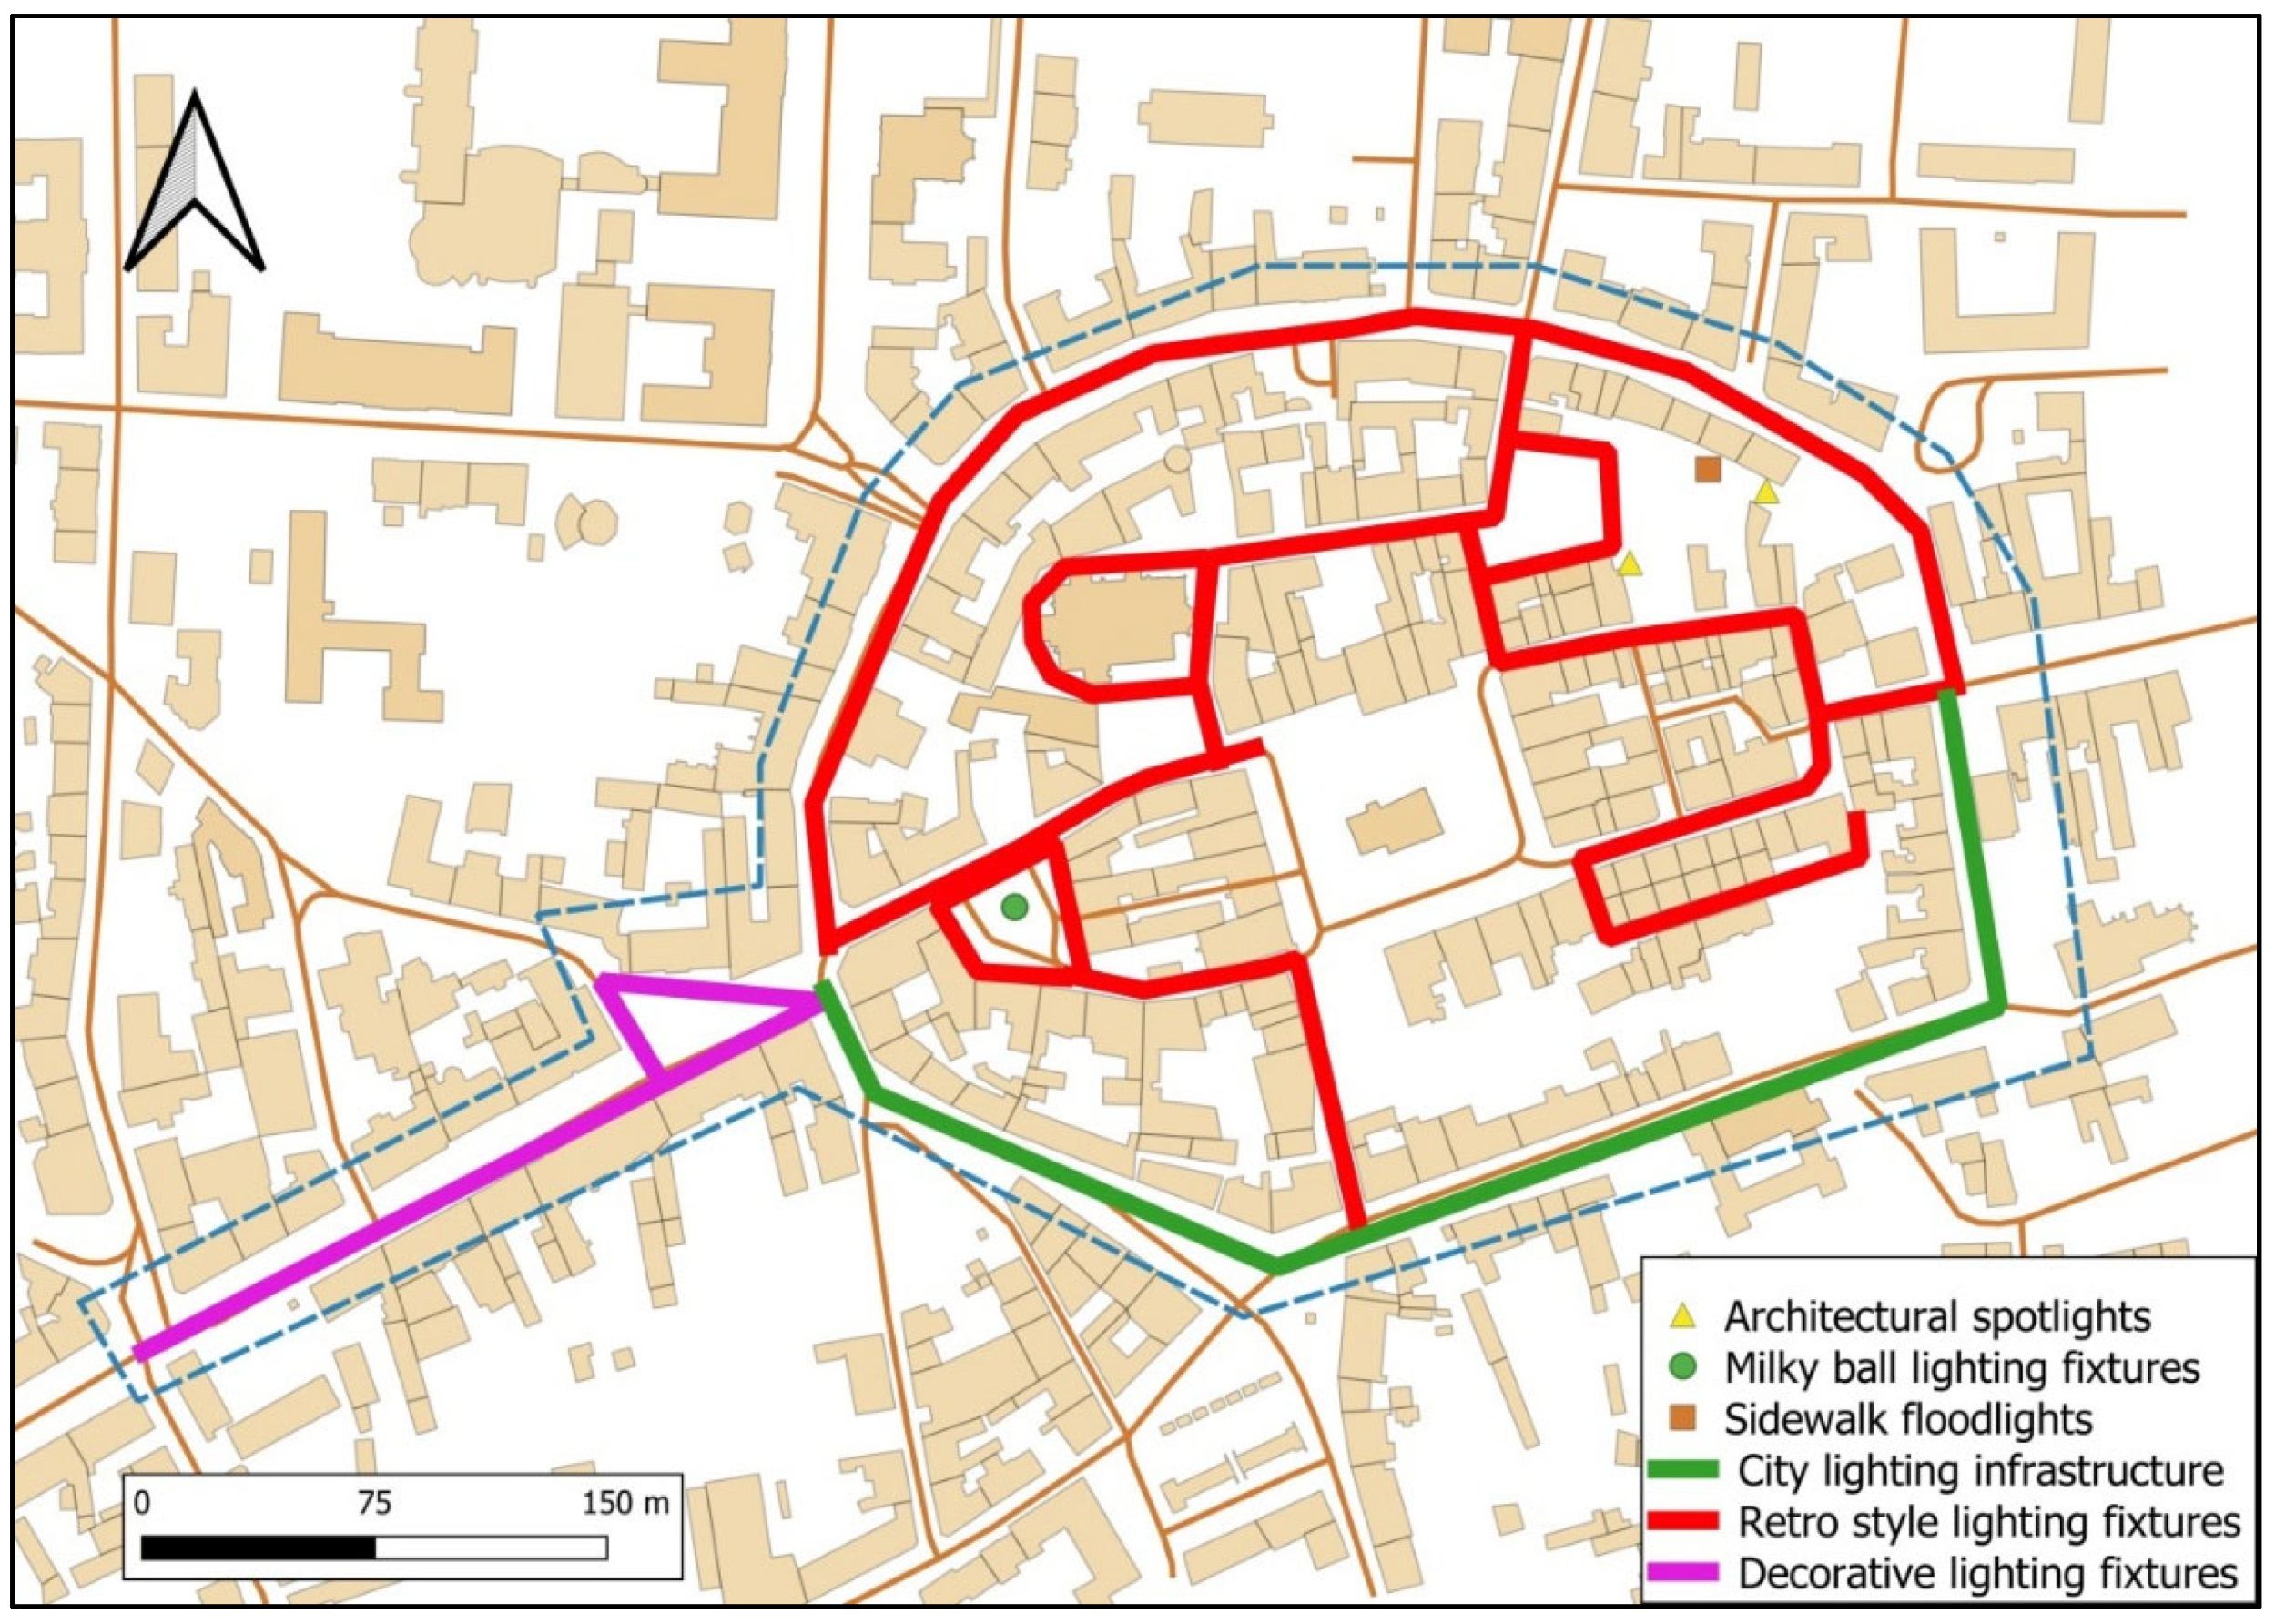
Figure 16 presents the arrangement of various luminaires illuminating the Tarnów Old Town area. Different types of luminaires are indicated using specific symbols: milky globe fixtures are represented by circles; ground-mounted fixtures (installed in the pavement) are shown as squares; architectural luminaires are marked with triangles; and streets illuminated by a mix of fixture types are indicated by symbols comprising circles of various colours, as explained in the figure legend.
Figure 16.
Map illustrating the location of different luminaires within the Old Town in Tarnów.
The luminaires vary in several parameters, including luminous flux, light distribution, correlated colour temperature (CCT), and installation method.
5.2. Light Intensity Level Analysis
According to the Regulation of the Minister of Infrastructure [41] on the technical conditions that buildings and their location must meet, the permissible value of vertical illuminance is 5 lx for white light and 3 lx for coloured or pulsating light. The CIE Technical Report (CIE, 2017) [38] specifies limit values for illuminance on building façades depending on the environmental classification. The report’s definition of five ecological zones ranges from E0, the category of protected areas where any light emission is unacceptable, to E4, which includes city centres and commercial areas with the highest permissible illuminance levels.
Given its well-developed lighting infrastructure, the city of Tarnów can be classified as an E4 environmental zone. Furthermore, the CIE distinguishes between two time periods: “pre-curfew” and “post-curfew.” In Tarnów, the lighting system is not dimmed at night; therefore, applying the 5 lx limit value throughout the entire night is a reasonable approach.
An analysis of the measured data indicates that the lighting intensity on the streets under investigation exceeds the permissible values on the surfaces of residential building windows. Exceeding the 5 lx limit in the context of intrusive light is a significant issue, as it can disrupt residents’ rest and sleep by excessively illuminating interior spaces.
To mitigate excessive lighting in the analysed areas, it is proposed to replace the currently used light sources with models of lower power consumption. This measure would not only reduce energy usage resulting in financial savings but also lower CO2 emissions, which is particularly important in light of rising electricity costs.
5.3. Energy Analysis
The annual electricity consumption for the external lighting of the analysed streets Wałowa, Bernardyńska, and Katedralna is 28,948 kWh/year. Wałowa Street has the highest number of lighting points (39 units), indicating that modernising the lighting along this street would have the greatest impact on reducing electricity consumption.
For the purposes of the calculations, an annual operating time of 4000 h per luminaire was assumed. This value is commonly used in design practice for the climatic conditions of the Central European zone, including Poland, as it accounts for seasonal variations in daylight duration and the typical operation cycle of street lighting in the region.
Electricity rates for external lighting such as street or road lighting in Poland in 2025 vary depending on the energy provider, region, and contractual arrangements. For institutional customers, such as local government units, the total cost of 1 kWh (including both energy and distribution fees) ranges from approximately EUR 0.24 to EUR 0.31 gross. In Tarnów, the distribution system operator responsible for public lighting infrastructure is TAURON Dystrybucja S.A.
For the calculations of rate, of EUR 0.28 per kWh was assumed (converted from PLN 1.20 using the average exchange rate of 1 EUR = 4.3 PLN, NBP 2025), reflecting current market conditions. The results of the calculations for the selected streets are presented in Table 5.
Table 5.
Summary of costs for electricity consumption by current lighting on selected streets.
5.4. Analysis of Potential Energy Savings
One potential solution to reduce energy consumption is the introduction of a lighting control system, as discussed in detail by Ceclana et al. (2007) [50]. The authors identify lighting control strategies such as voltage regulation and energy management optimisation. Precise voltage regulation can be achieved using modern regulators that limit the power supplied to lamps during night hours, thereby reducing energy consumption without compromising lighting quality. In contrast, intelligent control systems incorporating advanced technologies such as programmable schedules for dimming and automatic adjustment of lamp operating parameters in response to changing demand optimise energy management.
Implementing these strategies in public lighting systems can lead to significant energy savings, lower operating costs, extend the lifespan of light sources, and contribute to the reduction in CO2 emissions, thereby supporting sustainable development goals.
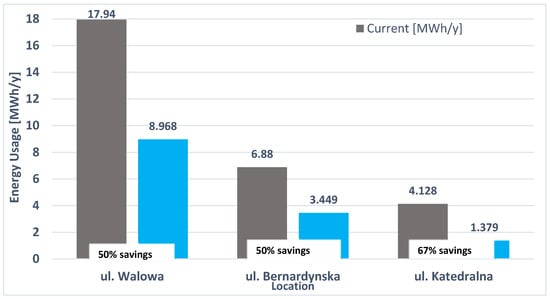
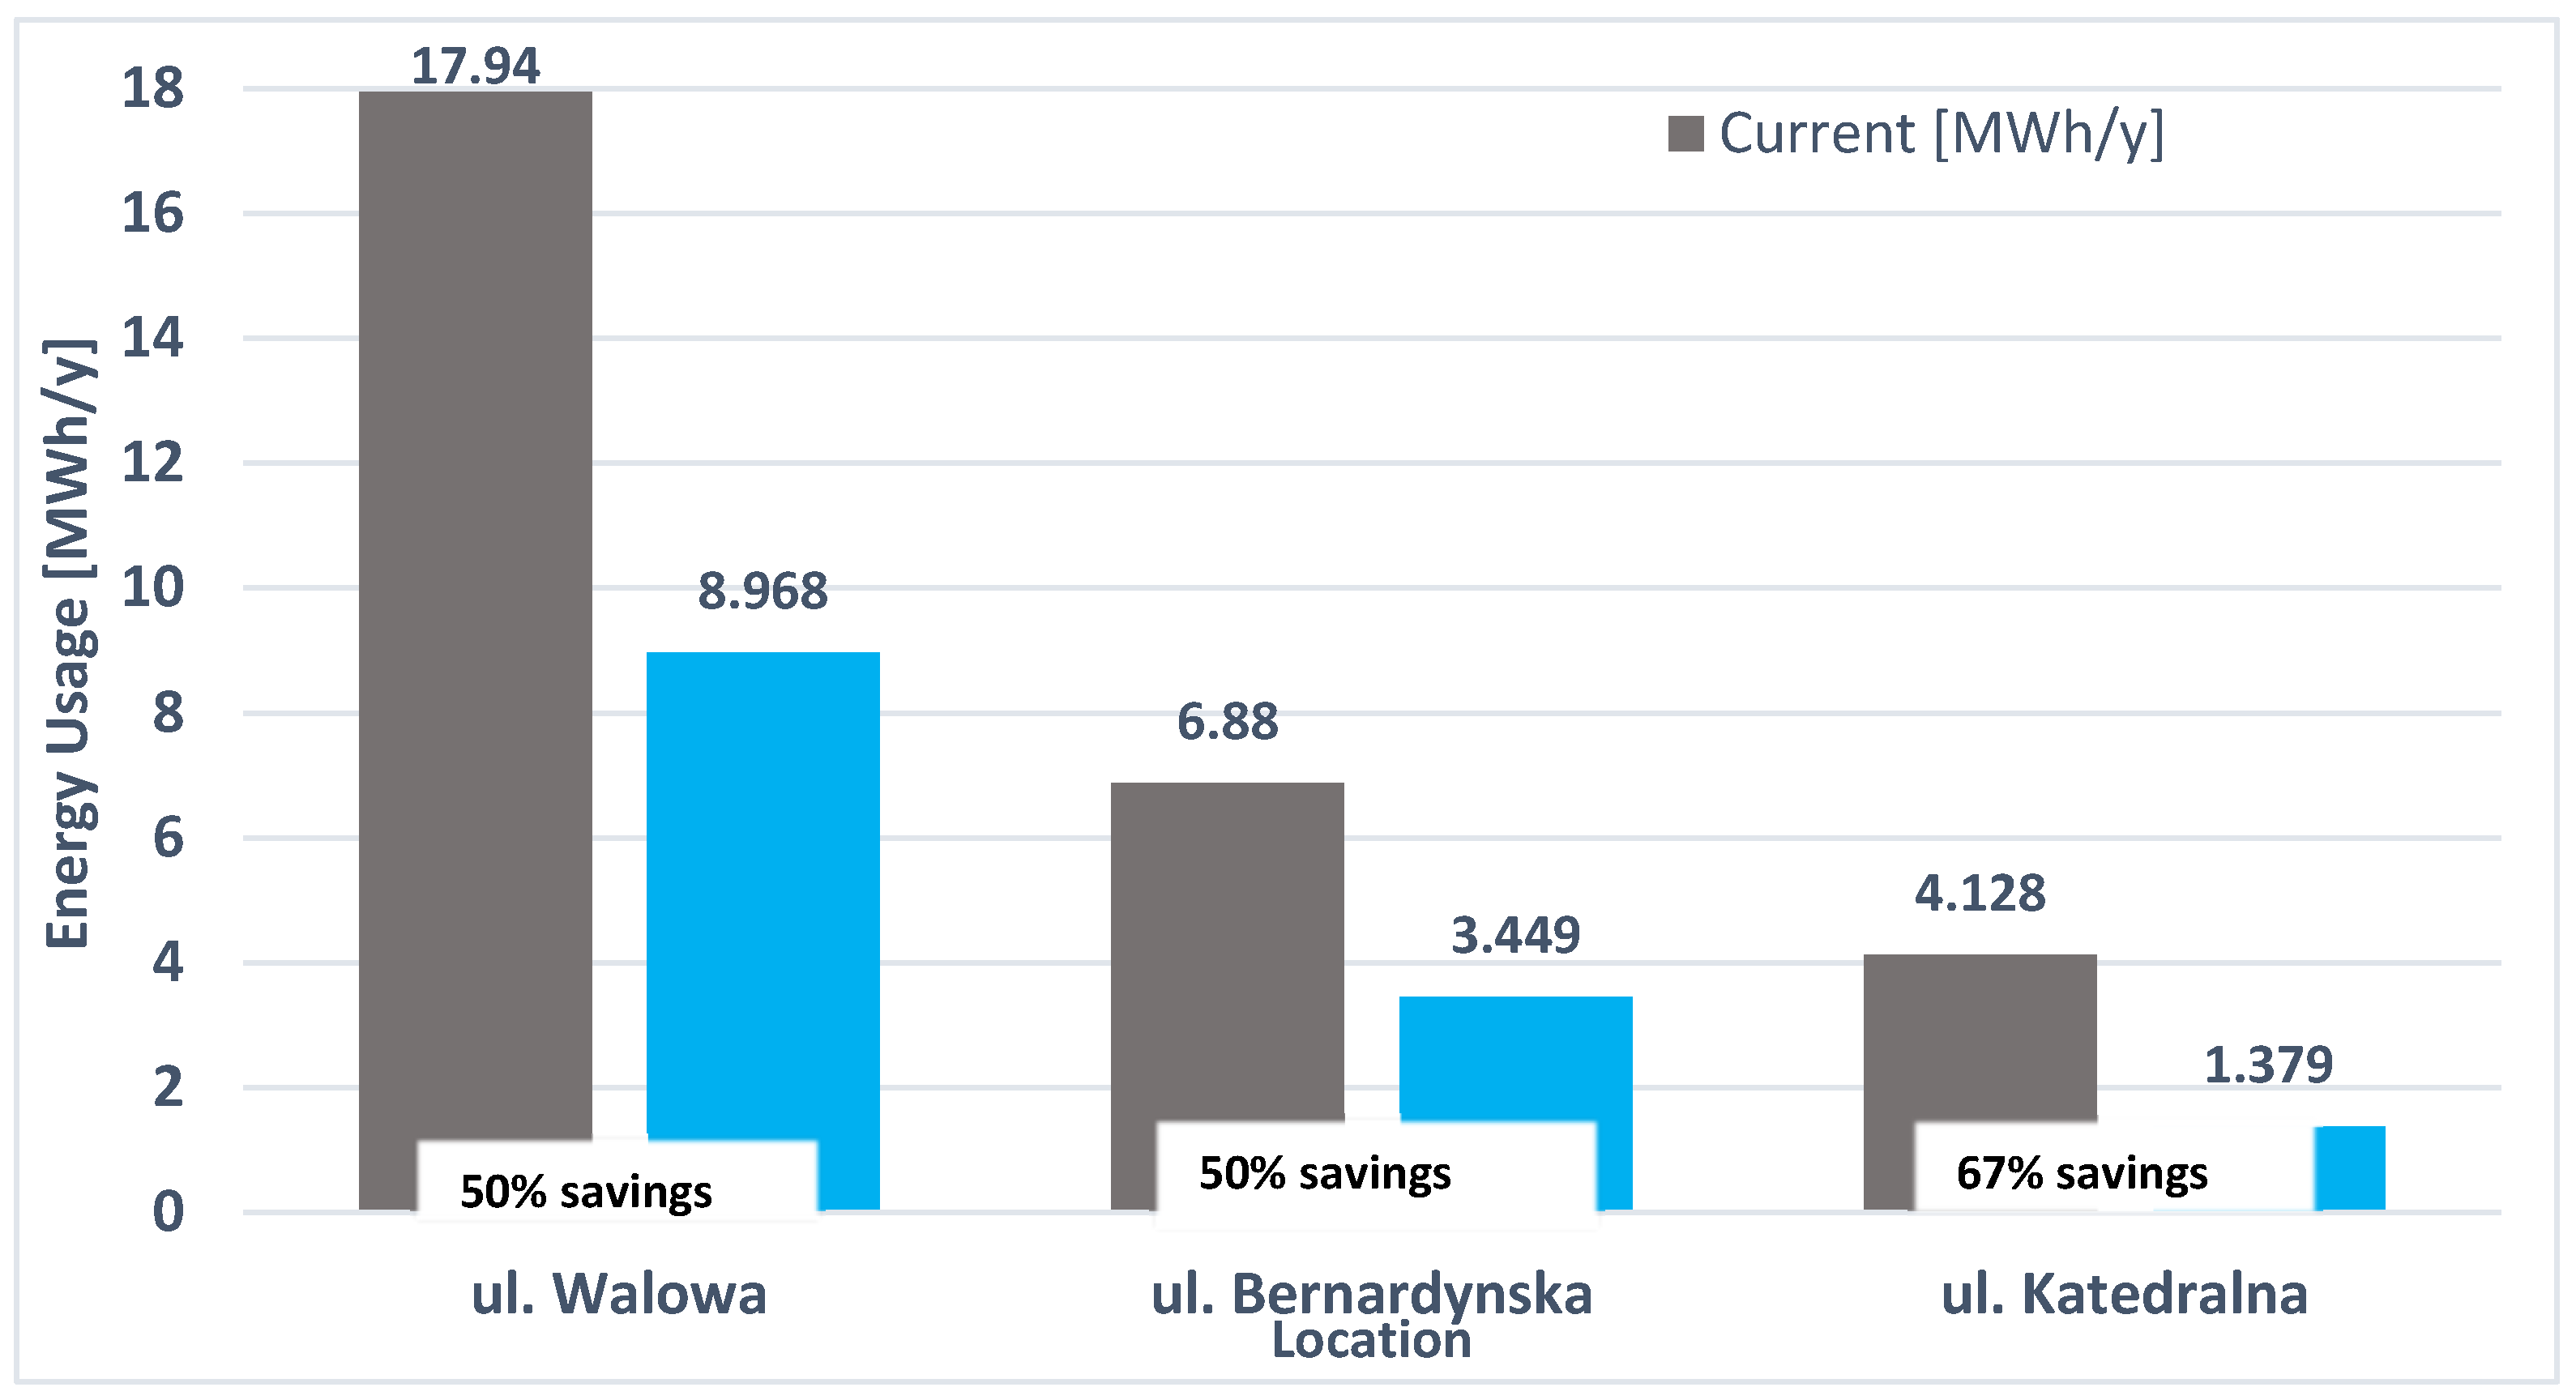
Lighting control measures that reduce luminous flux during specific night hours when traffic intensity is minimal can yield savings of over 40%. Analyses by Ożadowicz and Grela (2017) [51] confirm the effectiveness of this approach. Based on their results, in the present case, energy savings could amount to approximately 13,796 kWh per year, translating into financial savings of about 3,863 Euro annually.
When calculating the projected savings, it was optimistically assumed that the new LED luminaires would not generate capacitive reactive power, and thus would not incur additional fees arising from the Regulation of the Minister of Climate and Environment of 2024. In practice, however, depending on the type of power supply and the characteristics of the luminaires, this phenomenon may occur and should be considered in a comprehensive technical and economic analysis. Unlike traditional sodium luminaires, which are inductive, LED luminaires typically exhibit a capacitive nature.
Figure 17 illustrates the differences in energy consumption before and after modernisation, excluding possible additional operating costs related to reactive power charges. Assuming that LED luminaires do not generate capacitive reactive power, it is clear that the measures undertaken significantly improve energy efficiency and reduce environmental impact.
Figure 17.
The Energy usage and savings with lighting control.
The findings of this study can be compared with those of previous research conducted in medium-sized cities such as Toruń by Karpińska & Kunz (2020) [52]. In that study, light pollution was analysed using sky brightness measurements obtained with a Sky Quality Meter (SQM), which allowed the spatial distribution of night sky luminance to be assessed across different urban zones. The results showed higher levels of light pollution in densely populated areas and lower levels in outlying and green zones, which is consistent with the patterns observed in Tarnów. However, the approach adopted in the present study extends beyond the scope of previous research. While SQM-based studies primarily focus on the resulting brightness of the night sky, they do not provide detailed insight into the contribution of specific luminaire types or the underlying causes of light pollution within the urban fabric. In contrast, this study introduces the Sky Glow Contribution Index (SGCI), which provides a more comprehensive assessment by incorporating the lighting’s directional and spectral characteristics.
Furthermore, unlike previous studies, this research includes a detailed analysis of luminaire types and their photometric properties and contribution to artificial skyglow. It also proposes practical modernisation strategies for lighting systems in historic urban areas that take into account environmental, technical, and heritage-related constraints. This integrated approach provides a more actionable framework for reducing light pollution in medium-sized historic cities.
6. Limitations of the Study
This study has several limitations. Firstly, measurements were only taken once during winter (in February 2020), so seasonal variability and conditions in currently inaccessible areas, such as private courtyards and the Market Square, were not captured. However, the issues identified, such as over-illumination, upward light emission and light trespass, are inherent to the design of the fixtures and remain constant throughout the year. Another limitation is the lack of social research, since residents’ perceptions of comfort, safety and well-being are crucial for a comprehensive evaluation. Future work should therefore expand the temporal and spatial scope of measurements, integrating photometric data with social insights.
7. Conclusions
The analysis of Tarnów’s Old Town lighting systems revealed clear inconsistencies, with overexposed areas (e.g., Krakowska Street) contrasting with underlit spaces (e.g., Zakątna Street). Decorative fixtures such as milky globes and pavement uplights were identified as the main contributors to skyglow, while only suspended street luminaires complied with CIE 150:2017 [37] standards for the E4 zone.
Modernisation with LED technology offers a clear opportunity to reduce light pollution and energy use, provided that full cut-off luminaires with optimised optics and low blue-light emission are selected. Future projects should also integrate social research to ensure that solutions meet both technical standards and residents’ needs.
The following improvement options and recommendations have been proposed to enhance the quality of urban lighting:
- phasing out luminaires with high upward light emission;
- introducing integrated lighting management systems to adapt illumination to local conditions;
- reducing overexposure while enhancing lighting in underlit areas;
- applying solutions that respect both cultural heritage and ecological sustainability.
From a heritage conservation perspective, modern lighting technologies can, when properly designed, contribute to the protection rather than degradation of historic urban environments. Full cut-off luminaires minimise upward light emission, helping to preserve the visual integrity of historic skylines and reducing skyglow. In addition, LED sources emit negligible amounts of ultraviolet (UV) and infrared (IR) radiation, which can be harmful to historic façade materials. Their precise optical control allows for targeted illumination of architectural details without excessive light spill or visual disturbance.
Importantly, such interventions can be implemented in a reversible and non-invasive manner, in line with conservation principles. Therefore, modern lighting solutions may support a balanced approach that integrates environmental protection, user safety, and the preservation of the unique character of historic urban spaces.
Tarnów can serve as a model for other historic cities in Poland and across Europe by combining environmental, health, energy and heritage considerations. Well-designed, intelligent lighting systems improve visual comfort and urban safety, mitigate skyglow, reduce CO2 emissions and generate long-term financial savings, all while preserving the unique cultural identity of historic urban spaces.
Author Contributions
Conceptualization P.T., A.C. and T.Ś.; methodology, P.T. and T.Ś.; software, P.T.; validation, P.T., M.N.-O. and T.Ś.; formal analysis, P.T.; investigation, A.C., I.E. and T.Ś.; resources, M.N.-O. and A.C.; data curation, P.T. and T.Ś.; writing—original draft preparation, P.T., A.C. and M.N.-O. and T.Ś.; writing—review and editing, M.N.-O., A.C., M.J.-K., B.M.-P., B.S. and T.Ś.; visualization, P.T. and B.M.-P.; supervision, B.S. and M.N.-O.; project administration, A.C. and M.N.-O. All authors have read and agreed to the published version of the manuscript.
Funding
This publication was carried out as part of the NAWA STARS EU BOOSTER project, funded under the FERS program (FERS.01.05-IP.08-0219/23), under agreement no. BPI/WUE/2024/1/00029/U/00001 supported by the Polish National Agency for Academic Exchange (NAWA).
Institutional Review Board Statement
Not applicable.
Informed Consent Statement
Not applicable.
Data Availability Statement
The measurement data supporting the findings of this study are available from the corresponding author upon reasonable request.
Acknowledgments
The authors would like to thank the municipal authorities of Tarnów for their support during the field measurements and for providing access to technical information related to the lighting infrastructure.
Conflicts of Interest
The authors declare no conflicts of interest.
References
- Jägerbrand, A.K. Synergies and trade-offs between sustainable development and energy performance of exterior lighting. Energies 2020, 13, 2245. [Google Scholar] [CrossRef] [Scilit]
- Nawalkowski, P.; Konior, J. Dark Sky Community Sopotnia Wielka–the first active dark sky protection community in Poland: Conclusions and valorization of actions 10 years after public lighting modernization. In Artificial Light at Night: Between Threat and Development; Tabaka, P., Ed.; Lodz University of Technology: Łódź, Poland, 2022; pp. 247–273. [Google Scholar]
- Czaplicka, Z.A.; Czaplicka, A. The role of light in city functioning. In Artificial Light at Night: Between Threat and Development; Tabaka, P., Ed.; Lodz University of Technology: Łódź, Poland, 2022; pp. 315–330. [Google Scholar]
- Ściężor, T.; Kubala, M. The effect of atmospheric dust on the brightness of the night sky. Kosm. Probl. Nauk Biol. 2015, 64, 579–587. [Google Scholar]
- Zimerman, M.E.; Kim, B.M.; Hale, C.; Westwood, A.J.; Brickman, A.M.; Shechter, A. Neuropsychological function response to nocturnal blue light blockage in individuals with symptoms of insomnia: A pilot randomized controlled study. J. Int. Neuropsychol. Soc. 2019, 25, 668–677. [Google Scholar] [CrossRef] [Scilit] [PubMed]
- Skwarło-Sońta, K.; Żużewicz, K. The impact of ALAN on the sleep–wake rhythm and human health. In Light Pollution of the Night Sky–Towards Interdisciplinary Understanding, Monitoring, and Counteraction; Kunz, M., Ed.; Nicolaus Copernicus University Press: Toruń, Poland, 2023; pp. 13–29. [Google Scholar]
- Markus, R.P.; Sousa, K.S.; da Silveira Cruz Machado, S.; Fernandes, P.A.; Ferreira, Z.S. Possible role of pineal and extra pineal melatonin in surveillance, immunity, and first line defense. Int. J. Mol. Sci. 2021, 22, 12143. [Google Scholar] [CrossRef] [Scilit] [PubMed]
- Arble, D.M.; Bass, J.; Behn, C.D.; Butler, M.P.; Challet, E.; Czeisler, C.; Depner, C.M.; Elmquist, J.; Franken, P.; Grandner, M.A.; et al. Impact of sleep and circadian disruption on energy balance and diabetes: A summary of workshop discussions. Sleep 2015, 38, 1849–1860. [Google Scholar] [CrossRef] [Scilit] [PubMed]
- Gangwisch, J.E. Invited commentary: Nighttime light exposure as a risk factor for obesity through disruption of circadian and circannual rhythms. Am. J. Epidemiol. 2014, 180, 251–253. [Google Scholar] [CrossRef] [Scilit]
- Jurkowlaniec, E. Zaburzenia rytmów biologicznych pod wpływem zanieczyszczenia światłem–wybrane fizjologiczne aspekty niedoboru melatoniny oraz witaminy D. Pol. J. Sustain. Dev. 2017, 21, 47–57. [Google Scholar] [CrossRef] [Scilit]
- Yang, W.S.; Deng, Q.; Fan, W.Y.; Wang, W.Y.; Wang, X. Light exposure at night, sleep duration, melatonin, and breast cancer: A dose–response analysis of observational studies. Eur. J. Cancer Prev. 2014, 23, 269–276. [Google Scholar] [CrossRef] [Scilit]
- Kloog, I.; Haim, A.; Stevens, R.G.; Portnov, B.A. Global co distribution of light at night (LAN). Chronobiol. Int. 2009, 26, 108–125. [Google Scholar] [CrossRef] [Scilit]
- Skrob, K. Zanieczyszczenie światłem jako czynnik odpowiedzialny za globalną apokalipsę owadów–podsumowanie badań. In Light Pollution of the Night Sky–Towards Interdisciplinary Understanding, Monitoring, and Counteraction; Kunz, M., Ed.; Nicolaus Copernicus University Press: Toruń, Poland, 2023; pp. 53–76. [Google Scholar]
- Hölker, F.; Wolter, C.; Perkin, E.K.; Tockner, K. Light pollution as a biodiversity threat. Trends Ecol. Evol. 2010, 25, 681–682. [Google Scholar] [CrossRef] [Scilit]
- Randler, C. Sleep, sleep timing and chronotype in animal behaviour. Anim. Behav. 2014, 94, 161–166. [Google Scholar] [CrossRef] [Scilit]
- Lacoeuilhe, A.; Machon, N.; Julien, J.-F.; Le Bocq, A.; Kerbiriou, C. The influence of low intensities of light pollution on bat communities in a semi natural context. PLoS ONE 2014, 9, e103042. [Google Scholar] [CrossRef] [Scilit]
- Light Pollution Think Tank. In Zanieczyszczenie Światłem. Identyfikacja i Przeciwdziałanie; Poradnik multidisciplinarny; Light Pollution Think Tank: Kraków, Poland, 2023.
- Czaja, M.; Kołton, A. How light pollution can affect spring development of urban trees and shrubs. Urban For. Urban Green. 2022, 77, 127753. [Google Scholar] [CrossRef] [Scilit]
- Kołton, A.; Wojciechowska, R.; Czaja, M. Modyfikacja budowy morfologicznej liści klonu jawora i dławisza okrągłolistnego na skutek zanieczyszczenia światłem nocą. In Artificial Light at Night: Between Threat and Development; Tabaka, P., Ed.; Lodz University of Technology: Łódź, Poland, 2022; pp. 19–33. [Google Scholar]
- Shibaeva, T.G.; Mamaev, A.V.; Titov, A.F. Possible physiological mechanisms of leaf photodamage in plants grown under continuous lighting. Russ. J. Plant Physiol. 2023, 70, 148–159. [Google Scholar] [CrossRef] [Scilit]
- Haque, M.S.; Kjaer, K.H.; Rosenqvist, E.; Ottosen, C.O. Continuous light increases growth, daily carbon gain, antioxidants, and alters carbohydrate metabolism in a cultivated and wild tomato species. Front. Plant Sci. 2015, 6, 522. [Google Scholar] [CrossRef] [Scilit] [PubMed]
- Moore, M.V.; Pierce, S.M.; Walsh, H.M.; Kvalvik, S.K.; Lim, J.D. Urban light pollution alters the diel vertical migration of Daphnia. Verh. Int. Ver. Limnol. 2000, 27, 1–4. [Google Scholar] [CrossRef] [Scilit]
- Falchi, F.; Cinzano, P.; Duriscoe, D.; Kyba, C.C.M.; Elvidge, C.D.; Baugh, K.; Portnov, B.A.; Rybnikova, N.A.; Furgoni, R. The new world atlas of artificial night sky brightness. Sci. Adv. 2016, 2, e1600377. [Google Scholar] [CrossRef] [Scilit]
- Ściężor, T. Natural and Anthropogenic Factors of Light Pollution in the Night Sky; Cracow University of Technology Press: Kraków, Poland, 2018. [Google Scholar]
- Tarnów, I.T. History of the City. Available online: https://www.it.tarnow.pl/atrakcje/tarnow/ogolne-informacje/historia-miasta/ (accessed on 24 July 2024).
- Tarnów, M.M. History. Available online: https://www.mmtarnow.com/p/historia.html (accessed on 24 July 2024).
- Del Bianco, C.; Montedoro, L. Cultural tourism pressure on historic centres: Its impact on public space and intervention strategies for its mitigation: Florence, Italy, as a case study. Sr. Mieszk./Hous. Environ. 2023, 42, 80–86. [Google Scholar] [CrossRef] [Scilit]
- Dutkiewicz, J.E. Tarnów. Development of the City in the Years 1787–1939; Institute of Urban Planning and Architecture: Warsaw, Poland, 1954. [Google Scholar]
- Krupiński, A.B. Tarnów. In Monuments of Urban Planning and Architecture in Poland. Reconstruction and Conservation; Zin, W., Ed.; Arkady: Warsaw, Poland, 1986; Volume 1, pp. 479–496. [Google Scholar]
- Chrzanowski, T.; Kornecki, M. Art of the Kraków Region; Kraków, Poland, 1982; p. 88. [Google Scholar]
- Krasnowolski, B. Spatial arrangements of private towns in Lesser Poland: Selected examples. Ann. Soc. Econ. Hist. 2016, LXXVII, 24. [Google Scholar]
- Krasnowolski, B. The settlement complex of Spycimir of Leliwa in Tarnów. Quart. Quart. Q. Inst. Art Hist. Univ. Wrocław 2021, 2, 40–51. [Google Scholar] [CrossRef] [Scilit]
- Ściężor, T. Effect of street lighting on the urban and rural night time radiance and the brightness of the night sky. Remote Sens. 2021, 13, 1654. [Google Scholar] [CrossRef] [Scilit]
- Elvidge, C.D.; Baugh, K.E.; Zhizhin, M.; Hsu, F.-C. Why VIIRS data are superior to DMSP for mapping nighttime lights. Proc. Asia-Pac. Adv. Netw. 2013, 35, 62–69. [Google Scholar] [CrossRef] [Scilit]
- Zamorano, J.; Sánchez de Miguel, A.; Pascual, S.; Castaño, J.G.; Ramírez, P.; Challupner, P. ISS nocturnal images as a scientific tool against light pollution. LICA Rep. 2011. [Google Scholar] [CrossRef] [Scilit]
- Sánchez de Miguel, A.; Kyba, C.C.M.; Aubé, M.; Zamorano, J.; Cardiel, N.; Tapia, C.; Bennie, J.; Gaston, K.J. Colour remote sensing of the impact of artificial light at night (I): The potential of the International Space Station and other DSLR-based platforms. Remote Sens. Environ. 2019, 224, 92–103. [Google Scholar] [CrossRef] [Scilit]
- CIE. Guide on the Limitation of the Effects of Obtrusive Light from Outdoor Lighting Installations, 2nd ed.; Technical Report 150:2017; Commission Internationale de l’Éclairage: Vienna, Austria, 2017. [Google Scholar]
- CIE. Classification System of Illuminance and Luminance Meters; Technical Report CIE 231:2019; Commission Internationale de l’Éclairage: Vienna, Austria, 2019. [Google Scholar] [CrossRef] [Scilit]
- Kwiatkowska-Malina, J.; Horynek, H. Spójna strategia oświetleniowa przestrzeni miejskiej jako narzędzie ograniczenia zanieczyszczenia światłem. Zesz. Nauk. Politech. Częstoch. 2020, 26, 102–107. [Google Scholar] [CrossRef] [Scilit]
- Ratajkiewicz, P.; Michalak, H. Strategia oświetlenia jako element zrównoważonego rozwoju miast. Zesz. Nauk. Politech. Poznańskiej. Archit. Urban. Archit. Wnętrz 2023, 17, 479–500. [Google Scholar]
- Minister of Development and Technology. Announcement of the Minister of Development and Technology of 15 April 2022 on the Publication of the Consolidated Text of the Regulation of the Minister of Infrastructure on the Technical Conditions to be met by Buildings and Their Location. Journal of Laws of the Republic of Poland 2022, Item 1225. Available online: https://isap.sejm.gov.pl/isap.nsf/DocDetails.xsp?id=WDU20220001225 (accessed on 24 July 2024).
- Bará, S.; Rigueiro, I.; Lima, R.C. Monitoring transition: Expected night sky brightness trends in different photometric bands. J. Quant. Spectrosc. Radiat. Transf. 2019, 239, 106644. [Google Scholar] [CrossRef] [Scilit]
- Bará, S.; Lima, R.C.; Zamorano, J. Monitoring long-term trends in the anthropogenic night sky brightness. Sustainability 2019, 11, 3070. [Google Scholar] [CrossRef] [Scilit]
- Barentine, J.C. Night Sky Brightness Measurement, Quality Assessment and Monitoring. Nat. Astron. 2022, 6, 1120–1132. [Google Scholar] [CrossRef] [Scilit]
- Deverchère, P.; Vauclair, S.; Bosch, G.; Moulherat, S.; Cornuau, J.H. Towards an absolute light pollution indicator. Sci. Rep. 2022, 12, 17050. [Google Scholar] [CrossRef] [Scilit]
- Aubé, M.; Roby, J.; Kocifaj, M. Evaluating potential spectral impacts of various artificial lights on melatonin suppression, photosynthesis, and star visibility. PLoS ONE 2013, 8, e67798. [Google Scholar] [CrossRef] [Scilit]
- Tabaka, P. Influence of replacement of sodium lamps in park luminaires with LED sources of different closest color temperature on the effect of light pollution and energy efficiency. Energies 2021, 14, 6383. [Google Scholar] [CrossRef] [Scilit]
- Tabaka, P.; Kołomański, S. Influence of replacing discharge lamps with LED sources in outdoor lighting installations on astronomical observations. Bull. Pol. Acad. Sci. Tech. Sci. 2023, 71, e147915. [Google Scholar] [CrossRef] [Scilit]
- Tabaka, P.; Ściężor, T. Measurements of light trespass on windows of residential buildings located near streets. Sci. Rep. 2024, 14, 6492. [Google Scholar] [CrossRef] [Scilit]
- Ceclan, A.; Micu, D.D.; Simion, E.; Donca, R. Public lighting systems: An energy saving technique and product. In Proceedings of the 2007 International Conference on Clean Electrical Power, Capri, Italy, 21–23 May 2007; IEEE: Piscataway, NJ, USA, 2007; pp. 677–681. [Google Scholar] [CrossRef] [Scilit]
- Ożadowicz, A.; Grela, J. Energy saving in the street lighting control system—A new approach based on the EN 15232 standard. Energy Effic. 2017, 10, 563–576. [Google Scholar] [CrossRef] [Scilit]
- Karpińska, D.; Kunz, M. Analysis of Light Pollution of the Night Sky in Toruń (Poland). Civ. Environ. Eng. Rep. 2020, 30, 155–172. [Google Scholar] [CrossRef] [Scilit]













Disclaimer/Publisher’s Note: The statements, opinions and data contained in all publications are solely those of the individual author(s) and contributor(s) and not of MDPI and/or the editor(s). MDPI and/or the editor(s) disclaim responsibility for any injury to people or property resulting from any ideas, methods, instructions or products referred to in the content. |
© 2026 by the authors. Licensee MDPI, Basel, Switzerland. This article is an open access article distributed under the terms and conditions of the Creative Commons Attribution (CC BY) license.