


Abstract
The use of renewable energy sources instead of conventional ones, together with the development of efficient electricity storage solutions, represents a central objective of the transition to sustainable and resilient energy systems. In this context, two main development directions are the integration of hydrogen in the energy chain (Power-to-Gas) and the use of batteries, each with specific advantages and disadvantages, compared to internal combustion engines. The purpose of this work was to evaluate the dynamic response time of a hydrogen fuel cell model powered by green hydrogen, under conditions of sudden and instantaneous power demand, for its integration into wind-based renewable energy systems. Experimental research was carried out on an autonomous installation designed to operate continuously for an unlimited duration, simulating the integration of hydrogen produced from wind sources. The novelty consists of the application of an instrumental method for automatic measurement of the response time of a proton exchange membrane hydrogen fuel cell, based on the automatic acquisition and processing of measured electrical signals. The response time of the fuel cell was compared with that of an internal combustion engine based on the classic Carnot cycle, using a dedicated oscilloscope. The load connection time, the current and voltage variation as a function of time were recorded simultaneously. The results show that the response time of the fuel cell is relatively short (approximately 0.3 ms), much lower than that of the internal combustion engine (0.7 s), being of the order of about 2333 times smaller. In conclusion, the hydrogen fuel cell can be effectively integrated into renewable energy systems for the role of an uninterruptible power supply, with an exceptionally fast dynamic response, suitable for applications in regulating and supporting wind-powered networks.
1. Introduction
One of the most promising energy conversion devices for stationary and portable power systems is the proton exchange membrane fuel cell (PEMFC), especially in the context of integrating renewable energy sources such as wind power. In modern energy chains, hydrogen produced from surplus wind energy (green hydrogen) can be stored and subsequently converted into electricity by a fuel cell, allowing grid supplementation when wind production is low [1,2,3,4]. Compared to traditional systems based on the Carnot cycle of internal combustion engines or the Joule cycle of gas turbines, the use of hydrogen in fuel cells offers significant advantages in terms of energy efficiency, operational flexibility and the potential to reduce greenhouse gas emissions, especially in wind-integrated applications. To understand the performance of fuel cells and optimize their design in wind power systems, characterizing their dynamic responses to external load variations, in parallel with the operating parameters, is an area of intensive investigation. In the context of integration with wind power, the dynamic response of a PEM fuel cell is essential to ensure the rapidity and stability in covering the fluctuations produced by the instability of wind power generation. The dynamic response of a PEM fuel cell results from a complex interaction between thermal, hydraulic and electrochemical effects, and optimizing the operating conditions such as temperature, humidity, reactant stoichiometry, pressure and water management in the cell structure is crucial to obtain fast and stable response times. In wind-powered energy systems, these parameters directly influence the fuel cell’s ability to respond instantaneously to load changes, contributing to the efficiency and resilience of the entire wind hydrogen fuel cell chain. The response time of a proton exchange membrane (PEM) fuel cell to a change in current or voltage is influenced by several factors, including operating temperature, humidity, reactant stoichiometry, pressure, and water management within the cell [5,6]. Specifically, factors such as operating temperature, humidity, and reactant stoichiometry have a significant influence on the cell response dynamics to load variations. Higher operating temperatures generally lead to shorter response times, as a result of increased ionic conductivity of the membrane and enhanced water transport processes within it. In addition, proper humidity management helps maintain optimal membrane hydration, preventing both drying and flooding, which can negatively affect performance. Reactant stoichiometry also influences the availability of chemical species at the electrodes, playing an essential role in the stability and rapidity of the electrochemical response of the system [7,8]. However, there is an optimal temperature range, and exceeding this range can lead to performance degradation and slower response, requiring precise tuning of the operating conditions in the context of wind integration [9].
In recent years, the proton exchange membrane (PEM) market has experienced rapid and extensive development, mainly due to the low operating temperatures of the cells and the high power density that they can offer [10,11,12,13]. In the context of renewable energy systems, including those integrated with wind energy, the increased performance of PEMs strengthens the potential of fuel cells as an efficient solution for the conversion and storage of green hydrogen energy. Researchers have focused their efforts on investigating the local current distribution in PEM cells, but also on the analysis of the local current, total current and local voltage values [14,15,16], essential aspects for the integration of these cells into wind–hydrogen chains. The results of a study on the response time of a PEM cell under the action of an external load highlighted the dynamic behavior of the cell before establishing the steady state. The authors evaluated the response time of a PEM cell array to gradual load changes, as well as the time it takes for the output voltage to stabilize, and typical response times were in the order of 0.5 ms for peak voltage and 3 ms for stabilization [17,18]. In wind energy applications, these extremely short response times are critical for quickly covering sudden variations in wind power output and maintaining grid stability. The cell structure and materials including the membrane type, electrodes, and diffusion layer are important factors to consider in fuel cell design and optimization [19,20]. Dynamic modeling of PEM cells thus becomes essential, as it allows for predictions of system behavior that closely align with experimental results under varying load conditions [21,22,23,24,25,26,27,28,29,30]. The main objective of this experimental study was to demonstrate the speed with which the cell adjusts its output voltage and current to a change in load or operating conditions. The impact of response time is particularly important in applications where the fuel cell must adapt to changing power requirements, because the maximum rates of change in current and voltage are specific to the fuel cell stack and test hardware; response times can vary in a range from less than 5 ms to approximately 100 ms. It has been experimentally demonstrated that PEMFCs can handle various types of load without the need for additional current filtering or smoothing, which makes them suitable for the role of a fast and stable power source in wind-integrable systems. The stack proposed in this paper can be easily integrated into a fuel cell system powered by green hydrogen, and the final solution is distinguished by its low cost and high efficiency, being compatible with the sustainability and resilience requirements of modern wind energy systems.
The aim of this paper is to estimate the response time of a hydrogen fuel cell model to a sudden and instantaneous power demand, in the context of integrating fuel cells with renewable energy sources, such as wind power. The dynamic response of fuel cells is of particular importance for applications where green hydrogen is produced from surplus wind power and then rapidly converted into electricity; unfortunately, there are few publications that describe in detail the dynamic behavior of PEM fuel cells under various operating conditions. Several studies have been conducted on the dynamic response of PEM, which provide a reference framework for assessing the performance of wind–hydrogen-fuel cell systems. Some authors have investigated the behavior and performance of a proton exchange membrane (PEM) fuel cell to rapid load changes, observing that the response of the fuel cell system is faster than 0.15 s to these changes; however, load changes are visible in the voltage and current responses. Other researchers have experimentally evaluated the dynamic behavior of an air-breathing fuel cell, measuring the PEM performance as a function of temperature, humidity, and airflow, in steady-state and transient regimes. One objective of the studies was to analyze the effect of fuel stoichiometry, tanks, and dilution on the dynamic behavior of a PEM fuel cell during load changes. The behavior when exceeding the steady-state current density was analyzed for different rates of voltage change at a constant input flow rate, and in the case of DMFCs, the impact of anode concentration and cathode pressure flow rate on the dynamic response was investigated, highlighting clear dependencies of the response times on the operating conditions,. The normal operation of PEMFCs is strongly influenced by the operating temperature. The proton exchange membrane can be degraded by excessively high temperatures, while low temperatures can cause slower electrochemical reactions. Therefore, an efficient and adequate cooling system allows PEMFCs to achieve higher powers, reliable operation, and extended lifetimes, essential conditions for their integration into wind-powered systems, where loads and operating conditions can vary rapidly. Maintaining a uniform temperature inside the PEM stack is another crucial aspect of thermal management, as uneven temperature distributions can cause local degradation of system performance and stability. Also, both the humidity levels of the anode and cathode significantly influence the response time of the PEMFC. Optimal humidity levels, often around 50% at the anode and 70% at the cathode, can minimize the time required to reach steady state, favoring the fast dynamic response of the cell, required in wind energy integration scenarios. Low humidity can hinder water transport and slow down the response, while excessive humidity can lead to electrode flooding and a decrease in performance, both effects having direct implications for the speed and stability of the hydrogen-wind system.
The stoichiometric ratio, which is the ratio of the amount of reactant supplied to the theoretical amount required for the electrochemical reaction, plays an important role in the dynamic behavior of proton exchange membrane fuel cells (PEMFC). Adjusting the stoichiometry can influence the availability of reactants (hydrogen and oxygen) and the removal of reaction products, having a direct impact on the response time of the cell, especially in applications integrated with wind–hydrogen systems. For example, increasing the stoichiometric air flow rate can improve both steady-state and dynamic performance, ensuring sufficient oxygen supply and more efficient water management, essential conditions for rapid response to variable loads generated by wind power generation instabilities [5]. Operating pressure is another factor that affects the response time of PEMFC. Increasing pressure can improve reactant mass transfer and power density, contributing to better performance in both steady-state and transient conditions, which is advantageous in wind integration scenarios where power requirements can vary rapidly. Water transport within the cell is also crucial for performance and response time. Factors such as electro-osmotic resistance and back diffusion of water through the membrane, as well as the rate of water generation, supply, and removal, influence how quickly the cell reaches a new steady state after a load change. Poor water management can lead to membrane flooding or drying, which significantly slows down the dynamic response and affects the stability of the hydrogen-wind system. The magnitude and rate of load changes also influence the response time of the PEMFC [31]. In general, smaller and slower load changes lead to faster and more stable responses, while sudden and significant changes can generate overshoot and oscillations in voltage and current, similar to the behavior of intermittent renewable energy systems such as wind. Optimizing operating conditions temperature, humidity, stoichiometry and pressure, as well as ensuring efficient water management, are essential to achieve fast and stable response times, consistent with the resilience requirements of wind-powered energy systems. Many applications, including those integrated with wind farms, require backup power supplies capable of handling both long-term static loads and rapid power variations. Not every power system can satisfy both requirements, but proton exchange membrane fuel cells (PEMFCs) can be designed to support all types of load without additional current smoothing, due to their fast and efficient dynamic response. The novelty of this work consists of the use of an instrumental method for measuring the response time of a PEMFC fuel cell, based on the automatic acquisition and processing of electrical signals (voltage, current, time) on a digital oscilloscope. Through the function of storing and analyzing signals, the authors were able to perform a thorough analysis of the measured data, identifying intermittent events, oscillations or rare errors that would be difficult to observe in real time, as well as preparing the data for further processing (reports, comparisons, models). In this way, this work complements existing studies with relevant experimental values for the operational monitoring of fuel cells integrated into energy chains based on wind and green hydrogen [32,33].
The integration of green hydrogen produced from wind energy is a central pillar of this work, providing the essential operational context for evaluating the dynamic response of fuel cells. In a hybrid wind–hydrogen system, the inherent fluctuations of wind production are compensated by converting the surplus energy into hydrogen through electrolysis, which is stored and subsequently used as a clean energy vector. Proton exchange membrane fuel cells (PEMFC) play a critical role in this value chain, acting as a fast conversion interface that converts the stored hydrogen back into electricity to stabilize the grid during periods of calm weather or peak demand. Therefore, accurately characterizing the response time of PEMFC to sudden power demands is not just a theoretical exercise, but a prerequisite for the correct sizing of backup systems and for ensuring the resilience of grids powered predominantly by wind sources. This work experimentally demonstrates that the response speed of PEMFC technology (on the order of milliseconds) qualifies it as the ideal solution for managing the intermittency specific to wind farms, facilitating the transition to a decarbonized and stable energy mix [34,35,36,37,38].
2. Materials and Methods
In the context of the current energy transition, replacing conventional sources with renewable energy forms is a primary objective. However, due to the intermittent and unpredictable nature of unconventional sources, such as wind and solar energy, efficient storage of electrical energy becomes a critical component to ensure grid stability. Proton exchange membrane fuel cells (PEMFC) represent a viable solution to this challenge, but their optimal integration requires a precise characterization of the response dynamics to sudden load variations.
2.1. Dynamic Characterization Techniques
The response time of PEM fuel cells can be evaluated by several established experimental techniques: electrochemical impedance spectroscopy (EIS), chronoamperometry, and load-step transient measurements. Electrochemical impedance spectroscopy (EIS) analyzes the frequency response of the cell to an alternating voltage disturbance, generating an impedance spectrum that is interpreted by equivalent circuit models (ECM) to identify the internal processes that contribute to the overall response. This method requires a frequency response analyzer (FRA) and a specialized load bank. Chronoamperometry measures the current response over time to the application of a voltage step, being useful for studying electrochemical kinetics. Transient load step measurements involve rapidly changing the electrical load connected to the cell and observing the evolution of the voltage and current until the new steady state is reached. This technique most closely reflects the operating conditions in wind–hydrogen hybrid systems, where power fluctuations are severe and frequent. In this study, the load-step transient measurement method was chosen due to its direct relevance for load-following applications in renewable microgrids.
2.2. Experimental Setup and Testing Facility
We chose this step load regime because it represents the “worst-case scenario” for a fuel cell: the sudden transition from the quiescent state (no optimized active reactant flow) to significant consumption (approx. 22% of the nominal power of the 6.8 kW stack). It is important to note that, although the integration of green hydrogen and fuel cells into wind energy systems involves a complex technological cycle (wind generation, hydrogen production by electrolysis, its storage, electrochemical conversion and load response), the experimental setup in this study does not physically reproduce the entire chain. Instead, the architecture of the facility was deliberately designed to isolate and evaluate exclusively the conversion interface (PEMFC stack). This methodological decision is justified by the fact that, while the generation, electrolysis and storage processes have relatively slow system dynamics (on the order of minutes or hours), the electrochemical conversion represents the critical dynamic node. The fuel cell is the component that must ensure a practically instantaneous response to compensate for severe fluctuations or network faults. Therefore, our facility focuses on simulating the final and most transiently demanding stage of the wind–hydrogen system. A progressive increase in load would have masked the electrochemical inertia. By testing under this transient shock, we demonstrated the robustness of the gas diffusion layer and internal kinetics. The experiments were conducted on a stand-alone installation designed for continuous and unlimited operation, equipped with a proton exchange membrane fuel cell (PEMFC). The installation simulates an independent backup system, capable of compensating for the intermittency of wind production. The nominal operating parameters of the fuel cell stack were set at a voltage of approximately 46.8 V direct current (DC) and a current of 32 A DC. To ensure thermal stability in continuous operation, the installation was equipped with an industrial cooling system with a power of 10 kW, based on a water-to-air heat exchanger. The coolant temperature was maintained within the optimal range of 65–70 °C, and the cooling fan has a maximum power of 155 W. To guarantee complete system autonomy (portability), all auxiliary equipment requiring single-phase alternating current (230 V/50 Hz) is powered by a dedicated inverter, which converts energy directly from the fuel cell (output voltage 48 V DC).
2.3. Data Acquisition and Signal Processing
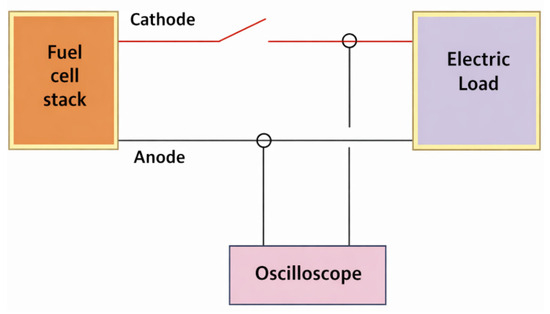
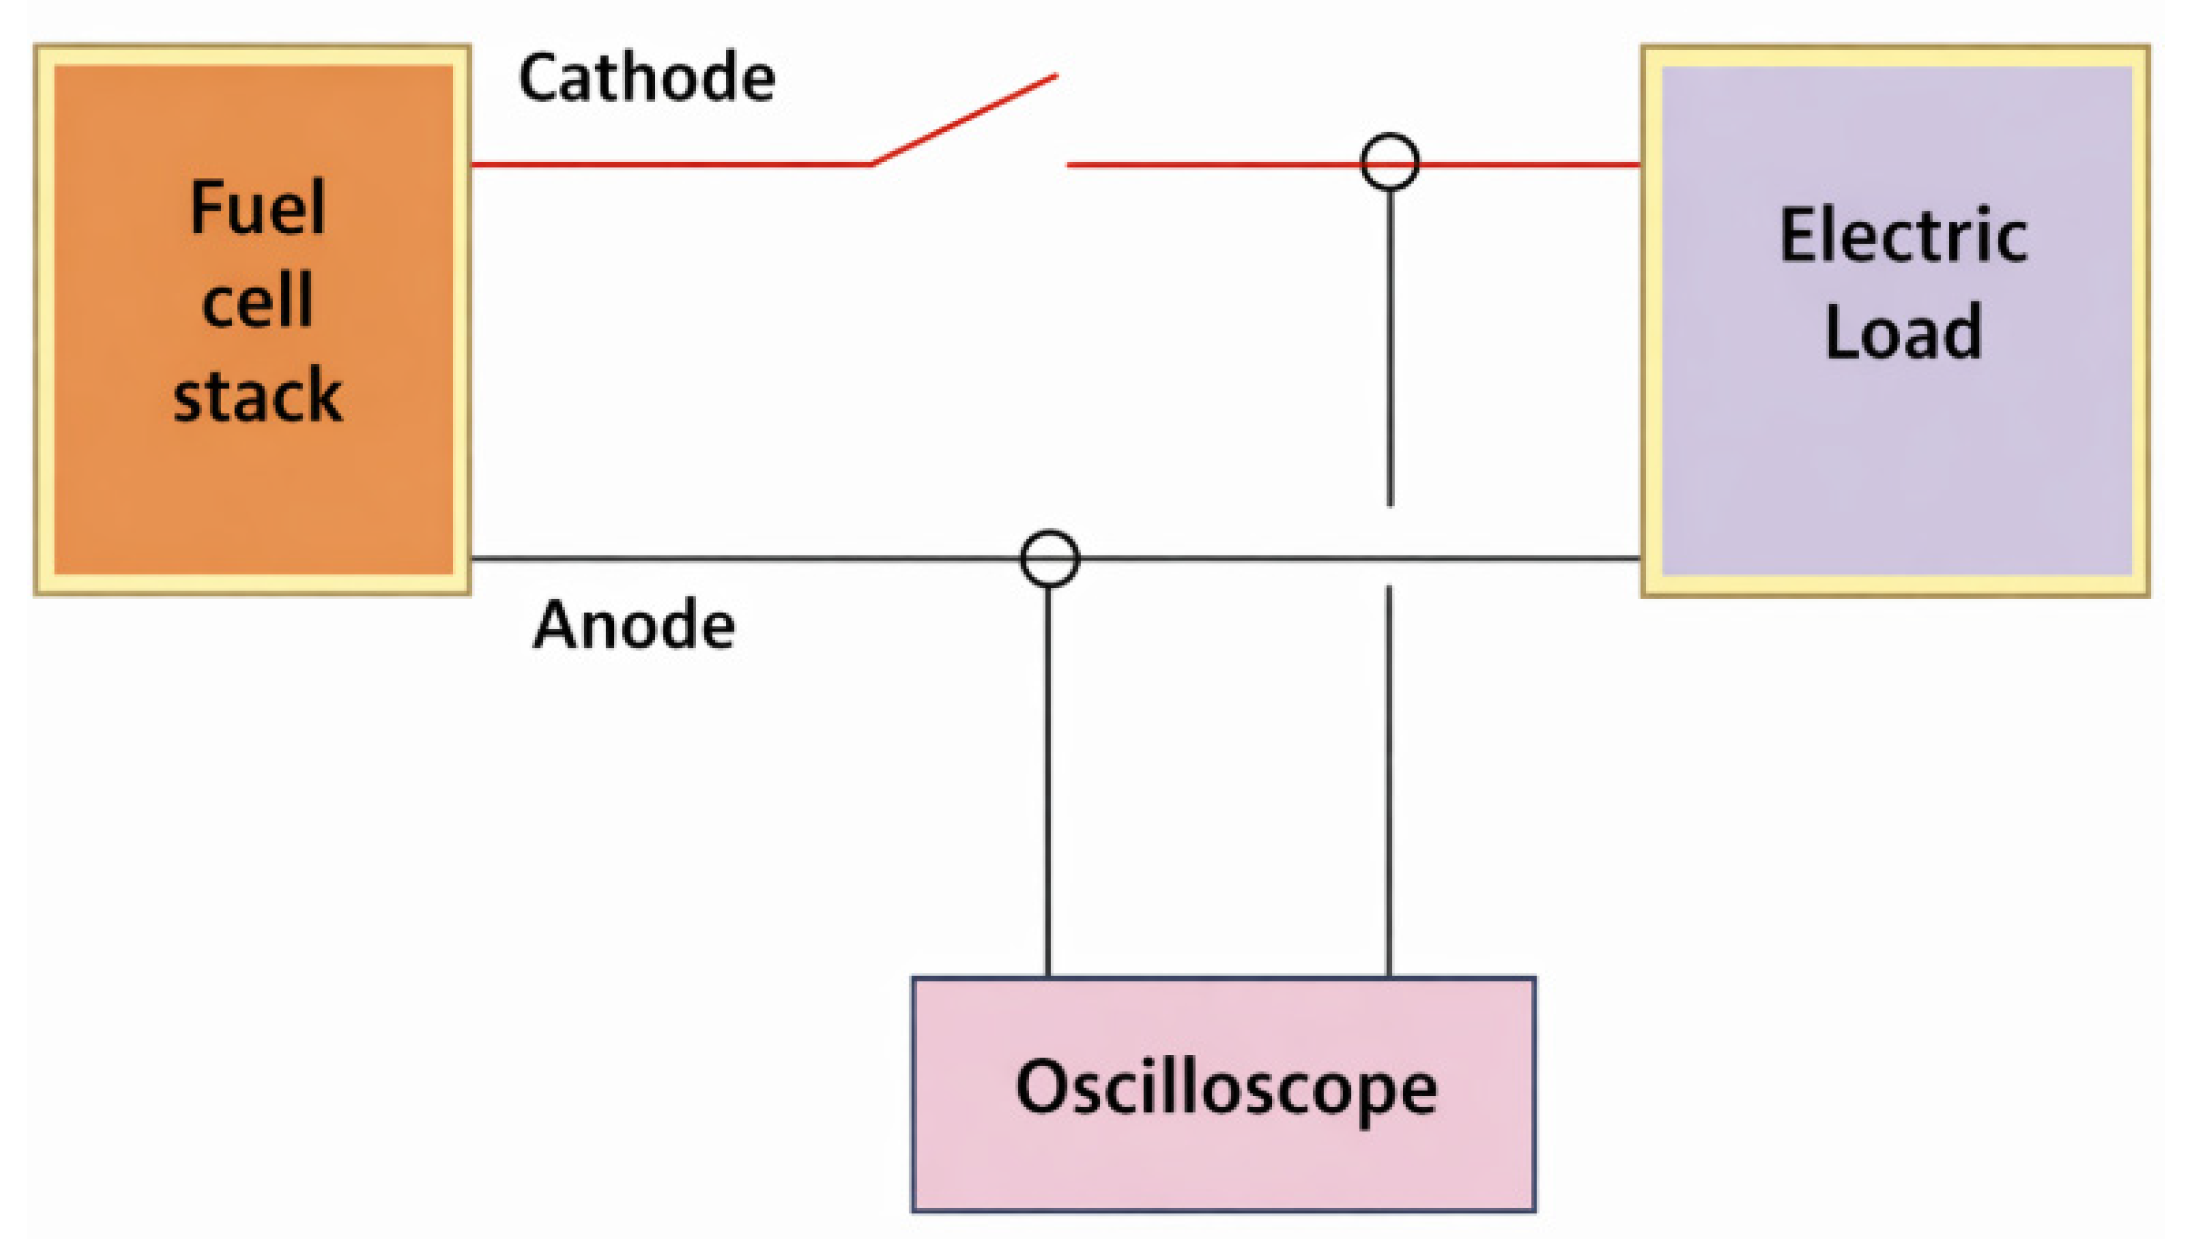
The applied experimental method is based on the use of a high-performance, two-channel analog oscilloscope, capable of simultaneously measuring the voltage and current of the fuel cell with high precision Figure 1. Data acquisition was performed with a sampling frequency of 20,000 measurements per second, ensuring a fine temporal resolution necessary to capture fast transient phenomena. The oscilloscope generates data files in .csv format, which contain large volumes of information. The methodological novelty of this study consists of the development of specific procedures for the automatic isolation of areas of interest from these massive files, namely the intervals in which sudden voltage and current jumps occur. This approach allowed overcoming the major difficulty represented by the manual processing of an extremely large number of data points, facilitating a detailed graphical and mathematical analysis of the variation in electrical quantities in the transient regime. Through this technique, the load connection time, current variation and voltage evolution as a function of time were accurately determined. The data obtained were subsequently compared with the performance of an internal combustion engine based on the Carnot cycle, to highlight the dynamic superiority of fuel cells in applications requiring minimal response time. In addition, to visualize in real time the battery response speed to a sudden power demand, additional measurements were performed using an uninterruptible power supply (UPS) with a sampling rate of 100 MS/s, a logic analyzer and a variable voltage source, connected by measurement cables and coaxial adapters. This redundant configuration validated the accuracy of the main data and allowed the identification of possible measurement errors.
Figure 1.
Test Diagram.
2.4. Data Analysis
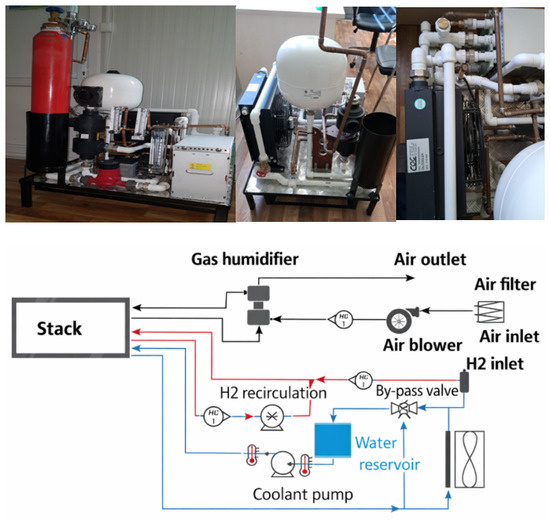
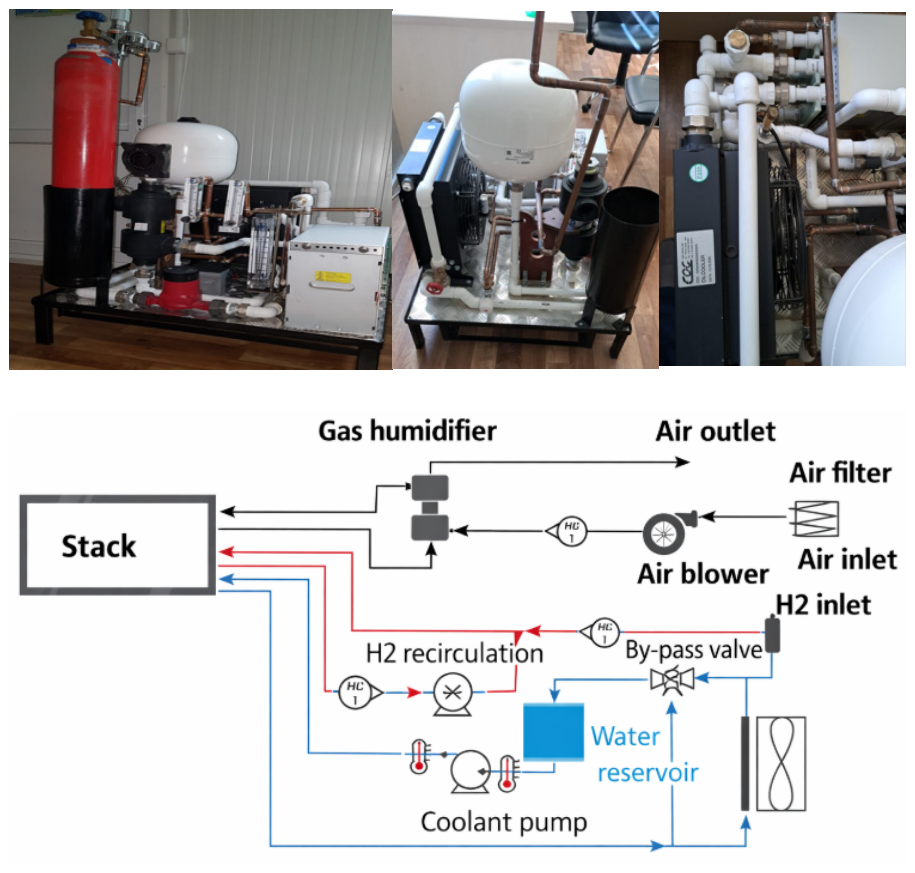
The experimental setup used in this study was designed modularly, comprising two main interdependent subsystems: the electrical power and measurement section, and the hydro pneumatic reactant management section. This architecture ensures precise control of operating parameters and high-fidelity data acquisition, critical for the dynamic characterization of the fuel cell in transient regimes. The test facility is modularly structured into two main subsystems Figure 2: the electrical and hydro pneumatic sections. The electrical section ensures energy conversion and high-precision data acquisition. It includes the fuel cell (FC) stack, a pure sine wave inverter for powering the auxiliaries, and a tantalum-wound resistive load bank, directly connected to the DC output for load step simulation. Dynamic measurements were performed with an analog/digital oscilloscope, complemented by a multimeter and a clamp meter for voltage divider calibration, ensuring a measurement error below 0.5%. The hydro pneumatic section manages the reactant flows to optimize the electrochemical reaction. The hydrogen circuit includes a recirculation pump that ensures autonomous humidification of the gas at the anode inlet, preventing membrane desiccation, and rotameters for flow monitoring. The air circuit integrates the circulation pump, the impurity filtration system, the expansion vessel for flow lamination and sensors for temperature and air flow, allowing precise control of the stoichiometric ratio and thermal management.
Figure 2.
The experimental installation and basic diagram of the installation.
2.5. Technical Specifications of the Installation
Table 1 summarizes the test operating conditions and the main technical parameters of the experimental facility. These values define the operating regime in which the dynamic response of the fuel cell was characterized, ensuring controlled and reproducible conditions for the analysis of the system performance in the context of integration with wind energy sources. The lowest value is given for a 2 kW stack, and the highest value is given for a 10 kW stack. The values approximately scale linearly with the number of cells, in the present case, 48.
Table 1.
Technical specifications and operating parameters.
3. Results
3.1. Monitoring Proton Exchange Membrane Fuel Cell (PEMFC) Parameters in Steady-State Mode
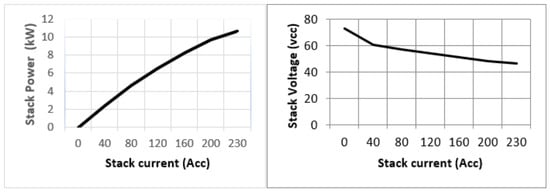
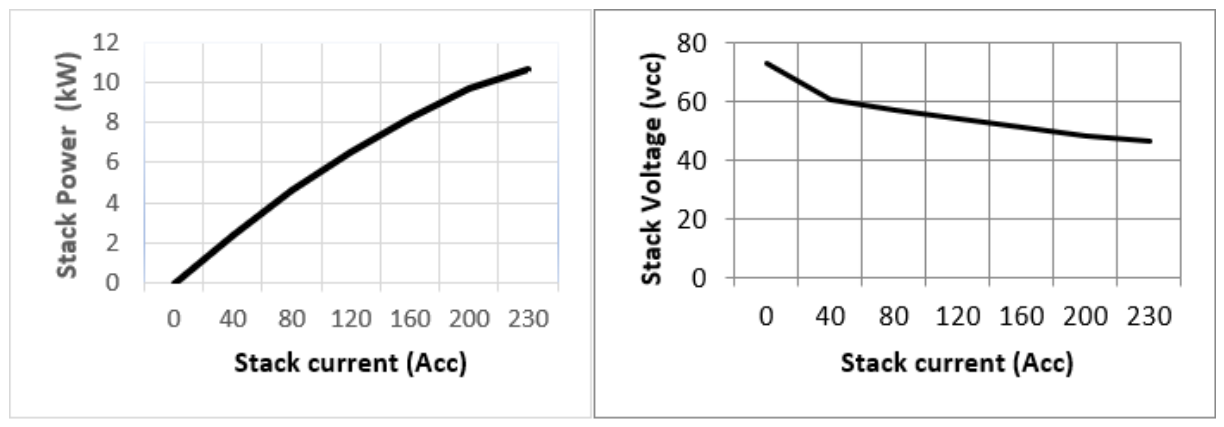
The electrical performance of a fuel cell (FC) can be classified according to its operating mode. In this regard, some authors have proposed stationary models that can be used to analyze the operation of the fuel cell at a fixed operating point or with slow dynamics [39,40], while other researchers have developed dynamic models oriented to the analysis of the cell behavior in transient regime. The relevant electrical parameters were determined based on the initial performance data of the stack, recorded under standard conditions. Thus, the stack temperature was maintained at 62 °C, at atmospheric pressure, with a hydrogen stoichiometry of 1.25, a minimum hydrogen flow ΦH2 rate of 36 NL/min and a relative humidity of 75%; for air Φair, the stoichiometry was 2.0, with a minimum flow rate of 67 NL/min and the same relative humidity of 75%. Under these conditions, the stack voltage decreases as the absorbed current increases, as illustrated in the graph in Figure 3.
Figure 3.
Life stack performance, the variation in stack voltage and stack power depending on the stack current.
Direct current (DC) is drawn from the fuel cell stack to power external devices and must contain a minimum level of noise, as excessive noise can reduce the life of the stack; for safe operation, the ripple noise must be less than 3% for common mode and less than 2% for differential mode, relative to the DC voltage. Individual cell voltage monitoring (CVM) is essential to ensure optimal performance, life and safety of the system. If the voltage of an individual cell is significantly lower than the average of the other cell voltages, it is likely that the fuel and/or air supply is deficient, with differences between cells indicating the robustness of the operating conditions and system design. Typically, the voltage of a cell under normal operating conditions is between 0.5 and 0.8 V, and the variation between cells does not typically exceed 10%. If the voltage of a cell drops below 0.3 V, the current load must be disconnected immediately to avoid irrevocable damage to the stack and possible dangerous situations.
3.1.1. Hydrogen Consumption
The anode represents the part of the fuel cell where the fuel is consumed to generate electrical energy. In this case, the fuel consumed is hydrogen, which must be delivered in a pure and humidified state, of appropriate quality (according to the values in Table 1). The amount of hydrogen consumed (ΦH2consumed) by the stack is determined by the power generated, more precisely by the electric current produced by it, according to Faraday’s law. For the stack model considered in this paper, the general equation was approximated by relation (1), presented below.
where
- n—the number of cells,
- I—the current drawn [A],
- ΦH2consumed—the amount of hydrogen [NL.min−1 A−1] (at 0 °C and 101.3 kPa).
In the present case, the stack with n = 48 operating at I = 230 A consumes 76.89 L/min (~77 NL/min) of hydrogen at 0 °C and 101.3 kPa.
3.1.2. Hydrogen Stack Inlet Flow Rate and Pressure Drop
The stack requires a minimum hydrogen flow for normal operation. The exact amount varies with stack power rating and the number of cells (Table 1). The minimum hydrogen flow at the stack inlet is provided by the following Equations (2) and (3):
where ΦH2 inlet [NL min−1].
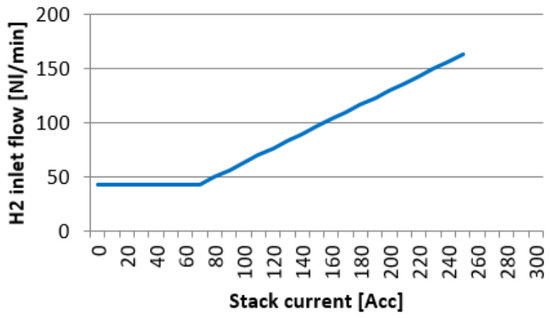
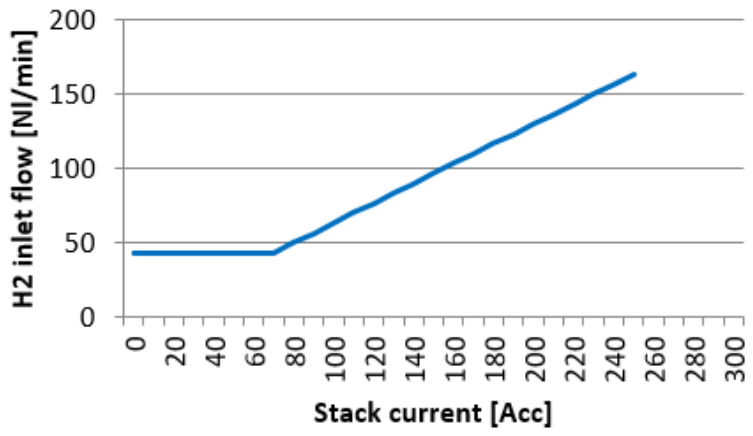
The stack typically operates at a stoichiometry of 1.25 and higher; in comparison, a minimum flow must be maintained at a lower current. The minimum inlet flow for our fuel cell (FC) is illustrated in Figure 4.
Figure 4.
The variation in minimum inlet flow as a function of stack current.
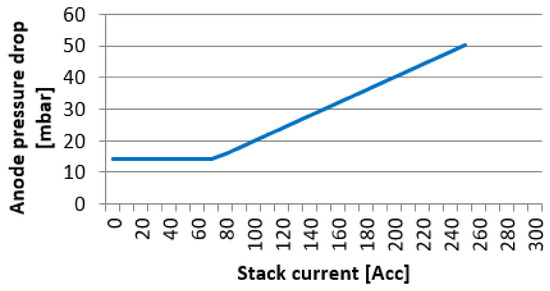
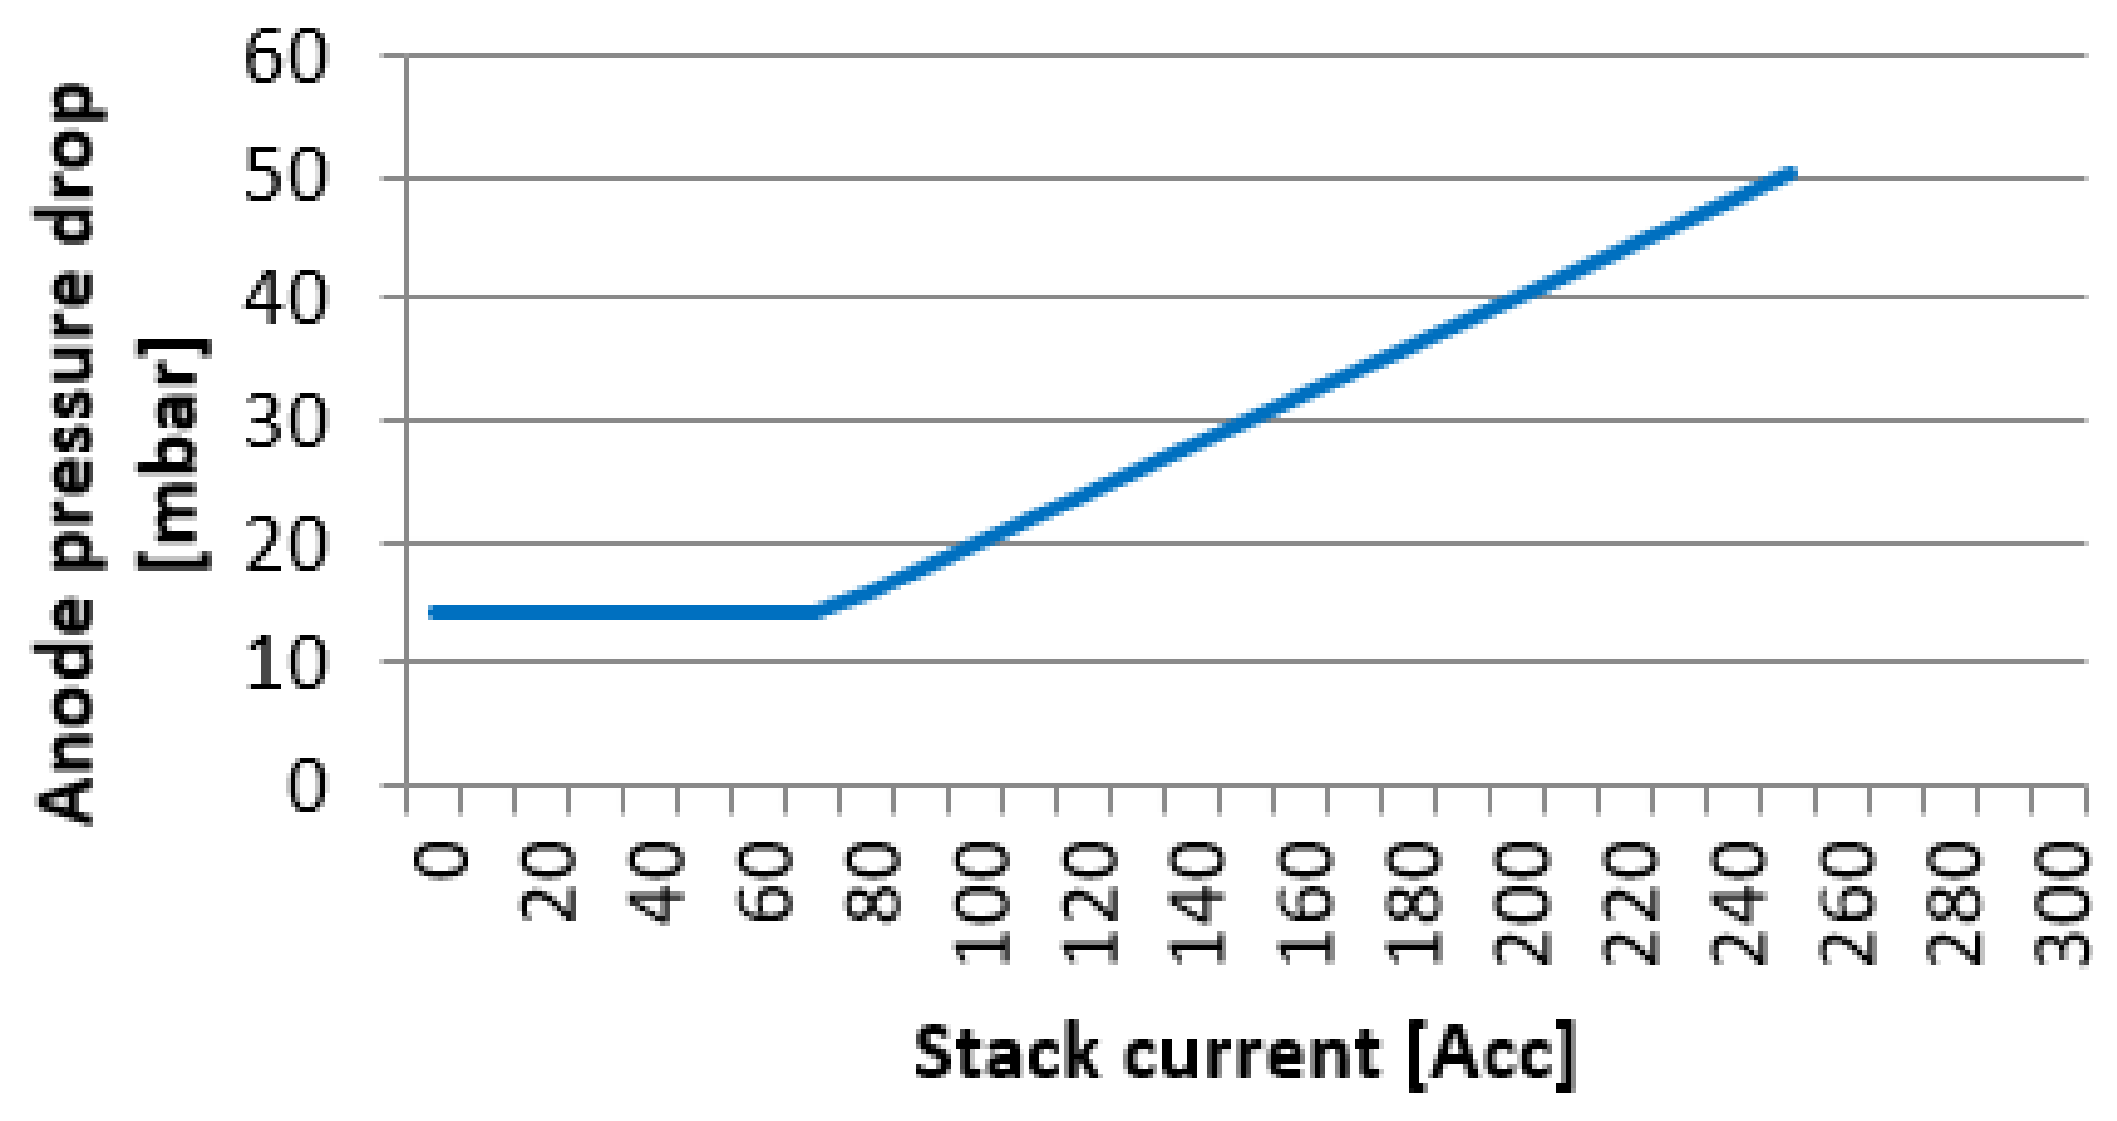
As illustrated in Figure 5, the pressure drop at the anode increases directly proportional to the stack current. This dynamics reflects the increase in the input hydrogen flow rate, which is automatically adjusted according to the generated current (according to Faraday’s law), demonstrating adequate gas permeability through the bipolar plate channels at varying loads.
Figure 5.
The anode pressure drop for the stack.
3.1.3. Hydrogen Recirculation
Since the stack is operating at a hydrogen stoichiometry above 1.25, part of the hydrogen leaves the stack without being utilized. This unutilized hydrogen from the stack outlet can be returned to the stack inlet via a blower and forms a recirculation circuit. The minimum recirculation flow for our stack is provided by Equation (4):
where .
3.1.4. Hydrogen Respiration
Even with the utmost care, the fuel cell stack as an assembled device will always release some small amounts of hydrogen. All stacks are assessed based on the amount of release, and the quality check threshold is given by the following Equation (5):
Our model of a fuel cell (FC) will respire less than 45 mL/min of hydrogen. Given the fact that the stack will release some hydrogen, the system should be designed in such a way that the small amount of hydrogen released will not cause potential danger
3.1.5. Cathode
The cathode is the part of the fuel cell in which air is supplied and water is produced. Air should be free of contaminants and should be humidified before entering the stack.
3.2. Air Quality
Oxygen in the air is used to convert hydrogen into electricity. Air fed to the fuel cell should be filtered from particles and harmful contaminants. Small traces of sulfur (S) compounds can reduce stack lifetime and must be removed. The maximum allowable concentration after filtering is detailed in Table 2.
Table 2.
Air specifications.
3.3. Oxygen Consumption and Stack Inlet Airflow Rate
The amount of oxygen from air consumed by the stack is determined by the stack’s power output and, more specifically, by the current the stack produces. The exact relation is provided by Faraday’s law. For our stack model, the relation is approximated using Equation (6):
Our stack model with n = 48 operating at I = 230 A consumes 38.45 L/min at 0 °C and 101.3 kPa. The stack requires a minimum air flow for normal operation. The exact amount varies with stack power rating and the number of cells. The minimum air flow at the stack inlet is provided by Equation (7):
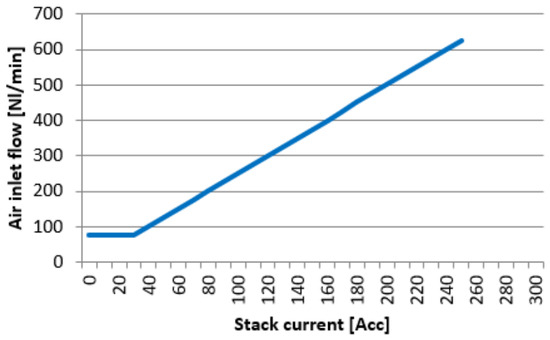
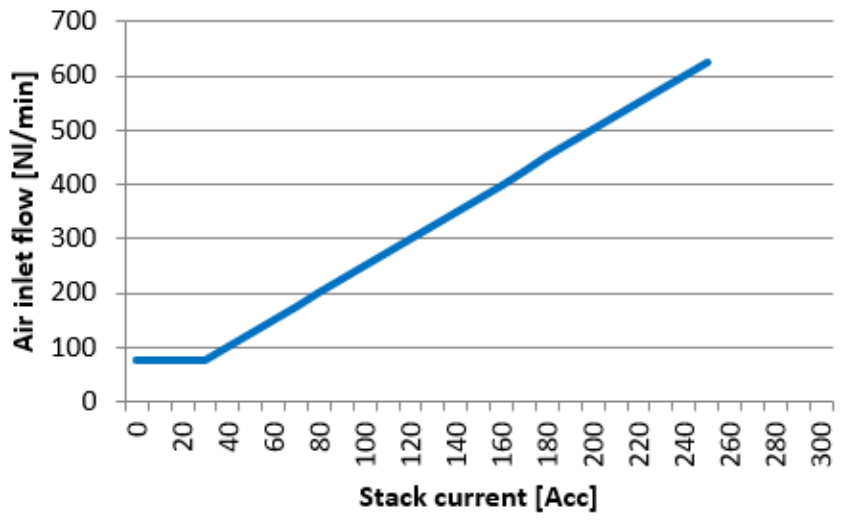
In this paper is a stack model with n = 48 operating at I = 230 A consumes 366 L/min air at 0 °C and 101.3 kPa. The minimum inlet airflow is detailed in Figure 6.
Figure 6.
The minimum airflow at the stack inlet as a function of stack current.
3.4. Cathode Pressure Drop
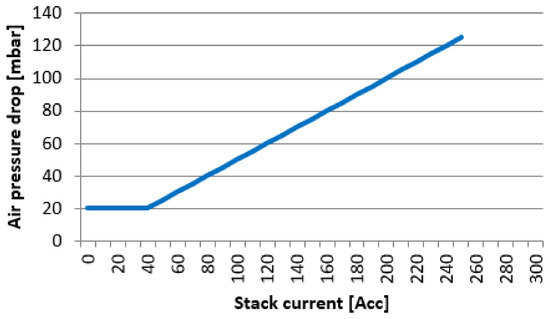
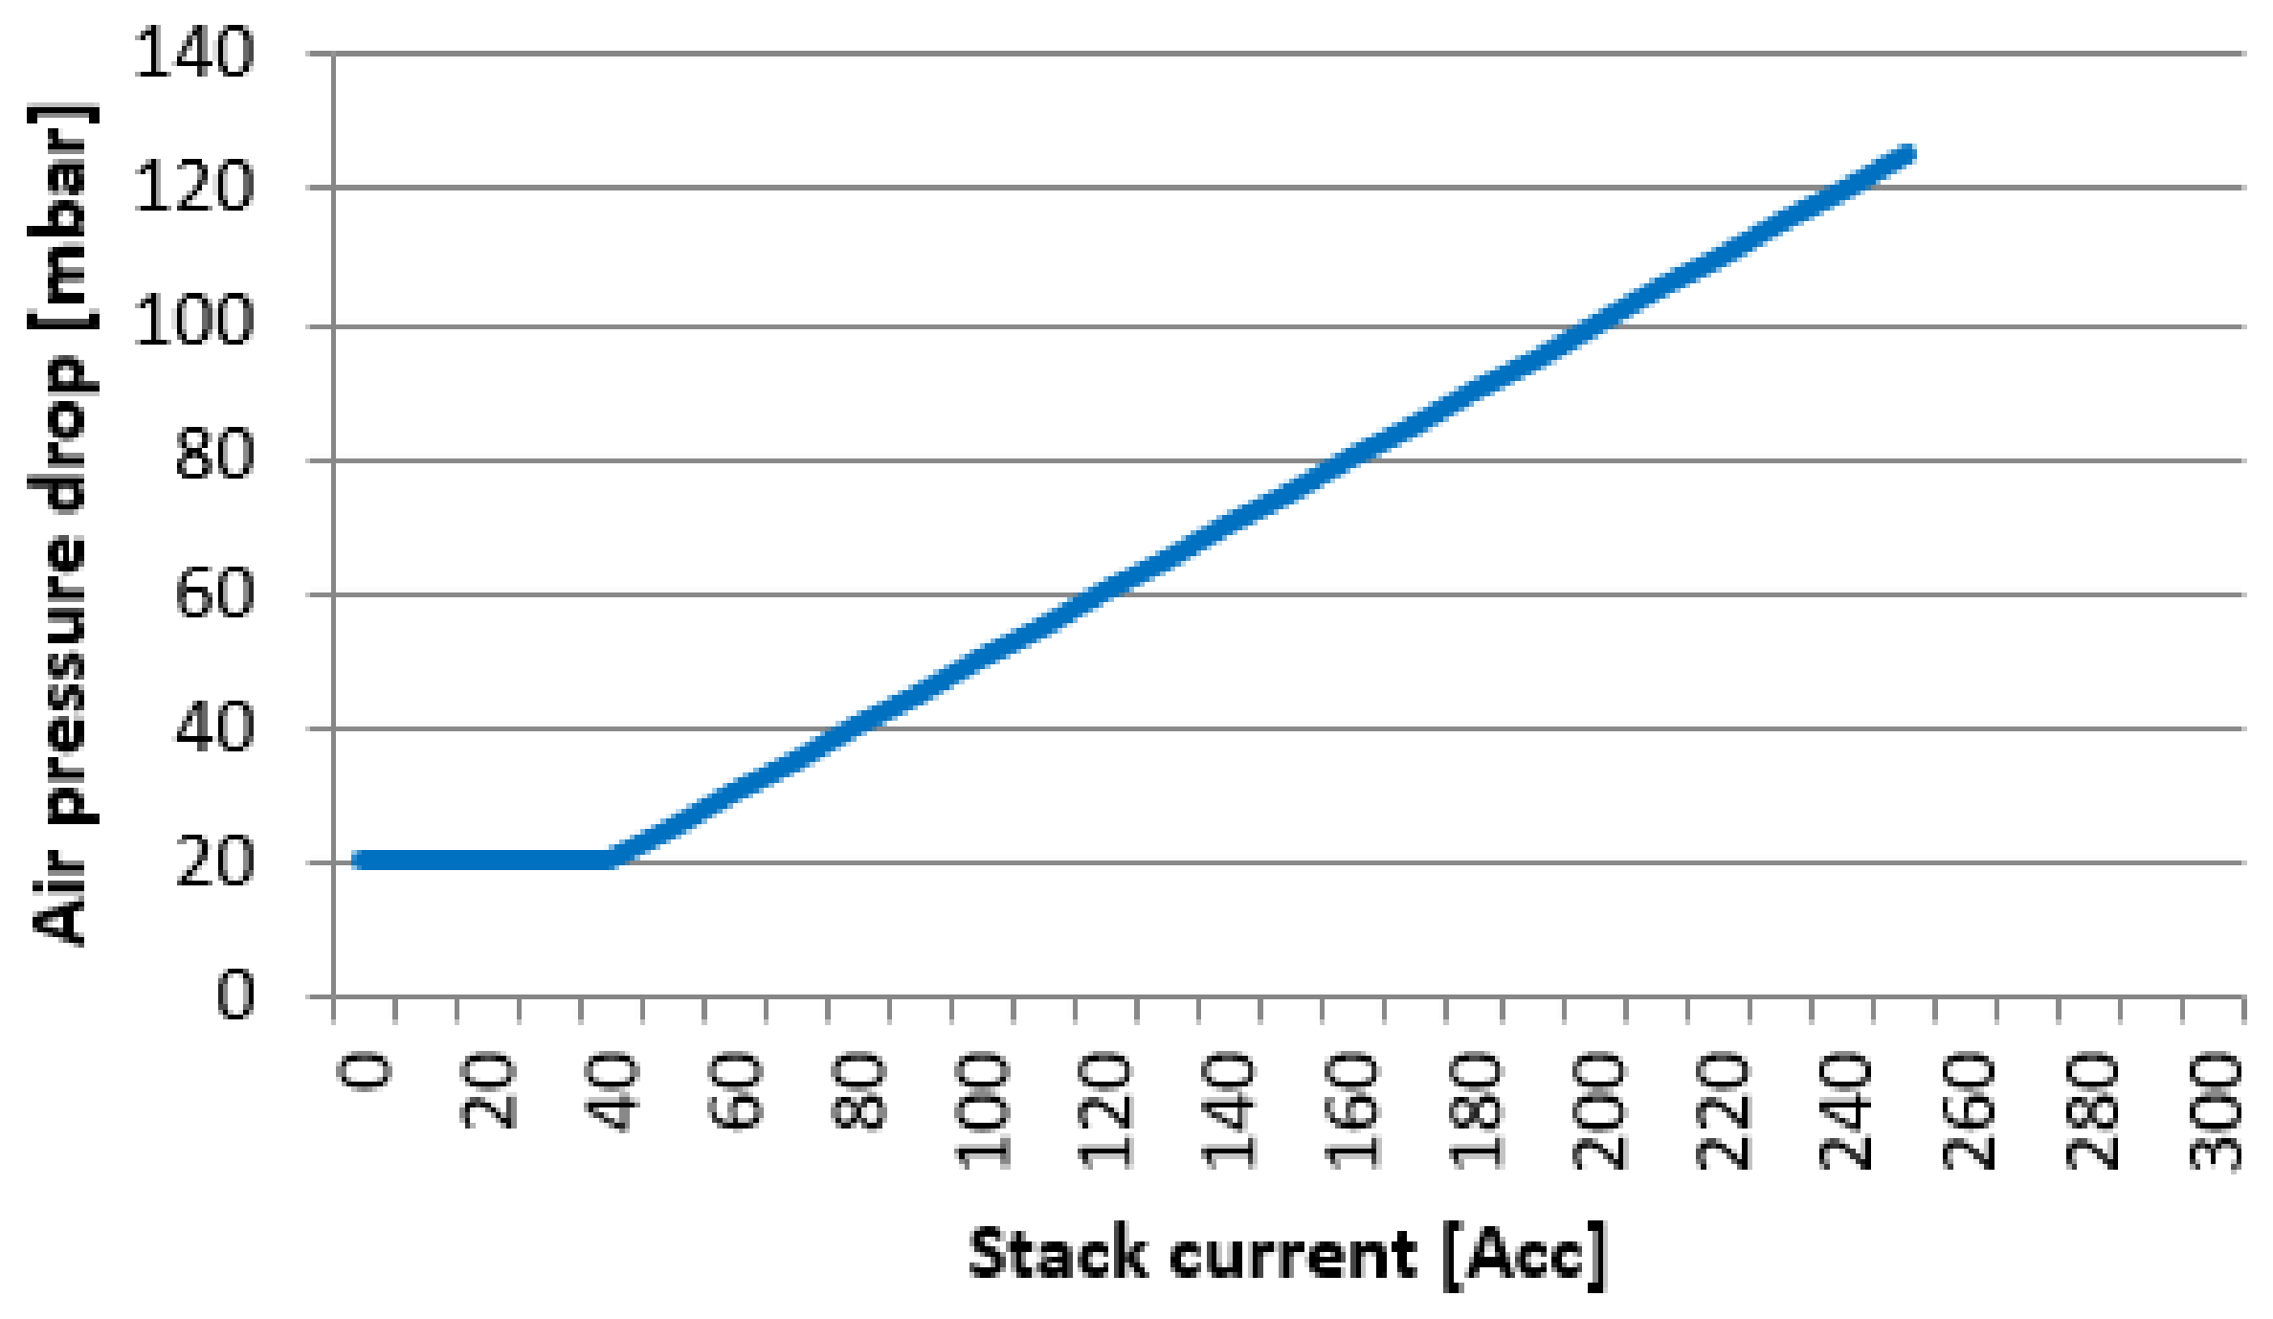
The stack pressure drop for the cathode increases linearly with the inlet gas flow Figure 7.
Figure 7.
The pressure drop under normal operating conditions.
3.5. Process Water
The fuel cell produces water, which is released at the cathode outlet together with the depleted air. The process water is released both as a vapor and as a liquid. The total amount of water produced by the stack is provided by the following Equation (9). Our model stack with n = 48 operating at I = 230 A produces 3.7 kg/h (or l/h).
3.6. Stack Cooling and Temperature Control
The stack produces heat during operation, and the stack is cooled using a coolant. Two types of coolant can be used, and the operating temperature and temperature difference should be controlled.
3.6.1. Coolant Type and Quality
Process heat from the stack is removed using a coolant. The coolant for the stack can either comprise demineralized water or ethylene glycol-based. In both scenarios, the electrical conductivity of the coolant should not exceed 10 μS/cm.
3.6.2. Coolant Circuit and Pipe Length
The coolant is in direct contact with the power-generating cells inside the stack. Therefore, the coolant may affect the stack’s electrical insulation in a system. Leak current is a function of the floating potential, coolant pipe diameter, pipe length from the stack to the heat-exchanger, and the coolant conductivity. By applying a sufficient pipe length between the stack and the heat exchanger, electric insulation is achieved.
3.6.3. Stack Cooling Requirement
The amount of heat generated by the stack depends on the stack size and the stack current and voltage. The minimum amount of heat that must be processed by the cooling circuit is provided by the following Equation (10). Our model stack with n = 48 operating at I = 230 A with Vstack = 40.8 V generates at least 4.19 kW of heat.
3.7. Stack Operating Temperature
The PEM fuel cell stack provides the best performance when operating at 65 °C. This temperature should be maintained through adequate temperature control. In addition, the temperature difference between the coolant inlet and outlet should be kept within 5 °C during steady-state operation, and the stack temperature should not exceed 70 °C during transients.
Stack Temperature Control
One way in which to keep the stack within the preferred operating window is to control the amount of cooling by maintaining the stack coolant water inlet temperature at 60 °C and simultaneously controlling the coolant flow through the stack by monitoring the coolant outlet temperature. The difference between the inlet and outlet temperature is then maintained at around 5 °C, under typical operating conditions, enabling a maximum control overshoot of 10 °C. The required coolant flow is provided by the following Equation (11). For our model stack that generates 4.19 kW of process heat, cooled with water (cp = 4.183 kJ /kg °C), with a temperature difference of 5 °C, 0.20 kg/s of water flow is required.
3.8. Monitoring Proton Exchange Membrane Fuel Cell (PEMFC) Parameters in Dynamic State Mode
Safe fuel cell (FC) operational conditions are illustrated in Table 3.
Table 3.
Safe operational conditions.
In a proton exchange membrane fuel cell (PEMFC), an electrochemical reaction occurs in which hydrogen and oxygen are combined to produce water. By applying the thermodynamic laws to this reaction, and based on the Nernst equation, the reversible voltage of a cell can be determined (Vrev).
where:
- T is the cell operating temperature [°C];
- pH2 and pO2 are the hydrogen and oxygen pressures [bar].
Considering the fact that the PEMFC stack comprises n series-connected cells, the PEMFC reversible voltage (Vrev,s) was determined using the following Equation (13):
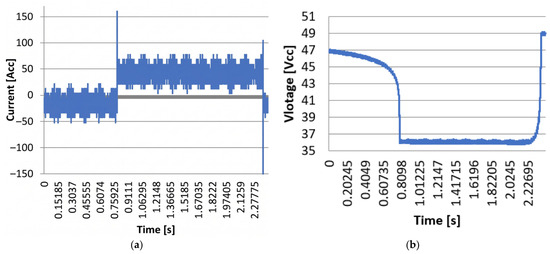
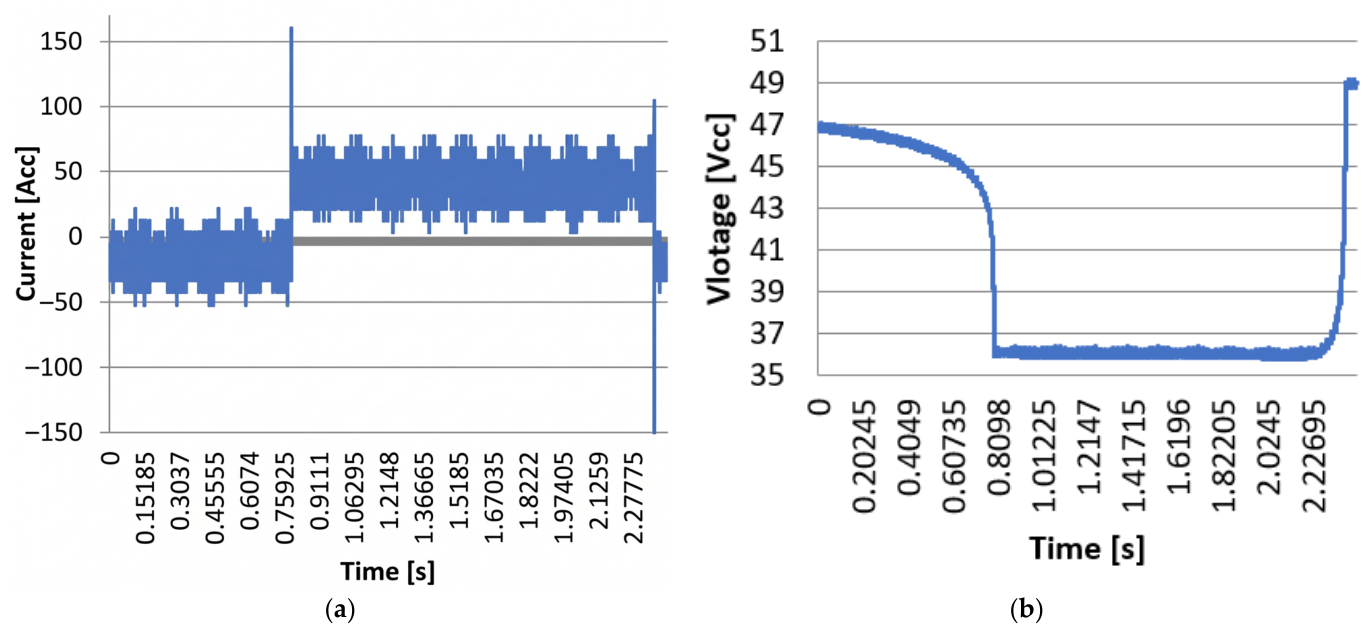
To estimate the response time of the cell to a sudden power request, a coiled resistance of 1500 W was instantly connected to the output of the fuel cell. The voltage at the terminals was approx. 46.8 V direct current (DC) and a 32 A direct current (DC). The measurements were taken at a rate of 20,000 measurements/s. The time in which the power of 1500 W was requested (load coupling time) was 1.57 s. The stack current variation (Figure 8a) and the stack voltage variation were imported into MS Excel. In total, 48,586 measurements were taken, with a total time of 2.42925 s, and the graphic representation is presented in the figure below (Figure 8b).
Figure 8.
(a) The stack current variation; (b) The stack voltage variation.
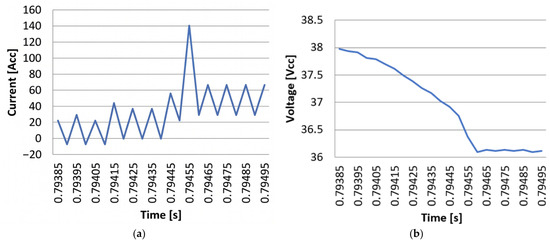
The 1500 W load was connected at +0.5547 s and a stack current variation graph was produced for 23 intervals of 50 µs (1.15 ms) (Figure 9a). The stack voltage variation graph in the same interval is shown below (Figure 9b).
Figure 9.
(a) The stack current variation at the charging point; (b) The stack voltage variation at the charging point.
Following our analysis, we found that the recovery time for the current was 0.2 ms (Figure 9a). The stack voltage stabilization point, the time t = 0.79465 s, is identical to the point at which the stabilization of the stack current variation is completed. A sudden voltage drop is observed when the load is connected, with the voltage stabilization time being 0.3 ms.
3.9. Comparison with the Response Time of an Internal Combustion Engine Generator
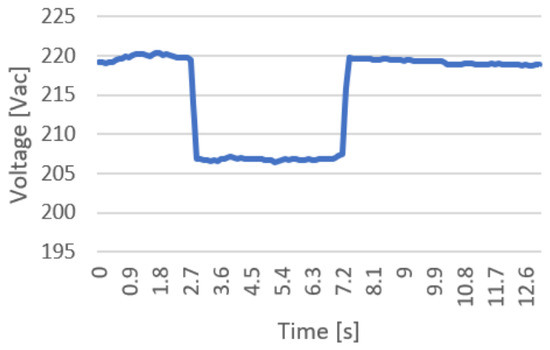
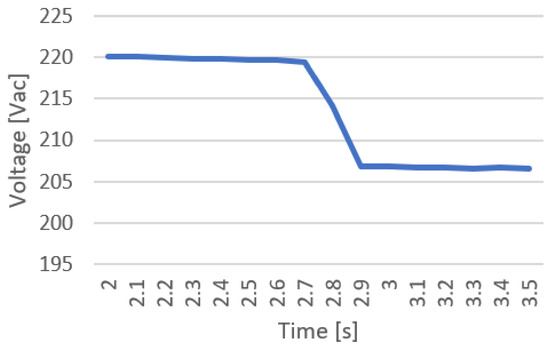
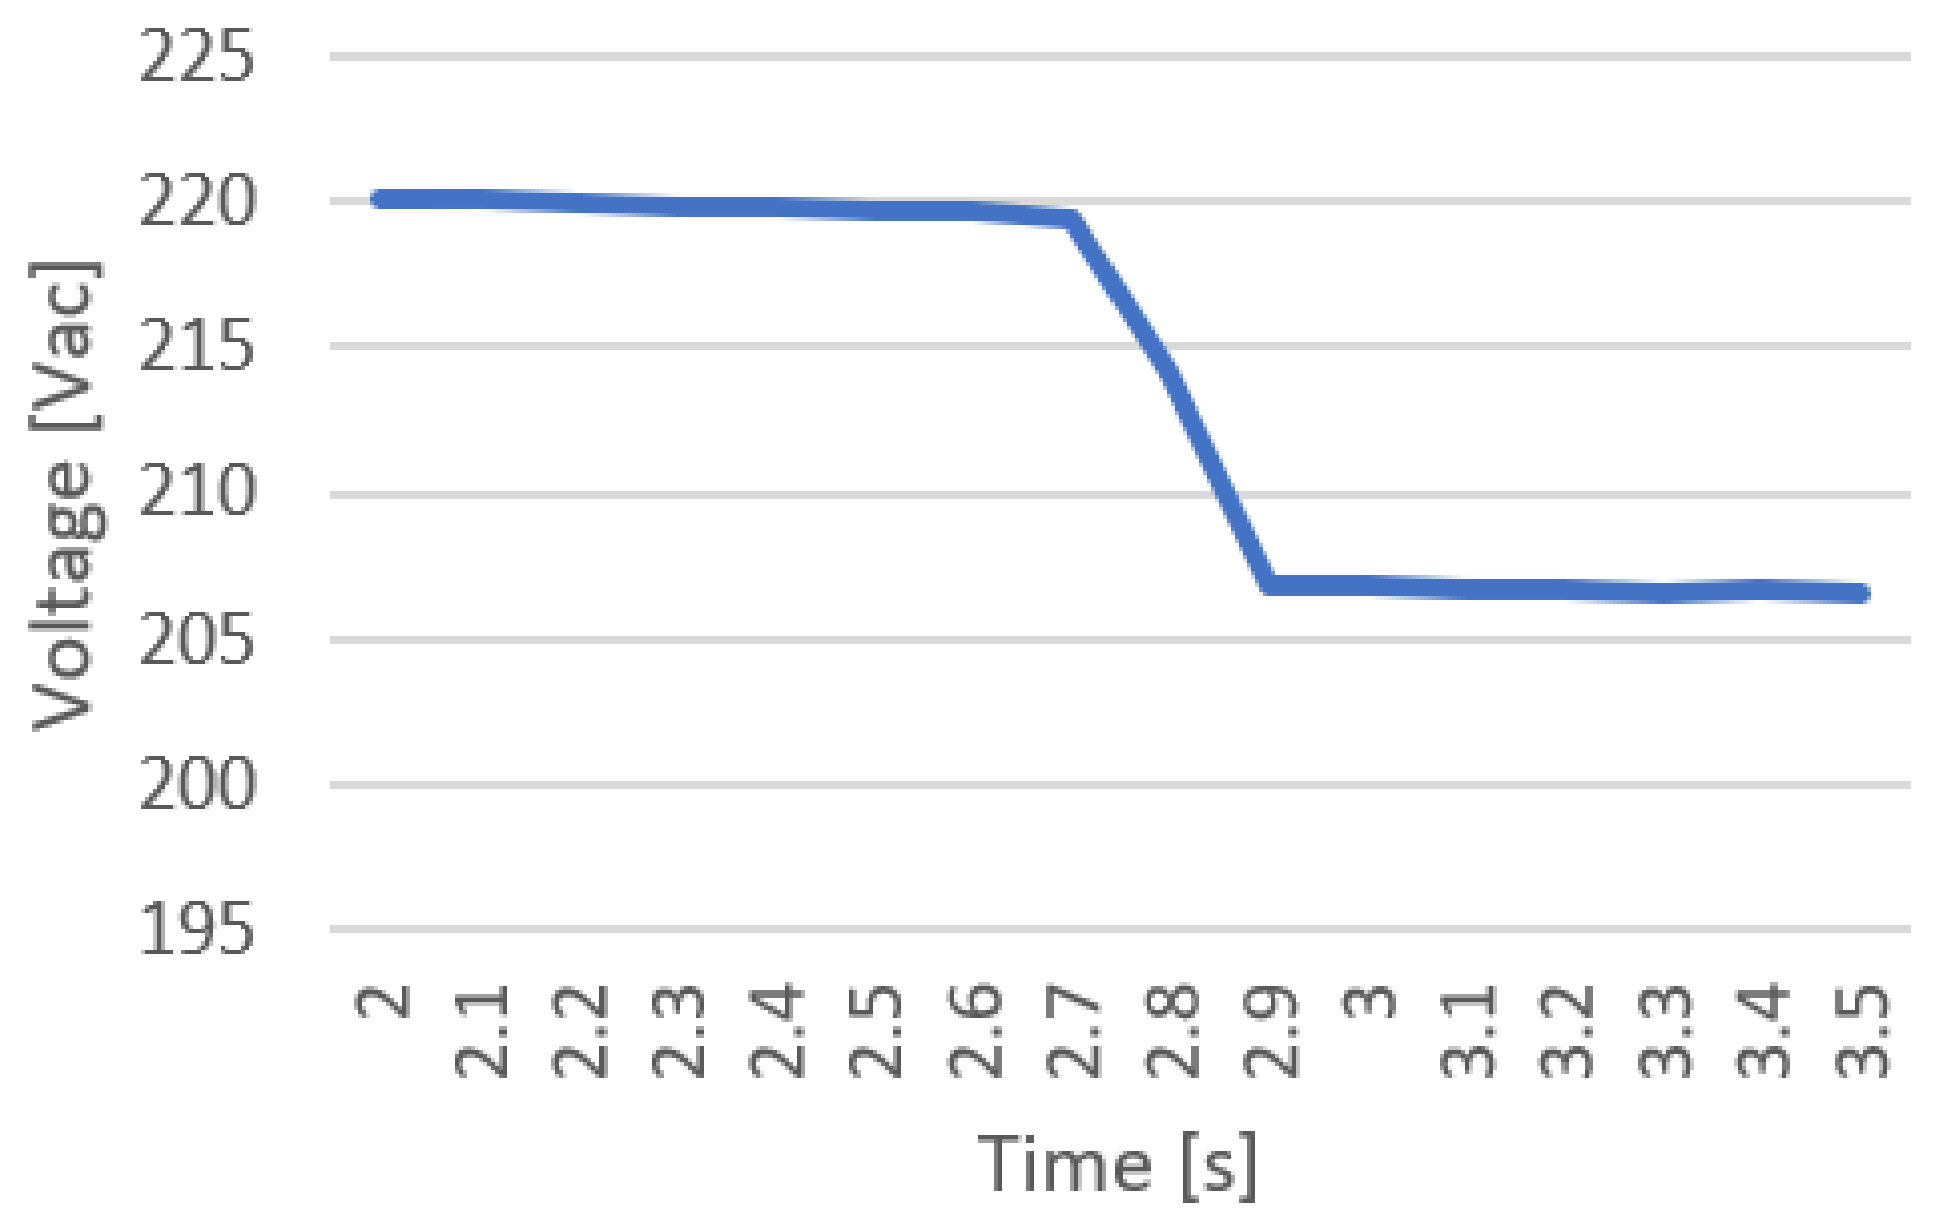
To highlight the dynamic superiority of proton exchange membrane fuel cells (PEMFC) in wind-hydrogen hybrid systems, their performance was compared to that of a classic internal combustion engine generator based on the Carnot cycle. Traditional internal combustion generators require a start-up and stabilization time of the order of seconds, due to the thermal and mechanical inertia involved in reaching the optimal operating regime. In contrast, PEMFCs powered by green hydrogen produced from wind energy demonstrate response times of the order of milliseconds, providing an instantaneous load-following capability essential for quickly compensating for fluctuations inherent in wind production. This experimental comparison highlights the critical role of PEMFC as a resilient backup system in sustainable energy architectures, where fast response requirements are imperative to maintain grid stability. To compare the response time of the fuel cell (FC) with a traditional energy source, identical measurements were performed on a thermal generator equipped with a Honda GX160 (Honda Motor Co., Ltd., Tokyo, Japan) four-stroke single-cylinder gasoline engine, characterized by: displacement of 163 cm3, net power of 2.5 kW at 3000 rpm and step load capacity of 835 W (33.4% of the rated power). The current variation was determined by measuring the voltage drop across a 50 mV/100 A shunt, and the voltage variation was corrected with a diode bridge and a resistive divider. The calibration of the instruments was performed using a Fluke 287 multimeter for voltage and a Fluke 393 FC clamp meter for current. The dual-channel oscilloscope generated a .csv file that was subsequently processed to determine the response time. The test profile lasted approximately 13 s: 2 s at no load, 5 s at 835 W load, followed by 6 s at no load. Voltage variation is presented in (Figure 10). The time for voltage stabilization ranged from 2.7 s to 2.9 s, roughly around 0.2 s (Figure 11).
Figure 10.
Voltage variation for the entire experimental period.
Figure 11.
Voltage variation in the stabilization time.
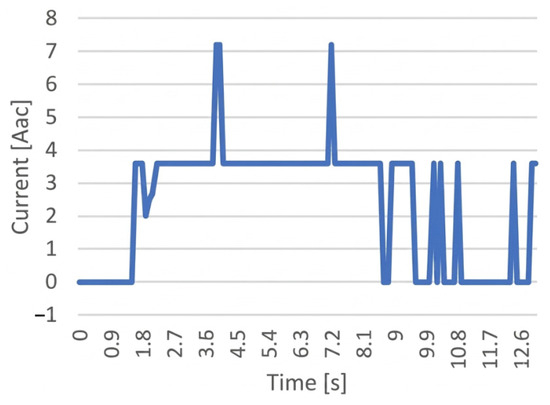
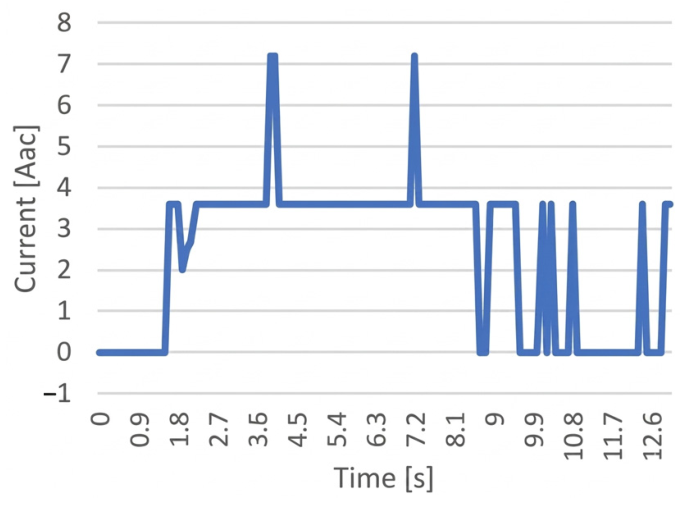
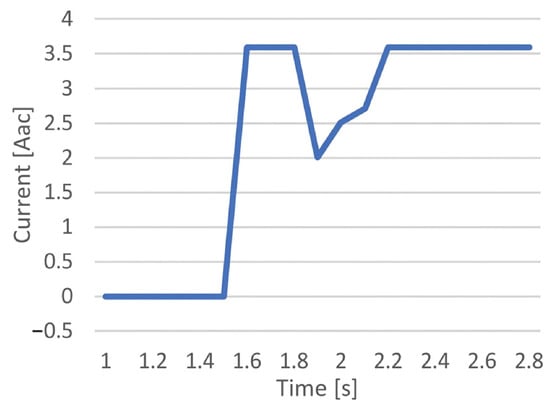
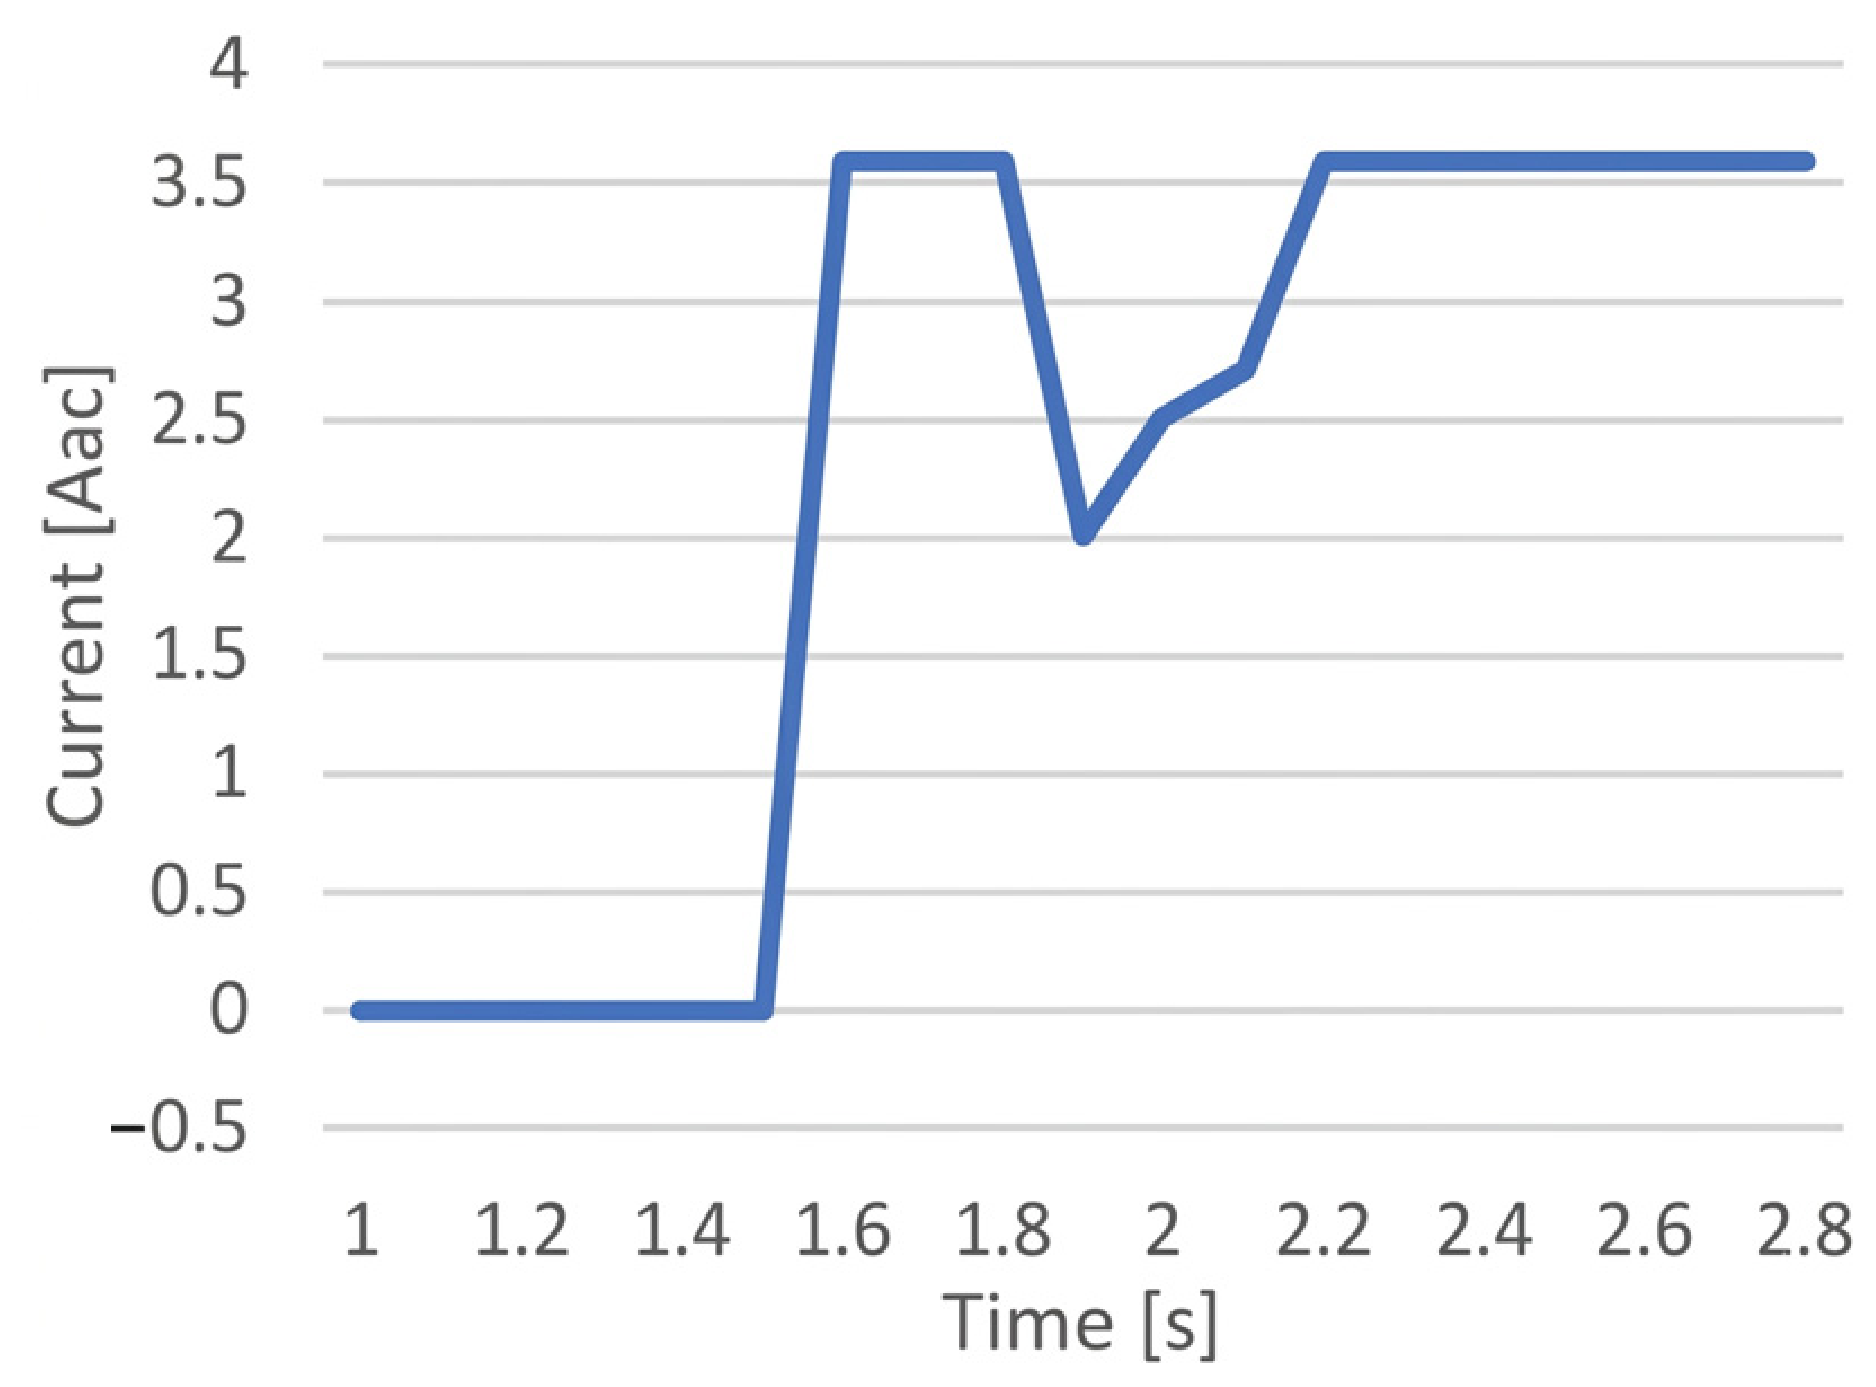
The current variation is presented in (Figure 12). Current stabilization ranged from t = 1.5 s to t = 2.2 s; the stabilization time was thus 0.7 s (Figure 13).
Figure 12.
Current variation during the test time.
Figure 13.
Current variation in the stabilization time.
The current increase was observed prior to voltage decrease with a 1 s delay, possibly due to flywheel inertia (voltage is driven by rotation). Environmental factors (temperature and humidity) do not affect response time. Because the test was performed at approx. 20% of the power of the fuel cell (FC) and in a relatively short time, no temperature increases were observed to favor mass transport mechanisms. The present work aims to determine the response time of a proton exchange membrane fuel cell (PEMFC) powered by green hydrogen, when applying a gradual load, in order to evaluate its ability to function as a fast backup system in hybrid energy architectures based on wind energy. The results of measurements performed with a digital oscilloscope, interpreted by analyzing voltage-current data, demonstrate an extremely low response time (of the order of milliseconds), which qualifies the PEMFC as an ideal solution for instantaneous compensation of fluctuations inherent in wind production. Finally, using the same equipment and calculation methods, the dynamic behavior of an internal combustion engine generator was characterized, finding that its response time is approximately 2333 times higher, highlighting the superiority of the PEMFC for fast regulation applications in sustainable and resilient energy systems.
4. Discussion and Conclusions
The transition to sustainable and resilient energy systems, especially those based on renewable sources such as wind energy, requires technological solutions capable of efficiently managing intermittency and sudden power variations. In this context, the precise dynamic characterization of proton exchange membrane fuel cells (PEMFC) fueled with green hydrogen becomes a pivotal element for their validation as storage and fast conversion systems in wind–hydrogen hybrid architectures. The present work experimentally demonstrated the exceptional response capacity of PEMFC technology, providing quantifiable and comparative data supporting its integration into modern energy grids. The obtained results not only confirm the dynamic superiority of PEMFCs over conventional alternatives, but also establish solid foundations for the optimization of future system configurations.
The presence of CO2 decreases the partial pressure of hydrogen at the active sites of the anode, which, according to the Nernst equation, causes a slight decrease in the reversible voltage of the cell. On the platinum catalyst and in the presence of hydrogen, a small portion of CO2 can be reduced to CO. The resulting carbon monoxide strongly poisons the platinum sites, blocking the access of hydrogen and drastically degrading the electrochemical performance.
For sensitive electronic equipment or in microgrids, a voltage and current stabilization delay of 0.7 s (specific to the mechanical inertia of the rated motor) causes frequency drops that can automatically trigger protective relays, disconnecting consumers. The 0.3 ms time of the PEMFC completely eliminates this risk. Even though an internal combustion engine burns hydrogen, the high combustion temperatures in the presence of atmospheric air generate emissions of NOx, a problem that does not exist in the case of cold electrochemical conversion in PEMFC. Unlike the Carnot cycle of internal combustion engine, fuel cells offer much higher operational and thermodynamic efficiency at part loads.
The experimental results obtained in this study revealed an exceptional response time of the proton exchange membrane fuel cell (PEMFC) to the sudden transition from zero power (open circuit) to a 1500 W load, utilizing 0.3 ms. This millisecond performance places the PEMFC in the category of power sources with instantaneous load-following capability, extremely valuable for hybrid energy architectures based on intermittent wind sources. The ability to compensate in real time for sudden variations in energy production qualifies the PEMFC as an optimal uninterruptible power supply (UPS) system for offshore or isolated microgrids, where voltage stability is critical for the operation of sensitive equipment. However, the analysis must be nuanced by considering specific operational limitations. In scenarios involving the opening of the stored hydrogen feed valve, the response time would increase significantly due to hydraulic delays and flow stabilization, an aspect not included in the current experiment, but essential to investigate in future experimental campaigns for full system optimization. Although wind power fluctuations can indeed be progressive, fault events (short circuits, sudden voltage drops, severe gusts leading to protective shutdown of turbines) require an extremely fast response. In microgrids or in applications where PEMFC functions as a UPS (Uninterruptible Power Supply) for sensitive equipment, industry standards require switching times of less than 20 ms. A delay greater than 0.15 s would lead to frequency drops that can automatically trip protective relays, disconnecting consumers. The time we obtained (0.3 ms) demonstrates that PEMFC can support power quality without requiring additional supercapacitors.
A critical operational parameter highlighted by the study is compliance with the manufacturer’s specifications regarding the use of the stack at full power only after reaching the operating temperature of 65 °C. This constraint imposes either an initial preheating cycle or a continuous coolant recirculation strategy to maintain optimal thermal conditions, significantly influencing the design and autonomy of the system in portable or autonomous applications.
The experimental comparison with a thermal generator equipped with an internal combustion engine (Honda GX160) revealed an order of magnitude difference in dynamic performance: the stabilization time of the thermal generator reaches 0.7 s, determined by the thermal inertia of the engine, the mechanical resistance of the rotating components and the dynamics of the speed controller. The dynamic performance ratio calculated as 0.7 s/0.3 ms = 2333 demonstrates the clear superiority of the PEMFC for applications requiring instantaneous response to load variations, consolidating its position as a reference technology in fast regulation systems for wind power networks.
The current study was limited to the analysis of the response at a single load step, not including the evaluation of the behavior at multiple successive steps or at repeated load-disengagement cycles. These investigations, essential for the complete characterization of the dynamic durability, constitute priority objectives of future research. Also, determining the variation in the 2333 performance ratio as a function of the load level (from 0% to 100% of the nominal power) will allow the optimization of wind–hydrogen hybrid architectures for specific applications, strengthening the technological feasibility of PEMFC in the context of the sustainable energy transition. Although the results of this study validate the millisecond-level responsiveness of the PEMFC interface, it is important to consider that wind generation systems and green hydrogen production processes operate on much longer time scales (on the order of minutes or hours). Given that grid stability requires instantaneous energy compensation, assessing the interconnection between these different time constants is a fundamental step. Therefore, future research will focus on integrating PEMFC intrinsic dynamic models within the wind–hydrogen macro-system architecture. This step will be important to understand the behavior and stability limits of the entire energy chain under extreme operational scenarios, thus strengthening the feasibility of these backup systems in modern power grids.
Author Contributions
Conceptualization, F.-V.P. and R.-M.C.; methodology, F.-V.P.; writing—original draft, F.-V.P. and R.-M.C.; writing—review and editing, R.-M.C., F.-V.P., M.P. and I.V.; funding acquisition, M.P. All authors have read and agreed to the published version of the manuscript.
Funding
Research funding of Constanta Maritime University 900663, Mircea cel Batran 104, Constanta, Romania.
Institutional Review Board Statement
Not applicable.
Informed Consent Statement
Not applicable.
Data Availability Statement
The raw data supporting the conclusions of this paper will be made available by the authors upon request.
Conflicts of Interest
The authors declare no conflicts of interest.
Nomenclature
| Abbreviation | |
| FC | Fuel Cell |
| PEM | Proton Exchange Membrane |
| PEMFC | Proton Exchange Membrane Fuel Cell |
| RH | Relative Humidity |
| UPS | Uninterruptible Power Supply |
| CO | Carbon monoxide |
| S | Sulfur |
| ppm | Parts per million |
| ppb | Parts per billion |
| OCV | Open-Circuit Voltage |
| CVM | Cell Voltage Monitoring |
| Symbols | |
| ΦH2 | Minimum hydrogen flow [NL/min] |
| Φair | Minimum air flow [NL/min] |
| n | Number of cells [-] |
| P | Stack power [kW] |
| V | Stack voltage [V] |
| Vrev | Reversible voltage [V] |
| I | Stack current [A] |
| T | Cell operating/stack temperature [°C] |
| pH2 | Hydrogen pressure [bar] |
| pO2 | Oxygen pressure [bar] |
| m | Mass flow [kg/h] or [L/s] |
| DC | Direct current [A] |
| ADC | Alternating current [A] |
| W | Watt, unit of power |
References
- Sun, H.; Zhang, G.; Guo, L.; Liu, H. A Study of Dynamic Characteristics of PEM Fuel Cells by Measuring Local Currents. Int. J. Hydrogen Energy 2009, 34, 5529–5536. [Google Scholar] [CrossRef] [Scilit]
- Pathapati, P.R.; Xue, X.; Tang, J. A New Dynamic Model for Predicting Transient Phenomena in a PEM Fuel Cell System. Renew. Energy 2005, 30, 1–22. [Google Scholar] [CrossRef] [Scilit]
- Benziger, J.; Chia, E.; Moxley, J.F.; Kevrekidis, I.G. The Dynamic Response of PEM Fuel Cells to Changes in Load. Chem. Eng. Sci. 2005, 60, 1743–1759. [Google Scholar] [CrossRef] [Scilit]
- Hidayat, E.F.; Juliandri; Zain, S.M.; Noviyanti, A.R. Advances in Proton Exchange Membrane Fuel Cell (PEMFC) Materials: A Review of Developments from 2021 to 2025. J. Power Sources 2025, 657, 238124. [Google Scholar] [CrossRef] [Scilit]
- Fan, R.; Chang, G.; Xu, Y.; Zhang, Y.; Wei, P. Enhancing PEM Fuel Cell Dynamic Performance: Co-Optimization of Cathode Catalyst Layer Composition and Operating Conditions Using a Novel Surrogate Model. Renew. Energy 2024, 231, 120993. [Google Scholar] [CrossRef] [Scilit]
- Khan, M.J.; Iqbal, M.T. Dynamic Modeling and Simulation of a Small Wind–Fuel Cell Hybrid Energy System. Renew. Energy 2005, 30, 421–439. [Google Scholar] [CrossRef] [Scilit]
- Loo, K.H.; Wong, K.H.; Tan, S.C.; Lai, Y.M.; Tse, C.K. Characterization of the Dynamic Response of Proton Exchange Membrane Fuel Cells—A Numerical Study. Int. J. Hydrogen Energy 2010, 35, 11861–11877. [Google Scholar] [CrossRef] [Scilit]
- Yan, Q.; Toghiani, H.; Causey, H. Steady State and Dynamic Performance of Proton Exchange Membrane Fuel Cells (PEMFCs) under Various Operating Conditions and Load Changes. J. Power Sources 2006, 161, 492–502. [Google Scholar] [CrossRef] [Scilit]
- Edwards, R.L.; Demuren, A. Regression Analysis of PEM Fuel Cell Transient Response. Int. J. Energy Environ. Eng. 2016, 7, 329–341. [Google Scholar] [CrossRef] [Scilit]
- Ceraolo, M.; Miulli, C.; Pozio, A. Modelling Static and Dynamic Behaviour of Proton Exchange Membrane Fuel Cells on the Basis of Electro-Chemical Description. J. Power Sources 2003, 113, 131–144. [Google Scholar] [CrossRef] [Scilit]
- Wang, Y.; Wang, C.Y. Dynamics of Polymer Electrolyte Fuel Cells Undergoing Load Changes. Electrochim. Acta 2006, 51, 3924–3933. [Google Scholar] [CrossRef] [Scilit]
- Amphlett, J.C.; Mann, R.F.; Peppley, B.A.; Roberge, P.R.; Rodrigues, A. A Model Predicting Transient Responses of Proton Exchange Membrane Fuel Cells. J. Power Sources 1996, 61, 183–188. [Google Scholar] [CrossRef] [Scilit]
- Kim, S.; Shimpalee, S.; Van Zee, J.W. The Effect of Stoichiometry on Dynamic Behavior of a Proton Exchange Membrane Fuel Cell (PEMFC) during Load Change. J. Power Sources 2004, 135, 110–121. [Google Scholar] [CrossRef] [Scilit]
- Zhang, G.; Guo, L.; Ma, L.; Liu, H. Simultaneous Measurement of Current and Temperature Distributions in a Proton Exchange Membrane Fuel Cell. J. Power Sources 2010, 195, 3597–3604. [Google Scholar] [CrossRef] [Scilit]
- Zhang, G.; Kandlikar, S.G. A Critical Review of Cooling Techniques in Proton Exchange Membrane Fuel Cell Stacks. Int. J. Hydrogen Energy 2012, 37, 2412–2429. [Google Scholar] [CrossRef] [Scilit]
- Yan, W.M.; Soong, C.Y.; Chen, F.; Chu, H. Sen Transient Analysis of Reactant Gas Transport and Performance of PEM Fuel Cells. J. Power Sources 2005, 143, 48–56. [Google Scholar] [CrossRef] [Scilit]
- Kim, S.; Shimpalee, S.; Zee, J.W. Van Effect of Flow Field Design and Voltage Change Range on the Dynamic Behavior of PEMFCs. J. Electrochem. Soc. 2005, 152, A1265–A1271. [Google Scholar] [CrossRef] [Scilit]
- Weydahl, H.; Møller-Holst, S.; Hagen, G.; Børresen, B. Transient Response of a Proton Exchange Membrane Fuel Cell. J. Power Sources 2007, 171, 321–330. [Google Scholar] [CrossRef] [Scilit]
- Larminie, J.; Dicks, A. Fuel Cell Systems Explained—Operational Fuel Cell Voltages. Fuel Cell Syst. Explain. 2013, 45–66. [Google Scholar] [CrossRef] [Scilit]
- Eg&G Technical Services, Inc. Fuel Cell Handbook, 7th ed.; U.S. Department of Energy Office of Fossil Energy National Energy Technology Laboratory: Morgantown, WV, USA, 2004. [CrossRef] [Scilit]
- Nguyen, T.V.; White, R.E. A Water and Heat Management Model for Proton-Exchange-Membrane Fuel Cells. J. Electrochem. Soc. 1993, 140, 2178–2186. [Google Scholar] [CrossRef] [Scilit]
- Springer, T.E.; Zawodzinski, T.A.; Gottesfeld, S. Polymer Electrolyte Fuel Cell Model. J. Electrochem. Soc. 1991, 138, 2334–2342. [Google Scholar] [CrossRef] [Scilit]
- Bernardi, D.M.; Verbrugge, M.W. A Mathematical Model of the Solid-Polymer-Electrolyte Fuel Cell. J. Electrochem. Soc. 1992, 139, 2477–2491. [Google Scholar] [CrossRef] [Scilit]
- Bernardi, D.M.; Verbrugge, M.W. Mathematical Model of a Gas Diffusion Electrode Bonded to a Polymer Electrolyte. AIChE J. 1991, 37, 1151–1163. [Google Scholar] [CrossRef] [Scilit]
- Bernardi, D.M. Water-Balance Calculations for Solid-Polymer-Electrolyte Fuel Cells. J. Electrochem. Soc. 1990, 137, 3344–3350. [Google Scholar] [CrossRef] [Scilit]
- Wöhr, M.; Bolwin, K.; Schnurnberger, W.; Fischer, M.; Neubrand, W.; Eigenberger, G. Dynamic Modelling and Simulation of a Polymer Membrane Fuel Cell Including Mass Transport Limitation. Int. J. Hydrogen Energy 1998, 23, 213–218. [Google Scholar] [CrossRef] [Scilit]
- Baschuk, J.J.; Li, X. Modelling of Polymer Electrolyte Membrane Fuel Cells with Variable Degrees of Water Flooding. J. Power Sources 2000, 86, 181–196. [Google Scholar] [CrossRef] [Scilit]
- Marr, C.; Li, X. Composition and Performance Modelling of Catalyst Layer in a Proton Exchange Membrane Fuel Cell. J. Power Sources 1999, 77, 17–27. [Google Scholar] [CrossRef] [Scilit]
- Wang, J.T.; Savinell, R.F. Simulation Studies on the Fuel Electrode of a H2 O2 Polymer Electrolyte Fuel Cell. Electrochim. Acta 1992, 37, 2737–2745. [Google Scholar] [CrossRef] [Scilit]
- Rowe, A.; Li, X. Mathematical Modeling of Proton Exchange Membrane Fuel Cells. J. Power Sources 2001, 102, 82–96. [Google Scholar] [CrossRef] [Scilit]
- Saeed, M.; El-Hameed, M.A.; Al-Hajri, E.; Kabbani, A. Water Management Strategies for Proton Exchange Membrane Fuel Cells: A Comprehensive Review. Electrochem 2025, 6, 38. [Google Scholar] [CrossRef] [Scilit]
- Guerrero-Rodríguez, N.F.; De La Rosa-Leonardo, D.A.; Tapia-Marte, R.; Ramírez-Rivera, F.A.; Faxas-Guzmán, J.; Rey-Boué, A.B.; Reyes-Archundia, E. An Overview of the Efficiency and Long-Term Viability of Powered Hydrogen Production. Sustainability 2024, 16, 5569. [Google Scholar] [CrossRef] [Scilit]
- Donateo, T.; Bonatesta, A.G.; Ficarella, A. Holistic Dynamic Modeling of Open-Cathode PEM Fuel Cells for Sustainable Hydrogen Propulsion in UAVs. Sustainability 2026, 18, 163. [Google Scholar] [CrossRef] [Scilit]
- Sopian, K.; Ibrahim, M.Z.; Wan Daud, W.R.; Othman, M.Y.; Yatim, B.; Amin, N. Performance of a PV–Wind Hybrid System for Hydrogen Production. Renew. Energy 2009, 34, 1973–1978. [Google Scholar] [CrossRef] [Scilit]
- Yang, Y.; Luo, X.; Dai, C.; Chen, W.; Liu, Z.; Li, Q. Dynamic Modeling and Dynamic Responses of Grid-Connected Fuel Cell. Int. J. Hydrogen Energy 2014, 39, 14296–14305. [Google Scholar] [CrossRef] [Scilit]
- Du, Y.; Huang, H.; Liu, H.; Zhao, J.; Yang, Q. Life Cycle Assessment of Abandonment of Onshore Wind Power for Hydrogen Production in China. Sustainability 2024, 16, 5772. [Google Scholar] [CrossRef] [Scilit]
- Benreguieg, A.; Montuori, L.; Alcázar-Ortega, M.; Siano, P. Multi-Criteria Decision Analysis for Assessing Green Hydrogen Suitability in MENA FFED Countries. Sustainability 2026, 18, 2157. [Google Scholar] [CrossRef] [Scilit]
- Zhou, B.; Gao, Y.; He, X.; Teng, Y.; Wang, N.; Wang, B.; Song, X. Deep-Reinforcement-Learning-Based Energy Management for Off-Grid Wind-to-Hydrogen Systems. Sustainability 2026, 18, 2408. [Google Scholar] [CrossRef] [Scilit]
- Elsayed, S.K.; Agwa, A.M.; Elattar, E.E.; El-Fergany, A.A. Steady-State Modelling of PEM Fuel Cells Using Gradient-Based Optimizer. Dyna 2021, 96, 520–527. [Google Scholar] [CrossRef] [Scilit] [PubMed]
- Zhu, C.; Li, X. A New One Dimensional Steady State Model for PEM Fuel Cell. World Electr. Veh. J. 2010, 4, 437–443. [Google Scholar] [CrossRef] [Scilit]

Disclaimer/Publisher’s Note: The statements, opinions and data contained in all publications are solely those of the individual author(s) and contributor(s) and not of MDPI and/or the editor(s). MDPI and/or the editor(s) disclaim responsibility for any injury to people or property resulting from any ideas, methods, instructions or products referred to in the content. |
© 2026 by the authors. Licensee MDPI, Basel, Switzerland. This article is an open access article distributed under the terms and conditions of the Creative Commons Attribution (CC BY) license.