Article

Membrane Structures as a Shelter Solution for Privately Owned Public Spaces: Evaluating Heat-Related Risk During Disasters and Daily Thermal Comfort via Simulation

1
School of Light Industry and Engineering, South China University of Technology, Guangzhou 510641, China
2
Independent Researcher, Tagajō 985-0831, Miyagi, Japan
3
Department of Architecture and Building Engineering, Institute of Science Tokyo, 4259 Nagatsuta-cho, Midori-ku, Yokohama 226-8502, Kanagawa, Japan
*
Authors to whom correspondence should be addressed.
Sustainability 2026, 18(9), 4167; https://doi.org/10.3390/su18094167
Submission received: 22 December 2025 / Revised: 11 April 2026 / Accepted: 13 April 2026 / Published: 22 April 2026
(This article belongs to the Special Issue Sustainable Urban Risk Management and Resilience Strategy)

Abstract

This study evaluated whether membrane structures can enhance thermal comfort and reduce heat- and cold-related health risks in privately owned public spaces (POPS) under representative seasonal peak conditions. Based on previous in situ measurements revealing severe summer heat stress and winter cold discomfort in two POPS in Tokyo’s Minato-ku Shibaura district, a membrane-based shelter solution is proposed and systematically assessed. Their thermal environmental effects were numerically simulated using a coupled surface energy balance (SEB) and computational fluid dynamics (CFD) model, with evaluations focusing on human health risks and thermal comfort. Results demonstrated that in summer, membrane structures effectively improved thermal comfort by reducing the standard effective temperature (SET*) by 1.9–3.9 °C, although these SET* values still remained above the thermal comfort range. Notably, heat stress-related health risks were significantly mitigated, as deep body temperature (DBT) decreased by 1.2–1.6 °C, falling below the 38 °C heatstroke risk threshold. In winter, although the overall improvement was limited, the membrane structures still reduced cold-related health risks and extended allowable exposure duration (AED). Furthermore, auxiliary measures (e.g., mist sprays for summer and supplementary heating for winter) are recommended to further enhance thermal comfort in POPS.

1. Introduction

If private developers agree to create and manage publicly accessible urban spaces, they are typically granted a bonus floor area ratio (FAR), allowing them to construct larger buildings than those permitted by local government zoning regulations [1,2]. These publicly accessible urban spaces, termed Privately Owned Public Spaces (POPS), have been developed worldwide [2]. This mechanism encourages voluntary participation by developers and increases the availability of privately owned land for public use, particularly in high-land-price areas, where public open spaces are typically scarce. In previous research [3], POPS were identified not only as spaces for daily leisure and social activities, but also as potential components of urban disaster-prevention systems. Their spatial capacity indicates strong potential to accommodate individuals who are unable to return home following sudden-onset disasters such as major earthquakes or infrastructure disruptions. In this study, the term “disaster situation” refers to post-disaster outdoor sheltering scenarios rather than prolonged extreme meteorological events.
However, in situ measurements reported in previous research [3] indicate that existing POPS in Tokyo experience significant thermal challenges. These include severe heat stress during summer daytime and cold discomfort with elevated nighttime health risks under low-wind winter conditions. In addition to thermal discomfort, wind-related issues also affect the usability of POPS. From the perspective of spatial design-related experience and safety, most POPS are attached to high-rise buildings, and the downwash wind (strong near-ground wind around high-rise buildings) generated at the bottom of high-rise buildings has attracted widespread attention. For example, the Minato Ward of Tokyo clearly lists optimizing building layout and shape, planting windbreak vegetation, and installing canopies/roofs (large-span shelter facilities for public spaces) as measures to address downwash wind in the Guidelines for Building Wind Mitigation Measures [4]. In daily scenarios, downwash wind often causes discomfort to people, and “wind damage” is even classified as one of the environmental disasters [5]. Furthermore, research by Soeda et al. [6] shows that the height of high-rise buildings tends to bring a sense of visual oppression, and installing canopies (or combination with arcades) can significantly reduce this oppression. At the same time, some studies suggest that expanding space horizontally can alleviate visual oppression. For example, “permeable design” (specifically, designing the first-floor space as a deep colonnade or glass structure and placing furniture inside) can guide people’s attention from vertical height to horizontal extension, further alleviating the sense of oppression. This design concept also provides a reference for optimizing POPS form. However, most existing POPS in Tokyo have not adopted such designs, resulting in a significant reduction in spatial practicality and user experience. Notably, the selection of materials and spatial form for such canopies is critical to balancing wind mitigation, thermal comfort, and disaster resilience—factors that have not been fully addressed in current POPS designs.
Thus, a shelter solution to improve the thermal environment in POPS is necessary to reduce heat/cold-related health risks for displaced populations. Meanwhile, if thermal comfort is improved for daily use, attendance, outdoor duration, and social interaction in POPS may also increase [7,8,9]. As suggested in [4,10,11], the greenery and canopy as shade devices and protection from the heavy wind have potential as shelter solutions. Greenery has been widely studied to improve outdoor thermal comfort in both summer and winter. For example, Klemm et al. [12] found that 10% of street tree cover can reduce mean radiant temperature (MRT) by around 1 K in summer, while Tong et al. concluded that vegetation can lower wind velocity, thereby improving thermal comfort in winter [13]. Among various potential materials for canopies, membrane structure is identified as the optimal choice based on discussion in Section 3.3. Highly solar-reflective, light, and thin membrane structures can keep a low surface temperature with little heat stored within themselves [14], yet their thermal performance in semi-open environments remains under-investigated compared to their traditional use in enclosed buildings (e.g., [15,16,17]). He et al. conducted a series of studies focusing on how the solar transmittance and absorptance of the membrane or the ground surface materials influencing the thermal environment under the membrane structure [14,18]. However, there is still a lack of research on the effect of membrane structures in winter conditions and a comparison of the thermal environment before and after the application of membrane structures.
To bridge the above gaps, this study investigates the following core question: Can membrane structures effectively enhance thermal comfort and reduce heat- and cold-related health risks in high-density POPS under representative seasonal peak conditions, particularly in post-disaster outdoor sheltering scenarios while remaining beneficial for daily use (Figure 1)? This study does not simulate extreme meteorological events. Instead, it assesses thermal performance under representative peak summer and winter conditions, which provide conservative boundary scenarios for prolonged outdoor exposure in post-disaster contexts. These conditions also reflect thermally stressful conditions relevant to daily use. Performance is evaluated in terms of both thermal comfort and heat/cold-related health risk. Based on previous in situ measurements of two POPS in the Minato-ku Shibaura business area of Tokyo [3], the membrane structure is proposed to be applied as a shelter solution and its material selection, horizontal plan, height, and shape are designed in this study. Its effect on the thermal environment is numerically simulated by coupling surface energy balance (SEB) and computational fluid dynamics (CFD) modeling and evaluated in terms of thermal comfort and heat/cold-related health risk. Although the simulations are based on Tokyo meteorological data, the proposed SEB–CFD coupling framework and integrated thermal performance evaluation methodology are transferable to other climatic regions by substituting local boundary conditions. In addition, this study clarifies the institutional positioning of membrane structures within Japan’s Comprehensive Design System (CDS), specifically the Tokyo Metropolitan Comprehensive Design Permission Guidelines (CDPG), to ensure regulatory compatibility and economic feasibility. The limitations of site selection and structural height, as well as additional benefits (e.g., natural daylight and ventilation, improved wayfinding for seismic resilience), are also discussed.

2. Methods

2.1. Study Area

Tokyo, Japan, was selected as the urban context of this study due to its high-density built environment, humid subtropical climate, and seismic risk profile. The city experiences hot and humid summers and relatively cold winters, and in high-density districts such as Minato-ku, urban heat island effects may intensify seasonal thermal stress. These climatic characteristics make the case representative of densely built East Asian metropolitan environments where prolonged outdoor sheltering under thermally stressful seasonal peak conditions may pose significant heat- and cold-related health risks. Tokyo is located in a high seismic-risk region, where large earthquakes may lead to temporary displacement due to structural inspections, building damage, or transportation disruption. In densely built districts such as Minato-ku, POPS may serve as temporary gathering and waiting areas during post-earthquake situations. Under such circumstances, evacuees may be required to remain outdoors for extended durations. From a thermal perspective, exposure to hot and humid summer conditions or cold winter nights—potentially intensified by urban heat island effects and high-rise-induced wind environments—may pose additional health risks. Therefore, enhancing shading, wind mitigation, and rain protection in POPS is essential for both emergency sheltering and daily thermal comfort.
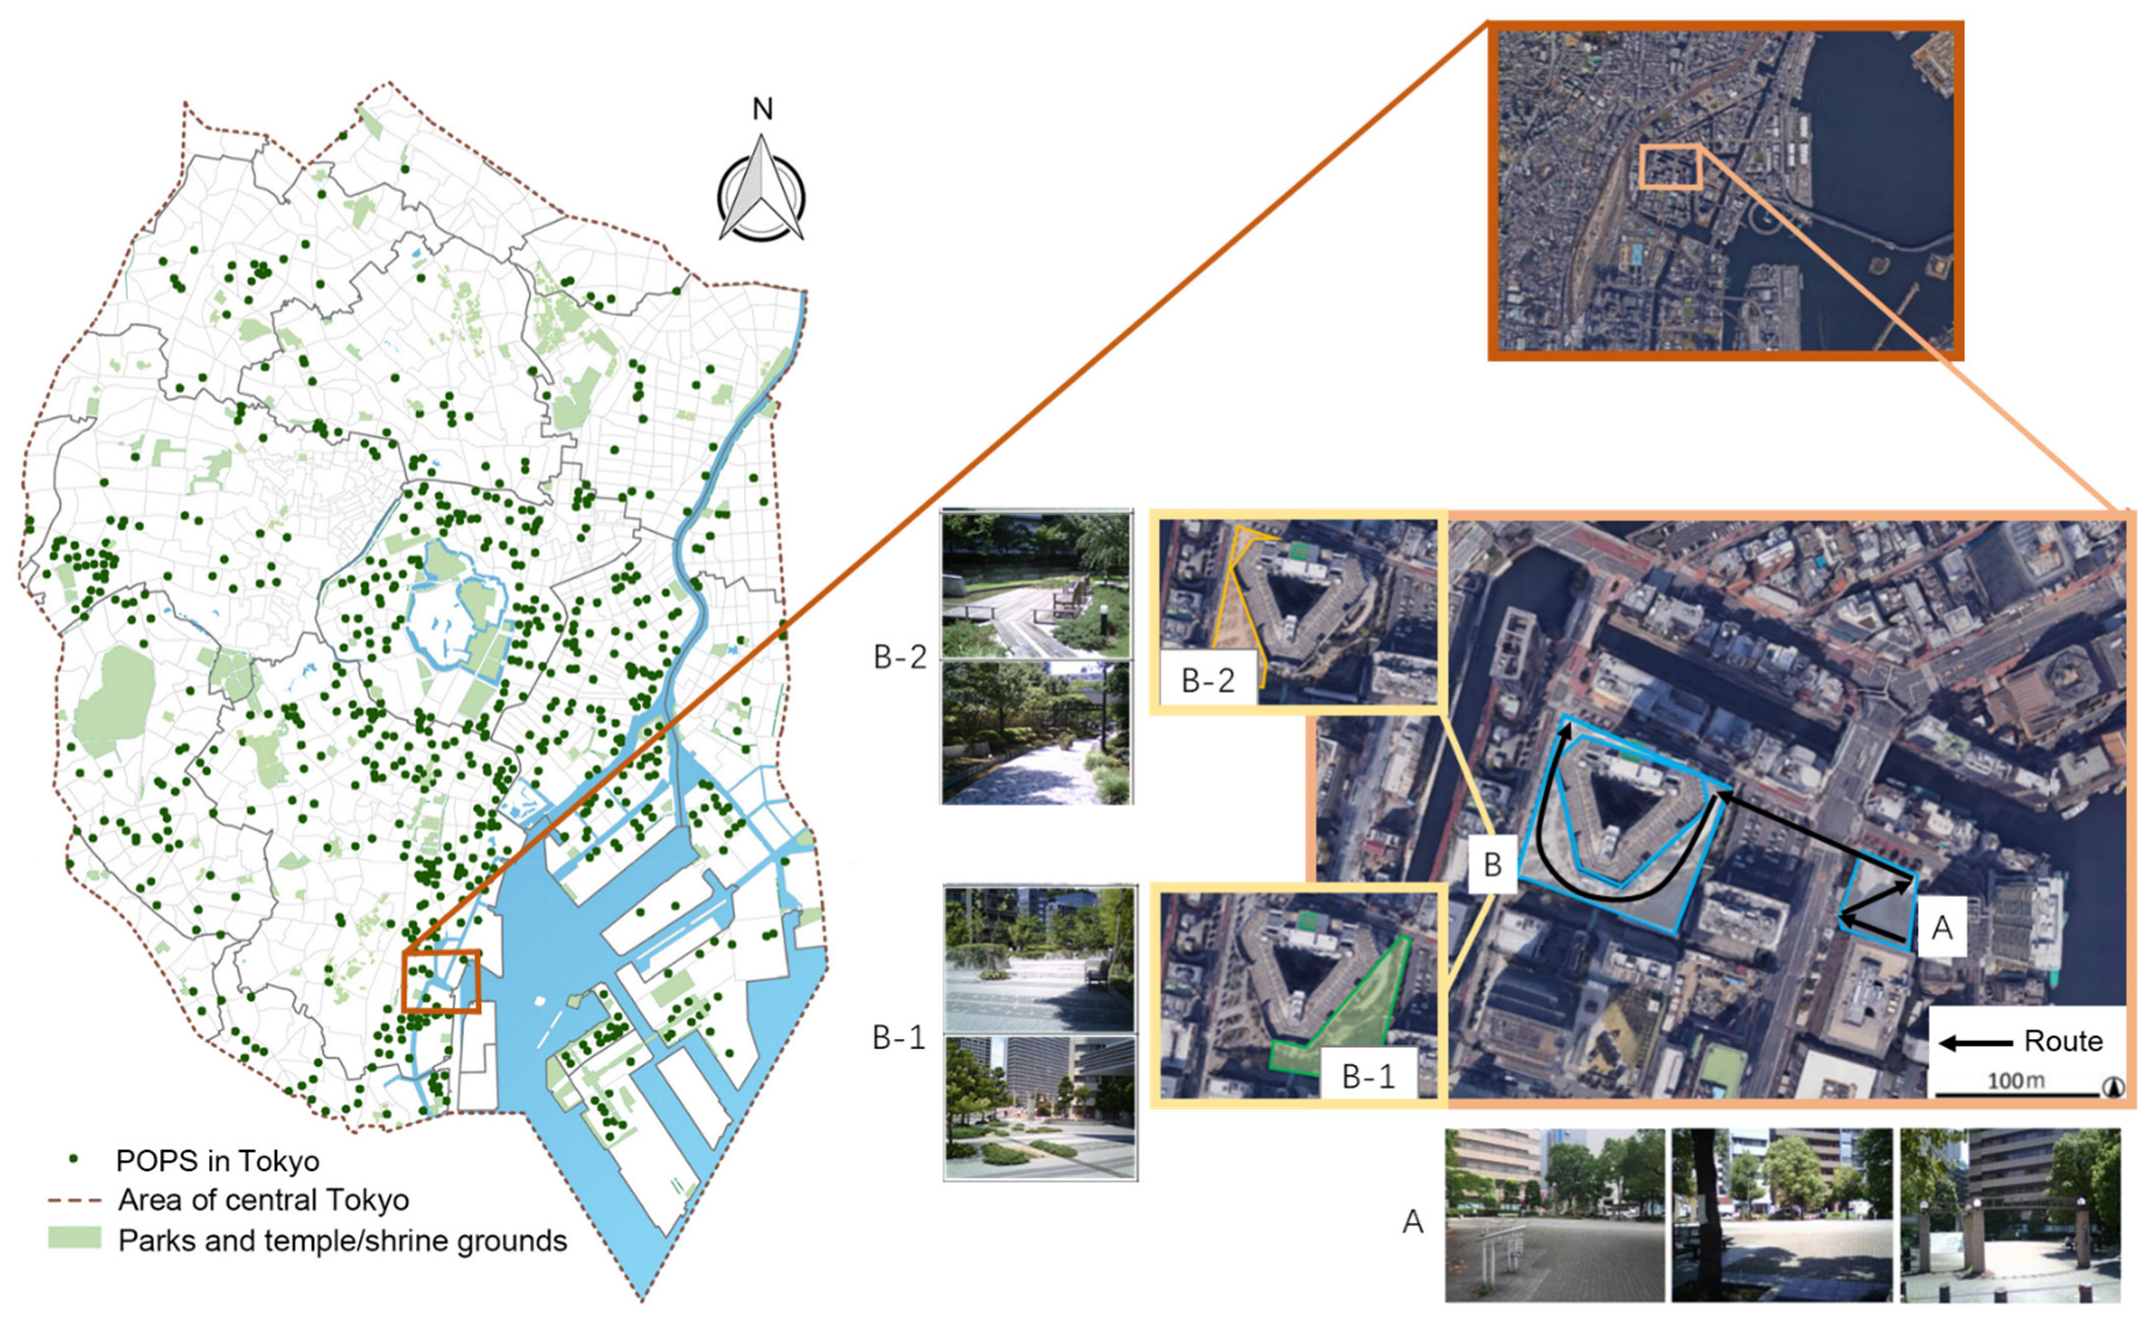
The Minato-ku Shibaura business area (Figure 2, top right), located within the Port of Tokyo district, combines high-rise office and residential buildings with POPS developed under Japan’s CDS. Two POPS, A and B (35.64° N, 139.75° E; Figure 2, bottom right), were selected as case study sites for membrane structure application. POPS A is attached to a 77.5 m-high office building and serves as a designated disaster-prevention base within the Port of Tokyo area, providing approximately 5188 m2 of open space. During emergency situations, employees working in the port area may gather in POPS A, potentially resulting in overcrowding. POPS B is associated with a 167 m high residential high-rise building accommodating approximately 869 households. Due to its proximity to POPS A and its large open space area (approximately 99,980 m2), POPS B has strong potential to function as supplementary emergency open space within the port district. In situ measurements, membrane structure design, and thermal simulations were conducted for both sites. In situ measurements were conducted on 31 July and 26 December 2018 at a typical pedestrian height of 1.5 m. Measured parameters included air temperature, relative humidity, wind velocity, and six-directional shortwave and longwave radiation. Key information from the referenced measurement study [3] is summarized in Appendix E.

2.2. Literature-Based Study

The material selection criteria (e.g., thermal and durability performance of membrane, metal, and glass materials) and institutional constraints (e.g., FAR regulations and pilotis-type classification criteria) for applying the proposed membrane structure to POPS were established based on relevant Japanese official regulations and guidelines [4,20], industry web sources [21], and the peer-reviewed academic literature [6,22,23]. In particular, the Tokyo Metropolitan CDPG [20], which govern the implementation of Japan’s CDS, provide the regulatory framework and detailed calculation methods for granting FAR incentives within the Tokyo metropolitan area.
In addition, the architectural and socio-spatial values of membrane structures were discussed through a comprehensive review of relevant academic studies and industry web sources [24,25,26,27,28,29,30,31,32,33,34].

2.3. Numerical Simulation

2.3.1. Coupled SEB and CFD Modeling Method

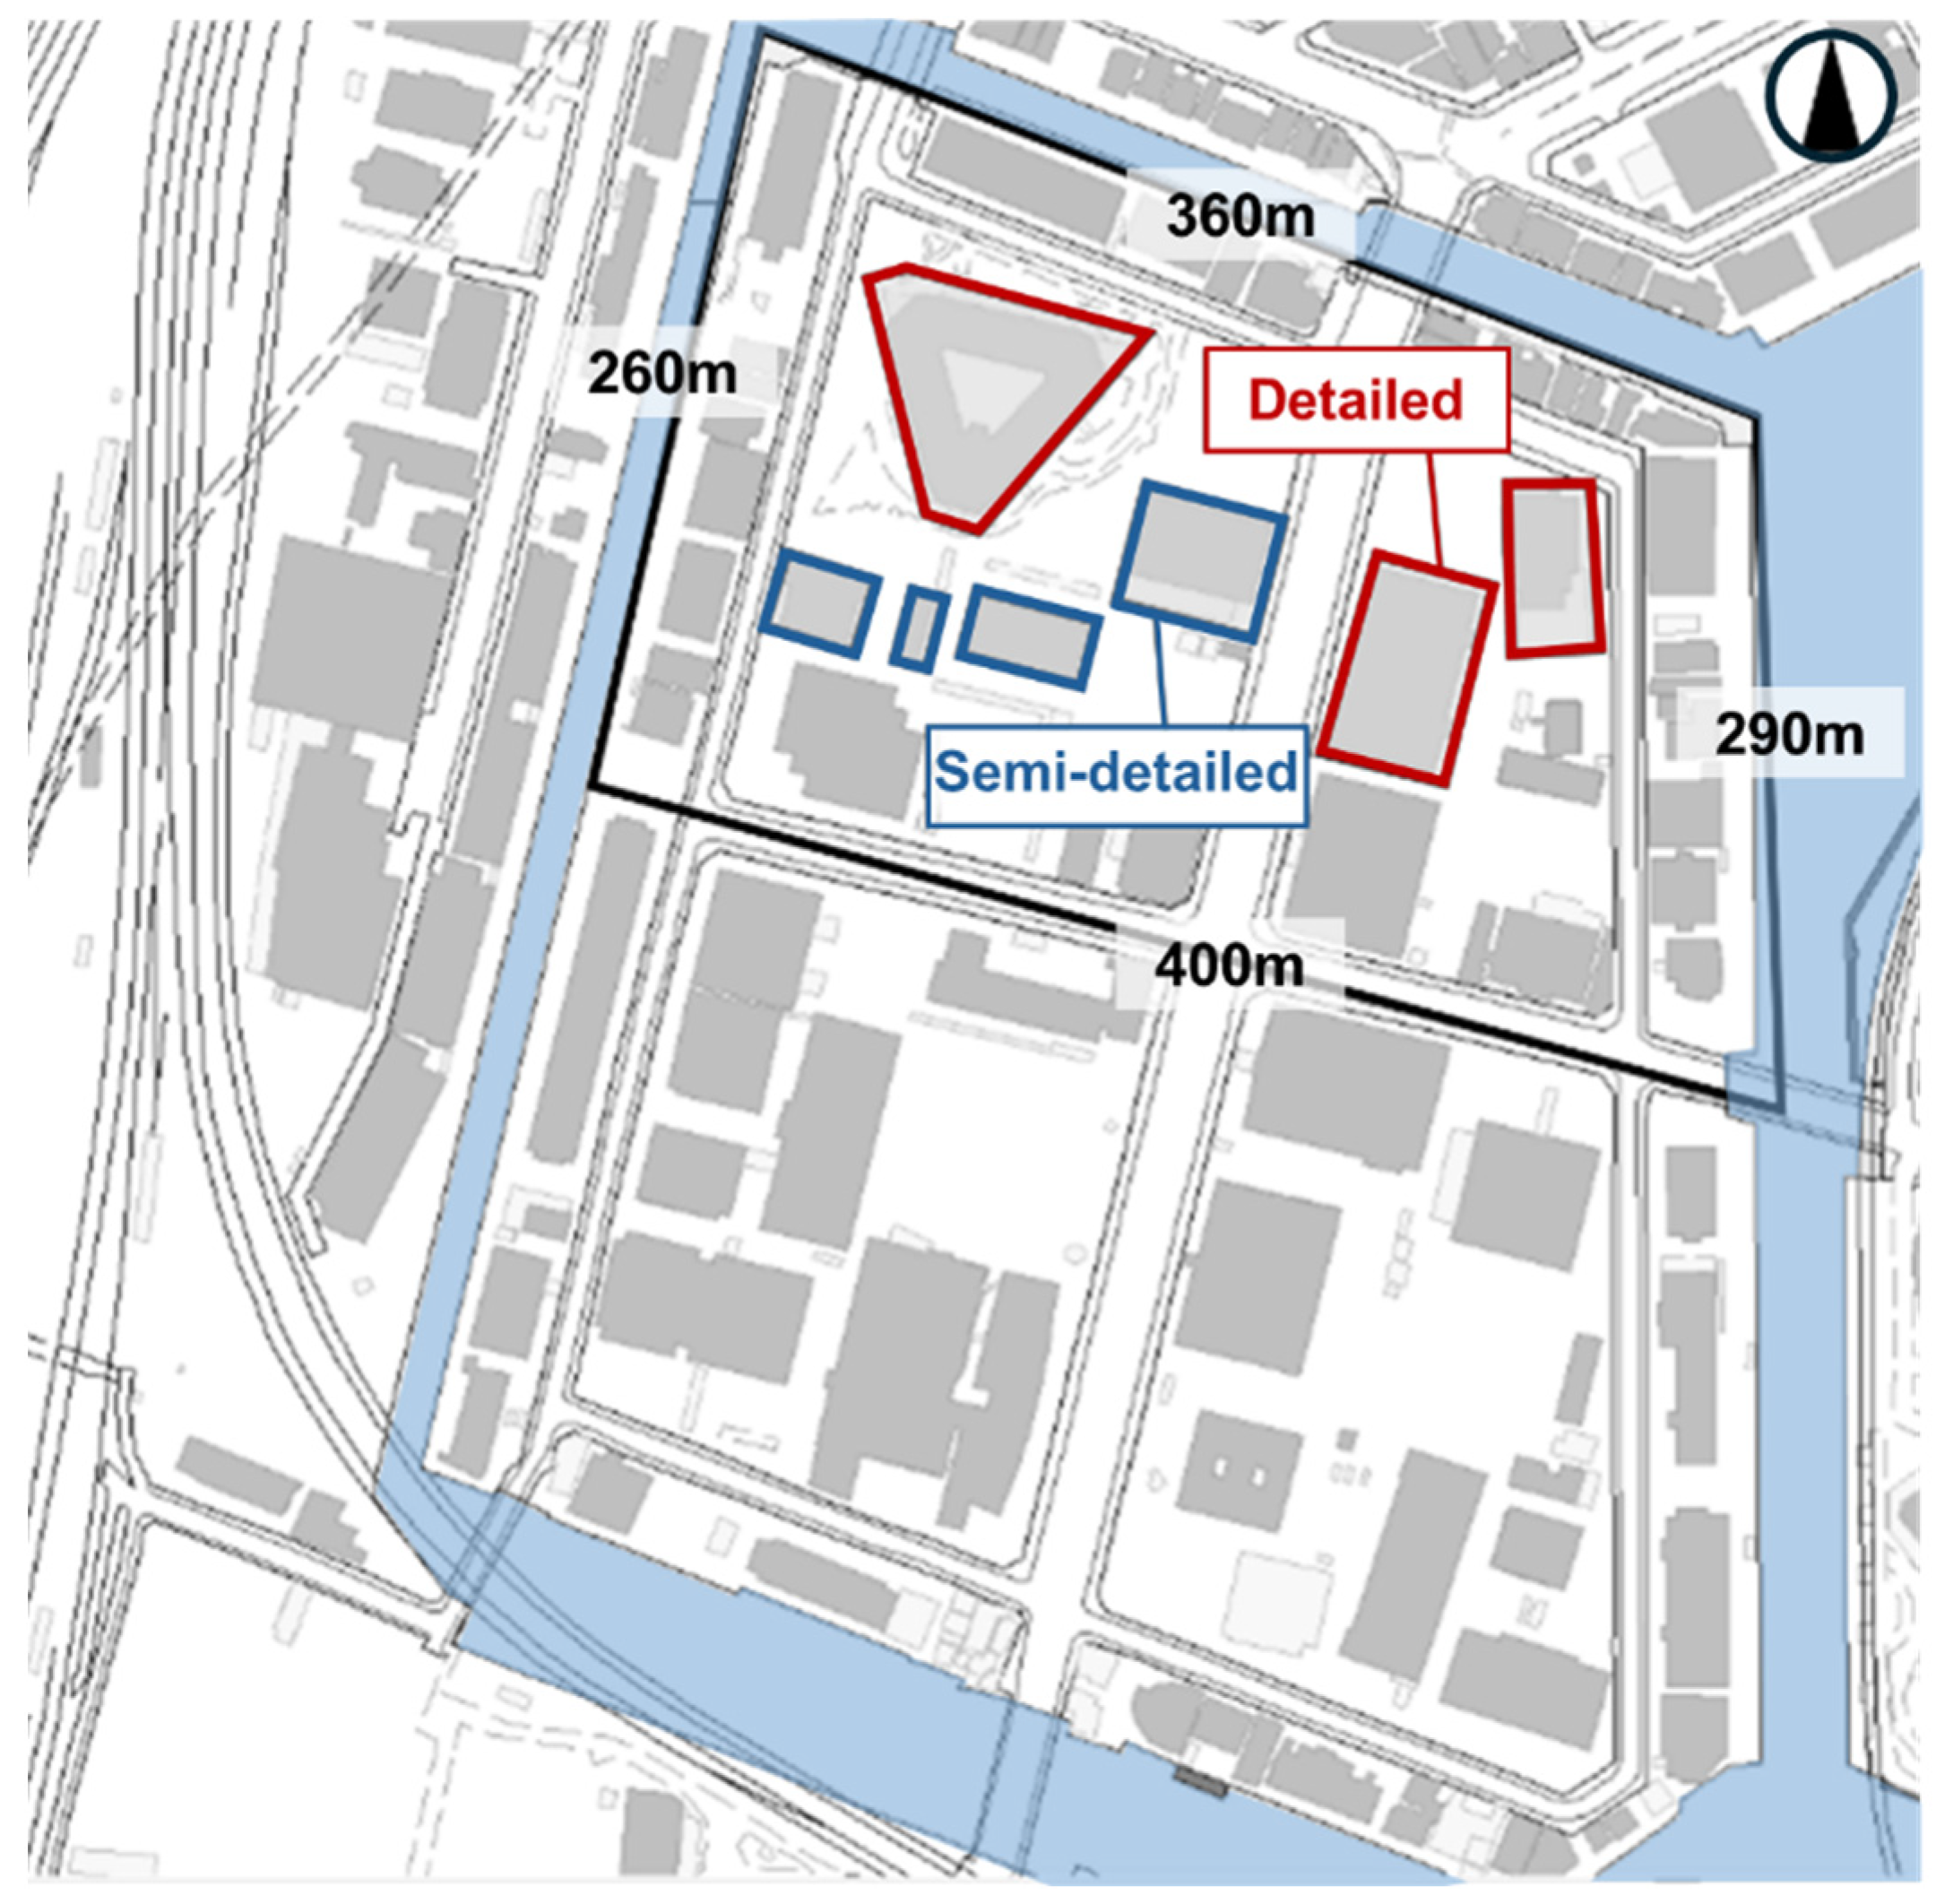
Based on the study area (Section 2.1), a three-dimensional (3D) model was delineated to cover POPS A, POPS B, and five surrounding blocks (to eliminate boundary effects on the core study area), as shown in Figure A1 in Appendix A. Bounded by the river to the north, east and west and the road to the south, the horizontal base of the 3D model range forms a quadrilateral with side lengths of approximately 260 m, 360 m, 290 m, and 400 m, covering an area of roughly 92,870 m2 (as labeled in Figure A1). Within this scope, buildings and greenery were replicated in terms of location, shape, and height based on the simulation’s varying precision requirements, with the corresponding precision levels detailed in Figure A1: (a) Detailed modeling: Buildings adjacent to POPS, along with public open space components (wooden terrace decks, hedges, ground materials), were modeled in detail, including rooftop fixtures, windows, eaves, and balconies. (b) Semi-detailed modeling: For nearby buildings, the human-scale 1st to 3rd floors were detailed, while floors above the 3rd were simplified except for distinct features. (c) Simplified modeling: Other buildings were simplified to prisms based on their exterior wall lines.
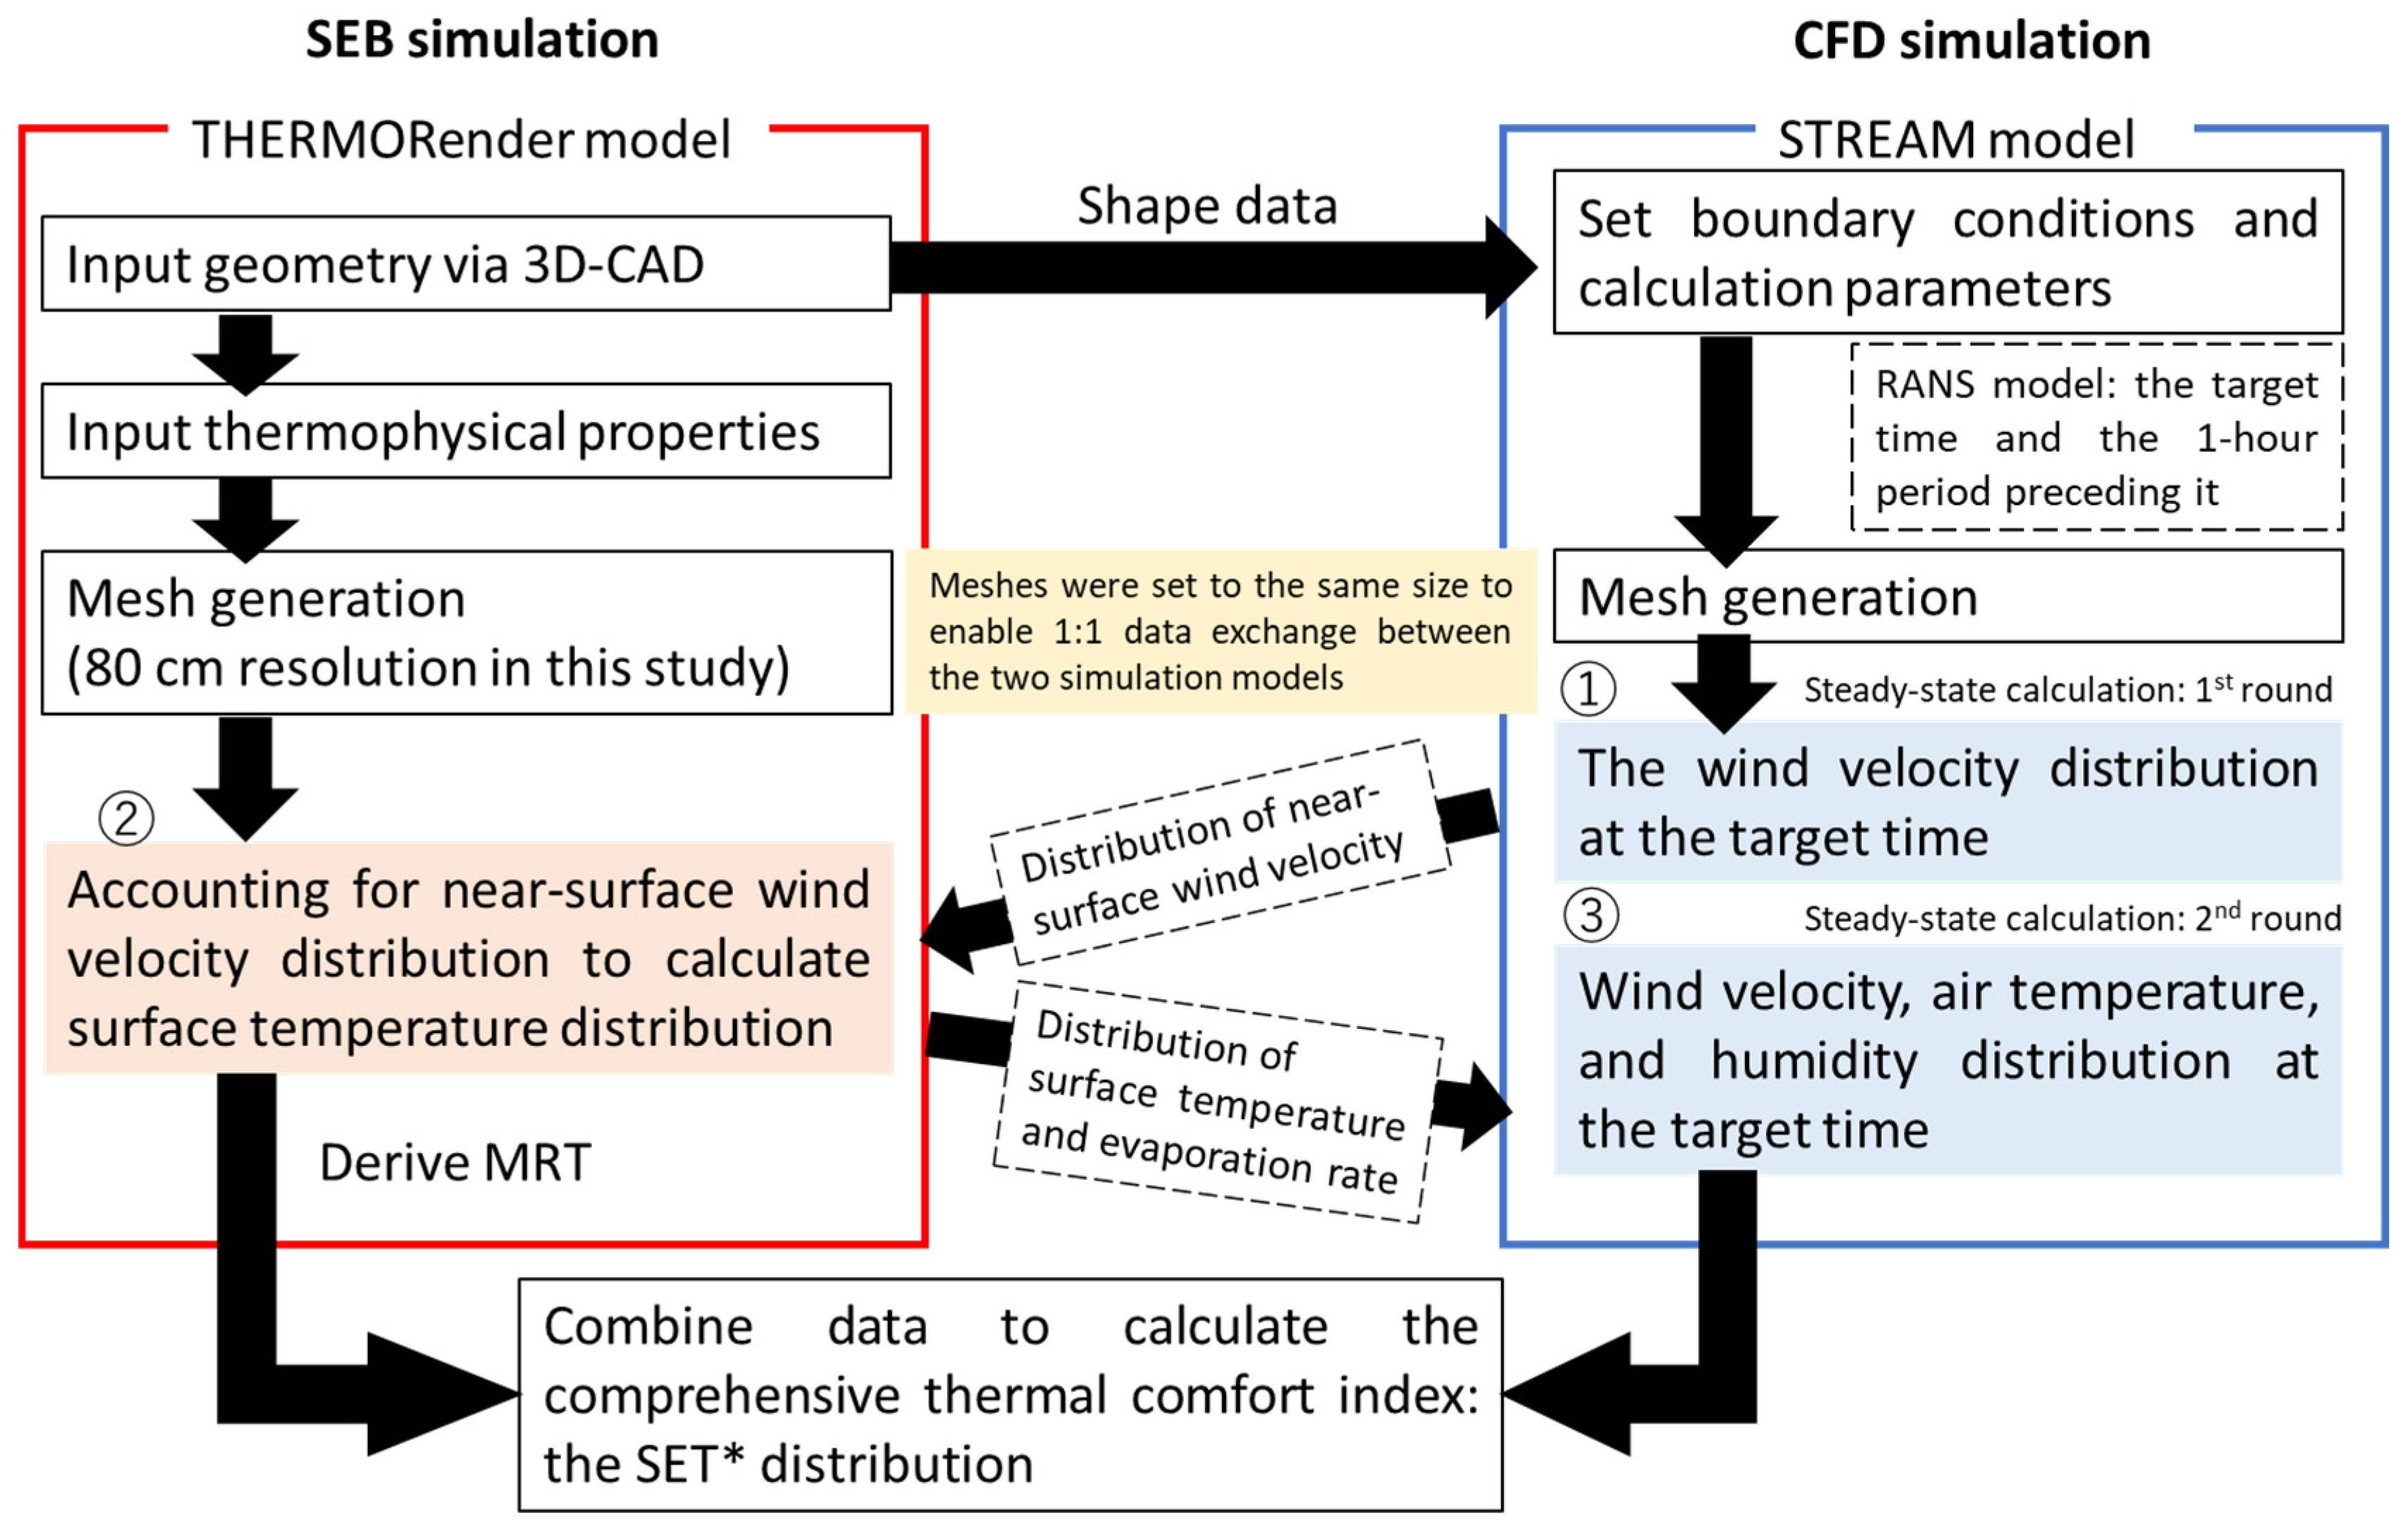
A coupled simulation method was used, integrating both SEB and CFD simulations. Two simulation models were applied: the THERMORender model, developed by Asawa et al. (2008) [35], for surface heat balance simulation, and the STREAM model (scSTREAM Version 14, Cradle, Tokyo, Japan) for airflow simulation. SEB modeling can predict the surface temperature but cannot simulate airflow and relative humidity. As one of the important parameters for determining the surface temperature, the distribution of wind velocity is assumed to be spatially uniform in SEB simulations, which may influence the accuracy of the simulated surface temperature. By contrast, CFD can predict the spatial distribution of airflow, and that of air temperature and humidity as well by coupling the heat and moisture transport equations. However, the surface temperature and evaporation rate are required to be input as boundary conditions. Therefore, the coupling of SEB and CFD, as shown in Figure 3, can improve the prediction accuracy of the surface temperature, and the simulated surface temperature can be input into STREAM as a boundary condition.
To clarify the initial and boundary conditions related to the study location, key CFD calculation parameters are supplemented in Table A1. The Reynolds-Averaged Navier–Stokes (RANS) model was adopted alongside the standard k-epsilon (k-ε) turbulence model. The RANS model is widely used in microclimate simulation due to its high efficiency and reliability in simulating steady-state flow fields, while the standard k-ε model was selected to simulate the turbulent characteristics of the airflow, which can effectively describe the energy exchange and mass transfer in the microclimate environment. Furthermore, according to the Recommendations for Loads on Buildings by the Architectural Institute of Japan (AIJ) [36], the terrain category for the inflow boundary was defined as Category IV (urban, built-up area with tall buildings). This classification was selected to represent the urban environment of the study area, where buildings are relatively high and dense. The computational domain was determined based on the height of the tallest building in the study area (H = 167 m, corresponding to the high-rise building attached to POPS B). Following commonly adopted CFD domain configuration practices for urban wind environment simulations, the distances to the inflow, outflow, and top boundaries were set to 5H, 10H, and 5H, respectively. A uniform mesh size of 80 cm × 80 cm was applied in both THERMORender and STREAM models to ensure spatial consistency.
Based on these parameters, the coupled simulation was conducted in sequential rounds as shown in Figure 3. First, the distribution of near-surface flow velocity can be simulated in STREAM (as the first-round CFD modeling) by applying the RANS model, based on the input 3D-CAD model of the study case as shape data combined with boundary conditions including inflow direction and velocity. Second, the simulated near-surface flow velocity distribution was input into THERMORender using the heat balance model (as the first-round heat balance modeling) to simulate surface temperature distribution. Finally, this simulated surface temperature distribution was incorporated into STREAM as boundary conditions to calculate the distributions of wind velocity, air temperature, and relative humidity for the target times defined in Section 2.3.2 (13:00 on the summer day and 02:00 on the winter day) as the second-round CFD modeling.

2.3.2. Simulation Date, Target Time, and Input Meteorological Data

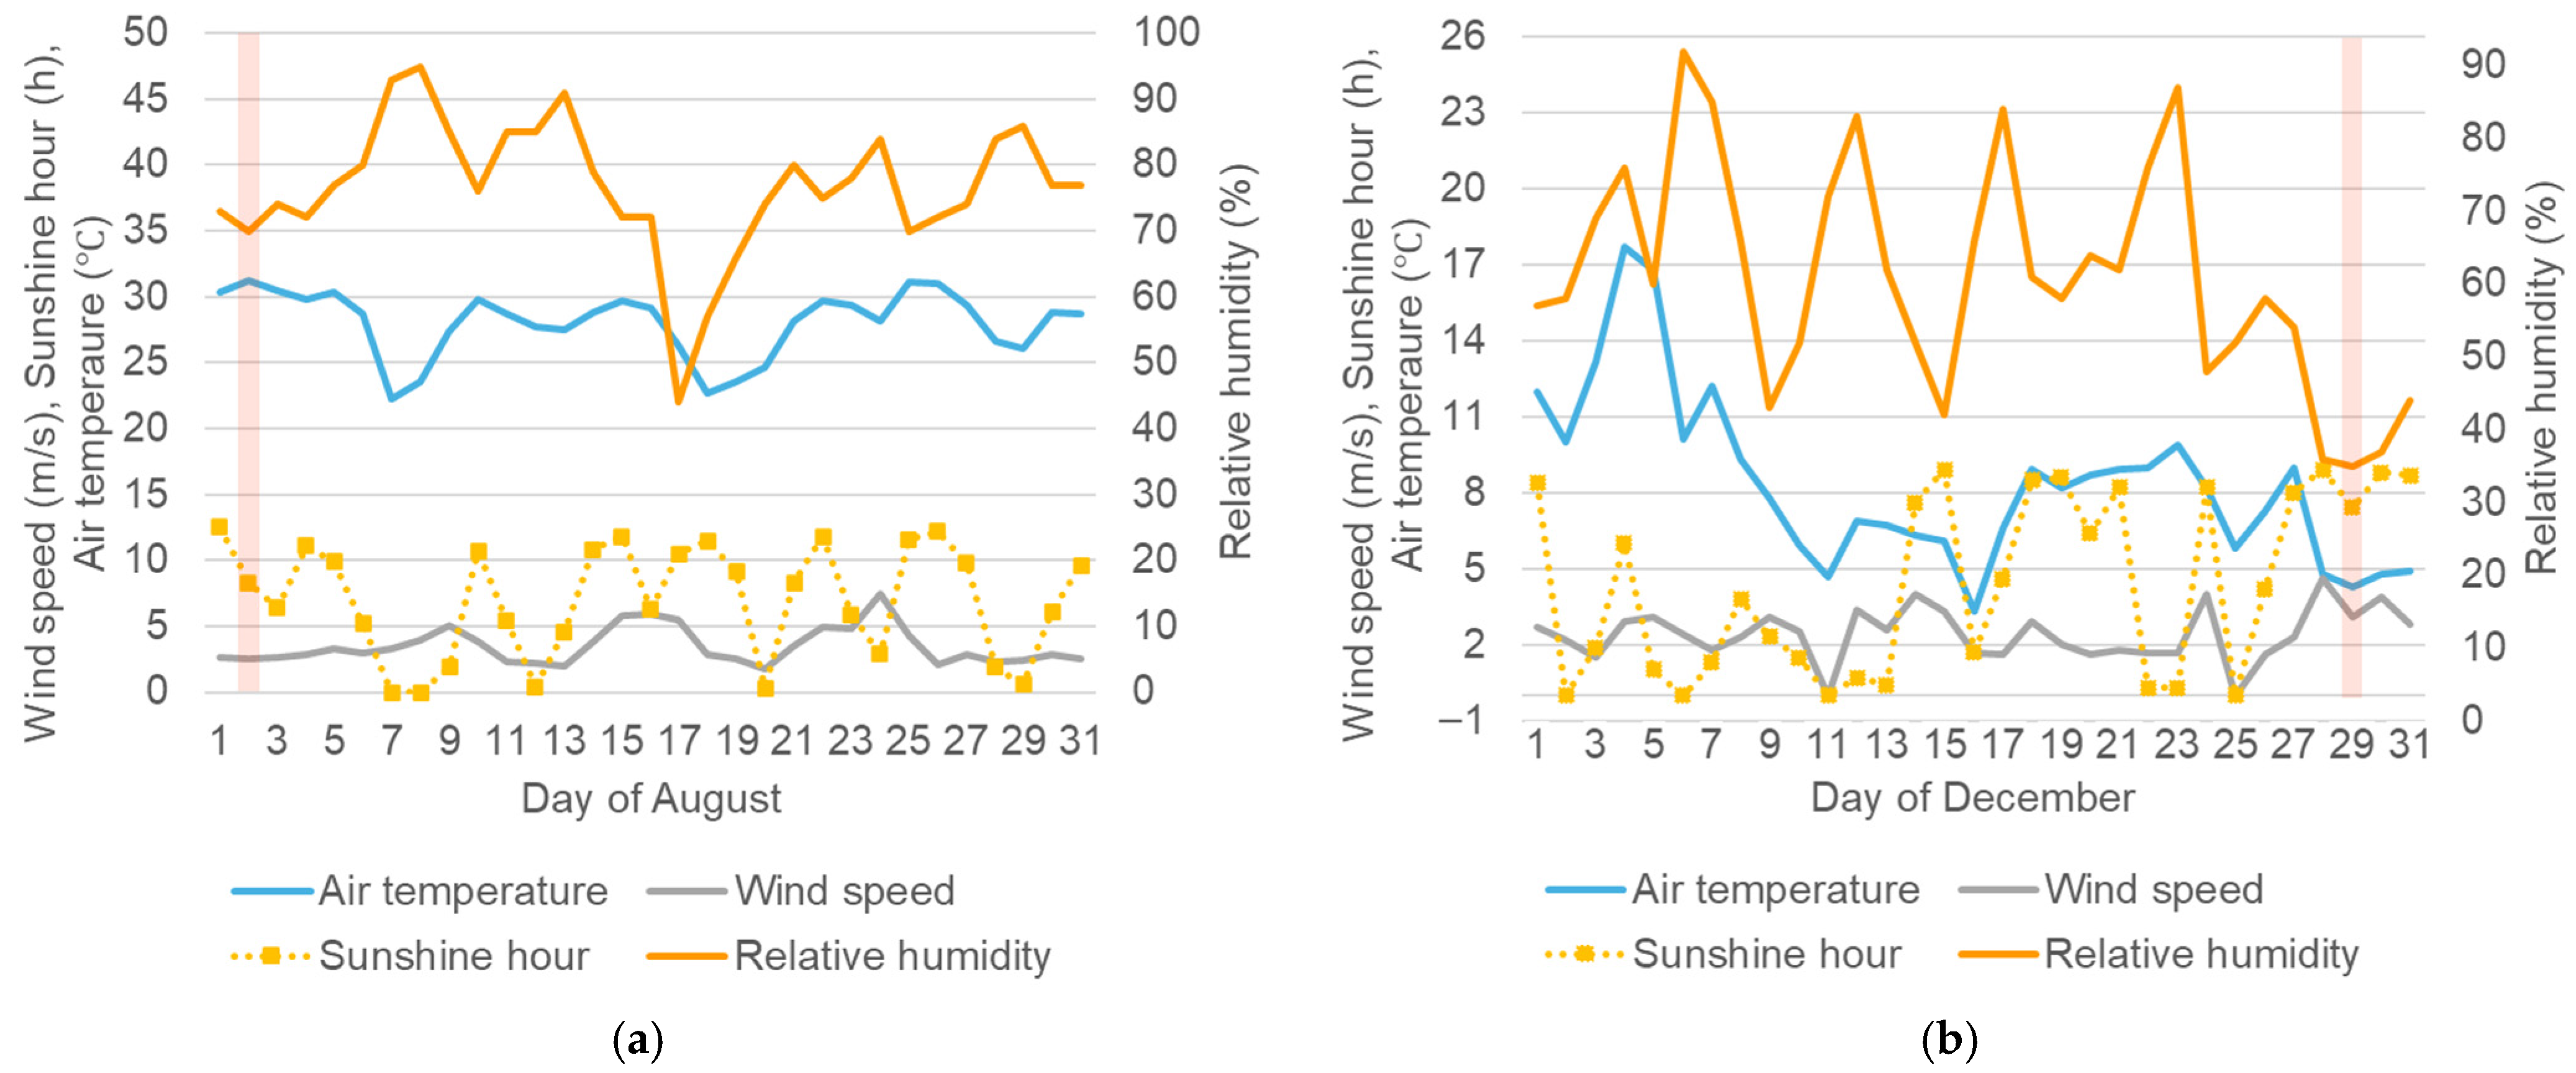
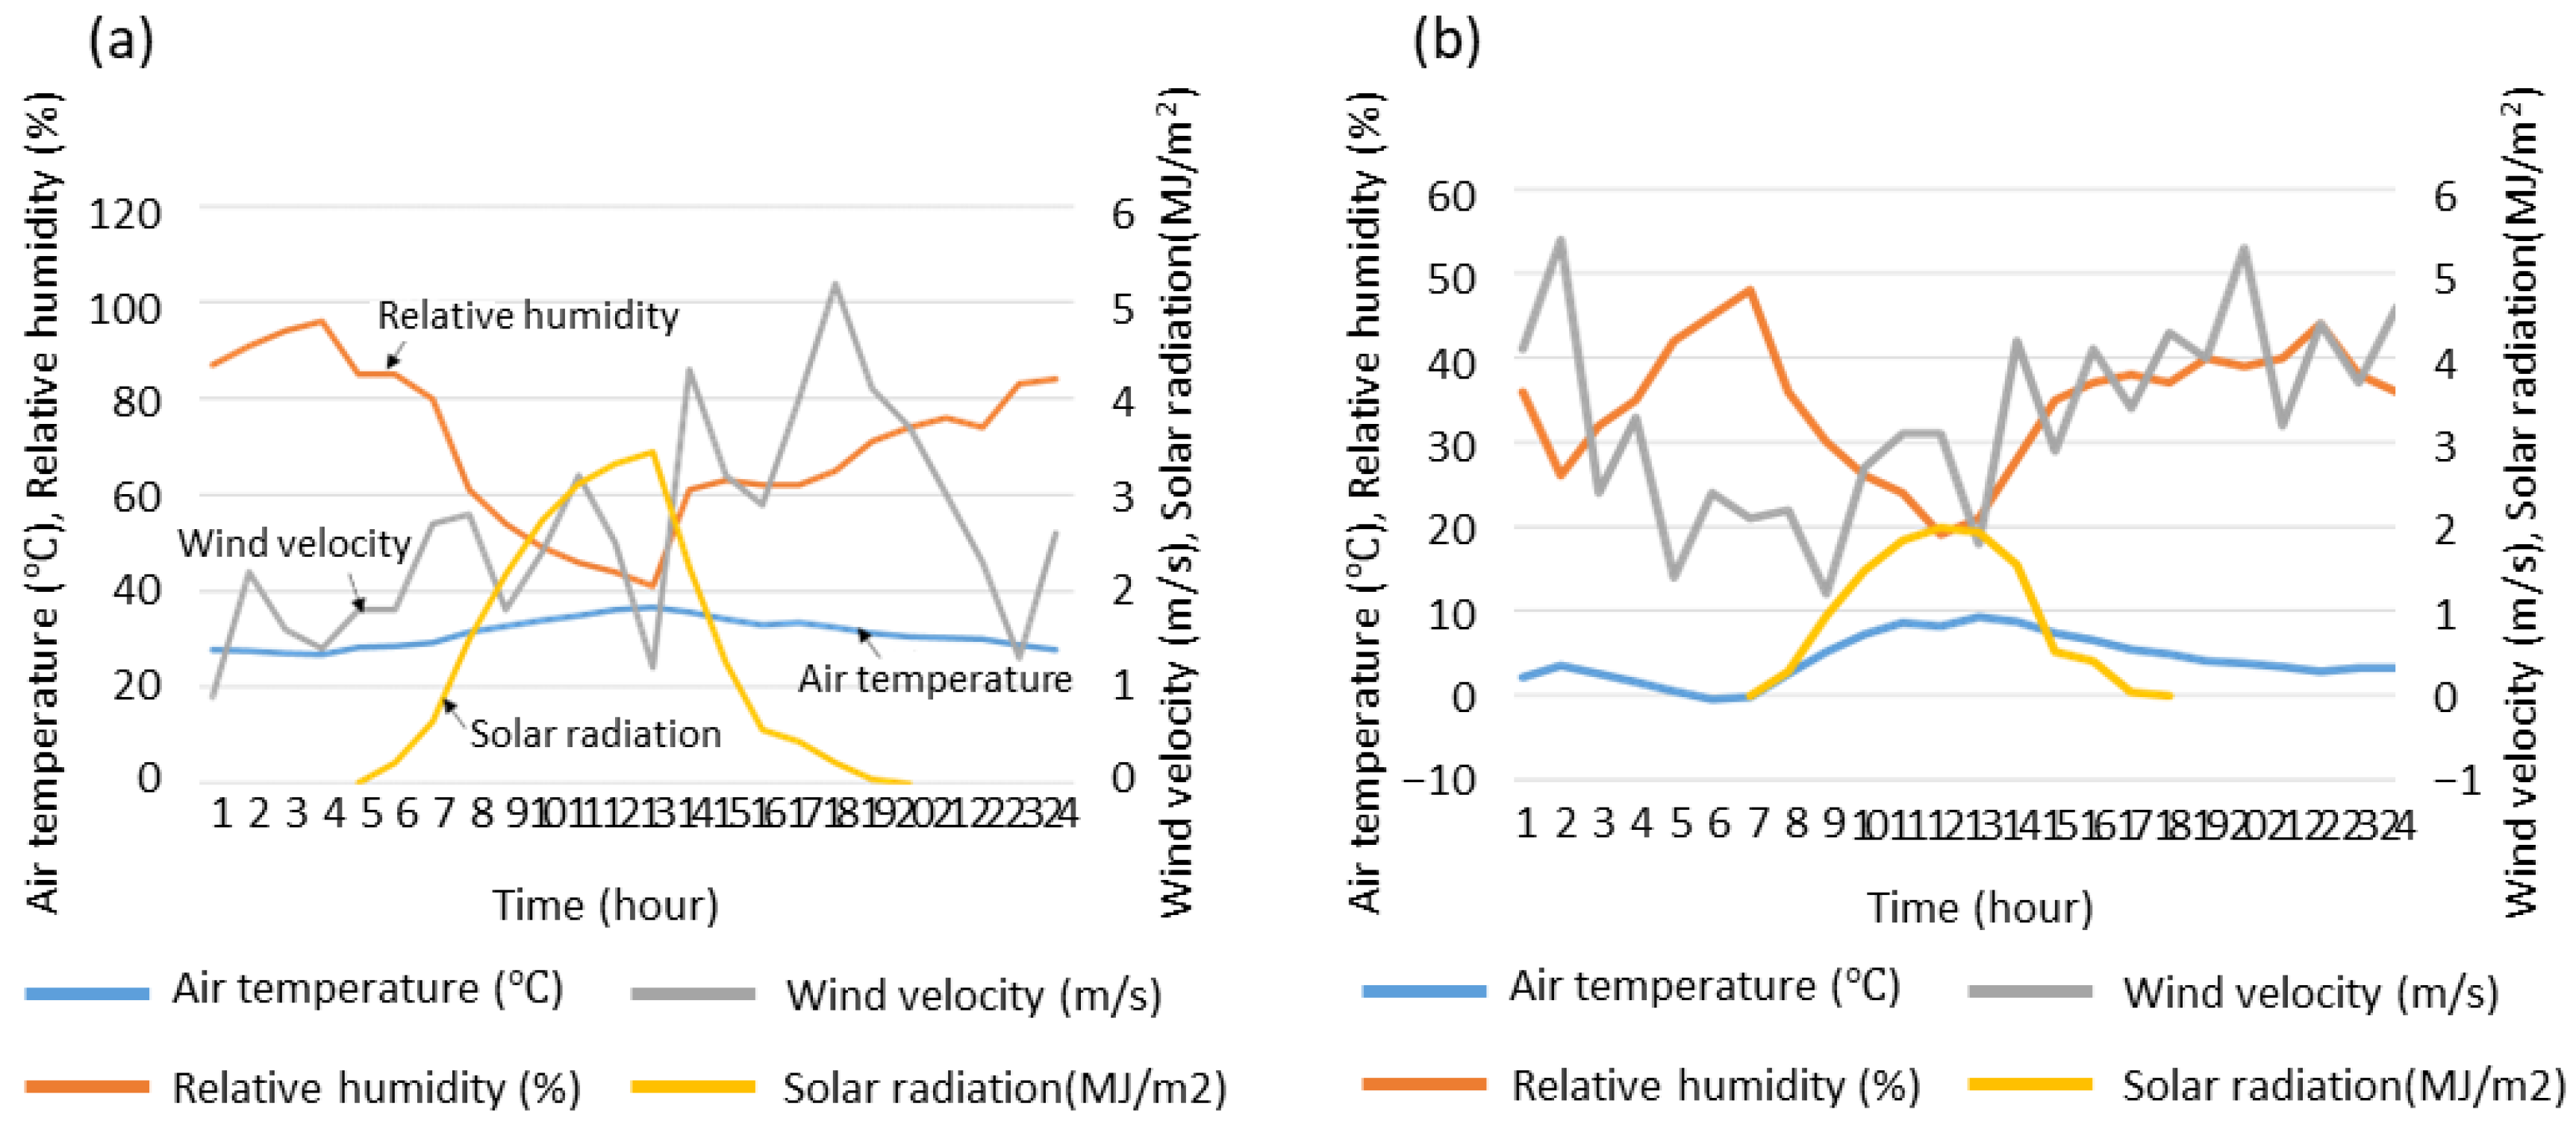
To evaluate the performance of the membrane structures under representative seasonal thermal stress, 2 August and 29 December 2018 were selected as simulation scenarios. These dates correspond to the peak thermal conditions within the typical summer (August) and winter (December) months, respectively. Rather than representing anomalous outliers, statistical validation confirms these days are representative (Table A4, Appendix B): the Z-scores for temperature (Summer: +1.58; Winter: −0.91) fall within the 95% confidence interval (±1.96 σ) of the seasonal distribution. Furthermore, wind speed and sunshine duration on both days are consistent with monthly averages (Figure A3, Appendix B), ensuring stable synoptic conditions. Cross-referencing with decadal climate data (2016–2025; Table A5) further verifies that these conditions align with Tokyo’s long-term thermal trajectory. Therefore, the selected days provide statistically representative yet thermally critical scenarios for conservative performance evaluation. Meteorological data of these two days input into the simulation are presented in Figure 4.
Regarding the target times for performance evaluation, considering the noontime and nocturnal periods revealed the worst thermal comfort and highest health risk based on the in situ measurement results in previous research [3], 13:00 (for the summer day) and 02:00 (for the winter day) were selected, respectively. As shown in Figure 4, at 13:00 on 2 August 2018, air temperature and solar radiation reached their peaks, alongside the lowest daytime wind velocity. Conversely, 02:00 on December 29 was selected as the representative hour for the most severe winter thermal stress, characterized by near-minimum ambient temperature combined with peak wind velocity.

2.3.3. Simulation of Membrane Structure and Other Subjects

For numerical simulation, the membrane canopy was simplified as an arch structure with a fixed clearance height of 6 m. This height was selected to comply with the regulatory requirements for “pilotis-type open spaces” under Japan’s CDS, thereby maintaining its classification as an open public space without reducing FAR incentives (see Section 3.1 for further discussion). The thermophysical properties of the membrane structure were adopted from He et al. [14], as summarized in Table 1. The material exhibits predominantly diffuse reflectance, thereby reducing the risk of specular glare. Owing to its low mass and limited thermal inertia, thermal lag effects are negligible, so performance comparisons are conducted at representative hourly conditions.
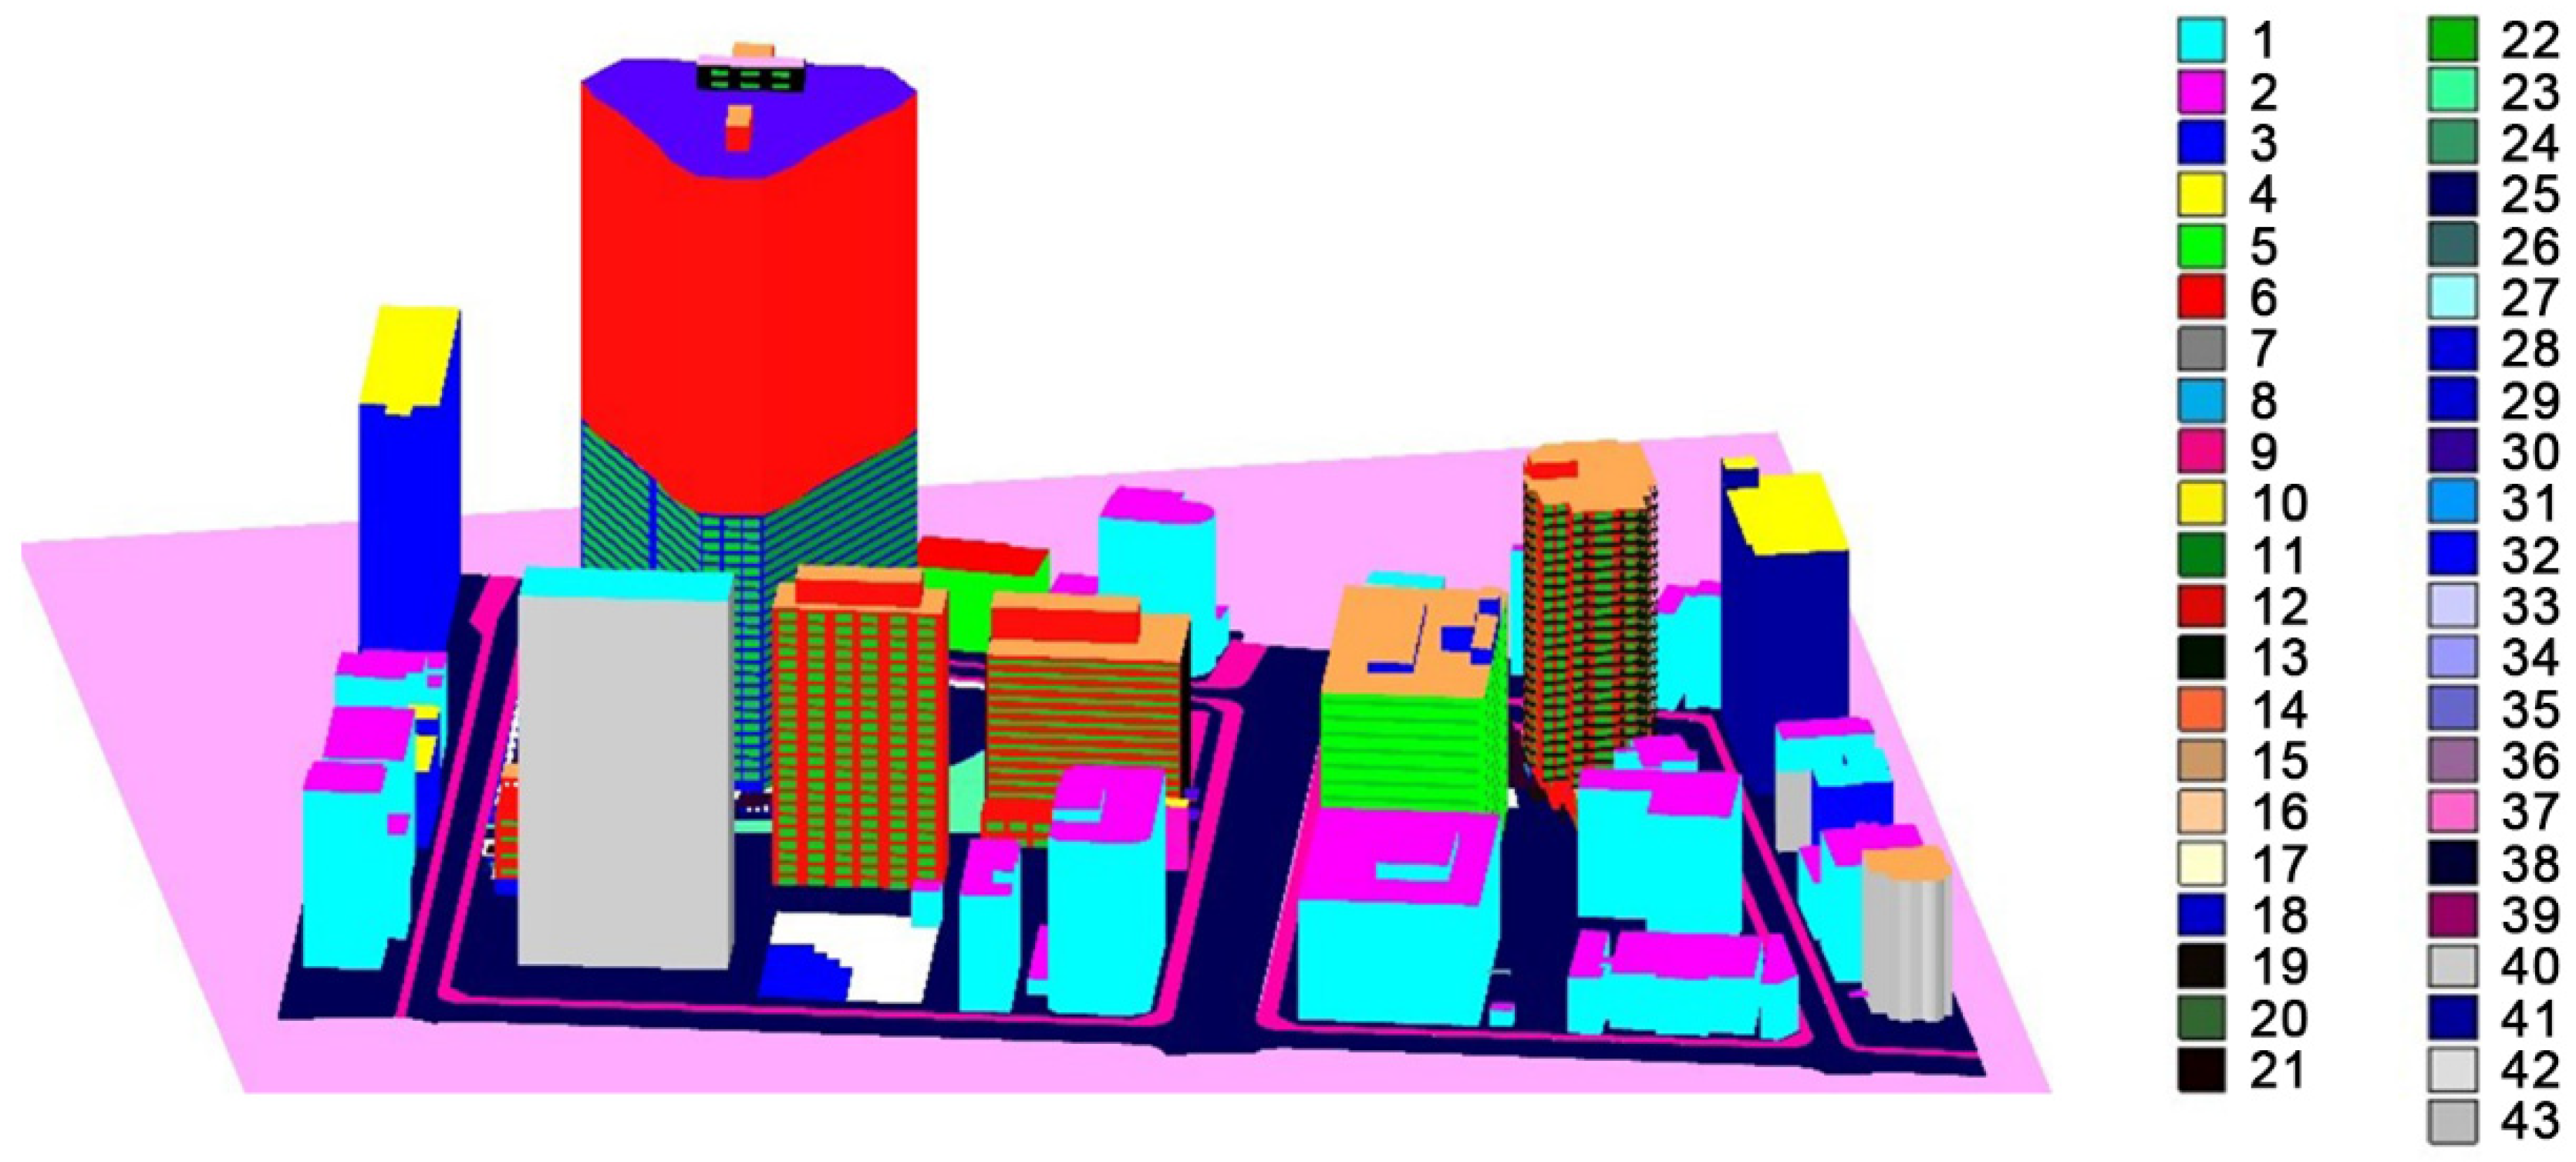
Based on in situ observations and official document reviews, 46 surface materials and their thermophysical properties (albedo, emissivity, heat capacity, and thermal conductivity) for buildings, pavements, and green spaces were incorporated into the model, the details of which are presented in Table A2 (Appendix A) and correspond to the numbered urban surface elements shown in Figure A2.

2.3.4. Simulation Validation

It should be noted that the in situ measurements referenced in this study [3] were not used for strict model validation, because the measurement and simulation days differ in meteorological conditions (Section 2.3.2). Instead, they served to identify the worst thermal periods as simulation target times and to provide empirical baseline indices for comparing pre- and post-intervention simulations, as detailed in Section 3.2.
The coupled model adopted in this study integrates the SEB model (for calculating thermal boundaries like surface energy fluxes) and CFD (for simulating microclimate parameters such as air temperature and wind field), and its accuracy has been fully validated in multiple previous studies [18,37,38,39] (Table A3 in Appendix A).
This coupled model exhibits high reliability in simulating different scenarios. For membrane structure semi-open spaces studied by Jiang He et al. [18], it accurately calculates membrane surface and ground temperatures—with a maximum simulation error of ≤2 °C for membrane surfaces, an average error of approximately 1.5 °C during the core period (8:00–18:00), and a relative error of ≤6.7% for ground temperature reduction after laying evaporative cooling pavement. It also reliably simulates microclimate parameters at the 1.2 m living height, with air temperature error ≤ 0.7 °C, wind speed error ≤ 0.3 m/s, and absolute humidity deviation within 0.5 g/kg (dry air) of measured values, while the simulated thermal comfort index (SET*) aligns with measured thermal environment trends.
For high-rise building shaded areas [38], the model effectively reproduces low-temperature microclimates and canyon airflow characteristics. The model predicts surface temperatures with an accuracy within 3 °C for core underlying surfaces and ≤2 °C for building facades; the coefficient of determination (r2) between simulated wind speeds and benchmark data is >0.85, with a mean absolute error (MAE) < 0.4 m/s. When parameters like surface reflectivity and thermal conductivity fluctuate by ±10%, the simulated air temperature changes by ≤0.8 °C, suggesting the robustness of the model.
In summary, the SEB-CFD coupled model, built on heat transfer mechanisms and empirical equations derived from extensive field measurements and wind tunnel experiments, has been experimentally validated for accuracy across membrane structure, high-rise building, and urban canyon scenarios. Its simulation errors for key parameters (surface temperature, air temperature, wind speed) are within engineering application thresholds, providing a reliable basis for subsequent simulations of the wind-thermal environment contrast before and after adding membrane structures near high-rise buildings.

2.4. Evaluation Indices for Thermal Comfort and Heat-Related Illness Risk

2.4.1. Mean Radiant Temperature (MRT)

As an important indicator of thermal comfort, MRT was calculated based on the measured and simulated data. Using measured and simulated longwave and shortwave radiation for six directions, Ssr, the absorbed radiation by human body, is calculated following Equation (1) assuming the human body is represented by a standard standing model (cylindrically approximated) [40].
s s r [ W / m 2 ] = i = 1 6 W i · a k · K i [ W / m 2 ] + a l · L i [ W / m 2 ]
where K i and L i are respectively shortwave and longwave radiation for surface i of the cylindrical model, a k   (=0.66) and a l   (=0.97) are respectively the absorbance of human body to shortwave and longwave radiation, and W i is the weight for direction, which is usually 0.06 for the top and bottom and 0.22 for the other four sides (left, right, forward, backward). Based on the calculated Ssr, the MRT can be estimated using the following:
t m r t   [ ° C ] = S s r [ W / m 2 ] ε p · σ   [ W / ( m 2 K 4 ) ] 0.25 273.2 ,
where t m r t   is MRT, ε p is the emissivity of human body with clothes, and σ is Stefan-Boltzmann constant which value is approximately 5.67 × 10⁻⁸. Hence, Equations (1) and (2) are used to calculate MRT based on mobile measurement results.

2.4.2. Standard Effective Temperature* (SET*)

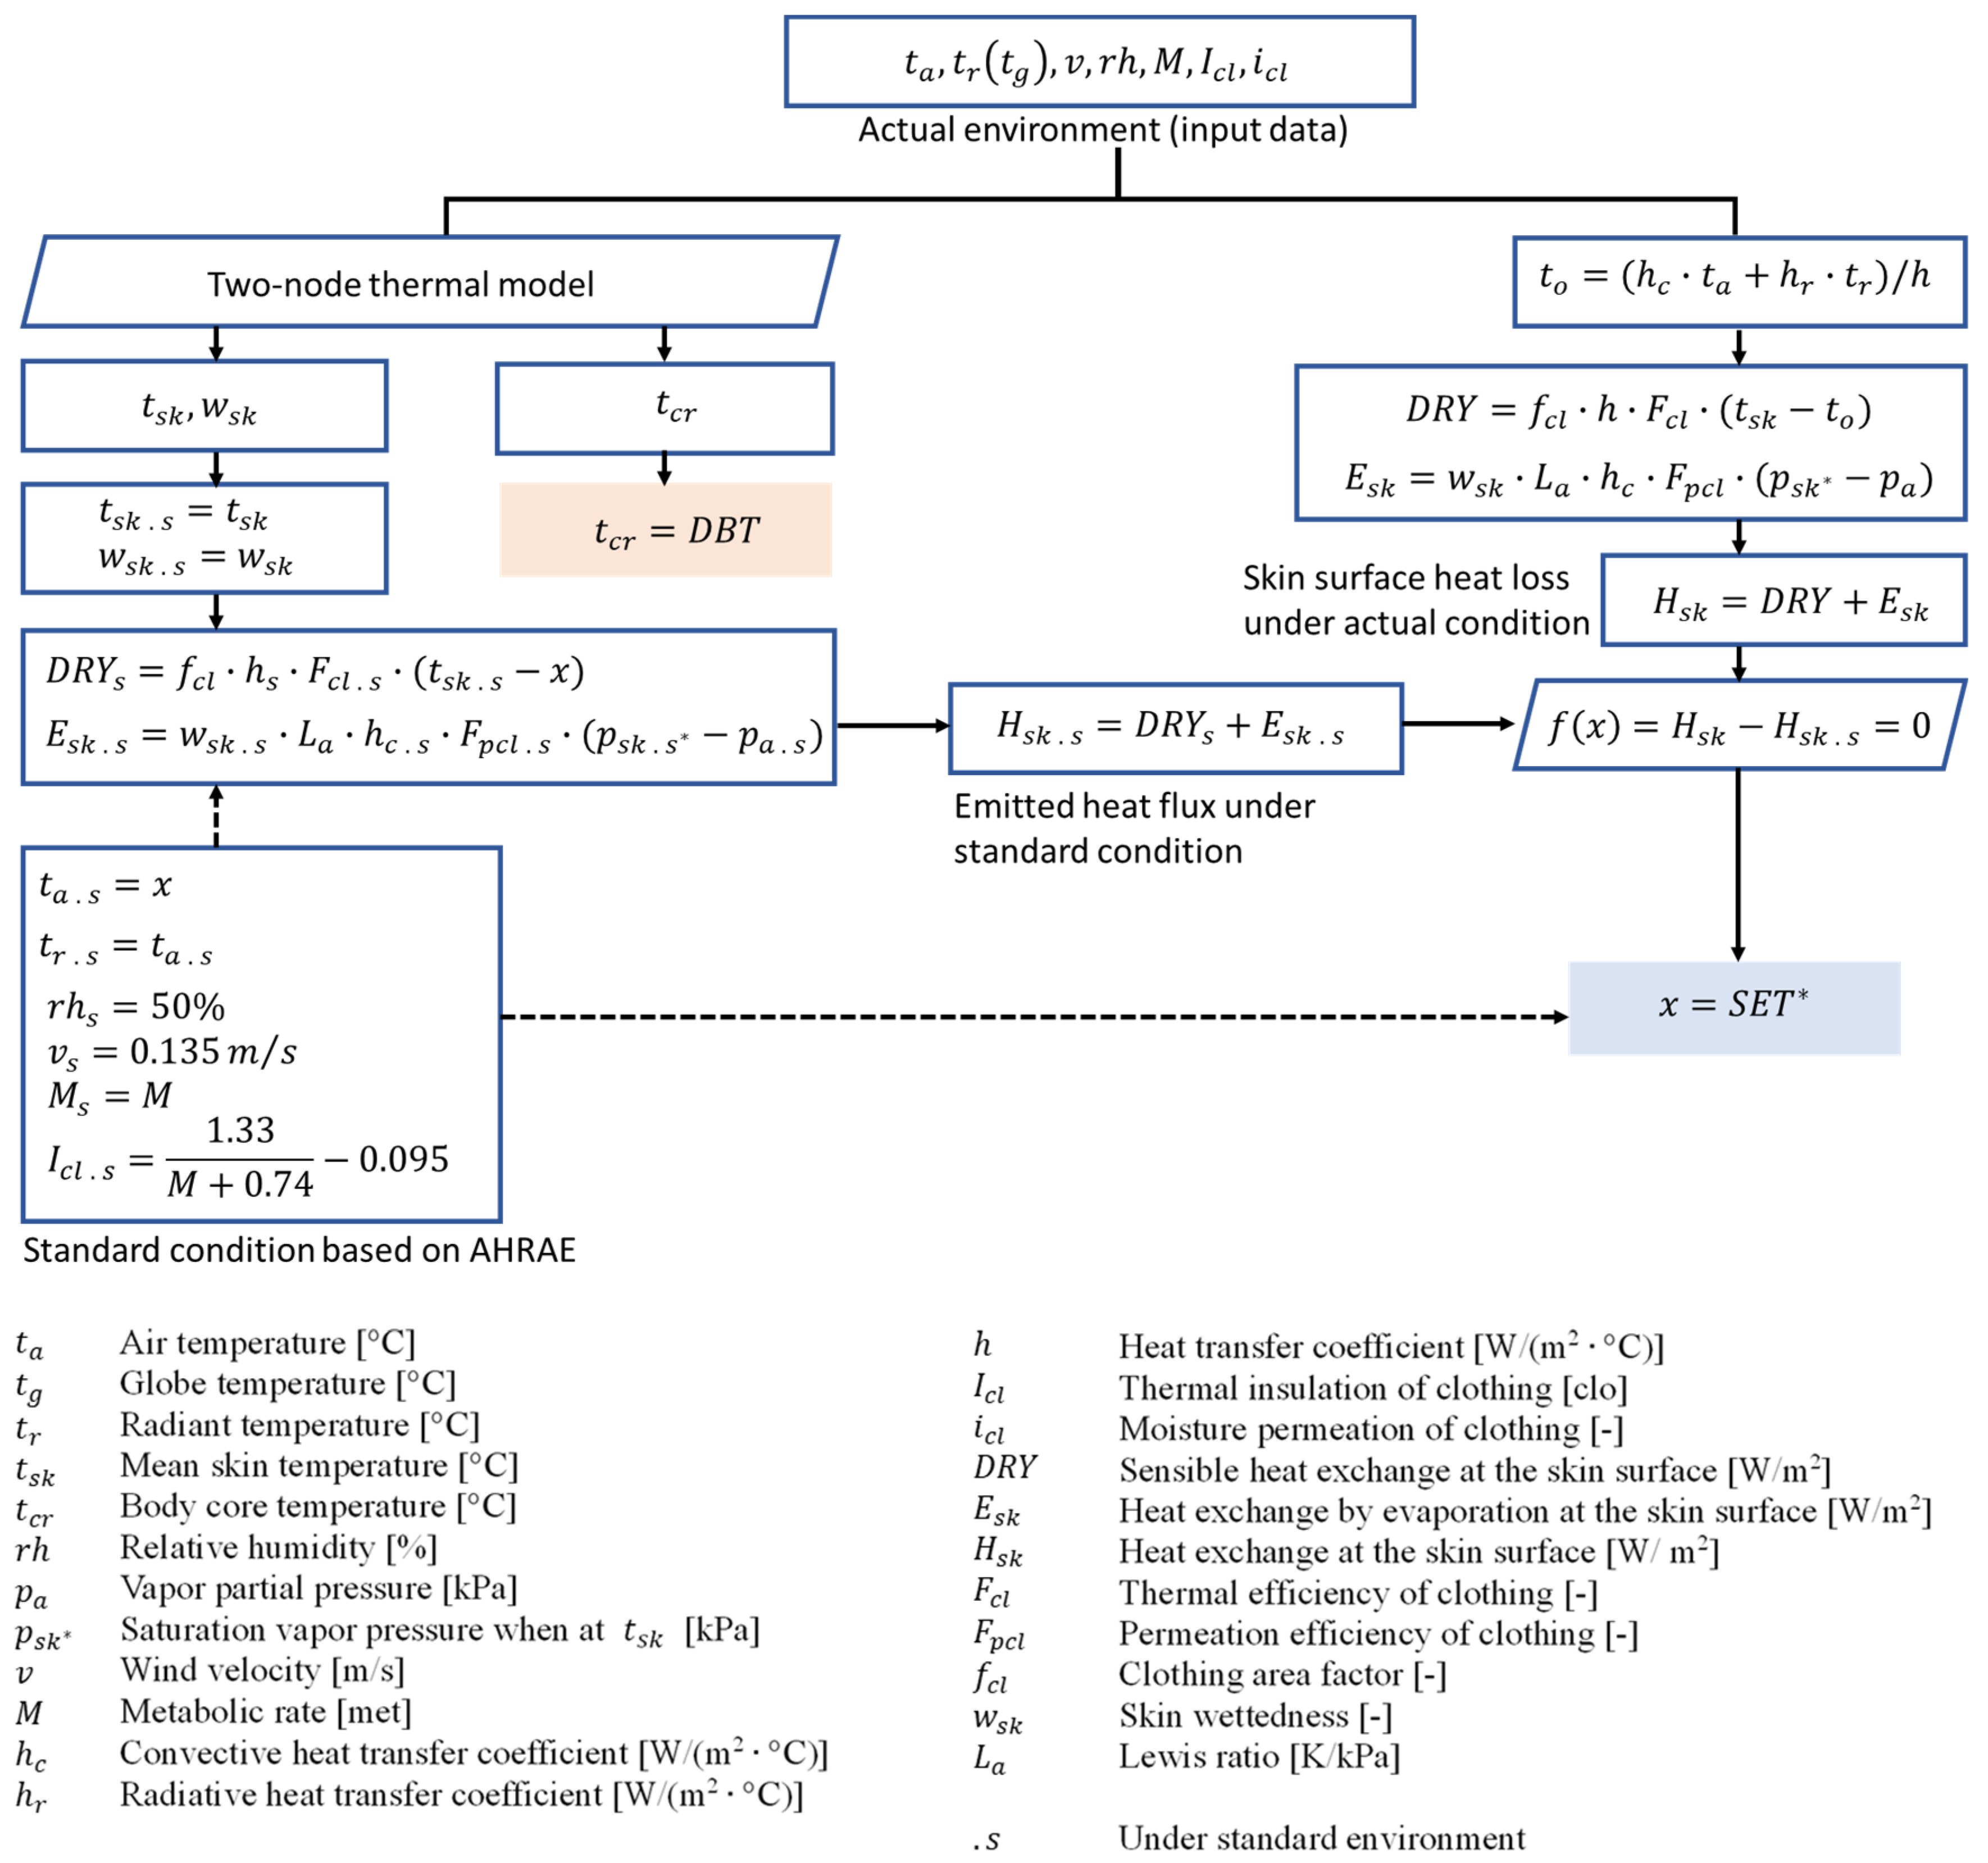
SET* is calculated based on the new effective temperature (ET*). SET* represents the air temperature of a standard environment that would produce the same heat loss from the human body as the actual environment, as defined by the American Society of Heating, Refrigerating and Air-Conditioning Engineers (ASHRAE): uniform distribution, air temperature = radiant temperature, relative humidity of 50%, airflow speed of 0.135 m/s, and standard clothing insulation = 1.33/(metabolic rate + 0.74) − 0.095. The physiological state of the human body is represented by mean skin temperature and clothing insulation [41]. The SET* is used to compare thermal environments under different conditions by comparing with those with the standard environment from ASHRAE.
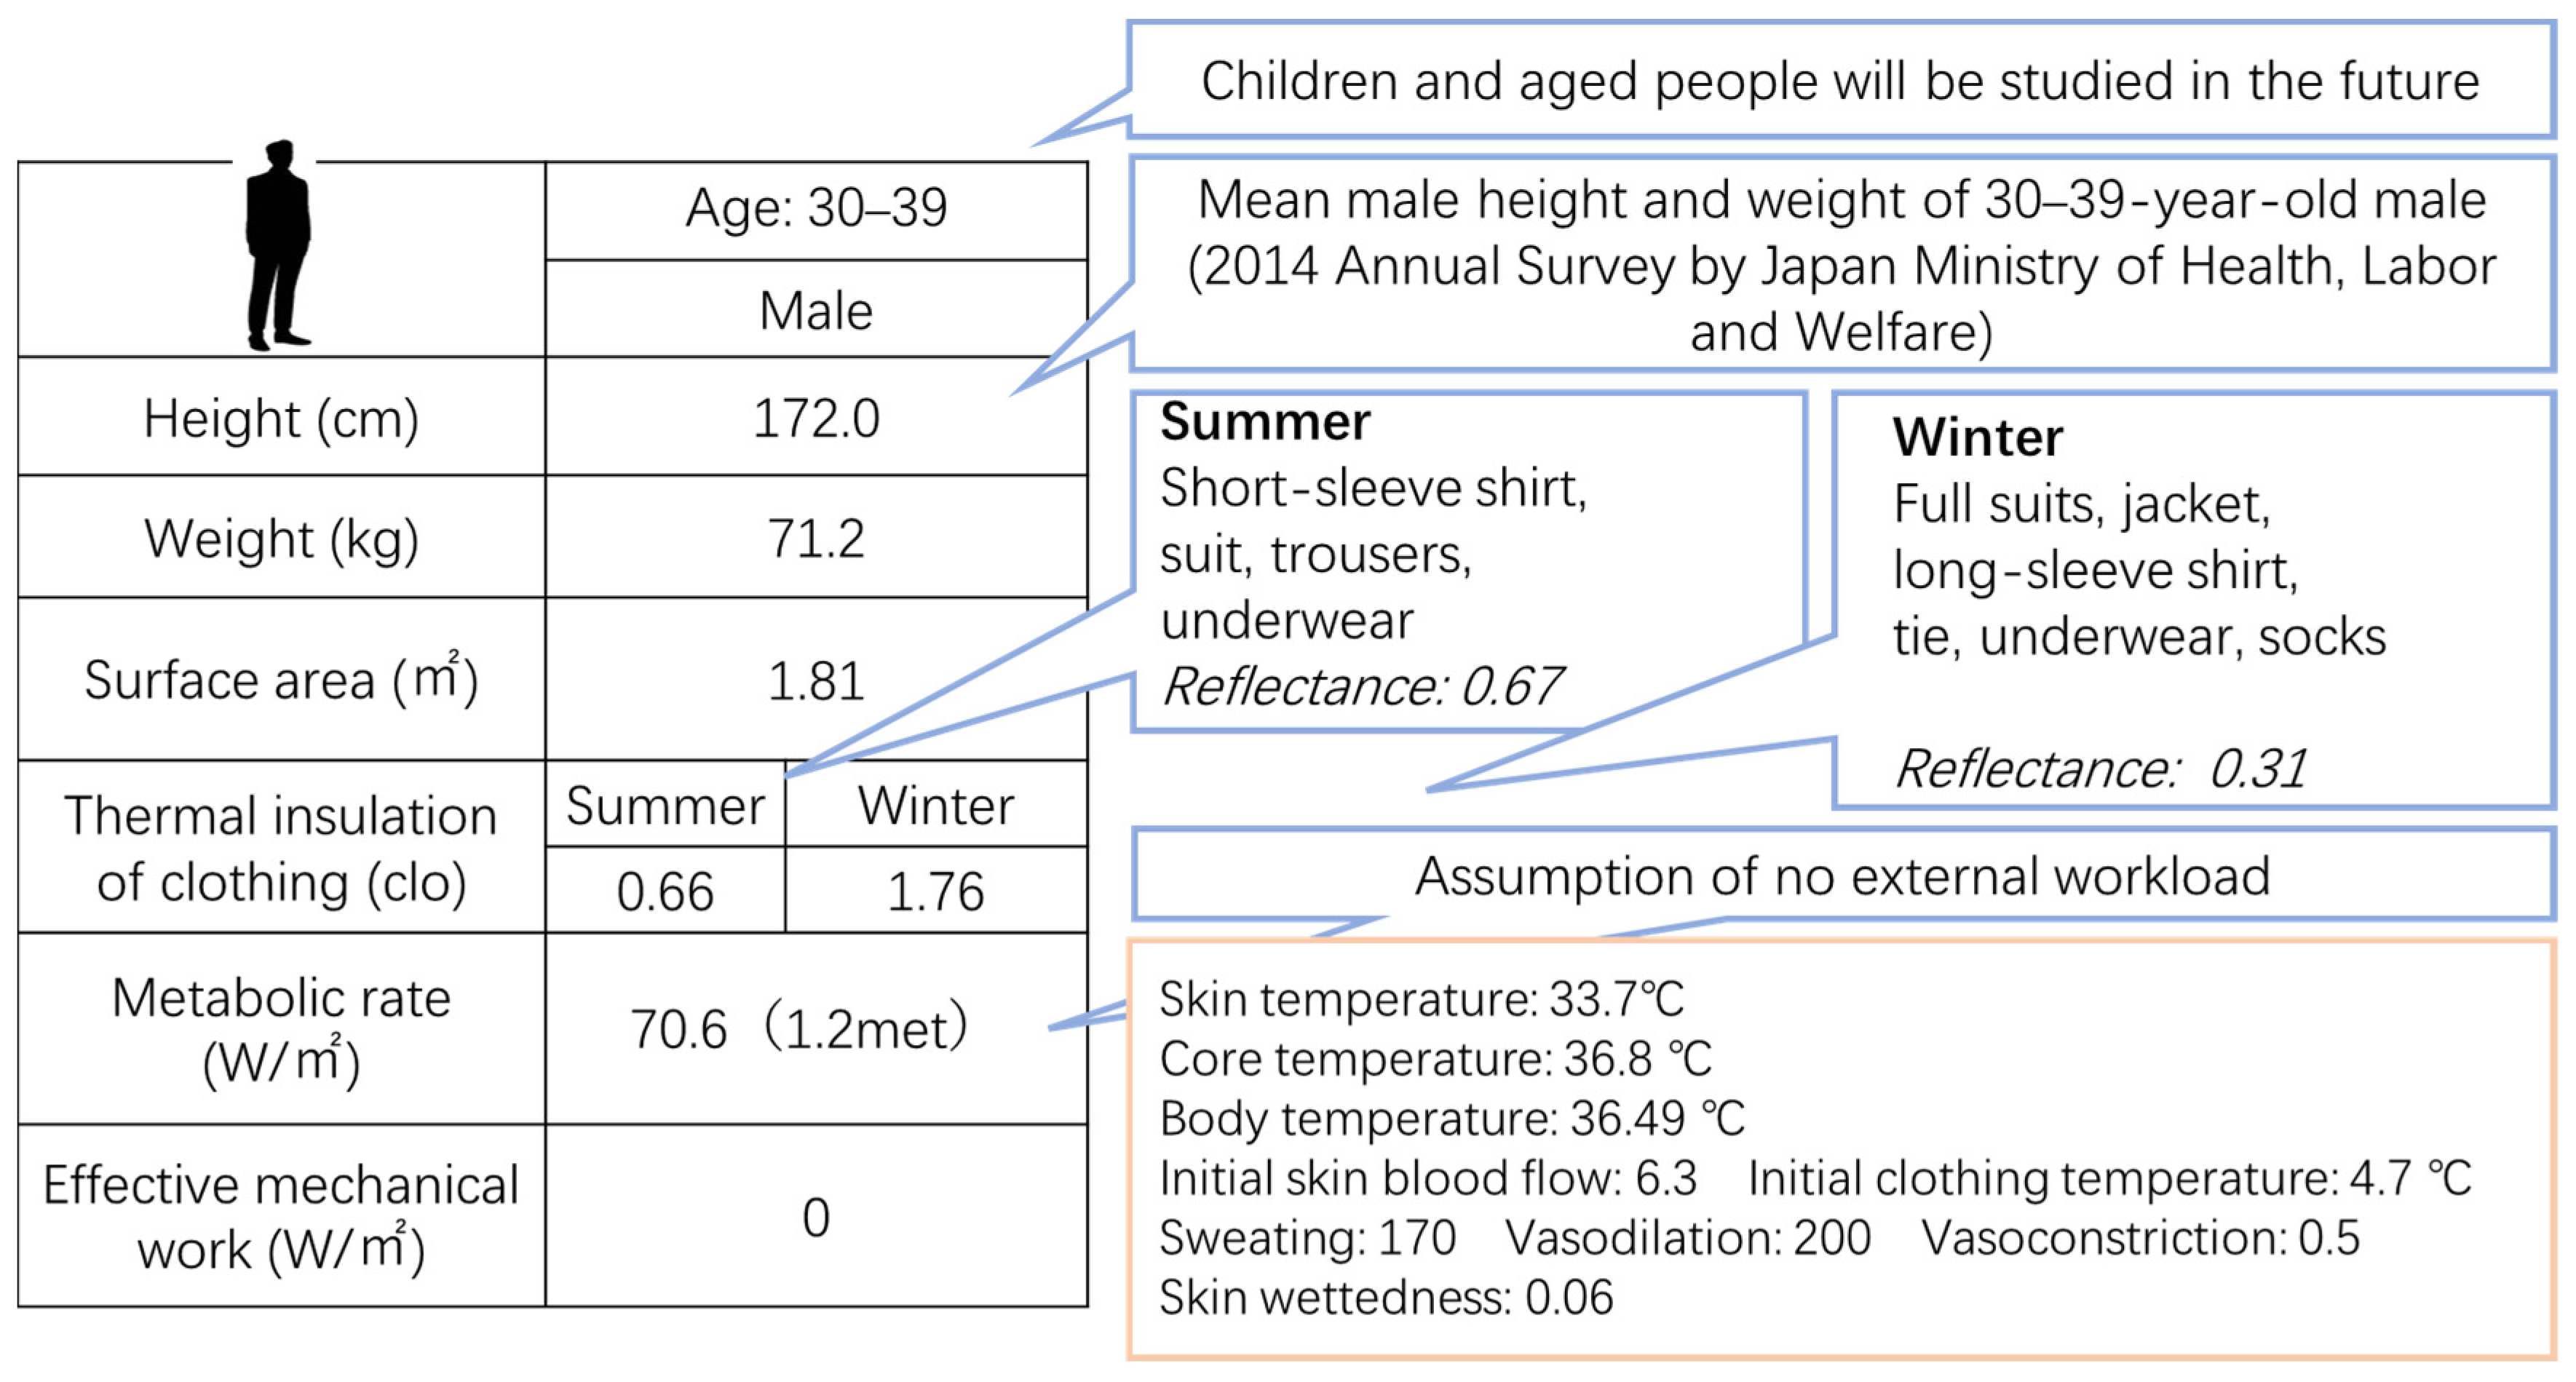
The SET* is calculated based on the two-node model [41], incorporating parameters including air temperature, relative humidity, air velocity, and MRT. The Gagge two-node thermal model integrates three modes of heat exchange between the human body and the environment: radiative heat transfer (with MRT as the core parameter), convective heat transfer (based on air velocity and air temperature), and evaporative heat transfer (combining ambient humidity and human sweating rate). Additionally, thermal regulation effects (e.g., vasoconstriction, vasodilation, and sweat secretion) are simulated using the defined human parameters (standing posture, metabolic heat production of 1.2 met; see Figure A4 in Appendix C). The SET* results are derived following the procedure and equations proposed by Ishii et al. [42], which aligns with the thermal environment equivalence calculation logic adopted in this study (refer to the flowchart in Figure A5 in Appendix C). Note that the two-node model exhibits low accuracy when the human body is in a high-metabolism state accompanied by heavy sweating [43]; thus, this study minimizes such errors by fixing the metabolic rate at 1.2 met, corresponding to light activity. Furthermore, SET* results are sensitive to clothing insulation: the clothing insulation (Icl) value of 1.76 clo used in this study, along with its specific derivation, is detailed in Appendix C.
Although SET* was originally developed as a thermal comfort index for indoor environments, the inclusion of MRT (a critical radiative heat parameter for outdoor environments) in the present calculations supports its validity for outdoor scenarios—existing studies have confirmed correlations between SET* and thermal sensation/comfort in outdoor settings [44,45]. Hence, SET* is suitable for evaluating the thermal environment of the outdoor and semi-outdoor space under the membrane structure in this study.
The comfort ranges of the urban outdoor environment regarding SET* have been explored. The result of Ishii et al. [46] demonstrated that the upper limit of outdoor environment comfort regarding SET* for Japanese people is about 27–28 °C. In addition, in the research of Kuwabara et al. [47] aimed to clarify the correlation between the SET* and thermal sensation and comfort, results of the summer and winter experiment showed that nearly 80% of the people do not feel unsatisfied when the SET* is within 20–25 °C in terms of the thermal comfort, and the same results were also revealed as the neutral temperature range regarding the thermal sensation. Therefore, the thermal comfort range of SET* for outdoor environments is defined as 20–28 °C in this study.

2.4.3. Deep Body Temperature (DBT)

It is necessary to assess the health risk of the POPS when used as refuges during disasters triggered by extreme hot and cold environments. The evaluation index must be applicable to both thermal conditions. For this reason, wet bulb globe temperature (WBGT) and wind chill temperature (WCT), which are commonly used to assess heat stress in hot environments and to prevent frostbite and hypothermia in polar activities, respectively, are not suitable for this dual-purpose evaluation.
Accordingly, DBT was selected as the evaluation index to assess POPS for emergency refuge use. This choice is based on primary human body response mechanisms to external thermal conditions, as DBT can effectively quantify the health risks of both heatstroke and hypothermia.
Human body temperature consists of core and skin surface temperatures. DBT refers to the core temperature of natural body cavities (e.g., the abdomen and thorax), which is largely insulated from environmental fluctuations. Normally, DBT remains at approximately 37 °C, and even a few-degree deviation can have a significant impact on health. In this study, DBT is calculated using the Gagge two-node thermal model, as detailed in Figure A5 in Appendix C.
Hypothermia occurs when DBT drops below 35 °C, impairing physical activity, cognitive function, and motor performance. Based on the international standard ISO 7933 [48] for evaluating hot environments, which considers healthy standard subjects rather than individual cases, a DBT above 38 °C is associated with a high health risk. Therefore, the upper and lower limits of DBT to ensure a low health risk are set at 38 °C and 35 °C, respectively.

2.4.4. Allowable Exposure Duration (AED)

AED, also termed duration limited exposure (DLE), refers to the limiting duration of staying under a given environment with certain clothing, without threatening physical and mental health. This would be important to decide the necessary disaster response. AED was thus selected as the evaluation index for extraordinary use, which is used to evaluate the time of no impact on health in the POPS.
Based on the heat budget of human body, the exposure limit in a certain environment can be estimated based on two standards, ISO 7933 [48] (for hot environment) and ISO 11079 [49] (for cold environment). Even though the application of AED to urban environment assessment is controversial [50], Sotama et al. [51] have confirmed that AED is able to be used as the evaluation index for disaster prevention in Japan.
The AED is usually calculated using predicted heat strain (PHS) model [52], which considers the human body as one nude, and predicts physiological parameters (sweat rate and rectal temperature) by minute (by hour for the cold environment) using the exponential formula of the time constant depending on the working conditions. The AED calculations in hot and cold environments are based on the study of Sakoi et al. [52], details of which are shown in Appendix D.

3. Results

3.1. Limitations and Institutional Positioning of Membrane Structures as POPS Solutions

Within the framework of Japan’s CDS, POPS are provided by developers in exchange for regulatory incentives, most notably additional FAR and relaxed building controls. As a result, any structural intervention introduced into POPS must be carefully assessed in relation to its legal classification, since it may affect the granted FAR incentives.
In principle, roofed structures are regarded as part of the “building” under the Building Standards Act. Therefore, directly adding a membrane structure to an existing POPS could increase the building area and consequently reduce the allowable FAR. Such an outcome would undermine the economic incentive mechanism embedded in the CDS and discourage developers from adopting the proposed shelter solution. Ensuring regulatory compatibility is thus a prerequisite for practical implementation.
To address this issue, the institutional positioning of the membrane structure was examined under the CDPG of Tokyo Metropolitan [20]. Atrium-type space and pilotis-type open space, as two potential classifications, were evaluated in terms of their compatibility with both regulatory requirements and environmental performance objectives.
The atrium classification requires a minimum vertical clearance of 30 m to maintain visual openness. This requirement is incompatible with the environmental objectives of the proposed membrane structure. A canopy installed at such a height would provide limited shading, rain protection, or wind mitigation, and would fail to function effectively as an emergency shelter. Moreover, atrium spaces are typically treated as interior voids within building envelopes, whereas POPS are predominantly exterior urban spaces. For these reasons, the atrium category was deemed unsuitable.
By contrast, the pilotis-type classification provides a feasible regulatory pathway. This category requires a minimum ceiling height of 6 m and a depth no less than twice the ceiling height. These requirements align with both institutional compliance and environmental performance needs. A clearance height of at least 6 m ensures that the membrane structure remains legally classified as an open public facility rather than additional enclosed building volume, thereby avoiding FAR reduction. Simultaneously, this height allows effective shading, wind mitigation, and spatial continuity with the adjacent high-rise context.
Accordingly, all membrane structures in this study were designed with a minimum clearance height of 6 m. This regulatory constraint was explicitly incorporated into the structural design and subsequent thermal simulations, ensuring that the proposed shelter solution is not only thermally effective but also legally compliant and economically feasible within Tokyo’s urban planning framework.
In summary, the primary limitation of applying membrane structures in POPS lies not in structural feasibility but in regulatory compatibility. By embedding institutional constraints into the environmental design process, this study bridged the gap between thermal performance optimization and real-world implementation.

3.2. Field Measurement Results

Detailed measurement results have been analyzed and discussed in previous work [3], with key summaries provided in Table A8 and Table A9 (Appendix E). In this study, the measurement results served two purposes. First, they were used to identify the time periods when the studied POPS exhibit the worst thermal environment in summer and winter, with these specific times being selected as the target times for simulating and evaluating the effect of the membrane structure proposal (see Section 2.3.2 for details). Second, the summer measurement-based thermal indices of the existing (unmodified) POPS provided an empirical benchmark for validating the simulated thermal environment before and after the membrane structure intervention.
Notably, although the measurements were conducted on 31 July 2018, the simulation adopted the representative peak summer scenario (2 August 2018) as defined in Section 2.3.2, enabling evaluation under a thermally critical yet representative condition. Both days occurred within the same late-July high-temperature period in Tokyo, indicating comparable synoptic conditions.

3.3. Design of Membrane Structure

Given the frequent occurrence of downwash wind in Minato Ward, Tokyo [4], the design of membrane structure canopies must simultaneously meet the dual goals of “thermal environment optimization” and “safety protection”. Compared to conventional canopy materials (e.g., aluminum/stainless steel metal sheets, glass), membrane structures are proven more suitable for POPS’ “combination of daily use and disaster response” needs, as verified by the following material performance comparison:
Metal canopies have no gaps for rainwater leakage, allowing their use even on canopies with gentle slopes [21]. They also offer high workability, enabling adaptation to curved canopy designs. However, according to Ogawa’s research [22], their medium-high solar absorptivity and low thermal emissivity lead to significant heat accumulation on sunny days: the surface temperature under metal canopies exceeds the ground temperature beneath by over 5 °C and the ambient air temperature by over 10 °C, creating a severe “heating effect” in the underlying space. Despite their strong aesthetic appeal, metal canopies thus pose notable challenges to the thermal environment of outdoor POPS.
Glass canopies are widely used in atrium designs and suit large-scale spaces. They utilize natural light to create energy-efficient environments, with extensive applications in cold regions requiring warmer microclimates. Nevertheless, they have critical limitations: sunlight shielding requires additional measures (e.g., installing washi paper or light-shielding roller blinds inside the glass), and durability issues persist—typhoon-induced glass ceiling collapses, for instance, may cause casualties [23], making them unsuitable for disaster-prone urban POPS.
In contrast, membrane structure canopies exhibit comprehensive advantages. Made of lightweight materials, they enable large-area open spaces, reduce construction costs, and only require auxiliary supports for reinforcement. Membrane structures may also offer economic advantages over metal and glass canopies, including lower raw material and construction costs due to their lightweight properties and relatively low long-term maintenance requirements [25,26]. Similar to glass, membrane materials are translucent, supporting natural light utilization and lowering lighting costs; additionally, high-strength, durable membrane variants meet diverse specification requirements. According to [22], ordinary membrane materials have a solar absorptivity of approximately 14%: for those with around 10% light transmittance, the surface temperature under the canopy is only 2–3 °C higher than the ground and about 5 °C higher than the outdoor air temperature, which is markedly lower than that under metal canopies. A minor limitation is uneven brightness in the space due to light transmission, which requires focused optimization during the design process (e.g., adjusting membrane translucency or adding diffusing layers).
In summary, canopy material selection must comprehensively consider translucency, large-area coverage capability, and inherent thermal properties. From the perspective of improving comfort and reducing health risks, membrane materials outperform metal and glass. They also align with the requirements of “creating large-scale spaces” while offering low cost and high durability, making them the optimal choice for semi-outdoor POPS canopies.
Furthermore, the combined design of membrane structure canopies and arcades helps mitigate the sense of visual oppression caused by high-rise buildings [6]. This not only indirectly increases citizens’ daily usage of POPS but also strengthens their recognition of these spaces as disaster shelters, thereby laying a crucial foundation for rapid evacuation response.
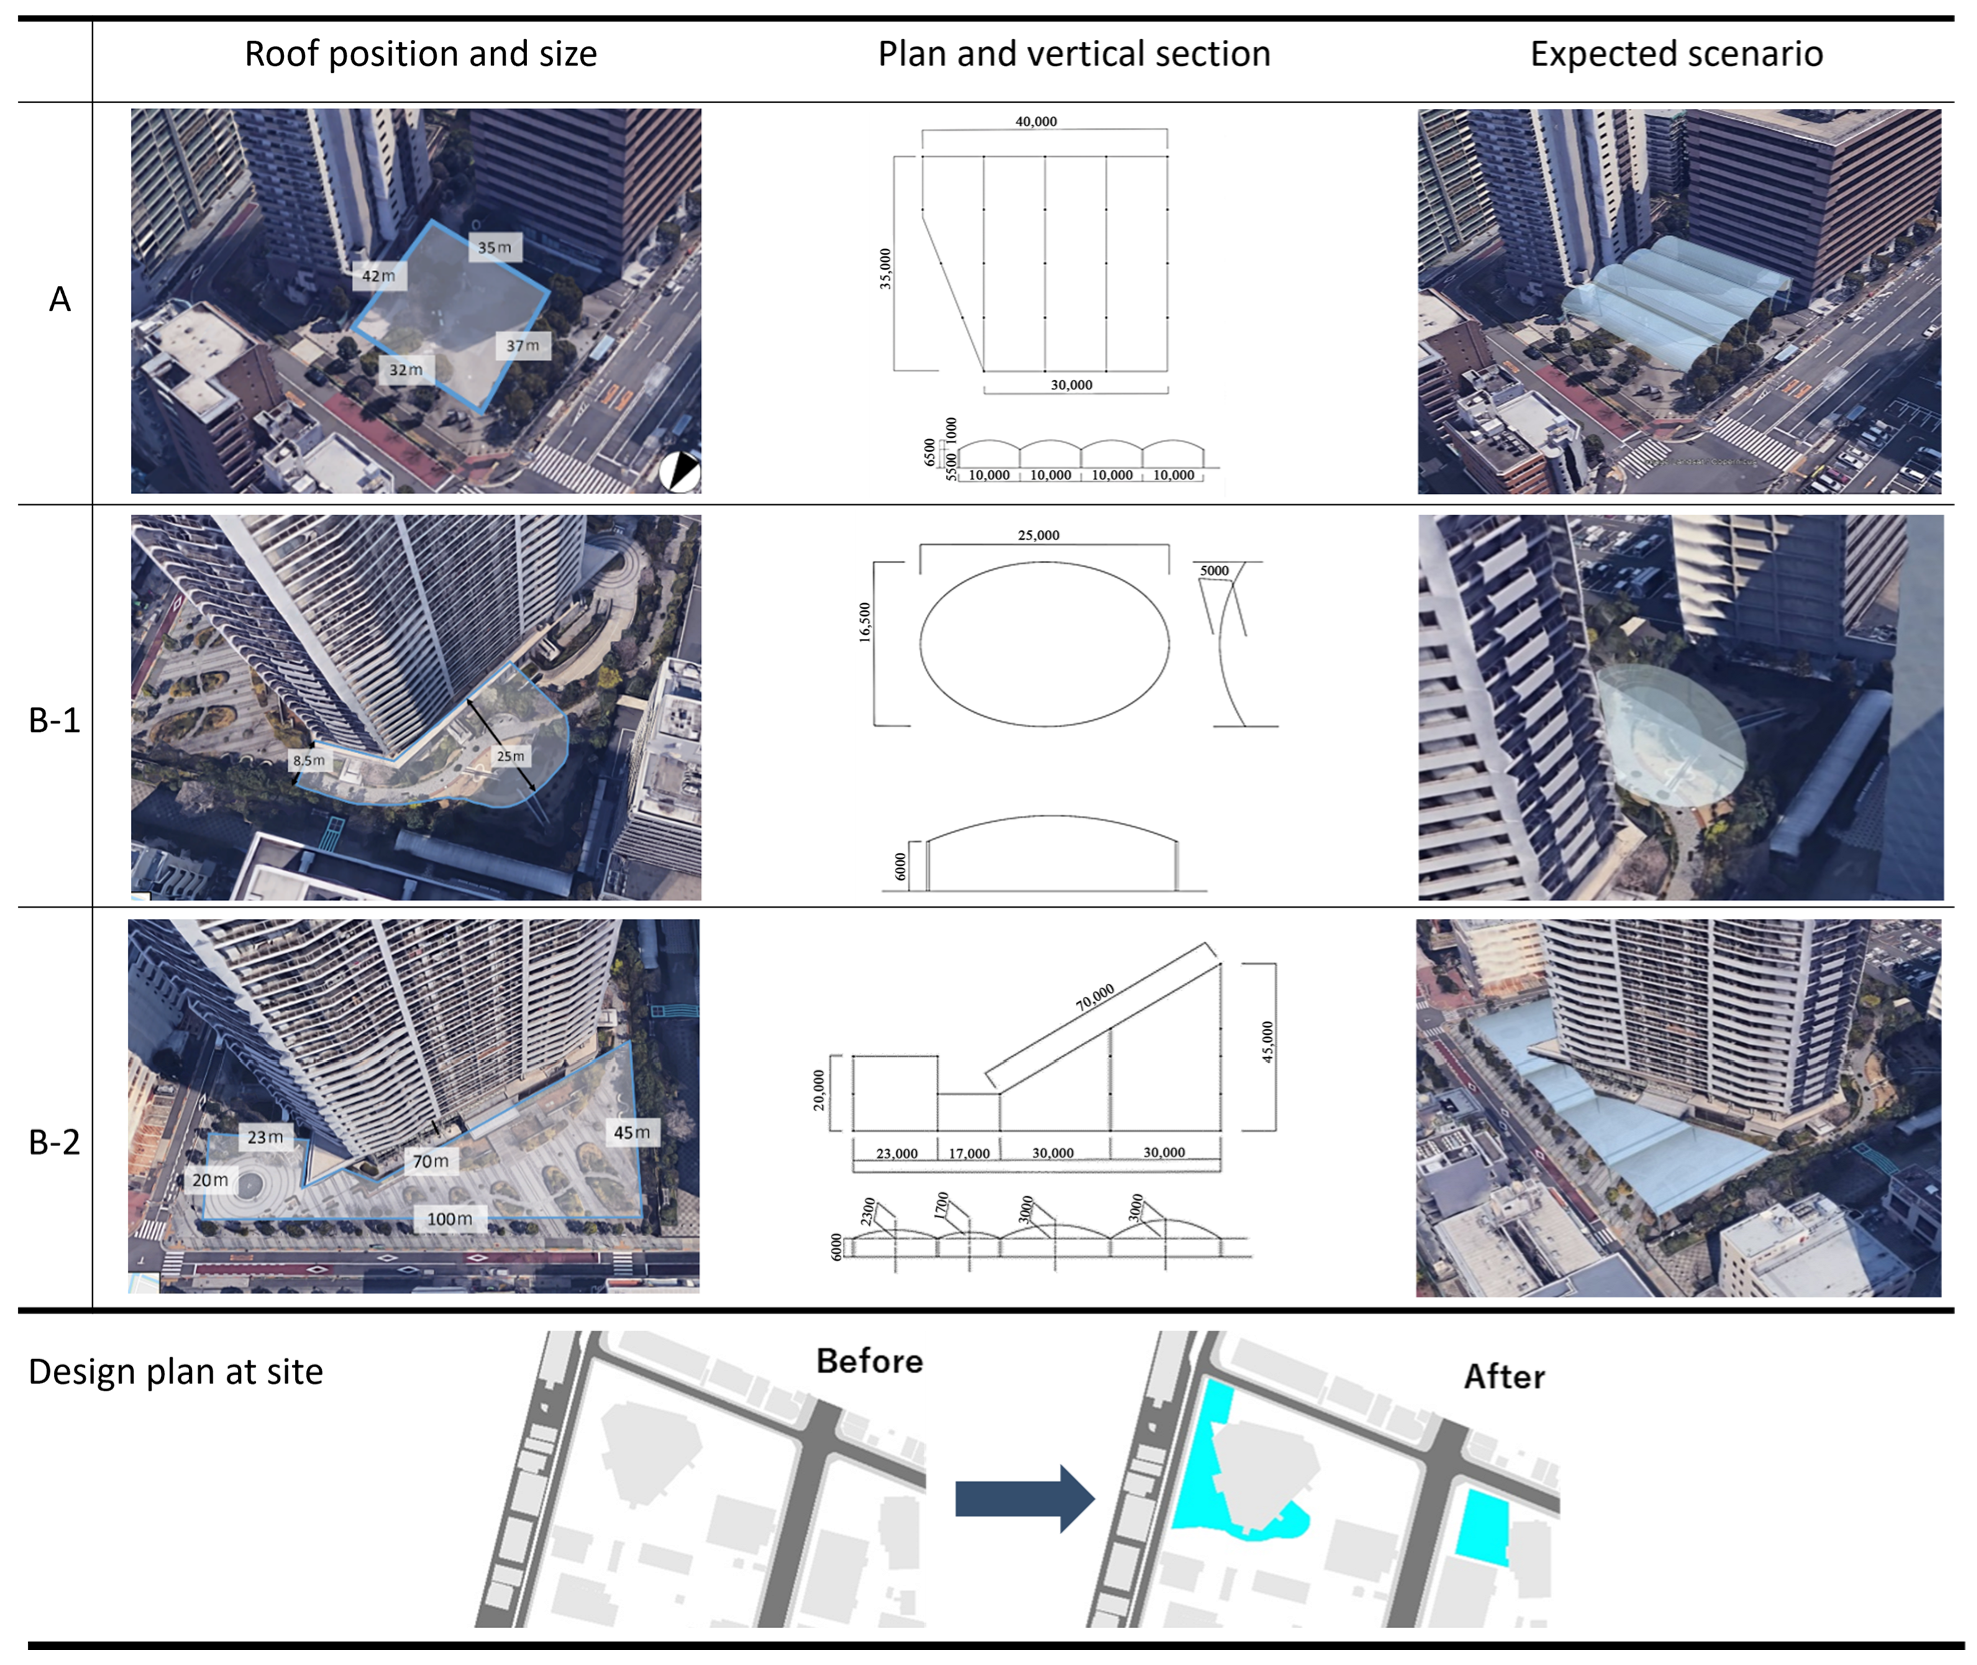
Based on the above principles, three membrane structure configurations were developed for POPS A, B-1, and B-2, as illustrated in Figure 5. The configurations were determined primarily by the spatial geometry of each POPS and its relationship with surrounding buildings. Their spans and vertical heights (from the arch horizontal plane to the vertex) were determined according to the entrance and eave heights of the POPS-attached buildings, ensuring spatial compatibility with the surrounding built environment. Consequently, different structural geometries (arch or dome configurations) were adopted to accommodate the spatial scale and layout of each POPS. The plan layouts were optimized to maximize coverage of the usable POPS area, thereby increasing potential shelter capacity while maintaining circulation and visual openness. Additionally, in line with the institutional constraints outlined in Section 3.1, a core design guideline was enforced: all membrane structures were required to be installed at a height of no less than 6 m to meet the ceiling height requirement for “pilotis and similar open spaces” and avoid compromising regulatory compliance.

3.4. Simulation Results

3.4.1. Summer

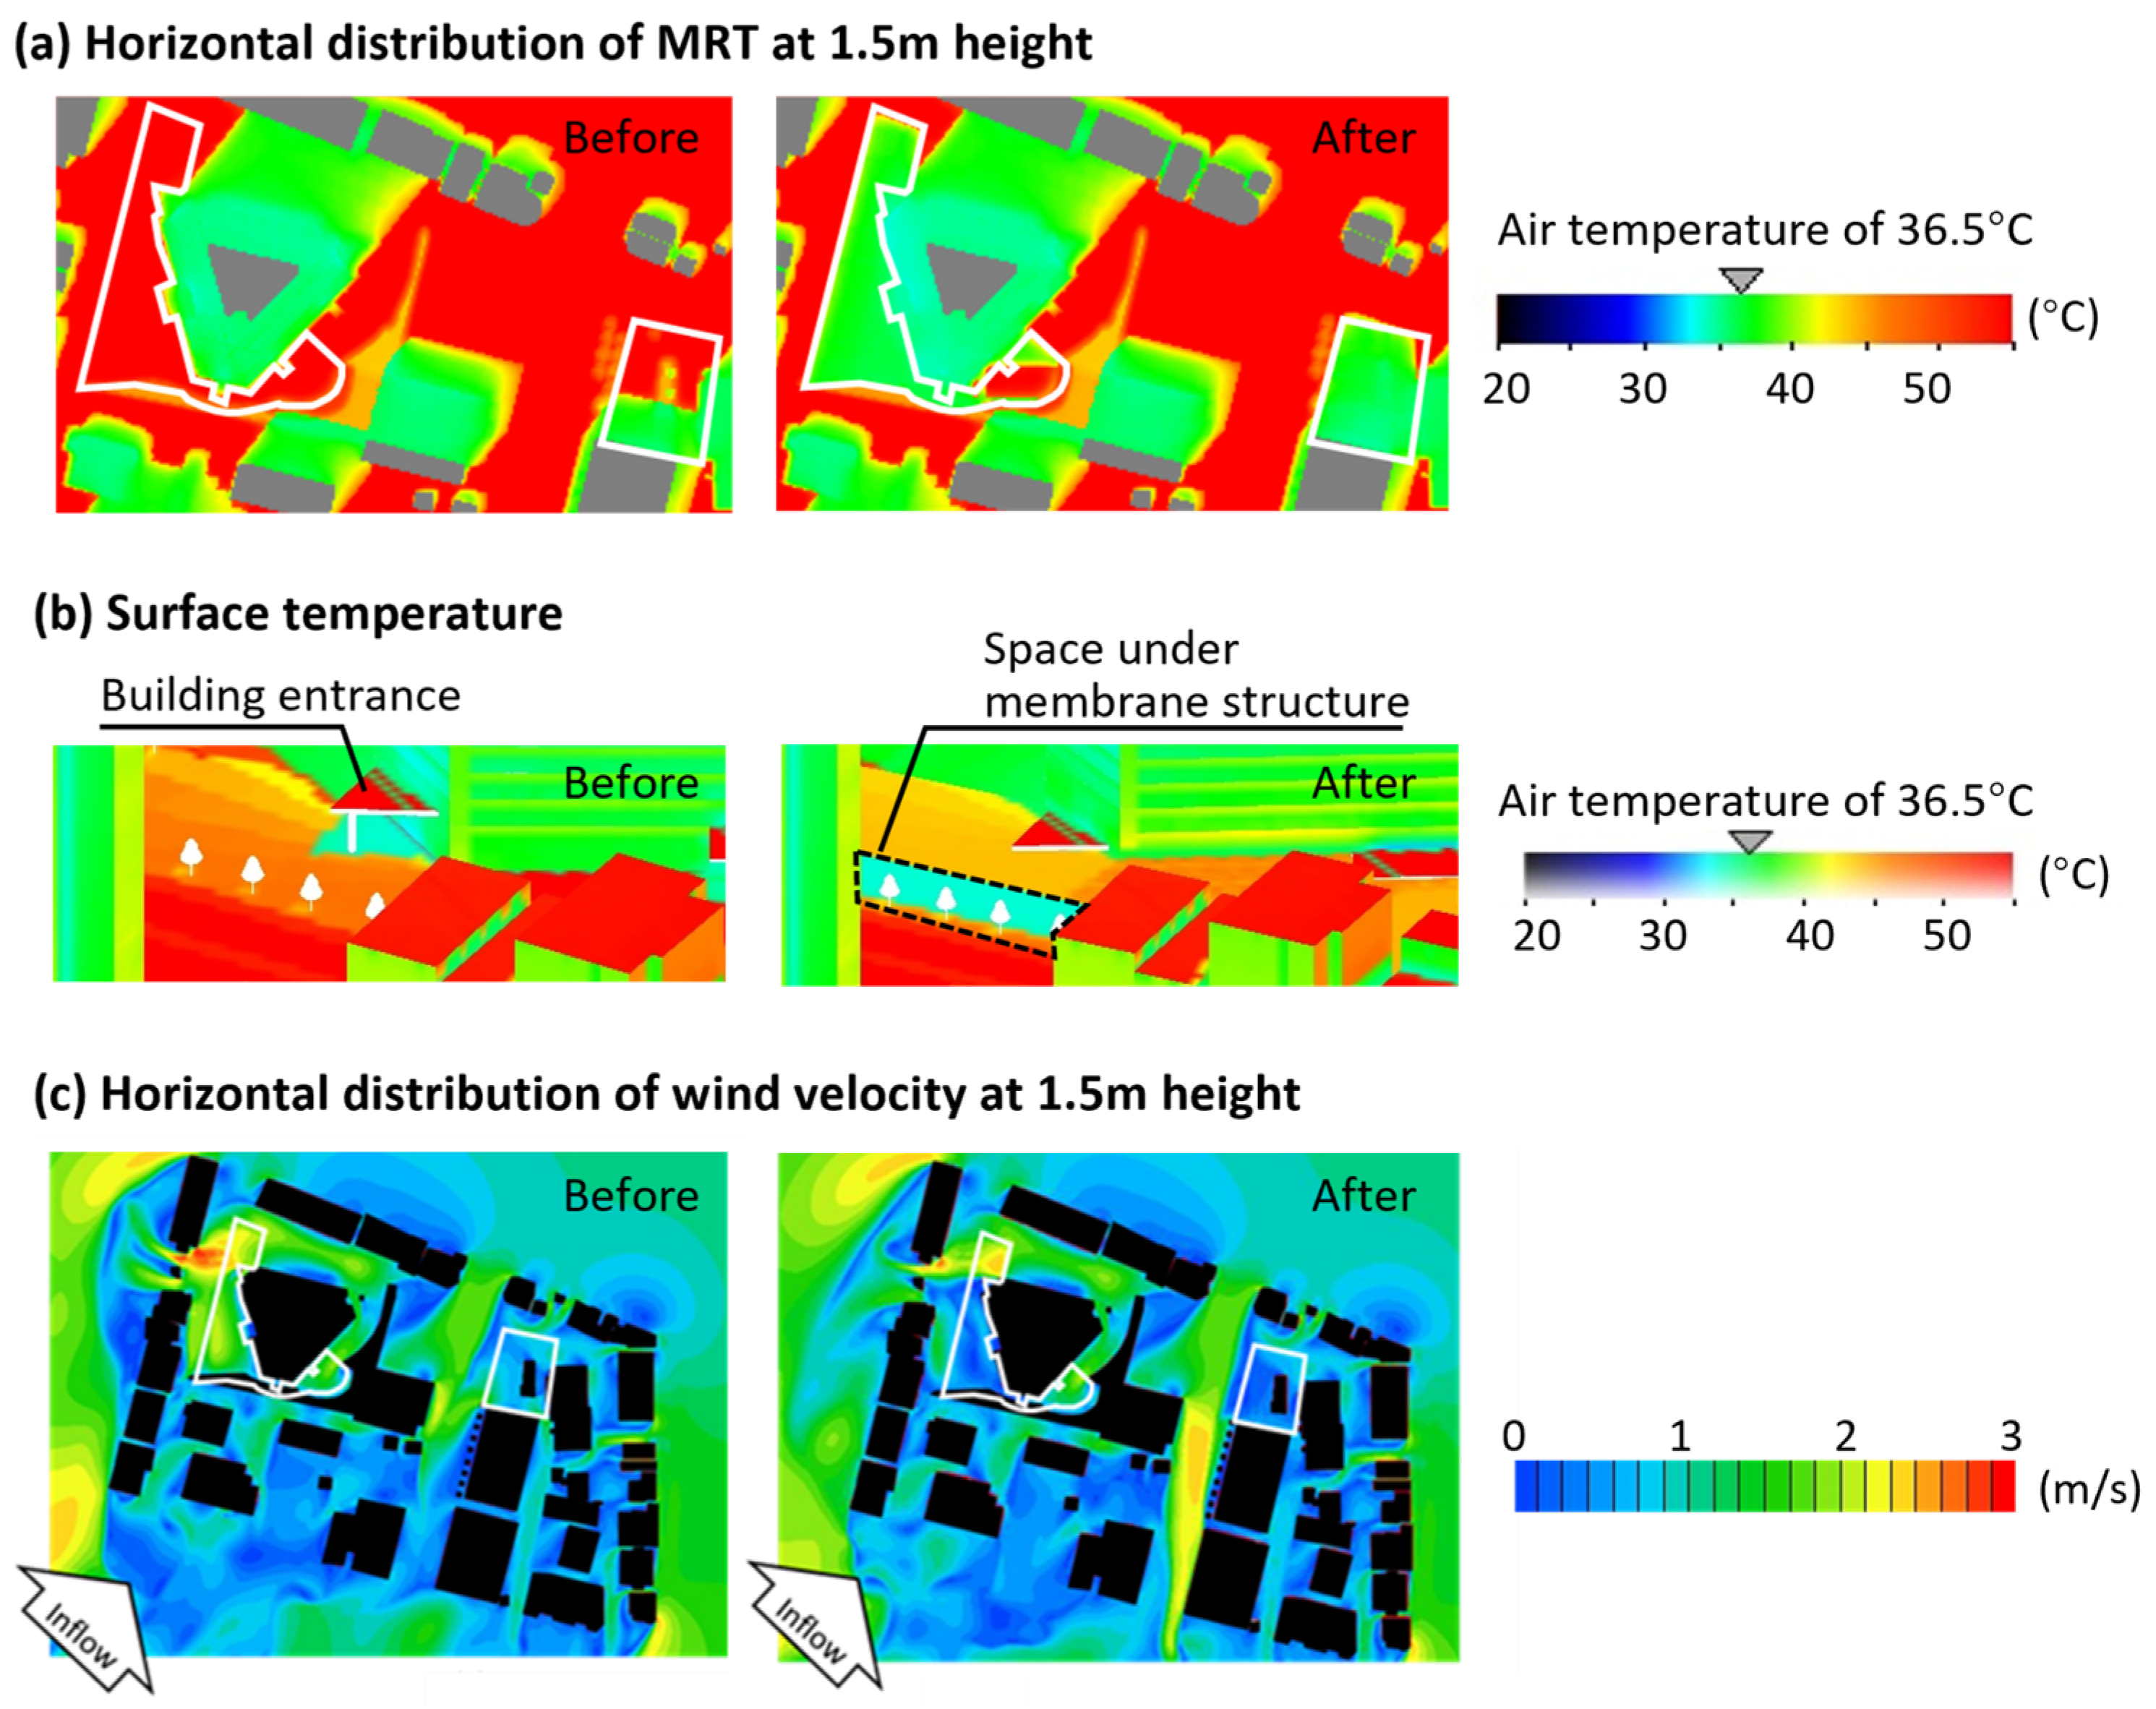
Figure 6 presents the simulation results at 13:00 under the representative peak summer scenario (2 August 2018). Regarding the MRT distribution before and after the proposal shown in Figure 6a, the reduced MRT area was found to occur under the membrane structure. At 13:00 before the proposal, part of POPS A was shadowed with a relatively lower MRT due to the buildings on its south side. However, after applying the membrane structure, the shadowed scope with a lower MRT was expanded. Before the proposal, the whole region of B-1 and B-2 showed high MRT, which decreased overall after the proposal intervention. Regarding the ground surface temperature in B-2 as shown in Figure 6b, that under the building entrance shelter before the proposal was about 33 °C, which was lower than that of the surrounding grounds by about 10 °C, but its coverage was very small. After the proposal, it was found that the ground surface temperature under the membrane structure was about 33 °C, and the coverage of this temperature range was much larger compared to the space under the entrance shelter before the proposal. According to the wind velocity distribution shown in Figure 6c, the wind velocity at 1.5 m height decreased in the POPS after the proposal. The reduction in wind velocity was limited in POPS A and B-1, but significant in B-2. In B-2, the wind velocity decreased not only within the region of membrane structure but also within the road range on the west.
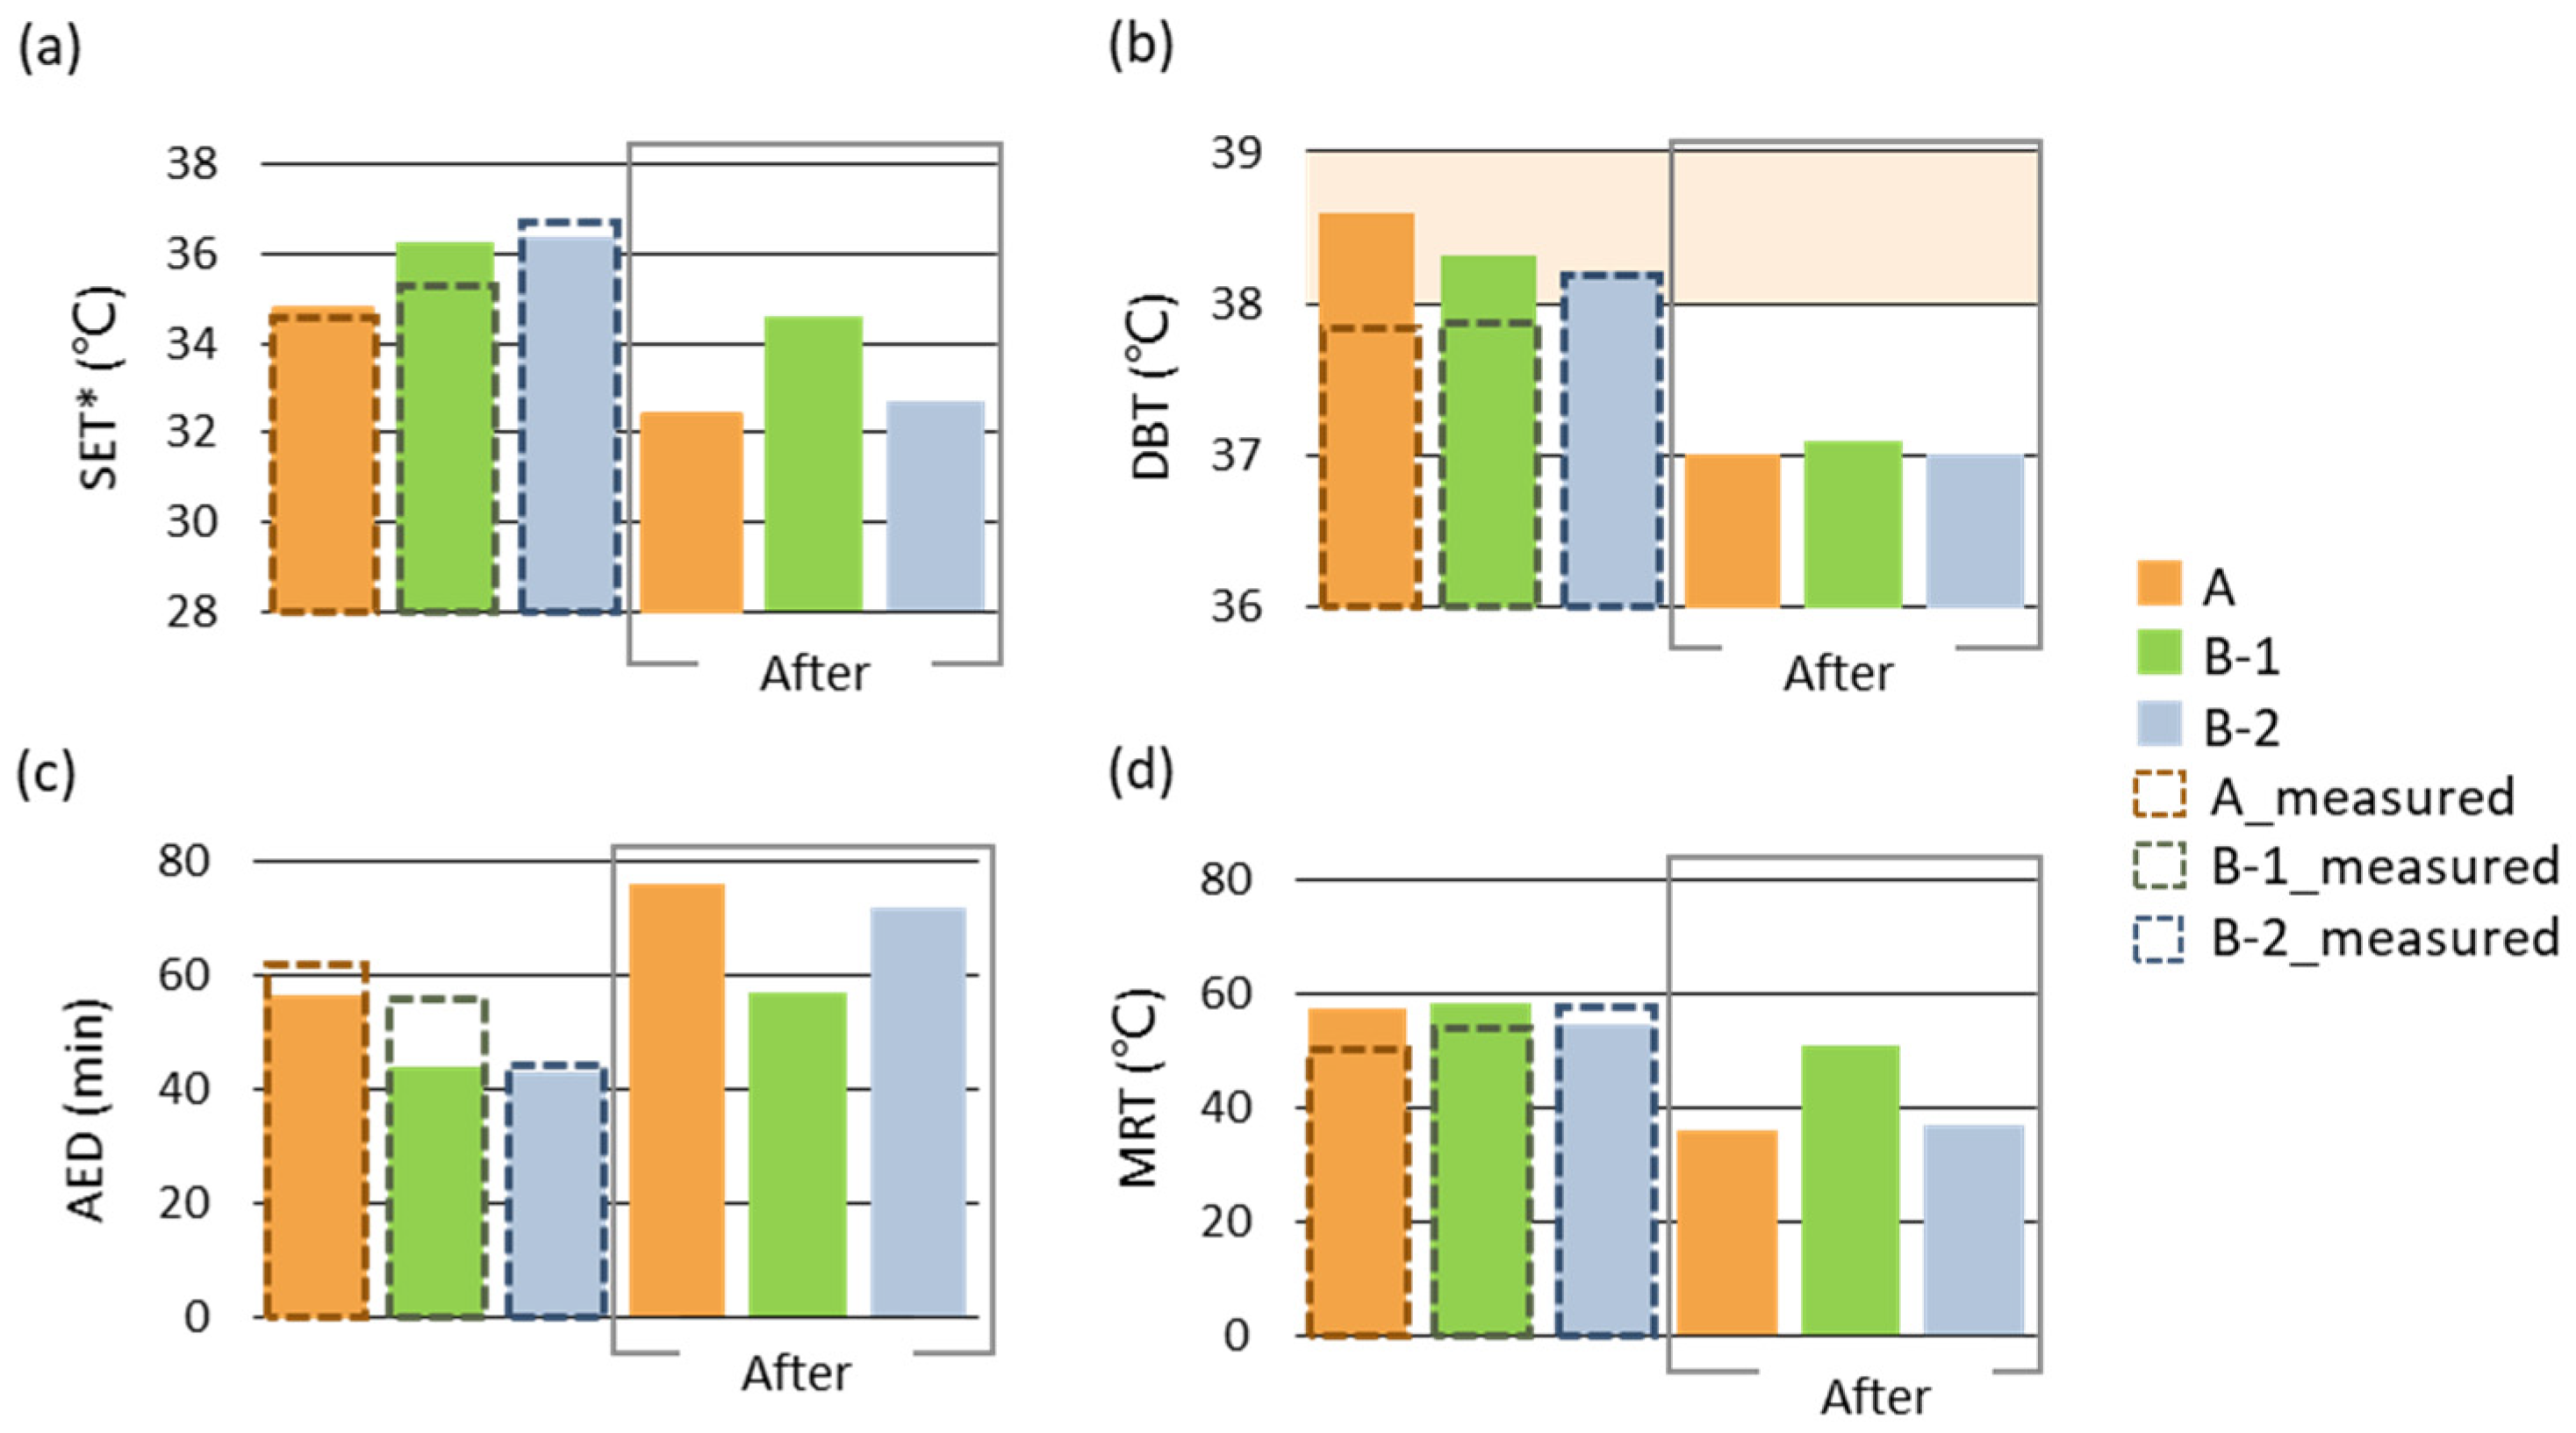
Calculated SET* values derived from simulation results (Figure 7a) showed that the proposed membrane structure decreased SET* by 2.4 °C, 1.7 °C, and 3.7 °C for POPS A, B-1, and B-2, respectively. Although the improvement was substantial, it was insufficient to reach comfort conditions (below 28 °C, the upper limit of the comfort range). Compared to the air temperature of 36.5 °C at 13:00, the simulated SET*s of 32.4 °C, 34.6 °C, and 32.7 °C under the membrane structure for POPS A, B-1, and B-2 were lower by 4.1 °C, 1.9 °C, and 3.8 °C, respectively. Field-measurement-derived SET* values of 34.6 °C, 35.3 °C, and 36.8 °C in POPS A, B-1, and B-2 (without membrane structure) were approximately 3.9 °C, 1.9 °C, and 3 °C higher than the corresponding 1.5 m height air temperatures (30.7 °C, 33.4 °C, and 33.8 °C), respectively. Figure 7b reveals the DBT before and after the proposal. DBT for all the studied POPS exceeded 38 °C, which is the upper limit to avoid the risk of severe heatstroke, but it decreased to below 38 °C after applying the proposal. The DBT reduction was 1.6 °C for POPS A, and 1.2 °C for B-1 and B-2. Figure 7c reveals that compared to the AED before the proposal, the AED was increased after the proposal. To be more specific, the increase in AED was about 20, 13, and 29 min for POPS A, B-1, and B-2, respectively. As shown in Figure 7d, MRT decreased after applying the membrane structure. The maximum MRT reduction in POPS A was about 21 °C, that of B-2 was about 18 °C, and that of B-1 was about 7 °C.
The measurement-based calculated thermal indexes were also compared with the simulation-based ones in the studied POPS without membrane structure as shown in Figure 7 and Table 2. This comparison confirmed that the thermal environment on the simulation day was harsher than that on the measurement day: the uniform air temperature input for simulation was about 5.8 °C, 3.1 °C, and 2.7 °C higher than that measured in situ in POPS A, B-1, and B-2 according to measurement-based indexes derived from [3]; the MRT at 13:00 in POPS A and B-1 on the measurement day was obviously lower than that on the simulation day by around 7.3 °C and 3.9 °C, respectively (B-2 showed a 3.5 °C higher MRT on the measurement day, due to unobstructed west solar radiation as analyzed in [3]). Similar to MRT but with smaller magnitudes, the SET* values in POPS A and B-1 on the measurement day were lower by 0.17 °C and 0.97 °C, respectively, whereas that in B-2 was higher by about 0.37 °C; the DBT in POPS A and B-1 on the measurement day were lower by 0.73 °C and 0.4 °C, respectively (DBT in B-2 was consistent between the two days); conversely, the AED in POPS A and B-1 on the measurement day were higher by 6 and 12 min, respectively (AED in B-2 was nearly the same).
Notably, even under this harsher simulation-day environment, the simulation-based indexes of POPS with the membrane structure still outperformed the measurement-based indexes of POPS without the membrane structure (Figure 7a–d). Specific differences in thermal indexes (SET*, DBT, MRT, AED) between the two scenarios were detailed in the rightmost column of Table 2.

3.4.2. Winter

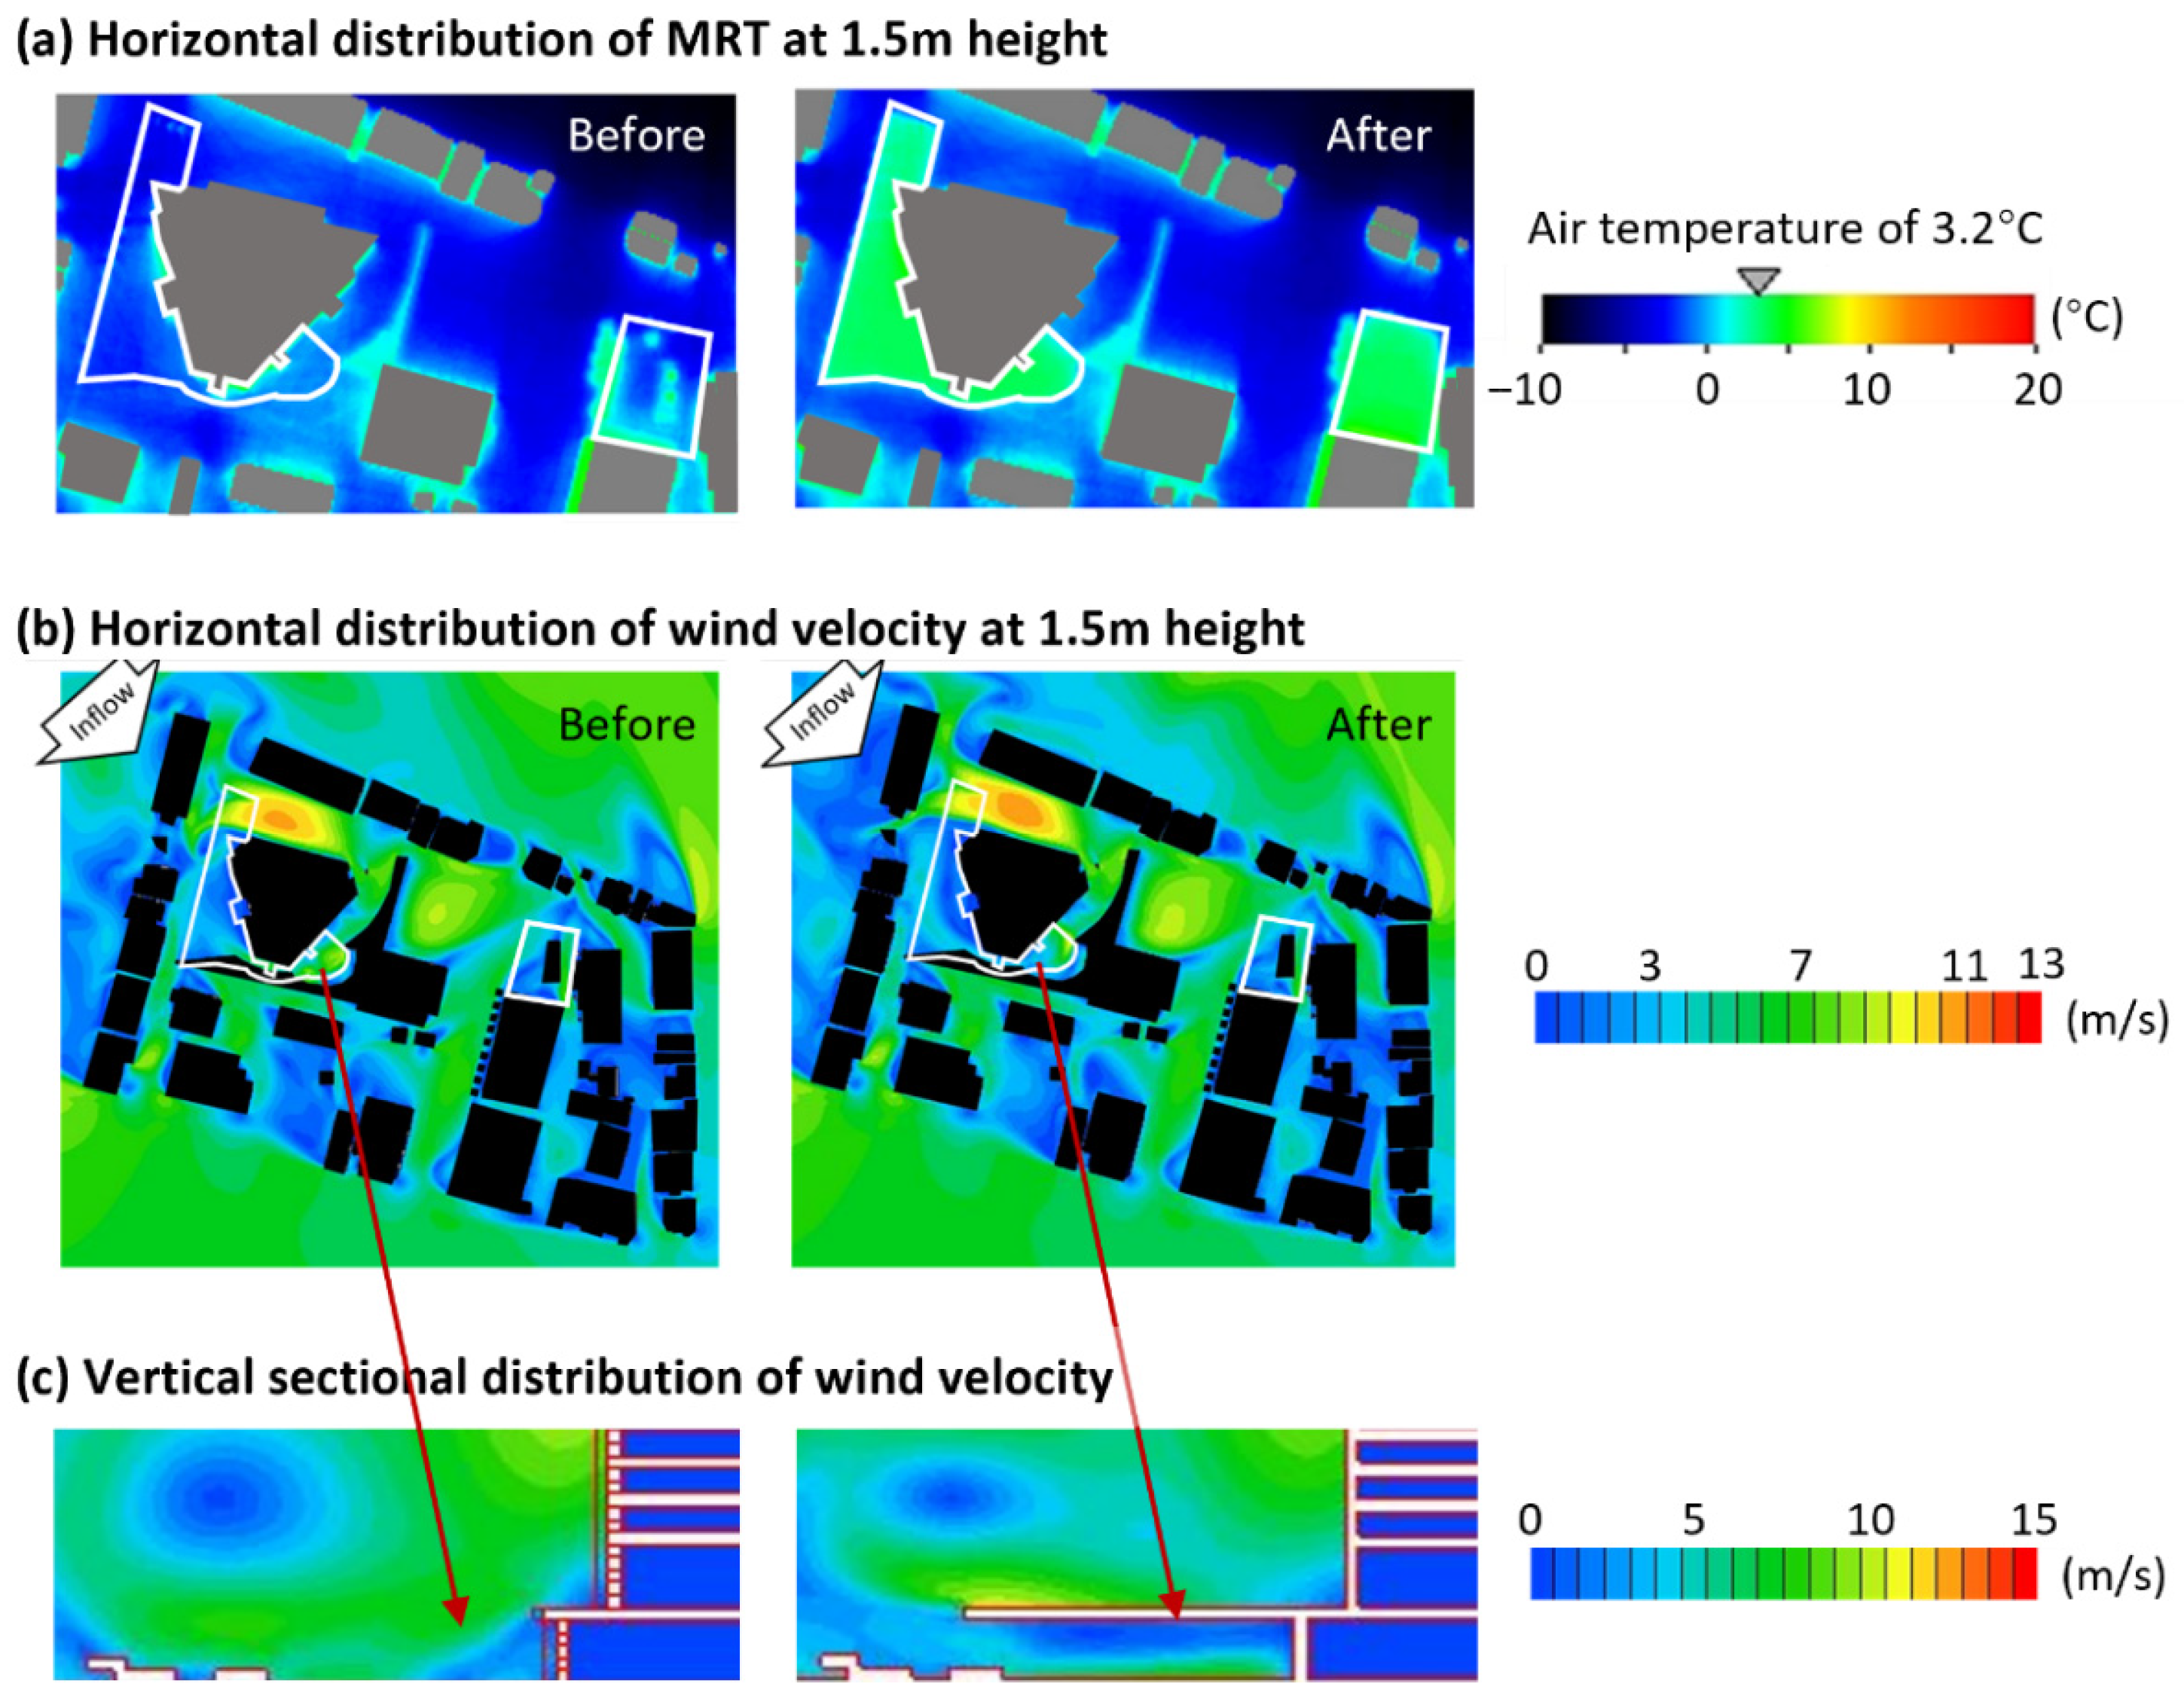
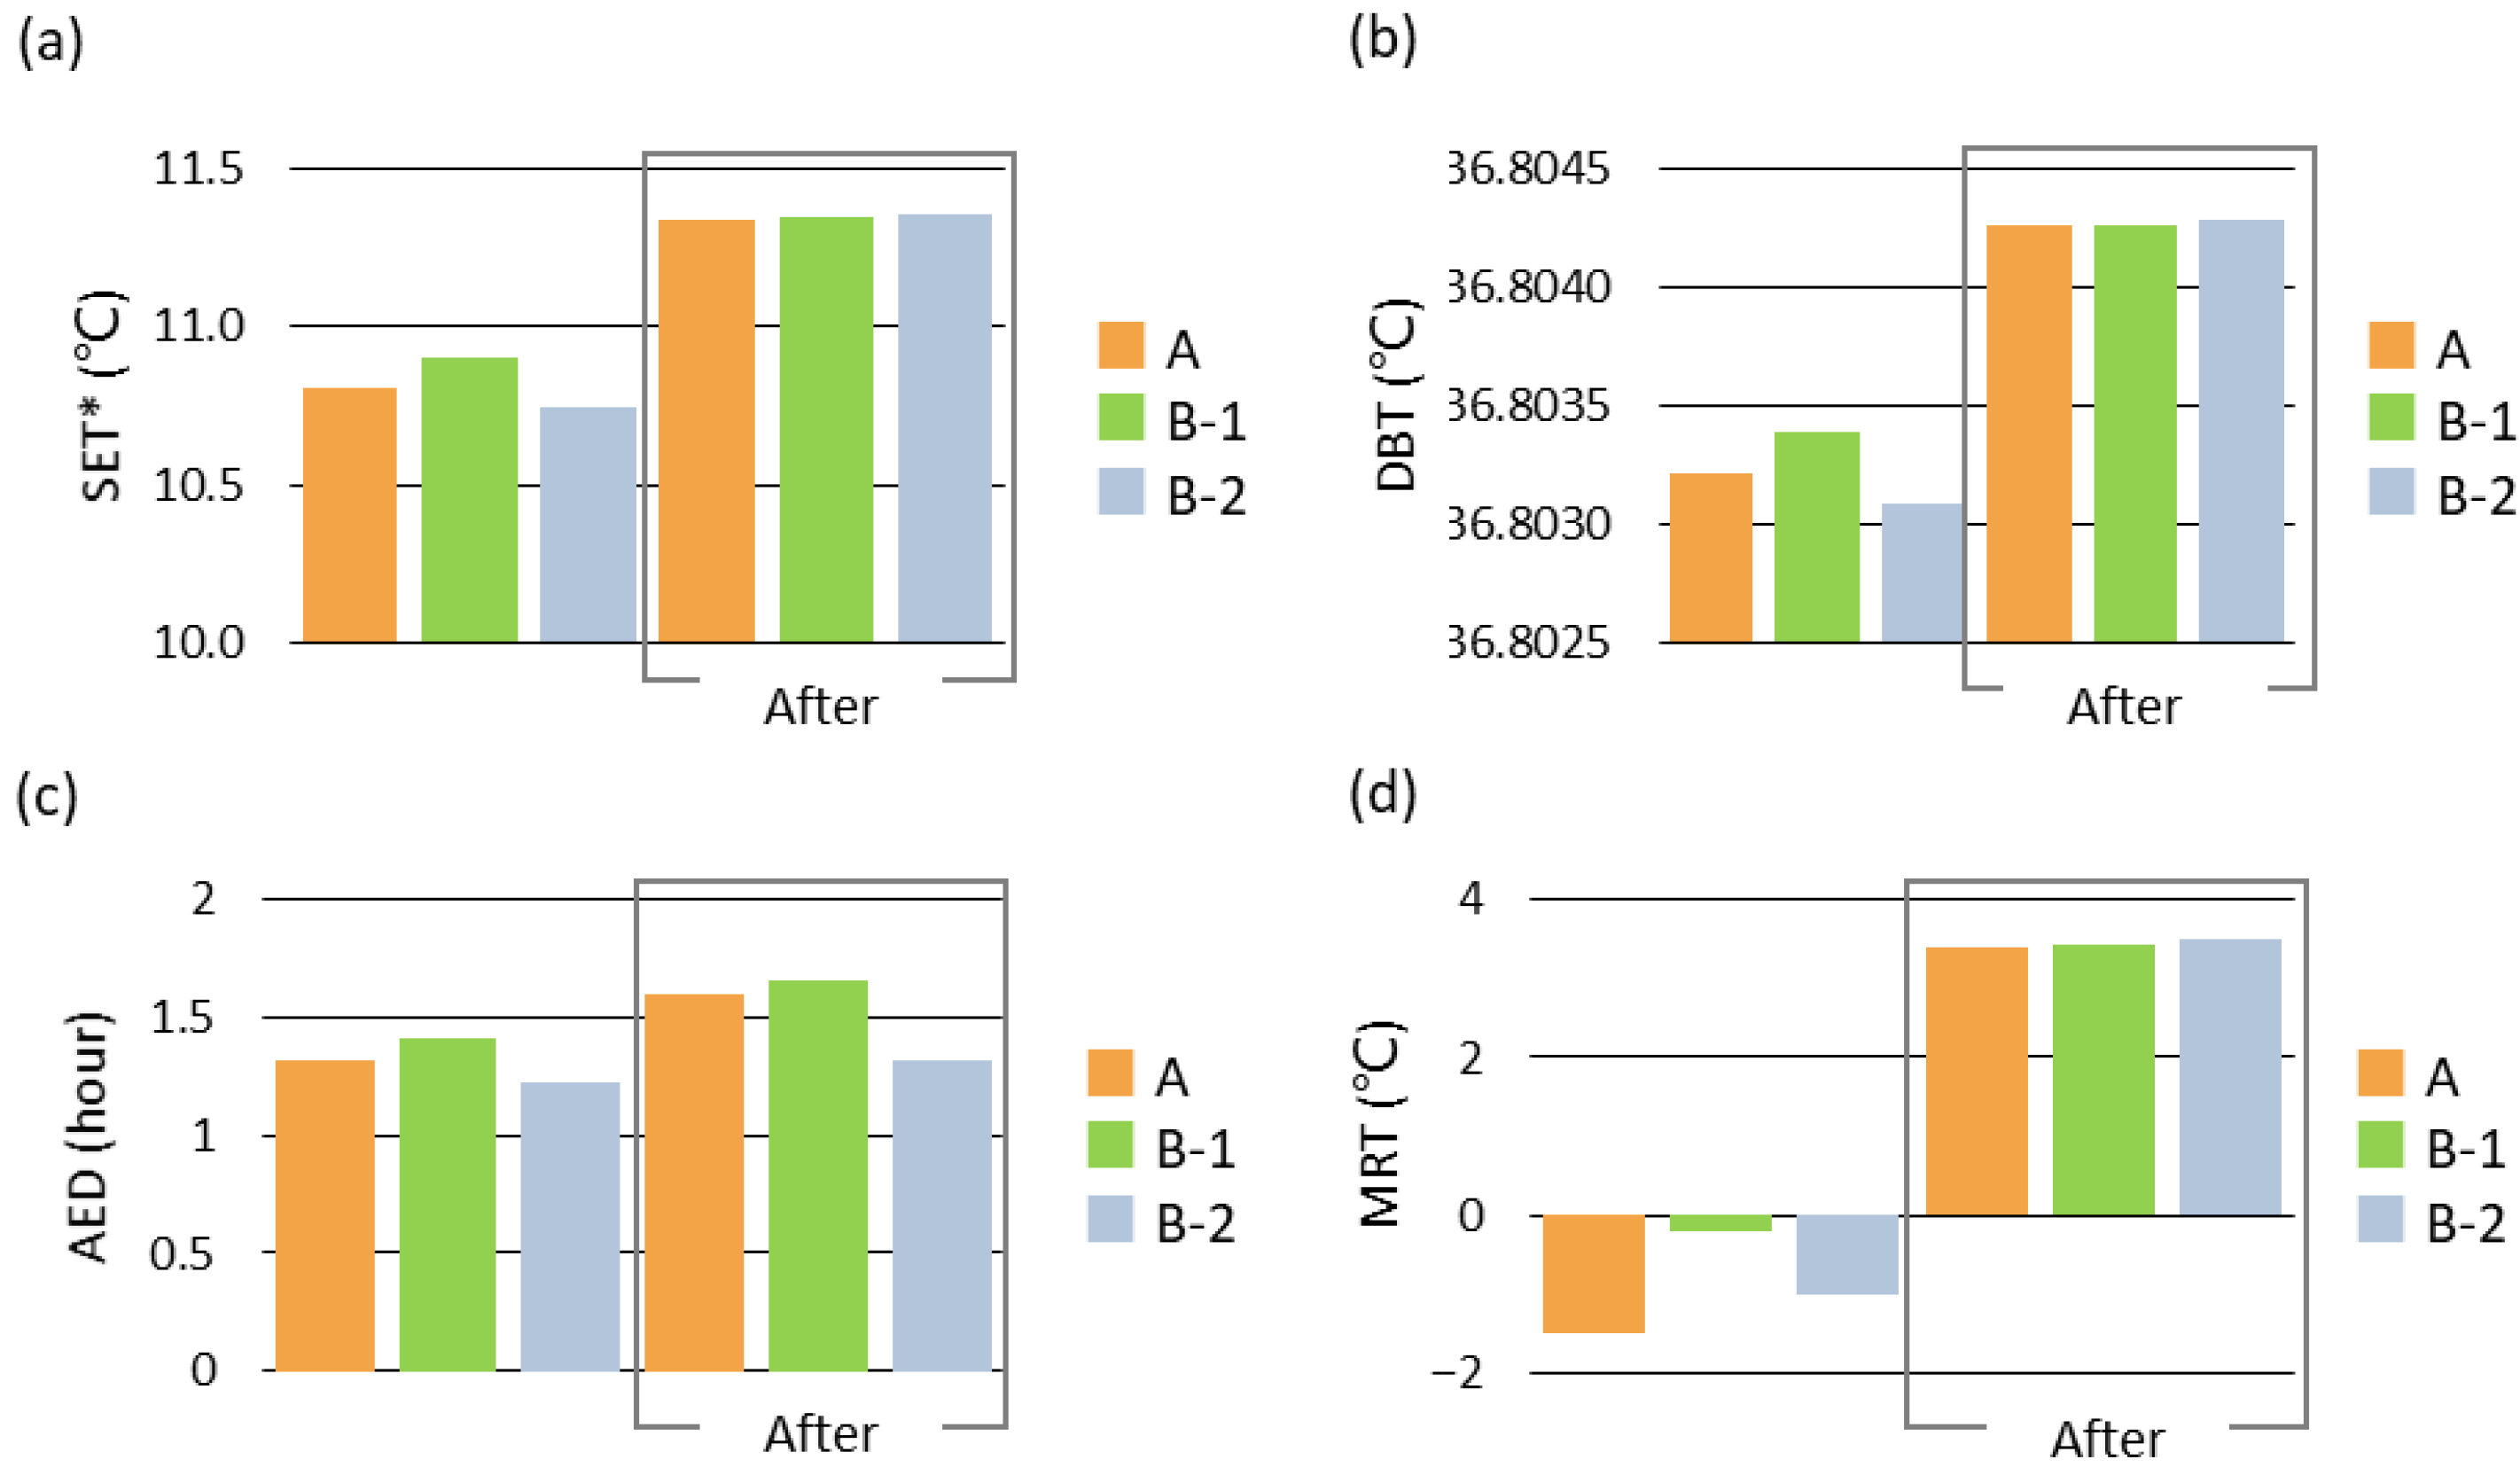
Figure 8a shows the MRT distribution before and after applying the membrane structure. At 2:00 under the representative peak winter scenario (29 December 2018), the air temperature was about 3.2 °C, whereas the MRT in POPS A, B-1, and B-2 before applying the proposal was obviously lower than the air temperature as −1.5 °C, −0.2 °C, and −1.0 °C, respectively. Regarding the MRT distribution as shown in Figure 8a, the relatively high MRT was observed only around the greeneries in POPS A. After applying the proposal, the MRT increased to slightly above the air temperature and was uniformly distributed within the range covered by the proposed membrane structure. In addition to the MRT improvement, the wind velocity change was another key factor affecting the winter thermal environment. Regarding the horizontal and vertical distributions of wind velocity at 1.5 m height before and after applying the proposal shown respectively in Figure 8b,c, the effect of the proposal to reduce the wind velocity was limited. This was because the proposed membrane structures are located in the downwind area of west-side buildings, where the incoming wind was already blocked, leaving little room for further wind reduction (as shown in Figure 8b).
Figure 9a reveals that the SET* in the studied POPS was increased after applying the proposal with an increase of about 0.5 °C, 0.4 °C, and 0.6 °C for POPS A, B-1, and B-2, respectively. As shown in Figure 9b, the improvement of DBT was negligible after applying the proposal to the studied POPS. Figure 9c shows that AED for staying in the studied POPS was increased after applying the proposal. The increase in AED was 0.27 h, 0.24 h, and 0.1 h for POPS A, B-1, and B-2, respectively (Table 3). Figure 9d and Table 3 show that after applying the proposal, the MRT was increased to 3.4 °C in POPS A and B-1 and 3.5 °C in POPS B-2. The MRT increased by 4.9 °C, 3.6 °C, and 4.5 °C for POPS A, B-1, and B-2, respectively.

4. Discussion

4.1. Summer Thermal Environment Improvement and Health Risk Mitigation

Simulation results (Figure 6 and Figure 7) demonstrated that the thermal environment in summer was improved after applying the membrane structure. Although calculated SET* remained above the upper comfort limit, both DBT and AED improved significantly, remaining within the safety range and being efficiently extended, respectively (Figure 7). This indicates that while the thermal environment remained “uncomfortable” due to summer heat stress, heatstroke-related health risks were effectively mitigated.
Heat-related illness remains a serious issue in Japan’s humid subtropical climate [53,54], accounting for 1745 heat-related deaths in 2010 [55]. As explored by Nakai et al. [53], a correlation exists between heat-related deaths and the peak daily temperature. The application of membrane structure in POPS was shown to be effective as a potential shelter solution providing effective mitigation of heat-related health risks during periods of peak daily temperature in summer, which is even more meaningful considering the severe problem of heat-related illness in Japan and its correlation to the peak daily temperature. Based on the unsatisfied thermal comfort in summer after applying membrane structure, extra measures for summer comfort are suggested here for POPS, such as the greenery and spray combined with the membrane structure would bring more effective cooling effect by evaporation.

4.2. Factors Influencing the Effectiveness of Membrane Structures

After applying the membrane structure, the MRT reduction varied across the studied POPS: approximately 20 °C for POPS A and B-2, but only 7 °C for POPS B-1 (Figure 7). This variation underscores the critical influence of ground surface materials, aligning with He et al. [18], who confirmed that such materials exert a non-negligible effect on the thermal environment under membrane structures. Notably, B-1’s smaller MRT reduction, attributed to pre-existing greeneries and south-side building shading (Result 3.4.1), highlights that membrane structures are more effective in POPS with limited prior shading. This suggests that membrane placement should prioritize areas with minimal existing solar obstruction to maximize cooling potential, complementing rather than duplicating existing microclimate improvements.
Notably, a key discrepancy appeared when comparing this study’s SET* results with He et al. [18]. In this study, the calculated SET* under the membrane was 1.9–4.1 °C lower than the ambient air temperature, whereas He et al. [18] reported measurement-based daytime SET* values 2–4 °C higher than the air temperature (measured at 1.2 m height on clear, low-wind sunny days). This difference reflects two core factors shaping the membrane’s impact on SET*: the surrounding built environment and human activity intensity (reflected by the assumed metabolic rate). In He et al.’s study [18], the membrane was enclosed by two-story concrete buildings that enhance solar absorption and heat retention. Furthermore, their study assumed a higher metabolic rate (1.5 met, compared to the 1.2 met used here), which further elevated the SET*. By contrast, the POPS in this study are attached to high-rise buildings. Existing building shading reduces solar input, and the weak-wind field (shown in Figure 6c, still higher than the 0.5 m/s in He et al.’s study [18]) minimizes heat retention. These conditions weaken the “heat accumulation effect,” leading to SET* 1.9–4.1 °C below the air temperature.
Comparing measured and simulated thermal environment indicators further verified the aforementioned conclusions and the mechanism of the weak-wind field. For POPS without membrane structures, the measured SET* (see Figure 7) was approximately 2–4 °C higher than the air temperature. The core reason for this phenomenon was that without the shelter of membrane structures, intense solar radiation acted directly on the human body and the surrounding environment, leading to a significant increase in the perceived temperature. In this study, however, the core function of the membrane structure was to provide effective shading, which greatly reduced the enhancing effect of solar radiation on the perceived temperature. Meanwhile, combined with the measured weak-wind field conditions around 13:00 (wind speed was only 1.2 m/s, see Figure 4a), the membrane structure had a limited effect on wind blocking. In this case, the cooling effect of shading offsets the impact of slight wind blocking in the weak-wind field. It is precisely for this reason that the simulated SET* under the membrane structure in this study was lower than the air temperature, which also demonstrated that the membrane structure could effectively reduce the human perceived temperature in the POPS area.
Ultimately, the simulation-based thermal indexes under the membrane (Figure 8) outperformed the measurement-based indexes of non-membrane POPS: SET* (0.7–4.1 °C lower), DBT (0.8–1.2 °C lower), MRT (3.5–21.4 °C lower), and AED (1–28 min higher). Critically, this DBT reduction addresses heat-related health risks. Prior to membrane installation, DBT in all POPS exceeded the 38 °C threshold for severe heatstroke, but post-installation, it fell within this safe range (1.6 °C reduction for A; 1.2 °C for B-1 and B-2; Figure 7b). This confirmed the membrane’s cooling effect even when the measurement day’s non-membrane thermal environment was more favorable than the simulation day’s. Collectively, these results demonstrate the membrane’s efficacy in improving POPS thermal environments and mitigating heat risks, with performance shaped by site-specific factors (ground materials, built context, solar radiation, wind). This supports its suitability for high-rise-attached POPS in dense urban areas.

4.3. Winter Thermal Environment Improvement and Limitations

While winter improvements from the membrane structure were limited, all evaluated thermal indices for the studied POPS (A, B-1, B-2) showed positive trends (Figure 8 and Figure 9). As indicated by SET* results (Figure 9a), the membrane did not fully resolve winter discomfort, and DBT improvements were negligible. Notably, however, the extension of AED (0.1–0.27 h; Figure 9c) confirmed its value as an emergency shelter, reducing cold-related health risks.
The relatively modest winter improvement can be attributed to two primary mechanisms. First, radiative heat loss dominates thermal sensation during cold nighttime conditions. The lightweight membrane has limited capacity to modify longwave exchange with the sky. Second, the installation location is situated within the downwind zone of adjacent high-rise buildings, where incoming wind velocity has already been partially attenuated (Figure 8b,c). As a result, additional wind reduction achieved by the membrane structure is constrained.
To enhance winter performance in cold-weather applications, several optimization strategies could be considered. These include (1) integrating adjustable side panels or partial vertical wind barriers to reduce horizontal cold-air infiltration; (2) combining membrane canopies with strategically positioned windbreak vegetation; (3) adopting semi-enclosed configurations during winter emergency operation modes; and (4) incorporating localized low-energy supplementary heating systems to improve thermal comfort during prolonged sheltering. Such adaptive design strategies could enable membrane structures to provide seasonally responsive performance.

4.4. Additional Architectural and Socio-Spatial Values of Membrane Structures

In addition to environmental performance discussed above, membrane structures contribute architectural and socio-spatial value to POPS. Their lightweight and translucent characteristics enable the creation of permeable, semi-open environments with abundant natural daylight and ventilation, functioning as passive environmental moderators that enhance outdoor usability with relatively low structural intervention [14].
From the perspective of seismic resilience, membrane structures may strengthen spatial legibility and wayfinding capacity. As visually distinctive elements within dense urban contexts, they can serve as recognizable gathering landmarks during post-disaster displacement. Such visual cues may assist evacuees in orientation while reinforcing everyday awareness of POPS as potential emergency spaces [24].
Moreover, the programmatic versatility of membrane-covered POPS supports daily vitality. Depending on site context and surrounding functions, these partially sheltered spaces may accommodate community events, recreational activities, temporary markets, workshops, or even function partly as parking facilities. This activity diversity enhances routine public use while maintaining adaptability for emergency sheltering [33]. For example, integrating photovoltaic panels into membrane systems may simultaneously provide renewable energy supply and shaded refuge during post-disaster power disruptions.
Beyond these functional aspects, tensile membrane and lightweight canopy structures have been widely implemented in public plazas and transportation hubs worldwide [25,34]. Reported advantages include efficient erection, structural efficiency, visual lightness, and adaptability to diverse site conditions [26]. However, studies have also noted limitations such as weather- and season-dependent thermal performance [26], maintenance requirements related to material aging [27], and potential visual or contextual impacts in historically sensitive urban environments [28].
Empirical research indicates that improving outdoor thermal conditions—particularly through effective shade provision—can increase pedestrian activity, preference for shaded routes, and duration of stay in public spaces [29,30]. These findings suggest that the long-term socio-spatial sustainability of canopy interventions depends not only on microclimatic improvement but also on context-sensitive architectural integration and support for diverse urban activities [31,32].

4.5. Limitations and Future Work

Despite demonstrated improvements in thermal safety, this study has several limitations. First, thermal evaluation is based on a standing human model with fixed metabolic rate and clothing insulation parameters. This standardized assumption ensures comparability but does not account for posture variations (e.g., seated and recumbent conditions) that may influence heat exchange during prolonged sheltering. Second, simulations adopt a standardized healthy adult model and do not incorporate variability across different population groups. Thermal tolerance and risk perception may differ among users under emergency conditions. Third, analysis is conducted under representative peak seasonal days rather than long-term climatic datasets. Although these scenarios provide conservative boundary conditions, seasonal variability was not fully assessed. Finally, findings rely on validated SEB–CFD simulations without post-installation field measurements of membrane structures. Empirical validation under real conditions would further strengthen conclusions. Another limitation is the absence of a quantitative cost–benefit assessment for the proposed site-specific membrane structures, which limits direct economic insights for private developers.
Beyond these identified limitations, future research may explore adaptive design strategies to approach year-round thermal comfort and enhance shelter performance under emergency conditions, conduct targeted quantitative cost–benefit analysis of the membrane structures for POPS combined with stakeholder economic investigations to enhance practical feasibility, and include dynamic parameter adjustment, integration of auxiliary cooling and heating measures (e.g., greenery or mist-spraying systems), and long-term monitoring of membrane-covered POPS to evaluate seasonal adaptability and user experience.

5. Conclusions

This study investigates whether membrane structures can effectively enhance thermal comfort and reduce heat- and cold-related health risks in high-rise-attached POPS under representative peak seasonal conditions, while remaining institutionally feasible within Japan’s CDS.
Based on in situ measurements and coupled SEB–CFD simulations, results confirm that membrane structures substantially improve summer thermal safety. Under peak summer conditions, MRT decreased by 7–21 °C and SET* by 1.7–3.7 °C across studied POPS. Although SET* remained above defined comfort threshold (28 °C), DBT was reduced by 1.2–1.6 °C to below critical 38 °C threshold associated with severe heat-related illness. In parallel, AED increased by 13–29 min, indicating a meaningful extension of tolerable outdoor exposure during post-disaster scenarios. These findings demonstrate that membrane structures are effective in mitigating heat-related health risks, even when full thermal comfort cannot be achieved.
In winter, performance improvements were more limited. While SET* increased modestly (0.4–0.7 °C) and DBT remained largely unchanged, MRT increased by 3.6–4.9 °C and AED was extended by 0.1–0.27 h. Although the membrane structure alone cannot resolve winter discomfort, it contributes to reducing cold-related exposure risk and supports emergency shelter functionality under nocturnal cold conditions.
Compliance with Japan’s CDS is critical for practical implementation. Membrane structures must be classified as “pilotis-type open spaces” (a minimum clearance height of 6 m and a depth no less than twice the height) to avoid reducing developers’ FAR incentives. Furthermore, this height constraint also ensures effective shading, wind mitigation, and compatibility with existing high-rise contexts. Material comparisons confirm membrane structures outperform metal/glass canopies, offering lower solar absorptivity, lighter weight, and lower construction costs, while supporting natural daylighting.
Beyond thermal performance, membrane structures provide architectural and socio-spatial benefits. This research addresses a critical gap by expanding the application of membrane structures to high-rise-attached public spaces, providing both a technical and institutional basis for enhancing urban resilience.

Author Contributions

Conceptualization, T.A.; methodology, X.X. and H.A.; software, X.X. and H.A.; validation, X.X.; formal analysis, X.X., H.A. and T.A.; investigation, H.A.; resources, H.A.; data curation, X.X. and H.A.; writing—original draft preparation, X.X.; writing—review and editing, T.A.; visualization, X.X.; supervision, T.A.; project administration, T.A. All authors have read and agreed to the published version of the manuscript.

Funding

This research received no external funding. The APC was funded by the authors.

Institutional Review Board Statement

Not applicable.

Informed Consent Statement

Not applicable.

Data Availability Statement

The original contributions presented in this study are included in the article. Further inquiries can be directed to the corresponding authors.

Conflicts of Interest

The authors declare no conflicts of interest.

Appendix A

Table A1. Initial calculation conditions of this study by CFD modeling (Units: m, m2, m/s, ° for relevant parameters; dimensionless for α).
Domain92,870 m2 (horizontal) × 835 m (vertical)
Turbulence modelStandard k-ε model
Inflow boundarySummerSW (225°), 1.2 m/s (Reference height: 35 m)
WinterNW (315°), 5.4 m/s (Reference height: 35 m)
EnvironmentIV Dense Urban/High-rise District
ZG: 550 m; α: 0.27
Outflow boundary (Xmax)Zero-gradient condition
Ground boundary (Zmin)Logarithmic low
Lateral and top boundariesFree slip
Scheme for advection termQUICK scheme
Figure A1. 3D model horizontal size and modeling precision levels of buildings (detailed, semi-detailed, and simplified modeling).
Sustainability 18 04167 g0a1
Figure A2. 3D model and spatial distribution of urban surface components with corresponding numerical identifiers for simulation.
Sustainability 18 04167 g0a2
Table A2. Component attributes and thermophysical properties corresponding to the numbered urban surface components in Figure A2.
Number (Refers to Figure A2)Component Attribute
(Component Category_Application, Thermal Insulation, Surface Layer)
ReflectivityEmissivityAreal Thermal Conductivity Areal Heat Capacity
[-][-][W/(mK)][kJ/(mK)]
1Wall_RC, commercial/residential use, insulated, thick mortar finish0.30.90.56207
2Flat roof_RC/SRC, flat roof, insulated, thick mortar finish0.30.90.81515
3Wall_RC, commercial use, insulated, stone cladding (dark finish)0.20.90.66448
4Flat roof_heavy steel structure, flat roof, insulated, concrete0.20.90.68395
5Wall_heavy steel structure, commercial use, insulated, stone cladding (dark finish)0.20.90.66448
6Flat roof_RC/SRC, flat roof, insulated, ceramic tile finish (dark)0.30.90.82496
7Wall_heavy steel structure, commercial use, uninsulated, autoclaved aerated concrete (AAC) panel (dark)0.20.90.60375
8Flat roof_light/heavy steel structure, flat roof, insulated, steel sheet (dark finish)0.30.80.8372
9Wall_wood structure/light steel structure, residential use, insulated, mortar-type finish (dark)0.30.90.3973
10Pitched roof_wood structure/light steel structure, pitched roof, insulated, steel sheet (dark finish)0.30.80.2225
11Glazing_double glazing0.080.944.7611
12Wall_heavy steel structure, commercial use, insulated, AAC panel (light finish)0.40.90.2045
13Balcony/Canopy_aluminum alloy railing0.60.820.007
14Flat roof_RC, flat roof, insulated, asphalt waterproofing0.20.90.91363
15Ground_wood structure, ground floor slab, timber flooring0.30.90.1530
16Exterior glazing_double glazing0.080.944.7611
17Pitched roof_wood structure/light steel structure, pitched roof, uninsulated, corrugated steel sheet (dark finish)0.20.90.5533
18Wall_RC, commercial/residential use, uninsulated, exposed concrete (dark finish)0.20.90.68627
19Outdoor structure_RC, commercial/residential use, uninsulated, mortar finish (dark)0.30.90.88399
20Balcony/Canopy_RC, commercial/residential use, uninsulated, exposed concrete (dark finish)0.20.90.68627
21Ground_RC, ground floor slab, plastic tile finish0.40.90.29197
22Wall_heavy steel structure, commercial use, insulated, AAC panel (dark finish)0.20.90.2045
23Ground_RC, ground floor slab, layered pavement system0.30.90.19931
24Hedge_vegetation hedge0.250.950.60152
25Wall_wood structure/light steel structure, residential use, insulated, exterior siding board (dark finish)0.20.90.79379
26Outdoor structure_steel mechanical equipment0.60.820.0011
27Wall_RC, commercial use, uninsulated, AAC panel (dark finish)0.20.90.60375
28Entrance door_steel entrance door0.60.81.5315
29Wall_RC, commercial use, insulated, ceramic tile finish (dark)0.20.90.67396
30Flat roof_RC, flat roof, uninsulated, asphalt waterproofing0.20.91.90362
31Ground_wood structure, second-floor slab, timber flooring0.30.90.6052
32Wall_light/heavy steel structure, commercial/industrial use, uninsulated, steel sheet (dark finish)0.30.80.4824
33Pitched roof_wood structure/light steel structure, pitched roof, uninsulated, steel sheet (dark finish)0.30.80.5530
34Ground_RC/heavy steel structure, ground floor slab, on-grade slab0.30.91.02900
35Flat roof_RC/heavy steel structure, flat roof, uninsulated, exposed concrete (dark finish)0.20.91.39394
36Pitched roof_RC, pitched roof, insulated, asphalt waterproofing0.20.90.2222
37Ground_water-retentive permeable paving (interlocking blocks)0.20.90.771143
38Ground_asphalt pavement (dark)0.10.90.551820
39Ground_asphalt pavement (light)0.30.90.551820
40Ground_lawn0.250.950.60200
41Ground_tile pavement (light)0.40.90.901163
42Ground_tile pavement (dark)0.20.90.901163
43Ground_concrete apron0.20.90.92971
Table A3. Validation cases in existing studies.
Literature and Its Applied ModelValidated Heat Transfer [W/m2]Validated Parameters and Obtained MethodResults
Jiang He et al. (2010) [18]

CFD + SEB Coupled Model

(Used to simulate the summer microclimate in semi-open spaces of membrane structures in Yokohama, Japan)
R S ,   R L ,   Q H , Q G ,   Q E
Membrane surface/ground temperature: Measured via thermocouples (0.1 °C accuracy, 60 s interval) and infrared thermography (8–14 μm band); coupled model simulated 24 h unsteady temperature for comparative validation.
Air temperature/wind field/humidity: The Launder–Kato k-ε model (minimum grid size 0.4 m) was used to simulate parameters at 1.2 m height, validated with measured data from ultrasonic anemometers (0.1 m/s accuracy) and capacitive humidity sensors (5% accuracy).
Thermal comfort index (SET*): Calculated based on simulated temperature, wind speed, humidity, and MRT* combined with a human thermal balance model, comparing with measured thermal environment trends.
Accurate membrane structure simulation: The maximum error between simulated and measured membrane surface temperatures is ≤2 °C, with an average error of approximately 1.5 °C during the core period (8:00–18:00) (measured daily maximum temperature 36.5 °C, simulated range 35.8–37.2 °C); after laying evaporative cooling pavement, the simulated ground temperature decrease (3–4 °C) highly matches the measured range (2.8–4.1 °C), with a relative error ≤6.7%.
High matching degree of microclimate parameters: The error between simulated and measured air temperatures at 1.2 m height is ≤0.7 °C, wind speed error ≤ 0.3 m/s, and simulated absolute humidity is within 0.5 g/kg (dry air) higher than measured values.
Reliable thermal comfort simulation: Simulated SET* is consistent with measured thermal environment trends; the SET* peak is 34–35 °C (measured 33.8–35.2 °C) without evaporative cooling pavement, and decreases by 1–2 °C after pavement installation.
Kan Chen et al. (2017) [38]

CFD + SEB Coupled Model

(Used to simulate the winter microclimate in the shaded area of high-rise buildings in Tsuchiura City, Ibaraki Prefecture, Japan)
R S ,   R L ,   Q H ,   Q G
Surface/radiant temperature: Measured data were obtained via aerial remote sensing (500 m altitude, 0.63 m spatial resolution) and mobile observations (2 s interval); the SEB model calculated and converted results to radiant temperature, with 112 sampling points (20 m interval) selected for validation.
Air temperature/wind field: CFD adopted the standard k-ε model (minimum grid size 0.8 m) to simulate temperature and wind distribution at 1m height, conducting 24 h continuous coupling validation.
Convective Heat Transfer Coefficient (CHTC): Calculated based on the Jurges formula combined with CFD-output wind speed, comparing uncoupled and coupled simulation schemes.
The coupled model effectively reproduces the low-temperature microclimate: Compared with uncoupled simulation, the surface temperature in shaded areas decreases by 0.5–1 °C, and the air temperature at 1m height is 0.1–0.3 °C lower than the overlying air temperature.
Good consistency between observation and simulation: Most points in the radiant temperature scatter plot distribute near the line y = x, with a coefficient of determination (r2) of 0.84; the temperature error of core underlying surfaces is ≤3 °C, and that of building facades is ≤2 °C.
Reliable model robustness: When parameters (reflectivity, thermal conductivity) fluctuate by ±10%, the simulated air temperature changes by ≤0.8 °C; the coupling converges after 2 iterations, with a convective heat flux error <5%.
Masahito Takata et al. (2018) [39]

CFD + SEB Coupled Model

(Used to simulate the winter microclimate in deep canyon spaces in Shibam, Yemen)
R S ,   R L ,   Q H ,   Q G
Surface temperature distribution: SEB model (0.25 m resolution) was used to calculate 24 h unsteady surface temperature.
Air temperature/wind field: The standard k-ε model (50 cm grid resolution) was adopted to simulate temperature and wind distribution at 1.5m height.
CHTC: Calculated based on CFD-local wind speed combined with the Jurges formula, distinguishing differences between canyon edges and centers.
The coupled model successfully reproduces the low-temperature microclimate caused by “material cold storage + shading”: The air temperature at 1.5 m height is 1–2 °C lower than that of SEB-only simulation, with a surface temperature error ≤2 °C.
Wind field/temperature field matches measured data: The coverage of weak-wind areas (0.2–1.2 m/s) is consistent with measurements; the standard deviation of canyon air temperature spatial distribution decreases from 1.2 °C to 0.8 °C.
Robustness: When material parameters fluctuate by ±10%, the air temperature changes by ≤0.5 °C, and the model can capture the 0.5–1 °C temperature difference heterogeneity caused by canyon orientation.
Takashi Asawa et al. (2011) [37]

CFD + SEB Coupled Model

(Used to simulate surface heat balance and convective heat transfer of urban canyons and apartment buildings)
R S ,   R L ,   Q H ,   Q G
Convective Heat Transfer Coefficient (CHTC): Measured CHTC data of urban canyons were obtained from wind tunnel experiments (Narita et al., 2000 [56]), comparing simulated results of high-Re (standard k-ε) and low-Re (Launder–Sharma) models.
Surface temperature/convective heat flux: SEB model (0.2 m voxel grid) computed surface temperature; CFD output flow field data to couple and validate the thermal distribution of apartment buildings (including verandas and eaves).
Wind speed distribution: CFD simulated wind speeds at 2 m/11 m heights, compared with wind tunnel experiment benchmark data.
High CHTC simulation accuracy: The simulated CHTC values of the low-Re model match wind tunnel experiment data well on most surfaces, with slightly larger errors only at wall-ground contact points due to non-isothermal conditions; the high-Re model (Jurges formula) is suitable for urban canopy scales, improving computational efficiency by 40%.
Reliable heat flux and temperature simulation: The simulated convective heat flux on the south wall of the apartment building shows a “increasing from wall center to edge” trend (the low-Re model captures high-value areas at veranda edges with an error ≤5%); the deviation between simulated surface temperature and 3D-CAD thermal simulator results is ≤1.8 °C.
Matched flow field simulation: The r2 between simulated wind speeds at 2 m height and benchmark data is >0.85, with a mean absolute error (MAE) <0.4 m/s, accurately reproducing the “skimming flow” characteristic of urban canyons.
R S : Net solar radiation [W/m2]; R L : Net longwave radiation [W/m2]; Q G : Conductive heat flux [W/m2]; Q H : Sensible heat flux [W/m2]; Q E : Latent heat flux [W/m2].

Appendix B

Table A4. Statistical validation of the selected simulation days (2018).
DateParameterObserved ValueSeasonal Mean (μ)Standard Deviation (σ)Z-Score [-]
2 August Maximum temperature [°C]37.332.6 (July–August)2.97+1.58
Wind speed [m/s]2.53.5 (July–August)1.23−0.81
29 December Minimum temperature [°C]−0.72.2 (December–February)3.23−0.91
Wind speed [m/s]3.12.6 (December–February)0.76+0.67
Figure A3. Daily meteorological profiles for August (a) and December (b) 2018 in Tokyo. The pink shaded areas highlight the specific days selected for simulation (2 August and 29 December).
Sustainability 18 04167 g0a3
Table A5. Comparison of 2018 simulation days with Tokyo’s decadal climate (2016–2025).
SeasonParameterValue on Simulated Day (2018)10-Year Average (2016–2025)
SummerMaximum temperature [°C]37.3 (Aug. 2)36.9 (Aug. maximum)
Average wind speed [m/s]2.5 3 (Aug. average)
WinterMinimum temperature [°C]−0.7 (Dec. 29)−0.13 (Dec. minimum)
Average wind speed [m/s]3.1 2.6 (Dec. average)

Appendix C

Figure A4. Parameters of an assumed person used for calculating thermal indexes.
Sustainability 18 04167 g0a4
Figure A5. Calculation flow of SET* (adapted from [42]).
Sustainability 18 04167 g0a5

Appendix D

Regarding the AED calculation in hot environments, E   r e q , the required evaporation for thermal equilibrium, is calculated by Equation (A1), and its involved terms and variations are shown in Table A6.
E   r e q = M W C R R e s
where M is the metabolic rate (W/m2), W is the effective mechanical work (W/m2), R and C are the heat exchanges by radiation and convection at the body surface (W/m2), respectively, Res is the respiratory heat exchange.
Table A6. Involved variation and equation for calculating E r e q .
Term EquationInvolved Variable
R e s [W/m2] R e s = C e s + E e s
C e s = 0.00152 M ( 28.56 0.885 t a + 0.641 P a )
E e s = 0.00127 M ( 59.34 + 0.53 t a 11.63 P a )
M [W/m2], t a [°C], P a [kPa]
C [W/m2] C = h c · f c l · ( t c l t a ) t s k [°C], t c l [°C], t a [°C], t s k [°C]
v a [m/s], M [W/m2], I c l [clo]
R [W/m2] R = h r · f c l · ( t c l t r ) t s k [°C], t c l [°C], t r [°C], I c l [clo]
C e s and E e s are the heat exchanges by respiratory evaporation and convection (W/m2), and t c l is the clothing surface temperature (°C).
Based on the calculated E   r e q , the AED can be estimated as the lower value calculated by the following Equations (A2) and (A3) for hot environments.
A E D = 60 Q m a x S = 60 Q m a x E r e q E s k
A E D = 60 D m a x S W
where Q m a x and D m a x are respectively the maximum total body heat storage and maximum water loss, which are respectively given as 50 Wh/m2 and 1000 Wh/m2 as the warming limit based on the reference criteria in ISO 7933 for the non-acclimatized people under hot environments, and E s k is the heat exchange by evaporation at skin surface, which limit, E m a x , is calculated by the following Equations (A4)–(A6).
W h e n   E r e q > 0   a n d   E m a x > 0 ,             w r e q = E r e q E m a x
W h e n   E r e q 0   ,             w r e q = 0
W h e n   E m a x 0     o r   E r e q E m a x > 1 ,             w r e q = 2
The required sweating, S W r e q , is calculated by the Equations (A7)–(A9).
r r e q = 1 w r e q 2 2
W h e n   w r e q 1 ,             S W r e q = E r e q r r e q
W h e n   w r e q = 2 ,             S W r e q = 2 · E r e q
Regarding the cold environment, the required clothing insulation index, IREQ, is applied to exposure working conditions both indoors and outdoors. Based on ISO-11079, the physiological strains are the mean skin temperature, skin wettedness and change in body heat content defining IREQ at two levels: one is I R E Q n e u t r a l , representing that almost no or minimal cooling of the human body during work (normal level); while the I R E Q m i n , representing that the highest admissible body cooling (subnormal level). Their corresponding thermal equilibriums are shown in Table A7.
Table A7. Thermal equilibriums at normal and subnormal levels.
Level I R E Q m i n (Subnormal) I R E Q n e u t r a l (Normal)
t s k [°C]30 t s k = 35.7 0.0285 × M
w [ND]0.06 w = 0.001 × M
The AED, here defined as the recommended maximum time of exposure with available or selected clothing, can be calculated in cold environments using Equations (A10)–(A12) for both levels as shown in Table A7.
S = M W R e s E R C
t c l = t s k I c l · ( M W R e s E S )
A E D = Q m a x S
where Q m a x and S are respectively the body limited maximum heat loss (40 Wh/m2) and the rate of change in heat content (W/m2). Here, we applied the thermal equilibriums at subnormal level for I R E Q m i n .

Appendix E

Field measurements were conducted in POPS A and POPS B (B-1 and B-2) in the Minato-ku Shibaura district, Tokyo, on a summer day, 31 July 2018 (partly cloudy, low wind), and a winter day, 26 December 2018 (sunny, low wind). Measurements were performed at pedestrian height (approximately 1.5 m above ground) using a mobile measurement system. The primary physical parameters recorded included air temperature, relative humidity, wind speed, and shortwave and longwave radiation (six directions).
From these data, mean radiant temperature (MRT), standard effective temperature (SET*), deep body temperature (DBT), and allowable exposure duration (AED) were calculated following the methods described in Section 2.4, Appendix C and Appendix D.
The measurement procedure and dataset are documented in a previous research [3]. Only summarized benchmark values necessary for simulation comparison are provided here. These values were used to determine the worst thermal periods and to establish empirical baselines for evaluating the thermal effects of the membrane structure.
Table A8. Measured thermal indices (summer, 31 July 2018, 12:00–15:00).
SiteAir Temp [°C]Wind Speed [m/s]MRT [°C]SET* [°C]DBT [°C]AED [min]
POPS A27–320.8–1.249–5234–3537.8–38.060–66
POPS B-132–342.0–2.248–5833–36≈37.945–78
POPS B-233–341.3–2.057–5936–3738.1–38.442–49
Values represent route-averaged measurements. Ranges reflect spatial and temporal variation during peak daytime hours.
Table A9. Measured thermal indices (winter, 26 December 2018).
SitePeriodAir Temp [°C]Wind Speed [m/s]MRT [°C]SET* [°C]DBT [°C]AED [h]
POPS A6:205.30.62.615.036.821.5
12:0011.51.511.419.936.8330
20:0010.90.77.618.736.833.3
POPS B-16:205.81.73.014.136.811.2
12:0011.51.917.520.336.8326.7
20:0011.10.88.819.036.833.1
POPS B-26:206.51.22.614.736.821.3
12:0012.31.717.520.936.8332.6
20:0011.91.18.219.036.833.3

References

  1. Jung, H. Urban planning policy for realizing public objectives through private development in Seoul. Sustainability 2019, 11, 2698. [Google Scholar] [CrossRef]
  2. Dimmer, C.; Kurose, T.; Maekawa, A.; Tchapi, M.; Shih, P.; Lien, C.; Hou, J.; Baba, Y.; Fuhrmann, E.; Beza, B.; et al. Privately Owned Public Space: The International Perspective; Center for Sustainable Urban Regeneration, The University of Tokyo: Tokyo, Japan, 2013. [Google Scholar]
  3. Abe, H.; Asawa, T. Proposal and validation of effective use of public open space and staying space of people having trouble returning home Part 2: Actual conditions of open space and effect verification of improvement measures on thermal environment. In Summaries of Technical Papers of Annual Meeting, Architectural Institute of Japan; Architectural Institute of Japan: Hokuriku, Japan, 2019; pp. 273–274. [Google Scholar]
  4. Minato City, Tokyo. Guidelines for Building Wind Mitigation Measures; Environmental Recycling Support Department: Tokyo, Japan, 2013. Available online: https://www.city.minato.tokyo.jp/documents/79236/birukazetebiki.pdf (accessed on 5 March 2026).
  5. Kobayashi, N. Present status of assessment for wind environment and problems. Wind Eng. JAWE 2005, 30, 303–306. [Google Scholar] [CrossRef]
  6. Soeda, M.; Ohno, R. Relationship between visual awareness and evaluation of street-scape: Part 3—Mitigation of a sense of oppression through architectural additional elements. In Summaries of Technical Papers of Annual Meeting; Architectural Institute of Japan: Tokai, Japan, 2003; pp. 713–714. [Google Scholar]
  7. Chen, L.; Ng, E. Outdoor thermal comfort and outdoor activities: A review of research in the past decade. Cities 2012, 29, 118–125. [Google Scholar] [CrossRef]
  8. Nasution, A.D.; Zahrah, W. Public open space privatization and quality of life, case study Merdeka Square Medan. Procedia Soc. Behav. Sci. 2012, 36, 466–475. [Google Scholar] [CrossRef]
  9. Huang, J.; Zhou, C.; Zhuo, Y.; Xu, L.; Jiang, Y. Outdoor thermal environments and activities in open space: An experiment study in humid subtropical climates. Build. Environ. 2016, 103, 238–249. [Google Scholar] [CrossRef]
  10. Seçkin, N.P. Environmental control in architecture by landscape design. A/Z ITU J. Fac. Arch. 2018, 15, 197–211. [Google Scholar] [CrossRef]
  11. Caldarice, O.; Pincegher, B.; Pizzorni, M.; Tollin, N. Urban Climate Shelters: A Nature-Based Solution for Urban Resilience. In Nature-Based Solutions for Urban and Peri-Urban Areas: For Resilient and Sustainable Urbanization; Firoz, C.M., Dashora, L.K., Shaw, R., Eds.; Springer Nature: Singapore, 2025; pp. 103–121. [Google Scholar] [CrossRef]
  12. Klemm, W.; Heusinkveld, B.G.; Lenzholzer, S.; van Hove, B. Street greenery and its physical and psychological impact on thermal comfort. Landsc. Urban Plan. 2015, 138, 87–98. [Google Scholar] [CrossRef]
  13. Tong, S.S.; Wong, N.H.; Tan, C.L.; Jusuf, S.K.; Ignatius, M.; Tan, E. Impact of urban morphology on microclimate and thermal comfort in northern China. Sol. Energy 2017, 155, 212–223. [Google Scholar] [CrossRef]
  14. He, J.; Hoyano, A. Measurement and simulation of the thermal environment in the built space under a membrane structure. Build. Environ. 2009, 44, 1119–1127. [Google Scholar] [CrossRef]
  15. Tian, G.; Fan, Y.; Gao, M.; Wang, H.; Zheng, H.; Liu, J.; Liu, C. Indoor thermal environment of thin membrane structure buildings: A review. Energy Build. 2021, 234, 110704. [Google Scholar] [CrossRef]
  16. Tian, G.; Fan, Y.; Wang, H.; Peng, K.; Zhang, X.; Zheng, H. Studies on the thermal environment and natural ventilation in the industrial building spaces enclosed by fabric membranes: A case study. J. Build. Eng. 2020, 32, 101651. [Google Scholar] [CrossRef]
  17. Suo, H.; Angelotti, A.; Zanelli, A. Thermal-physical behavior and energy performance of air-supported membranes for sports halls: A comparison among traditional and advanced building envelopes. Energy Build. 2015, 109, 35–46. [Google Scholar] [CrossRef]
  18. He, J.; Hoyano, A. Measurement and evaluation of the summer microclimate in the semi-enclosed space under a membrane structure. Build. Environ. 2010, 45, 230–242. [Google Scholar] [CrossRef]
  19. Mori Memorial Foundation. Tokyo Survey Book 2: Making Tokyo’s Open Spaces More Enjoyable; Mori Memorial Foundation: Tokyo, Japan, 2011; Available online: https://mori-m-foundation.or.jp/pdf/publication_18_en.pdf (accessed on 5 March 2026).
  20. Tokyo Metropolitan Government. Tokyo Metropolitan Comprehensive Design Permission Guidelines; Tokyo Metropolitan Government: Tokyo, Japan, 2024. Available online: https://www.toshiseibi.metro.tokyo.lg.jp/kenchiku/kijun/pdf/sogo_02.pdf (accessed on 5 March 2026).
  21. Yane-Connect. Metal Roofing Material Characteristics. Available online: https://yane-connect.com/variety/yane-sozai/metal/ (accessed on 5 March 2026).
  22. Ogawa, S. Study on Thermal Environment Formed in Membrane Roof Building Spaces and Its Improvement Methods. Master’s Thesis, Tokyo Institute of Technology, Tokyo, Japan, 2008. [Google Scholar]
  23. Yoshino, H.; Aozasa, K. Measurement on thermal environment of the atrium with passive environmental adjustment methods. AIJ J. Technol. Des. 1996, 2, 207–210. [Google Scholar] [CrossRef]
  24. León, J.; March, A. Urban morphology as a tool for supporting tsunami rapid resilience: A case study of Talcahuano, Chile. Habitat Int. 2014, 43, 250–262. [Google Scholar] [CrossRef]
  25. Taiyo Kogyo Corporation. Breaking Through What Membranes Can Do or Be. Available online: https://www.taiyokogyo.co.jp/english/techno/membrane/society.html (accessed on 5 March 2026).
  26. Hu, J.; Chen, W.; Qu, Y.; Yang, D. Safety and serviceability of membrane buildings: A critical review on architectural, material and structural performance. Eng. Struct. 2020, 210, 110292. [Google Scholar] [CrossRef]
  27. Yang, B.; Yang, Y.; Huo, Z.; Yu, Y. Advances in research on aging properties of polyvinyl chloride and polyvinylidene fluoride membranes. Constr. Build. Mater. 2023, 367, 130292. [Google Scholar] [CrossRef]
  28. Viscuso, S.; Endara Vargas, C.R.; Belotti, A.; Finetti, A.; Zanelli, A.; Block, P.; Boller, G.; Dewolf, C. Lightweight structures applied for the conservation of cultural heritage: Two case studies in Pompeii, Italy. In Proceedings of the IASS 2024 Symposium, Zurich, Switzerland, 26–30 August 2024; pp. 1–10. Available online: https://app.iass2024.org/files/IASS_2024_Paper_103.pdf (accessed on 5 March 2026).
  29. Li, Z.; Zhou, L.; Hong, X.; Qiu, S. Outdoor thermal comfort and activities in urban parks: An experiment study in humid subtropical climates. Build. Environ. 2024, 253, 111361. [Google Scholar] [CrossRef]
  30. Deng, Y.; Gan, D.; Tang, N.; Cai, Z.; Li, X.; Chen, S.; Li, X. Research on outdoor thermal comfort and activities in residential areas in subtropical China. Atmosphere 2022, 13, 1357. [Google Scholar] [CrossRef]
  31. van Ameijde, J.; Ma, C.Y.; Goepel, G.; Kirsten, C.; Wong, J. Data-driven placemaking: Data-driven placemaking: Public space canopy design through multi-objective optimisation considering shading, structural and social performance. Front. Archit. Res. 2022, 11, 308–323. [Google Scholar] [CrossRef]
  32. Liu, J.; Jiao, J.; Xie, Y.; Xu, Y.; Lin, B. Assessment on the expectation for outdoor usage and its influencing factors. Urban Clim. 2022, 42, 101132. [Google Scholar] [CrossRef]
  33. French, E.L.; Je, S.; Landman, K.; Brown, R.D. Designing public open space to support seismic resilience: A systematic review. Int. J. Disaster Risk Reduct. 2019, 34, 1–10. [Google Scholar] [CrossRef]
  34. 360 Research Reports. Architectural Membrane Market Report|Forecast (2034). Available online: https://www.360researchreports.com/ko/market-reports/architectural-membrane-market-205727 (accessed on 5 March 2026).
  35. Asawa, T.; Hoyano, A.; Nakaohkubo, K. Thermal design tool for outdoor spaces based on heat balance simulation using a 3D-CAD system. Build. Environ. 2008, 43, 2112–2123. [Google Scholar] [CrossRef]
  36. Architectural Institute of Japan (AIJ). AIJ Recommendations for Loads on Buildings; Architectural Institute of Japan: Tokyo, Japan, 2015. [Google Scholar]
  37. Asawa, T.; Hoyano, A. High-Resolution heat balance simulation for building and urban surfaces by combining the 3D CAD-based thermal environment simulator and CFD. In Proceedings of the Building Simulation 2011, Sydney, Australia, 14–16 November 2011; pp. 2565–2572. [Google Scholar]
  38. Chen, K. Formation factors of microclimate around a high-rise building in winter season—Examining by coupled analysis of heat balance simulation and CFD. J. Heat Isl. Inst. Int. 2017, 12, 9–20. [Google Scholar]
  39. Takata, M.; Hoyano, A.; Asawa, T. Development of 24 hours coupled analysis of heat balance and airflow using both numerical simulation on outdoor thermal environment and CFD. AIJ J. Technol. Des. 2018, 24, 715–719. [Google Scholar] [CrossRef]
  40. Watanabe, S.; Horikoshi, T. Calculation of mean radiant temperature in outdoors based on measurements. Jpn. J. Biometeorol. 2012, 49, 49–59. [Google Scholar] [CrossRef]
  41. Gagge, A.P.; Fobelets, A.P.; Berglund, L.G. A standard predictive index of human response to the thermal environment. ASHRAE Trans. 1986, 92, 709–731. [Google Scholar]
  42. Ishii, A. Evaluation Methods for Comfortable Thermal Environments. In Mechanism of Comfortable Thermal Environment: Toward Rich Living Spaces; The Society of Heating, Air-Conditioning and Sanitary Engineers of Japan (SHASE), Ed.; Maruzen Publishing: Tokyo, Japan, 2006; pp. 67–86. [Google Scholar]
  43. Ministry of the Environment, Japan. Study on Evaluation Indicators for Adaptation Measures. 2013. Available online: https://www.env.go.jp/air/report/h25-02/01-3.pdf (accessed on 5 March 2026).
  44. Kuwabara, K.; Mochida, T.; Nagano, K.; Shimakura, K. Experiment and evaluation of thermal sensation in outdoor environment. J. Hum. Living Environ. 2002, 9, 10–17. [Google Scholar] [CrossRef]
  45. Misaka, K.; Ishimaru, Y.; Horiguchi, Y.; Narita, K. Study on the effective utilization of outdoor space by mitigating thermal environment. Pap. Environ. Inf. Sci. 2017, 31, 131–136. [Google Scholar] [CrossRef]
  46. Ishii, A.; Katayama, T.; Shiotsuki, Y.; Yoshimizu, H.; Abe, Y. Experimental study on comfort sensation of people in the outdoor environment. J. Archit. Plan. Environ. Eng. (Trans. AIJ) 1988, 386, 28–37. [Google Scholar] [CrossRef]
  47. Kuwabara, K.; Horikoshi, T.; Mochida, T. A study on man’s thermal sensation and comfort sensation in outdoor thermal environment. In Technical Papers of the Annual Meeting of the Society of Heating, Air-Conditioning and Sanitary Engineers of Japan (SHASE); Society of Heating, Air-Conditioning and Sanitary Engineers of Japan (SHASE): Tokyo, Japan, 2004; pp. 565–568. [Google Scholar] [CrossRef]
  48. ISO 7933:2004; Ergonomics of the Thermal Environment—Analytical Determination and Interpretation of Heat Stress Using Calculation of the Predicted Heat Strain. ISO: Geneva, Switzerland, 2004.
  49. ISO 11079:2007; Ergonomics of the Thermal Environment—Determination and Interpretation of Cold Stress When Using Required Clothing Insulation (IREQ) and Local Cooling Effects. ISO: Geneva, Switzerland, 2007.
  50. Sawasaki, S.; Ooka, R.; Sakoi, T.; Tsuzuki, K.; Minami, Y. Study on thermal evaluation method for hot outdoor environment. Seisan Kenkyu 2006, 58, 323–327. [Google Scholar] [CrossRef]
  51. Sotama, M. Study of applying the cold index to disaster prevention. Rep. City Plan. Inst. Jpn. 2008, 6, 156–160. [Google Scholar] [CrossRef]
  52. Sakoi, T.; Mochida, T.; Nagano, K.; Shimakura, K. A proposal for revisions of ISO-7933 and ISO-11079. J. Hum. Living Environ. 2002, 9, 18–26. [Google Scholar] [CrossRef]
  53. Nakai, S.; Itoh, T.; Morimoto, T. Deaths from heat stroke in Japan: 1968–1994. Int. J. Biometeorol. 1999, 43, 124–127. [Google Scholar] [CrossRef]
  54. Watanabe, S.; Ishii, J. Effect of outdoor thermal environment on pedestrians’ behavior selecting a shaded area in a humid subtropical region. Build. Environ. 2016, 95, 32–41. [Google Scholar] [CrossRef]
  55. Ministry of the Environment, Japan. Heatstroke Environmental Health Manual (Netchusho Kankyo Hoken Manual); Ministry of the Environment: Tokyo, Japan, 2022. Available online: https://www.wbgt.env.go.jp/pdf/manual/heatillness_manual_full.pdf (accessed on 5 March 2026).
  56. Narita, K.-I.; Nonomura, Y.; Ogasawara, A. Wind tunnel test on convective mass transfer coefficient on urban surface: Study on convective heat transfer coefficient on outside building wall in an urban area—Part 2. J. Archit. Plann. Environ. Eng. (Trans. AIJ) 2000, 65, 69–76. [Google Scholar] [CrossRef] [PubMed]
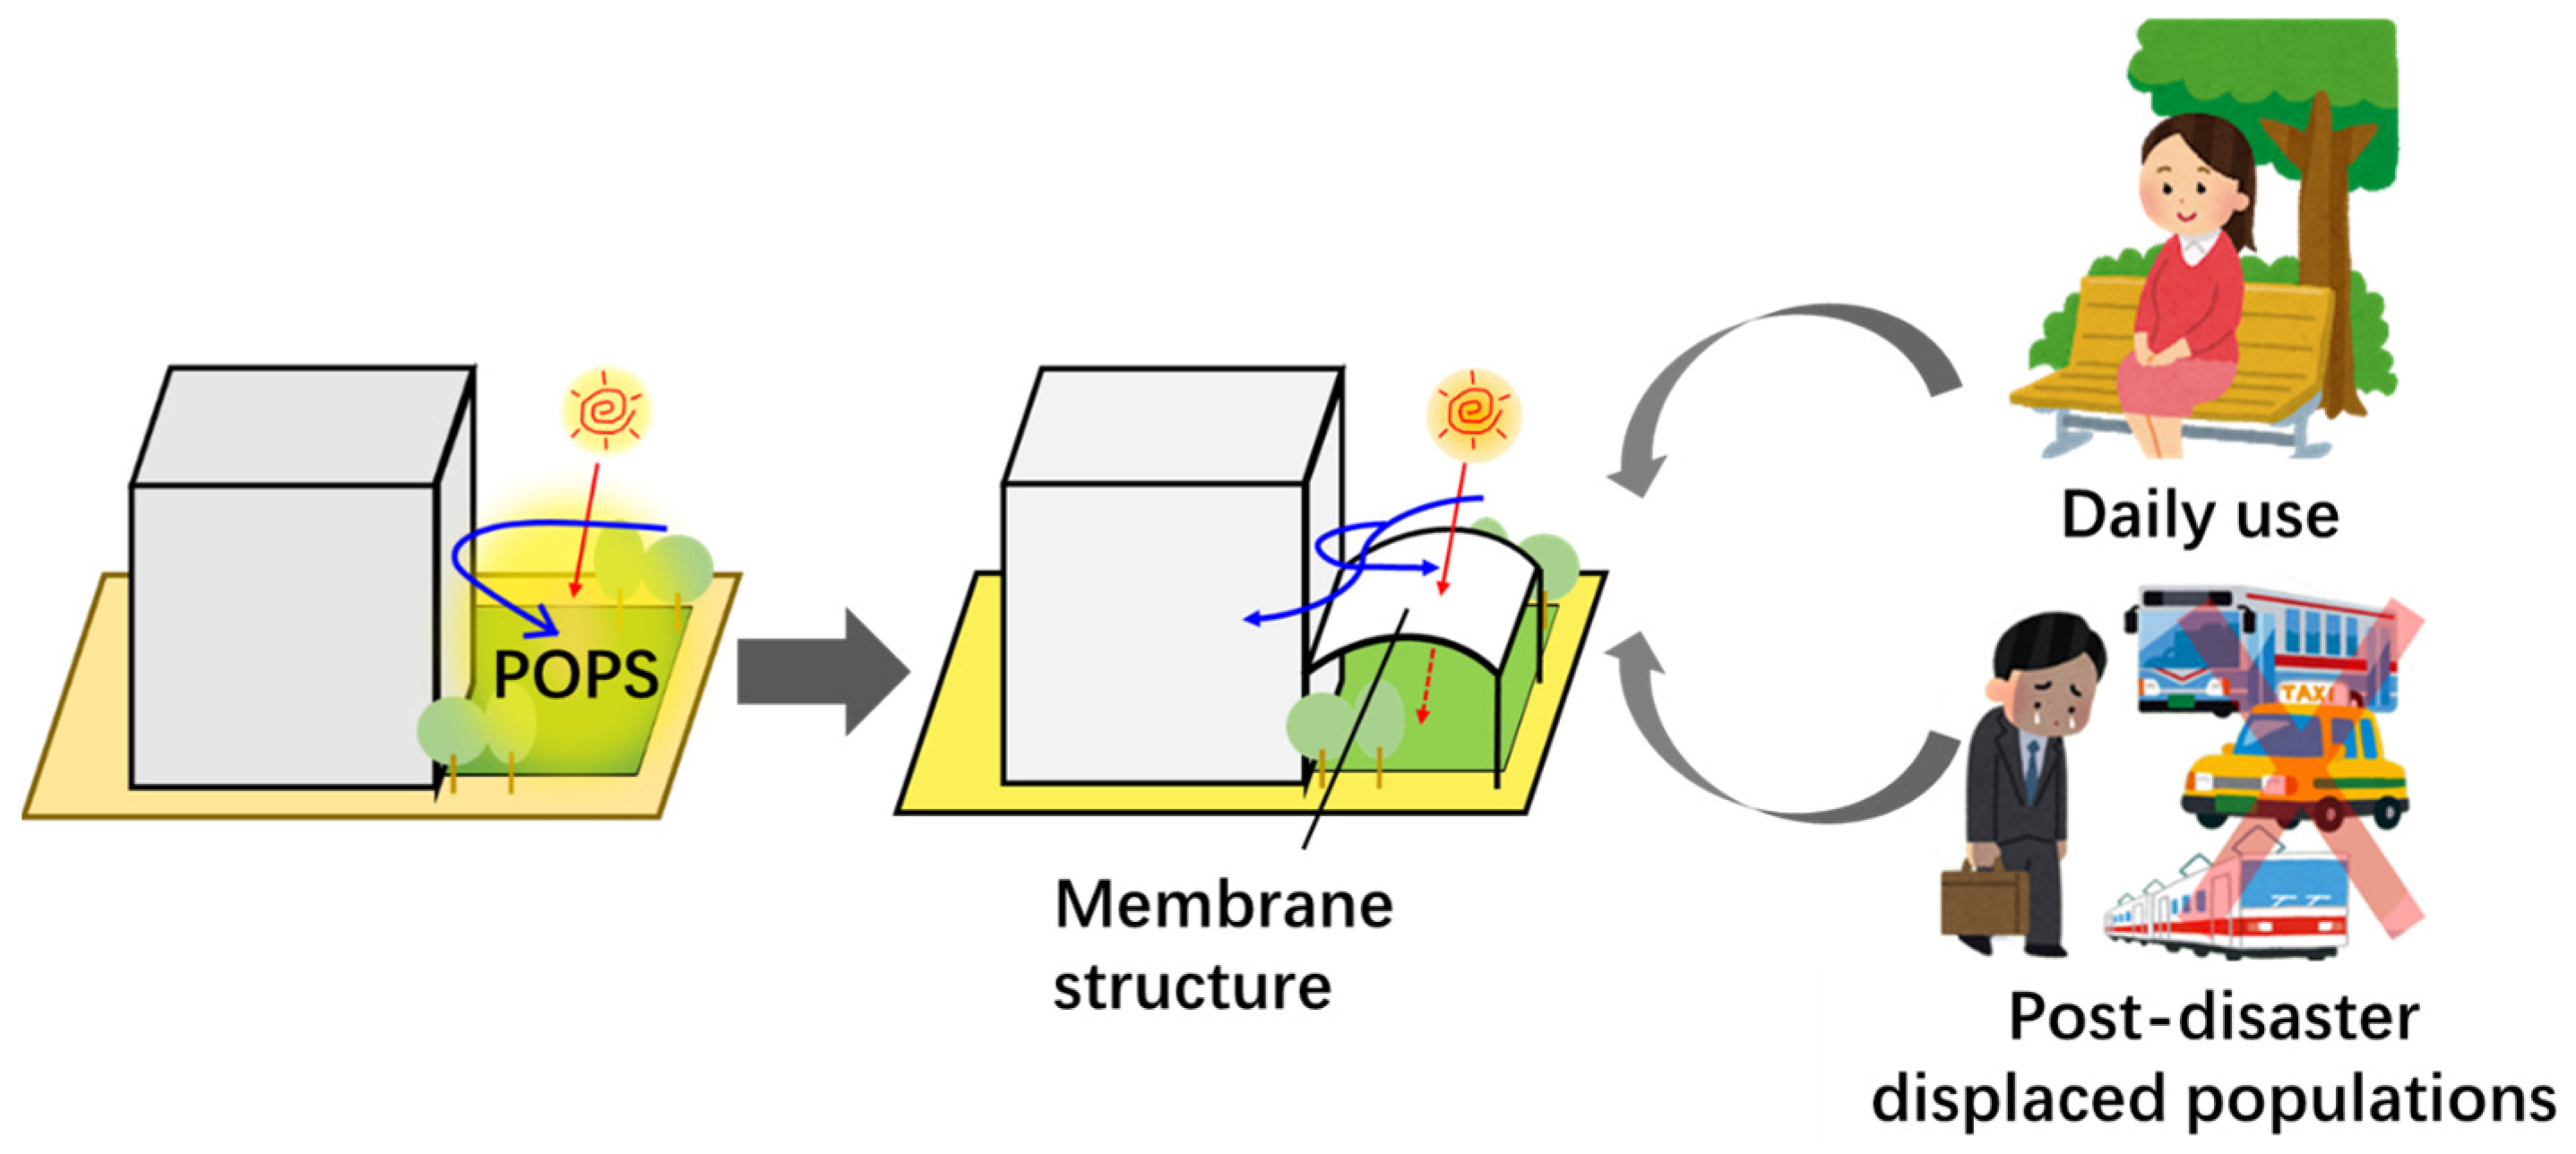
Figure 1. Conceptual framework illustrating the dual role of POPS in post-disaster sheltering and daily use.
Sustainability 18 04167 g001
Figure 2. Distribution of POPS in Tokyo (left, refers to [2,19]), location of Minato-ku Shibaura business area (right upper, base map derived from satellite imagery (Google Map, 2020)), studied POPS A, B-1, and B-2 (right lower, base map derived from satellite imagery (Google Map, 2020)) and photos taken in POPS A, B-1, and B-2 (right lower).
Sustainability 18 04167 g002
Figure 3. Simulation method coupling the heat balance and CFD.
Sustainability 18 04167 g003
Figure 4. Meteorological data on 2 August 2018 (a) and 29 December 2018 (b).
Sustainability 18 04167 g004
Figure 5. Design of the membrane structures for POPS A, B-1, and B-2 (base for visualizations derived from aerial imagery (Google Earth, 2020)).
Sustainability 18 04167 g005
Figure 6. Simulated MRT, surface temperature, and wind velocity before and after the application of membrane structure at 13:00 on 2 August 2018.
Sustainability 18 04167 g006
Figure 7. Predicted SET* (a), DBT (b), AED (c), and MRT (d) before and after membrane installation in POPS A, B-1, and B-2 at 13:00 on 2 August 2018. Dashed columns indicate values calculated from in situ measurements on 31 July 2018. In subplot (b), the light pink background denotes the temperature range exceeding the upper limit of the low health risk threshold for DBT.
Sustainability 18 04167 g007
Figure 8. Simulated MRT (a), surface temperature (b), and wind velocity (c) before and after the application of membrane structure at 2:00 on 29 December 2018.
Sustainability 18 04167 g008
Figure 9. Predicted SET* (a), DBT (b), AED (c), and MRT (d) before and after the application of membrane structure at 2:00 on 29 December 2018.
Sustainability 18 04167 g009
Table 1. Thermophysical parameters of the membrane structure input into the simulation.
Reflectivity [-]Emissivity [-]Thermal Conductivity [W/(m·K)]Thickness [mm]
0.740.090.1030.83
Table 2. SET*, DBT, AED, and MRT values for the summer scenario, with absolute differences between simulated before/after membrane installation and between measured baseline and simulated post-installation conditions for POPS A, B-1, and B-2.
IndexPOPSSimulated Values 1Measured Value 2Absolute Difference
Before 3After 4Before 3Simulated:
Before 3 vs. After 4
Measured Before 3 vs.
Simulated After 4
SET*
[°C]
A34.832.434.62.42.2
B-136.334.635.31.70.7
B-236.432.736.83.74.1
DBT
[°C]
A38.63737.91.60.9
B-138.337.137.91.20.8
B-238.23738.21.21.2
AED 5
[min]
A5676622014
B-1445756131
B-24372442928
MRT
[°C]
A57.536.250.221.314
B-158.350.954.47.43.5
B-254.836.958.317.921.4
1 Index calculated from simulated data using the models described in Section 2.4. 2 Index calculated from measured data using the models described in Section 2.4. 3 Before: POPS without membrane structures installed (i.e., prior to installing membrane structures). 4 After: POPS with membrane structures installed. 5 AED is reported in minutes for the summer scenario, as exposure durations are relatively short.
Table 3. SET*, DBT, AED, and MRT values for the winter scenario, with absolute differences between simulated before/after membrane installation for POPS A, B-1, and B-2.
IndexPOPSSimulated Values 1Absolute Difference
Before 2After 3Before 2 vs. After 3
SET*
[°C]
A10.811.30.5
B-110.911.30.4
B-210.711.40.7
DBT
[°C]
A36.803236.80430.0011
B-136.803436.80430.0009
B-236.803136.80430.0012
AED 4
[h]
A1.321.590.27
B-11.411.650.24
B-21.221.320.1
MRT
[°C]
A−1.53.414.91
B-1−0.23.443.64
B-2−1.03.524.52
1 Index calculated from simulated data using the models described in Section 2.4. 2 Before: POPS without membrane structures installed (i.e., prior to installing membrane structures). 3 After: POPS with membrane structures installed. 4 AED is reported in hours for the winter scenario, because cold-related limits are longer.
Disclaimer/Publisher’s Note: The statements, opinions and data contained in all publications are solely those of the individual author(s) and contributor(s) and not of MDPI and/or the editor(s). MDPI and/or the editor(s) disclaim responsibility for any injury to people or property resulting from any ideas, methods, instructions or products referred to in the content.