


Abstract
Wildfire monitoring systems increasingly rely on satellite-derived risk surfaces to support resource-constrained prioritization. However, less attention has been paid to how spatial aggregation interacts with alarm sparsity in shaping event-level wildfire capture. This study conducts a retrospective evaluation of percentile-based wildfire alarm regimes in California during the 2024 fire season. Using VIIRS-derived risk surfaces and MTBS burned-area perimeters, the analysis examines three aggregation scales (375, 1000, and 5000 m) under fixed alarm budgets (top 1%, top 5%, and top 10%). Event-level capture was evaluated by aggregating row-level capture values within each MTBS event, with the primary specification based on maximum event-level capture and a threshold of 0.02. Across 2078 unique wildfire events, the effect of spatial aggregation was conditional on alarm sparsity. Under the most restrictive budget (top 1%), scale effects were weak and non-monotonic. In contrast, under the top 5% and top 10%, the coarsest scale (5000 m) consistently produced the highest event-level threshold-exceedance rates. Robustness checks using mean event-level capture and a stricter threshold of 0.05 yielded qualitatively similar patterns under moderate alarm budgets. These findings indicate that the effect of spatial aggregation cannot be interpreted independently of alarm-budget design. Rather than treating spatial resolution as inherently beneficial or detrimental, the study shows that its implications depend on how event-level capture is evaluated under constrained alarm allocation.
1. Introduction
Wildfire risk assessment and monitoring have become central themes in sustainability-oriented disaster management research. Recent studies have applied machine learning and remote sensing techniques to map forest fire risk zones and assess regional vulnerability under climate and land-use change scenarios [1,2]. Such approaches typically focus on improving spatial resolution, predictive accuracy, or scenario consistency. However, operational wildfire management involves not only measurement precision but also decision constraints, particularly under limited resource conditions. In California, where thousands of wildfires are recorded annually across heterogeneous terrain, suppression agencies face persistent capacity constraints that require spatial prioritization of monitoring and intervention efforts. During the 2024 fire season alone, resource allocation decisions had to be made across thousands of candidate locations under budgets that permitted active response to only a small fraction of flagged areas. Under such conditions, the question of how spatial aggregation affects the distribution of alarm candidates becomes directly relevant to whether wildfire events are captured within operational alarm regimes. If aggregation scale alters which events exceed policy-relevant capture thresholds—and does so differently depending on how restrictive the alarm budget is—then spatial resolution is not merely a measurement attribute but a structural parameter of the decision system itself.
Satellite-based fire monitoring has evolved substantially with advances in active-fire detection algorithms. The MODIS Collection 6 product introduced refinements in contextual detection and false alarm control [3], while the VIIRS 375 m product enhanced spatial localization and sensitivity relative to earlier systems [4]. Burned-area mapping research has similarly emphasized algorithmic improvements and validation, including efforts to balance omission and commission errors [5] and to improve temporal consistency in Collection 6 burned-area products [6]. Validation studies, however, continue to report spatially heterogeneous performance across landscapes [7].
Although these studies significantly advance measurement reliability, comparatively less attention has been given to how spatial and temporal aggregation influence downstream policy construction. Classical spatial analysis has long demonstrated that aggregation scale can alter statistical inference, as articulated in the modifiable areal unit problem and ecological aggregation bias [8]. In wildfire contexts, such aggregation choices may reshape the distribution of alarm candidates derived from continuous risk surfaces.
Operational systems typically prioritize only a small subset of high-risk locations, often defined by top-K percentile selection. Under such sparsity constraints, aggregation effects may induce scale-dependent changes in event-level capture under sparse alarm budgets. While sustainability research increasingly integrates remote sensing platforms such as Google Earth Engine for large-scale hazard assessment [9,10], the interaction between aggregation scale and alarm sparsity remains insufficiently examined.
This study investigates how spatial–temporal aggregation interacts with sparsity-constrained alarm budgets in wildfire monitoring. Using VIIRS active-fire observations evaluated against Monitoring Trends in Burn Severity (MTBS) burned-area perimeters [11], the analysis identifies empirical shifts in event-level threshold-exceedance behavior across spatial scales. The findings contribute to sustainability-oriented wildfire risk management by highlighting conditions under which improvements in measurement resolution do not necessarily translate into stable or actionable policy outputs. This study does not evaluate predictive accuracy. Instead, it evaluates whether spatial resolution alters the event-level viability of percentile-based alarm allocation under fixed resource constraints. In California, where suppression agencies must allocate limited inspection and response capacity across thousands of candidate fire locations each season, the question of which spatial units are prioritized is not merely technical but operationally consequential. If aggregation scale changes which wildfire events are captured above policy-relevant thresholds—and does so differently depending on alarm-budget restrictiveness—then resolution choices carry decision-structural implications that extend beyond measurement fidelity. This reframes spatial resolution as a policy-coupled structural parameter rather than a measurement-quality attribute.
2. Related Works
2.1. Satellite-Based Fire Detection and Burned-Area Mapping
Satellite fire monitoring has evolved substantially with improvements in active-fire detection algorithms and burned-area mapping methodologies. The MODIS Collection 6 active-fire algorithm introduced refinements in contextual detection and false alarm reduction [3], while the VIIRS 375 m product improved spatial localization and sensitivity, particularly for small or low-intensity fires [4]. These algorithmic advances significantly enhanced spatial and temporal detail in global fire monitoring.
Burned-area products have undergone parallel development. The Collection 6 MODIS burned-area algorithm incorporated methodological updates to improve temporal consistency and mapping reliability [6]. Validation studies demonstrated spatial heterogeneity in detection performance across ecosystems [7]. Landsat-based mapping approaches emphasized balancing omission and commission errors through two-phase classification strategies [5], while multi-sensor fusion methods integrating Landsat and Sentinel-2 further refined spatial resolution and change detection capacity [12]. In addition to algorithmic developments, event-level decomposition approaches such as the Global Fire Atlas illustrated how temporal segmentation influences fire characterization [13]. These advances collectively improved measurement precision but primarily addressed detection accuracy rather than downstream decision structures.
Within sustainability, wildfire risk mapping has increasingly integrated remote sensing, machine learning, and climate scenario modeling. Studies have mapped forest fire risk zones using machine learning techniques [1], conducted regional risk assessment using MODIS data [14], and evaluated wildfire hazard under emission scenarios and wildland–urban interface expansion [15]. Scenario-based assessments have further examined land cover vulnerability under wildfire progression [2]. While these studies enhance predictive modeling and spatial hazard characterization, they typically evaluate performance in terms of prediction accuracy or risk intensity rather than structural stability of operational alarm regimes.
2.2. Multi-Scale Analysis and Aggregation Effects
Spatial aggregation has long been recognized as a structural determinant of analytical outcomes. The modifiable areal unit problem (MAUP) demonstrates that statistical results may vary depending on zoning or spatial unit definition [16], while ecological aggregation bias warns against inference distortions under grouped data [8]. These foundational principles imply that aggregation is not a neutral transformation but an operation capable of reshaping statistical distributions and ranking structures.
In wildfire research, aggregation decisions influence event delineation, burned-area estimation, and severity classification. Burned-area validation studies report sensitivity to spatial resolution and temporal compositing strategies [7]. Sentinel-2 time-series approaches have demonstrated that mapping consistency varies across temporal aggregation windows [17]. Radar–optical integration methods further highlight resolution-dependent classification variability [18].
Recent advances in cloud-based geospatial processing platforms, particularly Google Earth Engine [10], have enabled scalable multi-resolution analysis. Sustainability-oriented hazard assessments increasingly leverage such platforms for flood mapping [9] and fire risk analysis. However, while these platforms facilitate flexible aggregation, the structural implications of scale choices for downstream decision systems remain insufficiently investigated.
Multi-scale remote sensing research frequently reports that finer resolution improves spatial detail and classification accuracy. Nevertheless, aggregation-induced shifts in ranking stability or alarm prioritization have not been systematically examined in wildfire monitoring contexts. This gap becomes critical when alarm systems operate under resource-constrained selection mechanisms.
2.3. Threshold-Based Policies and Sparse Decision Systems
Operational wildfire management is constrained by limited suppression capacity and inspection resources. Consequently, alarm systems typically prioritize only a small subset of high-risk locations, often defined by percentile-based or threshold-based selection rules. Such mechanisms convert continuous risk surfaces into sparse alarm regimes.
In the classification literature, threshold choice is known to influence precision–recall trade-offs and class imbalance behavior [19]. Calibration strategies such as probabilistic scaling further affect decision thresholds under imbalanced conditions [20]. While these methods are widely discussed in machine learning, wildfire monitoring studies rarely frame alarm construction as a sparsity-constrained policy design problem.
Sustainability research has emphasized hazard risk zoning and vulnerability prioritization [1,21], but typically evaluates outcomes in terms of predictive skill or exposure reduction rather than event-level viability under sparse alarm allocation. Under extreme-sparsity conditions—such as top 1% selection—aggregation effects may induce degenerate alarm regimes in which meaningful spatial overlap with observed burned areas becomes unstable.
Thus, although extensive literature addresses detection accuracy and burned-area validation, comparatively limited work has examined how aggregation scale interacts with percentile-based alarm policies to shape regime transitions between stable prioritization and very low event-level threshold-exceedance performance.
2.4. Research Gap and Contribution
Despite substantial advances in satellite fire detection, burned-area mapping, and sustainability-oriented risk assessment, existing studies predominantly evaluate performance in terms of measurement accuracy, classification skill, or predictive improvement. The structural consequences of spatial aggregation under operational sparsity constraints remain largely unexamined.
Three observations emerge from the literature: First, improvements in spatial resolution are generally treated as monotonically beneficial. Higher resolution is assumed to enhance localization, reduce omission error, and increase mapping fidelity. However, this assumption is rarely tested under fixed resource constraints where only a small proportion of spatial units can be selected for intervention. Second, aggregation studies emphasize statistical sensitivity to zoning and resolution (MAUP), but typically focus on parameter estimation bias or variance distortion. The interaction between aggregation and percentile-based alarm policies has not been systematically evaluated in hazard monitoring systems. Third, sustainability-oriented wildfire studies concentrate on exposure assessment, vulnerability mapping, or climate scenario analysis. These frameworks assess spatial patterns of risk but do not examine whether the decision regime itself remains stable across aggregation scales. Accordingly, a conceptual gap exists at the intersection of:
- Multi-scale remote sensing;
- Sparsity-constrained alarm policies;
- Operational hazard management.
This study addresses this gap by examining whether spatial aggregation scale alters the event-level viability of percentile-based alarm allocation in wildfire monitoring. Rather than asking whether higher resolution improves detection accuracy, the analysis investigates whether aggregation scale shifts the system between higher or lower event-level threshold-exceedance performance under fixed top-K selection rules.
Critically, the contribution does not rest on the well-established observation that coarser spatial resolution reduces spatial detail. If the study merely demonstrated that aggregation degrades detection performance, the finding would restate a known technical property rather than advance scientific understanding. Instead, the empirical results reveal that the effect of aggregation on event-level capture is directionally conditional on alarm sparsity: under moderate alarm budgets, coarser aggregation consistently improved event-level threshold-exceedance rates, whereas under extreme sparsity, the effect was weak and non-monotonic. This conditionality cannot be derived from the general principle of aggregation-induced information loss and constitutes the primary empirical contribution. By reframing spatial resolution as a structural control parameter rather than a purely measurement attribute, the study contributes:
- An event-level evaluation perspective on wildfire alarm design;
- An empirical characterization of scale–sparsity interaction;
- A policy-coupled interpretation of spatial aggregation under constrained alarm allocation.
This perspective advances sustainability-oriented hazard research by linking measurement scale directly to event-level wildfire capture under constrained alarm allocation.
3. Materials and Methods
3.1. Study Area and Data
3.1.1. Study Area and Temporal Scope
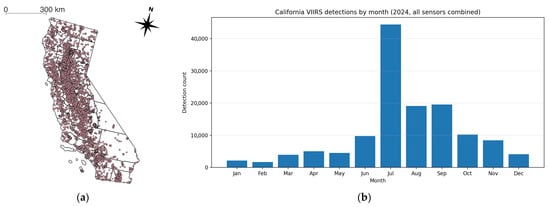
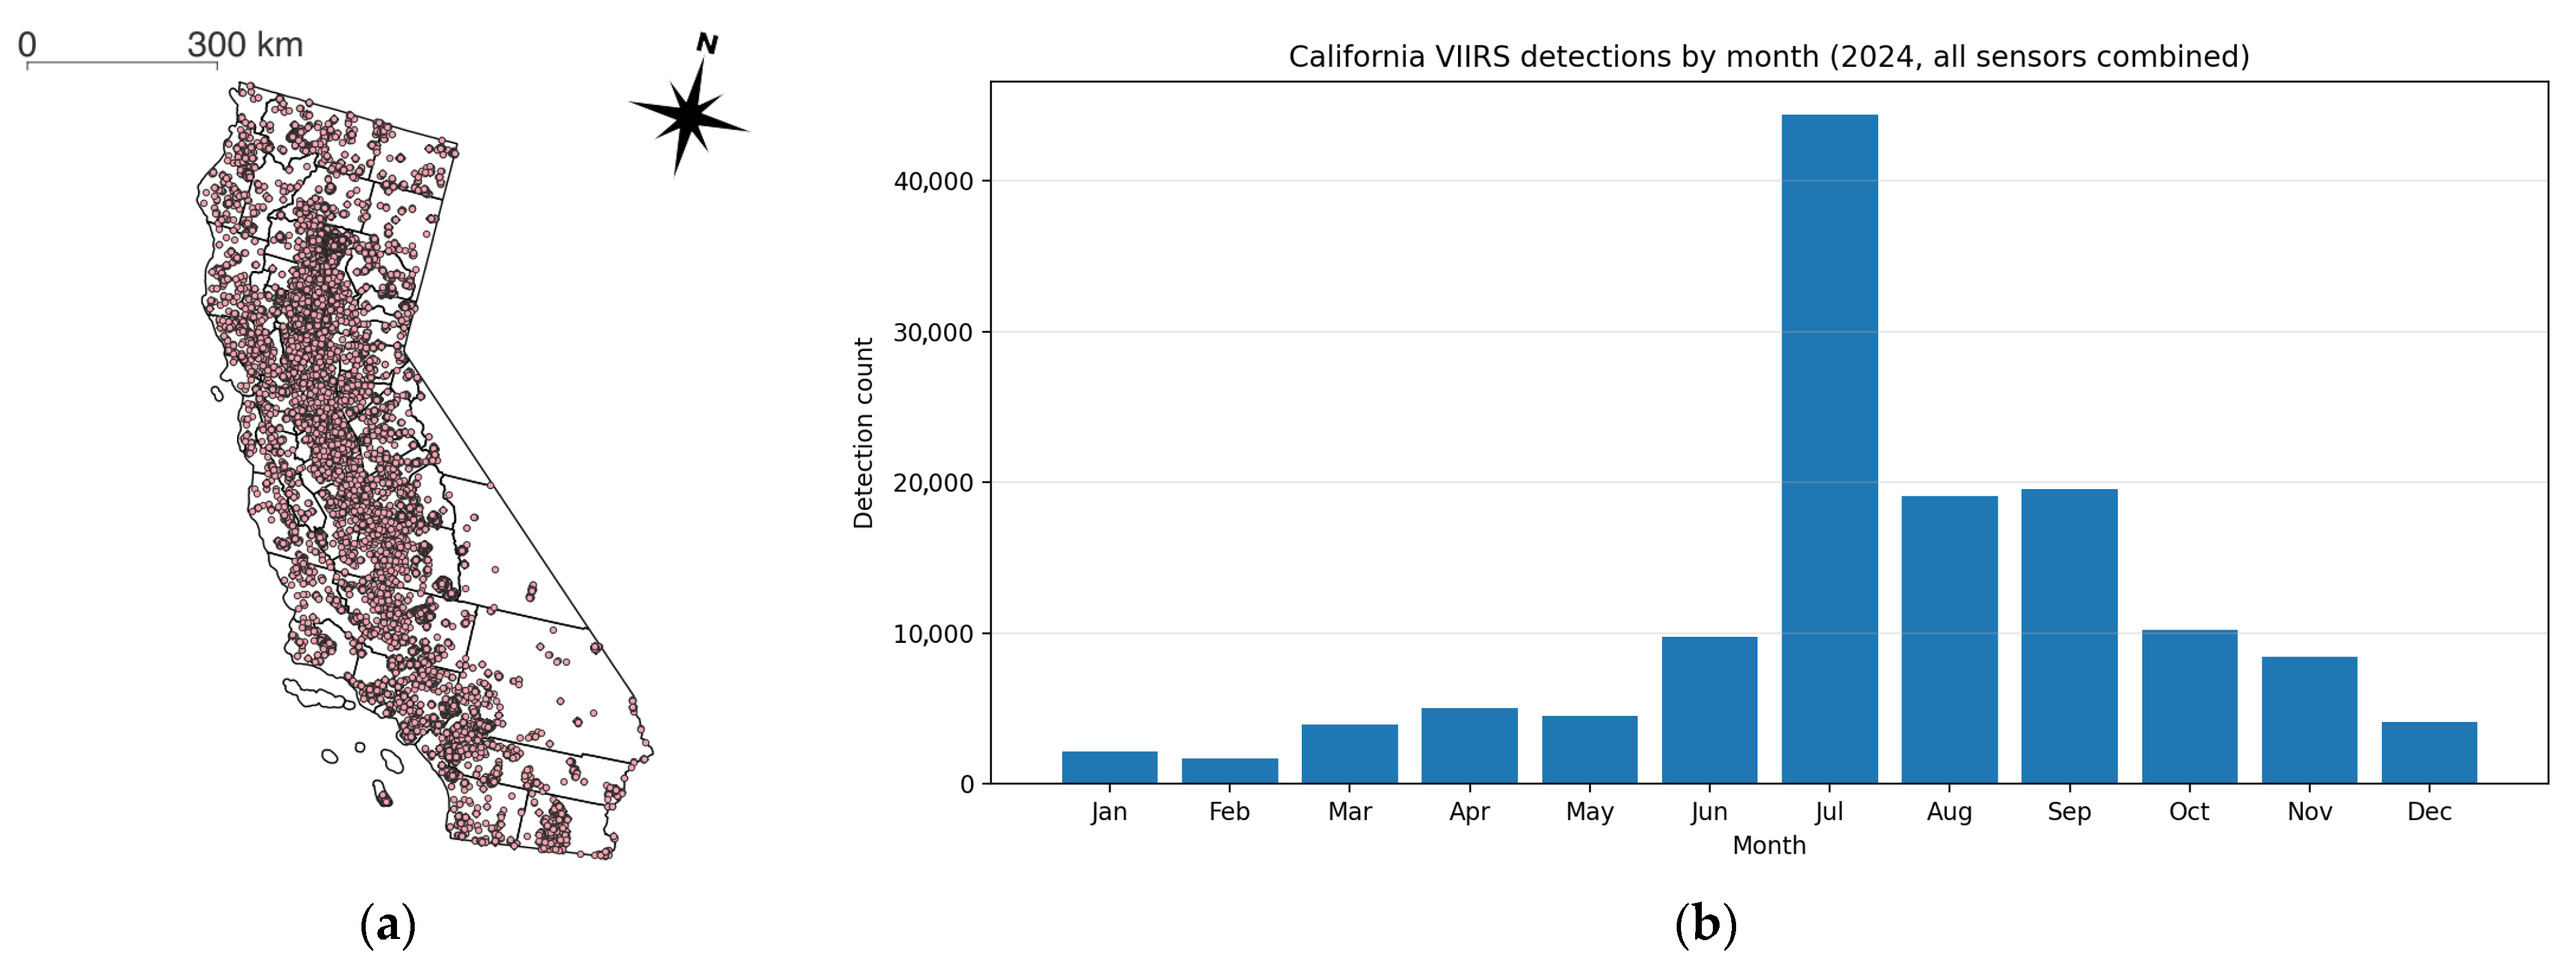
This study evaluates wildfire alarm regimes in California (CA), a region characterized by recurrent large-scale wildfires and heterogeneous fire dynamics. In this study, the empirical analysis is restricted to the 2024 core fire season (1 June to 31 October), which serves as the common temporal frame for all reported results (Figure 1). Restricting the study period to a single fire season improves internal consistency between the analytical design and the reported results while avoiding additional temporal heterogeneity that is not explicitly examined in the present version. All analyses are conducted within official state boundaries derived from the TIGER/2018 administrative dataset (Table 1).
Figure 1.
Spatial and temporal presentation of the VIIRS data used in the California 2024 analysis. (a) Spatial distribution of VIIRS active-fire detections across California during the 2024 analysis period. (b) Monthly count of VIIRS detections in California in 2024, aggregated across all sensors.
Table 1.
Dataset used in this study.
3.1.2. Active-Fire Observations
Active-fire detections are derived from the Visible Infrared Imaging Radiometer Suite (VIIRS) 375 m product provided by NASA LANCE. Figure 1 provides the spatial and temporal distribution of the VIIRS active-fire detections used in the California 2024 analysis. This dataset supplies daily fire radiative power (FRP) observations and detection counts at 375 m native resolution. VIIRS data are used to construct windowed wildfire risk scores. For each temporal window, FRP values and detection counts are aggregated spatially and temporally to produce a continuous risk surface. These risk surfaces form the basis for percentile-based alarm construction. Importantly, VIIRS serves as the decision input layer, not the evaluation benchmark.
3.1.3. Burned-Area Reference
Observed wildfire perimeters are obtained from the Monitoring Trends in Burn Severity (MTBS) dataset. MTBS provides event-level polygon boundaries derived from Landsat imagery. MTBS polygons serve as the reference layer for evaluation, enabling computation of spatial overlap between alarm regions and actual burned areas. The study does not use MTBS for model calibration; it is reserved exclusively for ex-post validation.
3.2. Experimental Design Overview
3.2.1. Analytical Focus of the Reported Design
Wildfire monitoring research has largely proceeded under the implicit assumption that improvements in spatial resolution enhance decision quality. While advances in detection algorithms and burned-area mapping have improved measurement accuracy, comparatively less attention has been given to how spatial aggregation interacts with sparsity-constrained alarm policies.
The analytical focus of the present study is a retrospective comparison of percentile-based wildfire alarm regimes across multiple aggregation scales under fixed alarm budgets. Rather than asking whether finer resolution improves predictive accuracy, the study examines whether aggregation scale alters the event-level performance of alarm allocation regimes when only a limited proportion of spatial units can be selected for intervention. The reported design, therefore, centers on the interaction between aggregation scale and alarm sparsity within a common observational and evaluative framework.
3.2.2. Experimental Variables and Design Rationale
To examine how spatial aggregation interacts with alarm sparsity in shaping event-level wildfire capture, the reported analysis varies spatial scale and alarm sparsity while holding measurement inputs and evaluation references constant (Table 2). The reported main analysis is restricted to California in 2024 under global calibration with a 7-day temporal window.
Table 2.
Experimental variables and design structure.
The first manipulated factor is spatial aggregation scale, evaluated at 375, 1000, and 5000 m. These three scales were selected to compare the native VIIRS resolution, an intermediate coarser resolution, and a substantially aggregated resolution within a common retrospective design. The second manipulated factor is alarm sparsity, represented by percentile-based top-K selection levels of 1%, 5%, and 10%, which provide a controlled representation of increasingly permissive alarm budgets.
All other components—including temporal window length, study period, input measurement (VIIRS), and evaluation reference (MTBS)—are held constant so that observed differences can be attributed to the interaction between aggregation scale and alarm sparsity rather than to changes in data source or evaluation basis. The reported outcome is the event-level threshold-exceedance rate, evaluated from aggregated event-level capture values. Robustness is additionally examined under alternative event-level aggregation and threshold specifications.
3.3. Event-Level Evaluation Framework
To evaluate how spatial aggregation and alarm sparsity shape event-level wildfire capture, the analysis constructs percentile-based alarm regimes under varying spatial scales and examines their overlap with observed burned areas under fixed sparsity constraints. The reported results focus on event-level threshold-exceedance behavior rather than configuration-level collapse classification.
3.3.1. Temporal Aggregation and Risk Surface Definition
Let the fire season be partitioned into non-overlapping temporal windows of fixed length days (baseline: 7 days). The 7-day window was adopted as a regime-design horizon for retrospective structural comparison rather than as an operational dispatch horizon. The objective is not to optimize immediate response timing, but to examine whether aggregation scale alters regime viability under a common temporal summarization rule. Each window is indexed by . Let denote a spatial pixel at the native VIIRS resolution (375 m). For each pixel, and window , a wildfire risk score is defined as (1):
where denotes the fire radiative power observed at pixel on day . denotes the number of days within the window on which a fire detection is recorded at pixel . is a non-negative weighting parameter that balances fire intensity and detection frequency. In the baseline specification, , giving equal emphasis to cumulative intensity and detection count. The inclusion of both cumulative FRP and detection count stabilizes the risk score under sparse detection regimes. FRP captures intensity magnitude, while captures persistence.
3.3.2. Spatial Aggregation
To evaluate scale effects, the native-resolution scores are aggregated to coarser grid cells. Let denote spatial aggregation scale (in meters), and let index coarse grid cells at resolution . is the set of native pixels that fall within coarse cell at scale . The aggregated risk score for coarse cell and window is as (2):
This aggregation uses a sum operator to preserve cumulative fire signal intensity within each coarse spatial unit. Spatial aggregation modifies the distribution and ranking of risk values across spatial units. Because alarm selection is ranking-based, aggregation scale directly influences prioritization outcomes.
3.3.3. Sparsity-Constrained Alarm Selection
Operational wildfire management requires selecting only a limited proportion of spatial units for intervention. Let denote the alarm sparsity level expressed as a percentage. For each window and scale , a threshold is defined such that (3):
That is, only the top of spatial units by risk score are selected. Define the alarm indicator function (4):
This converts the continuous risk surface into a binary alarm regime constrained by resource availability. Under fixed , changes in aggregation scale alter which spatial units are selected, thereby reshaping the alarm regime.
3.3.4. Burned-Area Capture Metric
Let denote the burned-area polygon of wildfire event in the MTBS dataset. For a given temporal window , spatial scale , and alarm sparsity level , row-level burned-area capture is defined as the proportion of the event polygon intersected by the union of selected alarm cells:
where denotes coarse grid cell at spatial scale , and is the alarm indicator for cell under window , scale , and sparsity level . Thus, measures how effectively the selected alarm cells overlap with the observed burned perimeter of the wildfire event .
Because multiple row-level records may be associated with the same MTBS wildfire event under a given configuration, row-level capture values are not used directly as the reported outcome. Instead, they provide the basis for deriving event-level capture values, which are then used in the threshold-exceedance evaluation described below. Accordingly, the reported analysis focuses on event-level capture behavior rather than configuration-level median summaries.
3.3.5. Event-Level Capture Aggregation
For event-level evaluation, row-level capture values were aggregated within each MTBS wildfire event identified by Event_ID. Because multiple row-level records may be associated with the same wildfire event under a given configuration, a single event-level capture value was derived for each event. The primary specification used the maximum capture observed within the event:
where denotes the set of row-level records associated with wildfire event . Equation (6) defines the primary event-level aggregation rule used in the main analysis. This maximum-based specification reflects whether a wildfire event was meaningfully captured under the alarm configuration, even when row-level capture varies across associated records.
For robustness analysis, an alternative mean-based aggregation rule was also considered:
The reported results primarily rely on , while is used to assess sensitivity to the event-level aggregation rule.
3.3.6. Threshold-Exceedance Evaluation Across Scales
Scale effects were evaluated by comparing event-level threshold-exceedance rates across spatial aggregation scales under fixed alarm sparsity. For a given event-level capture value and threshold , the exceedance status of wildfire event is defined as:
where is the indicator function, equal to 1 when the aggregated event-level capture exceeds the threshold and 0 otherwise. In the primary specification, and , corresponding to the criterion .
For each configuration, the analysis reports the number of unique wildfire events, the number exceeding the threshold, the exceedance rate, and Wilson 95% confidence intervals. This design enables direct comparison of scale-dependent event-level capture while holding alarm-budget constraints fixed.
3.3.7. Robustness Checks
To summarize exceedance behavior at the configuration level, the event-level threshold-exceedance rate is defined as:
where denotes the set of unique wildfire events in the study period, and is the event-level threshold-exceedance indicator defined in Equation (8). Equation (9) therefore gives the proportion of wildfire events exceeding the specified threshold under spatial scale , alarm sparsity level , and threshold .
Two robustness checks were conducted to assess whether the main qualitative pattern depended on a single event-aggregation rule or a single threshold choice. First, event-level capture was aggregated using the mean rather than the maximum value, while retaining the threshold of 0.02, that is, . Second, the main aggregation rule was retained while the threshold was increased from 0.02 to 0.05, that is, . These alternative specifications were used to evaluate whether the main scale–sparsity pattern remained qualitatively stable under different analytical choices. Additional robustness evidence was also examined using fixed-threshold summaries across multiple temporal windows and spatial scales.
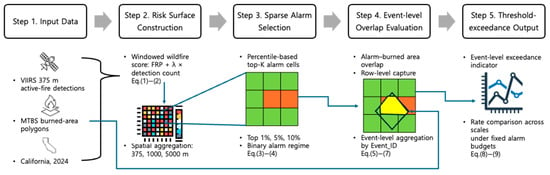
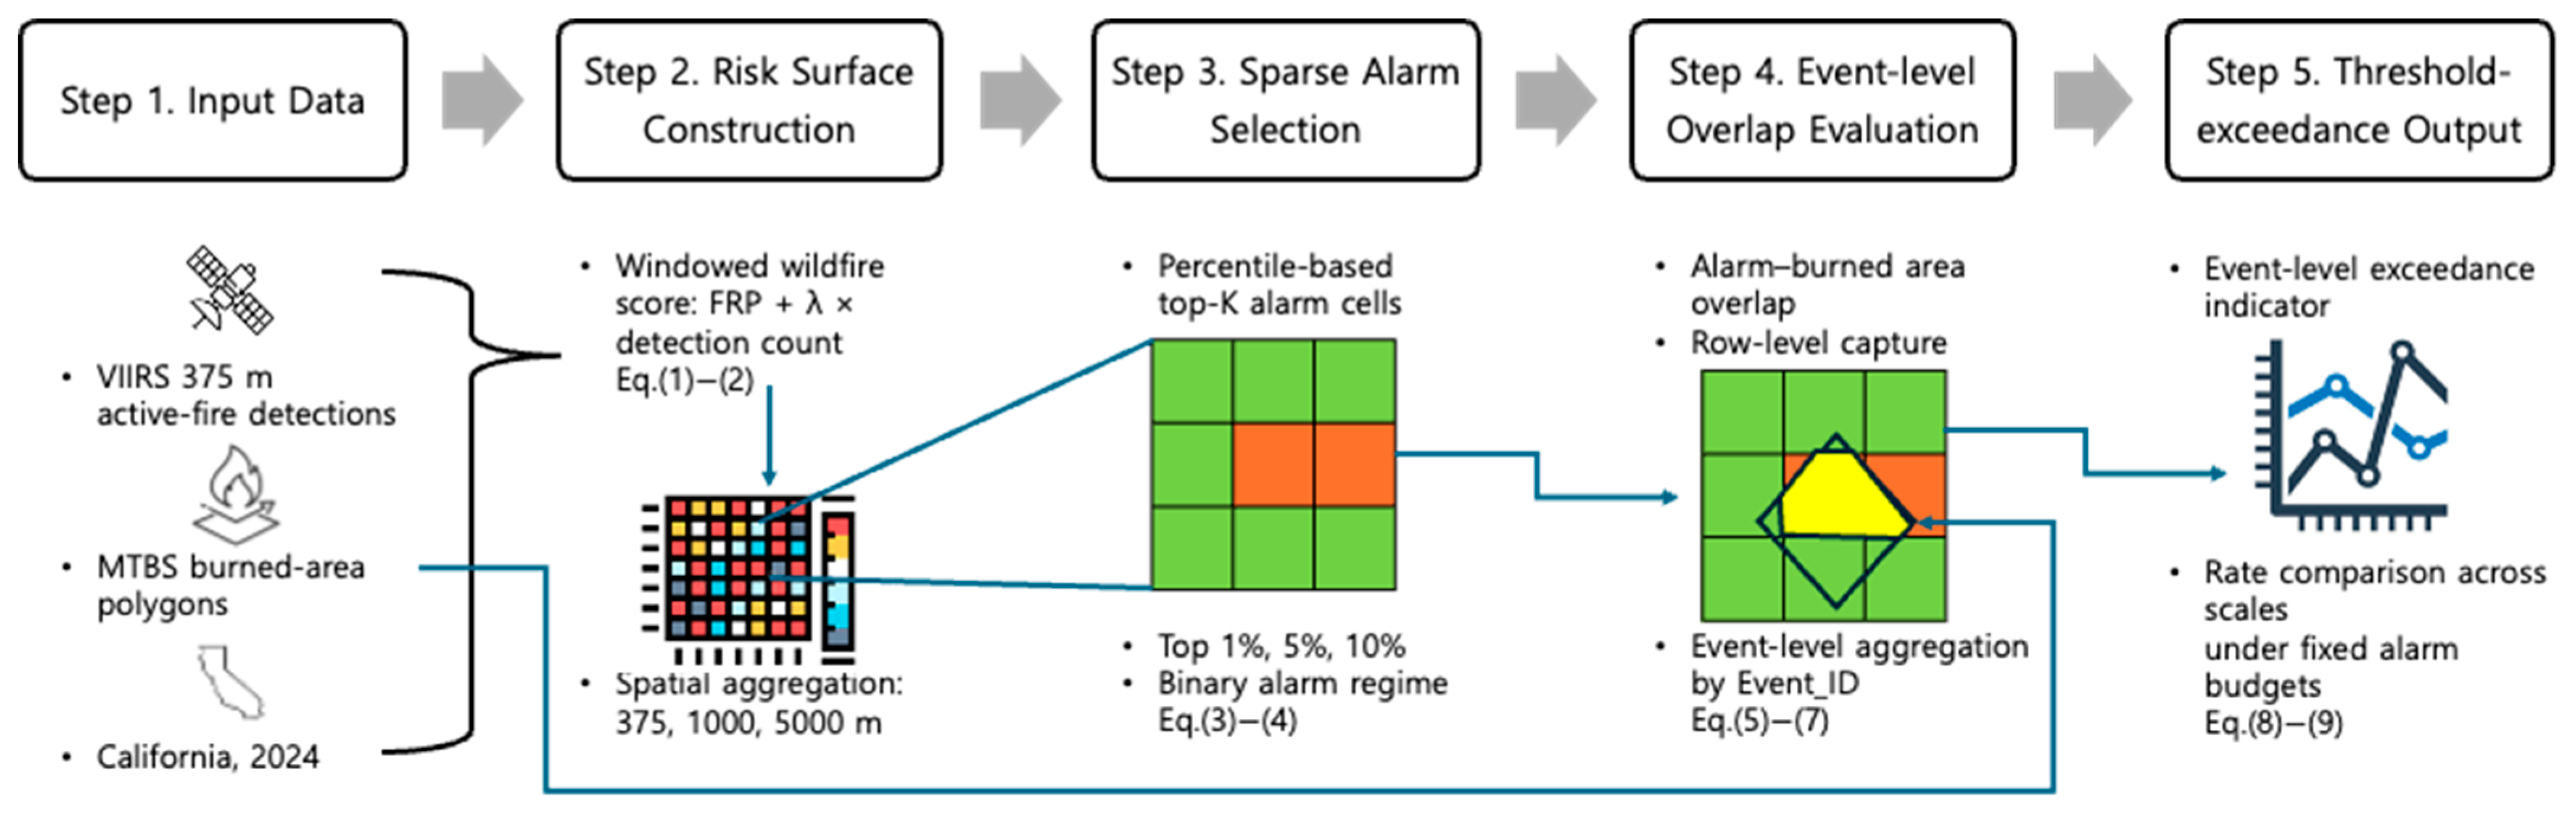
The overall analytical workflow linking (1)–(9) to the reported event-level evaluation is summarized in Figure 2.
Figure 2.
Analytical workflow for the event-level evaluation of percentile-based wildfire alarm regimes.
4. Results
4.1. Scale Effects Under Fixed Sparsity
The results reported below correspond to the California 2024 analysis under global calibration and examine three aggregation scales (375, 1000, and 5000 m) under fixed percentile-based alarm budgets. To evaluate scale effects under fixed sparsity, event-level capture was first aggregated within each MTBS event using the maximum observed capture value (). The main analysis then assessed the proportion of events exceeding a threshold of 0.02. This design allows comparison of spatial aggregation effects while holding alarm sparsity constant.
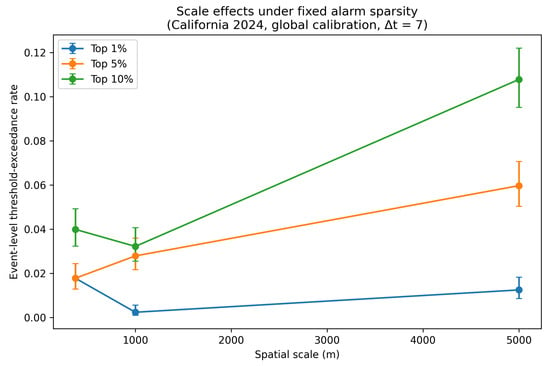
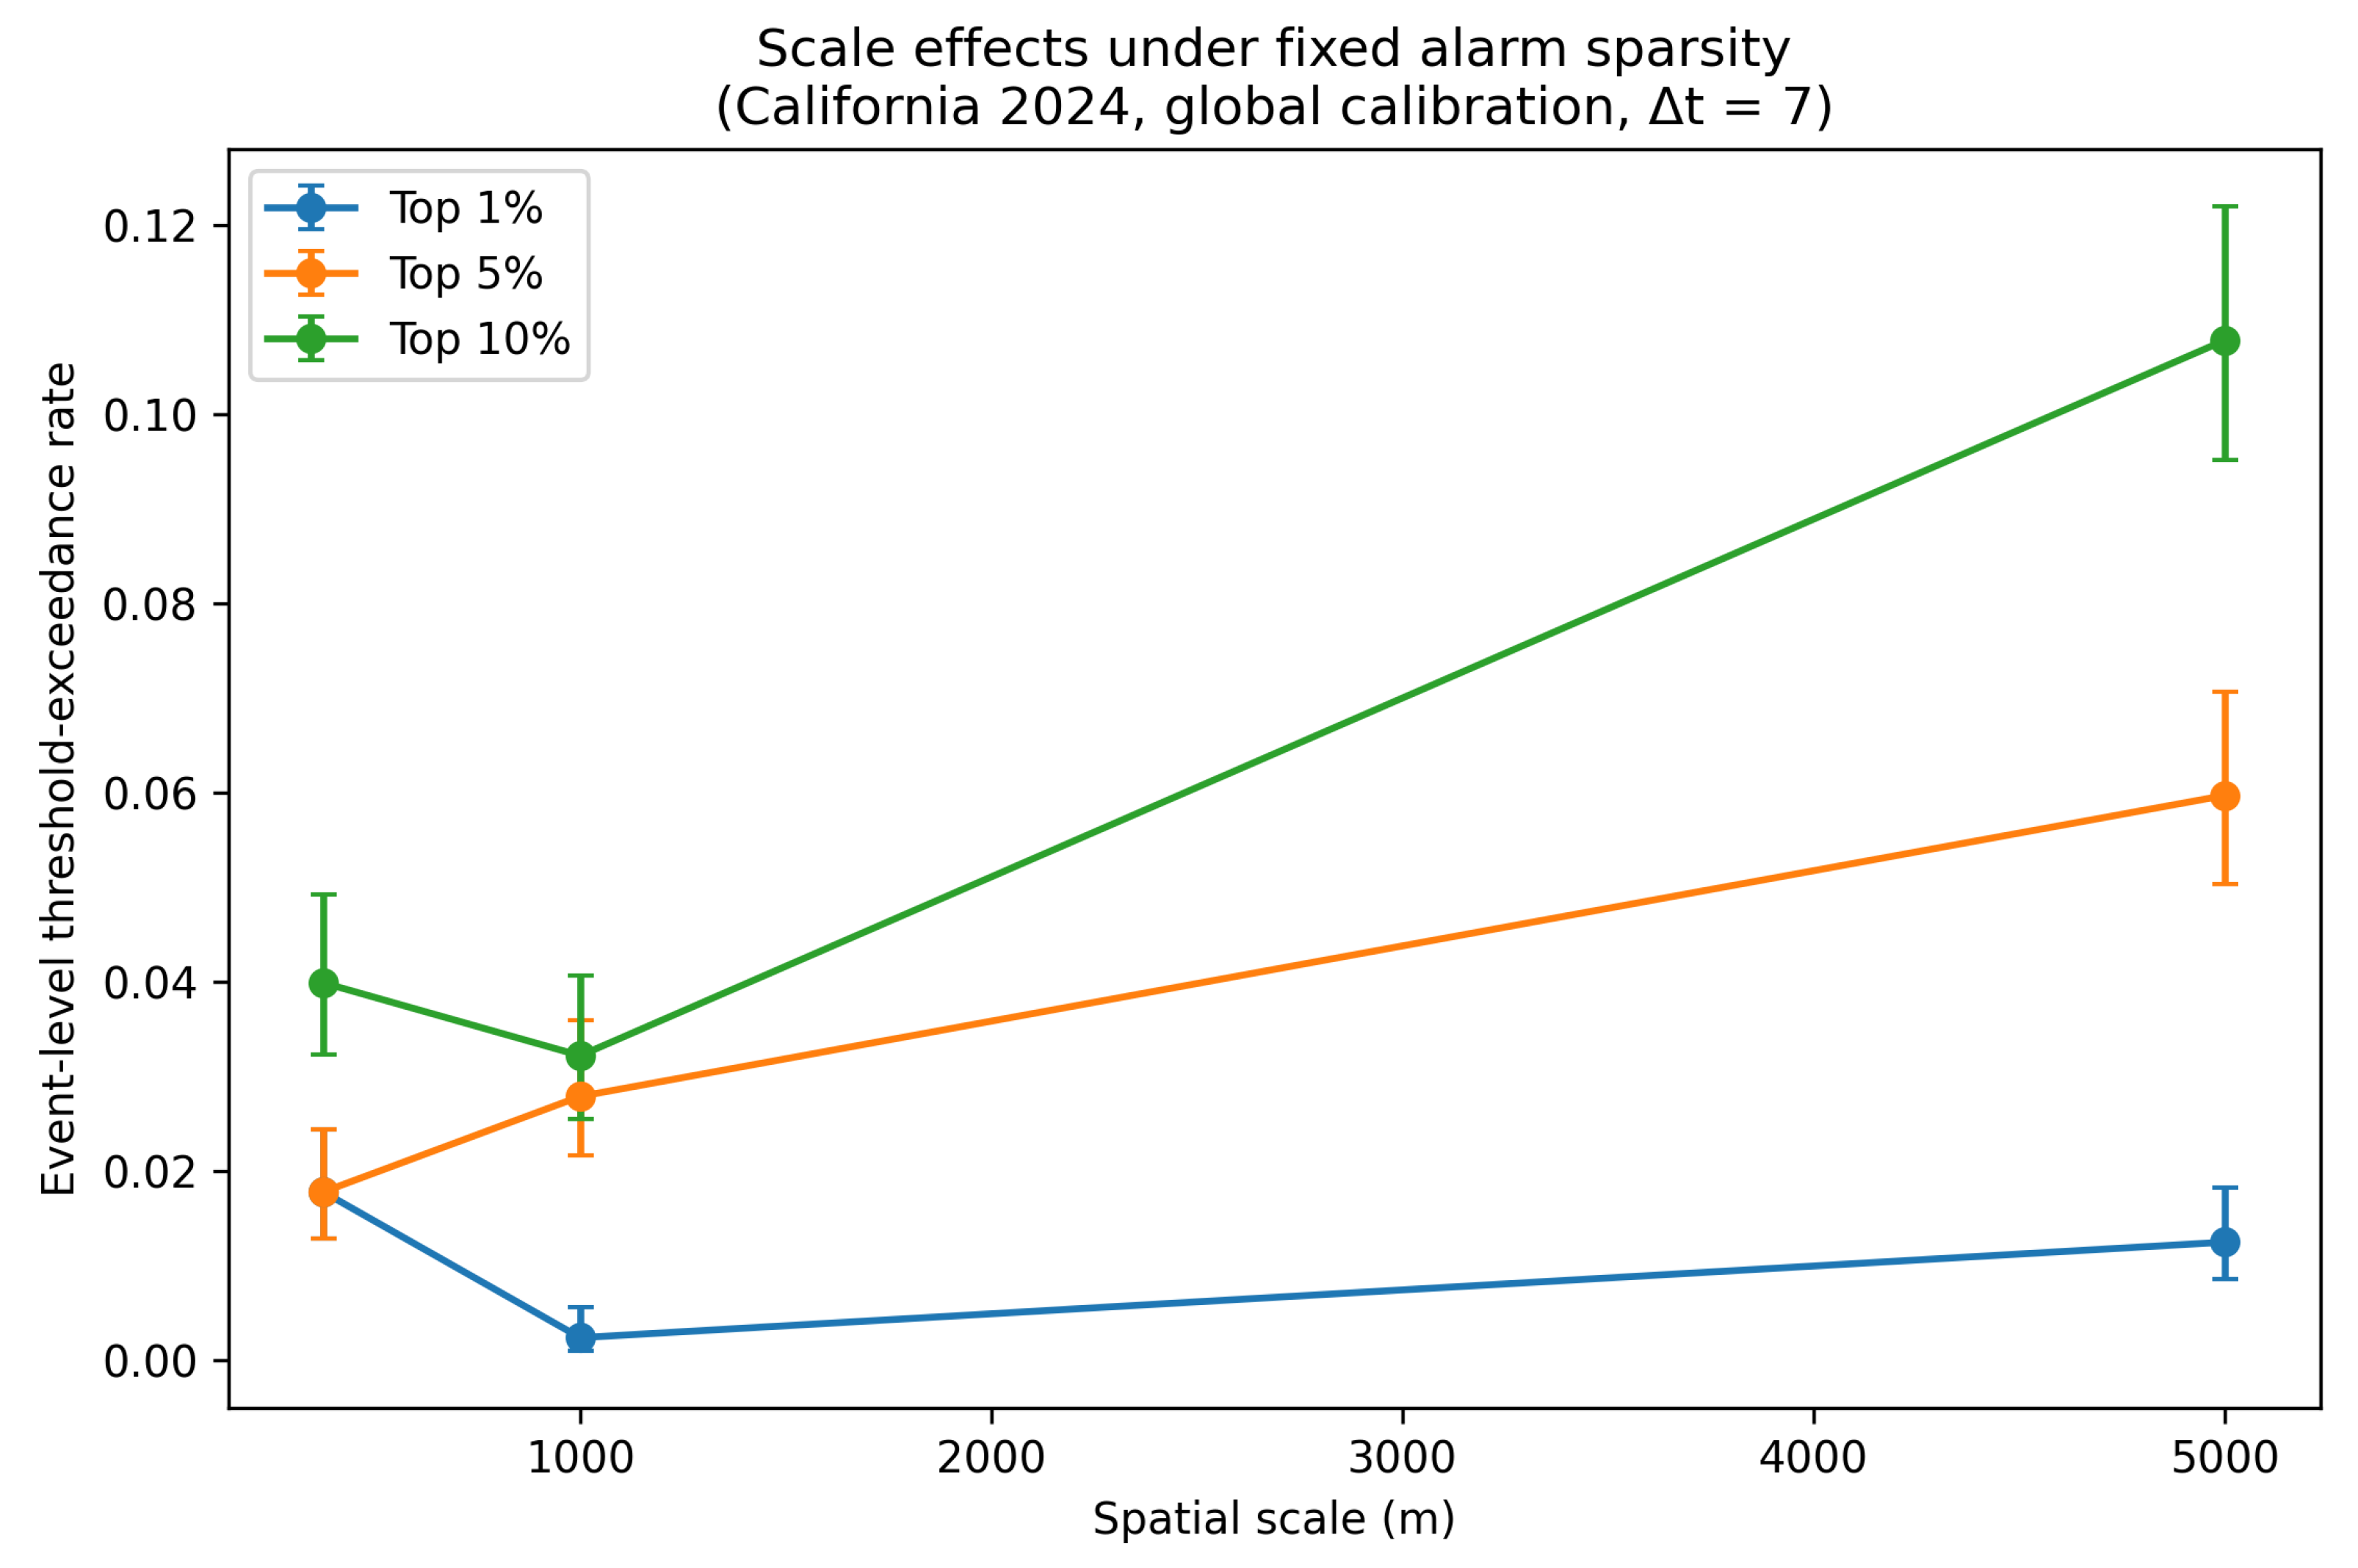
Table 3 and Figure 3 report event-level threshold-exceedance rates across spatial scales together with the number of unique wildfire events, exceedance counts, and Wilson 95% confidence intervals. A total of 2078 unique wildfire events were evaluated for each configuration. Under the most restrictive alarm budget (top 1%), the scale effect was weak and non-monotonic. The exceedance rate was 0.0178 at 375 m, declined to 0.0024 at 1000 m, and then increased to 0.0125 at 5000 m. Thus, under extreme sparsity, coarser aggregation did not produce a simple monotonic improvement.
Table 3.
Event-level threshold-exceedance rates across spatial scales under fixed alarm sparsity in California (2024, global calibration, Δt = 7), including robustness under alternative aggregation and threshold specifications.
Figure 3.
Event-level threshold-exceedance rates across spatial scales under fixed alarm sparsity in California (2024, global calibration, Δt = 7), using the primary specification (). Error bars indicate Wilson 95% confidence intervals.
A different pattern emerged under moderate alarm budgets. For the top 5%, the exceedance rate increased from 0.0178 at 375 m to 0.0279 at 1000 m and 0.0597 at 5000 m. For the top 10%, the corresponding values were 0.0399, 0.0322, and 0.1078. In both cases, the 5000 m configuration produced the highest event-level threshold-exceedance rate, indicating that coarser aggregation improved event-level capture under less restrictive alarm budgets.
Taken together, these results show that the effect of spatial aggregation depends on alarm sparsity. Under the top 1%, scale effects were weak and irregular, whereas under top 5% and top 10%, the coarsest scale consistently yielded the highest exceedance rates. Accordingly, spatial aggregation should not be interpreted as uniformly beneficial or detrimental. Its effect is conditional on the alarm budget under which event-level capture is evaluated.
4.2. Sparsity as an Amplifier of Event-Level Capture Differences
To further examine the role of alarm sparsity, the event-level threshold-exceedance rates in Table 3 were compared across top 1%, top 5%, and top 10% alarm budgets while holding spatial scale fixed. This perspective isolates the extent to which the alarm budget itself amplifies or suppresses event-level capture under a given aggregation scale.
At 375 m, the exceedance rate remained low under both top 1% and top 5% (0.0178 in both cases), but increased to 0.0399 under top 10%. Thus, under the finest scale, relaxing sparsity produced only limited gains until the alarm budget became substantially less restrictive. At 1000 m, the pattern was more responsive: the exceedance rate rose from 0.0024 at the top 1% to 0.0279 at the top 5% and 0.0322 at the top 10%. At 5000 m, the amplification effect was strongest. The exceedance rate increased from 0.0125 at the top 1% to 0.0597 at the top 5% and 0.1078 at the top 10%.
These results indicate that relaxing sparsity amplifies event-level capture, but the magnitude of that amplification depends strongly on spatial scale. The increase from top 1% to top 10% was modest at 375 m, stronger at 1000 m, and most pronounced at 5000 m. In other words, larger alarm budgets did not simply raise exceedance rates uniformly; they increasingly favored the coarser aggregation setting.
Viewed jointly, the results suggest that sparsity functions as an amplifier of scale-dependent differences. Under highly restrictive budgets, the contrasts among scales were weak and partly irregular. As the alarm budget became less restrictive, however, the differences widened substantially, with the 5000 m configuration separating more clearly from the 375 m and 1000 m settings. This pattern implies that the effect of sparsity is not merely additive, but interacts with aggregation scale to determine how strongly event-level capture can be realized.
4.3. Interaction Between Spatial Aggregation and Alarm Sparsity
Taken together, the results in Table 3 indicate that the effect of spatial aggregation cannot be interpreted independently of alarm sparsity. Under the most restrictive alarm budget (top 1%), scale effects were weak and non-monotonic: the exceedance rate was lowest at 1000 m, while 375 m and 5000 m produced somewhat higher values. In contrast, under the less restrictive top 5% and top 10% budgets, the coarsest scale (5000 m) consistently produced the highest event-level threshold-exceedance rates.
This contrast shows that the impact of aggregation is conditional on the alarm budget under which event-level capture is evaluated. When the budget is extremely sparse, scale differences remain limited and irregular. However, once the budget is relaxed, aggregation effects become more pronounced, and the advantage of the coarsest scale becomes clearer. In this sense, spatial aggregation and alarm sparsity do not operate as independent factors. Rather, sparsity determines how strongly scale-dependent differences in event-level capture can emerge.
The results, therefore, support an interaction-based interpretation. The question is not whether coarser or finer aggregation is universally superior, but under what alarm-budget conditions a given scale becomes more effective at exceeding the target event-level capture threshold. In the California 2024 setting examined here, coarser aggregation was most advantageous under moderate alarm budgets, whereas the extreme-sparsity regime did not exhibit the same consistent pattern.
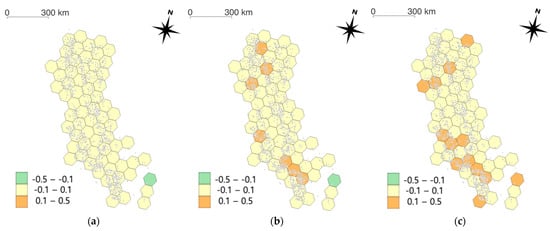
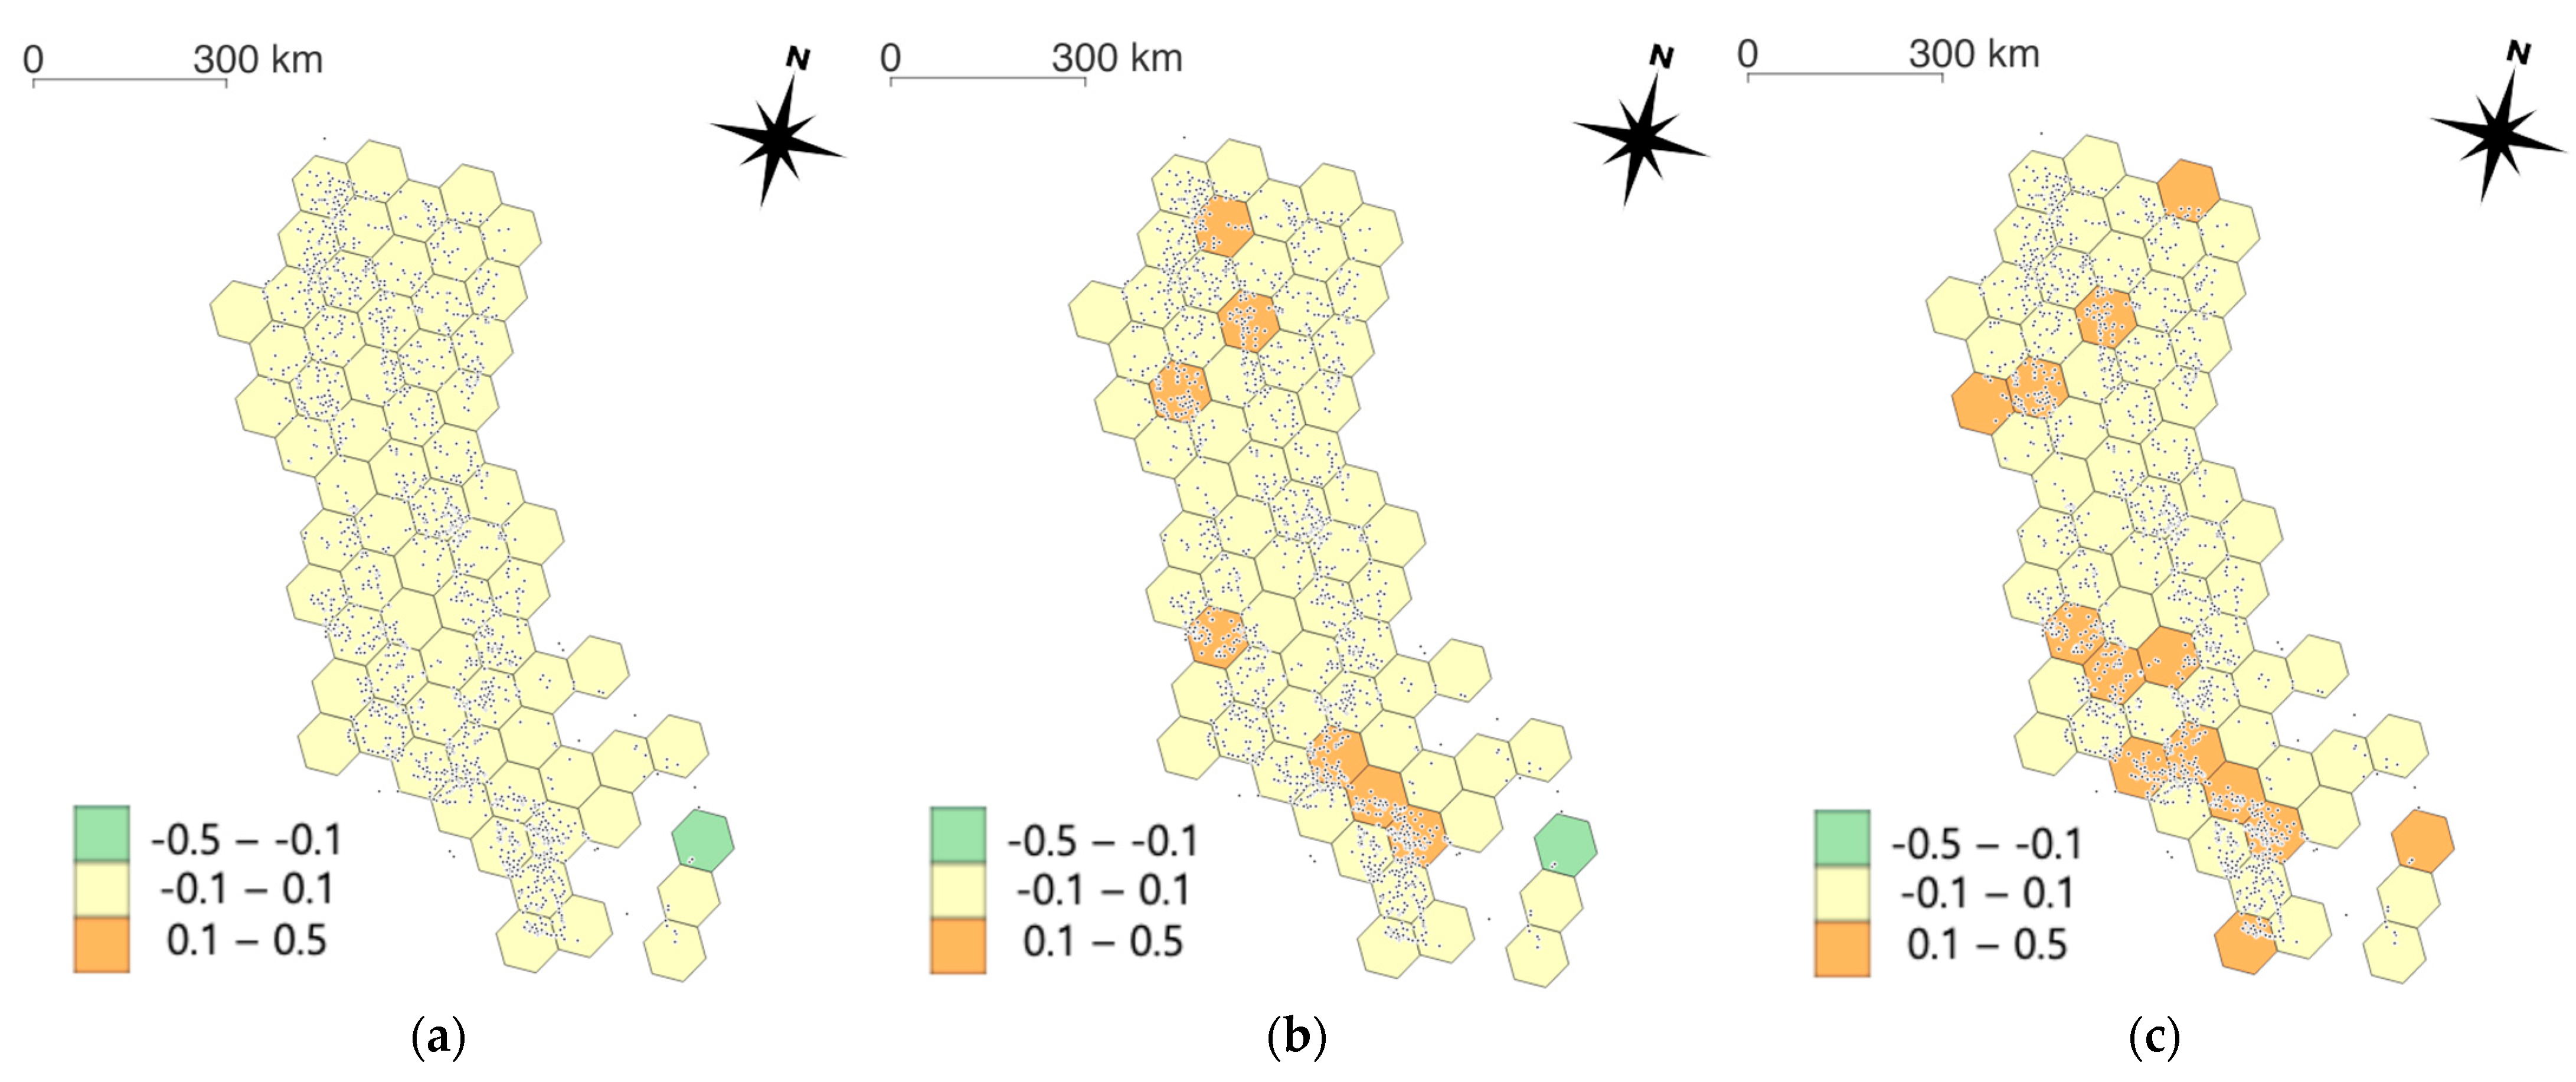
To visualize the spatial expression of the scale–sparsity interaction, Figure 4 maps the event-level threshold-exceedance advantage of the 5000 m configuration relative to the 375 m configuration across California under the primary specification. . The map is based on wildfire-event locations aggregated to a regular 50 km hexagonal grid, where positive values indicate areas in which the coarser aggregation more frequently exceeded the target threshold, whereas negative values indicate areas favoring the finer aggregation. Under the top 1% alarm budget, the spatial pattern is weak and patchy, consistent with the limited and irregular scale effect reported above. Under the top 5% and top 10% alarm budgets, positive values become more spatially extensive, indicating that the coarse-scale advantage emerges more clearly once the alarm budget is relaxed. This spatial evidence reinforces the interpretation that alarm sparsity conditions how strongly scale-dependent differences in event-level threshold-exceedance behavior can materialize across California.
Figure 4.
Spatial pattern of the interaction between spatial aggregation and alarm sparsity in California. Hexagons show the event-level threshold-exceedance advantage of the 5000 m configuration relative to the 375 m configuration under the primary specification (). Positive values indicate areas favoring the coarser aggregation, whereas negative values indicate areas favoring the finer aggregation. Black points denote wildfire-event locations. Panels correspond to (a) top 1%, (b) top 5%, and (c) top 10% alarm budgets.
Robustness checks further support this interpretation (Table 3). When the event-level aggregation rule was changed from maximum capture to mean capture while retaining the 0.02 threshold, absolute exceedance rates became substantially smaller, but the qualitative scale ordering under top 5% and top 10% remained similar, with 5000 m still producing the highest rates. Likewise, when the exceedance threshold was increased from 0.02 to 0.05 while retaining maximum aggregation, the 5000 m configuration again showed the highest exceedance rates under the top 5% and top 10%. These additional results indicate that the main interaction pattern is not driven solely by a single aggregation rule or threshold choice.
Overall, the findings suggest that scale effects in percentile-based wildfire alarm design are budget-dependent rather than universally monotonic. Under moderate alarm budgets, coarser aggregation enhanced event-level threshold-exceedance capture, whereas under extreme sparsity, the scale effect was weaker and less regular. This result is not derivable from the general principle that coarser resolution reduces spatial detail. If aggregation simply degraded information, one would expect monotonically decreasing event-level capture as scale coarsens. Instead, the observed pattern—where coarser aggregation improves exceedance rates under moderate budgets but produces weak and irregular effects under extreme sparsity—indicates that the interaction between aggregation and percentile-based selection generates non-trivial regime behavior that depends on the joint configuration of scale and budget. Accordingly, scale choice should be interpreted jointly with alarm-budget design rather than as an intrinsically beneficial or detrimental technical setting.
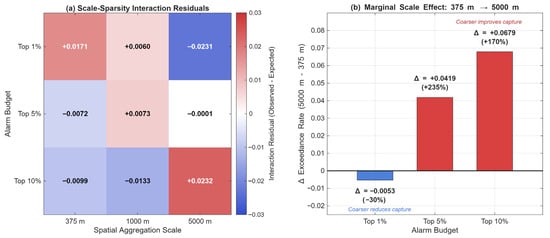
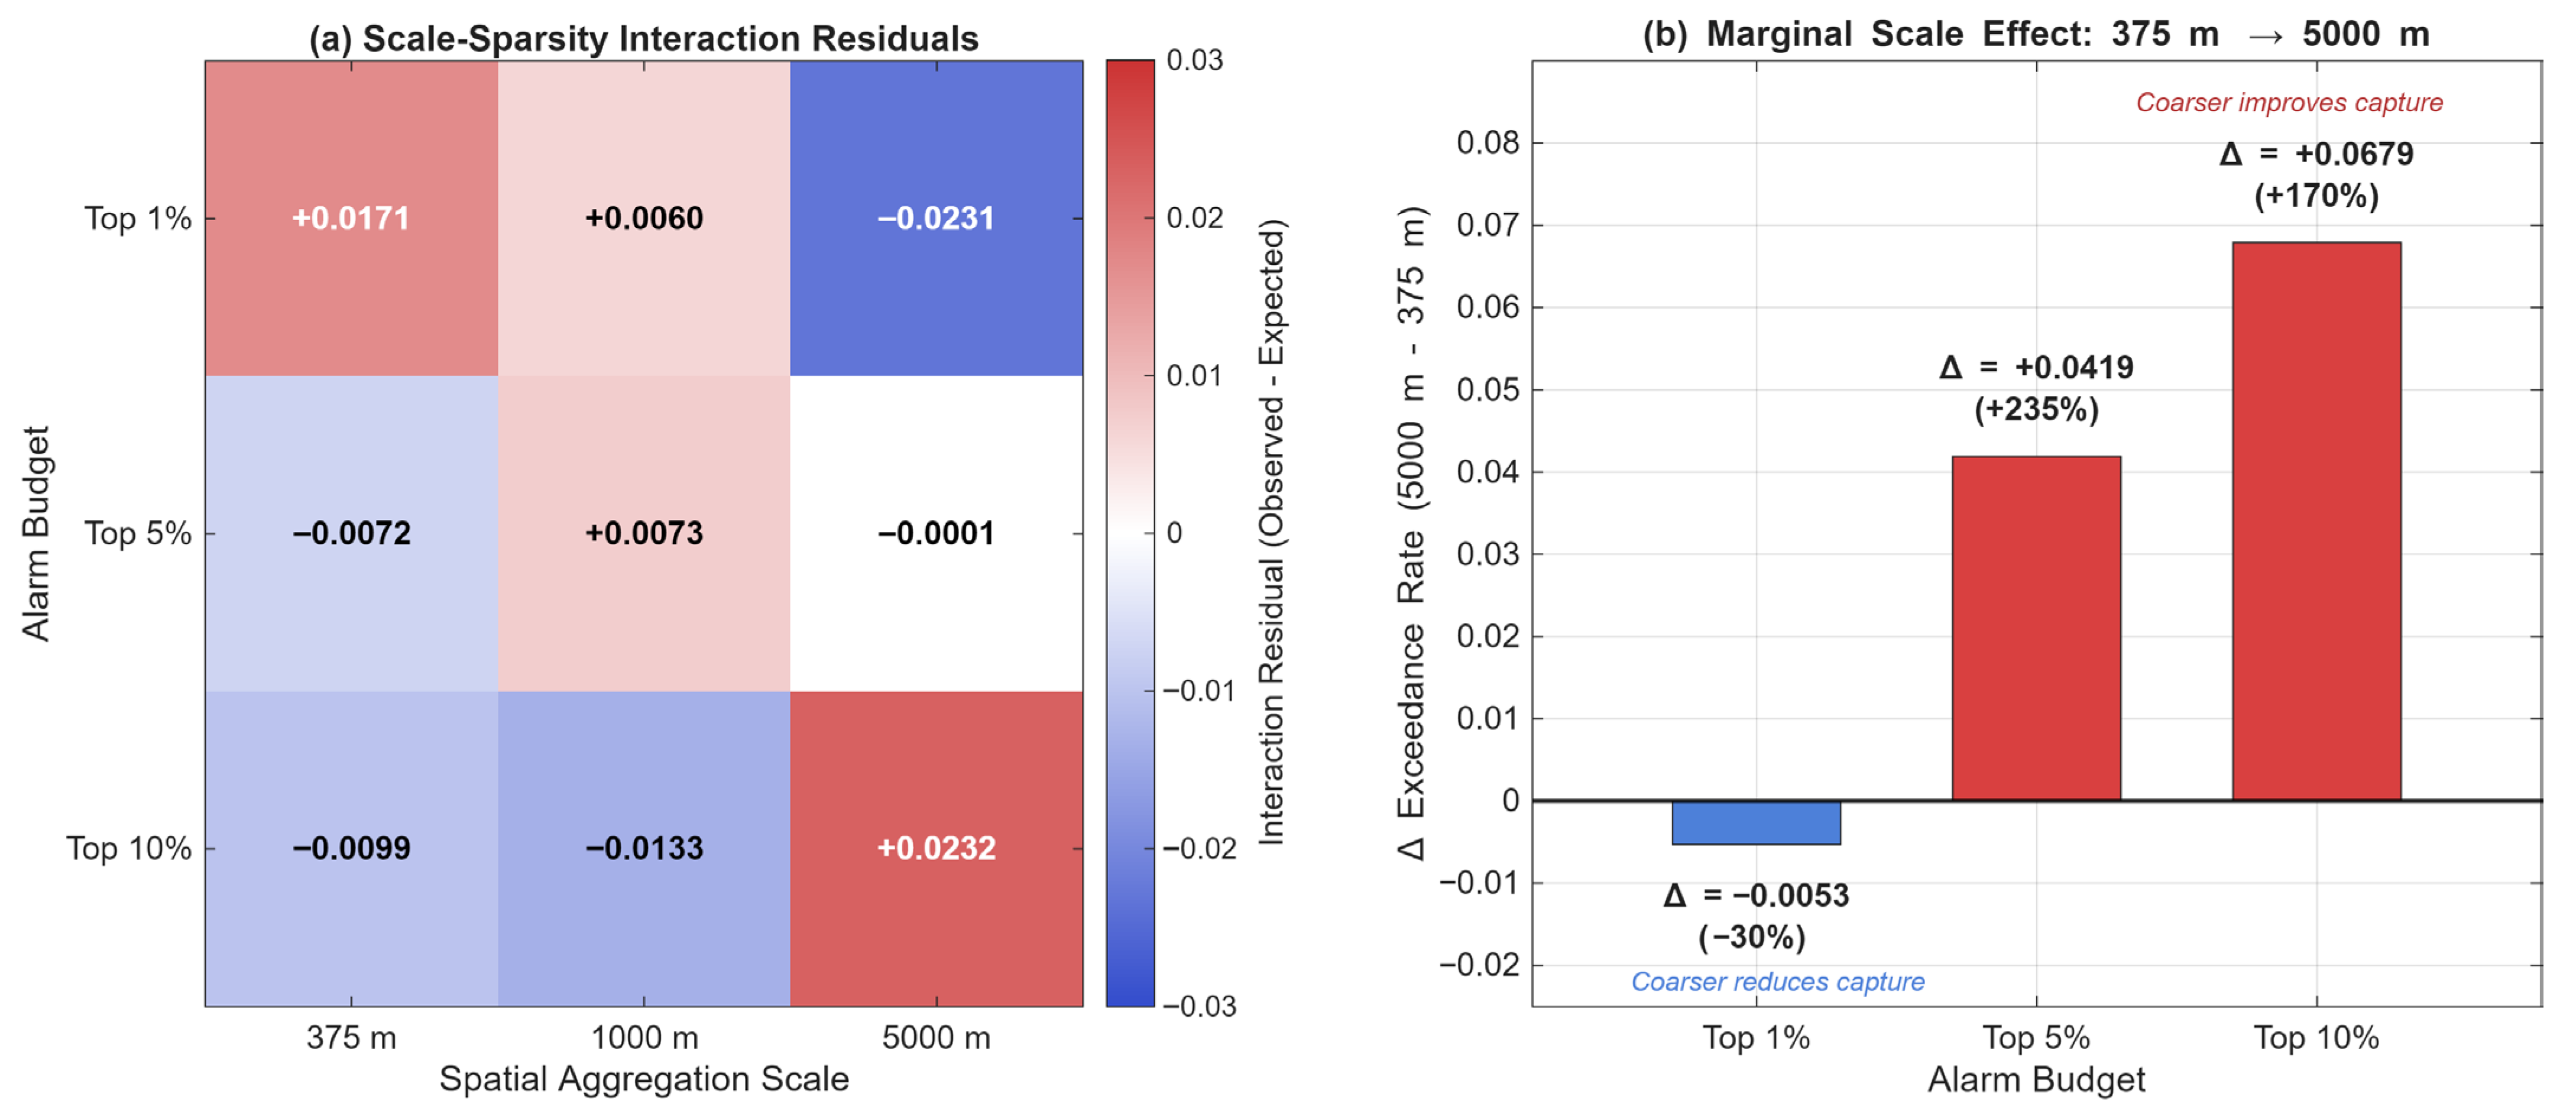
To quantify the interaction structure more precisely, Figure 5 decomposes the observed exceedance rates into additive and interaction components. Panel (a) presents interaction residuals, defined as the difference between observed event-level threshold-exceedance rates and rates expected under an additive model in which scale and sparsity effects operate independently. The strongest positive residual occurs at the 5000 m/top 10% configuration (+0.0280), indicating that the combination of coarse aggregation and moderate alarm budget produces substantially higher exceedance rates than would be predicted from their marginal effects alone. Conversely, the strongest negative residual occurs at 1000 m/top 1% (−0.0185), confirming that extreme sparsity suppresses the expected scale effect. Panel (b) reports the marginal scale effect, defined as the change in exceedance rate when aggregation shifts from 375 m to 5000 m under each alarm budget. Under the top 1%, the marginal effect is negative (Δ = −0.0053), indicating that coarser aggregation slightly reduces event-level capture. Under the top 5% and top 10%, the effect reverses to positive (Δ = +0.0419 and +0.0679, respectively), quantifying the magnitude of the directional reversal that constitutes the central empirical finding of this study.
Figure 5.
Non-spatial summaries of the scale–sparsity interaction. (a) Interaction residuals are defined as the difference between the observed event-level threshold-exceedance rate and the rate expected under an additive model in which spatial aggregation scale and alarm sparsity operate independently. Positive values indicate stronger-than-additive exceedance performance, whereas negative values indicate weaker-than-additive performance. (b) Marginal scale effect of shifting from 375 m to 5000 m under the primary specification, expressed as the change in event-level threshold-exceedance rate. Negative values indicate reduced exceedance under coarser aggregation, whereas positive values indicate improved exceedance.
5. Discussion
5.1. Event-Level Interaction Between Spatial Aggregation and Alarm Sparsity
The event-level results indicate that the consequences of spatial aggregation are interaction-dependent rather than monotonic. In the California 2024 setting, scale effects were weak and non-monotonic under the most restrictive alarm budget (top 1%), whereas under the less restrictive top 5% and top 10% budgets, the coarsest scale examined (5000 m) consistently produced the highest threshold-exceedance rates. This contrast suggests that aggregation effects should be interpreted jointly with alarm sparsity and with the event-level capture criterion used in evaluation.
A key implication is that coarser aggregation should not be regarded as inherently better or worse in a universal sense. Under moderate alarm budgets, coarser aggregation improved event-level threshold-exceedance capture in this retrospective setting, whereas under extreme sparsity, the scale effect remained weaker and less regular.
Accordingly, the present findings support an interaction-based interpretation of event-level wildfire capture rather than a simple scale-dominance argument. The mechanism underlying this interaction can be understood as follows. Coarser grid cells accumulate fire radiative power from multiple native-resolution pixels, which elevates their aggregated risk score and increases their likelihood of exceeding the percentile-based selection threshold. Simultaneously, each selected coarse cell covers a larger spatial footprint, increasing the area of potential overlap with burned-area perimeters. Under moderate alarm budgets, this dual mechanism—ranking elevation through signal accumulation and spatial coverage expansion—more than compensates for the loss of localization precision. Under extreme sparsity, however, the number of selected cells is too small for this compensatory mechanism to operate reliably across the event population, producing the observed weak and non-monotonic scale effects. This mechanistic interpretation clarifies why the results are not reducible to a restatement of aggregation-induced information loss.
5.2. Relation to the Modifiable Areal Unit Problem (MAUP)
These findings can be interpreted in relation to the modifiable areal unit problem (MAUP), which emphasizes that statistical and decision-related outcomes may change when the spatial unit of analysis is altered. In the present study, changing the aggregation scale from 375 m to 5000 m changed event-level threshold-exceedance rates in ways that depended on alarm sparsity. This suggests that aggregation is not merely a technical preprocessing choice, but a source of decision-relevant variation.
Importantly, the present results extend the MAUP discussion from descriptive or inferential distortion to regime-level alarm behavior. The issue is not only that different areal units yield different summary statistics, but that they can also alter whether event-level capture exceeds a policy-relevant threshold under a fixed alarm budget. In this sense, the study frames MAUP as a practical design issue in threshold-based alarm allocation rather than as an abstract spatial-statistical artifact alone.
Although the primary comparison in this study relies on regular-grid aggregation, a related practical issue concerns the use of irregular administrative units such as counties or districts in operational deployment. Such units are not shape-neutral: they vary in size, geometry, and internal heterogeneity, and may therefore alter alarm ranking and spatial overlap in ways that are conceptually related to, but not identical with, the scale effect observed in regular-grid analysis. In the present study, county boundaries were retained only for operational batching rather than for the main event-level comparison. Accordingly, the results should not be interpreted as implying that regular-grid and administrative-unit implementations are interchangeable. Future work should compare regular-grid alarm design with county- or district-based implementation more directly to assess how irregular operational units affect event-level threshold-exceedance behavior under fixed alarm budgets.
5.3. Implications for Sustainability-Oriented Wildfire Management
For sustainability-oriented wildfire management, the main implication is that spatial scale should be treated as a policy-coupled design choice rather than as an intrinsically beneficial technical parameter. In the California 2024 retrospective setting, coarser aggregation improved event-level threshold-exceedance capture under moderate alarm budgets, but not in a uniformly monotonic way under extreme sparsity. This means that the operational meaning of scale depends on how selective the alarm system is intended to be.
These results do not demonstrate that one aggregation scale is universally optimal for real-time wildfire management. Rather, they suggest that when decision systems are designed around limited alarm budgets, aggregation choices can materially influence whether wildfire events are captured above a target threshold. From a sustainability perspective, this matters because alarm design affects how monitoring resources, attention, and potential interventions are distributed across space under constrained capacity. In practical terms, when alarm budgets permit the selection of 5% or more of spatial units, adopting a coarser aggregation scale may increase the number of wildfire events captured above the target threshold without requiring additional monitoring resources. Conversely, under highly restrictive budgets where only 1% of spatial units can be selected, the choice of aggregation scale has limited and unpredictable effects on event-level capture, implying that other design parameters—such as temporal window length, risk score formulation, or regional calibration—may be more consequential for improving alarm performance. For operational agencies, this means that spatial resolution should not be optimized in isolation but should be jointly configured with the alarm budget to maximize event-level coverage under given resource constraints.
5.4. Methodological Contribution
The methodological contribution of this study lies in framing wildfire alarm evaluation as an event-level threshold-exceedance problem under alternative spatial aggregation regimes. Rather than relying only on aggregate coverage summaries, the analysis evaluates whether unique wildfire events exceed a policy-relevant capture threshold under fixed alarm budgets. This makes it possible to compare aggregation regimes in terms of event-level detectability rather than only configuration-level averages.
A second contribution is the explicit use of alternative event-aggregation and threshold specifications to assess robustness. The main results were obtained using maximum event-level capture with a threshold of 0.02, while supplementary checks considered mean event-level capture and a stricter threshold of 0.05. Although the absolute exceedance rates varied across specifications, the main qualitative conclusion remained stable under moderate alarm budgets. This supports the interpretation that the reported pattern is not reducible to a single aggregation rule or threshold value.
5.5. Limitations and Future Research
Several limitations should be acknowledged. First, the main event-level analysis is restricted to California in 2024 and therefore reflects a single empirical setting rather than a universal characterization of wildfire alarm behavior. Nevertheless, the California 2024 fire season encompasses 2078 unique wildfire events across heterogeneous terrain and fire dynamics, providing sufficient statistical power to identify the reported scale–sparsity interaction. The consistency of the qualitative pattern across alternative aggregation rules and threshold specifications further supports its robustness within the examined setting. Second, the main comparison focuses on three aggregation scales (375, 1000, and 5000 m) under global calibration with a 7-day setting, so the reported interaction pattern should be interpreted within that design space. However, the three scales span a range from native satellite resolution to a substantially coarsened grid, and the qualitative contrast between extreme and moderate sparsity conditions was consistent across all scale comparisons, suggesting that the interaction mechanism is not an artifact of a particular scale pair. Third, the study is retrospective and evaluates threshold-exceedance capture rather than prospective real-time forecasting performance. This design choice is intentional: the objective is to characterize how aggregation scale and alarm sparsity jointly shape event-level capture under controlled conditions, isolating the structural interaction from confounding factors present in real-time deployment such as forecast error, communication delays, and resource mobilization constraints.
A further limitation is that event-level capture required an aggregation rule when multiple rows were associated with the same MTBS event. The primary analysis used maximum event-level capture, and additional checks using alternative aggregation and threshold choices were used to evaluate robustness. Future research should examine whether the same interaction pattern persists across additional years, regions, calibration regimes, and operational deployment settings, and should test the framework under prospective real-time evaluation conditions.
6. Conclusions
This study examined how spatial aggregation interacts with percentile-based alarm sparsity in wildfire monitoring under a retrospective California 2024 setting. Rather than evaluating predictive accuracy alone, the analysis focused on whether unique wildfire events exceeded a policy-relevant capture threshold under fixed alarm budgets.
The main results show that the effect of spatial aggregation is conditional on alarm sparsity. Under the most restrictive alarm budget (top 1%), scale effects were weak and non-monotonic. In contrast, under the less restrictive top 5% and top 10% budgets, the coarsest aggregation scale examined (5000 m) consistently produced the highest event-level threshold-exceedance rates relative to 375 m and 1000 m. This indicates that coarser aggregation improved event-level capture under moderate alarm budgets, but not in a universally monotonic manner across all budget settings.
Robustness checks supported this interpretation. When event-level capture was aggregated using the mean rather than the maximum value, and when the exceedance threshold was increased from 0.02 to 0.05, the absolute rates changed, but the main qualitative pattern remained similar under the top 5% and top 10%. Thus, the principal conclusion is not reducible to a single aggregation rule or threshold choice.
These findings suggest that spatial scale should be interpreted as a policy-coupled design variable rather than as an intrinsically beneficial or detrimental technical setting. In threshold-based wildfire alarm design, the practical meaning of aggregation depends on how restrictive the alarm budget is and on how event-level capture is defined. More broadly, the study shows that aggregation choices can materially affect whether wildfire events are captured above decision-relevant thresholds under constrained allocation settings.
Future research should test whether the same interaction pattern persists across additional years, regions, calibration regimes, and operational deployment settings. Extending the framework to prospective real-time evaluation would further clarify how event-level threshold-exceedance behavior translates into practical wildfire monitoring performance.
Author Contributions
Conceptualization, J.K., J.H., T.-Y.K., S.-J.L. and H.-S.Y.; methodology, J.K., J.H., T.-Y.K., S.-J.L. and H.-S.Y.; software, J.K., J.H., T.-Y.K., S.-J.L. and H.-S.Y.; validation, J.K., J.H., T.-Y.K., S.-J.L. and H.-S.Y.; formal analysis, J.K., J.H., T.-Y.K., S.-J.L. and H.-S.Y.; investigation, J.K., J.H., T.-Y.K., S.-J.L. and H.-S.Y.; resources, J.K., J.H., T.-Y.K., S.-J.L. and H.-S.Y.; data curation, J.K., J.H., T.-Y.K., S.-J.L. and H.-S.Y.; writing—original draft preparation, J.K., J.H., T.-Y.K., S.-J.L. and H.-S.Y.; writing—review and editing, J.K., S.-J.L. and H.-S.Y.; visualization, J.K., S.-J.L. and H.-S.Y.; supervision, J.K., S.-J.L. and H.-S.Y.; project administration, J.K., S.-J.L. and H.-S.Y.; funding acquisition, J.K., S.-J.L. and H.-S.Y. All authors have read and agreed to the published version of the manuscript.
Funding
This research was supported by the 2023-MOIS36-004 (RS-2023-00248092) of the Technology Development Program on Disaster Restoration Capacity Building and Strengthening funded by the Ministry of the Interior and Safety (MOIS, Korea).
Institutional Review Board Statement
Not applicable.
Informed Consent Statement
Not applicable.
Data Availability Statement
The original contributions presented in the study are included in the article, further inquiries can be directed to the corresponding authors.
Conflicts of Interest
The authors declare no conflicts of interest.
Abbreviations
The following abbreviations are used in this manuscript:
| VIIRS | Visible Infrared Imaging Radiometer Suite |
| MODIS | Moderate Resolution Imaging Radiometer Spectroradiometer |
| MTBS | Monitoring Trends in Burn Severity |
| FRP | Fire Radiative Power |
| TIGER | Topologically Integrated Geographic Encoding and Referencing |
| MAUP | Modifiable Areal Unit Problem |
References
- Jain, P.; Coogan, S.C.P.; Subramanian, S.G.; Crowley, M.; Taylor, S.; Flannigan, M.D. A Review of Machine Learning Applications in Wildfire Science and Management. Environ. Rev. 2020, 28, 478–505. [Google Scholar] [CrossRef] [Scilit]
- Scott, J.H.; Thompson, M.P.; Calkin, D.E. A Wildfire Risk Assessment Framework for Land and Resource Management; U.S. Department of Agriculture, Forest Service, Rocky Mountain Research Station: Ft. Collins, CO, USA, 2013; p. RMRS-GTR-315.
- Giglio, L.; Schroeder, W.; Justice, C.O. The Collection 6 MODIS Active Fire Detection Algorithm and Fire Products. Remote Sens. Environ. 2016, 178, 31–41. [Google Scholar] [CrossRef] [Scilit] [PubMed]
- Schroeder, W.; Oliva, P.; Giglio, L.; Csiszar, I.A. The New VIIRS 375 m Active Fire Detection Data Product: Algorithm Description and Initial Assessment. Remote Sens. Environ. 2014, 143, 85–96. [Google Scholar] [CrossRef] [Scilit]
- Bastarrika, A.; Chuvieco, E.; Martín, M.P. Mapping Burned Areas from Landsat TM/ETM+ Data with a Two-Phase Algorithm: Balancing Omission and Commission Errors. Remote Sens. Environ. 2011, 115, 1003–1012. [Google Scholar] [CrossRef] [Scilit]
- Giglio, L.; Boschetti, L.; Roy, D.P.; Humber, M.L.; Justice, C.O. The Collection 6 MODIS Burned Area Mapping Algorithm and Product. Remote Sens. Environ. 2018, 217, 72–85. [Google Scholar] [CrossRef] [Scilit] [PubMed]
- Boschetti, L.; Roy, D.P.; Giglio, L.; Huang, H.; Zubkova, M.; Humber, M.L. Global Validation of the Collection 6 MODIS Burned Area Product. Remote Sens. Environ. 2019, 235, 111490. [Google Scholar] [CrossRef] [Scilit] [PubMed]
- Robinson, W.S. Ecological Correlations and the Behavior of Individuals. Am. Sociol. Rev. 1950, 15, 351. [Google Scholar] [CrossRef] [Scilit]
- Pandey, A.C.; Kaushik, K.; Parida, B.R. Google Earth Engine for Large-Scale Flood Mapping Using SAR Data and Impact Assessment on Agriculture and Population of Ganga-Brahmaputra Basin. Sustainability 2022, 14, 4210. [Google Scholar] [CrossRef] [Scilit]
- Gorelick, N.; Hancher, M.; Dixon, M.; Ilyushchenko, S.; Thau, D.; Moore, R. Google Earth Engine: Planetary-Scale Geospatial Analysis for Everyone. Remote Sens. Environ. 2017, 202, 18–27. [Google Scholar] [CrossRef] [Scilit]
- Eidenshink, J.; Schwind, B.; Brewer, K.; Zhu, Z.-L.; Quayle, B.; Howard, S. A Project for Monitoring Trends in Burn Severity. Fire Ecol. 2007, 3, 3–21. [Google Scholar] [CrossRef] [Scilit]
- Roy, D.P.; Huang, H.; Boschetti, L.; Giglio, L.; Yan, L.; Zhang, H.H.; Li, Z. Landsat-8 and Sentinel-2 Burned Area Mapping—A Combined Sensor Multi-Temporal Change Detection Approach. Remote Sens. Environ. 2019, 231, 111254. [Google Scholar] [CrossRef] [Scilit]
- Andela, N.; Morton, D.C.; Giglio, L.; Paugam, R.; Chen, Y.; Hantson, S.; Van Der Werf, G.R.; Randerson, J.T. The Global Fire Atlas of Individual Fire Size, Duration, Speed and Direction. Earth Syst. Sci. Data 2019, 11, 529–552. [Google Scholar] [CrossRef] [Scilit]
- Chuvieco, E.; Mouillot, F.; Van Der Werf, G.R.; San Miguel, J.; Tanase, M.; Koutsias, N.; García, M.; Yebra, M.; Padilla, M.; Gitas, I.; et al. Historical Background and Current Developments for Mapping Burned Area from Satellite Earth Observation. Remote Sens. Environ. 2019, 225, 45–64. [Google Scholar] [CrossRef] [Scilit]
- Radeloff, V.C.; Helmers, D.P.; Kramer, H.A.; Mockrin, M.H.; Alexandre, P.M.; Bar-Massada, A.; Butsic, V.; Hawbaker, T.J.; Martinuzzi, S.; Syphard, A.D.; et al. Rapid Growth of the US Wildland-Urban Interface Raises Wildfire Risk. Proc. Natl. Acad. Sci. USA 2018, 115, 3314–3319. [Google Scholar] [CrossRef] [Scilit] [PubMed]
- Openshaw, S. Ecological Fallacies and the Analysis of Areal Census Data. Environ. Plan. A 1984, 16, 17–31. [Google Scholar] [CrossRef] [Scilit] [PubMed]
- Filipponi, F. Exploitation of Sentinel-2 Time Series to Map Burned Areas at the National Level: A Case Study on the 2017 Italy Wildfires. Remote Sens. 2019, 11, 622. [Google Scholar] [CrossRef] [Scilit]
- Stroppiana, D.; Azar, R.; Calò, F.; Pepe, A.; Imperatore, P.; Boschetti, M.; Silva, J.; Brivio, P.; Lanari, R. Integration of Optical and SAR Data for Burned Area Mapping in Mediterranean Regions. Remote Sens. 2015, 7, 1320–1345. [Google Scholar] [CrossRef] [Scilit]
- Davis, J.; Goadrich, M. The Relationship between Precision-Recall and ROC Curves. In Proceedings of the 23rd International Conference on Machine Learning, Pittsburgh, PA, USA, 25–29 June 2006; Association for Computing Machinery: New York, NY, USA, 2006; pp. 233–240. [Google Scholar]
- Platt, J.C. Probabilistic Outputs for Support Vector Machines and Comparisons to Regularized Likelihood Methods. Adv. Large Margin Classif. 1999, 10, 61–74. [Google Scholar]
- Gonzalez-Mathiesen, C. Challenges in Developing Wildfire Understanding from Wildfire Information through Spatial Planning Processes. Sustainability 2024, 16, 420. [Google Scholar] [CrossRef] [Scilit]

Disclaimer/Publisher’s Note: The statements, opinions and data contained in all publications are solely those of the individual author(s) and contributor(s) and not of MDPI and/or the editor(s). MDPI and/or the editor(s) disclaim responsibility for any injury to people or property resulting from any ideas, methods, instructions or products referred to in the content. |
© 2026 by the authors. Licensee MDPI, Basel, Switzerland. This article is an open access article distributed under the terms and conditions of the Creative Commons Attribution (CC BY) license.