


Abstract
Identifying noise sources in exceedance-triggered audio is essential for targeted source tracing and sustainable urban social noise governance. While accurate models require massive labeled data, the acoustic complexity, high redundancy, and imbalanced class distributions of real-world recordings incur prohibitive manual annotation costs, hindering their widespread application in IoT networks. To tackle this bottleneck, we present a label-efficient active learning framework designed to minimize annotation costs by dynamically selecting the most valuable audio samples. Specifically, rather than treating uncertainty, class balance, and diversity as separate query criteria, it encodes uncertainty and dynamic class-aware learning needs into a weighted acoustic feature space, so that diversity-based selection can be performed in a unified manner. Experiments on the UrbanSound8K benchmark and a realistic exceedance-triggered monitoring dataset demonstrate consistent label-efficiency advantages over mainstream methods. Notably, our approach reaches 98% of the fully supervised upper bound on the real-world dataset while reducing the training annotation workload by 85.0% compared to random sampling. On the real-world dataset, the proposed framework yields higher F1-scores for several challenging under-represented categories and reduces the misclassification of dominant sound events relevant to social noise source tracing. Furthermore, cross-site generalization experiments reveal rapid localized adaptation to new monitoring environments, reaching the fully supervised upper bound with only 13% of the target-domain training data. Overall, this study provides a scalable and cost-effective classification framework for urban noise monitoring, offering practical support for noise regulatory authorities and city managers in more targeted noise source tracing and governance.
1. Introduction
Environmental noise pollution has become a crucial public health problem with rapid urbanization. Long-term exposure to high noise levels increases the risk of developing cardiovascular disease, sleep disturbance, and cognitive impairment [1,2,3]. Among various noise sources, social noise, defined by Chinese noise regulations as generated by residents’ daily living and social activities, has a particularly direct impact on urban dwellers [4]. Its scattered and frequent occurrence within residential neighborhoods not only leads to extensive public complaints, but also poses a significant challenge to environmental monitoring and governance [5,6]. Current environmental noise regulation mainly relies on sound pressure level (SPL) limitations [7,8] to detect exceedances. However, SPL measurements fall short of identifying specific noise sources, thereby limiting targeted pollution control [9,10]. With the widespread deployment of Internet of Things (IoT)-based automatic noise monitoring networks in major cities [11,12], they can automatically record audio whenever the sound level exceeds the threshold [13]. Using such data to classify dominant noise sources will support essential source tracing, catalyzing a crucial transition from passive monitoring to refined and sustainable urban noise governance [9].
Identifying dominant noise sources (e.g., square dancing, crowd clamor) of each exceedance-triggered recording is a typical audio classification task, for which deep learning models such as convolutional neural networks (CNNs) offer a reliable technical solution [14,15,16,17]. Training accurate models generally requires large-scale, accurately labeled data [18,19]. Nevertheless, IoT-based monitoring networks produce a large amount of audio data that is often acoustically mixed and highly redundant, making manual annotation inefficient and expensive [20,21]. This bottleneck hinders the scalable and cost-effective deployment of deep learning models in urban noise monitoring systems. To solve this practical challenge, active learning (AL) offers a label-efficient alternative. Unlike standard random sampling, AL aims to iteratively select the most informative samples for annotation to efficiently maximize the model performance [22,23]. Existing AL studies have mainly explored uncertainty-based, diversity-based, or class-aware sampling criteria, and these strategies have shown effectiveness in many general classification settings. However, most of them only consider one or two of these objectives, which may be insufficient for exceedance-triggered social noise recordings [24]. In these types of data, acoustic mixing and interference call for reliable uncertainty-driven exploration, high redundancy calls for diversity-aware selection to avoid labeling similar clips, and imbalanced class distributions require balanced sampling to better recognize minority categories [25,26,27]. Therefore, this calls for a tailored active learning strategy designed to overcome the annotation bottleneck of real-world social noise monitoring scenarios. Accordingly, this study examines whether a unified active learning strategy can improve label efficiency for social-noise classification under limited annotation budgets, and whether it remains effective for real exceedance-triggered recordings characterized by acoustic mixing, redundancy, class imbalance, and cross-site variation.
To address the above gap, this study proposes a unified active learning framework for cost-effective source tracing in social noise monitoring. The contribution of this work is a scenario-adapted mechanism design for exceedance-triggered real-world recordings, where high redundancy, acoustic mixing, and long-tail class distributions coexist. Specifically, the methodological contribution lies in encoding prediction uncertainty together with dynamic class-aware learning needs into a weighted acoustic feature space, so that diversity-based querying can be guided by both sample informativeness and class-learning demand in a unified manner. In addition, the practical contribution lies in validating this design on both a public benchmark and real exceedance-triggered monitoring data, demonstrating its value in reducing annotation cost, improving recognition of under-learned categories, and supporting rapid localized adaptation across monitoring sites. In this study, the classification task is defined for social noise source tracing and governance, with acoustically dominant non-social events included as confounding classes in exceedance-triggered recordings to improve source tracing reliability in real monitoring scenarios. The remainder of this paper is organized as follows. Section 2 presents the study sites, dataset construction, proposed active learning framework, and experimental setup. Section 3 reports and discusses the benchmark validation, real-world label-efficiency evaluation, ablation study, and cross-site generalization results. Finally, Section 4 summarizes the main conclusions and practical implications of this study.
2. Materials and Methods
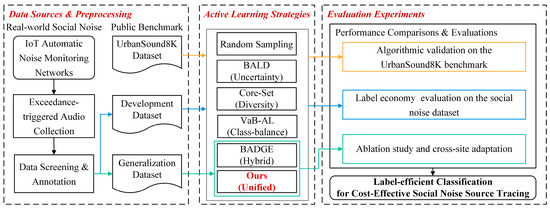
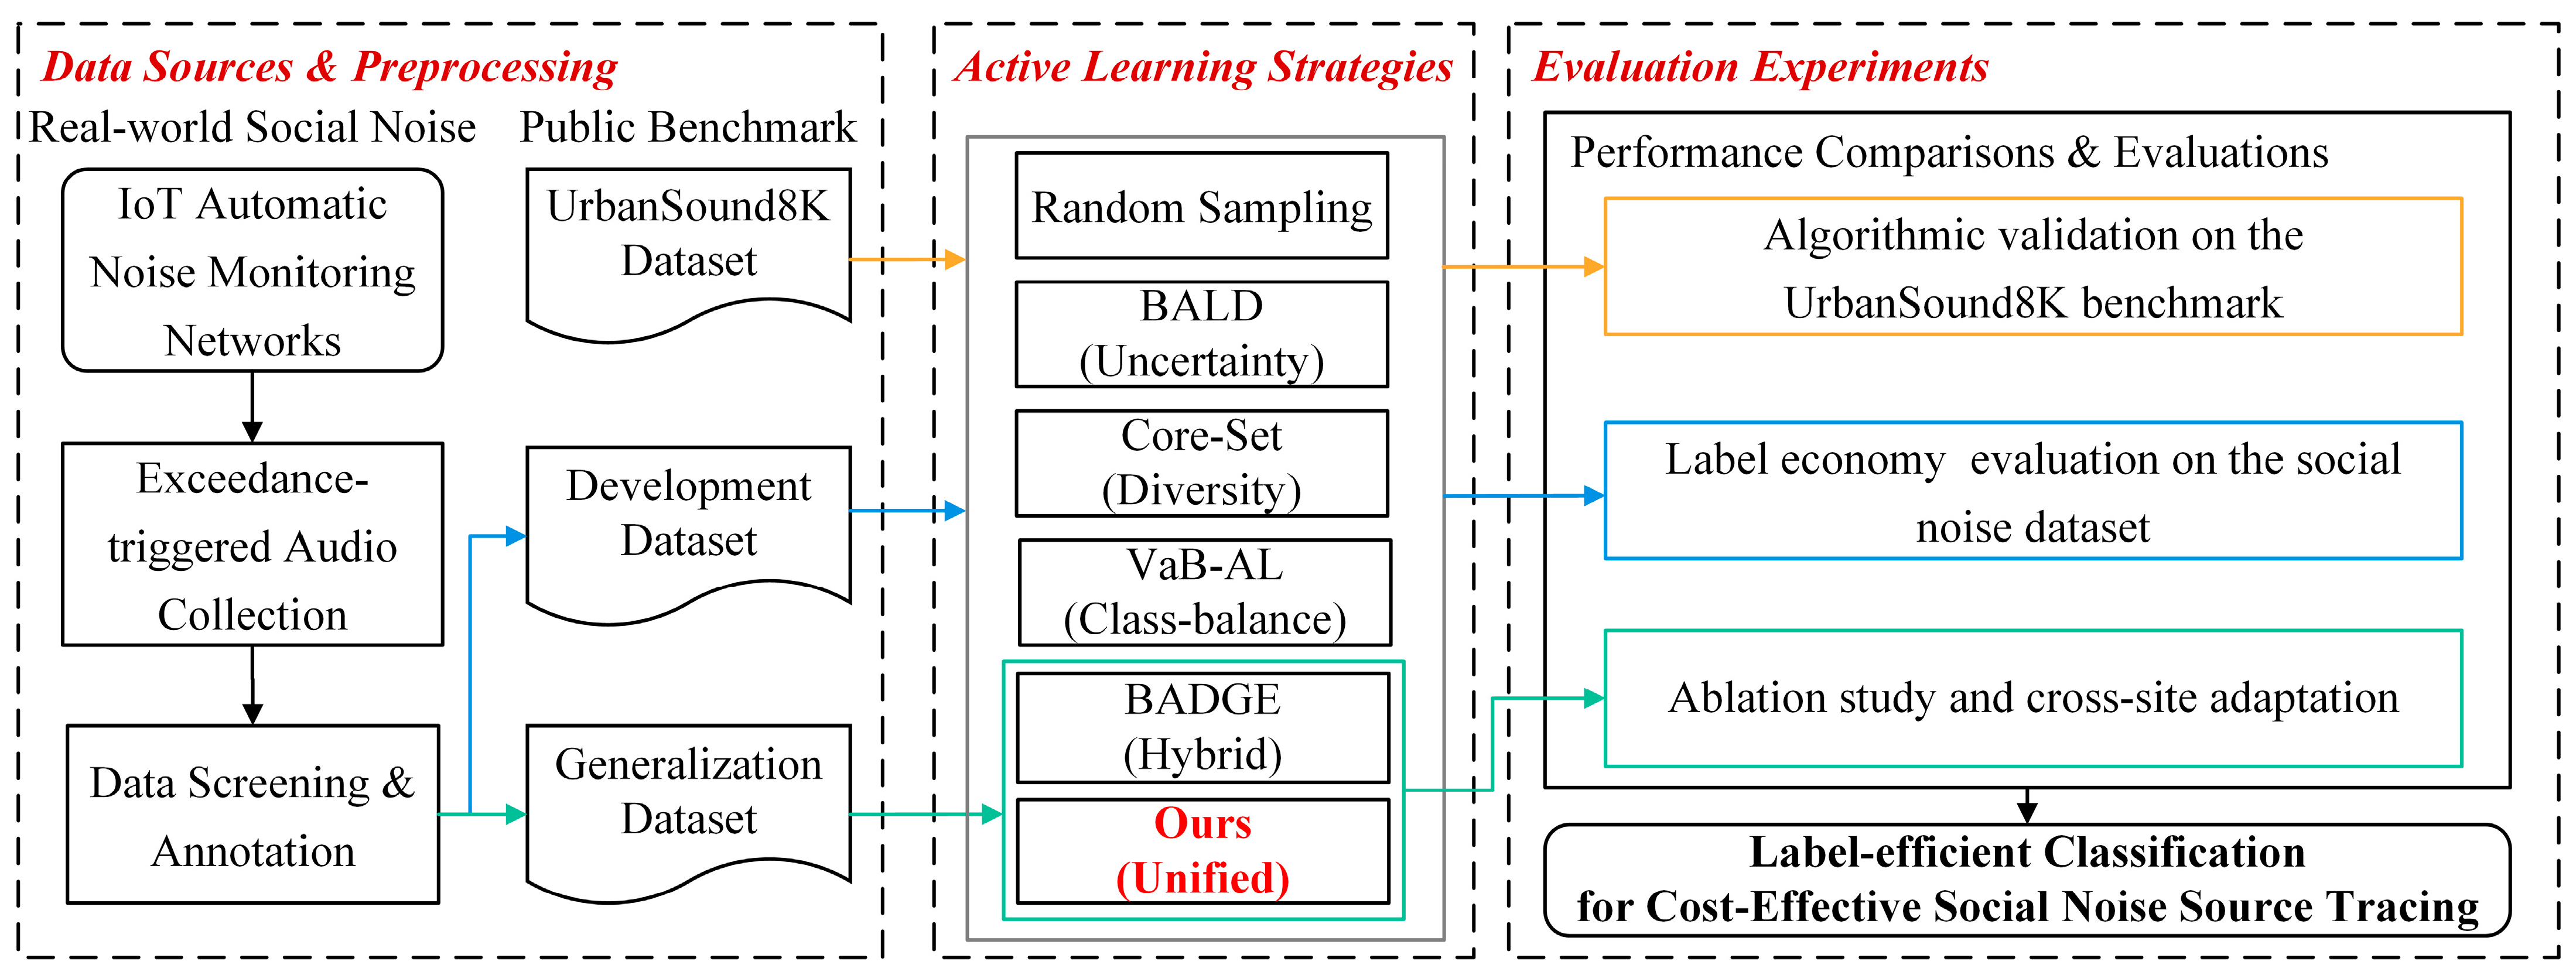
This section outlines the technical approach for the proposed label-efficient classification framework. As shown in the technical roadmap (Figure 1), the research workflow involves data acquisition and pre-processing, sampling strategy design, and multi-stage evaluation experiments that validate algorithmic performance, label economy and cross-site generalization. The specific implementations of each part are detailed in the following sections.
Figure 1.
Technical roadmap of the proposed active learning framework for application-oriented social noise classification in exceedance-triggered audio recordings.
2.1. Study Sites and Data Acquisition
2.1.1. Study Area and Noise Monitoring System
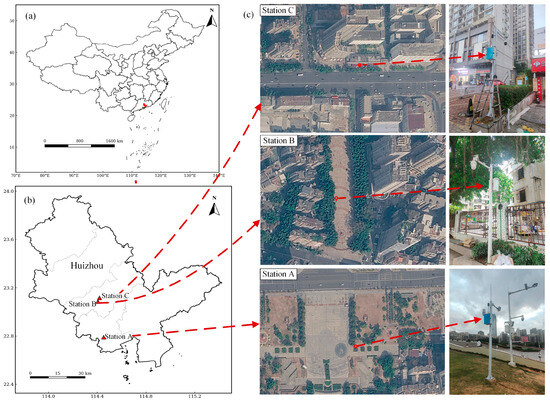
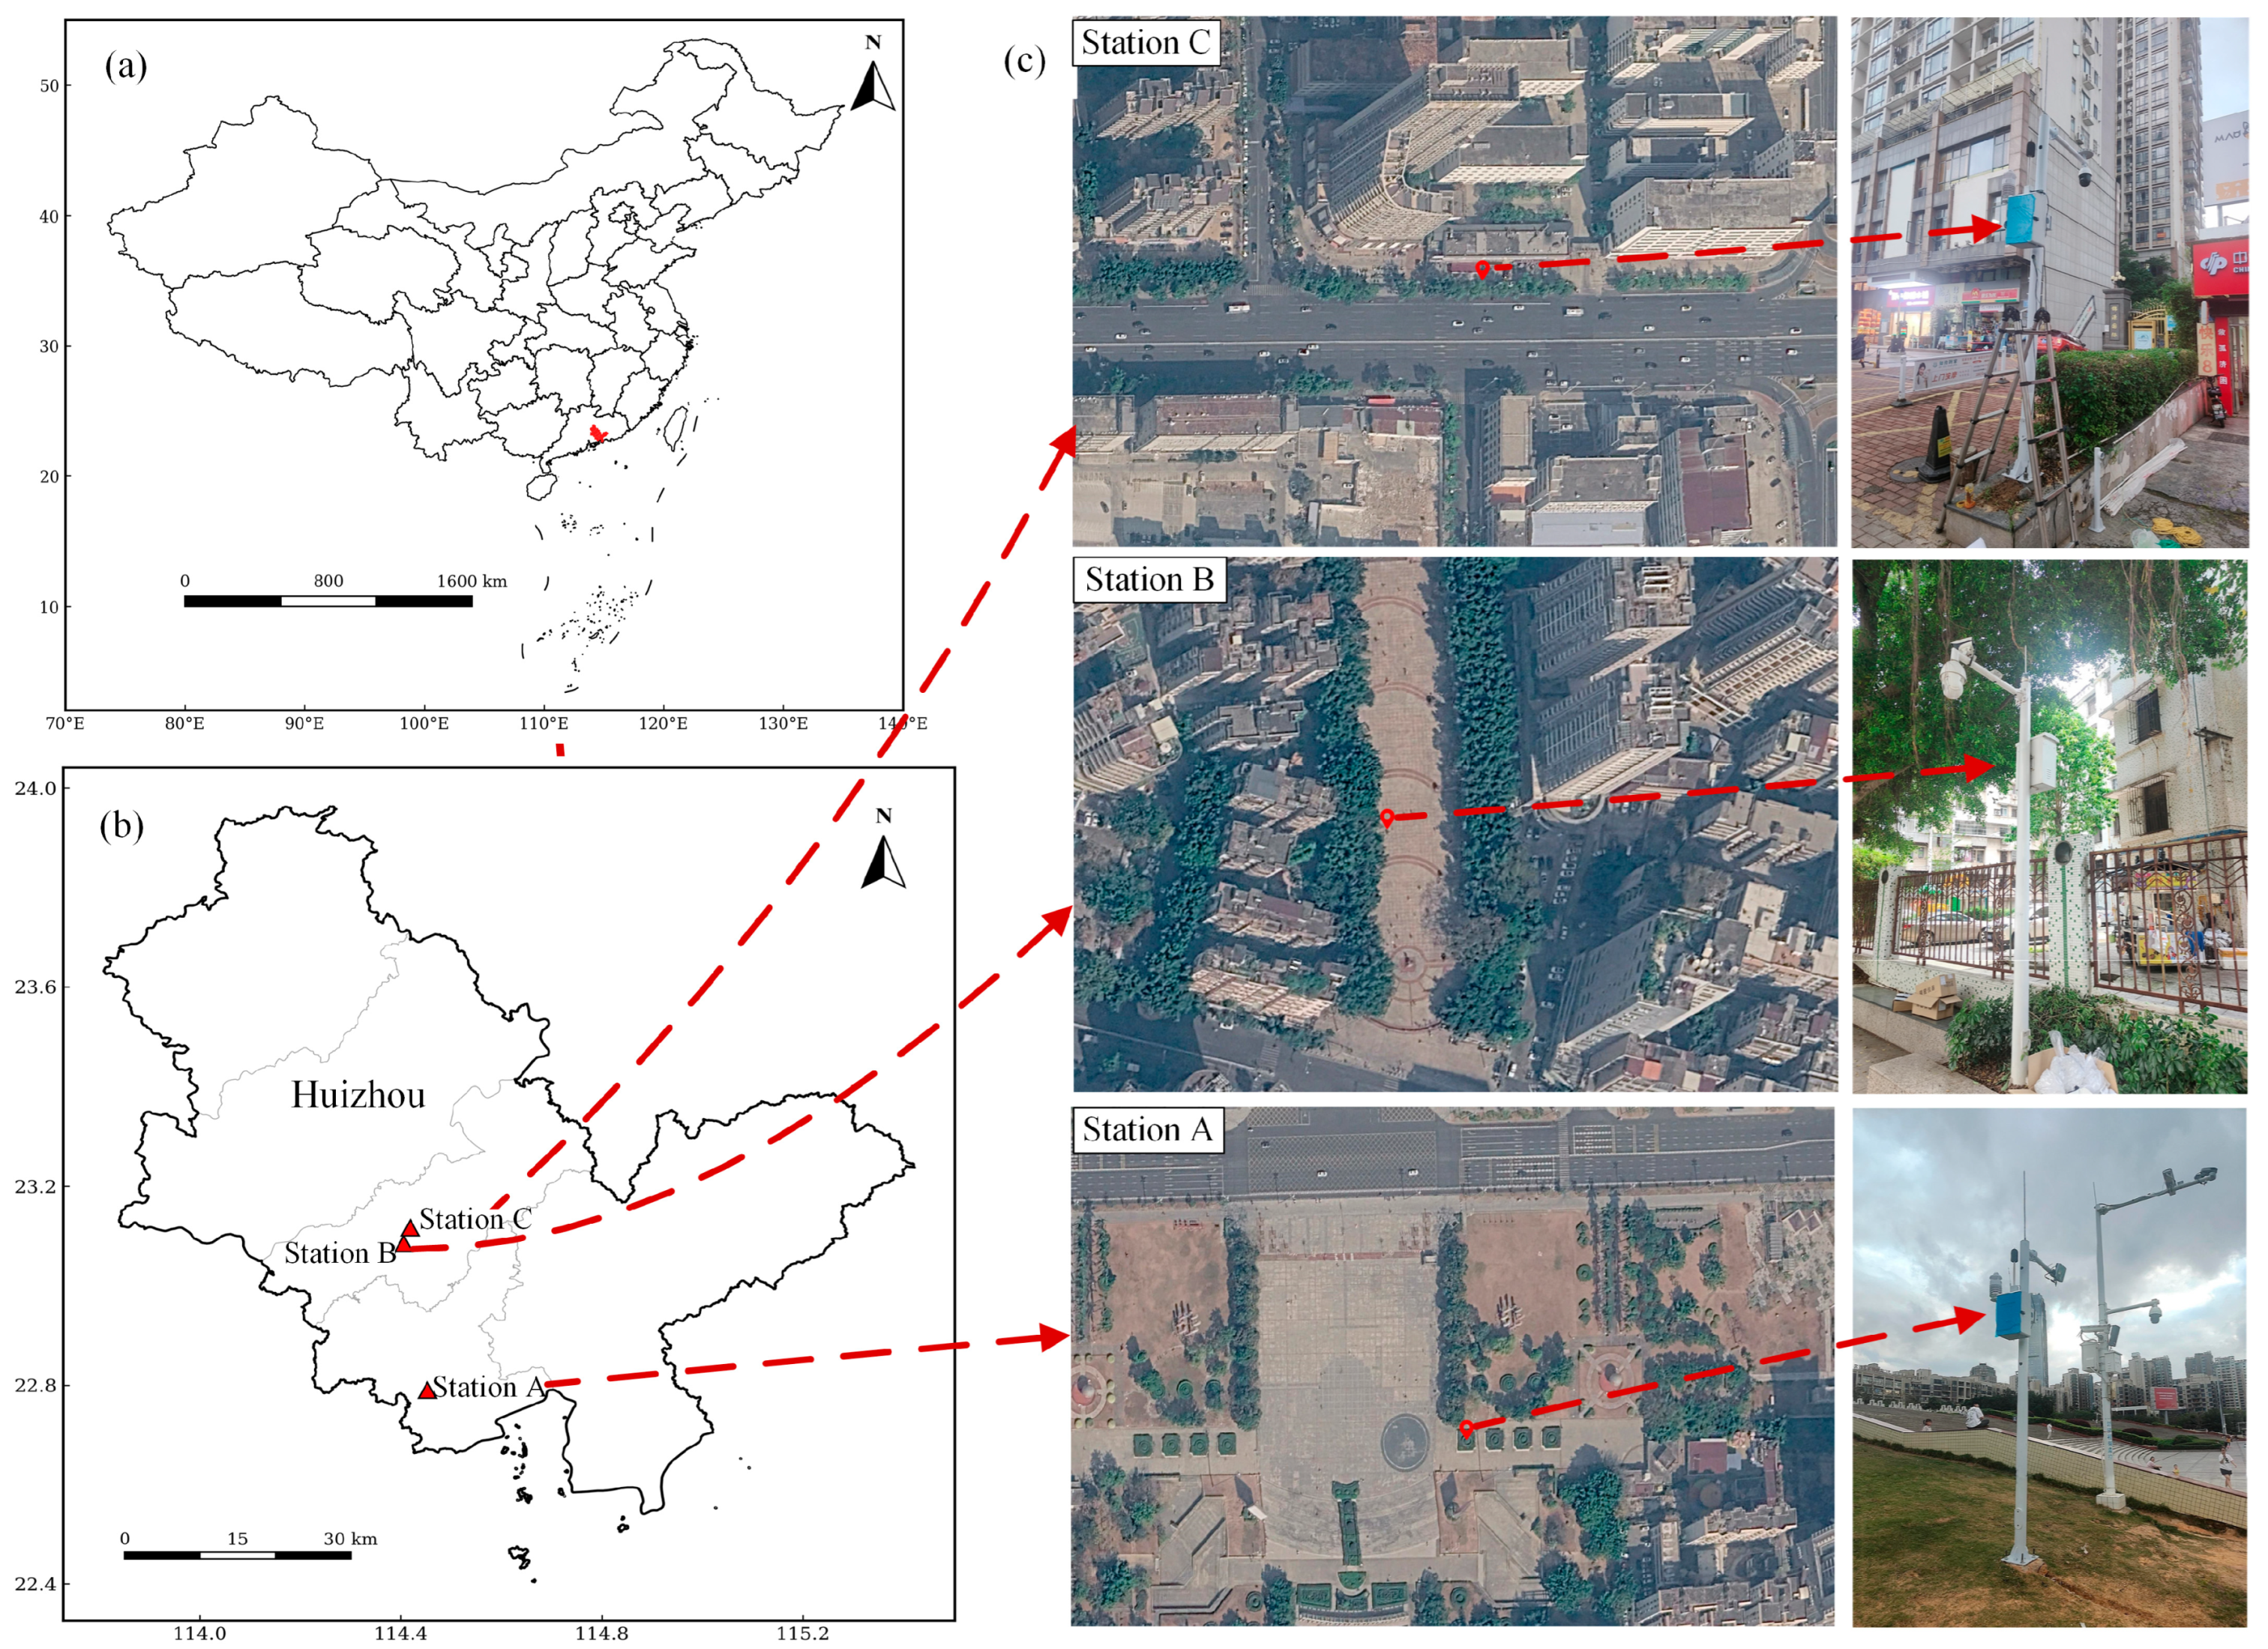
The field monitoring campaign was conducted in Huizhou, China. The monitoring locations were selected based on social noise complaint hotspots provided by local government authorities (the top three out of 30 based on complaint frequency). Three monitoring stations were deployed in different acoustic environments (Figure 2). Station A was located at the open square near the main artery, and its social noise events are sometimes masked by background traffic noise. Station B was set at the community square beside the residence, where the acoustic scene comprises recurrent social noise events and occasional natural sounds (e.g., birdsong). Data collection at Stations A and B was performed continuously from March to June 2025. Station C was installed in a noisy residential area near a commercial building and a neighboring street. The acoustic environment at this site was relatively noisy, primarily dominated by crowd clamor and road traffic noise. Data collection at Station C was conducted exclusively during June 2025. The IoT-based automatic noise monitoring terminals continuously monitored sound-level data in the field. The main hardware information of the deployed monitoring system is summarized in Table S1 of the Supplementary Materials. To capture valid noise pollution events, the terminal automatically saved a 10 s audio clip whenever the A-weighted equivalent sound level LAeq,T computed over a sliding window of T = 5 s exceeded the relevant daytime or nighttime limit. The limit was determined by the site’s officially designated acoustic environment functional class, following the Environmental Quality Standard for Noise (GB 3096–2008) [28]. Because the monitoring terminals were triggered by sound-level exceedances, the collected recordings could naturally include both recurrent social noise events and occasional natural sounds (e.g., birdsong) whenever these sounds became acoustically prominent during an exceedance event.
Figure 2.
Study area and field deployment of the IoT-based monitoring terminals in different social noise complaint hotspots. (a) Location of Huizhou in China. (b) Distribution of the three monitoring stations in Huizhou. (c) Map views and field photographs of Stations A–C.
2.1.2. Dataset Construction and Preprocessing
A large pool of exceedance-triggered 10 s recordings was first collected across the three IoT-based monitoring stations. To construct a reliable dataset, the original recordings were screened through three steps. First, clips severely degraded by extreme weather (e.g., heavy rain or wind noise causing microphone clipping) or electrical interference (e.g., persistent static noise) were discarded. Second, recordings with excessive acoustic ambiguity, namely clips in which multiple sounds overlapped without a clearly identifiable dominant source, were excluded because reliable human annotation could not be ensured. Third, when a single prolonged noise event repeatedly triggered the monitoring terminal and generated multiple temporally adjacent clips, only representative segments were retained. In total, approximately 32,000 exceedance-triggered 10 s recordings were initially collected across the three monitoring stations, and 8000 recordings were retained after screening for annotation and dataset construction. Detailed quantity statistics for the screening process are provided in Table S2 of the Supplementary Materials.
Following this screening, all retained clips were annotated independently by two acoustic experts. In this study, the dominant source was operationally defined as the acoustically most salient event within the 10 s recording window, that is, the sound event judged to be primarily responsible for the exceedance. For clips containing multiple overlapping sources, annotators assigned the label to the source that remained perceptually dominant over the clip and was considered the principal contributor to the exceedance, rather than to background or brief secondary sounds. Disagreements between the two annotators were subsequently re-examined through joint review, and a final label was assigned only after consensus was reached. Clips for which a reliable dominant source could not be determined were excluded during the quality-control stage. Based on this protocol, the retained recordings were categorized into 12 dominant-source classes, whose class names, abbreviations, and operational definitions are summarized in Table 1.
Table 1.
Class names, abbreviations, and operational definitions of the 12 dominant-source classes.
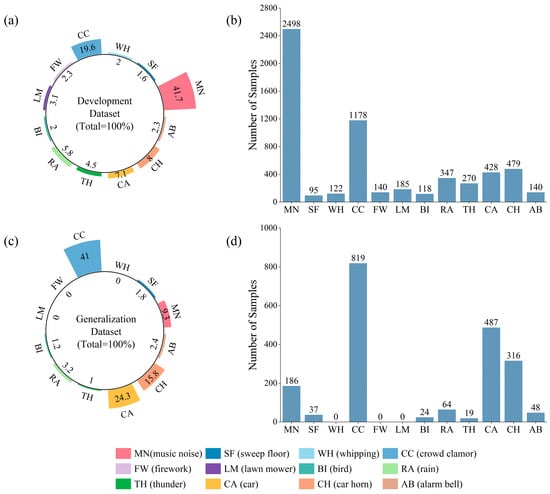
After filtering and annotation, the recordings were organized into two functionally distinct real-world datasets according to site characteristics and experimental objectives. Stations A and B, both representing open-square social noise scenarios, were combined to form a development dataset containing 6000 clips for evaluating label-efficient model construction. Conversely, Station C, located in a commercial-residential acoustic environment with a markedly different source composition, was used as an independent generalization dataset containing 2000 clips for cross-site adaptation analysis. In the present application setting, social noise classification is implemented on exceedance-triggered recordings collected for social noise source tracing and governance. Because real-world exceedance-triggered audio may also contain acoustically dominant non-social events, such as bird, rain, and others, these categories were retained as confounding classes to avoid misclassification and to improve the practical reliability of source tracing. As shown in Figure 3, both datasets exhibit evident class imbalance, and their relative and absolute class distributions differ substantially across sites, reflecting the practical challenges of long-tail recognition and cross-site distribution shift in real-world monitoring. In addition to the real-world collected recordings, we also evaluated the proposed method on the widely adopted UrbanSound8K benchmark [29] to validate the fundamental effectiveness under a standard public benchmark setting.
Figure 3.
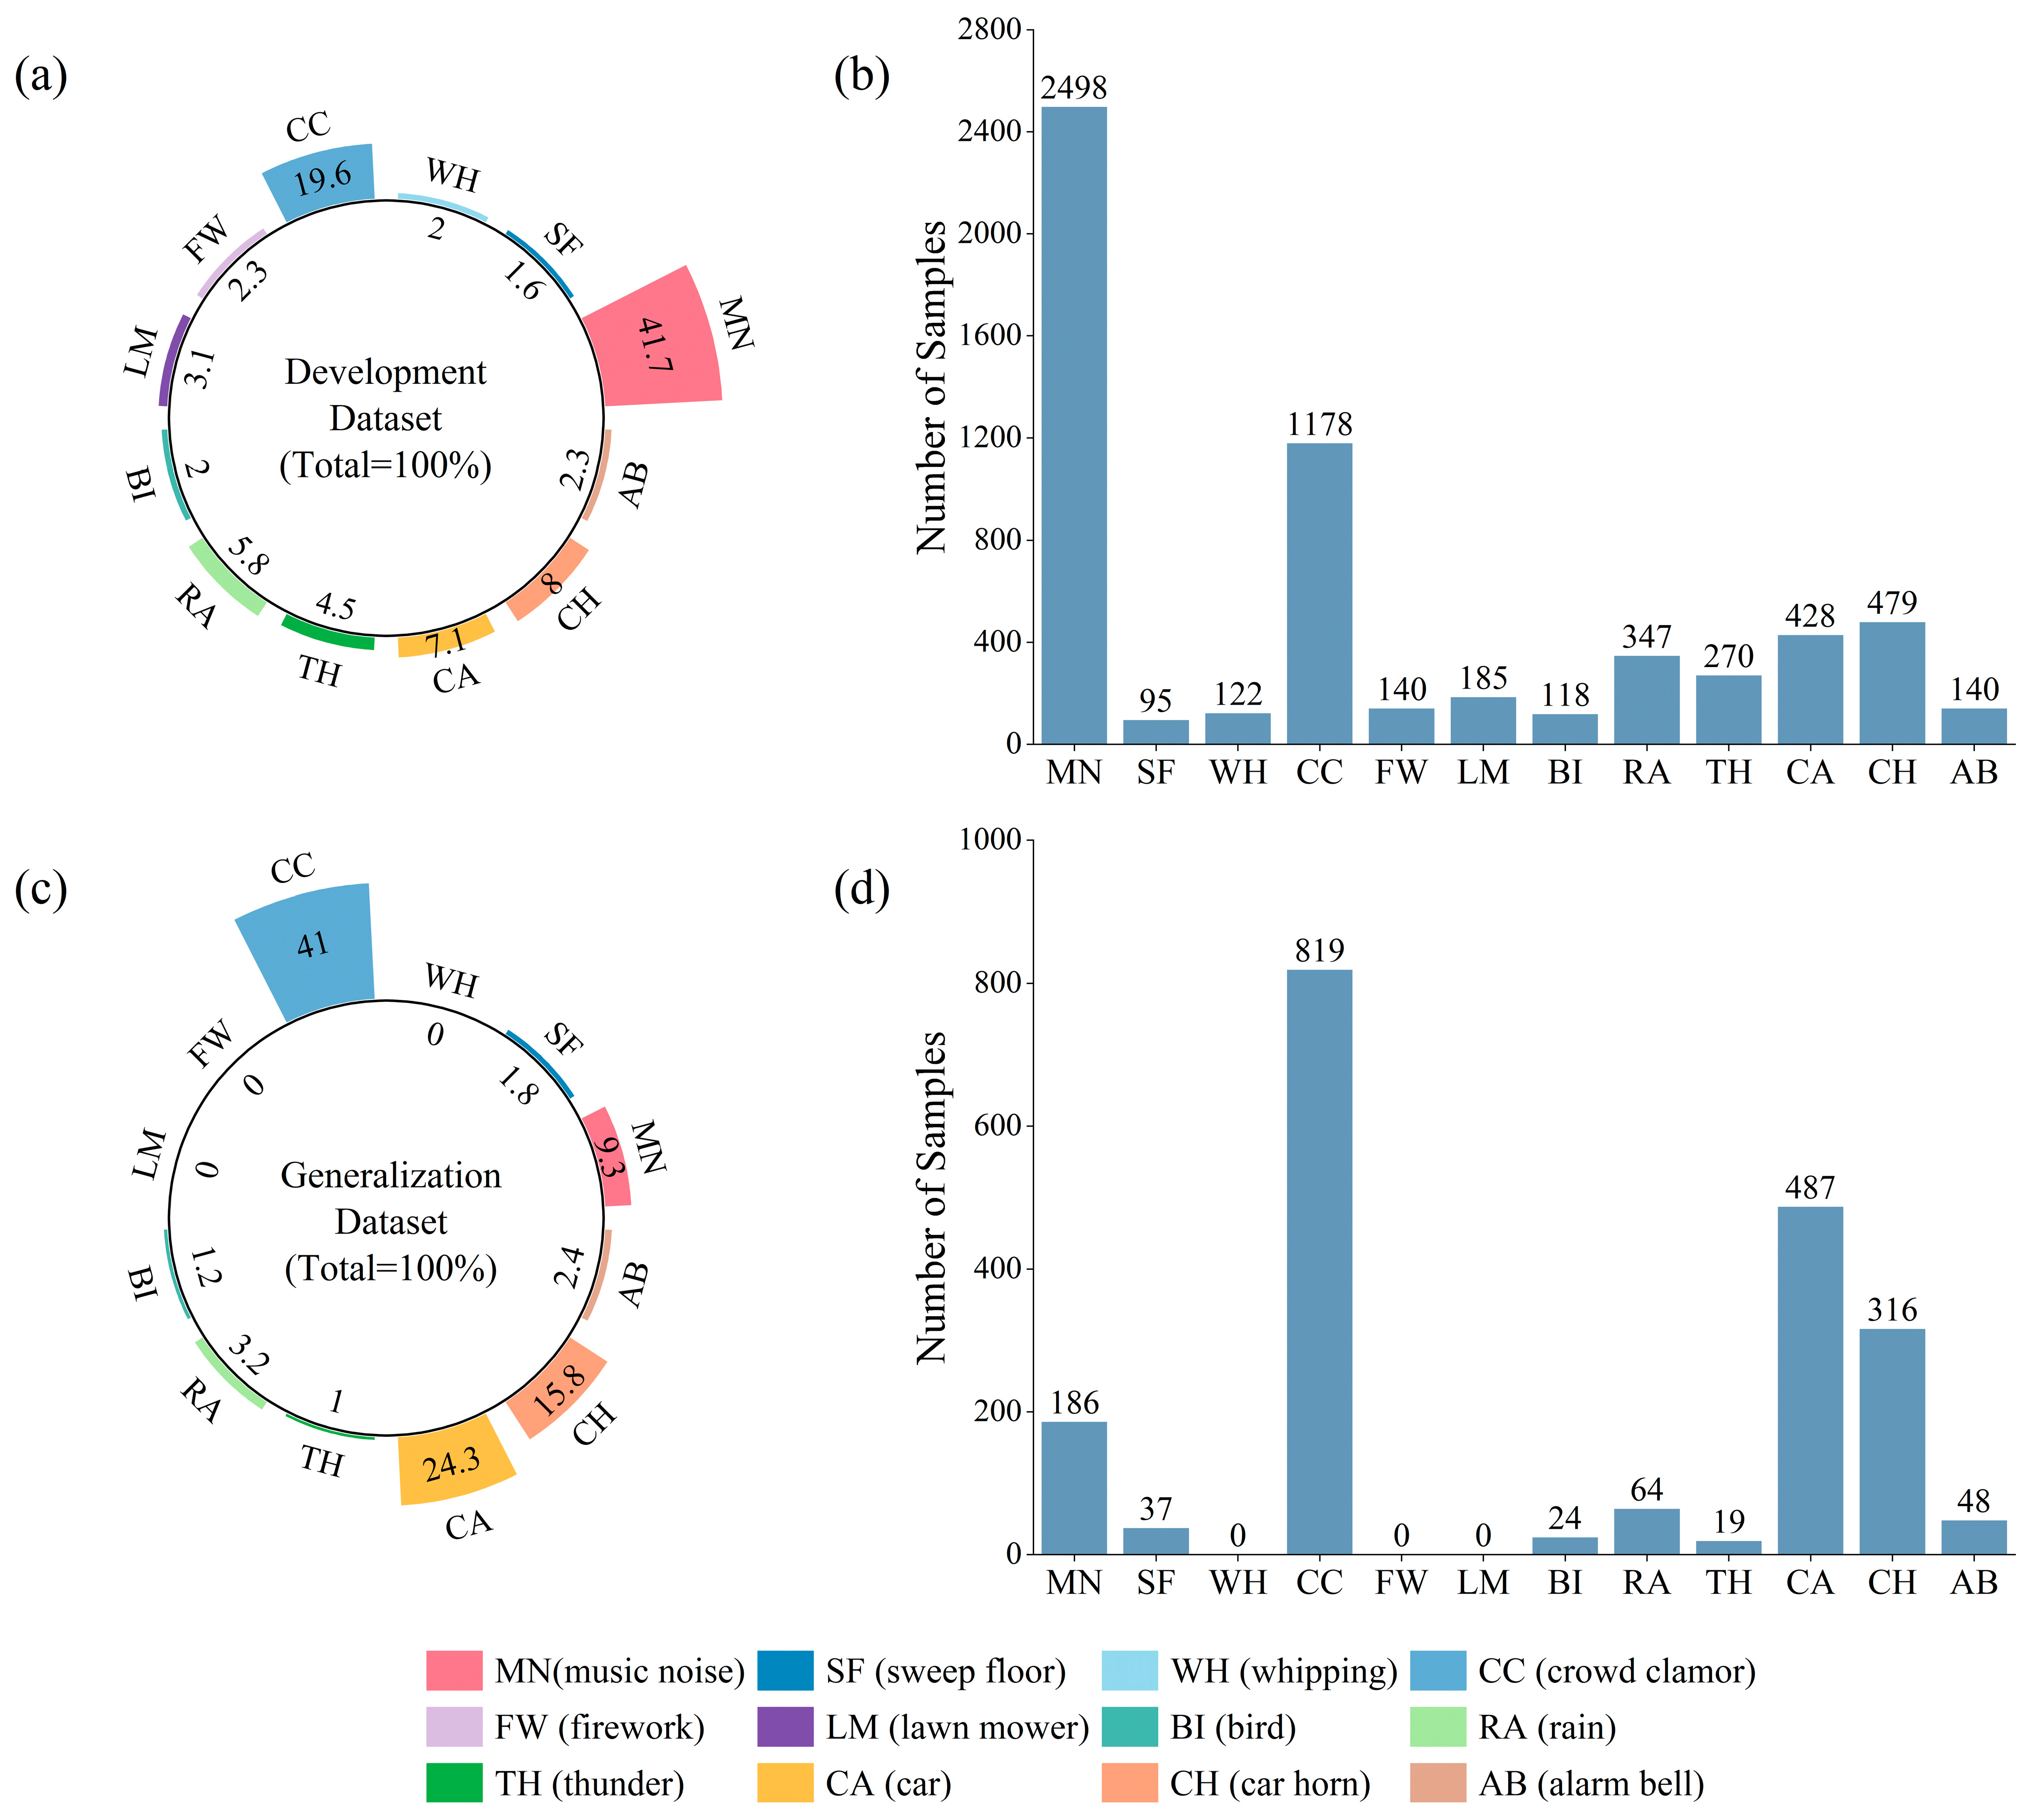
Relative and absolute class distributions of the two real-world datasets. (a) Relative class distribution of the development dataset. (b) Absolute sample counts of the development dataset. (c) Relative class distribution of the generalization dataset. (d) Absolute sample counts of the generalization dataset. Both datasets exhibit evident class imbalance, while their class compositions differ substantially across sites, indicating a clear cross-site distribution shift. Colors correspond to the class legend, and class abbreviations and definitions are provided in Table 1.
2.2. Active Learning Framework
We formulate the application-oriented social noise classification task as a multi-class classification problem on exceedance-triggered recordings within an active learning framework [30]. In this setting, each class denotes the dominant sound event of a clip, including both target social noise categories and practically encountered confounding classes. In line with reporting practices in recent applied acoustics research [31], the present study explicitly specifies the acoustic data representation and the subsequent learning workflow. Each audio clip was represented by log-Mel filterbank (Fbank) features as the acoustic input to the subsequent learning framework, and the detailed extraction settings are provided in Section 2.4.2. The proposed strategy jointly considers uncertainty, diversity, and class balance. Therefore, we analyze the theoretical characteristics of these measures to motivate the foundation for our proposed unified strategy.
2.2.1. Problem Formulation
In the context of automated social noise monitoring, we denote the exceedance-triggered audio dataset as . Here, each sample represents an audio clip and denotes its dominant sound-event label, including social noise categories and confounding classes. Our objective is to train a deep neural network model via active learning using minimal labeled data, while enabling the model to accurately predict the noise source class of each clip.
To minimize annotation costs, active learning is conducted in an iterative manner. In the initial phase, is divided into a small labeled dataset , where , and a large unlabeled data pool . During iteration , given the current label set and unlabeled pool , we select a query set of size by maximizing the sampling score, as defined in Equation (1):
where estimates the informativeness of sample under the current model. After querying the oracle (human experts) for labels , we update the labeled and unlabeled sets as shown in Equation (2) and Equation (3), respectively:
The model is then updated to obtain based on . Therefore, the core objective is to design an efficient sampling function that enables the model to achieve greater classification performance under a limited annotation budget.
2.2.2. Review and Limitations of Conventional Sampling Strategies
To construct an efficient sampling function , we first review representative active learning criteria in the literature and analyze their limitations in the context of exceedance-triggered audio monitoring for social noise governance. Current approaches typically rely on a single dimension or a fusion of two from the triplet of uncertainty, diversity, and class balance.
Uncertainty sampling. Standard uncertainty sampling with measures such as entropy or BALD (Bayesian Active Learning by Disagreement) is a popular method to select informative samples [32,33]. Although successful in generic classification, this approach faces challenges in environmental sound. High uncertainty in this domain is often caused by acoustic ambiguity, such as overlapping sound events or heavy background interference, rather than informational gain [34]. Thus, it is prone to select noisy abnormal samples or confusing clips which might contribute little to model improvement, thereby reducing annotation efficiency [35,36].
Diversity sampling. The diversity-based methods such as Core-Set aim to maximize the coverage in feature space while minimizing sample redundancy [37]. This is especially useful in removing temporally neighboring redundant clips [38]. But diversity selection usually ignores the sample difficulty. It has been shown that pure diversity sampling tends to select representative but easily classified samples that contribute less to model improvement [39]. As such, they might have a lower sampling efficiency than uncertainty strategies.
Hybrid and class-balanced strategies. To address the above limitations, recent methods often employ hybrid strategies. For instance, BADGE [40] combines uncertainty and diversity to capture multiple informative signals, while VaB-AL [41] combines uncertainty with class balance to tackle imbalanced distributions. However, BADGE mainly couples uncertainty with diversity, whereas the learning needs of under-represented or insufficiently learned classes are not explicitly encoded in the sampling geometry. Likewise, prior class-balanced active learning methods introduce class-aware preference, but this signal is not necessarily coupled with distance-based diversity selection in a unified feature-space mechanism. In the context of exceedance-triggered social noise recordings, where long-tail classes, acoustically mixed events, and temporal redundancy coexist, the interaction between class-learning needs and diversity-aware querying may still be insufficiently captured when these signals are handled separately [42]. Therefore, a scenario-adapted unified sampling mechanism is needed for real-world noise source tracing tasks.
2.3. Proposed Sampling Strategy
Based on the properties of exceedance-triggered recordings collected for social noise monitoring, we propose a unified sampling strategy. The key idea is to encode both prediction uncertainty together with dynamic class-aware learning needs into a weighted acoustic feature space built from backbone-derived embeddings of the Fbank inputs described in Section 2.4.2, so that diversity-based querying can be performed in a unified manner. Rather than handling informativeness, class balance, and representativeness as independent criteria, the proposed strategy allows these factors to interact within the same sampling geometry. As a result, diversity sampling is guided not only toward broad feature-space coverage, but also toward samples that are more informative, less redundant, and more relevant to under-represented categories in real-world monitoring data.
2.3.1. Construction of Comprehensive Value
We define a comprehensive value score for each unlabeled sample , quantifying its potential contribution to model training. This score combines prediction uncertainty with a dynamic class-aware weight.
Robust uncertainty estimation. In exceedance-triggered recordings, complex background noise can introduce noisy signals into standard uncertainty measurements. To obtain a robust estimate, we utilize margin sampling to quantify the decision boundary ambiguity. By focusing on the difference between the top-two predicted probabilities, this metric effectively captures the confusion between the most likely candidate classes while resisting the interference of non-target background noise [43]. The uncertainty score is defined by Equation (4):
where and are the classes with the highest and second-highest probabilities. A smaller margin indicates that the decision boundary is ambiguous.
Dynamic class-aware weighting. To reflect the class-learning needs at the current active learning stage, we further introduce a dynamic class-aware weighting term. This term jointly considers the current class distribution in the labeled set and the class-specific recognition status of the current model. In this way, the weighting mechanism emphasizes categories that are either under-represented or remain insufficiently learned under the current training state. To prevent numerical instability or extreme weights during the cold-start phase, we apply logarithmic smoothing as presented in Equation (5):
Here, is the proportion of class in the current labeled set, is the model’s accuracy for class on the validation set, and is a small smoothing constant (e.g., 10−5) added to prevent numerical instability. The fixed validation subset was reserved during dataset partitioning and manually annotated at the same stage as the test set. It served as a standard part of the dataset throughout all active learning iterations, and is used for model evaluation, training control, and fair comparison across methods, and is therefore distinct from the samples iteratively labeled during active learning. In our framework, the class-wise performance computed on this fixed validation set is further used to update the dynamic class-aware weights at each iteration. This mechanism ensures the model pays higher attention to tail classes (low ) and difficult classes (low ). Finally, the comprehensive value is computed using Equation (6), which is the product of uncertainty and the expected class weight derived from the sample’s predicted distribution:
In this formulation, the class-aware term is applied at the sample level through the predicted class distribution of each unlabeled instance, allowing current class-learning needs to influence the value assessment of ambiguous samples as well.
2.3.2. Sampling via Weighted Feature Space
Standard diversity sampling (e.g., Core-Set) treats all samples as geometrically equal, often selecting easy samples just to fill the feature space. Therefore, we construct a weighted feature space by scaling the magnitude of each feature according to its calculated comprehensive value.
This design is motivated by the fact that the final query step is based on farthest point sampling (FPS), which selects samples according to their distances in the feature space. Therefore, if the comprehensive value is expected to influence diversity-based querying, it should not be used only as a separate score, but should be incorporated into the feature space used for FPS.
Let be the -normalized feature vector of sample extracted from the deep model. The weighted feature representation is defined as shown in Equation (7):
By scaling the magnitude of the normalized embedding, this mapping preserves the original feature direction while adjusting the relative influence of each sample during distance-based selection. In other words, samples with similar acoustic characteristics still remain close in direction, but those with higher comprehensive value are placed farther from the origin and therefore receive greater emphasis during FPS. In this way, the distances used for sample selection reflect not only acoustic similarity, but also the current training value of candidate samples.
We then perform Farthest Point Sampling (FPS) on the above weighted feature vectors. Equation (8) presents the object to iteratively select a sample that maximizes the distance to the current labeled set :
Under this formulation, diversity sampling is guided not only by feature-space coverage, but also by sample importance under the current model. This is particularly suitable for exceedance-triggered social noise recordings, where redundant clips are common and high-value samples should not be overlooked during selection.
2.4. Experimental Design and Setup
2.4.1. Evaluation Experiments
The performance of the proposed framework was tested in a three-stage evaluation pipeline that progresses from fundamental benchmark validation to real-world simulation of an IoT-based noise monitoring network. To establish a standardized baseline, we conducted validation on UrbanSound8K, which serves as an ideal setting for comparison with typical AL strategies. Then we focused on the real-world development dataset (Stations A and B) to assess the label efficiency in training a social noise classification model. Finally, a model migration scenario with the generalization dataset of Station C was simulated. This experiment investigated whether our approach could maintain strong label efficiency in localized training after deploying the trained model to a new monitoring site.
2.4.2. Dataset Splitting and Model Training Settings
After data screening and temporal deduplication, the development dataset was split into 4200 training clips, 600 validation clips, and 1200 test clips, whereas the generalization dataset was split into 1400 training clips, 200 validation clips, and 400 test clips. A fixed labeled validation subset was reserved before active learning and kept unchanged throughout all iterations. For UrbanSound8K, a fixed validation split was also used throughout active learning, with Fold 9 reserved for validation and Fold 10 used as the test split. These two procedures served different purposes. Temporal deduplication was applied during dataset curation to remove near-duplicate clips repeatedly triggered by the same continuous event, whereas subset partitioning was designed to reduce leakage across the training, validation, and test sets. Notably, even after temporal deduplication, recordings collected at the same monitoring site on the same day may still exhibit residual acoustic correlation because they often share similar background conditions and recurring activity patterns. To mitigate this effect, the curated clips were grouped using station and recording-date metadata before partitioning, and all clips within the same group were assigned to the same subset. This strategy helps prevent acoustically similar recordings from being split across different subsets, thereby reducing the risk that temporal correlation within the same site may inflate performance estimates.
All audio inputs were normalized to 10 s, resampled to 16 kHz, and converted into log-Mel filterbank features using a 25 ms analysis window, a 10 ms hop length, and 128 Mel filter bins spanning 20–8000 Hz, followed by z-score normalization. These acoustic features were then encoded by PANNs-CNN14 initialized with AudioSet-pretrained weights [44,45], which served as the backbone network in all experiments. The resulting 2048-dimensional embeddings were used as the base representation for constructing the unified weighted acoustic feature space for active learning. For each dataset, all compared methods shared the same acoustic features, pretrained backbone, optimizer, learning-rate schedule, batch size, training epochs, regularization strategy, and stopping criterion. No additional probability calibration procedure was applied. The key experimental settings are summarized in Table 2.
Table 2.
Training settings used in the experiments.
2.4.3. Active Learning Procedure and Metrics
We performed experiments in an AL setting with a per-iteration query budget of 36 clips on the social noise datasets and 100 clips on the UrbanSound8K benchmark to maintain a low manual annotation workload. In this study, the reported annotation budget counts only the samples iteratively queried from the unlabeled training pool. The fixed validation and test subsets were excluded from this budget because they served as shared validation and final evaluation splits for all compared methods and were not part of the candidate query pool. This definition isolates the label efficiency of the sampling strategy itself, rather than conflating iterative query cost with the fixed overhead required for model selection and final evaluation. We compared our method to relevant baselines such as Random, BALD [32], Core-Set [37], VaB-AL [41], and BADGE [40]. Model performance was mainly measured in terms of macro-averaged F1-score (Macro-F1) for an unbiased comparison across imbalanced noise classes, while class-wise results were reported using F1-score. We also used the area under the learning curve (AULC), which is a widely accepted measure for sampling efficiency and in this case indicates greater cost reduction when target performance is reached with a lower manual annotation budget (Section S1). To evaluate label efficiency against a consistent reference, the fully supervised upper bound was used as a performance ceiling throughout the three-stage evaluation. For each dataset, this upper bound was obtained by training the same backbone on all labeled samples in the corresponding training split. To ensure a fair comparison, the fully supervised setting and all active learning methods shared the same pretrained initialization and training configuration, as described in Section 2.4.2. Under this design, performance differences relative to the upper bound can be attributed to the amount of labeled data rather than to differences in initialization or training setup. For the cross-site adaptation experiment, the reported annotation ratio was calculated with respect to the target-domain training data of Station C, and the corresponding fully supervised upper bound was obtained using all labeled samples from the same target-domain training data. All experiments were repeated three times with different random seeds and the mean performance was reported across runs.
3. Results and Discussion
3.1. Algorithmic Validation on UrbanSound8K Benchmark
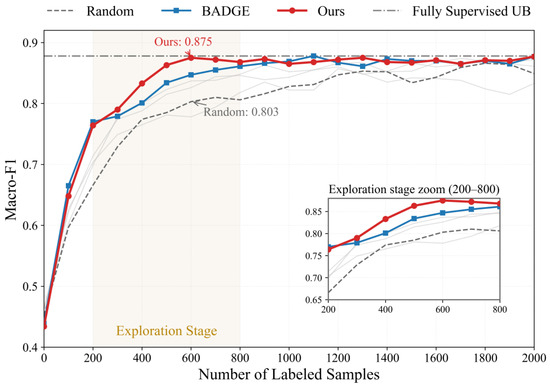
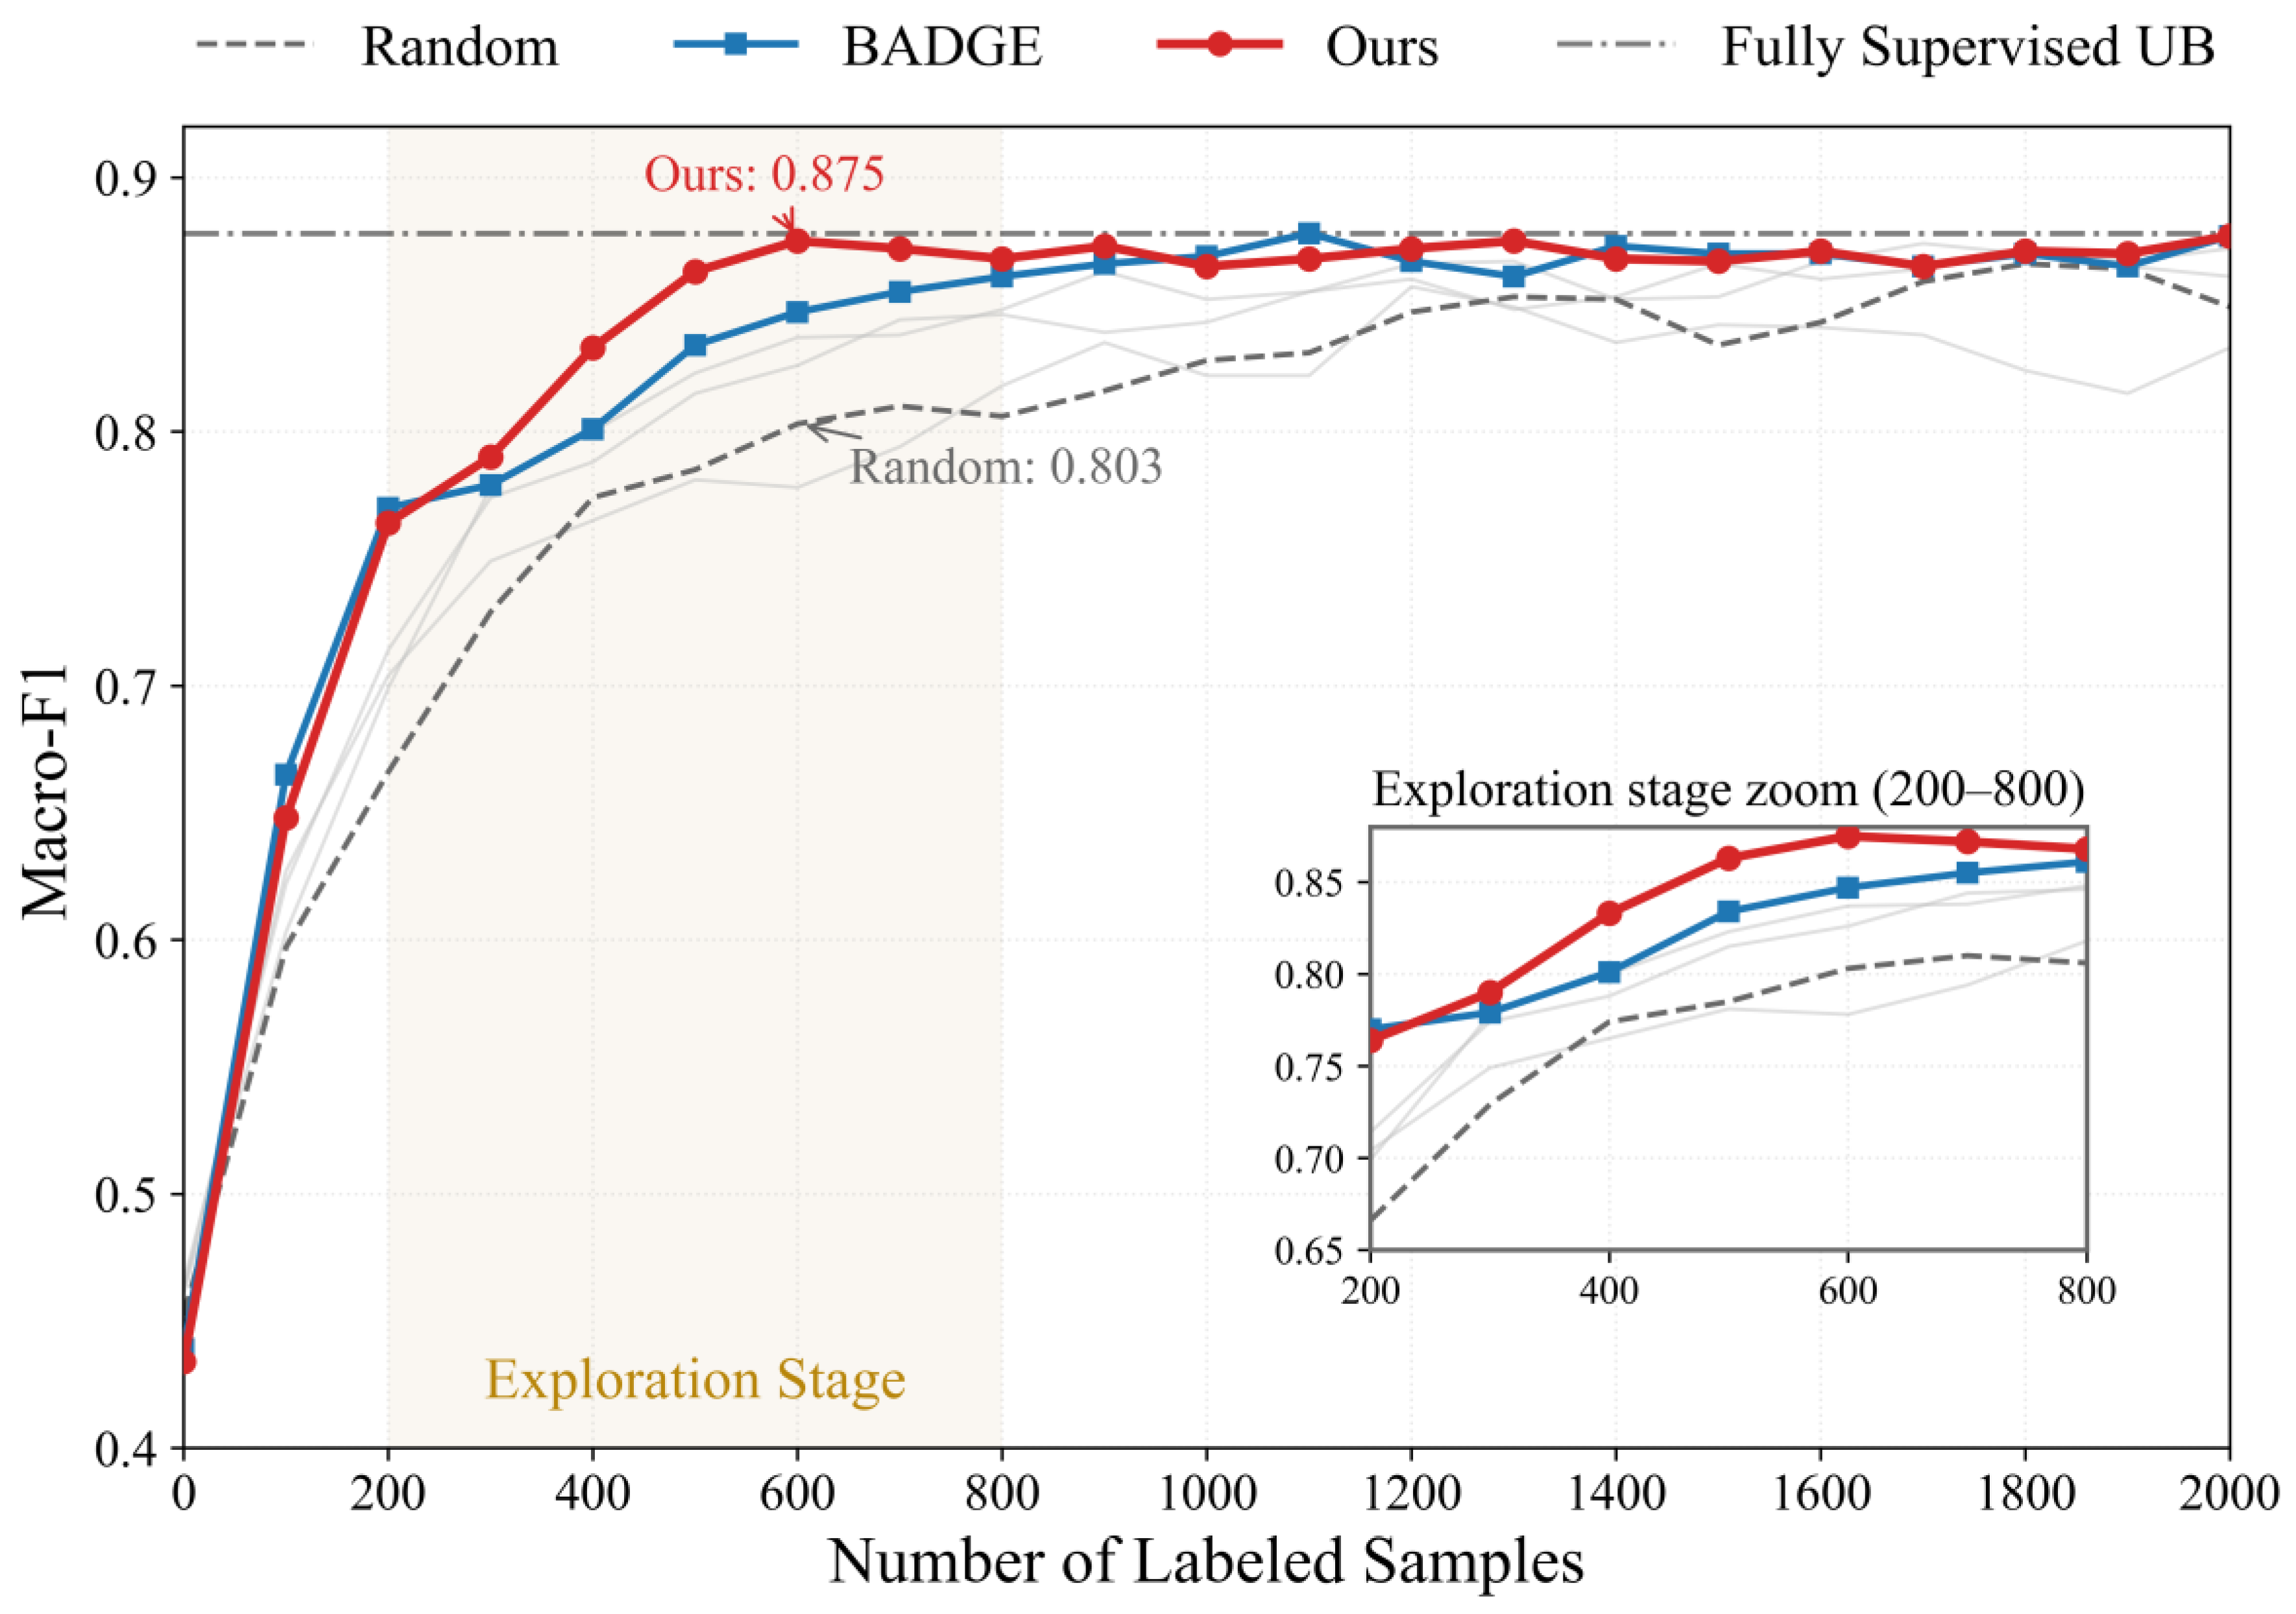
In order to verify the efficiency of the proposed AL approach, we first conducted a baseline comparison on UrbanSound8K dataset. The learning curves of various approaches under a growing labeling budget are shown in Figure 4, compared with the fully supervised upper bound of 0.878 Macro-F1. The results show that our approach achieves a similar performance to the upper bound using a smaller sample size than baseline methods. In particular, in the early querying stage before 200 labeled samples, our approach and the hybrid baseline BADGE exhibit similar or better performance than the other methods. This suggests that introducing sample diversity plays a role when building up the initial decision boundary. As the labeling budget increases, the model enters the exploration stage while the advantage of the proposed unified strategy becomes more apparent. For budgets ranging from 200 to 800 samples, the proposed approach remains above BADGE over this budget range, indicating better learning efficiency. This suggests that hard samples and minority classes become more critical for enhancing model performance at this stage, and the observed advantage may be associated with the effect of class-aware sampling. For instance, our proposed strategy achieves a rapid performance gain to a Macro-F1 of 0.875 using just 600 labeled examples. Under the same budget, the random sampling baseline reaches a score of 0.803. This result suggests that the proposed method selects more useful samples and achieves faster performance improvement in the critical middle stage of the AL process. The remaining baselines, shown as light gray reference curves in Figure 4, exhibit weaker or less consistent improvement during this stage. This further indicates the advantage of the proposed strategy in selecting representative and informative samples under limited annotation budgets.
Figure 4.
Learning curves of active learning methods on the UrbanSound8K dataset. Macro-F1 is plotted against the number of labeled samples. For visual clarity, the proposed method, BADGE and Random are emphasized, while the other baselines are shown as light gray reference curves. The dashed line marks the fully supervised upper bound (0.878). The inset provides a zoomed view of the exploration stage (200–800 labeled samples).
The visual trend is further quantified in Table 3, including AULC, running variability, and the labeling budget required to reach 98% of the fully supervised upper bound. Our approach achieves the highest AULC value of 1673.52, which suggests that it can consistently choose informative samples and provide better performance during AL iterations. In addition to the above sampling efficiency, training robustness is also an important evaluation metric. The proposed approach shows a relatively small standard deviation value of ±8.76 over various runs. The stability is similar to BADGE baseline with a better overall AULC, which relatively mitigates performance fluctuation seen for other approaches like BALD. In particular, the Core-Set yields a lower AULC than the Random baseline, indicating diversity-based sampling alone tends to select uninformative data in complex acoustic environments. We also evaluate the savings in labeling costs. To achieve 98% of the fully supervised upper bound, the random sampling baseline requires 1300 annotated samples. Among the compared active learning baselines, BADGE requires only 800 samples to achieve it and the proposed method achieves the same with just 500 samples. Compared to random sampling, this method saves 61.5% of the labeling budget. These results show that the proposed strategy can help reduce the data labeling costs associated with environmental sound classification tasks, thereby providing a basis for further evaluation in the more challenging real-world social noise scenario.
Table 3.
Comparison in performance and labeling efficiency between different AL approaches. The AULC represents the Area Under the Learning Curve, indicating the overall performance throughout the entire AL process. The labeling budget shows the number of samples required to reach the target performance. Annotation saving is computed relative to the Random sampling baseline.
3.2. Efficiency Analysis on Real-World Social Noise Dataset
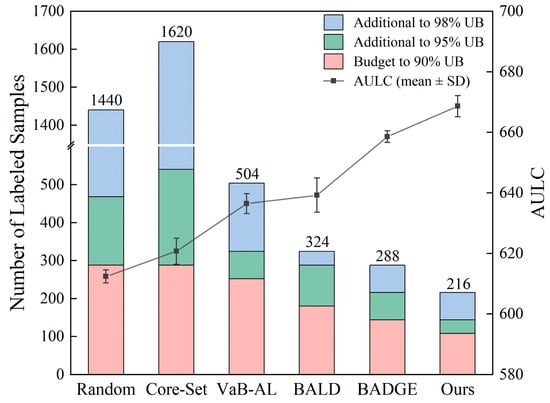
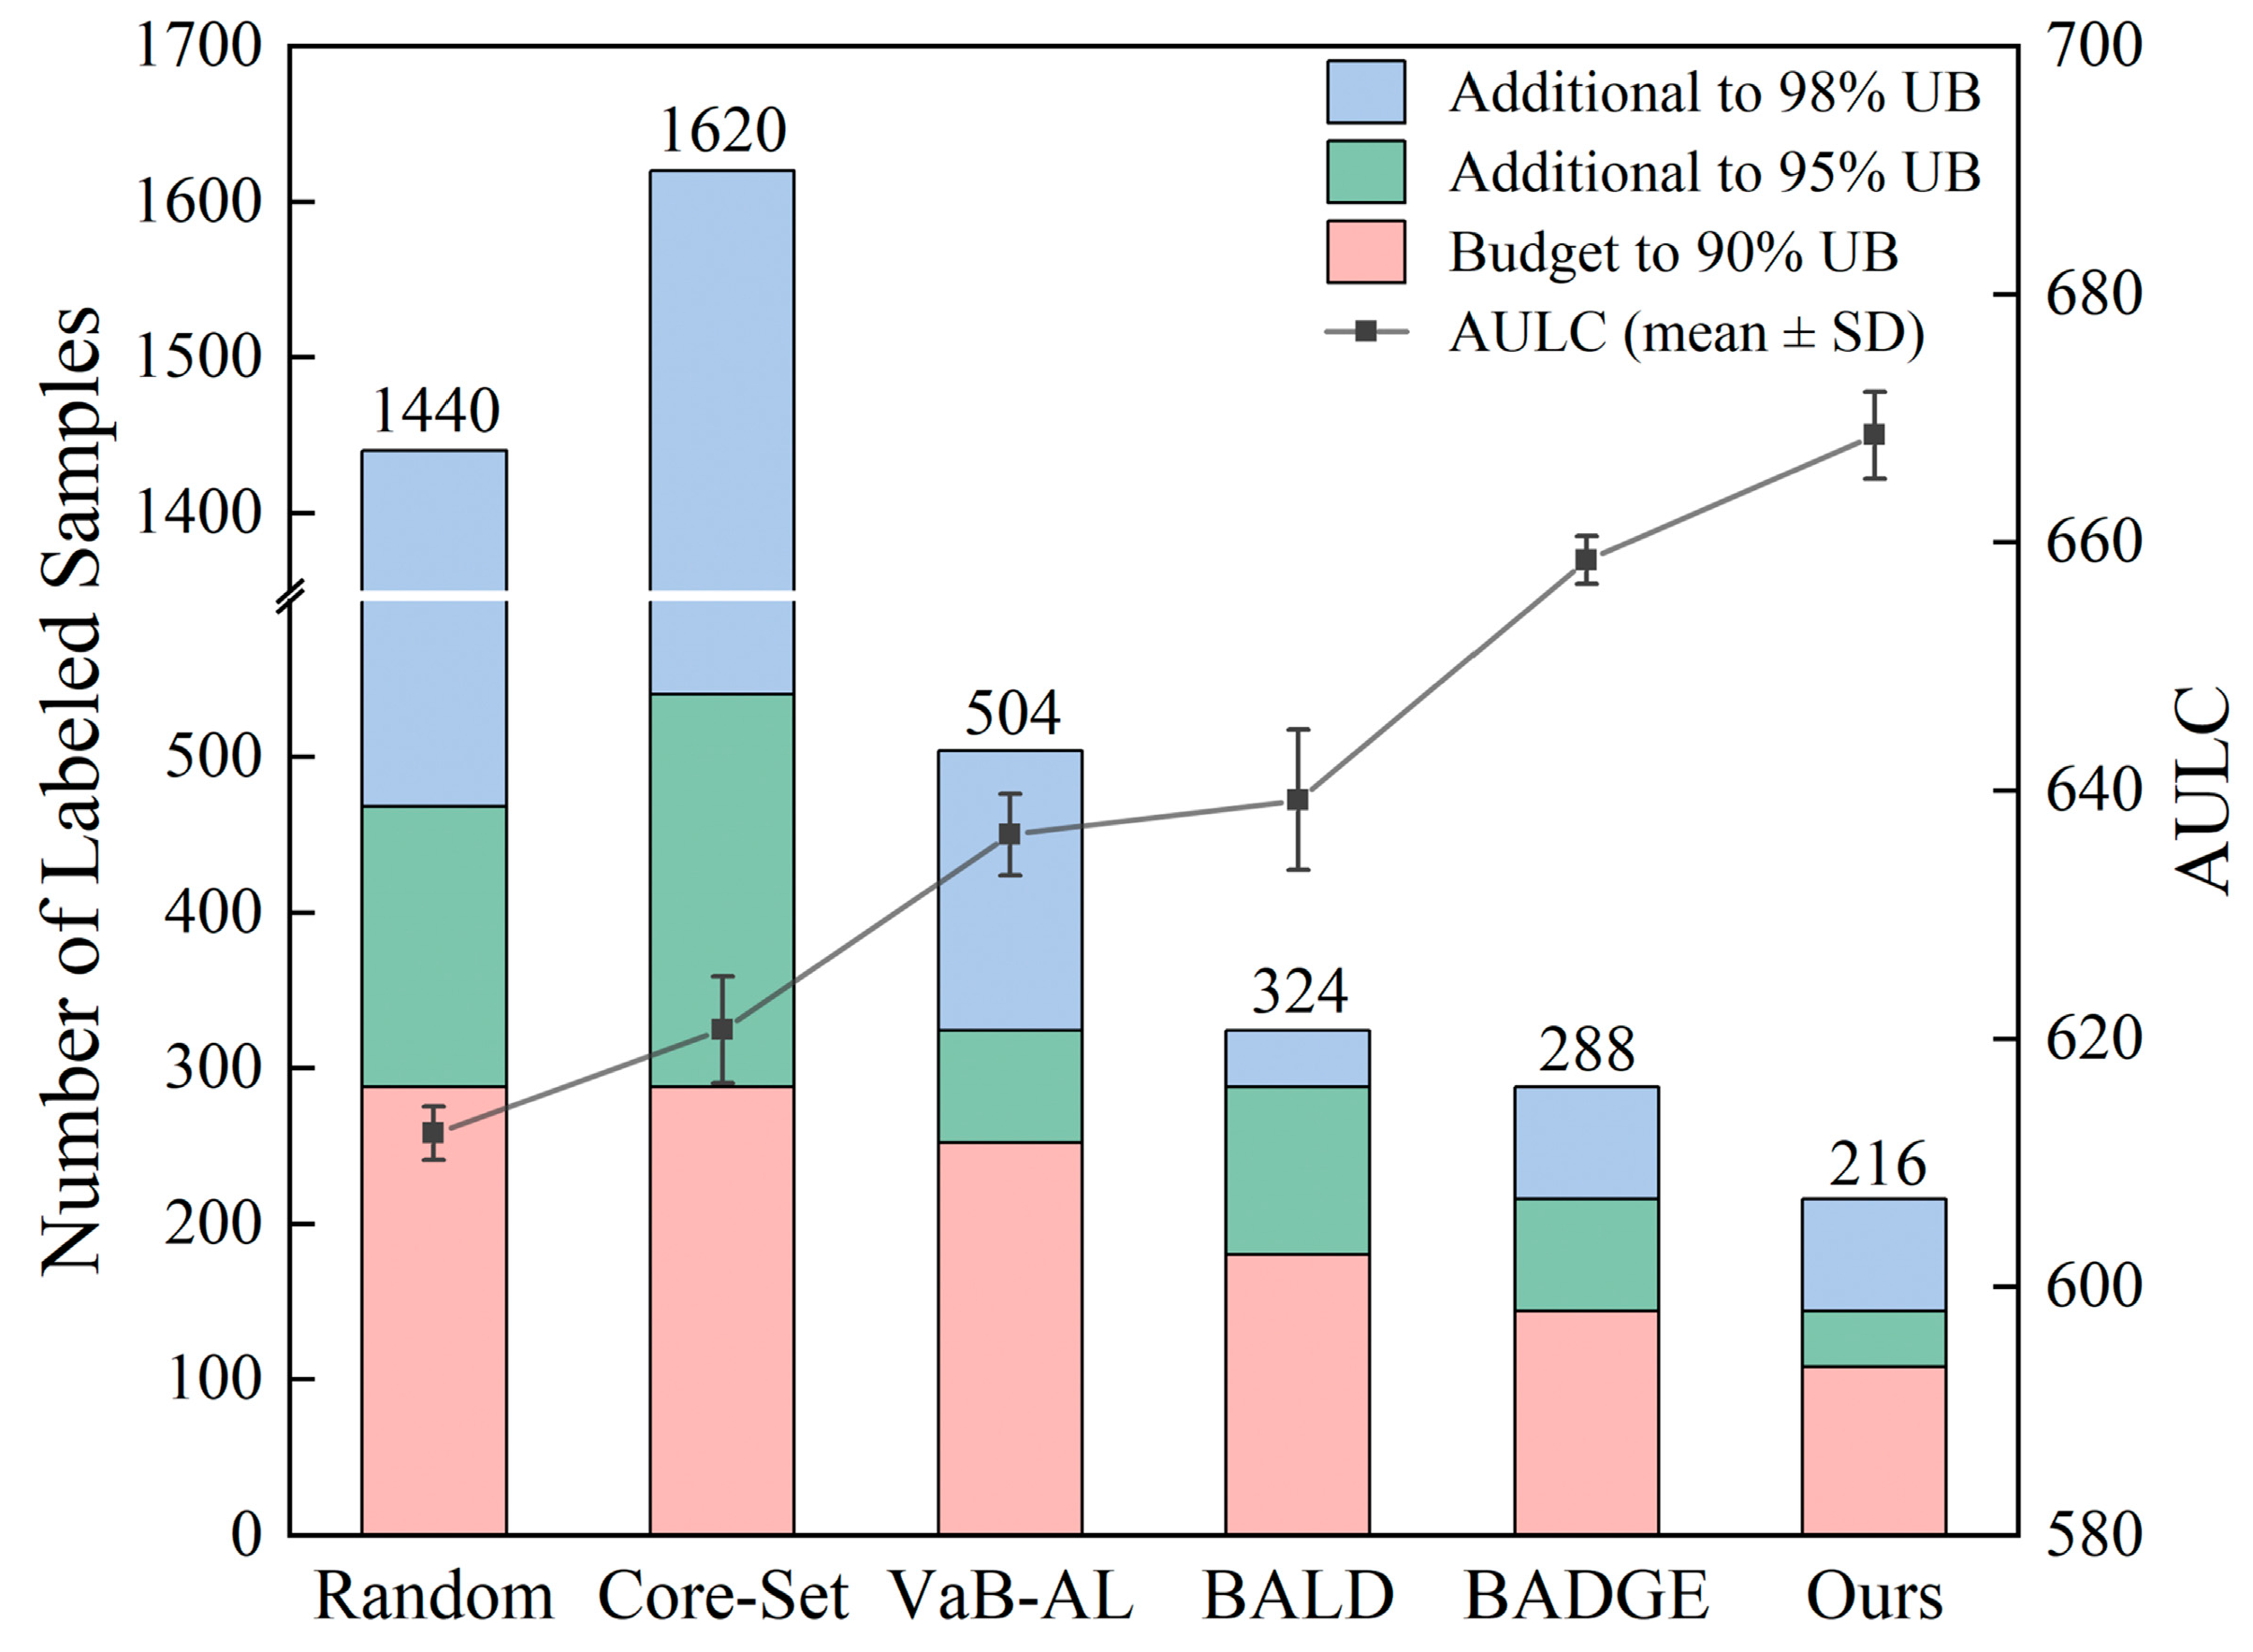
To further verify the proposed strategy in a realistic, highly imbalanced acoustic scenario, we extended experiments to the social noise development dataset. The full Macro-F1 learning curves are provided in Figure S1. We measured the amount of annotations needed to achieve 90%, 95%, and 98% of the fully supervised upper bound (UB). As shown in Figure 5, our approach requires fewer cumulative annotations than other methods for each target, giving it an advantage over competing approaches on average. For example, only 108 samples are required to reach 90% of the UB, demonstrating higher labeling efficiency on real-world exceedance-triggered social noise data. Additionally, we observe that the percentage saving in labels over random sampling increases with tighter accuracy targets. The proposed method reaches the 98% UB level with only 216 samples, representing an 85.0% reduction in the training annotation budget compared to the 1440 samples required by random sampling. Moreover, the cost saving is higher than that obtained in the UrbanSound8K experiments, indicating that our approach offers better cost-efficiency in real-world social noise scenarios. The highest overall AULC, together with the narrow error bars, further suggests that our method maintains relatively consistent performance in this monitoring task. Overall, the label-efficient advantage of the proposed method is more pronounced in the realistic social noise scenario than in the benchmark setting. Based on these results, we further analyze a representative low-annotation budget node to explain the class-wise source of the performance gain over BADGE.
Figure 5.
Annotation budget requirements and overall sampling efficiency on the social noise development dataset. The stacked bars show the cumulative number of labeled samples required for each method to reach 90%, 95%, and 98% of the fully supervised upper bound (UB). The dark gray line represents AULC per method (mean ± SD).
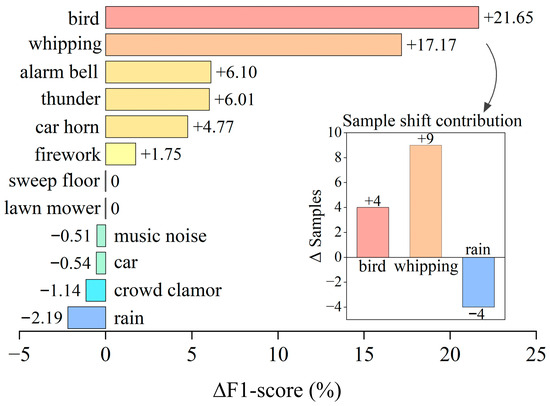
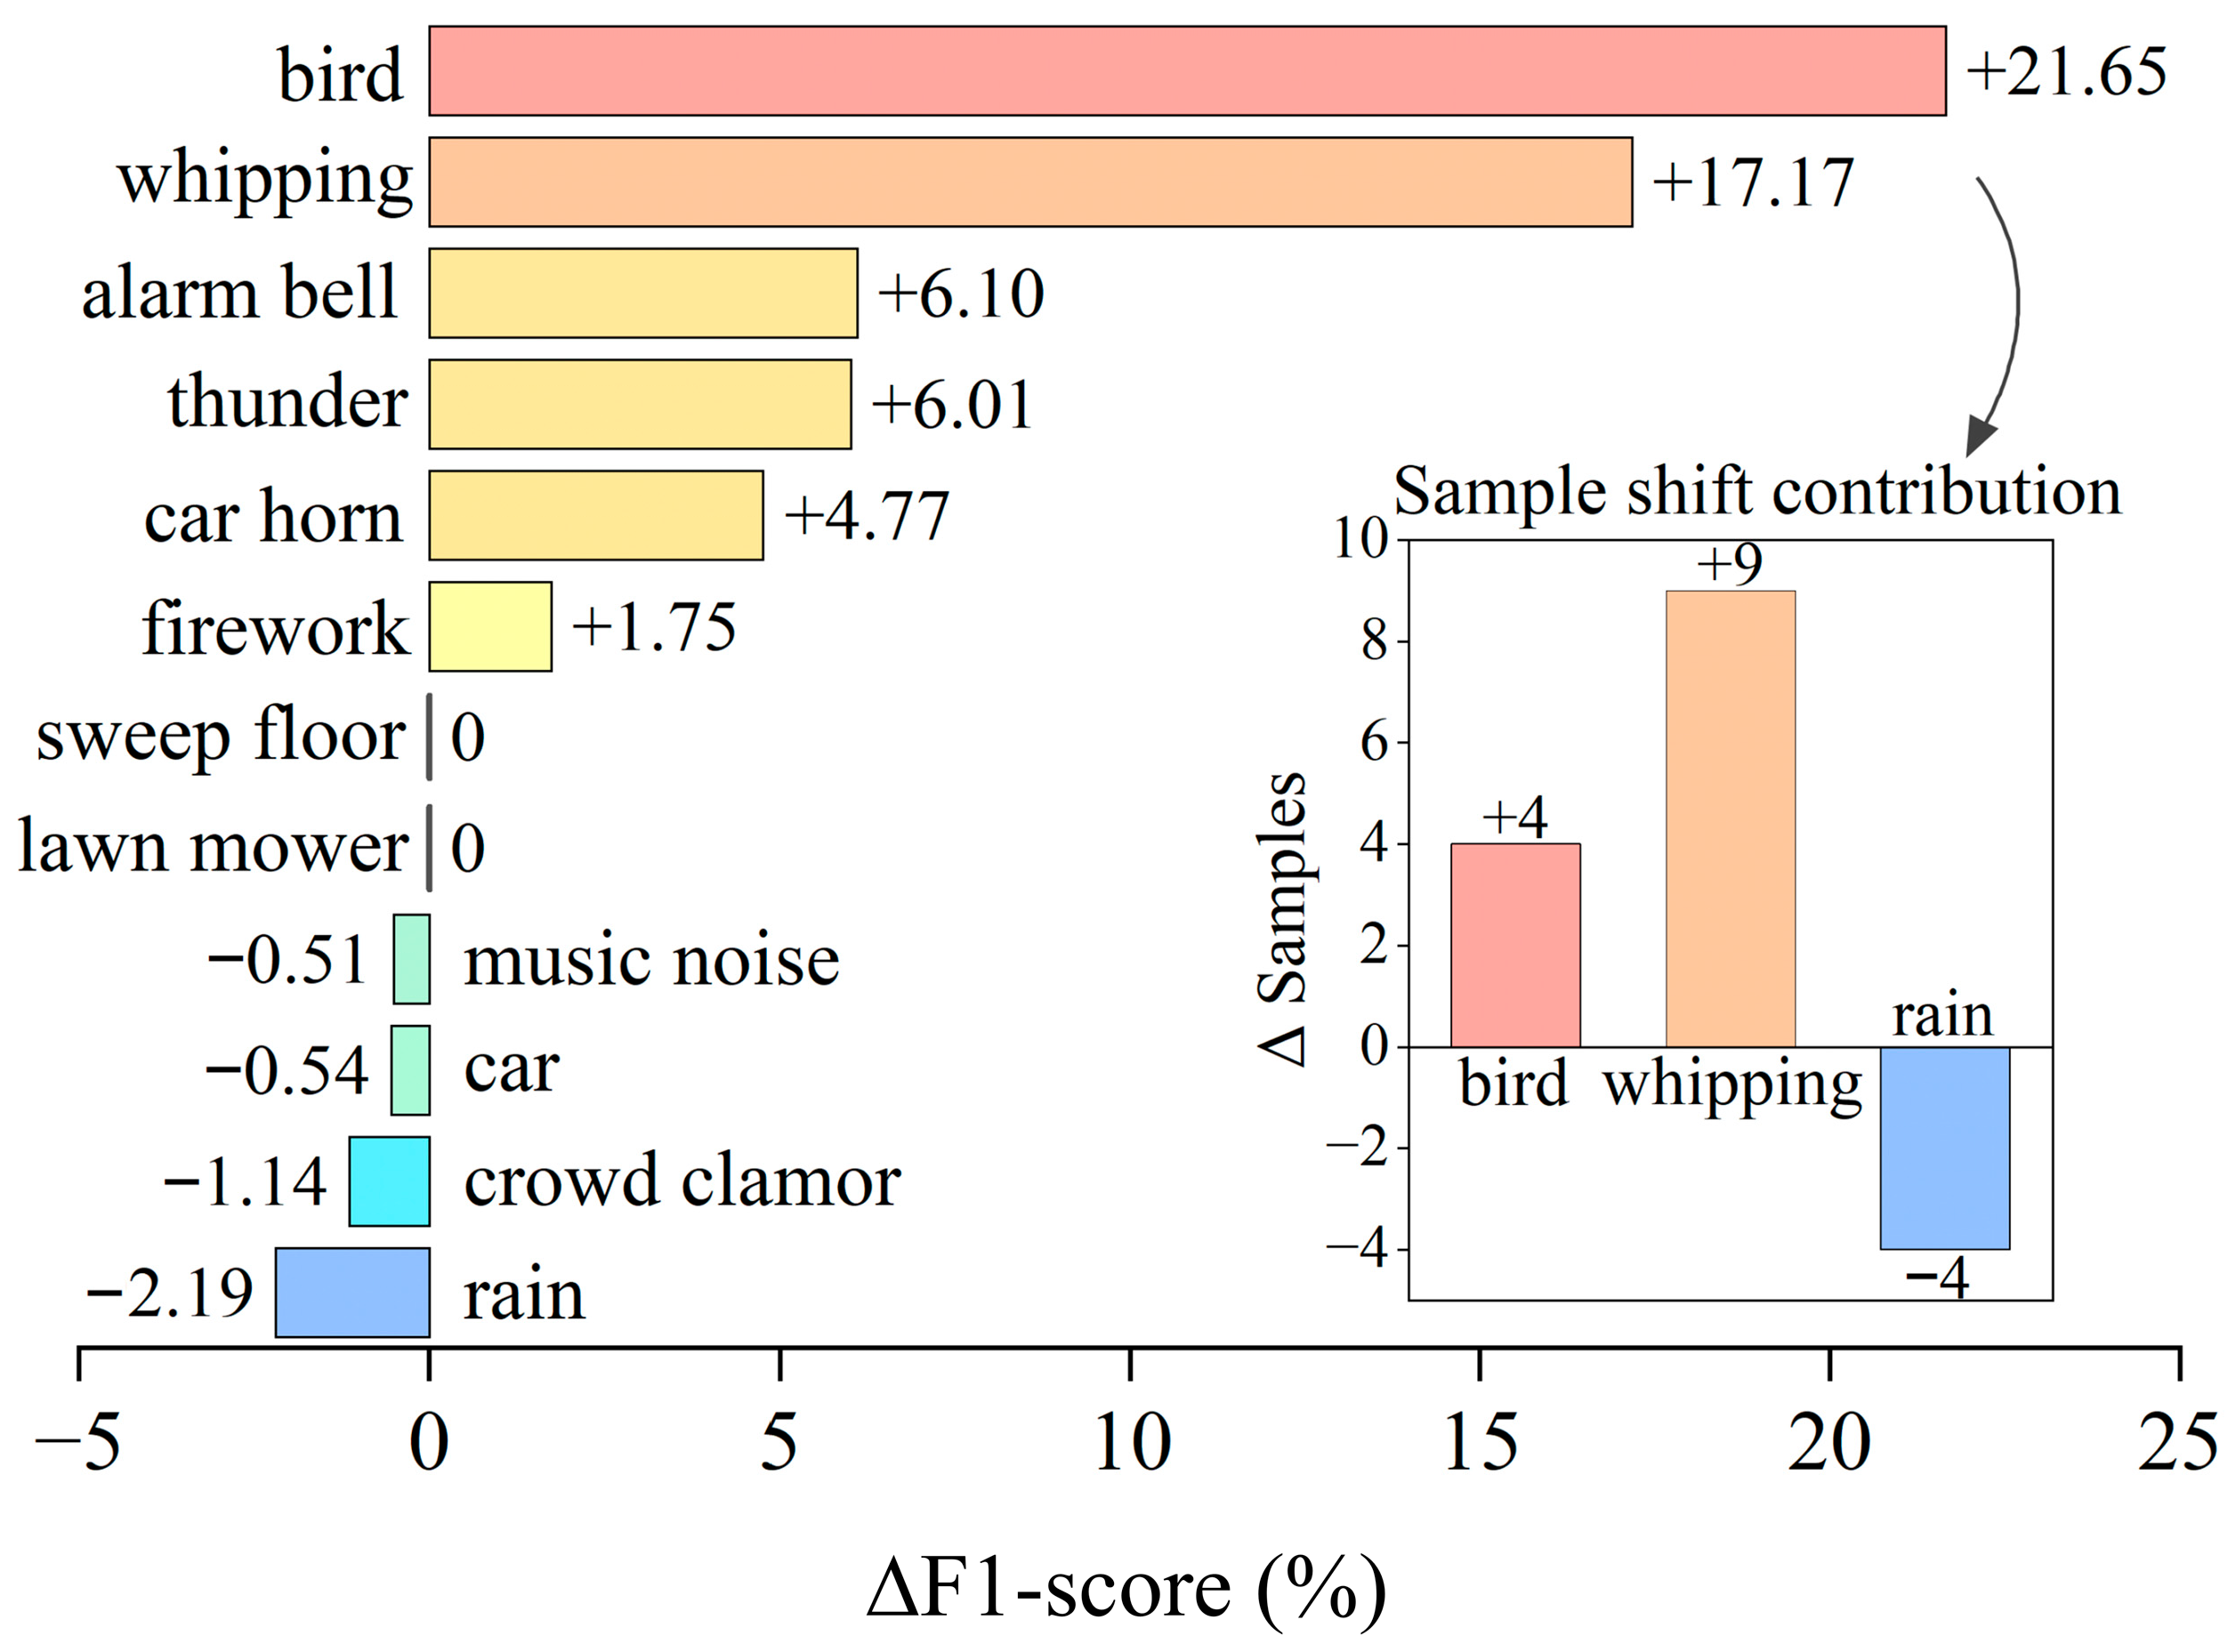
Figure 6 provides a detailed analysis of the F1-score differentials across noise categories relative to the most competitive baseline BADGE. This provides a class-wise view of the performance differences between our approach and BADGE. Specifically, we select the iteration with 144 samples for this analysis, as our method reaches a Macro-F1 of 0.930 which meets the practical requirements for noise exceedance event classification. At the same budget level, BADGE obtains a Macro-F1 of 0.874. Results show that the greatest performance improvement occurs in under-represented categories, such as bird and whipping. Improvements are also observed for noise sources with clear acoustic signatures, including alarm bell, thunder and car horn. Although these noise events possess distinct spectral characteristics, they are often interfered with by fluctuating urban background noise. These results indicate an enhanced ability to distinguish target acoustic signatures from complex urban background interference, improving the classification of these categories. Although slight variations were obtained in the dominant classes like music noise and car, including a 2.19% decrease in the rain category, performance remains at a reasonable level for practical monitoring purposes. The inset in Figure 6 shows that these performance differences are associated with sample shift across categories. Our method allocates fewer annotation resources to the common classes such as rain, while increasing the selection frequency and classification accuracy for classes including bird and whipping. This pattern is consistent with the higher overall Macro-F1 observed under the constrained annotation budget and may also help explain the improved recognition of several socially relevant exceedance-event categories. Detailed sampling counts for each category in this iteration can be found in Table S3. These non-social categories were retained as acoustically salient confounding classes because distinguishing them from target social noise events is necessary for reliable source tracing in real exceedance-triggered recordings.
Figure 6.
F1-score improvement in the proposed method across different sound categories compared to BADGE at the iteration with 144 queried samples. The horizontal bars represent the performance change (∆F1-score) for each class, where positive values indicate a performance gain achieved by our strategy. The inset shows representative sample shift across categories associated with these differences.
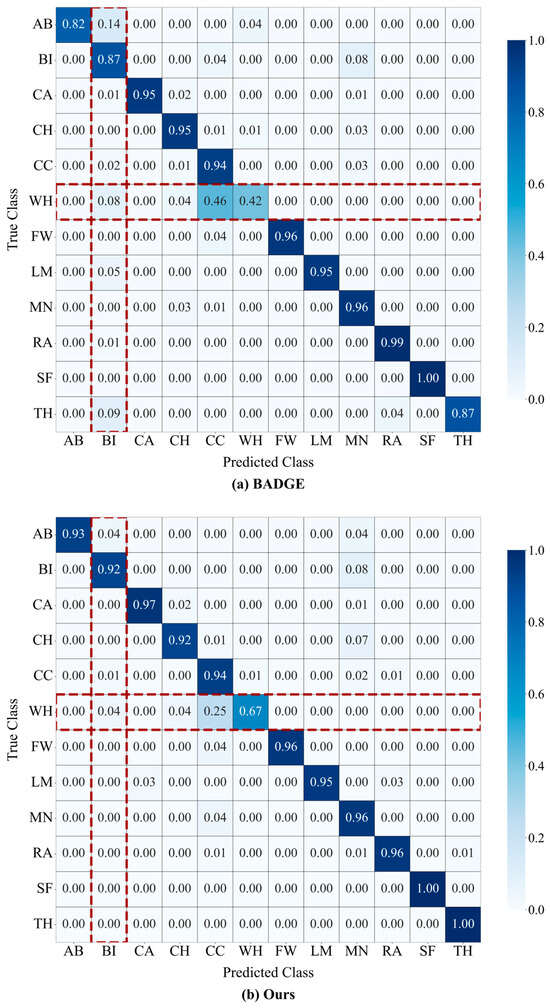
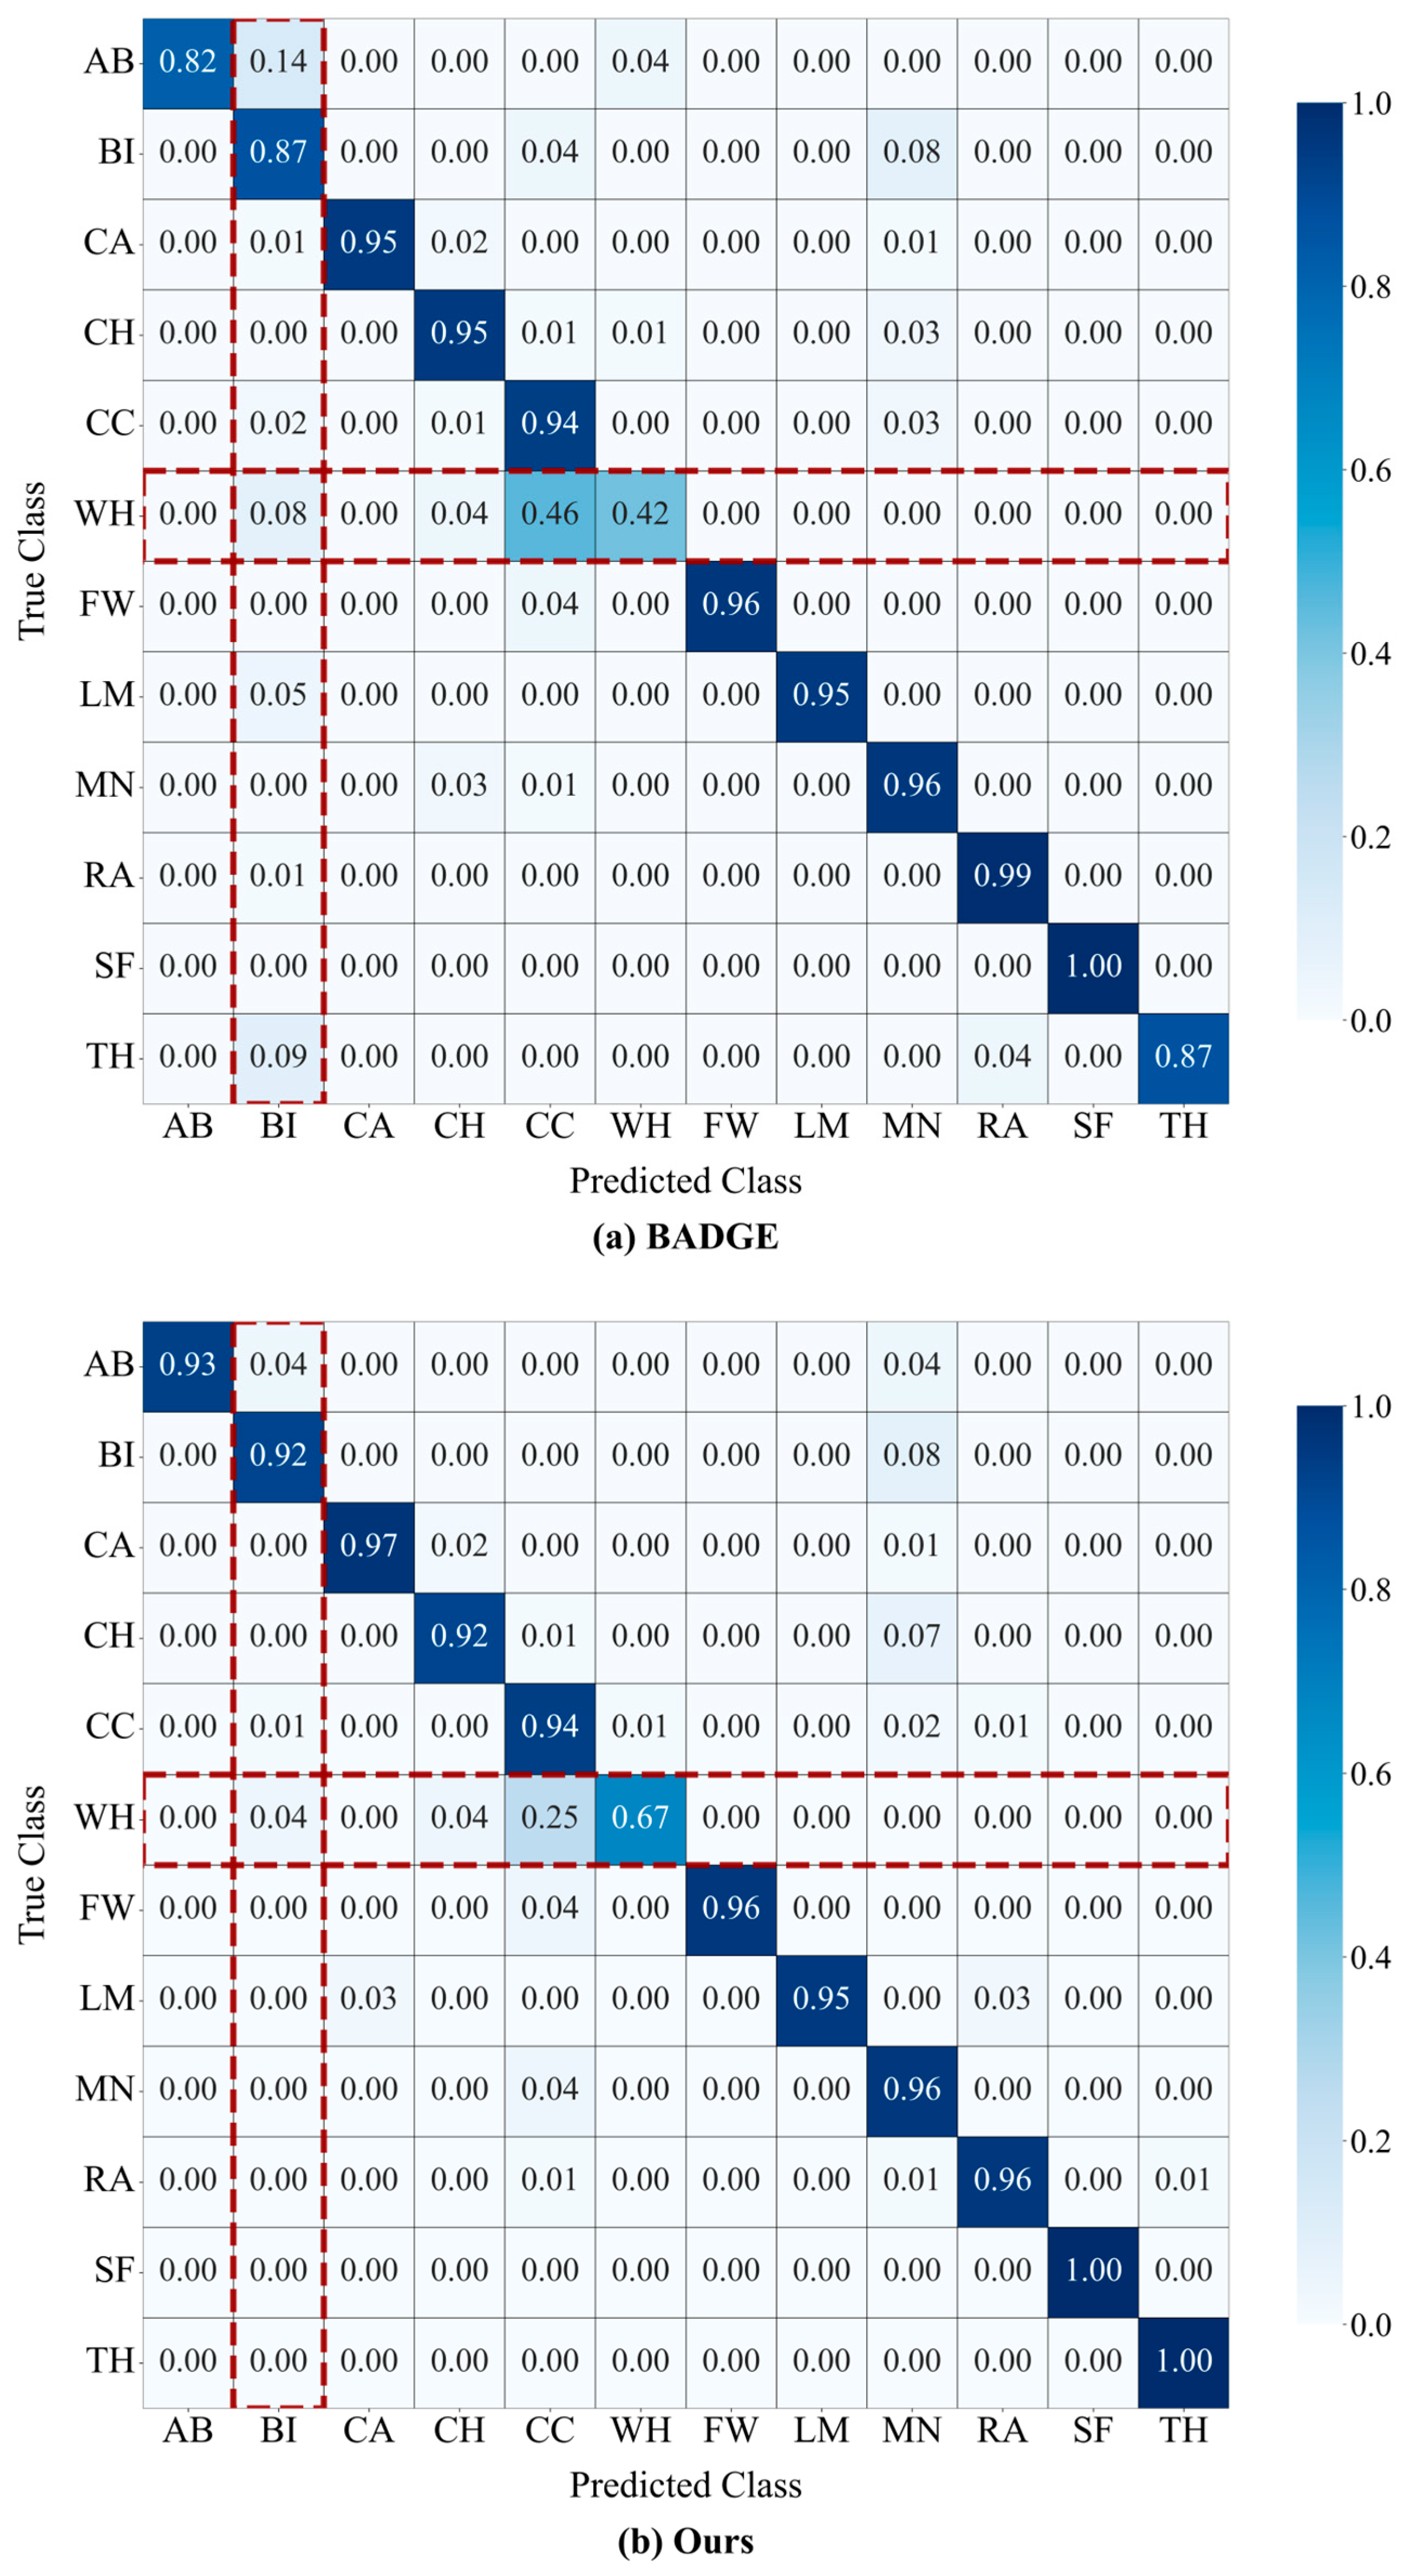
To better understand the origins of the substantial improvements in both the bird (BI) and whipping (WH) categories, we further analyzed the misclassification pathways that exist within the confusion matrices (Figure 7). This comparison reveals the specific misclassification pathways reduced by the proposed strategy. Analysis of the bird (BI) column for the BADGE baseline reveals substantial cross-category interference, where several noise types, such as alarm bell (AB), whipping (WH), and thunder (TH), are frequently misidentified as bird sounds. This shows a high degree of boundary ambiguity in BADGE when distinguishing complex environmental noises from the actual bird category. Our method reduces such confusions, which suggests that bird calls are more clearly distinguished under the proposed sampling strategy in the current experimental setting. In terms of the whipping (WH) class, BADGE suffers from a high degree of confusion within the broad social noise categories, misclassifying 46% of true whipping (WH) events as crowd clamor (CC). In real-world urban environments, both sources often happen in the same locations, such as community squares or parks. Furthermore, they produce abrupt, sharp noise profiles that make them confusable in a mixture. In contrast, our approach increases the true positive rate for whipping (WH) to 67% while reducing the confusion between it and crowd clamor (CC). These detailed improvements suggest that our approach may improve the selection of difficult or under-learned samples near challenging class boundaries, and are associated with reduced misclassification both between social noise and background sounds and among acoustically similar social noise categories.
Figure 7.
Confusion matrix comparison between (a) BADGE baseline and (b) our method. The matrices show classification performance for each noise category, where rows represent true classes and columns represent predicted classes. Class abbreviations are defined in Table 1. Values are row-normalized such that diagonal elements indicate recall per class. The red dashed boxes highlight the specific performance differences in recognizing tail classes, namely bird and whipping.
3.3. Ablation Study and Cross-Site Generalization Evaluation
To better understand the roles of the proposed sampling components, we further compared four configurations, including uncertainty only, uncertainty + diversity, uncertainty + class balance, and the full framework (Table 4). As shown in the table, both diversity-aware querying and dynamic class-aware weighting improve performance over uncertainty-only sampling, indicating that each component contributes useful sampling signals beyond uncertainty alone. In terms of overall AULC and Macro-F1, the uncertainty + diversity setting performs slightly better than the uncertainty + class balance setting, suggesting a somewhat stronger contribution to global label efficiency under the current budget. By contrast, the uncertainty + class balance setting yields larger gains for challenging under-represented categories such as bird and whipping, indicating that the class-aware component is beneficial for long-tail recognition. The full framework achieves the best overall results, supporting the view that diversity-aware coverage and dynamic class-aware weighting play complementary roles in the proposed design.
Table 4.
Ablation study on the proposed AL framework. The four configurations correspond to uncertainty only, uncertainty + diversity, uncertainty + class balance, and the full framework. The Overall AULC represents the global sampling efficiency. Performance is evaluated at a fixed annotation budget of 144 samples to match the category-specific analysis.
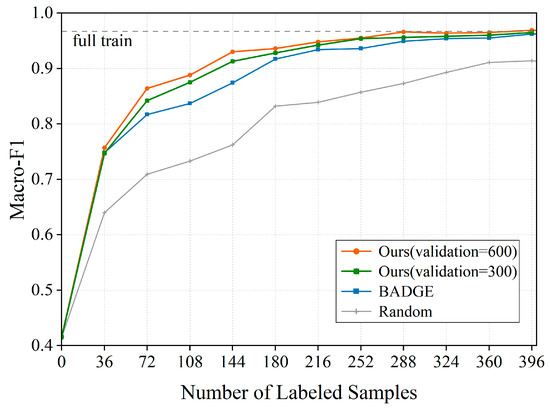
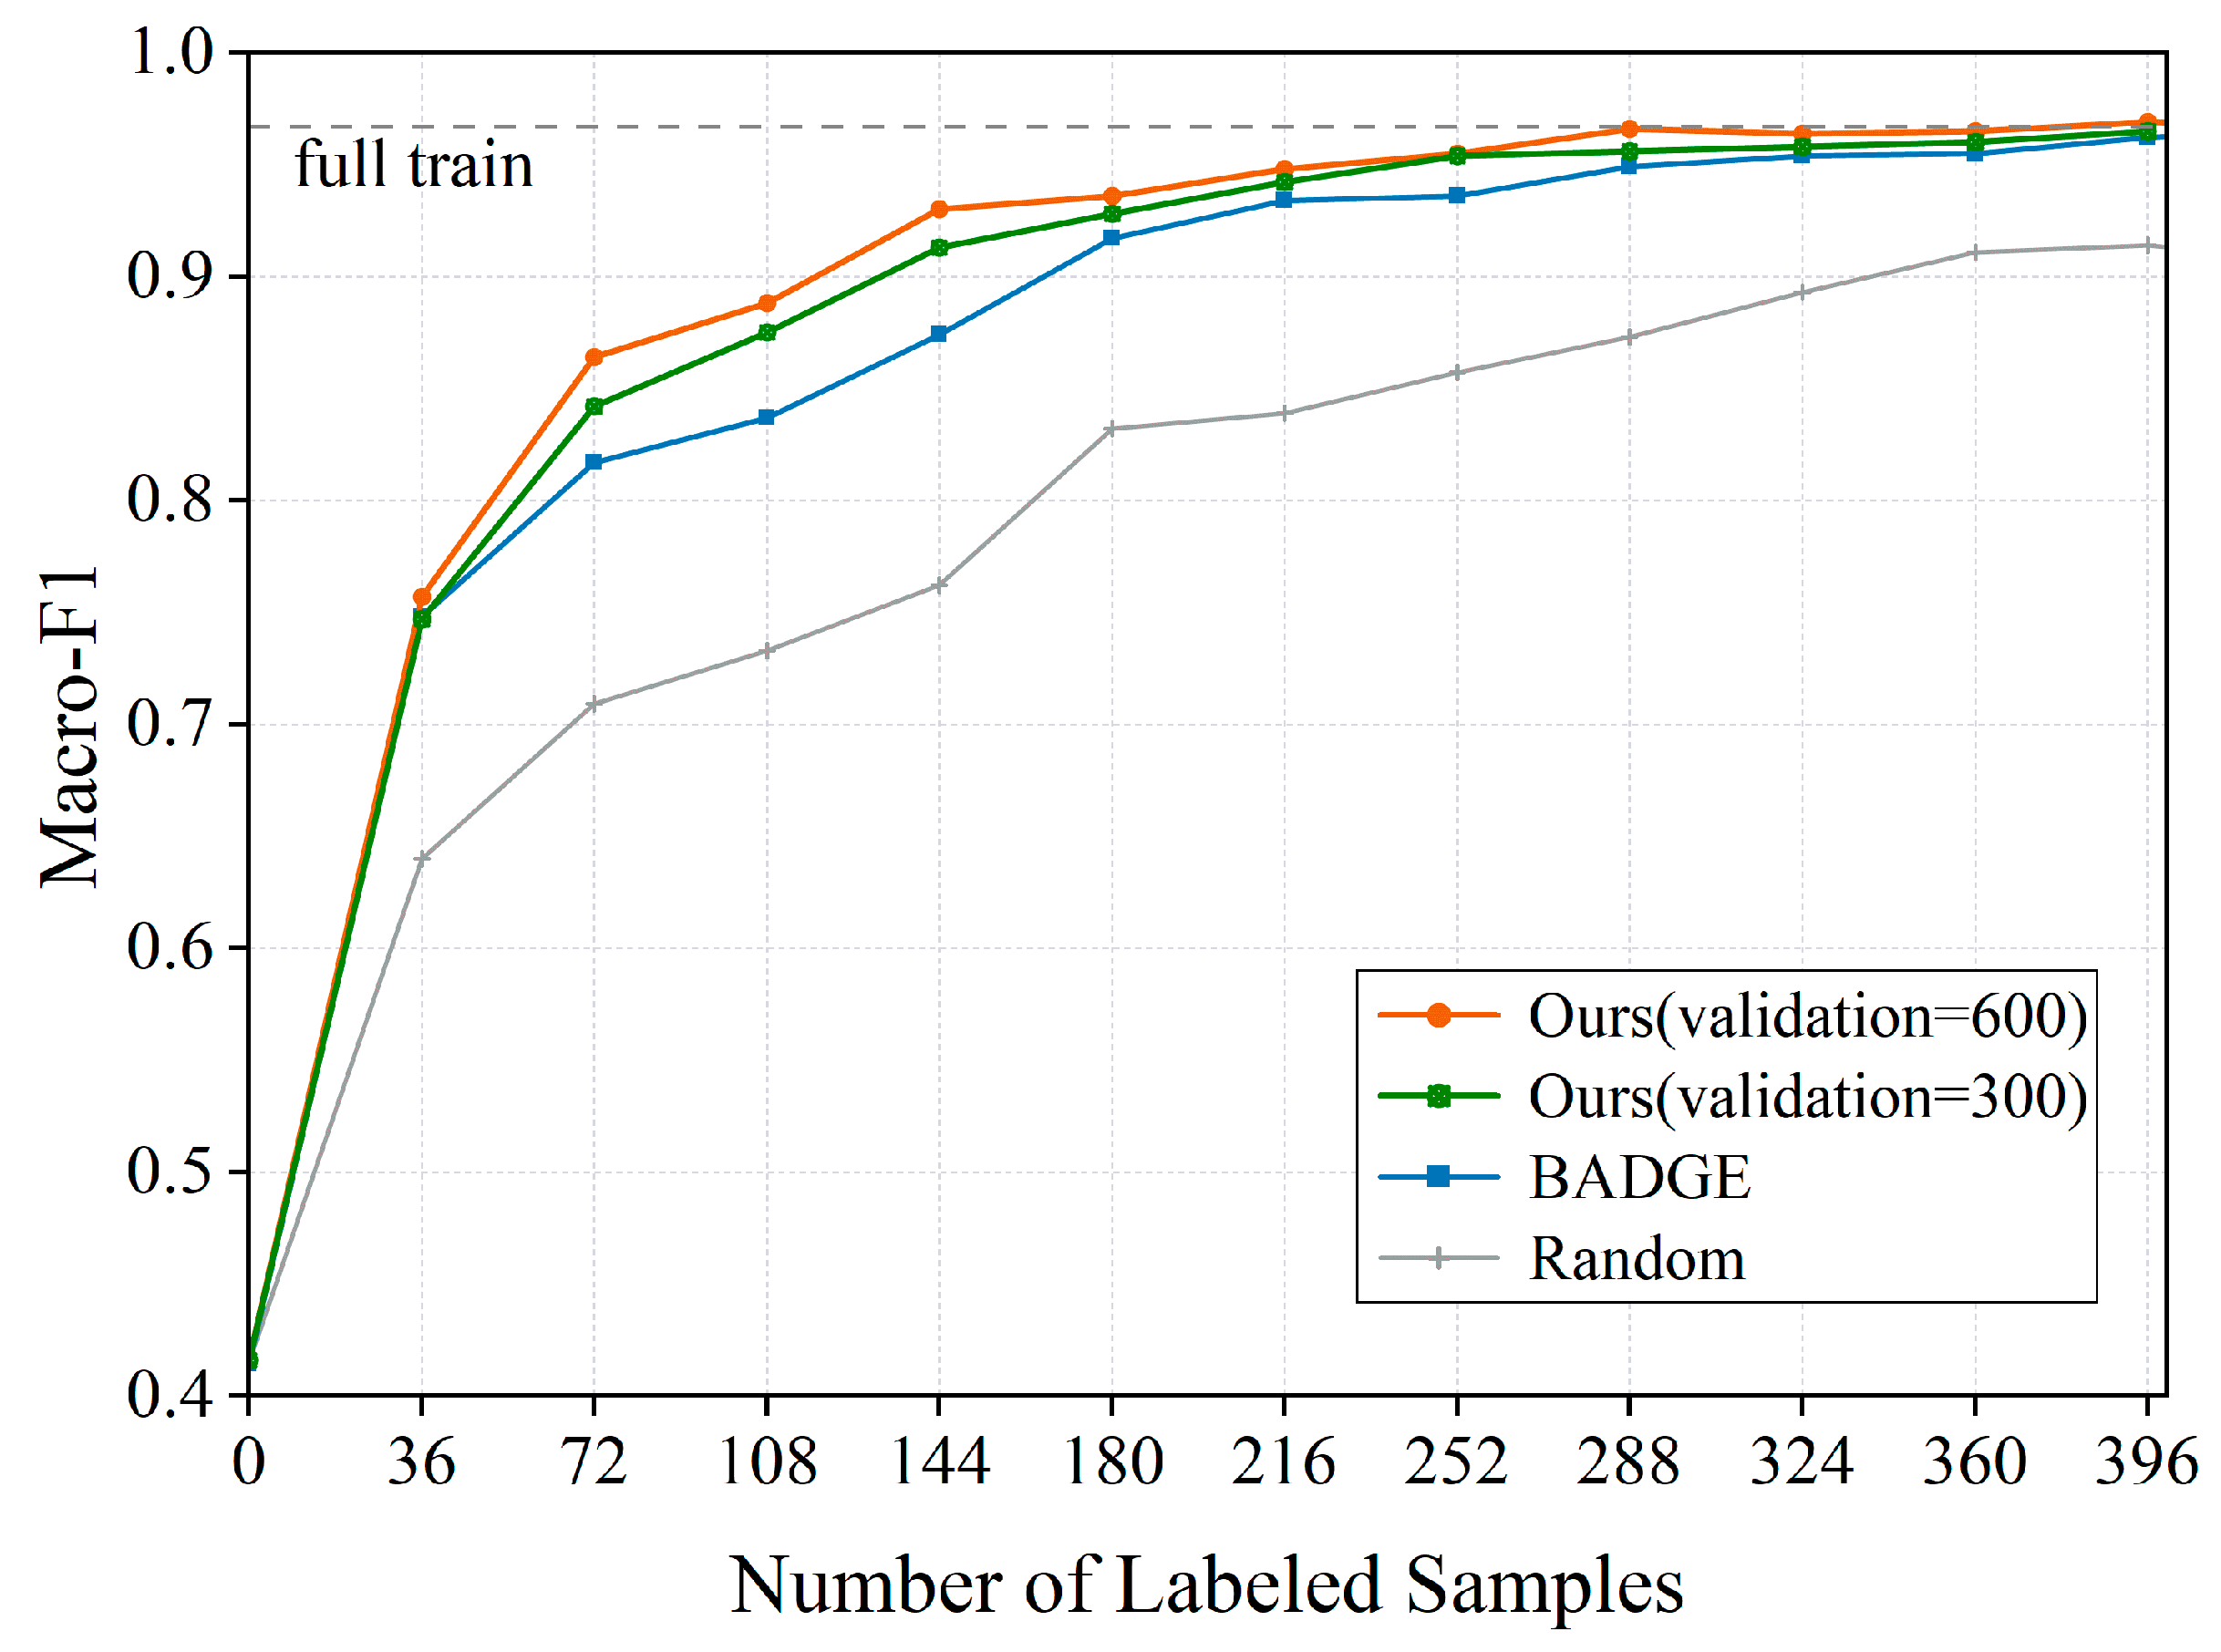
We further examined how the proposed framework behaved when less validation data was used to estimate the class-wise recognition term in Equation (5). To this end, all experimental settings were kept unchanged, and only the amount of validation data used for computing the class-wise validation accuracy was reduced from 600 to 300. As shown in Figure 8, the learning curve obtained with 300 validation samples remained close to that of the original setting, although the performance was slightly lower at some annotation budgets, with the difference being more visible in the middle stage of active learning. Despite this reduction, the proposed method with 300 validation samples still remained above BADGE over most of the learning process. These results suggest that the framework can retain its overall label-efficiency advantage under a moderate reduction in validation data, although a larger validation subset appears to provide somewhat better class-wise recognition estimates.
Figure 8.
Sensitivity analysis of the proposed method to validation data size on the social noise development dataset.
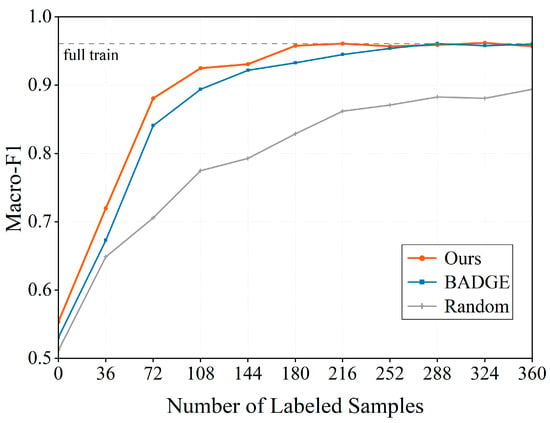
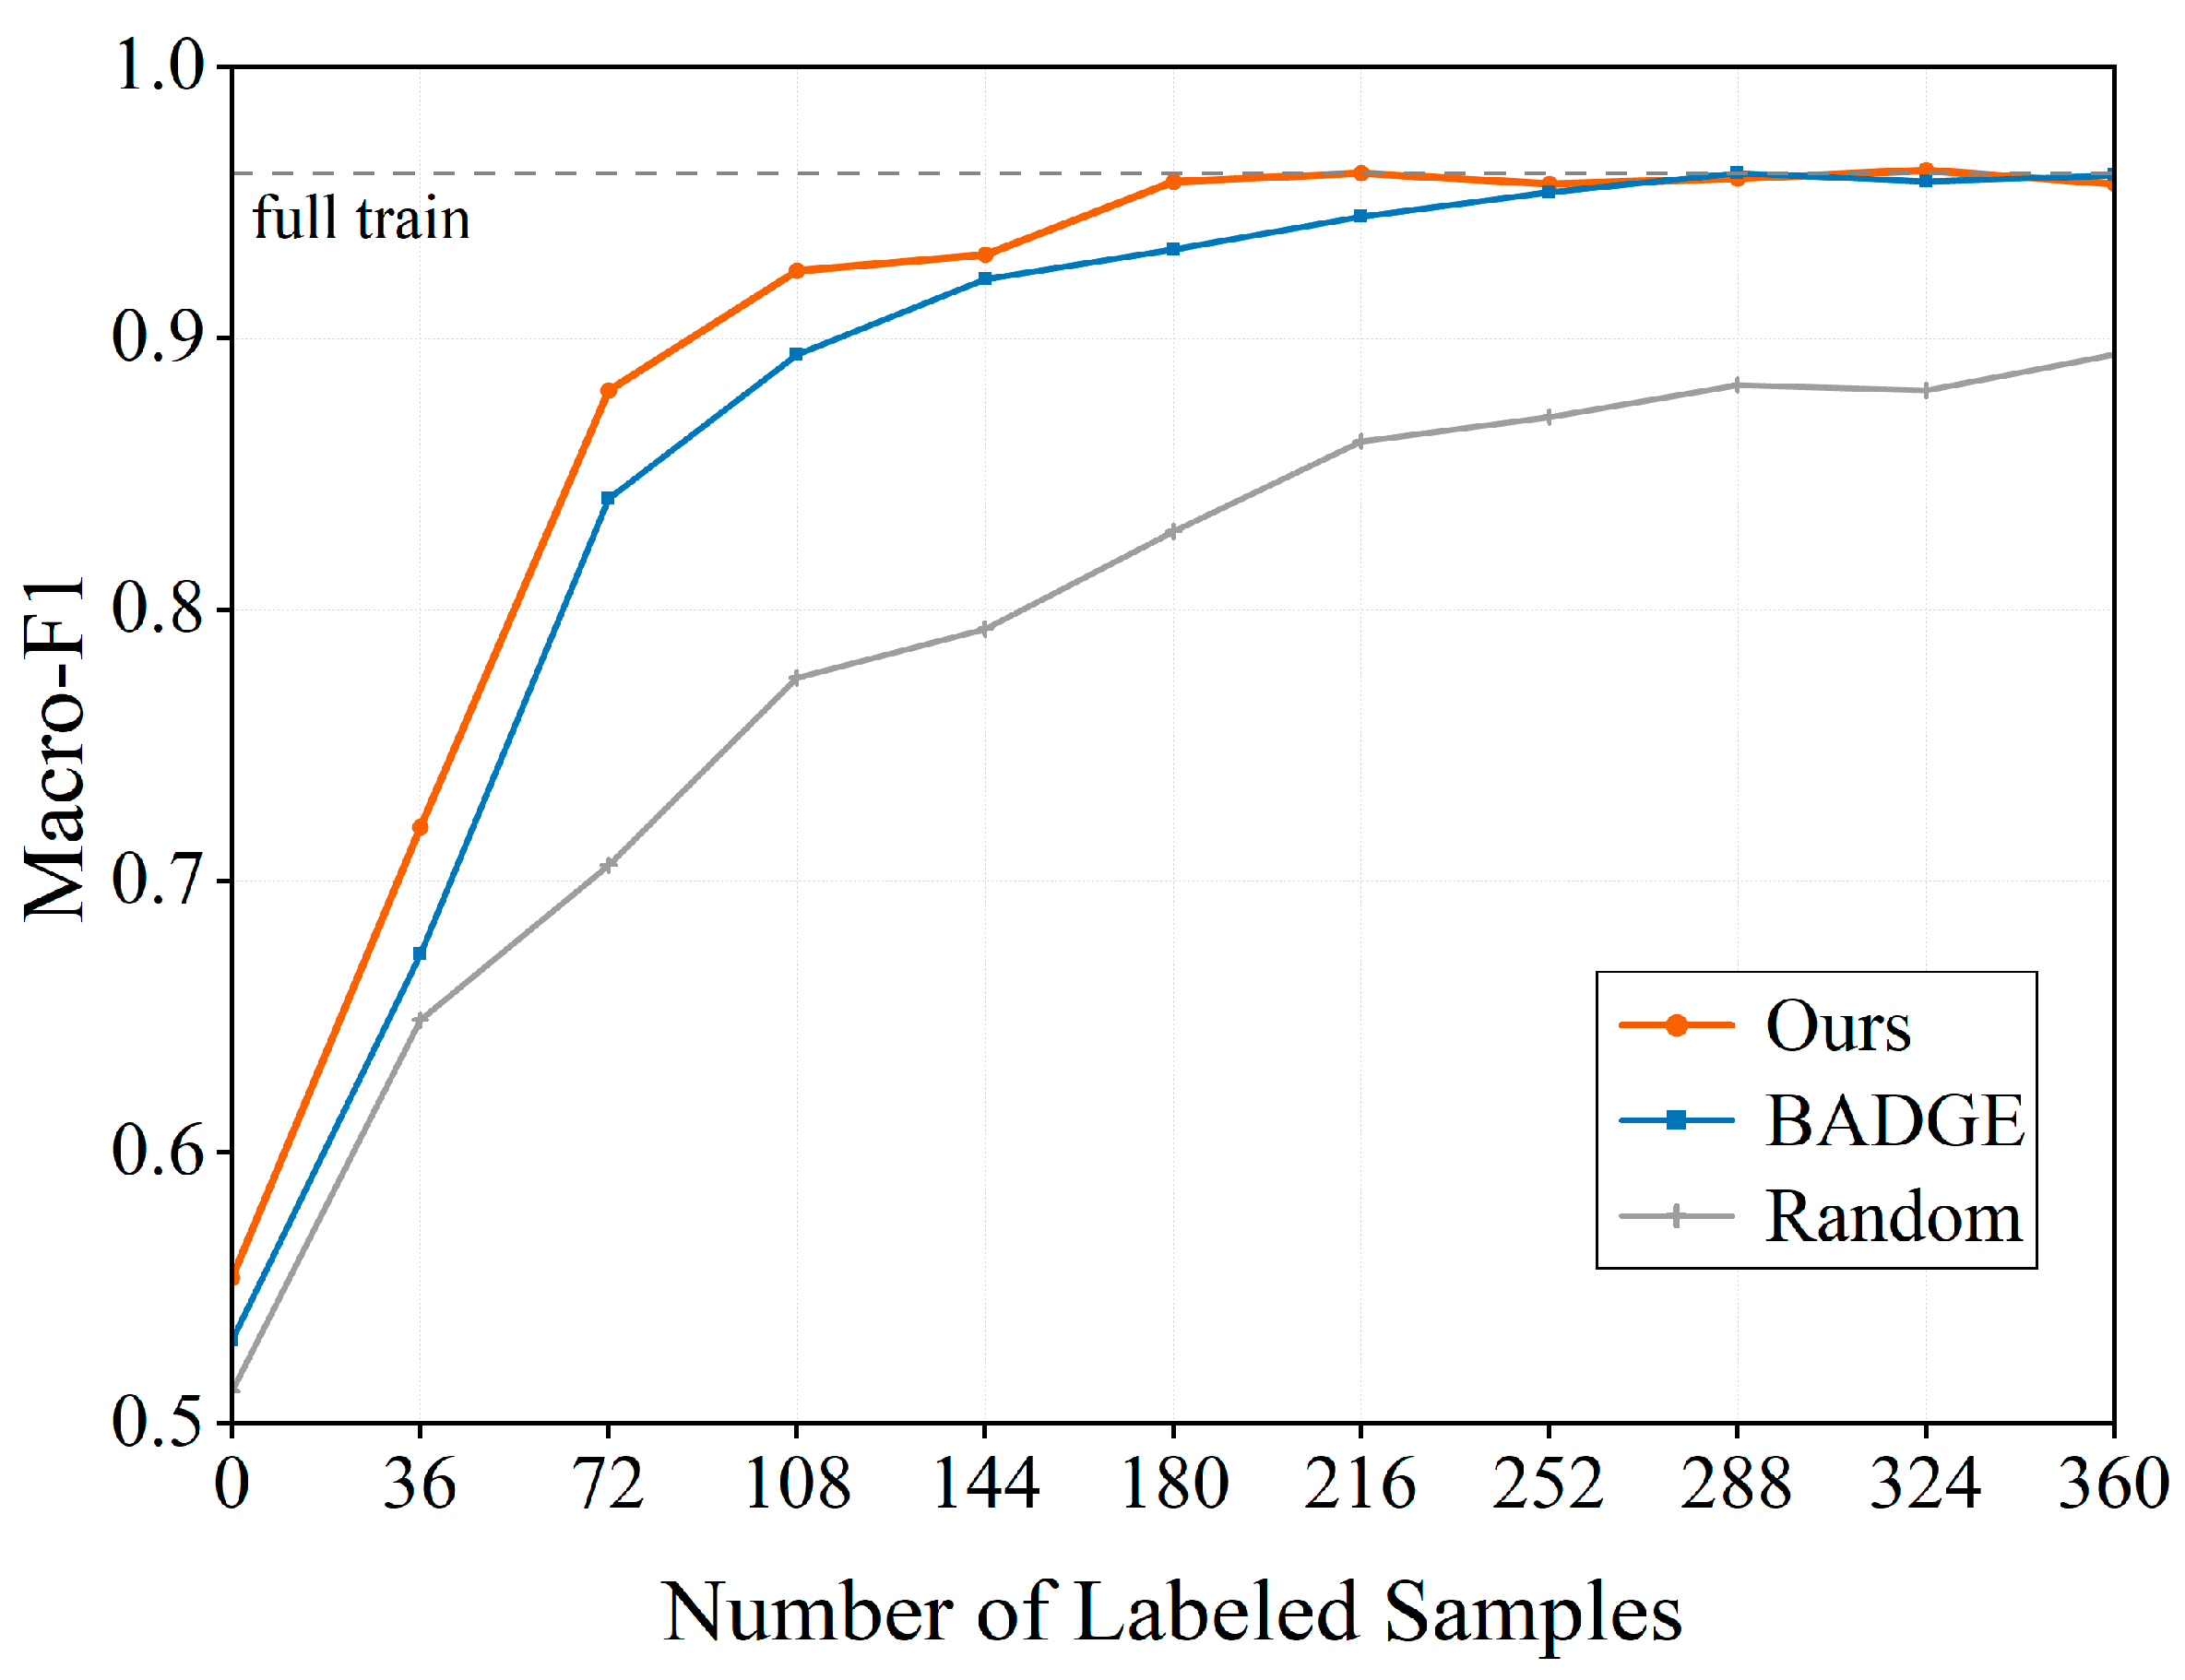
Next, we further tested the practical deployability and cross-site generalization of the framework on Station C dataset. For this purpose, models trained with 144 samples from the development dataset were first applied directly to Station C for zero-shot recognition. All tested approaches suffered from a drop in performance. Such a decline can be attributed to the large acoustical difference between various urban functional zones, which reveals the difficulty of directly transferring models to new sites and the necessity of localized adaptation in real-world IoT noise monitoring networks. To address this challenge, we performed localized training on the target data through active learning to quickly adapt the models to that new acoustic setting (Figure 9). Under the strong distributional drift, the random sampling baseline exhibited a slow convergence rate due to treating all samples equally. On the other hand, although BADGE improves adaptation efficiency to some extent, the proposed method achieves higher Macro-F1 more rapidly and consistently. Under this setting, the proposed framework converged to the fully supervised upper bound using only 13% of the target-domain training data at Station C, corresponding to 180 additionally labeled samples. This result indicates that the framework can adapt efficiently to new monitoring environments with limited local annotation effort, highlighting its practical value for scalable deployment in real-world social noise monitoring networks.
Figure 9.
Cross-site adaptation learning curves on the generalization dataset. The curves illustrate the improvement in Macro-F1 as a function of the target-domain annotation budget. The dashed line indicates the performance upper bound of the fully supervised model.
In summary, the above results show that the proposed framework is useful for addressing several practical challenges in real social noise monitoring. The benchmark experiment verifies the basic effectiveness of the unified sampling strategy under limited annotation budgets. The real-world development dataset further shows its value in reducing manual labeling cost, improving the recognition of under-represented categories, and alleviating confusion in acoustically mixed exceedance-triggered recordings. In addition, the cross-site adaptation results indicate that the framework can support faster localized model updating when deployed to new monitoring stations with different acoustic conditions. These findings demonstrate the practical relevance of the reported results for cost-effective source tracing in IoT-based urban noise monitoring networks.
4. Conclusions
In this work, we developed and validated a label-efficient framework to identify dominant sound events in massive exceedance-triggered audio recordings generated by IoT monitoring networks for social noise source tracing. By integrating robust uncertainty, redundancy-aware diversity, and dynamic class balance into a unified acoustic feature space, our approach helps address the practical challenges of acoustic mixing and long-tail distributions. Experiments on the UrbanSound8K benchmark and social noise datasets demonstrated that our strategy achieves higher sampling efficiency. On the real-world dataset, the framework reached 98% of the Macro-F1 upper bound, reducing the training annotation workload by 85.0% compared to random sampling. Furthermore, the ablation study suggested that diversity-aware querying and dynamic class-aware weighting make complementary contributions within the proposed framework. Under the current annotation budget, diversity yields slightly stronger gains in overall label efficiency, whereas dynamic class-aware weighting is particularly beneficial for improving the recognition of under-represented categories such as bird and whipping.
Beyond overall performance metrics, the reported results are useful for noise regulatory authorities seeking more targeted and cost-effective source tracing in urban monitoring practice. While deploying established models directly to new stations leads to performance degradation caused by spatial acoustic discrepancies, our active learning approach allows for the rapid restoration of recognition capabilities. With only 13% of the target-domain training data, the framework achieved localized adaptation and converged to the fully supervised upper bound in a new monitoring environment. At the same time, this study has several limitations. The real-world data were collected from a single city, only three monitoring stations, and a relatively short observation period, and potential seasonal effects were not explicitly evaluated. These factors may limit the current evidence for broader spatial and temporal generalization. Future work will therefore extend the framework to more cities, a larger number of monitoring sites, and longer-term datasets covering different seasons and acoustic environments. We will also further examine the robustness of the framework under broader cross-site deployment conditions and evaluate its long-term adaptation performance in real monitoring networks.
From a sustainable development perspective, this study has practical relevance for building more efficient and sustainable urban noise monitoring systems. By substantially reducing the annotation effort needed to develop reliable sound-event classification models, the proposed framework helps lower the resource demands associated with large-scale deployment and long-term maintenance of IoT-based monitoring networks. Its ability to support more accurate source tracing and rapid localized adaptation across monitoring sites also makes it valuable for more targeted noise management in complex urban environments. In this way, the contribution of the present work extends beyond methodological improvement, offering practical support for smarter environmental governance, healthier acoustic environments, and more livable communities.
Supplementary Materials
The following supporting information can be downloaded at: https://www.mdpi.com/article/10.3390/su18083936/s1, Table S1: Main IoT hardware used in the field monitoring system; Table S2: Quantity statistics of the screening process for real-world exceedance-triggered recordings; Table S3: Cumulative sampling distribution across noise categories for BADGE and the proposed method at the stage corresponding to 144 queried samples (180 labeled samples in total, including the initial labeled set); Figure S1: Learning curves of various active learning methods on the social noise development dataset.
Author Contributions
Conceptualization, Y.Z. (Yihao Zhan); methodology, Y.Z. (Yihao Zhan); software, Y.Z. (Yihao Zhan); validation, Y.Z. (Yihao Zhan) and Y.Z. (Yun Zhu); formal analysis, Y.Z. (Yun Zhu), J.-C.J., W.Y. and J.L.; investigation, Y.Z. (Yihao Zhan); resources, Y.Z. (Yihao Zhan) and W.Y.; data curation, Y.Z. (Yihao Zhan); writing—original draft preparation, Y.Z. (Yihao Zhan); writing—review and editing, Y.Z. (Yun Zhu), J.-C.J., W.Y., K.L., H.H., Z.L., S.L. and Q.C.; visualization, Y.Z. (Yihao Zhan); supervision, Y.Z. (Yun Zhu); project administration, Y.Z. (Yun Zhu) and S.L.; funding acquisition, Y.Z. (Yun Zhu). All authors have read and agreed to the published version of the manuscript.
Funding
This research was funded by the National Key Research and Development Program of China (2023YFC3708503) and the Fundamental Research Funds for the Central Universities.
Institutional Review Board Statement
Not applicable.
Informed Consent Statement
Not applicable.
Data Availability Statement
The data presented in this study are available on request from the corresponding author.
Acknowledgments
The authors sincerely thank Yun Zhu for his assistance in the preparation and management of this paper.
Conflicts of Interest
Author Wenwei Yang is employed by Cloud & Information (Guangdong) Eco-Environment Science and Technology Co., Ltd. The remaining authors declare that the research was conducted in the absence of any commercial or financial relationships that could be construed as a potential conflict of interest.
Abbreviations
The following abbreviations are used in this manuscript:
| IoT | Internet of Things |
| CNN | convolutional neural network |
| AL | active learning |
| Macro-F1 | macro-averaged F1-score |
| AULC | area under the learning curve |
| Fbank | log-Mel filterbank |
| PANNs | Pretrained Audio Neural Networks |
| LAeq,T | A-weighted equivalent sound level over time period T |
| MN | music noise |
| SF | sweep floor |
| WH | whipping |
| CC | crowd clamor |
| FW | firework |
| LM | lawn mower |
| BI | bird |
| RA | rain |
| TH | thunder |
| CA | car |
| CH | car horn |
| AB | alarm bell |
References
- Moudon, A.V. Real Noise from the Urban Environment. Am. J. Prev. Med. 2009, 37, 167–171. [Google Scholar] [CrossRef] [Scilit]
- Newbury, J.B.; Heron, J.; Kirkbride, J.B.; Fisher, H.L.; Bakolis, I.; Boyd, A.; Thomas, R.; Zammit, S. Air and Noise Pollution Exposure in Early Life and Mental Health from Adolescence to Young Adulthood. JAMA Netw. Open 2024, 7, e2412169. [Google Scholar] [CrossRef] [Scilit]
- Basner, M.; Babisch, W.; Davis, A.; Brink, M.; Clark, C.; Janssen, S.; Stansfeld, S. Auditory and Non-Auditory Effects of Noise on Health. Lancet 2014, 383, 1325–1332. [Google Scholar] [CrossRef] [Scilit]
- National People’s Congress. Law of the People’s Republic of China on the Prevention and Control of Pollution from Environmental Noise; National People’s Congress: Beijing, China, 2022.
- Paul, K.C.; Haan, M.; Mayeda, E.R.; Ritz, B.R. Ambient Air Pollution, Noise, and Late-Life Cognitive Decline and Dementia Risk. Annu. Rev. Public Health 2019, 40, 203–220. [Google Scholar] [CrossRef] [Scilit]
- Wang, C.; Li, Y.; Shen, Y.; Liu, Y.; Ru, P.; Wei, Z.; Xie, D. Addressing the Influencing Path of Social Noise Exposure Risk Perception on Noise Mitigation Behavior. J. Environ. Manag. 2024, 353, 120238. [Google Scholar] [CrossRef] [Scilit] [PubMed]
- Carrasco, V.; Arenas, J.P.; Huijse, P.; Espejo, D.; Vargas, V.; Viveros-Muñoz, R.; Poblete, V.; Vernier, M.; Suárez, E. Application of Deep Learning to Enforce Environmental Noise Regulation in an Urban Setting. Sustainability 2023, 15, 3528. [Google Scholar] [CrossRef] [Scilit]
- Masum, M.H.; Pal, S.K.; Akhie, A.A.; Ruva, I.J.; Akter, N.; Nath, S. Spatiotemporal Monitoring and Assessment of Noise Pollution in an Urban Setting. Environ. Chall. 2021, 5, 100218. [Google Scholar] [CrossRef] [Scilit]
- Maijala, P.; Zhao, S.; Heittola, T.; Virtanen, T. Environmental Noise Monitoring Using Source Classification in Sensors. Appl. Acoust. 2018, 129, 258–267. [Google Scholar] [CrossRef] [Scilit]
- Peng, B.; Wang, K.I.-K.; Abdulla, W.H. Environmental Noise Monitoring Using Distributed Hierarchical Wireless Acoustic Sensor Network. Internet Things 2024, 28, 101373. [Google Scholar] [CrossRef] [Scilit]
- Luo, L.; Qin, H.; Song, X.; Wang, M.; Qiu, H.; Zhou, Z. Wireless Sensor Networks for Noise Measurement and Acoustic Event Recognitions in Urban Environments. Sensors 2020, 20, 2093. [Google Scholar] [CrossRef] [Scilit] [PubMed]
- Liu, Y.; Ma, X.; Shu, L.; Yang, Q.; Zhang, Y.; Huo, Z.; Zhou, Z. Internet of Things for Noise Mapping in Smart Cities: State of the Art and Future Directions. IEEE Netw. 2020, 34, 112–118. [Google Scholar] [CrossRef] [Scilit]
- Luo, L.; Zhang, L.; Wang, M.; Liu, Z.; Liu, X.; He, R.; Jin, Y. A System for the Detection of Polyphonic Sound on a University Campus Based on CapsNet-RNN. IEEE Access 2021, 9, 147900–147913. [Google Scholar] [CrossRef] [Scilit]
- Purwins, H.; Li, B.; Virtanen, T.; Schluter, J.; Chang, S.-Y.; Sainath, T. Deep Learning for Audio Signal Processing. IEEE J. Sel. Top. Signal Process. 2019, 13, 206–219. [Google Scholar] [CrossRef] [Scilit]
- Koutini, K.; Eghbal-zadeh, H.; Widmer, G. Receptive Field Regularization Techniques for Audio Classification and Tagging with Deep Convolutional Neural Networks. IEEE/ACM Trans. Audio Speech Lang. Process. 2021, 29, 1987–2000. [Google Scholar] [CrossRef] [Scilit]
- Zaman, K.; Sah, M.; Direkoglu, C.; Unoki, M. A Survey of Audio Classification Using Deep Learning. IEEE Access 2023, 11, 106620–106649. [Google Scholar] [CrossRef] [Scilit]
- Yu, W.; Jang, J.-C.; Zhu, Y.; Peng, J.; Yang, W.; Li, K. Enhanced Estimation of Traffic Noise Levels Using Minute-Level Traffic Flow Data through Convolutional Neural Network. Sustainability 2024, 16, 6088. [Google Scholar] [CrossRef] [Scilit]
- Karimi, D.; Dou, H.; Warfield, S.K.; Gholipour, A. Deep Learning with Noisy Labels: Exploring Techniques and Remedies in Medical Image Analysis. Med. Image Anal. 2020, 65, 101759. [Google Scholar] [CrossRef] [Scilit]
- Russakovsky, O.; Deng, J.; Su, H.; Krause, J.; Satheesh, S.; Ma, S.; Huang, Z.; Karpathy, A.; Khosla, A.; Bernstein, M.; et al. ImageNet Large Scale Visual Recognition Challenge. Int. J. Comput. Vis. 2015, 115, 211–252. [Google Scholar] [CrossRef] [Scilit]
- Cakir, E.; Parascandolo, G.; Heittola, T.; Huttunen, H.; Virtanen, T. Convolutional Recurrent Neural Networks for Polyphonic Sound Event Detection. IEEE/ACM Trans. Audio Speech Lang. Process. 2017, 25, 1291–1303. [Google Scholar] [CrossRef] [Scilit]
- Song, H.; Kim, M.; Park, D.; Shin, Y.; Lee, J.-G. Learning from Noisy Labels with Deep Neural Networks: A Survey. IEEE Trans. Neural Netw. Learn. Syst. 2023, 34, 8135–8153. [Google Scholar] [CrossRef] [Scilit]
- Wang, H.; Jin, Q.; Li, S.; Liu, S.; Wang, M.; Song, Z. A Comprehensive Survey on Deep Active Learning in Medical Image Analysis. Med. Image Anal. 2024, 95, 103201. [Google Scholar] [CrossRef] [Scilit] [PubMed]
- Wang, M.; Hua, X.-S. Active Learning in Multimedia Annotation and Retrieval: A Survey. ACM Trans. Intell. Syst. Technol. 2011, 2, 1–21. [Google Scholar] [CrossRef] [Scilit]
- Wu, Y.-X.; Min, F.; Chen, G.-S.; Shen, S.-P.; Wen, Z.-C.; Zhou, X.-B. Self-Supervised Class-Balanced Active Learning with Uncertainty-Mastery Fusion. Knowl.-Based Syst. 2024, 300, 112192. [Google Scholar] [CrossRef] [Scilit]
- Mohaimenuzzaman, M.; Bergmeir, C.; Meyer, B. Deep Active Audio Feature Learning in Resource-Constrained Environments. IEEE/ACM Trans. Audio Speech Lang. Process. 2024, 32, 3224–3237. [Google Scholar] [CrossRef] [Scilit]
- Shen, Y.; Cao, G.; Dong, H.-Y.; Dong, B.; Lee, C.-M. UN15: An Urban Noise Dataset Coupled with Time–Frequency Attention for Environmental Sound Classification. Appl. Sci. 2025, 15, 8413. [Google Scholar] [CrossRef] [Scilit]
- Gong, Y.; Chung, Y.-A.; Glass, J. PSLA: Improving Audio Tagging with Pretraining, Sampling, Labeling, and Aggregation. IEEE/ACM Trans. Audio Speech Lang. Process. 2021, 29, 3292–3306. [Google Scholar] [CrossRef] [Scilit]
- GB 3096-2008; Environmental Quality Standard for Noise. Ministry of Environmental Protection of the People’s Republic of China: Beijing, China, 2008.
- Salamon, J.; Jacoby, C.; Bello, J.P. A Dataset and Taxonomy for Urban Sound Research. In Proceedings of the 22nd ACM International Conference on Multimedia, Orlando, FL, USA, 3–7 November 2014; ACM: New York, NY, USA, 2014; pp. 1041–1044. [Google Scholar]
- Li, D.; Wang, Z.; Chen, Y.; Jiang, R.; Ding, W.; Okumura, M. A Survey on Deep Active Learning: Recent Advances and New Frontiers. IEEE Trans. Neural Netw. Learn. Syst. 2025, 36, 5879–5899. [Google Scholar] [CrossRef] [Scilit]
- Feng, H.; Zhou, Y.; Zeng, W.; Guo, W. A Physics-Based PSO-BPNN Model for Civil Aircraft Noise Assessment. Appl. Acoust. 2024, 221, 109992. [Google Scholar] [CrossRef] [Scilit]
- Gal, Y.; Islam, R.; Ghahramani, Z. Deep Bayesian Active Learning with Image Data. In Proceedings of the 34th International Conference on Machine Learning—Volume 70, Sydney, NSW, Australia, 6–11 August 2017; JMLR.org: Cambridge, MA, USA; pp. 1183–1192.
- Nguyen, V.-L.; Shaker, M.H.; Hüllermeier, E. How to Measure Uncertainty in Uncertainty Sampling for Active Learning. Mach. Learn. 2022, 111, 89–122. [Google Scholar] [CrossRef] [Scilit]
- Xia, X.; Liu, T.; Han, B.; Gong, M.; Yu, J.; Niu, G.; Sugiyama, M. Sample Selection with Uncertainty of Losses for Learning with Noisy Labels. In Proceedings of the International Conference on Learning Representations, Online, 25–29 April 2022. [Google Scholar]
- Ren, P.; Xiao, Y.; Chang, X.; Huang, P.-Y.; Li, Z.; Gupta, B.B.; Chen, X.; Wang, X. A Survey of Deep Active Learning. ACM Comput. Surv. 2022, 54, 1–40. [Google Scholar] [CrossRef] [Scilit]
- Gonsior, J.; Falkenberg, C.; Magino, S.; Reusch, A.; Hartmann, C.; Thiele, M.; Lehner, W. Comparing and Improving Active Learning Uncertainty Measures for Transformer Models by Discarding Outliers. Inf. Syst. Front. 2024. [Google Scholar] [CrossRef] [Scilit]
- Sener, O.; Savarese, S. Active Learning for Convolutional Neural Networks: A Core-Set Approach. In Proceedings of the 6th International Conference on Learning Representations, ICLR 2018, Vancouver, BC, Canada, 30 April–3 May 2018. [Google Scholar]
- Wang, Z.; Fang, X.; Tang, X.; Wu, C. Multi-Class Active Learning by Integrating Uncertainty and Diversity. IEEE Access 2018, 6, 22794–22803. [Google Scholar] [CrossRef] [Scilit]
- Kim, Y.; Shin, B. In Defense of Core-Set: A Density-Aware Core-Set Selection for Active Learning. In Proceedings of the 28th ACM SIGKDD Conference on Knowledge Discovery and Data Mining, Washington, DC, USA, 14–18 August 2022; ACM: New York, NY, USA, 2022; pp. 804–812. [Google Scholar]
- Ash, J.T.; Zhang, C.; Krishnamurthy, A.; Langford, J.; Agarwal, A. Deep Batch Active Learning by Diverse, Uncertain Gradient Lower Bounds. In Proceedings of the International Conference on Learning Representations, Addis Ababa, Ethiopia, 30 April 2020. [Google Scholar]
- Choi, J.; Yi, K.M.; Kim, J.; Choo, J.; Kim, B.; Chang, J.; Gwon, Y.; Chang, H.J. VaB-AL: Incorporating Class Imbalance and Difficulty with Variational Bayes for Active Learning. In Proceedings of the 2021 IEEE/CVF Conference on Computer Vision and Pattern Recognition (CVPR), Nashville, TN, USA, 20–25 June 2021; IEEE: Piscataway, NJ, USA, 2021; pp. 6745–6754. [Google Scholar]
- Tsvigun, A.; Shelmanov, A.; Kuzmin, G.; Sanochkin, L.; Larionov, D.; Gusev, G.; Avetisian, M.; Zhukov, L. Towards Computationally Feasible Deep Active Learning. In Proceedings of the Findings of the Association for Computational Linguistics: NAACL 2022; Association for Computational Linguistics: Seattle, WA, USA, 2022; pp. 1198–1218. [Google Scholar]
- Hwang, Y.; Jo, W.; Hong, J.; Choi, Y. Overcoming Overconfidence for Active Learning. IEEE Access 2024, 12, 118707–118716. [Google Scholar] [CrossRef] [Scilit]
- Kong, Q.; Cao, Y.; Iqbal, T.; Wang, Y.; Wang, W.; Plumbley, M.D. PANNs: Large-Scale Pretrained Audio Neural Networks for Audio Pattern Recognition. IEEE/ACM Trans. Audio Speech Lang. Process. 2020, 28, 2880–2894. [Google Scholar] [CrossRef] [Scilit]
- Ashurov, A.; Yi, Z.; Liu, H.; Yu, Z.; Li, M. Concatenation-Based Pre-Trained Convolutional Neural Networks Using Attention Mechanism for Environmental Sound Classification. Appl. Acoust. 2024, 216, 109759. [Google Scholar] [CrossRef] [Scilit]

Disclaimer/Publisher’s Note: The statements, opinions and data contained in all publications are solely those of the individual author(s) and contributor(s) and not of MDPI and/or the editor(s). MDPI and/or the editor(s) disclaim responsibility for any injury to people or property resulting from any ideas, methods, instructions or products referred to in the content. |
© 2026 by the authors. Licensee MDPI, Basel, Switzerland. This article is an open access article distributed under the terms and conditions of the Creative Commons Attribution (CC BY) license.