


Abstract
Cross-border equipment manufacturers in Shandong are under growing pressure to maintain supply chain continuity and long-term sustainability amid geopolitical uncertainty and industrial restructuring. Using quarterly data for 149 listed firms from 2001Q1 to 2024Q3, this study develops an interpretable early-warning model for firms’ relative vulnerability. Because firm-level disruption events are not consistently observable, vulnerability is proxied by return-on-assets underperformance relative to the industry median. We compare a multilayer perceptron (MLP) with logistic regression, decision tree, random forest, XGBoost, and LightGBM, and then use Shapley additive explanations (SHAP) to interpret the selected model. Under the study’s F1-oriented early-warning objective, the multilayer perceptron achieves the highest observed F1 score (the harmonic mean of precision and recall) in our evaluation setting, whereas XGBoost performs slightly better on threshold-independent ranking metrics. The interpretation results show that stronger profitability is associated with lower predicted vulnerability, policy-backed export demand with greater stability, and India-related geopolitical risk with higher predicted vulnerability. These findings suggest that interpretable early-warning tools may help support continuity-oriented operations, resilience investment, and sustainability-oriented industrial upgrading in export-dependent manufacturing regions.
1. Introduction
Shandong Province, located on China’s eastern seaboard, is one of the country’s most important manufacturing bases [1]. Within Shandong’s industrial system, the equipment manufacturing sector plays a vital role in provincial economic development and also supports the national shift toward new growth drivers [2]. As a foundational industry that provides production technology and equipment to all sectors of the national economy, equipment manufacturing is simultaneously capital-, technology-, and labor-intensive, and its level of development is often used to gauge a nation’s degree of industrialization and modernization. Building on this industrial base and local supporting ecosystem, Shandong has leveraged the gateway and logistics advantages of its major coastal ports, especially Qingdao, to extend its equipment manufacturing industry outward and embed it more deeply in global supply chains [3,4].
However, amid the reconfiguration of global supply chains and the escalation of geopolitical uncertainty, cross-border equipment manufacturing enterprises in Shandong are facing rising pressure on supply chain continuity and resilience [5]. These pressures arise not only from firms’ internal operational and financial vulnerabilities but also from complex external influences, including policy change, logistics conditions, and the geopolitical environment [6]. Against this backdrop, developing an early-warning framework that combines high predictive accuracy with strong explanatory power has become increasingly important for resilience-oriented operations and sustainability-oriented industrial transformation [7,8].
Research on supply chain resilience has gradually moved from conceptual discussion and qualitative review toward performance-based assessment and firm- or sector-level evaluation [9,10,11]. Yet evidence remains limited for export-oriented equipment manufacturing in China, where industrial restructuring, global supply chain reconfiguration, and maritime-route exposure interact in specific ways [4,12]. Shandong provides a useful setting because its equipment manufacturers are deeply embedded in cross-border trade but remain sensitive to logistics shocks and policy change [3,12].
Methodologically, recent studies increasingly use machine learning and deep learning to capture nonlinear risk patterns in supply chain settings [7,13,14]. Recent work has also begun exploring neural-network and integrated machine-learning approaches for supply chain risk prediction in operational contexts [15,16,17]. However, two gaps remain. First, evidence on deep-learning-based risk prediction in export-dependent equipment manufacturing is still scarce [15,16,17]. Second, models with strong predictive performance are often difficult to explain in a way that managers can readily use [18,19,20]. This study addresses both issues by combining a multilayer perceptron with SHAP in a province-level early-warning setting.
Accordingly, this study uses quarterly data for 149 listed cross-border equipment manufacturers in Shandong from 2001Q1 to 2024Q3 to build an interpretable early-warning model. The model predicts whether a firm is likely to enter a relatively vulnerable state in the next quarter, where vulnerability is proxied by return-on-assets underperformance relative to the industry median. The purpose is not to identify literal disruption events, but to provide a reproducible quarter-level warning signal when direct event data are unavailable. On this basis, the study addresses the following research questions:
RQ1: In the specific context of cross-border equipment manufacturing enterprises in Shandong Province, how does a multilayer perceptron perform relative to traditional and other machine-learning models in the early warning of proxy-based disruption-related vulnerability?
RQ2: Which internal firm-level and external environmental factors are most strongly associated with proxy-based disruption-related vulnerability, and what are their relative contributions within the fitted model?
RQ3: How can the interpretability results be translated into actionable managerial and policy recommendations for sustainability-oriented resilience governance?
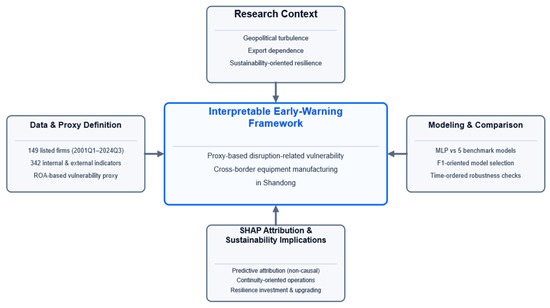
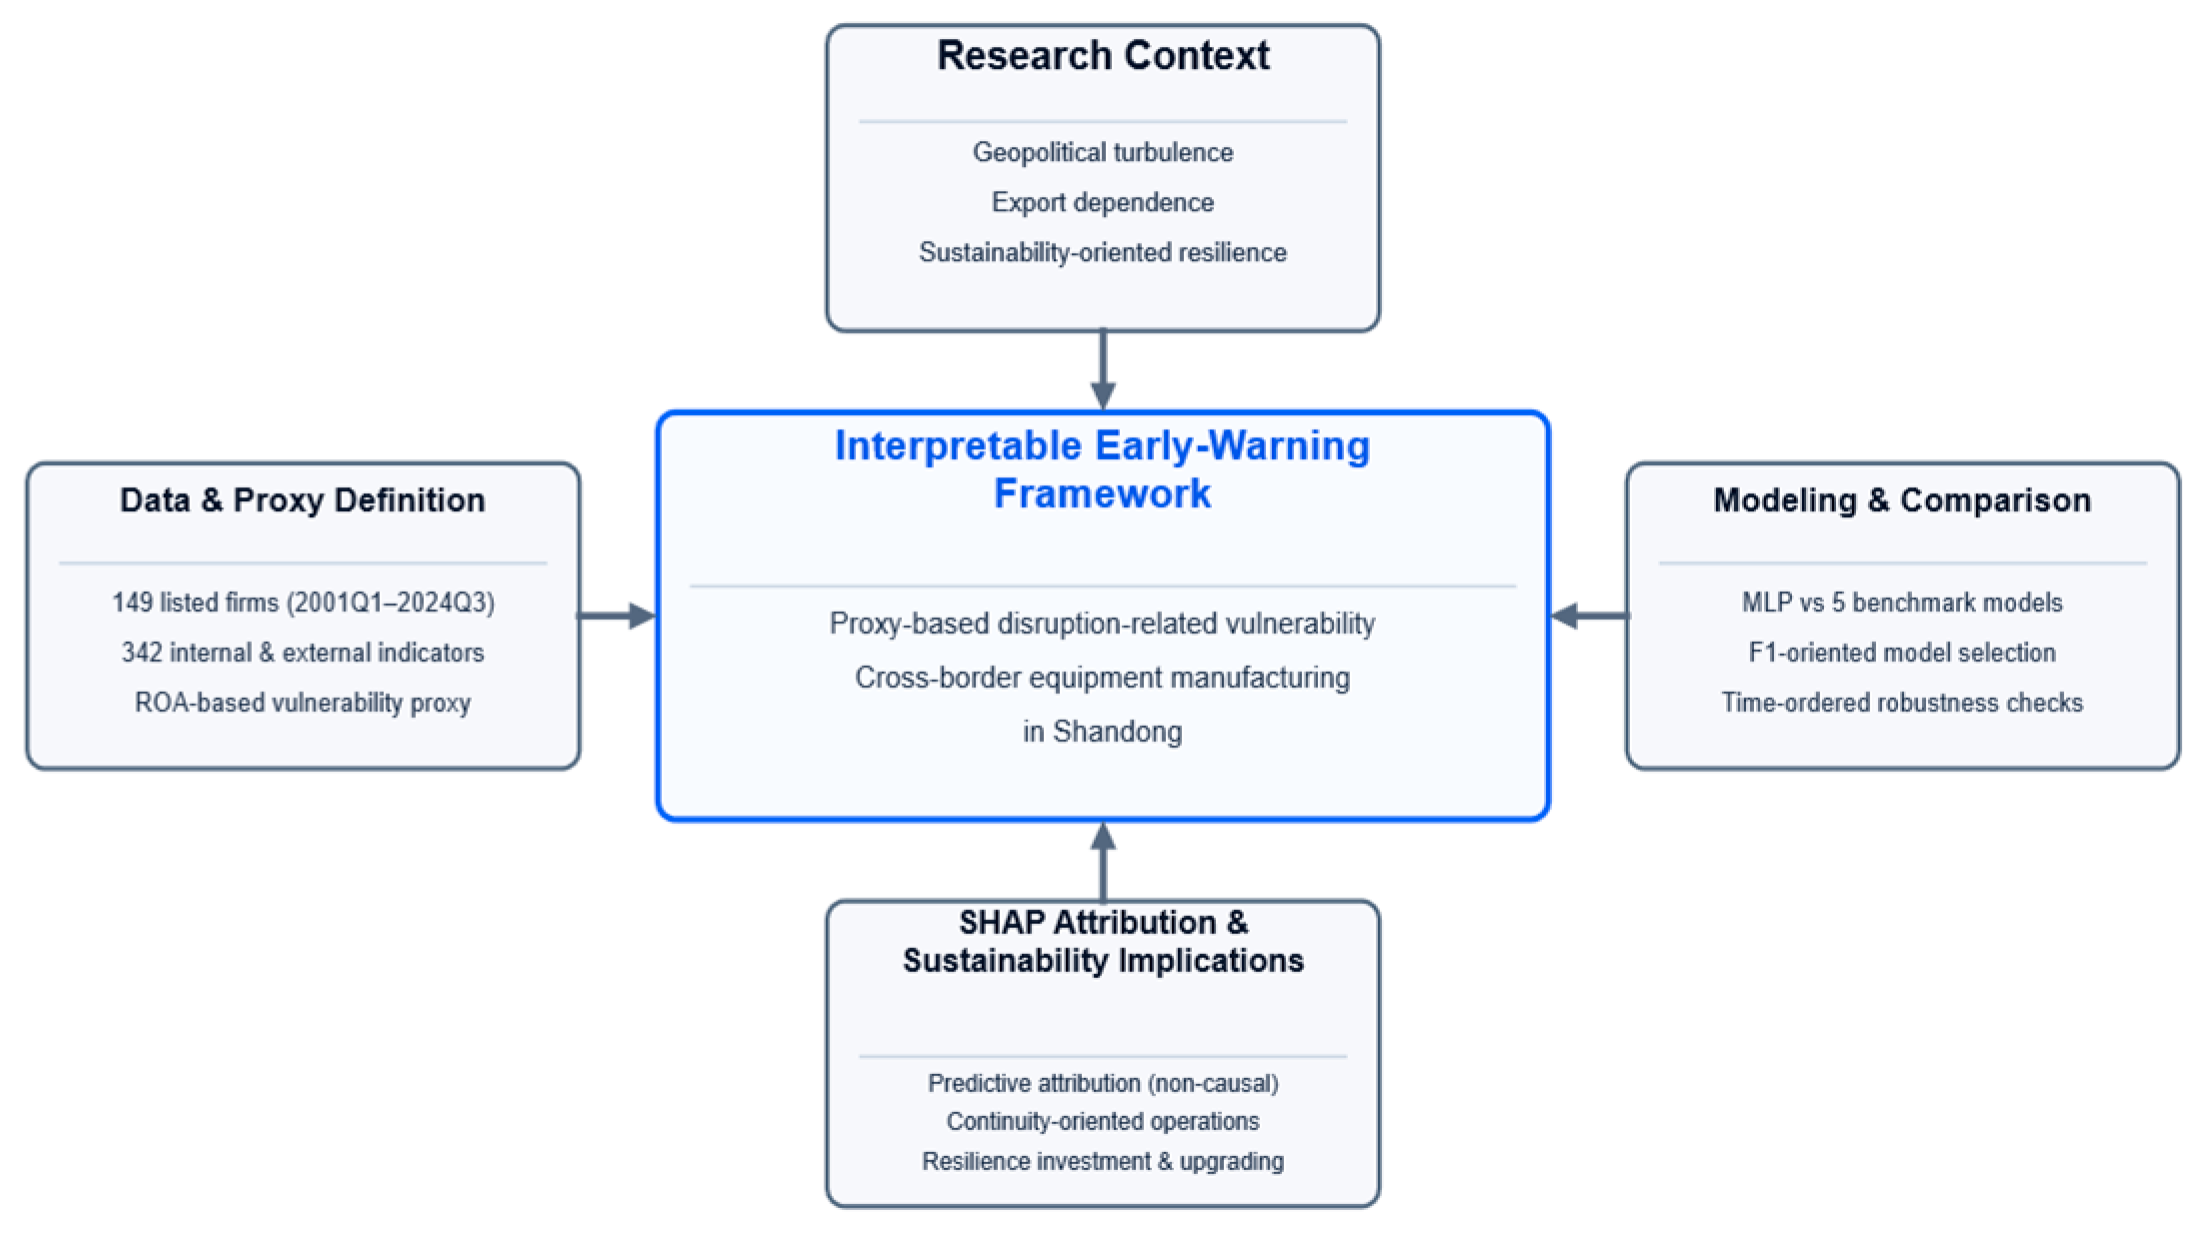
Figure 1 presents a compact mind map of the study framework, linking the research context, proxy definition, comparative modeling strategy, SHAP-based predictive attribution, and sustainability-oriented implications.
Figure 1.
Mind Map of the Study Framework.
The main contributions of this study are threefold. First, methodologically, it proposes an interpretable MLP+SHAP early-warning framework that combines predictive performance with explanatory transparency. Second, empirically, it identifies the key features that receive the strongest predictive attribution in the fitted model, especially profitability, policy-backed export demand, and geopolitical risk in Shandong’s cross-border equipment manufacturing sector. Third, from a sustainability perspective, it translates interpretable model outputs into observable risk signals and proposes practical response paths for resilience-oriented resource allocation and industrial upgrading in Shandong and other export-dependent manufacturing regions.
2. Methodology
2.1. Indicator System Design and Theoretical Basis
Proxy-based disruption-related vulnerability may arise from the joint effects of internal operational vulnerability and external environmental uncertainty. This study focuses on cross-border equipment manufacturing enterprises in Shandong Province, whose supply chains are typically capital-intensive, cyclical, highly dependent on cross-border operations, and strongly policy-sensitive. Accordingly, when constructing the early-warning indicator system, we adopt a dual perspective of internal operational resilience and external environmental shocks and organize a broad candidate feature space of 342 indicators in light of both the industrial characteristics of equipment manufacturing and the regional development context of Shandong, so as to capture the mechanisms potentially associated with proxy-based disruption-related vulnerability.
2.1.1. Internal Dimension: Operational and Financial Characteristics of Equipment Manufacturing
Equipment manufacturing firms are characterized by heavy assets, long production cycles, and high fixed costs. Their disruption-related vulnerability often stems from insufficient internal operational efficiency, financial soundness, and resource deployment capability. Drawing on the resource-based view [21] and dynamic capability theory [22], we select the following five categories of internal indicators:
1. Profitability indicators (e.g., annualized return on total assets, gross profit margin on sales, and return on equity). Equipment manufacturers rely on high capital input and scale effects; profitability is therefore likely to be closely associated with their risk-bearing and reinvestment capacity and may serve as an important signal of supply chain resilience.
2. Solvency and leverage indicators (e.g., current ratio, debt-to-equity ratio, and shareholders’ equity ratio). These indicators reflect a firm’s financial buffering capacity in the face of external shocks. Many equipment manufacturers in Shandong face debt-structure adjustment pressures during the transition from old to new growth drivers, making leverage and liability structure central to the stability of cross-border operations.
3. Operational efficiency indicators (e.g., inventory turnover, accounts receivable turnover, and total asset turnover). Equipment manufacturing supply chains are long and inventory cycles are complex. Poor operational efficiency can easily lead to production interruptions or delivery delays, a problem that becomes more acute in cross-border settings.
4. Cash flow and stability indicators (e.g., cash flow from operating activities per share and free cash flow). Cash flow is critical to supply chain continuity. Equipment manufacturing enterprises in Shandong often face cash-flow mismatch risks because overseas orders have long payment cycles and equipment upgrading requires large capital outlays.
5. Growth and investment indicators (e.g., revenue growth rate and fixed asset expansion rate). These variables capture firms’ expansion trajectories and investment intensity during transformation. Either overly rapid or overly weak growth may amplify supply chain volatility.
2.1.2. External Dimension: Cross-Border Operations and the Regional Policy Environment
Equipment manufacturing enterprises in Shandong are highly dependent on global supply chains and the international trade environment. Their cross-border nature makes them especially sensitive to geopolitical developments, trade policy, and international logistics. Drawing on theories of global supply chain risk transmission and regional economic policy, we select the following external indicators:
1. Geopolitical risk indices (e.g., India, the United States, and the European Union). Exports from Shandong are concentrated in ASEAN, South Asia, Europe, and North America, and firms are highly dependent on the Indian Ocean–Malacca route. Geopolitical turbulence can therefore directly affect cross-border logistics and order security [23].
2. Economic and trade policy uncertainty indices (e.g., Economic Policy Uncertainty (EPU) and Trade Policy Uncertainty (TPU)). Changes in domestic and foreign policy can affect overseas market access, tariff costs, and supply chain configuration, especially in the context of China’s dual circulation strategy and Shandong’s ongoing transition from old to new growth drivers [24].
3. International logistics and trade indicators (e.g., the Baltic Dry Index (BDI), the Baltic Dirty Tanker Index (BDTI), and the value of general trade imports and exports). These variables reflect global shipping costs and trade activity and directly influence the export costs and delivery capacity of Shandong’s equipment manufacturers [25].
4. Aid-related and policy-oriented trade indicators (e.g., the export value of donated aid materials). Such orders often carry policy backing and relatively stable contractual arrangements and may serve as stabilizers when firms face market volatility [26].
These external indicators should be understood as context-sensitive proxies for regionally relevant channels of cross-border vulnerability rather than direct measurements of specific disruption events.
2.1.3. Definition of the Dependent Variable: A Financial Proxy for Disruption-Related Vulnerability
The dependent variable is defined as a quarterly financial proxy for disruption-related vulnerability rather than a directly observed disruption event. Specifically, a firm is classified as vulnerable when its return on assets in quarter t falls below the industry median in the same quarter; otherwise, it is classified as relatively normal. This proxy is used because sustained supply chain stress in capital-intensive cross-border manufacturing may be reflected in weaker asset returns through delayed delivery, inventory mismatch, cost escalation, and working-capital pressure. At the same time, the proxy becomes less informative when return on assets is driven mainly by non-operating items, strategic expansion, or accounting adjustments. Accordingly, the proxy is most appropriate for panel-based early warning of relative operating stress among listed export-oriented manufacturers, rather than for direct identification of discrete disruption events at the transaction or supplier level. This definition is implementable at the quarterly frequency, comparable across firms, and suitable for long-span panel-based early warning. For empirical implementation, the vulnerable class is coded as 0 in the dataset.
2.2. Data Sources, Sample Construction, and Preprocessing
Building on the indicator system above, this section further describes the data sources, sample selection, and preprocessing steps to ensure representativeness, completeness, and reproducibility. The final dataset combines firm-level financial information with macro-level external indicators, thereby forming a quarterly panel database that captures firms’ internal and external risk exposure.
At the firm level, data are drawn primarily from the RESSET and CSMAR databases, including quarterly data from financial statements, balance sheets, income statements, and cash flow statements, with missing variables supplemented from Wind. Macro-economic and external-environment variables are collected from the CEIC Global Database, IMF International Financial Statistics (IFS), and the World Bank open data platform, combined with the Economic Policy Uncertainty (EPU) index released by Baker et al. and the Geopolitical Risk (GPR) index developed by Caldara and Iacoviello. All macro data are arranged at the quarterly frequency and aligned with firm-level data after smoothing and linear interpolation.
For sample construction, we select cross-border equipment manufacturing enterprises in Shandong Province. Based on the China Securities Regulatory Commission’s Industry Classification Guidelines for Listed Companies, we identify listed firms whose primary business belongs to equipment manufacturing (industry codes C71–C76, including special equipment, electrical machinery, and automobile manufacturing). To ensure stable cross-border orientation, we further retain firms whose overseas revenue share remained above 20% on an annual basis. The sample covers major provincial industrial clusters such as Qingdao West Coast New Area (shipbuilding and marine engineering equipment), Yantai Economic and Technological Development Zone (auto parts), and Weifang Binhai Area (power equipment), in line with the cluster-development orientation of the 14th Five-Year Plan for Equipment Manufacturing in Shandong Province. The study period spans from 2001Q1 to 2024Q3. To ensure data quality, we exclude financial firms and firms under ST or *ST treatment. After sample cleaning, the final sample contains 149 firms and provides sufficient firm-quarter observations for leakage-free model training and evaluation. The sample covers core subsectors of Shandong’s equipment manufacturing industry, including special equipment manufacturing (29.86%), electrical machinery and equipment manufacturing (20.89%), and automobile manufacturing (14.92%), all of which share characteristics such as capital intensity, long supply chains, and strong cyclicality, making them representative for analyzing proxy-based disruption-related vulnerability in cross-border equipment manufacturing.
To further improve data reliability, we conducted a series of data-quality checks before model training. These checks included duplicate-record screening, variable-range and sign-consistency inspection for major accounting items, quarterly alignment verification between firm-level and macro-level indicators, and leakage-free preprocessing in which missing-value handling, winsorization, and standardization parameters were estimated within the training window only and then applied to validation and test data. After these screening and cleaning procedures, no major coding inconsistencies or structurally invalid firm-quarter observations remained in the final analytical sample.
After collecting firm-level and macro-level data, we conduct the following preprocessing steps:
1. Missing values: filled using linear interpolation or seasonal means within the training window only, without using future information;
2. Outliers: winsorized mildly using median ± 3 median absolute deviation (MAD);
3. Alignment and frequency: macro and micro indicators are unified to the quarterly frequency and temporally aligned;
4. Standardization: all continuous variables are standardized using the z-score.
Because the dependent variable is defined by the industry-median threshold, the labels are approximately balanced within the sample. We therefore do not apply over-/under-sampling or class weighting, so as to preserve the true distribution and avoid artificial distortion.
The integrated and cleaned dataset exhibits good completeness and consistency and provides a solid foundation for subsequent neural network modeling. Based on this dataset, we further construct an MLP model to predict proxy-based disruption-related vulnerability, as described below.
2.3. Model Design and Training
2.3.1. Model Principle
An MLP is a feedforward neural network built from an input layer, hidden layers, and an output layer. Through layered nonlinear transformations, it can model complex relationships among variables. According to the universal approximation theorem [27], MLPs with sufficient hidden units are able to approximate continuous functions effectively. This ability makes them appropriate for analyzing the nonlinear and high-dimensional risks present in equipment-manufacturing supply chains.
The overall mapping from input to output is:
where denotes the standardized input feature vector; is the hidden representation at layer ; and are the weight matrix and bias vector of layer , respectively; is the nonlinear activation function at layer (rectified linear unit (ReLU) in this study); is the sigmoid function in the output layer, which maps the linear combination to a probability; is the total number of layers (i.e., the index of the output layer); and is the predicted probability of belonging to the proxy-defined disruption-vulnerable class, taking values in the interval (0, 1). This integrated mapping reflects the mechanism of alternating linear transformation and nonlinear activation and allows the model to progressively extract high-order combination features while capturing nonlinearities and interaction effects between internal operating indicators and external environmental variables.
2.3.2. Network Architecture Design
We adopt a tunable MLP architecture. The number of input nodes equals the dimensionality of the standardized feature space. The hidden layers consist of one to two blocks of linear transformation–batch normalization (BatchNorm)–activation–Dropout [28], and the weights are initialized using Xavier initialization to stabilize training. The number of neurons per hidden layer is selected from {32, 64}, and activation functions are compared between ReLU and exponential linear unit (ELU) [29], with the better-performing combination retained based on validation performance. BatchNorm is retained after each layer, and Dropout is searched in the range of 0.3 to 0.6 to control overfitting. The output layer uses a sigmoid function to map the network output to a probability of proxy-based disruption-related vulnerability in (0, 1). The specific number of layers, layer width, and activation function are jointly determined by hyperparameter search using the validation-set F1 score (the harmonic mean of precision and recall). Candidate architectures are evaluated on the training set using grouped time-series cross-validation by company ID (GroupKFold × TimeSeriesSplit, embargo = 1), and the layer/width/activation combination with the best validation performance is selected as the final architecture. BatchNorm and Dropout are retained during the final training stage to improve stability and generalizability.
2.3.3. Training Procedure and Hyperparameter Selection
For model estimation, binary cross-entropy is employed as the loss function to quantify the gap between the model’s predicted probabilities and the actual class labels:
To improve model generalization, an L2 penalty is incorporated into the loss function, yielding the total objective:
where is the sample size; is the proxy-defined class label; is the predicted probability of disruption-related vulnerability under the proxy definition; is the weight matrix of layer (bias terms are typically not penalized); denotes the Frobenius norm, i.e., the sum of squared matrix elements; is the regularization coefficient controlling the penalty strength; and is the regularized total objective minimized during training. Model parameters are updated using the Adam optimizer [30] with an initial learning rate of 0.001, together with an adaptive learning-rate reduction strategy based on validation-set F1 (e.g., Reduce LR On Plateau, which lowers the learning rate proportionally when F1 fails to improve over several epochs). To enhance generalization, the Dropout hyperparameter is searched over the interval 0.3–0.6 and the best value is selected. The data are split chronologically into training, validation, and test sets with proportions of approximately 70%/15%/15%. All preprocessing parameters are estimated on the training set only and then applied to the validation and test sets. Hyperparameter selection and early-stopping monitoring are conducted using grouped time-series cross-validation by company ID (GroupKFold × TimeSeriesSplit, embargo = 1 time step) [31]. The classification threshold is selected on the validation set by maximizing F1 and is then fixed for the test set. The test set is used once only for final evaluation. The standardization of continuous variables follows Section 2.2; its parameters (means and standard deviations) are fit only on the training set and then applied to the validation and test sets. For reproducibility, the one-shot benchmark in Table 1 uses a fixed random seed (41), whereas the supplementary time-ordered robustness settings are documented in Appendix A and reported in Appendix B; these supplementary evaluations are interpreted as descriptive robustness evidence rather than formal inferential proof. All models were implemented in Python 3.10. The main packages used were PyTorch 2.0 for the MLP model; scikit-learn 1.3 for logistic regression, decision tree, and random forest; XGBoost 1.7; LightGBM 4.0; and SHAP 0.43 for model interpretation.
Table 1.
Comparison of Predictive Performance across Models.
2.3.4. Performance Evaluation and Benchmark Comparison
We evaluate model performance using five metrics: accuracy, recall, the F1 score, the area under the receiver operating characteristic curve (AUC-ROC), and the area under the precision-recall curve (AUC-PR). Among them, the F1 score and AUC-PR are especially informative for this task because they better capture the quality and stability of identifying proxy-defined vulnerable cases (the target class for evaluation). To verify the effectiveness of the MLP, we compare it with five baseline models: logistic regression (LR), decision tree (DT), random forest (RF), XGBoost, and LightGBM. For fair comparison, all benchmark models use the same chronologically ordered split, leakage-free preprocessing pipeline, grouped time-series cross-validation, and validation-based threshold selection described above. Full comparative and robustness results are reported in Section 3.1 and Appendix B.
2.4. Interpretability Analysis: SHAP
To improve model transparency while preserving predictive performance, we conduct a global SHAP analysis on the final selected MLP. Throughout the paper, SHAP > 0 indicates lower proxy-based disruption-related vulnerability, whereas SHAP < 0 indicates higher proxy-based disruption-related vulnerability; all figures and discussions below follow this convention.
SHAP is used here as an interpretability tool for predictive attribution rather than for causal identification. Accordingly, the reported feature importance, sign, and ranking should be interpreted as model-based associations with the proxy-defined outcome, not as independent causal effects. Throughout the following sections, terms such as “important predictive features” or “associated factors” are therefore preferred to causal expressions such as “drivers” or “determinants”.
In this section, the function to be explained is defined as the log-odds of the model-implied probability of normal operation, with the logit link defined as:
For ease of exposition, we denote the SHAP-explained function as . Under the setup described in Section 2.1.3, the network output represents the predicted probability of the proxy-defined disruption-vulnerable state. Accordingly, the probability of the proxy-defined normal state is denoted by , and an additive decomposition is constructed on the logit scale. This transformation is adopted so that positive SHAP values can be interpreted consistently as contributions toward the proxy-defined normal state, and negative SHAP values as contributions toward higher proxy-based vulnerability:
where is the baseline term, defined as the expectation under the background distribution , which is constructed from representative subsamples drawn from the training set:
Under this setup, indicates lower proxy-based disruption-related vulnerability, whereas indicates higher proxy-based disruption-related vulnerability. Global importance is measured and ranked by , and the beeswarm plot visualizes directionality and heterogeneity across different feature values. In implementation, SHAP is computed directly using the explainer’s forward function defined on this logit-transformed target, rather than by first computing SHAP values for and then transforming them, so as to preserve additivity in logit space. The implementation uses a SHAP-based explainer for deep-learning models [19,32]. The background sample is selected from the training set using methods such as k-medoids [33], with a size of approximately 100.
3. Results and Discussion
We first assess the predictive performance of the MLP model in the early warning of proxy-based disruption-related vulnerability and compare it with a set of benchmark models. After establishing the effectiveness of the MLP, we use SHAP to identify the important predictive features of proxy-based disruption-related vulnerability and reveal the direction and magnitude of their effects. Finally, we synthesize the predictive and interpretability results in light of both theory and practice to provide the basis for the managerial implications and conclusions.
3.1. A Comparative Evaluation of Predictive Performance
To systematically evaluate the performance of different models in providing early warnings of proxy-based disruption-related vulnerability, this study uses the F1 score as the core evaluation metric because it balances precision and recall and is especially suitable for settings that emphasize the identification quality of proxy-defined disruption-vulnerable cases (the target class for evaluation). Accuracy, AUC-ROC, and AUC-PR are additionally reported to provide a multidimensional performance assessment. All model hyperparameters are optimized using grouped time-series cross-validation by company ID (GroupKFold × TimeSeriesSplit, embargo = 1 quarter) and are then evaluated on an independent test set. Because the primary goal of this study is the identification quality of proxy-defined vulnerable cases, F1 is prioritized, while AUC-ROC and AUC-PR are reported as threshold-independent supplementary metrics.
Table 1 presents the performance of the proposed MLP model and five benchmark models—logistic regression (LR), decision tree (DT), random forest (RF), XGBoost, and LightGBM—in predicting next-quarter proxy-defined disruption-related vulnerability. Because the study focuses on the identification quality of proxy-defined vulnerable cases, F1 is treated as the primary metric. The classification threshold for each model is determined by maximizing F1 on its respective validation set and then fixed for the test set; AUC-ROC and AUC-PR are also reported to characterize threshold-independent performance.
As shown in Table 1, the MLP achieves the highest F1 score (0.8842) and the highest accuracy (0.8824). However, its advantage is not uniform across metrics. XGBoost yields slightly higher AUC-ROC and AUC-PR, and logistic regression records marginally higher recall. We therefore select the MLP not because it dominates every criterion, but because it best matches the study’s main objective: identifying vulnerable firms with a balanced trade-off between precision and recall. To facilitate a more detailed model-by-model comparison, Table 2 summarizes the main comparative patterns across the one-shot benchmark and the supplementary time-ordered evaluations.
Table 2.
Detailed Comparative Profile of Predictive Performance across Models.
Table 2 provides a more detailed cross-model comparison beyond the one-shot benchmark reported in Table 1. The results further confirm that no single model dominates all evaluation criteria. The multilayer perceptron not only achieves the highest F1 score in the one-shot evaluation, but also maintains the highest average F1 across the eight temporal partitions and the rolling-window evaluation. This pattern suggests that the multilayer perceptron is the most suitable model for the present study when threshold-based identification of proxy-defined vulnerable cases is treated as the primary task objective. By contrast, XGBoost performs best on threshold-independent ranking metrics, including AUC-ROC and AUC-PR, both in the one-shot benchmark and in the supplementary time-ordered evaluations reported in Appendix B. Logistic regression shows a slightly stronger recall tendency, whereas random forest and LightGBM remain competitive but do not consistently outperform the multilayer perceptron on the primary task-oriented metric. Therefore, the comparative evidence should be interpreted as supporting a task-aligned selection of the multilayer perceptron under an F1-oriented early-warning objective, rather than as establishing universal superiority across all metrics and validation settings.
Robustness of Model Comparison
To check whether this conclusion depends on a single hold-out split, we repeated the comparison under three additional time-ordered settings: eight alternative temporal partitions, rolling-window evaluation, and a pre-/post-2012 subperiod analysis. The pattern remains broadly stable. The MLP keeps the highest average F1, whereas XGBoost continues to perform slightly better on AUC-ROC and AUC-PR. These exercises do not establish formal statistical dominance, but they do show that the main ranking pattern is not an artifact of one specific split. Detailed temporal partitions and robustness results are reported in Appendix A and Appendix B, respectively. Therefore, the present comparison should be interpreted as evidence of descriptive temporal stability and task suitability under an F1-oriented objective, rather than as a formal statistical significance test across model families.
3.2. SHAP-Based Predictive Attribution and Feature Importance
After confirming the task-aligned predictive performance of the MLP, this section uses SHAP to interpret the fitted model and identify the globally important predictive features associated with proxy-based disruption-related vulnerability for cross-border equipment manufacturing enterprises in Shandong during 2001Q1–2024Q3. The features are ordered from highest to lowest according to their mean absolute SHAP values (); a larger value indicates a larger average contribution to the model’s predictions and hence greater importance in distinguishing whether a firm is likely to be classified as relatively vulnerable under the proxy definition in the next quarter. These results should be interpreted as predictive attribution rather than causal identification.
Sign and color convention. In this section, the sign of SHAP is interpreted directly as the direction of change in proxy-based disruption-related vulnerability: SHAP > 0 indicates lower disruption-related vulnerability, whereas SHAP < 0 indicates higher disruption-related vulnerability. In the beeswarm plot, red represents higher feature values, whereas blue represents lower feature values.
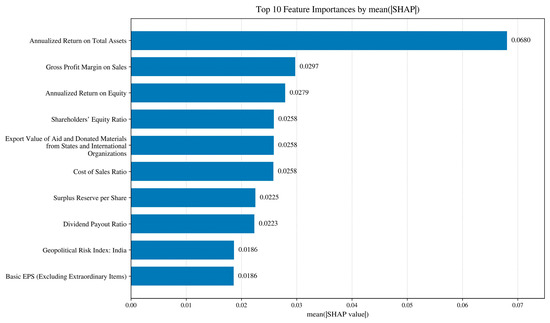
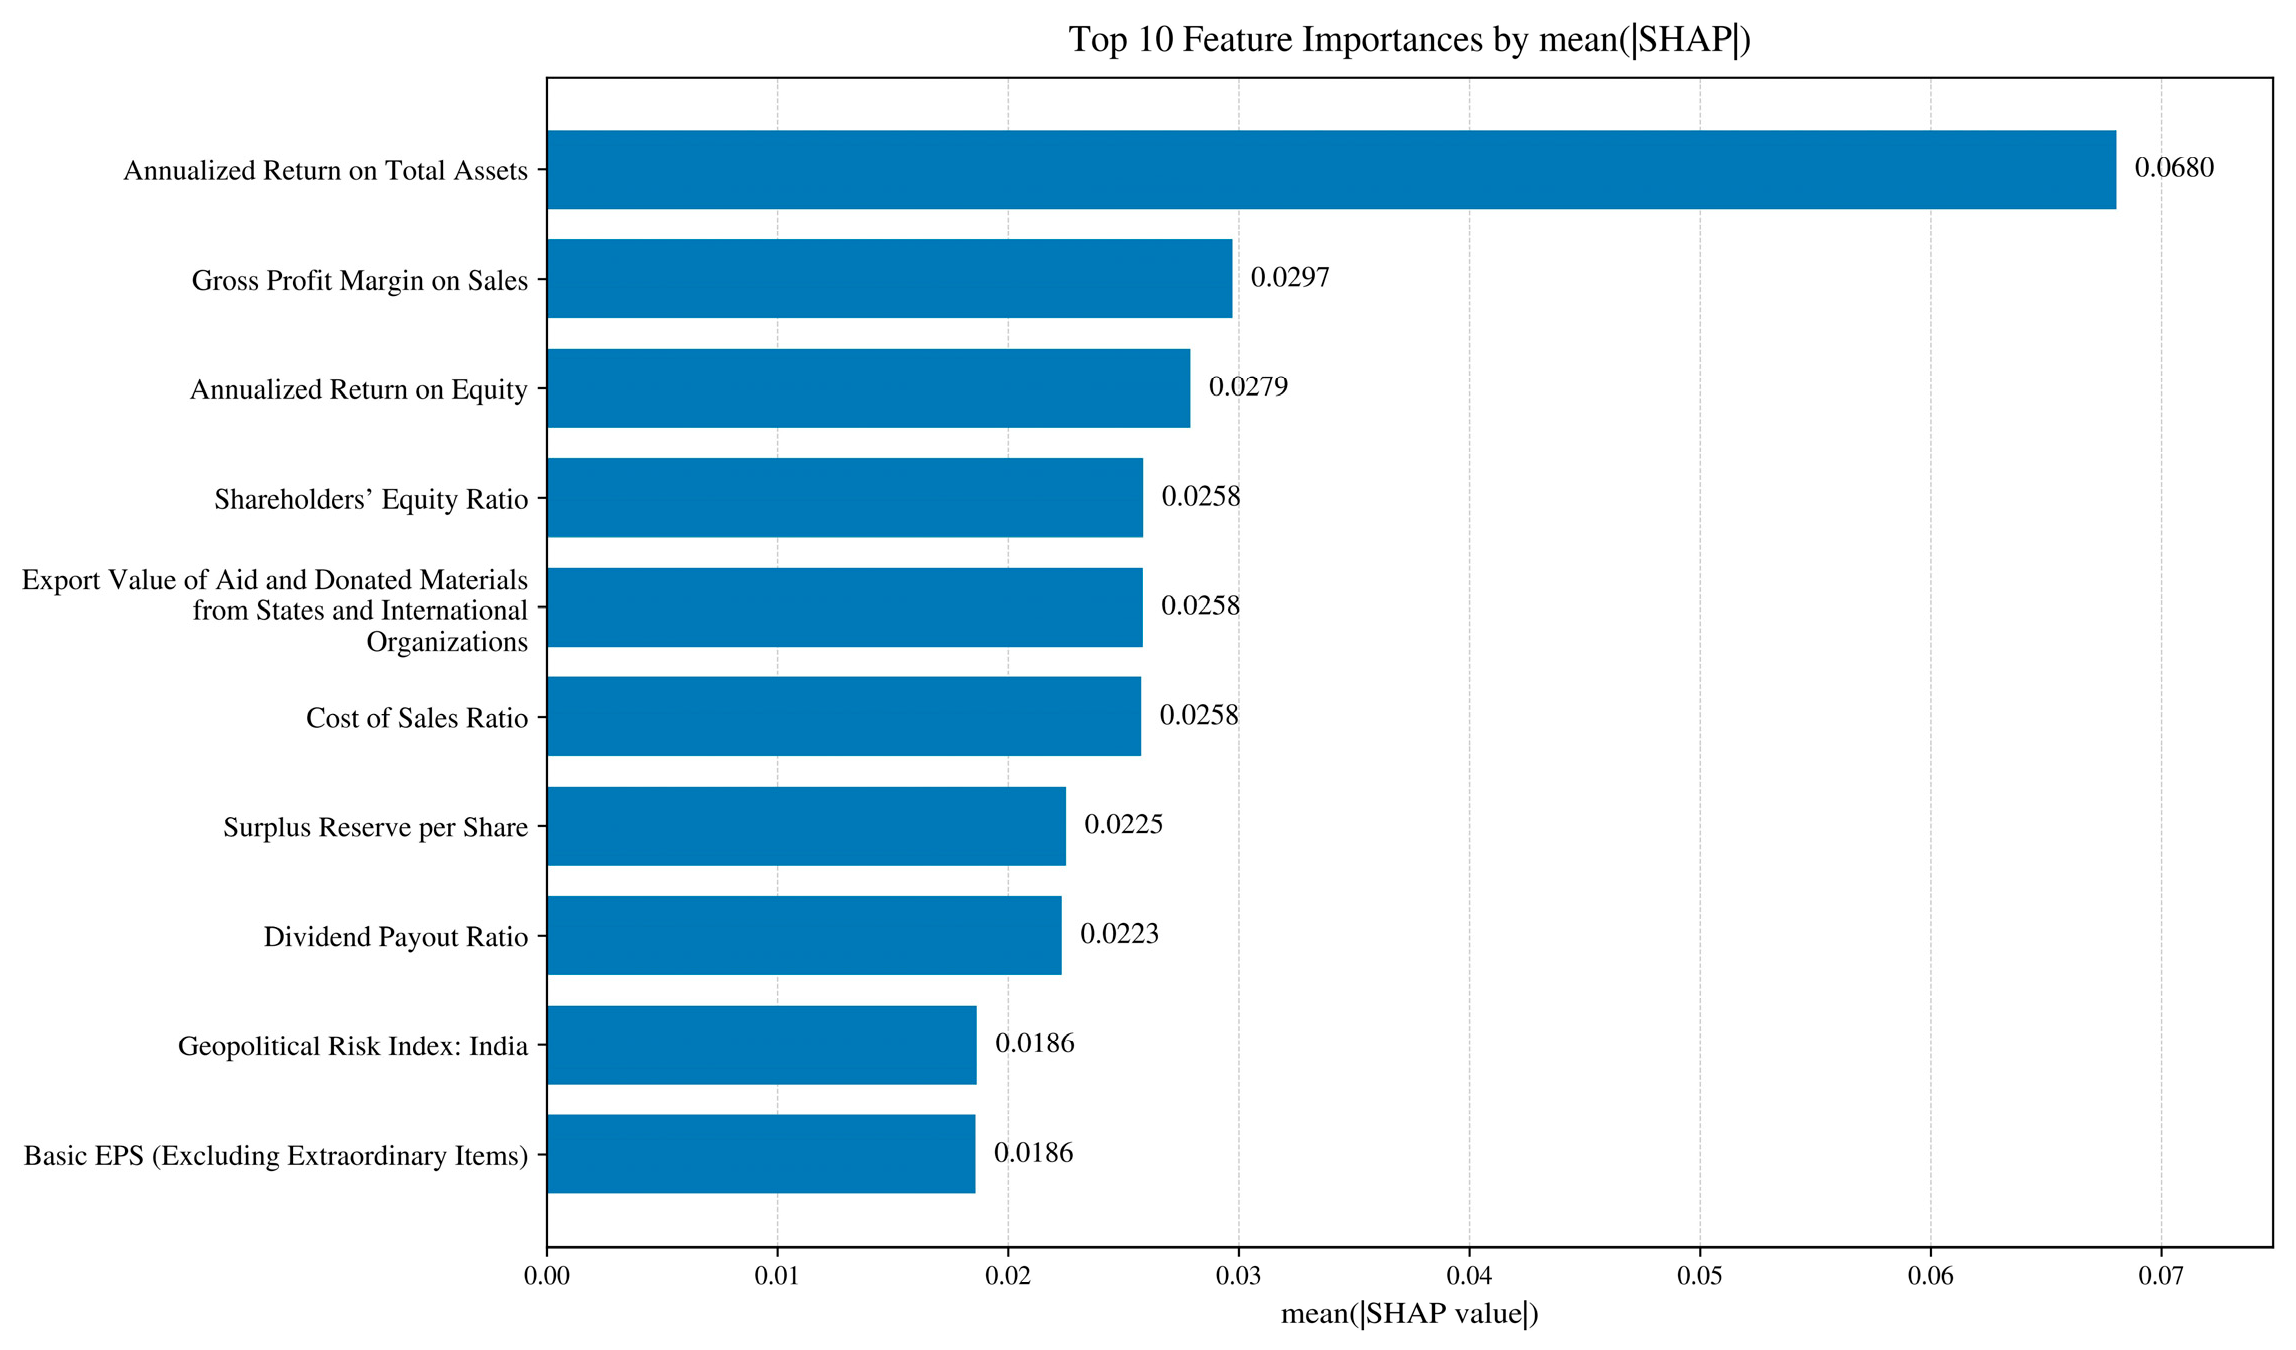
First, Figure 2 presents a SHAP feature-importance bar chart for the top 10 important predictive features ranked by mean absolute SHAP value. Annualized return on total assets has the highest mean absolute SHAP value among all features, indicating that it receives the strongest predictive attribution in the fitted model. Other profitability indicators, such as gross profit margin on sales and annualized return on equity, also rank prominently and form the first tier of the early-warning system.
Figure 2.
SHAP Feature-Importance Bar Chart.
To provide more precise quantitative evidence, Table 3 reports the top 10 most influential predictive features and their corresponding mean absolute SHAP values. The results show that four of the top five predictive features are internal financial indicators, especially profitability measures, including annualized return on total assets, gross profit margin on sales, and annualized return on equity. This indicates that internal financial indicators receive high predictive attribution in the fitted model. Notably, the Export Value of Aid and Donated Materials from States and International Organizations—hereafter referred to as policy-backed export demand—also ranks within the top five.
Table 3.
Top 10 Important Predictive Features Associated with Proxy-Based Disruption-Related Vulnerability (Based on SHAP Analysis of the MLP Model).
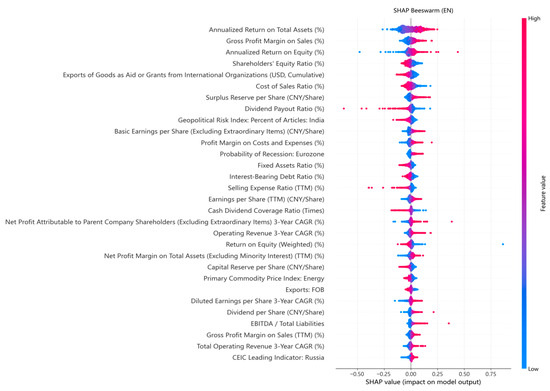
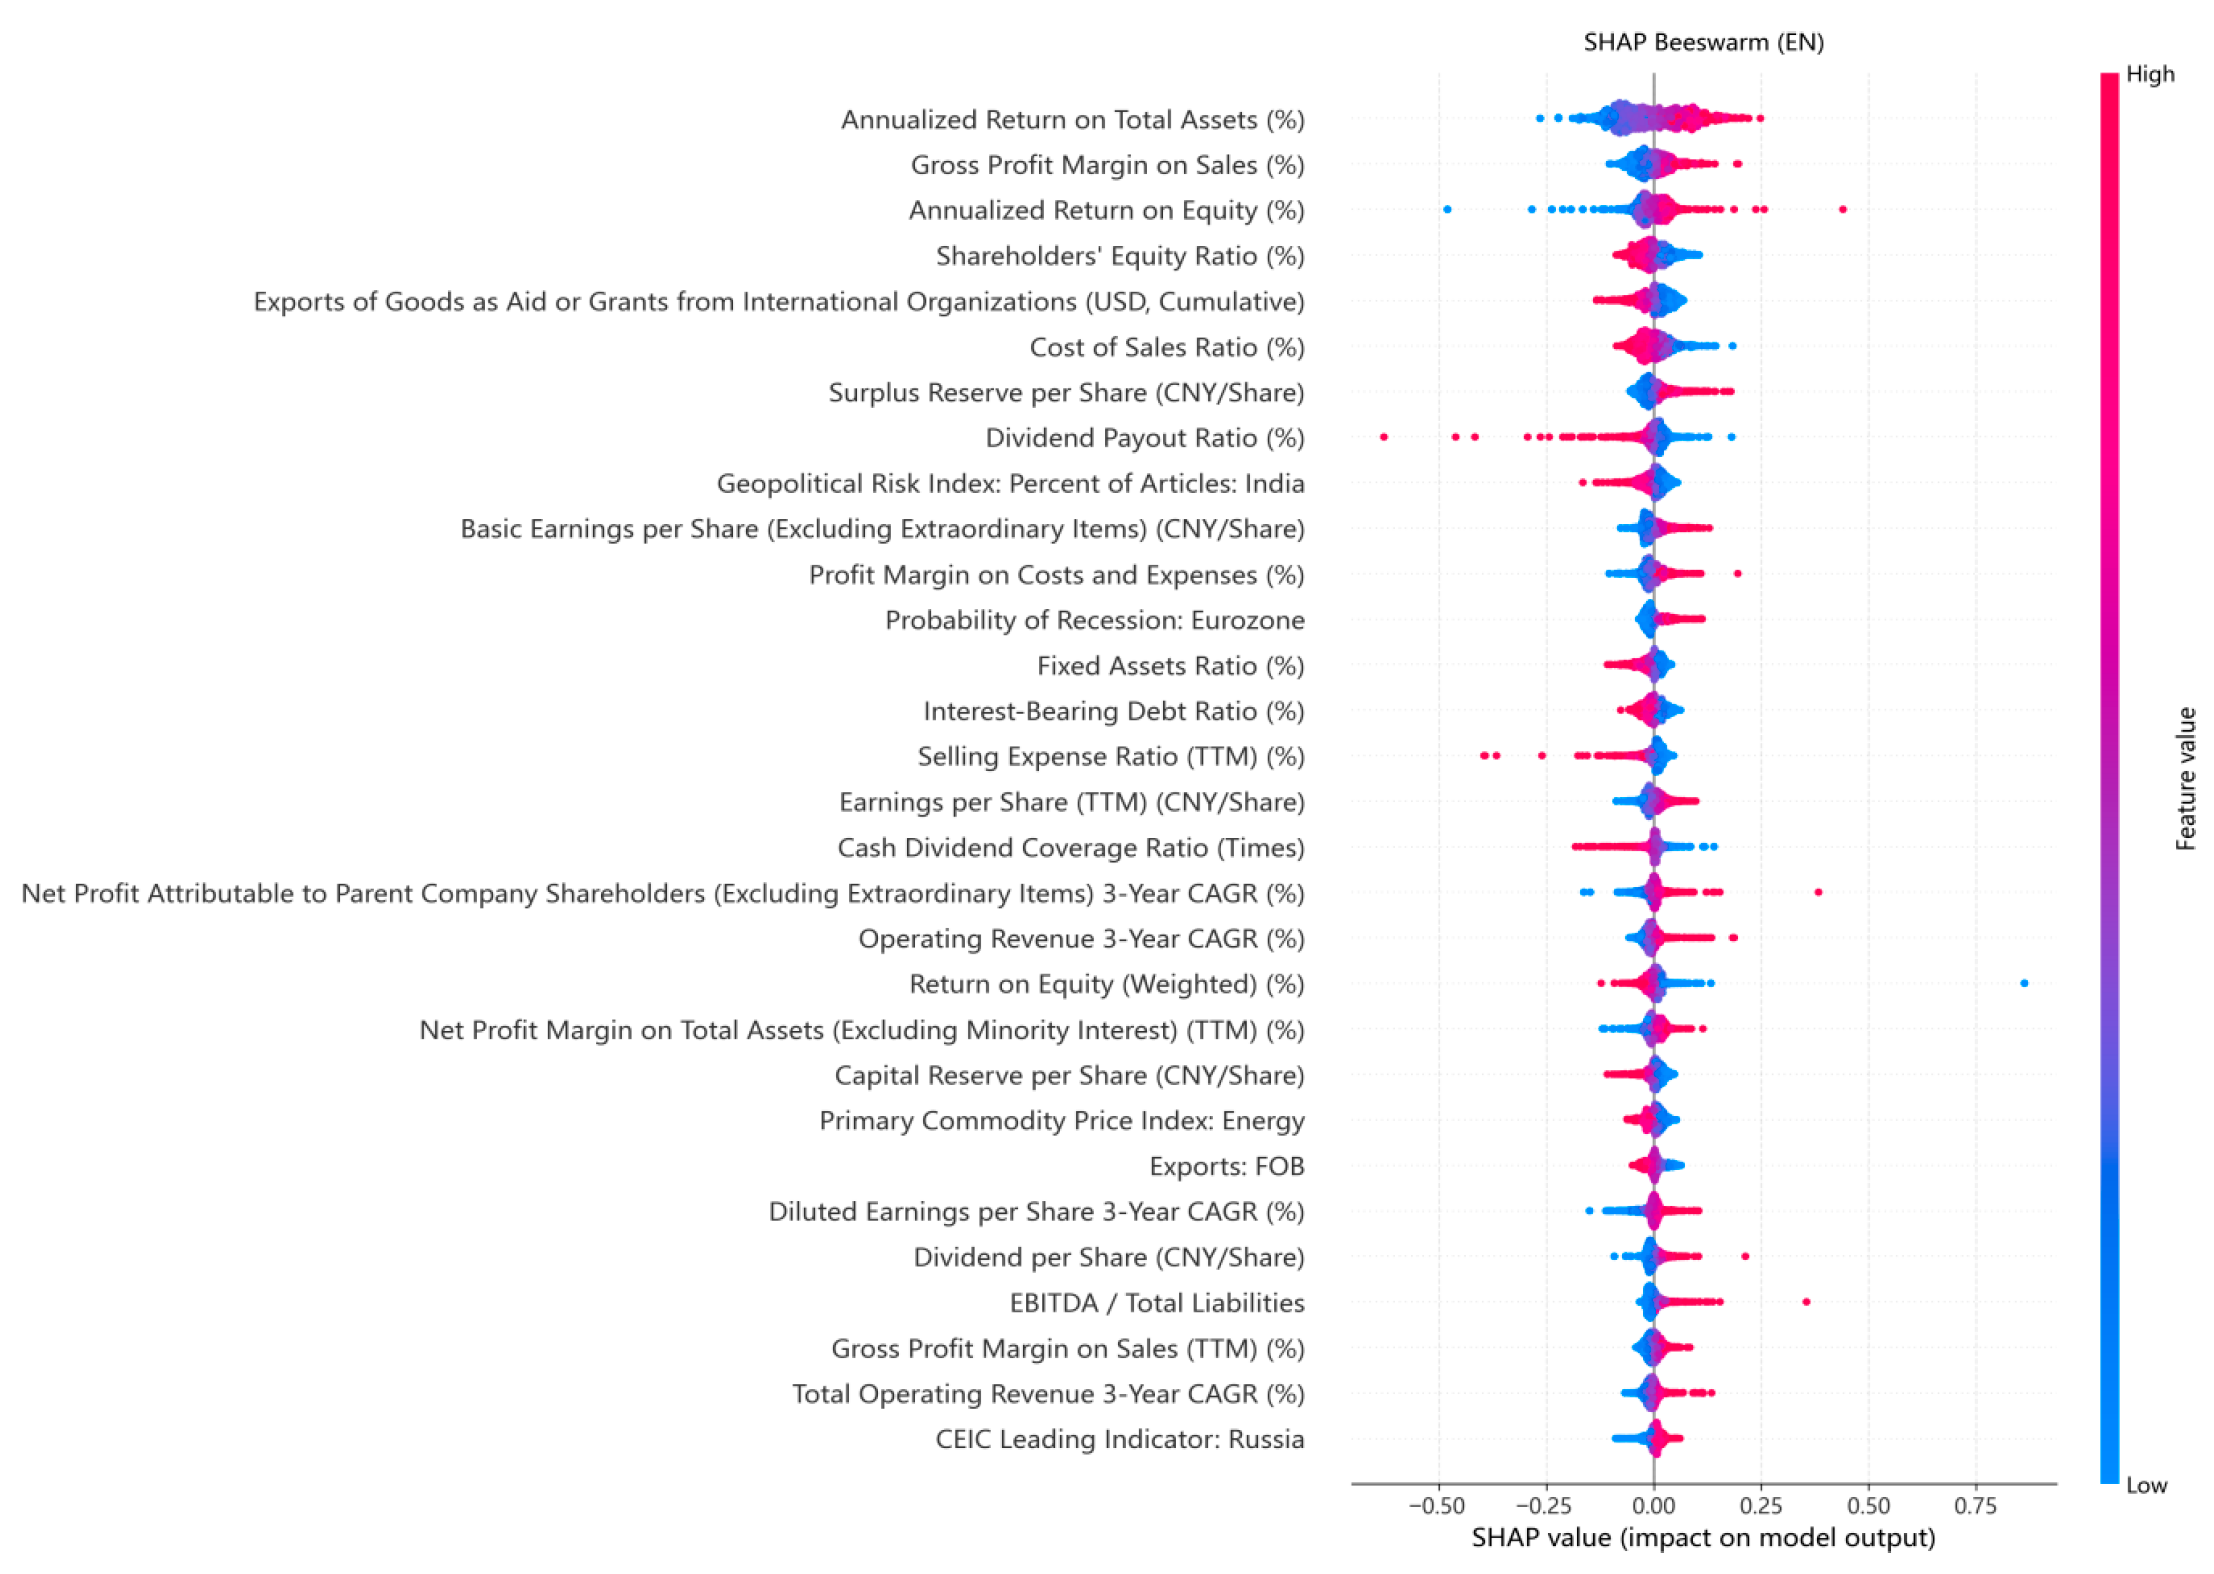
The beeswarm summary plot in Figure 3 further illustrates the impact patterns of these key factors:
Figure 3.
SHAP Beeswarm Summary of Proxy-Based Disruption-Related Vulnerability for Cross-border Equipment Manufacturing Enterprises in Shandong Province. Figure Note: Red = high value, blue = low value; SHAP > 0 indicates lower disruption-related vulnerability, whereas SHAP < 0 indicates higher disruption-related vulnerability; target class for evaluation = proxy-defined vulnerable state (coded as 0).
1. For core profitability indicators such as annualized return on total assets and gross profit margin on sales, high feature values (red points) are densely distributed in the positive SHAP region, indicating a clear global association between stronger profitability and lower relative vulnerability.
2. For external environmental indicators, high values of policy-backed export demand are also concentrated in the positive SHAP region, suggesting an association with lower predicted vulnerability. By contrast, high values of the geopolitical risk index for India lie mainly in the negative SHAP region, indicating an association with higher predicted vulnerability.
3.3. Discussion
For readability, the discussion proceeds from internal profitability to the external environment and finally to the combined value of predictive performance and interpretability.
3.3.1. Prominence of Profitability-Related Features in Predictive Attribution
Table 3 and Figure 3 show that profitability variables occupy the top positions in the fitted model, with annualized return on total assets standing out most clearly. This pattern suggests that firms with stronger earnings capacity are more likely to be predicted as remaining outside the proxy-defined vulnerable group in the following quarter. In the Shandong context, this is plausible because firms undergoing upgrading and cross-border adjustment need profits not only for current operations, but also for buffer inventories, supplier diversification, and technology investment [2,34,35].
3.3.2. External Conditions Associated with Higher and Lower Predicted Vulnerability
The external variables point in two different directions. Higher policy-backed export demand is associated with lower predicted vulnerability, suggesting that relatively stable institutional orders may cushion firms against market volatility [26,36]. By contrast, higher India-related geopolitical risk is associated with higher predicted vulnerability. Given Shandong’s exposure to South-Asia-linked shipping routes, this pattern is consistent with the province’s sensitivity to maritime logistics uncertainty [23]. These are predictive associations rather than causal claims, but they still help identify where firms may need closer monitoring.
3.3.3. Model Value: From Accurate Prediction to Interpretable Attribution
The contribution of the framework is practical. Numerically, this task-aligned advantage is modest but consistent: the multilayer perceptron records an F1 score of 0.8842, compared with 0.8797 for XGBoost and 0.8749 for logistic regression, whereas XGBoost attains the highest AUC-ROC and AUC-PR. The MLP provides a task-aligned warning signal under the study’s F1-oriented objective, and SHAP helps identify which variables receive the greatest predictive attribution in that signal. Together, they allow managers to move from “which firms look vulnerable” to “which factors are most closely associated with that vulnerability in the fitted model.” In this setting, sustainability is reflected not only in reducing disruption exposure, but also in maintaining investment continuity, preserving export stability, and promoting higher-value and lower-carbon industrial upgrading under external shocks [37].
4. Conclusions
4.1. Major Findings
This study shows that an interpretable neural-network framework can be used to monitor relative vulnerability among Shandong’s cross-border equipment manufacturers when direct disruption-event data are unavailable. Empirically, the MLP achieves the highest observed value on the study’s primary F1 criterion, while XGBoost remains slightly stronger on AUC-based metrics. Profitability variables are the strongest predictive features, policy-backed export demand is associated with lower predicted vulnerability, and India-related geopolitical risk is associated with higher predicted vulnerability. These findings support the use of explainable early-warning tools as a complement to resilience planning, rather than as standalone causal evidence.
4.2. Managerial Implications
Based on these core findings for cross-border equipment manufacturing enterprises in Shandong, we offer three closely linked and actionable strategic implications for business managers and provincial policymakers.
1. Strengthen profit quality to build a resilient foundation during the transition from old to new growth drivers. In the fitted model, profitability-related indicators receive the highest predictive attribution among internal variables and are consistently associated with lower predicted vulnerability. During Shandong’s ongoing industrial upgrading, firms face substantial investment needs and supply chain reconfiguration pressures. Management should therefore move beyond a narrow focus on profit scale and treat profit-quality indicators—such as return on assets and gross profit margin—as practical early-warning signals associated with the firm’s capacity to absorb shocks and sustain long-term resilience investment. Excess profits can be allocated to resilience-enhancing assets, such as supply chain diversification, upgrading of critical technologies, and strategic safety stocks, so that financial strength is translated into buffering capacity during the transition toward more intelligent and higher-value manufacturing.
2. Leverage policy-backed export demand by embedding firm supply chains into relatively stable institutional networks. SHAP highlights policy-backed export demand as an external feature associated with lower predicted vulnerability. This suggests that, where relevant and feasible, firms may enhance stability by participating in policy-supported trade and international capacity-cooperation programs such as those associated with the Belt and Road Initiative. As an important equipment-manufacturing province and a strategic land–sea hub in the Belt and Road network, Shandong creates favorable opportunities for firms to collaborate with the provincial Department of Commerce and the China Council for the Promotion of International Trade. Such demand may provide countercyclical stability and may serve as a buffer against global market volatility because it tends to carry stronger policy backing and lower settlement risk.
3. Focus on geopolitical risk and develop a region-specific geopolitical risk monitoring and response system. Shandong’s reliance on Indian Ocean routes may increase the sensitivity of its cross-border equipment manufacturing sector to related geopolitical risks. Firms need a targeted and routine mechanism for monitoring and responding to geopolitical developments. Building on the resources and information advantages of core coastal ports such as Qingdao and Yantai, leading firms or industry associations could take the initiative in establishing a shared risk-information platform. At the same time, firms should actively explore diversified logistics channels, including the Qilu freight train service to Eurasia and the China–ASEAN New International Land–Sea Trade Corridor, so as to reduce excessive dependence on any single maritime corridor and build a more resilient cross-border logistics system consistent with Shandong’s position as a northern international shipping hub.
4.3. Limitations and Future Research
While this study strives for methodological rigor, several limitations should be acknowledged.
First, the study predicts proxy-based disruption-related vulnerability rather than directly observed disruption events. The use of quarter-level relative return on assets underperformance offers practical advantages in terms of data availability, quarterly implementation, and cross-firm comparability, but it does not fully capture operational disruptions such as supplier interruption, production stoppage, or overseas delivery delay. In addition, the relationship between return on assets and disruption-related vulnerability may weaken when financial outcomes are materially affected by accounting adjustments, subsidies, asset disposals, investment-cycle effects, or other non-operational factors, or when the financial consequences of disruption are lagged. Accordingly, the framework should be used as an early-warning aid for relative vulnerability screening, rather than as a substitute for event-level disruption diagnosis.
Second, although Section Robustness of Model Comparison and Appendix B provide descriptive robustness evidence across alternative time-ordered validation settings, with Appendix A documenting the underlying temporal partitions and subperiod splits, these exercises involve overlapping windows and unequal test horizons and therefore should not be interpreted as formal inferential proof of model superiority. Future work can strengthen comparative evidence through non-overlapping rolling-origin designs, external validation samples, bootstrap confidence intervals, or pre-specified significance testing under fixed temporal splits.
Third, the Shapley additive explanation results should be interpreted as model-based predictive attribution rather than causal identification. Although the method is useful for revealing which features are most influential in the fitted model, it does not independently establish causal mechanisms or fully eliminate the influence of confounding relationships among predictors.
Fourth, the data are limited to listed firms and mainly structured quarterly indicators. This may exclude many small and medium-sized cross-border equipment manufacturers in Shandong and may underrepresent unstructured but practically relevant information, such as supplier-network changes, local policy implementation intensity, or logistics text signals.
Future research may therefore proceed in four directions: improving proxy validation through alternative vulnerability definitions and sensitivity analysis; enriching data sources by incorporating non-listed firms and higher-frequency operational data; strengthening causal analysis through natural experiments or quasi-experimental designs; and extending the framework to other provinces or manufacturing sectors to assess external validity.
Author Contributions
Conceptualization, X.S. and L.D.; methodology, X.S. and X.Z.; software, X.S.; validation, X.S. and X.Z.; formal analysis, X.S.; investigation, X.S.; data curation, X.S.; writing—original draft preparation, X.S.; writing—review and editing, L.D. and X.Z.; visualization, X.S.; supervision, L.D.; project administration, L.D. All authors have read and agreed to the published version of the manuscript.
Funding
This research received no external funding.
Institutional Review Board Statement
Not applicable.
Informed Consent Statement
Not applicable.
Data Availability Statement
The data supporting the reported results were obtained from commercial and public databases, including RESSET, CSMAR, Wind, CEIC, IMF International Financial Statistics (IFS), the World Bank Open Data platform, the Economic Policy Uncertainty (EPU) database, and the Geopolitical Risk (GPR) database. Due to licensing and access restrictions, the raw data are not publicly available.
Acknowledgments
The authors would like to thank the anonymous reviewers and editors for their valuable comments and suggestions.
Conflicts of Interest
The authors declare no conflicts of interest.
Appendix A. Supporting Validation Designs for Robustness Checks
The eight temporal partitions used in Table A3 are defined as follows (all dates in YYYYQ format):
Table A1.
Temporal Partitions for Table A3.
Table A2.
Chronological Splits for Subperiod Analysis (Table A5).
Appendix B. Robustness Check Results
Table A3.
Model Performance Across Multiple Temporal Partitions (8 Partitions).
Table A4.
Rolling Window Evaluation Results (2019Q1–2024Q3, 23 Windows).
Table A5.
Subperiod Analysis Results. (a) Subperiod 1: 2001Q1–2012Q4 (Pre-2012). (b) Subperiod 2: 2013Q1–2024Q3 (Post-2012).
References
- Yan, Y.; Wang, X.; Zhao, S.; Zhang, Y. Spatial structure and influencing factors of regional city supply networks in manufacturing: A case study of Shandong, China. Front. Environ. Sci. 2023, 11, 1107835. [Google Scholar] [CrossRef] [Scilit]
- Xue, W.; Li, B.; Yang, Y.; Zhao, H.; Xu, N. Evaluating the effectiveness of new and old kinetic energy conversion from an electric power economics perspective: Evidence on the Shandong Province of China. Energies 2019, 12, 1174. [Google Scholar] [CrossRef] [Scilit]
- Xu, W.; Gong, X. Factor cluster analysis of Qingdao port logistics competitiveness. Logistics 2020, 4, 26. [Google Scholar] [CrossRef] [Scilit]
- Zhang, X.; Fan, X.; He, M. Analysis on the Effects of Global Supply Chain Reconfiguration on China’s High-End Equipment Manufacturing Industry. Int. J. Phys. Distrib. Logist. Manag. 2024, 54, 1–39. [Google Scholar] [CrossRef] [Scilit]
- Dolgui, A.; Ivanov, D. Ripple effect and supply chain disruption management: New trends and research directions. Int. J. Prod. Res. 2021, 59, 102–109. [Google Scholar] [CrossRef] [Scilit]
- Chang, X.; Song, Z.; Zhou, T. Geopolitical risk and global supply chain resilience. Financ. Res. Lett. 2025, 86, 108551. [Google Scholar] [CrossRef] [Scilit]
- Zogaan, W.A.; Ajabnoor, N.; Salamai, A.A. Leveraging deep learning for risk prediction and resilience in supply chains: Insights from critical industries. J. Big Data 2025, 12, 94. [Google Scholar] [CrossRef] [Scilit]
- Atieh Ali, A.A.; Sharabati, A.A.A.; Allahham, M. The Relationship between Supply Chain Resilience and Digital Supply Chain and the Impact on Sustainability: Supply Chain Dynamism as a Moderator. Sustainability 2024, 16, 3082. [Google Scholar] [CrossRef] [Scilit]
- Ponomarov, S.Y.; Holcomb, M.C. Understanding the concept of supply chain resilience. Int. J. Logist. Manag. 2009, 20, 124–143. [Google Scholar] [CrossRef] [Scilit]
- Tang, J.; Han, S.; Wang, J. A comparative analysis of performance-based resilience metrics via a quantitative-qualitative combined approach: Are we measuring the same thing? Int. J. Disaster Risk Sci. 2023, 14, 736–750. [Google Scholar] [CrossRef] [Scilit]
- Ho, W.; Zheng, T.; Yildiz, H. Supply Chain Risk Management: A Literature Review. Int. J. Prod. Res. 2015, 53, 5031–5069. [Google Scholar] [CrossRef] [Scilit]
- Feng, X.; Xu, M.; Li, J. Analysis of China’s Industrial Network Structure and Its Resilience from the Sectoral Perspective. Habitat Int. 2024, 153, 103192. [Google Scholar] [CrossRef] [Scilit]
- Babai, M.Z.; Arampatzis, M.; Hasni, M. On the Use of Machine Learning in Supply Chain Management: A Systematic Review. IMA J. Manag. Math. 2025, 36, 21–49. [Google Scholar] [CrossRef] [Scilit]
- Li, J.; Yi, M.; Sun, Q. Artificial Intelligence and Supply Chain Risk: Mediating Effects of Supply Chain Efficiency and Resilience. Int. Rev. Financ. Anal. 2025, 108, 104700. [Google Scholar] [CrossRef] [Scilit]
- Sattar, M.U.; Dattana, V.; Hasan, R. Enhancing Supply Chain Management: A Comparative Study of Machine Learning Techniques with Cost–Accuracy and ESG-Based Evaluation for Forecasting and Risk Mitigation. Sustainability 2025, 17, 5772. [Google Scholar] [CrossRef] [Scilit]
- Xu, L. Predicting Out-of-Stock Risk Under Delivery Schedules Using Neural Networks. Electronics 2025, 14, 3012. [Google Scholar] [CrossRef] [Scilit]
- Jin, T. Integrated Machine Learning for Enhanced Supply Chain Risk Prediction. In Proceedings of the 2024 8th International Conference on Electronic Information Technology and Computer Engineering (EITCE 2024), Haikou, China, 18–20 October 2024; pp. 1254–1259. [Google Scholar] [CrossRef] [Scilit]
- Rudin, C. Stop explaining black box machine learning models for high stakes decisions and use interpretable models instead. Nat. Mach. Intell. 2019, 1, 206–215. [Google Scholar] [CrossRef] [Scilit] [PubMed]
- Li, M.; Sun, H.; Huang, Y. Shapley value: From cooperative game to explainable artificial intelligence. Auton. Intell. Syst. 2024, 4, 2. [Google Scholar] [CrossRef] [Scilit]
- Arrieta, A.B.; Diaz-Rodriguez, N.; Del Ser, J. Explainable Artificial Intelligence (XAI): Concepts, Taxonomies, Opportunities and Challenges toward Responsible AI. Inf. Fusion 2020, 58, 82–115. [Google Scholar] [CrossRef] [Scilit]
- Lima, B.; Ganga, G.M.D.; Godinho Filho, M. Timing and interdependencies in blockchain capabilities development for supply chain management: A resource-based view perspective. Ind. Manag. Data Syst. 2025, 125, 1645–1685. [Google Scholar] [CrossRef] [Scilit]
- Shiferaw, R.M.; Amentie Kero, C. Dynamic capabilities view practices of business firms: A systematic literature review. Cogent Bus. Manag. 2024, 11, 2336309. [Google Scholar] [CrossRef] [Scilit]
- Su, C.W.; Dong, R.; Qin, M. Do Geopolitical Risks Impede the Global Supply Chain? Financ. Res. Lett. 2025, 85, 107811. [Google Scholar] [CrossRef] [Scilit]
- Zhou, F.; Wen, H. Trade Policy Uncertainty, Development Strategy, and Export Behavior: Evidence from Listed Industrial Companies in China. J. Asian Econ. 2022, 82, 101528. [Google Scholar] [CrossRef] [Scilit]
- Kim, H.S.; Kim, D.H.; Choi, S.Y. Baltic Dry Index Forecast Using Financial Market Data: Machine Learning Methods and SHAP Explanations. PLoS ONE 2025, 20, e0325106. [Google Scholar] [CrossRef] [Scilit]
- Aboushady, N.; Harb, G.; Zaki, C. Aid for Trade and Export Performance of Recipient Countries: The Moderating Role of Institutions. J. Int. Trade Econ. Dev. 2025, 34, 925–953. [Google Scholar] [CrossRef] [Scilit]
- Augustine, M.T. A Survey on Universal Approximation Theorems. arXiv 2024, arXiv:2407.12895. [Google Scholar] [CrossRef] [Scilit]
- Garbin, C.; Zhu, X.; Marques, O. Dropout vs. Batch Normalization: An Empirical Study of Their Impact to Deep Learning. Multimed. Tools Appl. 2020, 79, 12777–12815. [Google Scholar] [CrossRef] [Scilit]
- Dubey, S.R.; Singh, S.K.; Chaudhuri, B.B. Activation Functions in Deep Learning: A Comprehensive Survey and Benchmark. Neurocomputing 2022, 503, 92–108. [Google Scholar] [CrossRef] [Scilit]
- Reyad, M.; Sarhan, A.M.; Arafa, M. A Modified Adam Algorithm for Deep Neural Network Optimization. Neural Comput. Appl. 2023, 35, 17095–17112. [Google Scholar] [CrossRef] [Scilit]
- Deng, A. Time series cross validation: A theoretical result and finite sample performance. Econ. Lett. 2023, 233, 111369. [Google Scholar] [CrossRef] [Scilit]
- Nazri, M.A.W.; Razak, T.R. Towards Deployable and Explainable Deep Learning Models for Paddy Leaf Disease Classification in R: A Comparative Study of CNN Architectures with SHAP and LIME. Expert Syst. Appl. 2026, 300, 130337. [Google Scholar] [CrossRef] [Scilit]
- Li, L.; Lan, L.Y.L.; Huang, L. Selecting representative samples from complex biological datasets using k-medoids clustering. Front. Genet. 2022, 13, 954024. [Google Scholar] [CrossRef] [Scilit]
- Chen, Y.; Huang, J.; Li, Y. Measuring digital transformation in high-end equipment manufacturing: An IPO model-based approach. Sci. Rep. 2025, 15, 27339. [Google Scholar] [CrossRef] [Scilit] [PubMed]
- Benfratello, L.; Bottasso, A.; Piccardo, C. R&D and Export Performance: Exploring Heterogeneity along the Export Intensity Distribution. J. Ind. Bus. Econ. 2022, 49, 189–232. [Google Scholar] [CrossRef] [Scilit]
- Xue, M.; Wang, Y. Does One Belt and One Road Initiative Facilitate China’s Export of Equipment? Post-Communist Econ. 2023, 35, 441–453. [Google Scholar] [CrossRef] [Scilit]
- Wang, C.; Zhang, W.; Qiu, X. Hydrothermal Treatment of Lignocellulosic Biomass towards Low-Carbon Development: Production of High-Value-Added Bioproducts. EnergyChem 2024, 6, 100133. [Google Scholar] [CrossRef] [Scilit]

Disclaimer/Publisher’s Note: The statements, opinions and data contained in all publications are solely those of the individual author(s) and contributor(s) and not of MDPI and/or the editor(s). MDPI and/or the editor(s) disclaim responsibility for any injury to people or property resulting from any ideas, methods, instructions or products referred to in the content. |
© 2026 by the authors. Licensee MDPI, Basel, Switzerland. This article is an open access article distributed under the terms and conditions of the Creative Commons Attribution (CC BY) license.