


Abstract
Against the backdrop of global sustainable development and ecological civilization construction, tourism ecological security at cultural landscape heritage sites faces both opportunities and challenges. This study constructs a cultural landscape heritage tourism ecological security (CLHTES) evaluation system based on the Driver–Pressure–State–Impact–Response (DPSIR) framework. It dynamically assesses CLHTES in the Yangtze River Delta Integrated Demonstration Zone (YRDIDZ) from 2014 to 2023 using the entropy-weighted Technique for Order Preference by Similarity to an Ideal Solution (TOPSIS) and linear stretching transformation, identifies obstacle factors with the obstacle degree model, and predicts CLHTES trends for 2024–2030 using a radial basis function (RBF) neural network. Results show that: (1) The CLHTES index in the YRDIDZ presented a three-stage fluctuating upward trend during 2014–2023, with medium-clustered security levels and divergent evolution across the DPSIR criteria layers; (2) CLHTES obstacles feature a multi-level differentiated structure, with rising barriers in D and P layers, the R layer as the future core obstacle, and high-frequency barriers concentrated in cultural and social indicators; (3) Under the assumption of structural continuity in current trajectories, the conditional trend projection suggests that the CLHTES index of the YRDIDZ may sustain a general upward tendency during 2024–2030, with a possibility of approaching Level VII after 2028; however, these projections should be interpreted as exploratory and scenario-like rather than as robust forecasts, given the short annual series and the absence of exogenous disturbance variables. This study explores tourism-ecology interactions from a social-ecological complex system perspective, supporting synergistic tourism development and ecological protection of cultural landscape heritage.
1. Introduction
Against the grand backdrop of global climate change and the Sustainable Development Goals (SDGs), the research perspective of tourism security has evolved over the past four decades from the previous visitor-centric security issues [1,2] to a focus on the systemic security and resilience of “destinations” as integrated systems [3,4]. This re-recognition of the complex relationship between tourism and the broader environment lies in exploring how to meet the tourism needs of present generations without compromising the ability of future generations to meet their own, thereby achieving a balance between tourism development and natural carrying capacity [5,6]. Such attention to the health and sustainability of the “ecological-economic-social” complex system has greatly enriched the connotation of tourism security research [7].
Cultural landscape heritage is “a common work of nature and humankind” [8], whose core value lies in demonstrating the unique cultural manifestations and their universal significance formed through the long-term co-evolution of humans and nature in specific regions. As one of the world’s most important tourism destinations, these heritage sites are confronted with immense opportunities and severe challenges brought by the tourism industry and climate change [9,10]. High-quality tourism development feeds back into heritage protection and enhances public cultural awareness. The ecological environment’s support for tourism not only manifests in maintaining the integrity and service functions of cultural landscape ecosystems [11] but also contributes to reflecting cultural characteristics harmonious with the environment and promoting value dissemination [12,13]. Consequently, research on the assessment of CLHTES holds important reference value and indicative significance for regional sustainable development [14]. It is worth noting that, compared with other types of heritage sites, cultural landscape heritage tourism depends on a state of high adaptability, coordination, and unity achieved by social, economic, ecological, and cultural elements through energy flow, material cycle, and information transmission [15]; its ecological security entails the systematic protection and management of the interconnections among the aforementioned multi-dimensional indicators [16]. Therefore, how to diagnose the complex safety risks of cultural landscape heritage sites and define safety thresholds constitutes a key issue for realizing the protection, risk management, and sustainable utilization of regional cultural landscape heritage.
This perspective is conceptually aligned with the broader literature on social–ecological systems (SES), resilience, and adaptive governance. Ostrom [17] emphasizes that the sustainability of complex systems depends on the interaction among resource systems, governance arrangements, users, and ecological conditions, rather than on any single subsystem in isolation. Likewise, resilience-oriented scholarship highlights that coupled systems should be understood in terms of their capacity to absorb disturbance, adapt, and reorganize under change, while adaptive governance studies stress the importance of flexible, multi-actor responses under uncertainty [18]. In the context of cultural landscape heritage tourism, these insights are particularly relevant because heritage areas are shaped not only by ecological carrying capacity, but also by cultural continuity, tourism development, and institutional response. Recent studies on cultural landscapes and agricultural heritage systems have similarly argued that such landscapes should be treated as dynamic systems whose resilience depends on the coordinated management of environmental, cultural, and socio-economic pressures [19]. Against this theoretical background, the DPSIR-based indicator framework adopted in this study can be understood as an operational tool for tracing the evolving balance among cultural resources, tourism dynamics, ecological conditions, and governance responses over time.
To date, global studies on CLHTES have mainly focused on topics such as the construction of CLHTES assessment systems [20], carrying capacity evaluation [21], safety grade classification [22], spatiotemporal distribution evolution [23], influencing factor analysis [24], variation trend prediction [25], and dynamic early warning [26]. Research scales encompass not only artificially divided administrative regions, such as prefectural-level cities [27], urban agglomerations [28], and countries [29], but also naturally formed specific regions, such as grasslands [30], lakes [31], coastal areas [32], and arid regions [33]. Various research frameworks have been adopted, including the PSR model [34], CSAED model [35], EES model [36], DPSIR model [37,38], and fuzzy matter-element model [39]. Among these, the DPSIR model, developed by the European Environment Agency (EEA) in the 1990s through optimizing the earlier PSR and DSR models, addresses the logical gaps in the original models and establishes a more comprehensive closed-loop analytical framework. Its core lies in systematically identifying the causes, current status, and response directions of environmental issues by sorting out the causal chain of “human activities-environmental systems-social feedbacks,” thereby providing logical support for policy formulation, resource management, and ecological protection [40,41]. As a commonly used assessment index system model for environmental systems, it covers social, economic, environmental, and other elements, reflecting and revealing the continuous feedback mechanisms between subsystems from a systematic perspective. To date, it has been widely applied in fields such as tourism ecological security assessment, wetland ecological security assessment, low-carbon urban ecological security assessment, and heritage site tourism ecological security assessment [42]. However, existing studies have not paid sufficient attention to the fact that current assessment systems focus more on social, economic, and ecological indicators, while lacking attention to cultural indicators. CLHTES is a comprehensive “social-economic-ecological-cultural” complex system, the absence of cultural dimension indicators makes it difficult for assessment systems to fully characterize the complex nature of CLHTES. This not only fails to accurately capture the dynamic coupling relationship between cultural inheritance and tourism development but also hinders the reflection of the supporting role of cultural landscape security in regional sustainable tourism development. Compared with conventional DPSIR applications in tourism ecological security, the present framework advances the field in three respects. First, it reconceptualises CLHTES as a four-dimensional social–economic–ecological–cultural system, incorporating cultural indicators that have been systematically neglected in prior assessments. Second, it introduces UGC-based sentiment analysis as an alternative to questionnaire-based cultural measurement, improving both temporal coverage and sample representativeness. Third, it integrates historical assessment, obstacle diagnosis, and future prediction into a unified longitudinal analytical chain, thereby moving beyond the predominantly cross-sectional designs of existing studies. These innovations collectively address identified theoretical and empirical gaps and carry direct implications for heritage governance and sustainable tourism planning.
In terms of research methods, the AHP method [43], ecological footprint method [44], and TOPSIS method [45], among others, have been widely applied in security assessment. For exploring influencing factors, the main methods include the comprehensive index method [46], obstacle degree model [47], grey relational analysis model [48], and geographical detector [49]. For trend prediction, the methods encompass the grey GM (1, 1) prediction model [50] and RBF neural network [51].
The Jiangnan region of China, where the YRDIDZ is situated, served as a core supply base for imperial taxation, a prestigious gathering hub for literati and scholars, and a foundational supporting area for prosperous urban development in ancient China. The extensive ecological water network interconnects numerous scenic heritage resources and everyday landscapes, including native settlements, characteristic pastoral areas, and mulberry-dike agriculture. Coupled with intangible cultural heritages (ICH) such as local traditional scientific knowledge and practical wisdom in resource management, these elements collectively construct a rural cultural landscape network featured by human–water symbiosis in the YRDIDZ. Abundant natural resources, long-standing cultural traditions, and heritage sites of various grades within the region have boosted the development of the local tourism industry [52,53]. Meanwhile, however, the cultural landscapes in the YRDIDZ are under tremendous pressure during tourism development and conservation [54], such as the loss of authenticity caused by excessive commercialization of some cultural landscapes. In particular, the ecological environment has been degraded under the impacts of climate change and intensified anthropogenic disturbances. Therefore, how to maximally safeguard the regional CLHTES while ensuring the sound development of the tourism industry and economic benefits has become an urgent issue to be addressed in the conservation and management of rural landscape heritage.
This study has three critical aims: (1) to establish and innovate a novel CLHTES evaluation indicator system based on the DPSIR framework; (2) to explore the dynamic evolution of the state of CLHTES; and (3) to identify security obstacle factors and predict the future variation trend of the security index. Furthermore, cultural landscape heritage in YRDIDZ is selected as the study area, and several methods, including the improved entropy weight method, obstacle degree model, and RBF neural network prediction model, are applied to explore the temporal evolution, obstacle factors, and trend prediction of CLHTES.
This study presents innovations as well as theoretical and practical contributions. First, it improves the DPSIR conceptual framework, integrates cultural indicators, and establishes a regional evaluation indicator system for CLHTES. Second, it utilizes online big data from Ctrip Travel Network User-Generated Content (UGC) and semantic analysis to obtain data for some cultural indicators. Compared with the traditional questionnaire survey method, the long-term and large-sample tourist review data improve the accuracy of ecological security analysis. Third, the constructed long-term full-chain analytical framework of “historical evolution-current situation assessment-future prediction” not only provides long-term data support for identifying abrupt change nodes of security levels and key influencing factors before and after the implementation of regional strategies but also offers a scientific basis for the forward-looking planning of CLHTES under the background of cross-regional collaborative governance.
2. Materials and Methods
2.1. Methodology
As shown in Figure 1, this study takes YRDIDZ as its research area. Firstly, it constructs the CLHTES evaluation system, establishing a three-tier evaluation framework comprising the criterion layer (5 items), factor layer (15 items), and indicator layer (35 items), and identifies statistical yearbooks of the corresponding years, regional development bulletins, and Ctrip UGC data as data sources. On this basis, the entropy-weighted TOPSIS method and linear stretching transformation method are employed to calculate the CLHTES index of YRDIDZ from 2014 to 2023, which is further classified into 7 security levels; meanwhile, the temporal evolution characteristics of the security status during this period are visualized separately from the regional and criterion layer perspectives. Subsequently, based on the obstacle degree model, key obstacle factors are diagnosed from the criterion layer, factor layer, and indicator layer, and the dominant types of obstacle factors at different layers are presented by means of radar charts and frequency statistics charts of the top 5 obstacle factors. Finally, an RBF neural network model with a core framework of “three-layer architecture + multiple quadratic kernel functions + linear output” is constructed; the model training is completed through training set sample selection, weight solving, and parameter optimization. After verifying the model accuracy using R2, MAE, and RMSE, this study predicts the evolution trend of the CLHTES index of YRDIDZ from 2024 to 2030 and plots the corresponding prediction diagram.
Figure 1.
Methodological framework.
2.2. Materials
2.2.1. Study Area
YRDIDZ is a key platform for implementing the Yangtze River Delta integration strategy [55]. As shown in Figure 2, it covers a total area of approximately 2300 km2 (including 350 km2 of water area), with a permanent population of 3.5153 million and a regional GDP of CNY 472.549 billion in 2023. The zone is rich in cultural landscape tourism resources, including historic towns, immovable cultural relics, intangible cultural heritage, and integrated ecological–cultural tourism experiences. At the same time, rapid tourism development, urbanization, and ecological vulnerability have increased pressure on local cultural landscape heritage, making the assessment of CLHTES particularly important in this region.
Figure 2.
Study area map (YRDIDZ).
2.2.2. Data Sources
The research data are mainly derived from the Statistical Yearbooks of the YRDIDZ from 2015 to 2024, covering official documents including Bulletins on National Economic and Social Development, Bulletins on Environmental Quality Status, Lists of Representative ICH Projects, and Lists of Inheritors of Representative ICH Projects of the aforementioned regions from 2014 to 2023. The study period of 2014–2023 was determined with reference to the formal establishment of the YRDIDZ as a national-level demonstration zone in November 2019, which serves as the structural anchor of the research design. The endpoint of 2023 reflects the latest year for which complete and officially verified statistical data were available at the time of this study. A five-year pre-establishment baseline (2014–2018) was incorporated symmetrically to enable comparison of CLHTES dynamics before and after this critical policy milestone, yielding a continuous ten-year panel dataset that ensures temporal completeness and cross-period comparability. Among them, part of the data was collated and calculated after acquiring primary data from the official websites of the corresponding administrative regions. Only five observations were missing out of 1050 indicator-year-region entries, accounting for approximately 0.48% of the complete dataset. These missing values involved S2 for Qingpu in 2014, S4 for Qingpu in 2014, S4 for Jiashan in 2014, P3 for Jiashan in 2015, and R6 for Wujiang in 2023. For these isolated single-year gaps, linear interpolation was adopted to maintain temporal continuity. Because the missing proportion was very low and most gaps were outside the main inflection years of the overall CLHTES trajectory, the influence on entropy weighting and long-term trend identification is considered limited. Nevertheless, for relatively volatile indicators, interpolation may smooth short-term fluctuations to some extent, and this potential bias is taken into account in the discussion of the study limitations.
In the selection of cultural indicators for the impact (I) criterion layer, positive/negative evaluation data of cultural landscape heritage tourism (I4/I5) are newly incorporated to reflect tourists’ satisfaction with cultural landscape heritage tourism in the region, providing decision-making support for tourist management and facility optimization at heritage sites. To quantify tourists’ cultural perception and experience quality of cultural landscape heritage sites (corresponding to indicators I4 and I5 in the CLHTES evaluation system), we collected user-generated content (UGC) tourist reviews from Ctrip Travel Network, the largest online tourism platform in China, using Python 3.13 web crawler technology. To ensure the relevance and temporal consistency of the data, we established a two-level filtering strategy. First, at the attraction level, we dynamically identified eligible Grade A tourist attractions in the YRDIDZ for each year according to the official annual lists for Qingpu District, Wujiang District, and Jiashan County during 2014–2023, and excluded attractions unrelated to cultural landscape heritage tourism. Second, at the review level, we excluded invalid content, including off-site information irrelevant to the in-attraction tourism experience, meaningless or extremely short texts, duplicate content, and fake commercial reviews. Through this process, 7216 original reviews were collected, and 5347 valid reviews covering the 2014–2023 study period were retained for analysis. The detailed annual distribution of eligible attractions and valid reviews is provided in Table S1.
We adopted the BosonNLP dictionary-based sentiment analysis method to process the review texts. The core workflow included: (1) text preprocessing through Jieba word segmentation, stop-word removal, and noise cleaning; (2) calculating a sentiment score for each review on a scale from 0 to 1, with higher values indicating more positive evaluations; (3) classifying reviews with sentiment scores > 0.6 as positive and reviews with sentiment scores < 0.4 as negative, and aggregating their annual counts as indicators I4 and I5, respectively, while treating reviews with scores between 0.4 and 0.6 as neutral; and (4) extracting high-frequency sentiment expressions from the positive and negative corpora and further standardizing and grouping them into semantic categories for interpretive analysis, as reported in Table 1. High-frequency expressions were independently standardized and categorized by two researchers with relevant expertise, and the resulting classification showed good reliability (Cohen’s Kappa = 0.89; see Note S1 for details). It should be noted that indicators I4 and I5 were constructed from the annual counts of review-level positive and negative classifications, rather than directly from word-frequency statistics. The high-frequency word categories in Table 1 were used only to interpret the substantive content and semantic structure of tourist evaluations. Stratified random-sampling manual annotation showed that the consistency rate between the sentiment analysis results and manual annotation reached 92.2%, with an inter-annotator Cohen’s Kappa coefficient of 0.88. In addition, a robustness test using SnowNLP 0.12.3 as an alternative sentiment analysis method yielded Pearson correlation coefficients of 0.983 for annual positive review counts and 0.981 for annual negative review counts, further confirming the stability of the sentiment classification results. Compared with questionnaire-based approaches, online tourist review data provide larger-scale and longer-term feedback on tourist perceptions and experience, thereby improving the temporal coverage and empirical richness of cultural evaluation [56].
Table 1.
High-frequency sentiment expressions and semantic categories derived from tourist reviews of cultural landscape heritage attractions in the YRDIDZ.
2.2.3. Evaluation Indicator System
Based on the DPSIR model, this study constructs an evaluation indicator system for CLHTES in YRDIDZ, defining the zone as a four-dimensional composite system integrating social, economic, ecological, and cultural dimensions. Drawing on existing research findings and the practical development context of the demonstration zone, a total of 35 evaluation indicators were screened from five criterion layers, which correspond to 15 factor layers, thus completing the construction of the CLHTES evaluation indicator system (Table 2).
Table 2.
Evaluation indicator system for CLHTES in YRDIDZ.
In this study, the “cultural” dimension is operationalized through three interrelated components: tangible cultural heritage endowment and protection, intangible cultural heritage (ICH) inheritance and living transmission, and cultural tourism development and experiential perception. Specifically, the first component is represented by S6, S7, R6, and R7; the second by S8, S9, R5, and I6; and the third by D5, D6, P5, P6, I4, and I5. Together, these indicators capture heritage resources and protection efforts, the continuity and social embeddedness of living traditions, and the developmental and experiential dimensions of cultural tourism. In this way, the cultural dimension of CLHTES is understood as a dynamic and multi-layered system rather than a static stock of heritage assets.
In addition to literature support, the selection and retention of indicators in this study followed four practical criteria. First, each indicator needed to correspond clearly to the DPSIR causal logic and to the social–economic–ecological–cultural characteristics of CLHTES. Second, the indicator had to be supported by relatively continuous and comparable data for the study period from 2014 to 2023. Third, the indicator needed to be policy-relevant and interpretable so that the evaluation results could inform regional governance and management. Fourth, obvious conceptual duplication was avoided as far as possible, while preserving the multidimensional structure of the indicator system.
We recognize that some indicators are conceptually related, particularly among economic and cultural tourism variables. However, potentially overlapping indicators were retained when they reflected different policy-relevant meanings within the DPSIR framework. For example, D2 reflects broader structural upgrading of the tertiary sector, whereas D6 captures the specific growth of the cultural tourism economy. In this sense, partial co-movement among some indicators is consistent with the coupled nature of the CLHTES system rather than evidence of exact duplication.
The operational mechanism of this model follows a closed-loop transmission logic of “D-P-S-I-R”: socioeconomic development and the upgrading of cultural and tourism industries act as core long-term drivers (D), which exacerbate the pressure (P) on the CLHTES environment of the zone. Such pressures directly act on the conservation and inheritance state (S) of cultural landscape heritage, triggering changes in its state characteristics, and then exert a cascade of impacts (I) on the regional CLHTES system. This in turn urges local governments and relevant stakeholders to implement targeted regulation and optimization measures, thereby forming a response (R) mechanism that ultimately serves the core goal of sustainable development of cultural landscape heritage tourism in the zone.
It should be noted that the allocation of indicators across the DPSIR categories in this study was based on their functional role in the causal chain of the system, rather than solely on the surface form of the variables. In the context of cultural landscape heritage tourism, the extended DPSIR framework is intended to capture how socioeconomic and tourism drivers generate pressure on the system, how these pressures affect the ecological, cultural, and tourism state of the destination, how such changes produce downstream consequences, and how governance and social actions respond to them. Accordingly, indicators were assigned to the Driver, Pressure, State, Impact, and Response dimensions according to their theoretical function in this dynamic process.
In particular, the tourist review-based indicators I4 and I5 were classified under the Impact dimension. Although these indicators are perception-based, they were not used to describe the baseline state of the system itself. Instead, they were used to reflect the social and experiential consequences of changes in cultural landscape heritage tourism as expressed through tourists’ positive and negative evaluations. In this sense, these indicators capture the downstream effects of the state of the system on tourism experience and destination perception, and are therefore conceptually consistent with the “Impact” category in the extended DPSIR framework.
To reduce potential redundancy among indicators and to examine the structural consistency of the extended DPSIR indicator system, supplementary statistical diagnostics were conducted before the comprehensive evaluation. First, a Pearson correlation analysis was performed for the 35 indicators across the 30 region-year observations to examine possible redundancy among variables, especially among economic-, tourism-, and cultural-related indicators that might be theoretically correlated. The results indicate that although several indicator pairs exhibit moderate to strong correlations, the overall system does not show complete informational overlap or collapse into a small set of redundant variables. Across the full set of 595 possible indicator pairs, only 51 pairs showed Pearson correlations above 0.70, accounting for approximately 8.6% of all possible pairs. These results suggest the presence of localized redundancy risk rather than pervasive redundancy that would invalidate the subsequent comprehensive evaluation. A summary of representative highly correlated indicator pairs and the rationale for their retention is provided in Table S2.
Second, a supplementary principal component analysis (PCA) was conducted to assess the structural consistency of the extended DPSIR framework after incorporating cultural indicators. Because the number of indicators exceeds the number of observations in the present dataset, PCA was used as an auxiliary diagnostic tool rather than as a substitute for the theory-driven indicator framework. The results show that the first four principal components explain approximately 78.1% of the total variance, indicating that the indicator system retains a relatively stable multidimensional structure. In particular, the cultural indicators introduced in this study contribute additional informational content rather than merely duplicating existing economic, social, or environmental dimensions. A summary of the PCA results is reported in Table S3.
It should also be noted that formal variance inflation factor (VIF) testing was not adopted as the primary diagnostic method in this study. This is because the present research aims at comprehensive evaluation rather than regression estimation, and the limited sample size relative to the number of indicators makes formal VIF-based assessment less stable and less informative in this context. Therefore, correlation-based redundancy diagnostics and supplementary PCA, combined with theoretical screening during indicator selection, were used to assess redundancy and structural reasonableness. These additional checks increase the transparency and robustness of the indicator system used in the entropy-weighted TOPSIS evaluation.
2.3. Methods
2.3.1. Entropy-Weighted TOPSIS Method
The entropy-weighted TOPSIS method integrates the entropy weight method (EWM) for objective weighting with the Technique for Order Preference by Similarity to an Ideal Solution (TOPSIS) for alternative ranking. EWM quantifies information entropy to objectively derive indicator weights, thereby eliminating the subjective bias inherent in expert scoring methods and enhancing discriminability. Concurrently, TOPSIS evaluates alternatives by calculating their Euclidean distances from both the Positive Ideal Solution (PIS) and Negative Ideal Solution (NIS), identifying the optimal scenario as the closest to the PIS and farthest from the NIS. This hybrid framework offers robust scientific rigor by combining objective weighting with ideal-proximity ranking. Furthermore, it imposes no restrictive assumptions regarding data distribution or sample size, enabling an intuitive, authentic, and reliable assessment of multi-attribute decision-making problems [70].
Therefore, this study adopts the entropy-weighted TOPSIS method to assess the CLHTES of YRDIDZ. The specific steps and formulas are presented as follows:
- (1)
- After completing data preparation and constructing the original evaluation matrix, the range method is adopted to implement positive transformation and standardization of the raw data, thereby eliminating the dimensional influence among indicators. Specifically, positive indicators follow the rule of the larger the value, the better, while negative indicators follow the rule of the smaller the value, the better.
Original evaluation matrix:
For positive indicators:
For negative indicators:
where denotes the row index for region-year combinations, with ; represents the total number of region-year combinations for standardized values, which is 30 in this study; denotes the column index for indicator items, with ; represents the total number of indicators, which is 35 in this study; is the standardized value of the indicator at row and column ; is the original value of the indicator at row and column ; and are the minimum and maximum values of the original data for the -th column indicator, respectively.
- (2)
- Via the EWM, calculate the weights of the evaluation indicators:
- (3)
- Construct the weighted standardized matrix and determine the PIS and NIS corresponding to the i-th row (region-year combination):
- (4)
- Calculate the relative closeness degree, i.e., the initial CLHTES index of YRDIDZ:
To examine the robustness of the entropy-weighted TOPSIS results, this study additionally compared the main CLHTES patterns under an equal-weight TOPSIS scheme.
2.3.2. CLHTES Level Classification Standards and Linear Stretching Transformation
Currently, the academic community has not yet reached a consensus on the classification criteria for CLHTES evaluation. Based on relevant literature [22,71] and the practical context of the YRDIDZ, this study divides the CLHTES status into seven distinct levels (Table 3).
Table 3.
Level classification criteria for CLHTES evaluation in YRDIDZ.
To achieve the discriminability and practical application value of level classification while preserving the relative superiority–inferiority relationship of security levels among various evaluation objects, this study adopts the linear stretching transformation method to standardize the original relative closeness degrees, thereby obtaining the final CLHTES index of YRDIDZ.
The rationality of this transformation is reflected in three aspects. First, linear stretching is a monotonic linear mapping, which can strictly maintain the consistency of the order relationship of the original relative closeness degrees, avoid distorting the inherent hierarchical correlation among evaluation units, and conform to the objectivity principle in processing multi-attribute decision-making results. Second, the transformation process expands the data range only through proportional scaling, without altering the discrete characteristics and inherent correlation laws of the original data, thus ensuring that the mapping logic between the security index and each evaluation indicator remains intact. Third, as a classic method for standardizing multi-attribute decision-making results, this transformation features clear logic and high interpretability, without introducing additional subjective deviations. Moreover, it has already formed a mature application foundation in fields such as geographical environment evaluation and risk grade classification, thereby possessing sufficient academic rationality [72]. The general expression of the linear stretching transformation method is as follows:
where denotes the initial security index of the evaluation object in the -th row; represents the final security index after transformation; and are the maximum and minimum values of the initial security index before transformation, respectively; and are the maximum and minimum values of the final security index after transformation, respectively.
It should be emphasized that the linear stretching transformation in this study was used primarily to enhance interpretability and comparative discrimination in the presentation of CLHTES results, rather than to alter the substantive evaluation outcome. Because the transformation is monotonic, it preserves the original ranking and relative superiority-inferiority relationships of the entropy-weighted TOPSIS scores, while facilitating clearer mapping of the index values onto the security-level categories.
2.3.3. Obstacle Degree Model
The CLHTES index of YRDIDZ can only reflect the status of its security level, but fails to accurately identify the obstacle factors restricting its development. Compared with traditional quantitative methods, which are applicable to external mechanism analysis, the obstacle degree model is suitable for analyzing internal influencing factors of the system and their intensity of action, and can well reflect the internal operation laws of CLHTES [73,74]. In view of this, this study establishes an obstacle factor diagnosis model for the demonstration zone to clarify the obstacle factors restricting the improvement of CLHTES level, with the formula as follows:
where denotes the standardized value of the indicator at row and column ; is the indicator deviation degree; represents the factor contribution degree; refers to the obstacle degree of the indicator-layer indicator to CLHTES; refers to the obstacle degree of the upper-level factor-layer indicator to CLHTES. By the same token, the obstacle degree of the criterion-layer indicators can be obtained by summing up the obstacle degrees of the factor-layer indicators upward in accordance with the indicator hierarchical relationship; a higher obstacle degree indicates that the corresponding indicator is in urgent need of optimization.
2.3.4. RBF Neural Network
This study adopts the RBF neural network and combines it with data preprocessing and parameter optimization strategies [51] to achieve medium- and long-term trend prediction of the CLHTES index in YRDIDZ. The specific steps are as follows:
- (1)
- Construction of the RBF neural network model
A three-layer RBF structure is adopted to achieve nonlinear fitting and prediction, whose core lies in mapping the input space to a high-dimensional feature space via radial basis functions, followed by output generation through linear combination.
Hidden layer kernel function: the multiquadric function is adopted as the radial basis kernel function, and the formula is as follows:
where denotes the input vector; is the center vector of the -th hidden layer neuron; represents the kernel width parameter (which controls the radial action range of the function).
Output layer calculation: the output is a linear combination of the hidden layer outputs, and the formula is as follows:
where denotes the number of hidden layer neurons; is the output layer weight; represents the predicted output.
- (2)
- Training and parameter optimization of the RBF model
First, samples are randomly selected from the training set to serve as the hidden layer centers .
Second, the output layer weights are solved via the least squares method. The hidden layer output matrix has a dimension of , and its elements are defined as . This matrix is then substituted into the regularized pseudoinverse formula:
where is the weight vector; denotes the training set label; represents the transpose of the hidden layer output matrix (the superscript is the transpose operator). The transpose operation swaps the rows and columns of a matrix, which is an essential matrix operation for solving weights via the least squares method.
Third, the grid search method is employed to search through the number of hidden layer neurons , kernel width parameter , and random seeds. The optimal model is selected using (coefficient of determination), MAE (mean absolute error), and RMSE (root mean square error) of the validation set as evaluation metrics:
where denotes the mean value of the validation set labels; represents the number of samples.
Finally, data processing was conducted using Python functions, and inter-regional trend differences were visualized as line charts via Origin. Under the original modeling framework, model performance was evaluated using R2, MAE, and RMSE. Given that the annual CLHTES series for 2014–2023 contains only ten observations, however, the RBF neural network may be vulnerable to overfitting if model complexity is not carefully controlled. Therefore, in the revised analysis, predictive robustness was further assessed using a rolling-origin out-of-sample testing strategy, which preserves temporal order and repeatedly evaluates model performance on held-out years. Specifically, the model was trained on earlier observations and tested on subsequent years in an expanding-window manner. In addition, two simpler benchmark models were introduced for comparison: a linear trend model and an ARIMA model. The purpose of this comparison is not to replace the original RBF-based projection in the main text, but to assess whether the nonlinear model captures temporal variation more effectively than parsimonious alternatives under short-sample conditions. Predictive performance in the revised comparison was evaluated using MAE, RMSE, and MAPE. Therefore, the validation results reported in this study should be interpreted as evidence of limited short-sample predictive performance rather than conclusive proof of strong long-term forecasting ability. Detailed year-by-year rolling-origin prediction results for the overall YRDIDZ series are provided in the Supplementary Materials (Table S5), while the summary predictive performance and regional robustness checks are reported in Tables S6 and S7.
2.3.5. Bootstrap-Based Uncertainty Analysis
To assess the uncertainty of the composite CLHTES index, this study conducted a bootstrap-based uncertainty analysis. The indicator set was resampled with replacement for 1000 iterations, and in each iteration the entropy-weighted TOPSIS procedure and linear stretching transformation were recalculated to obtain bootstrap replicates of the CLHTES index. Based on these replicates, 95% confidence intervals were estimated for the annual overall CLHTES index of the YRDIDZ and for the regional mean indices of Qingpu, Jiashan, and Wujiang. In the revised uncertainty tables, the point estimates correspond to the main-text CLHTES index values reported in the manuscript, while the bootstrap procedure is used to quantify uncertainty around these reported values. This procedure was used to evaluate the robustness of the main temporal and regional patterns reported in the study.
3. Results
3.1. Analysis of the Evolution of CLHTES Status
3.1.1. Temporal Evolutionary Characteristics of the Comprehensive CLHTES Index
Based on the entropy-weighted TOPSIS and linear stretching transformation methods, this study measured the CLHTES indices for the two districts and one county from 2014 to 2023. The overall CLHTES level of the YRDIDZ was represented by the arithmetic mean of the three sub-regions in order to characterize the integrated temporal evolution of the demonstration zone as a cross-jurisdictional governance unit.
As shown in Figure 3, from the perspective of the overall evolutionary trend, the CLHTES in the YRDIDZ presented a continuous improvement with a fluctuating upward pattern during 2014–2023. The security index climbed from 0.4124 in 2014 to 0.6315 in 2023, and the corresponding security level was upgraded from Level III to Level V. No extreme states (i.e., Level I or Level VII) occurred, revealing a typical characteristic of mid-range clustering. Thus, the CLHTES status of the YRDIDZ still retains considerable potential for further improvement and optimization.
Figure 3.
Temporal evolution of the overall CLHTES index in the YRDIDZ, 2014–2023. Error bars denote bootstrap-based 95% confidence intervals derived from 1000 bootstrap resamples. The shaded bands indicate the corresponding security-level intervals.
Based on the fluctuation characteristics of the index, the evolution of the security status of the YRDIDZ during the study period can be divided into three stages. The first stage was the sensitive fluctuation period from 2014 to 2016. During this period, the CLHTES level of the YRDIDZ remained consistently at Level III, with the security index dropping to the lowest value of the study period (0.3989) in 2016. The second stage was the rapid improvement period from 2017 to 2019. Compared with the first stage, the security status of the YRDIDZ achieved substantial improvement: the security index increased from 0.4347 to 0.6054, and the corresponding security level completed a stepwise leap from Level III to Level IV and then to Level V. The third stage was the steady growth period from 2020 to 2023. The security index of the YRDIDZ showed an evolutionary trend of rising with fluctuations. Although the index fell back to 0.5868 in 2020, the cumulative increase of the index during the study period reached 0.0447, and the security level remained stable at Level V.
A bootstrap-based uncertainty analysis was further conducted to evaluate the robustness of the composite CLHTES index. The results indicate that the overall upward trend of CLHTES in the YRDIDZ during 2014–2023 remains stable under repeated indicator resampling, although the confidence intervals of adjacent years partly overlap. In particular, the annual overall index shows a general upward shift from the earlier to the later stage of the study period, supporting the robustness of the main temporal trend identified in this study.
To complement the zone-level synthesis, sub-regional heterogeneity was further examined for Qingpu, Wujiang, and Jiashan (Figure S1 in the Supplementary Materials). The CLHTES indices of the three sub-regions all improved to varying degrees during 2014–2023, but clear differences were observed in their evolutionary trajectories and improvement effects. Collectively, the security levels of the three sub-regions spanned five levels, from Level II to Level VI, during the study period, also showing a typical hierarchical pattern of “agglomeration in the middle”. In terms of mean CLHTES values, the three sub-regions ranked as follows: Jiashan (0.6075) > Qingpu (0.5380) > Wujiang (0.4134), corresponding to Level V, Level IV, and Level III, respectively. This indicates that Jiashan maintained a comparatively higher CLHTES level than Qingpu and Wujiang during the study period. More specifically, the three sub-regions generally followed a temporal pattern similar to that of the overall YRDIDZ, which can also be divided into three stages: a relatively sensitive fluctuation period during 2014–2016, a rapid improvement period during 2017–2019, and a steady growth period during 2020–2023. However, their specific security levels and fluctuation amplitudes were not completely consistent. Jiashan remained at a relatively high level throughout most of the study period, Qingpu showed a steady upward trend, whereas Wujiang exhibited more pronounced fluctuations, reflecting significant intra-regional heterogeneity within the demonstration zone.
3.1.2. Temporal Evolutionary Characteristics of the Comprehensive CLHTES Index at the Criterion Layer
As shown in Figure 4, the D index of CLHTES in the YRDIDZ exhibited a fluctuating downward trend from 2014 to 2023, decreasing from 0.6867 (Level VI) in 2014 to 0.4648 (Level IV) in 2023, indicating a weakening security status. The P index showed relatively small fluctuations, maintaining a stable evolutionary pattern and consistently high security levels. It reached 0.7380 (Level VI) in 2014, peaked at approximately 0.8 (Level VII) in 2020 and 2022, and slightly declined to 0.6758 (Level VI) in 2023, representing the optimal security dimension among all criteria layers in the YRDIDZ. The S index displayed a steady upward evolutionary trend, rising from 0.3858 (Level III) in 2014 to 0.6039 (Level V) in 2023. The I index exhibited the most dramatic fluctuations, with an overall upward trajectory. It was only 0.2039 (Level I) in 2014, surged to 0.7948 (Level VII) in 2019, and receded to 0.5496 (Level V) in 2023. The R index demonstrated a fluctuating upward evolutionary trend, increasing from 0.3076 (Level II) in 2014 to 0.6011 (Level V) in 2023.
Figure 4.
Temporal Evolution Diagram of CLHTES Index at the Criterion Layer in the YRDIDZ, 2014–2023. The five lines represent the Driver (D), Pressure (P), State (S), Impact (I), and Response (R) dimensions, respectively. Index values are interpreted according to the seven-level classification system shown in Table 3.
3.2. Diagnosis of Obstacle Factors for CLHTES
3.2.1. Analysis of Obstacle Degree at the Criterion Layer
Based on the calculation results derived from the obstacle degree model, this study constructs a radar chart illustrating the criterion-layer obstacle factors affecting the CLHTES of the YRDIDZ over the period 2014–2023 (Figure 5).
Figure 5.
Radar chart of obstacle factors at the criterion layer in the YRDIDZ, 2014–2023.
The results show that the obstacle degrees of the D and P criterion layers presented an overall upward trend, while those of the S, I and R criterion layers exhibited a general downward trend. Among them, the R criterion layer will become the core obstacle restricting the improvement of the YRDIDZ’s CLHTES in the future. A comparison of the obstacle degree rankings at the criterion layer between 2014 and 2023 shows the following: in 2014, the obstacle degrees were ranked from high to low in the order of R (33.30%) > S (27.63%) > I (21.24%) > D (10.27%) > P (7.57%); in 2023, the ranking was adjusted to R (28.62%) > S (23.15%) > D (18.32%) > I (18.26%) > P (11.65%). Notably, the obstacle degree of the D criterion layer surpassed that of the I criterion layer for the first time in 2023; prior to this period (2014–2022), the obstacle degree ranking at the criterion layer had remained stable in the sequence of R > S > I > D > P.
3.2.2. Analysis of Obstacle Degree at the Factor Layer
By counting the occurrence frequency of the factor layers corresponding to the top five indicator layers in terms of obstacle degree, a frequency statistics chart of the top five obstacle factors at the factor layer is plotted for the YRDIDZ (Figure 6).
Figure 6.
Frequency analysis of the top 5 obstacle factors at the factor layer in the YRDIDZ, 2014–2023.
From an overall perspective, the obstacle factors at the factor layer of the CLHTES in the YRDIDZ are dominated by cultural-type factors and social-type factors. Among them, cultural-type factors accumulated 36 occurrences, specifically including Q8 (14 occurrences), Q15 (13 occurrences), and Q11 (9 occurrences); social-type factors accumulated 14 occurrences, including Q14 (8 occurrences) and Q2 (6 occurrences).
The obstructive effects of cultural-type and social-type factors essentially reflect the lag in the construction of soft mechanisms during cross-regional collaborative governance. In contrast, the weaker obstacles posed by economic-type and environmental-type factors stem from sufficient support provided by sound regional hard infrastructure and guarantees. This pattern provides clear directions for overcoming security constraints through institutional innovation and coordinated governance in subsequent stages.
3.2.3. Analysis of Obstacle Degree at the Indicator Layer
As shown in Figure 7, from an overall perspective, the high-frequency obstacle factors that ranked among the top five during the study period were in the order of: S7, R4, I4, R3, and D4. Accordingly, the primary obstacle factors affecting CLHTES in the YRDIDZ are concentrated in cultural and social indicators, while the constraints from economic and environmental indicators are relatively weak. This reflects a structural pattern characterized by sufficient hard infrastructure support but lagging soft governance mechanisms.
Figure 7.
Frequency statistics of the top 5 obstacle factors at the indicator layer in the YRDIDZ, 2014–2023.
Further analysis of the criterion-layer attribution of the annual TOP5 obstacle factors during the period 2014–2023 reveals that the core obstacle factors were stably concentrated in the three criterion layers of S, I, and R. By comparing the evolution of the TOP5 obstacle factors in the YRDIDZ between 2014 and 2023, significant indicator transformation characteristics can be identified: the overall obstacle factors of the YRDIDZ show a trend of shifting from R indicators to D and S indicators. Specifically, the core obstacle factors changed from R3 and R6 in 2014 to D4 and S6 in 2023.
3.3. Trend Prediction of CLHTES
Based on the RBF neural network, this study predicted CLHTES trends for 2024–2030 (Figure 8). To improve predictive robustness under the short annual series, the original RBF analysis was supplemented with rolling-origin out-of-sample testing and benchmark comparisons against a linear trend model and an ARIMA model. The optimal hyperparameter settings of the original RBF model under the selected modelling framework are reported in Table 4. As shown in Table 5, the linear trend and ARIMA models yielded lower out-of-sample errors than the RBF model for the overall YRDIDZ series, indicating that a high in-sample goodness-of-fit does not necessarily translate into stronger out-of-sample generalisability under short-sample conditions. The prediction results presented below should therefore be interpreted cautiously and are used primarily to indicate the possible direction of future evolution under current trajectories.
Figure 8.
Predicted temporal evolution of the CLHTES index in the YRDIDZ from 2024 to 2030 based on the RBF neural network model. The curve shows the projected annual CLHTES values, and the corresponding security levels are interpreted according to the classification system in Table 3.
Table 4.
Optimal hyperparameter settings of the RBF model for the overall YRDIDZ series.
Table 5.
Rolling-origin out-of-sample predictive performance for the YRDIDZ CLHTES series.
From an overall perspective, under the assumption of structural continuity in the underlying socioeconomic and governance conditions, the conditional trend projection based on the RBF neural network suggests that the CLHTES index of the YRDIDZ may exhibit a general upward tendency from 2024 to 2030. It should be explicitly noted, however, that these results represent exploratory, scenario-like projections rather than robust forecasts. The projection is conditional on the structural stability of the system and does not account for potential exogenous disturbances, including policy adjustments, macroeconomic fluctuations, climate extremes, public-health emergencies, or abrupt shifts in tourism patterns. Furthermore, given the short annual series on which the model was trained (ten observations spanning 2014–2023) and the limited out-of-sample generalisability demonstrated in the rolling-origin validation (Table 5), the projected values carry non-negligible uncertainty and should be treated with appropriate caution. Under these qualifications, the projection tentatively suggests that, if current development trajectories persist, the CLHTES level of the YRDIDZ may approach Level VII after 2028 within the present evaluation framework. This should be understood as a relatively advanced position within the constructed index and classification system rather than as an indication that all ecological, cultural, or governance risks have been resolved.
4. Discussion
4.1. Interpretation of Key Findings
The results of this study indicate that the CLHTES of the YRDIDZ exhibited a fluctuating upward trend from 2014 to 2023, undergoing a three-stage evolution from Level III to Level V. This phased pattern is broadly consistent with the stage evolution theory of heritage security proposed by Zhang et al. [75], according to which the security status of heritage destinations changes with the dynamic balance between conservation intensity and development intensity. The concentration of the CLHTES levels in the middle range, with no occurrence of Level I or Level VII during the observation period, also suggests that the security status of cultural landscape heritage destinations is jointly constrained by multiple social, ecological, cultural, and institutional factors rather than by a single dominant variable. This finding is also consistent with the conclusion of Andrea et al. [76] that the security level of heritage sites is difficult to move toward extreme states because it is shaped by multiple interacting constraints. Moreover, these evolutionary and hierarchical characteristics are broadly in line with the findings of Gao et al. [13], particularly in terms of the seven-level classification logic and the tendency of security change to unfold gradually rather than abruptly.
The phased evolution can be interpreted in relation to both governance change and structural conditions, although such interpretation should be treated with caution rather than as strict causal proof. In the first stage (2014–2016), the YRDIDZ remained in a sensitive security state, which can be plausibly associated with high population-density pressure, relatively fragmented governance arrangements, and still-insufficient public cultural service capacity. In the second stage (2017–2019), the CLHTES index improved rapidly, likely reflecting the cumulative effects of strengthened heritage protection, increased public cultural investment, and the acceleration of regional integration and cultural-tourism coordination. In the third stage (2020–2023), the index entered a steady-growth phase, indicating that earlier investments in cultural facilities, tourism service improvement, and collaborative governance had begun to produce more stable returns. At the same time, the persistence of fluctuations suggests that the regional system had not yet overcome deeper structural constraints.
The three-stage evolution of CLHTES also corresponded to important policy milestones in the regional governance context. In particular, 2016 marked a key preparatory turning point, as the approval of the Development Plan for the Yangtze River Delta Urban Agglomeration provided a top-level framework for deeper regional coordination by clarifying the development scope, strategic objectives, and cooperation direction of the Yangtze River Delta. Although the CLHTES index still remained in the sensitive fluctuation stage at that time, this policy milestone signaled the gradual accumulation of institutional conditions for subsequent improvement. By contrast, 2019 represented a more direct policy inflection point, as the Outline of the Yangtze River Delta Regional Integration Development Plan formally elevated regional integration to a national strategy and explicitly identified the Yangtze River Delta Eco-Green Integrated Development Demonstration Zone as a pilot area for cross-jurisdictional institutional innovation. This strategic upgrade provided stronger policy support for heritage protection coordination, public cultural service development, and integrated cultural-tourism governance, which is consistent with the rapid rise in the CLHTES index up to 2019 and the steadier growth trajectory thereafter. These links are interpreted here as policy-contextual explanations rather than strict causal proof.
Intra-regional differences also deserve attention. Although the YRDIDZ as a whole shows a clear upward trajectory, the aggregate trend masks differentiated development paths across Qingpu, Jiashan, and Wujiang. Qingpu and Jiashan exhibit relatively steadier improvement, which may reflect stronger public service support, more mature tourism-cultural integration, and earlier accumulation of governance capacity. Wujiang, by contrast, shows a more staged growth pattern, suggesting that the release of policy effects and institutional coordination gains may have been comparatively slower or more uneven. This indicates that regional integration should not be understood as uniform convergence, but rather as a process that still requires differentiated governance according to local resource endowments, institutional capacity, and development tempo. In this sense, the regional mean value is useful for identifying the overall trajectory of CLHTES, but it does not eliminate the need to interpret local heterogeneity in governance pathways and improvement rates.
Carr et al. [37] criticized the application of the DPSIR framework in sustainable development assessment. Later, some scholars adopted improved frameworks in their research, such as DPSIRM [45], DPSIR-DEA [57], DPSWR [58], and DPSIR-SBM [61]. Nevertheless, Carr et al. [37] also proposed that confining the DPSIR framework to local-scale research and fully incorporating the perspectives and demands of local stakeholders can avoid the “scalar trap”. This study is exactly conducted at the local scale, taking into account the demands of multiple stakeholders, including tourists, local residents, and governments. In addition, compared with previous studies that focused on indicators of the three dimensions of economy, society, and environment [59,60], this study emphasizes the inclusion of cultural indicators within the DPSIR framework. This not only improves the multi-dimensional structure of the evaluation system, but also provides a more scientific decision-making basis for risk identification, threshold definition, and coordinated governance of CLHTES in the YRDIDZ. Furthermore, some cultural indicators are obtained by crawling UGC online big data from Ctrip and conducting semantic analysis. In comparison with the traditional evaluation questionnaire method, this approach enables large-sample, long-term, and continuous user evaluation research on a specific space or place [56]. It thus addresses the limitations of traditional surveys and significantly increases the sample size of user feedback information.
The obstacle analysis further shows that CLHTES constraints in the YRDIDZ present a multi-level differentiated structure. At the factor layer, cultural-type and social-type factors dominate the obstacle frequencies, while at the indicator layer, the most prominent constraints are concentrated in S7, R4, I4, R3, and D4. This pattern is broadly consistent with the finding of Zhang et al. [75] that cultural distortion and weak support mechanisms often constitute core risks in heritage contexts. It also suggests that the main bottlenecks to further improvement do not lie primarily in basic hard infrastructure or environmental control alone, but increasingly in the quality of cultural resource protection, public cultural service provision, interpretive effectiveness, social support capacity, and long-term structural coordination. In addition, the exact composition of key obstacles varies across study areas and methods [34,61], which further indicates that obstacle identification should be interpreted in relation to specific institutional and regional contexts rather than as a universally fixed ranking.
The dynamic shift in obstacle structure is also theoretically meaningful. The relative decline in response-dominated constraints, together with the increasing prominence of D- and S-related obstacles by 2023, may indicate that earlier investments in governance response capacity have begun to produce results, while more structural pressures—especially those related to urbanization, demographic change, and uneven cultural-tourism endowment—have become comparatively more visible. In this sense, the governance challenge in the YRDIDZ appears to be evolving from the mitigation of immediate response deficits toward the coordination of deeper structural contradictions, which is typical of regions entering a more advanced but still incomplete stage of integrated cultural landscape governance.
Finally, the conditional trend projections derived from the RBF model suggest that the CLHTES of the YRDIDZ may follow a general upward trajectory from 2024 to 2030, potentially approaching Level VII after 2028 under the current modelling framework, provided that the structural conditions of the system remain broadly stable. It must be emphasized, however, that these projections are exploratory and scenario-like in nature rather than robust forecasts. They rest on the critical assumption of structural continuity in the socioeconomic, cultural, and governance dimensions of the system, and explicitly do not account for exogenous shocks such as policy reversals, macroeconomic disruptions, climate extremes, or unforeseen public-health events. Given the short training series (ten annual observations) and the limited out-of-sample predictive performance reported in Table 5—where the linear trend and ARIMA benchmarks outperformed the RBF model in rolling-origin validation—the forward-looking values reported here should be interpreted with commensurate caution. They are intended to indicate a plausible direction of future evolution under current trajectories rather than to constitute a deterministic basis for precise level classification. Furthermore, “Level VII” or “absolute security” in this study denotes a relatively advanced position within the constructed index and classification system; it does not imply the elimination of all ecological, cultural, or governance risks, which remain subject to dynamic pressures beyond the scope of the present model. This qualification is especially important for policy interpretation, because cultural landscape heritage systems remain exposed to dynamic pressures from urbanization, tourism growth, environmental change, governance uncertainty, and possible exogenous shocks. Although the present projection is broadly consistent with previous studies using similar predictive approaches in tourism ecological security assessment [51], its interpretation should remain cautious under short-sample conditions.
4.2. Governance Implications and Broader Applicability
The obstacle indicators identified in this study can be translated into more concrete governance priorities. For S7, the number of key cultural relic protection units, the policy task is not limited to increasing nominal listings, but includes strengthening heritage identification, graded protection, restoration planning, daily maintenance, and the integration of cultural relic conservation into broader territorial governance. For R4, the number of “Three Museums and One Station,” the implication is to enhance both the coverage and functional quality of public cultural service facilities, especially in terms of accessibility, interpretive services, educational outreach, and cross-regional sharing. For I4 and I6, management efforts should focus on improving interpretation systems, enriching participatory cultural activities, optimizing tourism experience quality, and reducing shallow or excessive commercialization. For R3, a longer-term governance priority is the cultivation of talent and institutional support for heritage protection, cultural communication, and tourism service management. These tasks may be advanced through existing policy channels such as public cultural service investment, cultural relic protection projects, cultural-tourism integration programs, and inter-jurisdictional coordination mechanisms.
From a governance perspective, the results imply a staged intervention framework. In the short term, priority should be given to improving cultural interpretation quality, visitor guidance, participatory cultural activities, and the reduction in shallow commercialization, so as to directly alleviate constraints related to I4 and I6. In the medium term, attention should focus on the coordinated expansion, maintenance, and functional upgrading of public cultural infrastructure, especially the “Three Museums and One Station” system and related heritage-supporting facilities, corresponding to R4 and R7. In the long term, structural pressures associated with urbanization, demographic change, and uneven development capacity need to be addressed through spatial planning, ecological protection, talent cultivation, and cross-regional governance coordination, especially in relation to D3 and D4. Such a staged governance framework is more consistent with the temporal hierarchy revealed by the obstacle analysis.
The practical implications of the study can also be understood at multiple levels. At the heritage-site management level, the multi-layered obstacle analysis helps identify the most urgent governance bottlenecks, thereby providing prioritized guidance for conservation and tourism management. At the regional policy level, the temporal evolution analysis and forward projections provide a useful decision-support basis for cross-regional collaborative planning in the YRDIDZ. At the methodological level, the DPSIR–TOPSIS–RBF framework proposed in this study may also be transferable to other cultural landscape heritage regions that face the dual challenge of conservation and tourism development, provided that the indicator system is appropriately localized according to regional socio-ecological conditions.
4.3. Limitations and Prospects
Despite the aforementioned findings, this study is subject to limitations imposed by data availability and the constraints of current understanding regarding the CLHTES in the YRDIDZ. The evaluation index system still has room for refinement; access to more micro-level indicators could further enhance the accuracy of the assessment. In addition, although the proportion of missing data was very low and linear interpolation was applied only to isolated single-year gaps, this treatment may slightly smooth short-term fluctuations in relatively volatile indicators. However, because the main conclusions of this study are based on long-term composite trends and multi-indicator integration, such influence is considered limited.
It should also be noted that the seven-level thresholds adopted in this study are not intended as universally fixed absolute standards, nor are they purely data-driven cut-offs derived from the sample distribution. Rather, they are literature-informed and locally adapted reference intervals established for the practical context of the YRDIDZ. Although alternative classification schemes, such as a five-level framework, may change the granularity of level assignment, they would not alter the main findings regarding the overall upward trend, the three-stage temporal evolution, or the characteristic of mid-range clustering of CLHTES during the study period.
To examine the robustness of the entropy-weighted TOPSIS results, this study additionally compared the main CLHTES patterns under an equal-weight TOPSIS scheme (Table S4, Supplementary Materials). The comparison indicates that the overall improving trend remains identifiable under both weighting schemes, suggesting that the main temporal conclusions are not driven solely by the entropy-weighting setting. However, the exact relative ranking of some sub-regions changes under the alternative weighting assumption, indicating that local comparative positions are sensitive to weighting choices and should therefore be interpreted with appropriate caution.
In addition, the obstacle degree results are partly dependent on the adopted indicator weights. Therefore, modest changes in weighting may affect the exact rank order of some indicators, especially when their obstacle-degree values are close. However, the broader structural pattern identified in this study—namely the recurrent prominence of cultural and social constraints—remains relatively stable. Accordingly, the interpretation of obstacle rankings in this study focuses more on recurrent structural patterns than on the exact position of any single indicator in the Top 5 list.
The current prediction model also does not explicitly incorporate exogenous drivers such as policy adjustments, climate extremes, macroeconomic fluctuations, public-health emergencies, or tourism shocks. Second, the predictive analysis is constrained by the short annual time series. The CLHTES series used for model training spans only 2014–2023 and contains ten observations, which increases the risk of overfitting and limits the robustness of long-horizon prediction. Even with rolling-origin validation and benchmark comparison, predictive errors remain non-negligible under short-sample conditions. As a result, the future values reported in this study should be interpreted as conditional trend projections under current trajectories rather than precise forecasts. Although a bootstrap-based uncertainty analysis was incorporated in the revised manuscript, the estimated confidence intervals still reflect uncertainty under the current indicator system and sample structure rather than all possible sources of real-world uncertainty.
Future research directions should therefore focus on refining the CLHTES evaluation index system, deepening the analysis of spatiotemporal coupling mechanisms, applying spatial econometric models to explore the spatiotemporal evolution characteristics, spatial correlation patterns, and driving mechanisms of CLHTES in the YRDIDZ, as well as clarifying the inter-regional security spillover effects and collaborative governance pathways.
5. Conclusions
This study developed an improved evaluation framework for CLHTES by extending the DPSIR model to better incorporate cultural dimensions and by integrating multi-source data, including statistical records and tourism UGC. Methodologically, the study combines entropy-weighted TOPSIS, linear stretching transformation, obstacle degree analysis, and RBF neural network prediction into a unified analytical chain linking historical evolution, current diagnosis, and future forecasting. Empirically, the results show that the CLHTES of the YRDIDZ followed a fluctuating upward trajectory from 2014 to 2023, progressing from Level III to Level V, with clear stage differentiation. The obstacle analysis further indicates that the main constraints are concentrated in cultural and social dimensions, especially in heritage protection capacity, public cultural service provision, visitor evaluation, and long-term structural support. These findings suggest that the improvement of CLHTES in cross-regional heritage areas depends not only on environmental governance, but also on stronger cultural protection, public service coordination, and institutional integration. With respect to future evolution, this study generated conditional, exploratory trend projections for the CLHTES of the YRDIDZ over 2024–2030, suggesting a possible continued upward tendency and a potential approach to Level VII after 2028. These projections are derived under the assumption of structural continuity in the underlying system and explicitly do not incorporate exogenous disturbances such as policy shifts, climate variability, macroeconomic shocks, or public-health emergencies. Given the inherently short annual series (ten observations), the limited out-of-sample predictive performance demonstrated in rolling-origin validation, and the attendant risk of overfitting, these forward-looking values should be interpreted strictly as scenario-like trend references rather than as robust or deterministic forecasts. Their primary value lies in indicating a plausible direction of future development under current trajectories, thereby providing a conditional basis for forward-looking governance planning rather than a precise prediction of future security levels. The findings carry practical implications for heritage site management, regional policy planning, and methodological application in analogous cultural landscape heritage contexts beyond the YRDIDZ. Beyond the YRDIDZ, the framework proposed in this study may also be applicable to other cultural landscape heritage regions that face the dual challenge of conservation and tourism development. Its broader value lies in providing a transferable approach for integrating cultural indicators into tourism ecological security assessment and for supporting differentiated governance under complex social-ecological conditions.
Supplementary Materials
The following supporting information can be downloaded at: https://www.mdpi.com/article/10.3390/su18083797/s1, Figure S1: Temporal evolution of the CLHTES index in Qingpu, Wujiang, and Jiashan, 2014–2023; Table S1: Full annual distribution of UGC corpus; Table S2: Summary of representative highly correlated indicator pairs in the extended DPSIR indicator system; Table S3: Summary of principal component analysis (PCA) results for the extended DPSIR indicator system; Table S4: Robustness comparison between entropy-weighted TOPSIS and equal-weight TOPSIS results; Table S5: Rolling-origin out-of-sample prediction details for the overall YRDIDZ CLHTES series; Table S6: Summary of rolling-origin out-of-sample predictive performance for the overall YRDIDZ CLHTES series; Table S7: Rolling-origin out-of-sample predictive performance for Qingpu, Jiashan, and Wujiang; Table S8: Bootstrap 95% confidence intervals for the annual overall CLHTES index of the YRDIDZ, 2014–2023; Table S9: Bootstrap 95% confidence intervals for the regional mean CLHTES indices; Note S1: Standardized workflow for the semantic categorization of high-frequency sentiment expressions.
Author Contributions
Conceptualization, S.D.; methodology, Z.Y.; software, Z.Y.; validation, S.D.; formal analysis, Z.Y.; investigation, X.L.; resources, S.D.; writing—original draft preparation, S.D.; writing—review and editing, Z.Y. and X.L.; visualization, Z.Y.; supervision, X.L.; project administration, X.L.; funding acquisition, S.D. All authors have read and agreed to the published version of the manuscript.
Funding
This research was funded by a grant from the National Natural Science Foundation of China, No. 52208067, and China Postdoctoral Science Foundation Project, No. 2023M740667.
Institutional Review Board Statement
Not applicable.
Informed Consent Statement
Not applicable.
Data Availability Statement
The datasets generated and or analyzed during the current study are available from the corresponding author on reasonable request.
Acknowledgments
This publication was supported by the National Natural Science Foundation of China under the Young Scientists Fund programme, for the project entitled “Research on Security Optimization of Vernacular Cultural Landscapes in the Yangtze River Delta Demonstration Area Based on Geo-information Tupu” (Grant No. 52208067), and by the China Postdoctoral Science Foundation within the framework of the project “Research on the Security Tupu of Local Cultural Landscapes in the Yangtze River Delta Demonstration Area Based on Value Strategic Point Identification” (Project No. 2023M740667). The sole responsibility for the content of this paper lies with the authors. The funding bodies are not responsible for any use that may be made of the information contained therein.
Conflicts of Interest
The authors have no competing interests to declare that are relevant to the content of this article.
References
- George, R. Visitor perceptions of crime-safety and attitudes towards risk: The case of Table Mountain National Park, Cape Town. Tour. Manag. 2010, 31, 806–815. [Google Scholar] [CrossRef] [Scilit]
- Zou, Y.G.; Yu, Q.L. Sense of safety toward tourism destinations: A social constructivist perspective. J. Destin. Mark. Manag. 2022, 24, 100708. [Google Scholar] [CrossRef] [Scilit]
- Buckley, R. Sustainable tourism: Research and reality. Ann. Tour. Res. 2012, 39, 528–546. [Google Scholar] [CrossRef] [Scilit]
- Abbass, K.; Qasim, M.Z.; Song, H.; Murshed, M.; Mahmood, H.; Younis, I. A review of the global climate change impacts, adaptation, and sustainable mitigation measures. Environ. Sci. Pollut. Res. 2022, 29, 42539–42559. [Google Scholar] [CrossRef] [Scilit]
- Aktymbayeva, A.; Nuruly, Y.; Artemyev, A.; Kaliyeva, A.; Sapiyeva, A.; Assipova, Z. Balancing nature and visitors for sustainable development: Assessing the tourism carrying capacities of Katon-Karagay National Park, Kazakhstan. Sustainability 2023, 15, 15989. [Google Scholar] [CrossRef] [Scilit]
- Skiniti, G.; Lilli, M.; Skarakis, N.; Tournaki, S.; Nikolaidis, N.; Tsoutsos, T. A holistic approach for tourism carrying capacity estimation in sensitive ecological areas. Environ. Dev. Sustain. 2024, 26, 31971–31995. [Google Scholar] [CrossRef] [Scilit]
- Liu, K.D.; Xiong, X.; Xiang, W.J.; Wu, S.Y.; Shi, D.S.; Zhang, W.T.; Zhang, L.B. Investigating the coordination between ecological and economic systems in China’s green development process: A place-based interdisciplinary evaluation. Ecol. Soc. 2023, 28, 43. [Google Scholar] [CrossRef] [Scilit]
- Aplin, G. World heritage cultural landscapes. Int. J. Herit. Stud. 2007, 13, 427–446. [Google Scholar] [CrossRef] [Scilit]
- Sesana, E.; Gagnon, A.S.; Bonazza, A.; Hughes, J.J. An integrated approach for assessing the vulnerability of World Heritage Sites to climate change impacts. J. Cult. Herit. 2020, 41, 211–224. [Google Scholar] [CrossRef] [Scilit]
- Hu, H.S. Climate and environmental dynamics: Deciphering the distribution and vulnerability of world heritage sites in Europe. J. Environ. Manag. 2025, 392, 126693. [Google Scholar] [CrossRef] [Scilit]
- Chen, L.; Yang, H.N.; Huang, H.; Chang, M.; Wang, X.Y.; Han, D.; Liu, S.Y.; Xiao, Y.; Yao, D.; Xiang, X. How do natural and socio-economic factors influence the sustainable development of the ecological environment in the World Natural Heritage Sites? Evidence from the Jiuzhaigou, China. J. Clean. Prod. 2023, 428, 139238. [Google Scholar] [CrossRef] [Scilit]
- Song, H.M.; Chen, J.L.; Li, P.C. Decoding the cultural heritage tourism landscape and visitor crowding behavior from the multidimensional embodied perspective: Insights from Chinese classical gardens. Tour. Manag. 2025, 110, 105180. [Google Scholar] [CrossRef] [Scilit]
- Gao, J.; Zhang, C.Z.; Liu, L. Communicating the outstanding universal value of World Heritage in China? The tour guides’ perspective. Asia Pac. J. Tour. Res. 2020, 25, 1042–1055. [Google Scholar] [CrossRef] [Scilit]
- Anton, W.R.Q.; Deltas, G.; Khanna, M. Incentives for environmental self-regulation and implications for environmental performance. J. Environ. Econ. Manag. 2004, 48, 632–654. [Google Scholar] [CrossRef] [Scilit]
- Reynolds, C. Ecological pattern and ecosystem theory. Ecol. Model. 2002, 158, 181–200. [Google Scholar] [CrossRef] [Scilit]
- Liu, D.D.; Yin, Z.Y. Spatial-temporal pattern evolution and mechanism model of tourism ecological security in China. Ecol. Indic. 2022, 139, 108933. [Google Scholar] [CrossRef] [Scilit]
- Ostrom, E. A general framework for analyzing sustainability of social-ecological systems. Science 2009, 325, 419–422. [Google Scholar] [CrossRef] [Scilit]
- Biggs, R.; Schlüter, M.; Biggs, D.; Bohensky, E.L.; BurnSilver, S.; Cundill, G.; Dakos, V.; Daw, T.M.; Evans, L.S.; Kotschy, K. Toward principles for enhancing the resilience of ecosystem services. Annu. Rev. Environ. Resour. 2012, 37, 421–448. [Google Scholar] [CrossRef] [Scilit]
- Zhao, L.; Ma, R.; Chen, F.; Li, J.R.; Chen, Q.; Fan, Y.X. Enhancing the spatial resilience of agricultural heritage through constructing a balanced production-living-ecological space protection network. npj Herit. Sci. 2025, 13, 368. [Google Scholar] [CrossRef] [Scilit]
- Espin, P.A.; Mena, C.F.; Pizzitutti, F. A model-based approach to study the tourism sustainability in an island environment: The case of Galapagos Islands. In Urban Galápagos: Transition to Sustainability in Complex Adaptive Systems; Springer: Berlin/Heidelberg, Germany, 2018; pp. 97–113. [Google Scholar]
- Tokarchuk, O.; Gabriele, R.; Maurer, O. Estimating tourism social carrying capacity. Ann. Tour. Res. 2021, 86, 102971. [Google Scholar] [CrossRef] [Scilit]
- Zheng, X.; Yang, Z.P.; Zhang, X.Y.; Wang, T.; Chen, X.D.; Wang, C.R. Spatiotemporal evolution and influencing factors of provincial tourism ecological security in China. Ecol. Indic. 2023, 148, 110114. [Google Scholar] [CrossRef] [Scilit]
- Lin, Y.Y.; Zhang, F.Z.; Cai, G.; Jin, Y.D.; Zhang, L.; Ge, Y. Spatio-temporal pattern and driving factors of tourism ecological security in Fujian Province. Ecol. Indic. 2023, 157, 111255. [Google Scholar] [CrossRef] [Scilit]
- Muntifering, J.R.; Linklater, W.L.; Naidoo, R.; Du Preez, P.; Beytell, P.; Jacobs, S.; Knight, A.T. Black rhinoceros avoidance of tourist infrastructure and activity: Planning and managing for coexistence. Oryx 2021, 55, 150–159. [Google Scholar] [CrossRef] [Scilit]
- Lu, J.W.; Chen, H.B. Dynamic evaluation and forecasting analysis of touristic ecological carrying capacity of forest parks in China. Forests 2023, 15, 38. [Google Scholar] [CrossRef] [Scilit]
- Guo, H.; Sun, D.Y.; Wu, L.Z.; Cui, Y.Q.; Wang, X.F.; Ma, Y.L.; Shu, H.P. Early warning and prediction of water resources carrying capacity in Shule River based on system dynamics model, Northwest China. Environ. Sustain. Indic. 2025, 28, 100991. [Google Scholar]
- Liu, S.D.; Geng, Y.H.; Zhang, J.J.; Kang, X.F.; Shi, X.L.; Zhang, J. Ecological trap in tourism-urbanization: Simulating the stagnation and restoration of urbanization from the perspective of government incentives. Ecol. Econ. 2021, 185, 107054. [Google Scholar] [CrossRef] [Scilit]
- Zhang, M.N.; Ao, Y.; Liu, M.; Zhao, Y.H.; Lin, K.L.; Cheng, T. Ecological security assessment based on ecosystem service value and ecological footprint in the Pearl River Delta urban agglomeration, China. Ecol. Indic. 2022, 144, 109528. [Google Scholar] [CrossRef] [Scilit]
- Mazur, I.; Aliyev, R.; Zhelizko, Y. The safety and security of the tourism entrepreneurship potential realization in modern conditions. Balt. J. Econ. Stud. 2020, 6, 203–208. [Google Scholar] [CrossRef] [Scilit]
- Dong, Z.H.; Zhang, J.Q.; Tong, Z.J.; Han, A.R.; Zhi, F. Ecological security assessment of Xilingol grassland in China using DPSIRM model. Ecol. Indic. 2022, 143, 109336. [Google Scholar] [CrossRef] [Scilit]
- Wen, M.X.; Zhang, T.; Li, L.; Chen, L.Q.; Hu, S.; Wang, J.; Liu, W.Q.; Zhang, Y.; Yuan, L.N. Assessment of land ecological security and analysis of influencing factors in Chaohu Lake Basin, China from 1998–2018. Sustainability 2021, 13, 358. [Google Scholar] [CrossRef] [Scilit]
- Xiong, J.X.; Wang, X.B.; Zhao, D.; Wang, J. Spatiotemporal evolution for early warning of ecological carrying capacity during the urbanization process in the Dongting Lake area, China. Ecol. Inform. 2023, 75, 102071. [Google Scholar] [CrossRef] [Scilit]
- An, X.Y.; Kasimu, A.; Zhang, X.; Song, N.; Zhang, Y.; Shayiti, B. Integrating revised ecosystem service value, ecological sensitivity and circuit theory to construct an ecological security pattern in the UANSTM, China. Sustainability 2025, 17, 10880. [Google Scholar] [CrossRef] [Scilit]
- Zhao, Z.K.; Liu, C.; Chang, W.Y.; Ren, Y.J. Comprehensive resilience assessment and obstacle analysis of cities based on the PSR-TOPSIS model: A case study of Jiangsu cities. Land 2025, 14, 1437. [Google Scholar] [CrossRef] [Scilit]
- Zhou, B.; Yu, H.; Zhong, L.S.; Chen, T. Developmental trend forecasting of tourism ecological security trends: The case of Mount Putuo Island. Acta Ecol. Sin. 2016, 36, 7792–7803. [Google Scholar] [CrossRef] [Scilit]
- Ma, J.X.; Zhang, J.H.; Sun, F.; Zou, C.X.; Ma, T.C. Spatial-temporal pattern and influencing factors of tourism ecological security in Huangshan City. Front. Ecol. Evol. 2023, 11, 1214741. [Google Scholar] [CrossRef] [Scilit]
- Carr, E.R.; Wingard, P.M.; Yorty, S.C.; Thompson, M.C.; Jensen, N.K.; Roberson, J. Applying DPSIR to sustainable development. Int. J. Sustain. Dev. World 2007, 14, 543–555. [Google Scholar] [CrossRef] [Scilit]
- Yi, R.; Chen, Y.A.; Chen, A. Evaluating urban climate resilience in the Yangtze River Delta urban agglomeration: A novel method integrating the DPSIR model and Sustainable Development Goals. J. Environ. Manag. 2025, 376, 124517. [Google Scholar] [CrossRef] [Scilit]
- Liang, Y.Q.; Liu, H.Y.; Chiaka, J.C.; Jiang, C.T.; Wei, N.N.; Liang, Y.H. Spatiotemporal patterns and driving mechanism of tourism ecological security in Guangxi, China. Front. Ecol. Evol. 2023, 11, 1163498. [Google Scholar] [CrossRef] [Scilit]
- Duan, X.Y.; Yin, P.; He, X.L.; Chen, B.; Cao, K.; Tong, G. Unraveling nonlinear interactions: A DPSIR-based conceptual model for synergistic impacts of climate change and human activities on coastal blue carbon ecosystems. Glob. Change Biol. 2025, 31, e70432. [Google Scholar] [CrossRef] [Scilit]
- Liang, Y.; Cheng, Y.S.; Ren, F.; Du, Q.Y. Urban resilience assessment framework and spatiotemporal dynamics in Hubei, China. Sci. Rep. 2024, 14, 31391. [Google Scholar] [CrossRef] [Scilit]
- Jiang, C.M.Y.; Du, X.Y.; Cai, J.; Li, H.; Peng, Y.; Chen, Q.B. Study on the spatial–temporal evolution and driving mechanisms of tourism ecological security in the Jianmen Shu Road Heritage Area. Land 2025, 14, 509. [Google Scholar] [CrossRef] [Scilit]
- Kašpar, J.; Badr, S.; Tahri, M.; Maanan, M.; Tahri, H.; Mohammadi, Z.; Novotný, M.; Yousfi, N. A new automatic AHP tool to assess the forest vulnerability to wind damage. Ecol. Indic. 2025, 178, 113607. [Google Scholar] [CrossRef] [Scilit]
- Castellani, V.; Sala, S. Ecological footprint and life cycle assessment in the sustainability assessment of tourism activities. Ecol. Indic. 2012, 16, 135–147. [Google Scholar] [CrossRef] [Scilit]
- Yang, L.; Hao, Y.R.; Wang, B.; Li, X.Y.; Gao, W.F. Evaluation of the water resources carrying capacity in Shaanxi Province based on DPSIRM–TOPSIS analysis. Ecol. Indic. 2025, 173, 113369. [Google Scholar] [CrossRef] [Scilit]
- Cheng, Y.M.; An, Q.; Liu, L.; Li, H.; Huang, G.H. Spatially distinct drought patterns and influencing factors across China: A machine learning approach with a comprehensive index. Ecol. Indic. 2025, 179, 114170. [Google Scholar] [CrossRef] [Scilit]
- Li, Q.J.; Geng, Y.H.; Fu, S.; Zhang, Y.P.; Zhang, J.J. How to recognize and measure the driving forces of tourism ecological security: A case study from Zhangjiajie Scenic Area in China. Land 2025, 14, 1733. [Google Scholar] [CrossRef] [Scilit]
- Lu, T.T.; Hao, M.; Zhang, Z.N. Comprehensive evaluation of remote tower controllers’ situation awareness level based on the entropy weight method (EWM)–TOPSIS–gray relational analysis model. Appl. Sci. 2025, 15, 2623. [Google Scholar] [CrossRef] [Scilit]
- Wang, J.; Chen, X.; Zhang, Z.H. Spatial differences and drivers of tourism ecological security in China’s border areas. Sustainability 2023, 15, 11811. [Google Scholar] [CrossRef] [Scilit]
- Liu, Y.Y.; Wang, C.; Wang, H.; Chang, Y.P.; Yang, X.G.; Zang, F.; Liu, X.M.; Zhao, C.Y. An integrated ecological security early-warning framework in the national nature reserve based on the gray model. J. Nat. Conserv. 2023, 73, 126394. [Google Scholar] [CrossRef] [Scilit]
- Li, J.H.; Zeng, X.; Cao, Q.Y.; Ji, Y. Evaluation and trend forecast of tourism ecological security in karst mountainous areas: Taking international mountain tourism destination of Guizhou Province as an investigation sample. Ecol. Econ. 2022, 38, 145–151. [Google Scholar]
- Xie, Y.T.; Nolf, C. Cultural landscape characterization in the metropolitan areas of the Yangtze River Delta. Chin. Landsc. Archit. 2020, 36, 73–78. [Google Scholar]
- Yan, J.Y.; Du, S.; Zhang, J.B.; Yu, W.Y. Analyzing transregional vernacular cultural landscape security patterns with a nature–culture lens: A case study of the Yangtze River Delta Demonstration Area, China. Land 2023, 12, 661. [Google Scholar] [CrossRef] [Scilit]
- Dong, S.J.; An, H.; Wu, H.L. Ecological vulnerability assessment, driving factor analysis, and prediction in the Yangtze River Delta region. Environ. Sci. 2025, 1–16. [Google Scholar] [CrossRef] [Scilit]
- Tang, M.; Luo, X.L.; Zhang, X.C.; Yang, L.F. Governance of cross-boundary regions under national strategies: Insights from the Ecological and Green Integration Development Demonstration Zone of the Yangtze River Delta, China. Econ. Geogr. 2025, 45, 46–56. [Google Scholar]
- Fang, B.; Ye, Q.; Kucukusta, D.; Law, R. Analysis of the perceived value of online tourism reviews: Influence of readability and reviewer characteristics. Tour. Manag. 2016, 52, 498–506. [Google Scholar] [CrossRef] [Scilit]
- Ma, X.B.; Sun, B.; Hou, G.L.; Zhong, X.; Li, L. Evaluation and spatial effects of tourism ecological security in the Yangtze River Delta. Ecol. Indic. 2021, 131, 108190. [Google Scholar] [CrossRef] [Scilit]
- Wang, S.; Sun, C.Z.; Li, X.; Zou, W. Sustainable development in China’s coastal area: Based on the driver-pressure-state-welfare-response framework and the data envelopment analysis model. Sustainability 2016, 8, 958. [Google Scholar] [CrossRef] [Scilit]
- Yang, X.P.; Jia, Y.T.; Wang, Q.H.; Li, C.M.; Zhang, S.X. Space–time evolution of the ecological security of regional urban tourism: The case of Hubei Province, China. Environ. Monit. Assess. 2021, 193, 566. [Google Scholar] [CrossRef] [Scilit]
- Tang, C.C.; Wu, X.F.; Zheng, Q.Q.; Lyu, N. Ecological security evaluations of the tourism industry in ecological conservation development areas: A case study of Beijing’s ECDA. J. Clean. Prod. 2018, 197, 999–1010. [Google Scholar] [CrossRef] [Scilit]
- Ruan, W.Q.; Li, Y.Q.; Zhang, S.N.; Liu, C.H. Evaluation and drive mechanism of tourism ecological security based on the DPSIR-DEA model. Tour. Manag. 2019, 75, 609–625. [Google Scholar] [CrossRef] [Scilit]
- Lu, X.L.; Yao, S.M.; Fu, G.; Lv, X.F.; Mao, Y.A. Dynamic simulation test of a model of ecological system security for a coastal tourist city. J. Destin. Mark. Manag. 2019, 13, 73–82. [Google Scholar] [CrossRef] [Scilit]
- Zhang, F.T.; Jiang, C.X.; Ma, D.L.; Yang, X.Y.; Xiao, Y.D.; Tan, H.M. Evaluation of tourism ecological security based on DPSIRM-SBM model and its temporal–spatial evolution characteristics. Environ. Dev. Sustain. 2024, 26, 18111–18137. [Google Scholar] [CrossRef] [Scilit]
- Tian, X.B.; Hu, J.; Xu, X.; Jia, Y.Y.; Lyu, L.; Liu, H.M. Spatial-temporal distribution characteristics and influence mechanism of key cultural relics protection units in China at different historical periods. Econ. Geogr. 2021, 41, 191–201. [Google Scholar]
- Dong, B.L.; Bai, K.; Sun, X.L.; Wang, M.T.; Liu, Y. Spatial distribution and tourism competition of intangible cultural heritage: Take Guizhou, China as an example. Herit. Sci. 2023, 11, 64. [Google Scholar] [CrossRef] [Scilit]
- Yang, X.P.; Zhao, Y.L.; Zhao, J.; Shi, C.; Deng, B.L. Tourists’ perceived attitudes toward the famous terraced agricultural cultural heritage landscape in China. Agriculture 2022, 12, 1394. [Google Scholar] [CrossRef] [Scilit]
- Zhou, J.J.; Wu, S.S.; Wu, X.J.; Xia, X.M. Cultural landscape perception of the Chinese traditional settlement: Based on tourists’ online comments. PLoS ONE 2023, 18, e0283335. [Google Scholar] [CrossRef] [Scilit]
- Sun, C.M.; Gao, J.X.; Xu, J. Research on improving regional public cultural service level based on DPSIR framework: Take 11 provinces and municipalities in the Yangtze River Economic Belt as examples. Libr. Theory Pract. 2022, 53–60+67. [Google Scholar] [CrossRef]
- Hausmann, A. Cultural tourism: Marketing challenges and opportunities for German cultural heritage. Int. J. Herit. Stud. 2007, 13, 170–184. [Google Scholar] [CrossRef] [Scilit]
- Luo, J.; Chen, S.; Sun, X.; Zhu, Y.; Zeng, J.; Cheng, G. Analysis of city centrality based on entropy weight TOPSIS and population mobility: A case study of cities in the Yangtze River Economic Belt. J. Geogr. Sci. 2020, 30, 515–534. [Google Scholar] [CrossRef] [Scilit]
- Xiao, Z.F.; Li, R.; Lyu, W.Q. Study on temporal and spatial pattern evolution of tourism ecological security in Chengdu-Chongqing urban agglomeration. World Reg. Stud. 2023, 32, 122–133. [Google Scholar]
- He, S.; Shao, H.Y.; Xian, W.; Zhang, S.H.; Zhong, J.L.; Qi, J.G. Extraction of abandoned land in hilly areas based on the spatio-temporal fusion of multi-source remote sensing images. Remote Sens. 2021, 13, 3956. [Google Scholar] [CrossRef] [Scilit]
- Yang, S.J.; Song, S.; Li, F.D.; Yu, G.M.; He, G.Z.; Cui, H.T.; Wang, R.; Sun, B.; Du, D.; Chen, G.; et al. Evaluating farmland ecosystem resilience and its obstacle factors in Ethiopia. Ecol. Indic. 2023, 146, 109900. [Google Scholar] [CrossRef] [Scilit]
- He, X.R.; Cai, C.Y.; Tang, J.X.; Shi, J.Z.; Yang, R.B. Analysis of coupling coordination and obstacle factors between tourism development and ecosystem services value: A case study of the Yellow River Basin, China. Ecol. Indic. 2023, 157, 111234. [Google Scholar] [CrossRef] [Scilit]
- Zhang, S.N.; Ruan, W.Q.; Li, Y.Q.; Xiao, H.G. Cultural distortion risks at heritage sites: Scale development and validation. Tour. Manag. 2024, 102, 104860. [Google Scholar] [CrossRef] [Scilit]
- Valagussa, A.; Frattini, P.; Crosta, G.B.; Spizzichino, D.; Leoni, G.; Margottini, C. Hazard ranking of the UNESCO world heritage sites (WHSs) in Europe by multicriteria analysis. J. Cult. Herit. Manag. Sustain. Dev. 2020, 10, 359–374. [Google Scholar] [CrossRef] [Scilit]
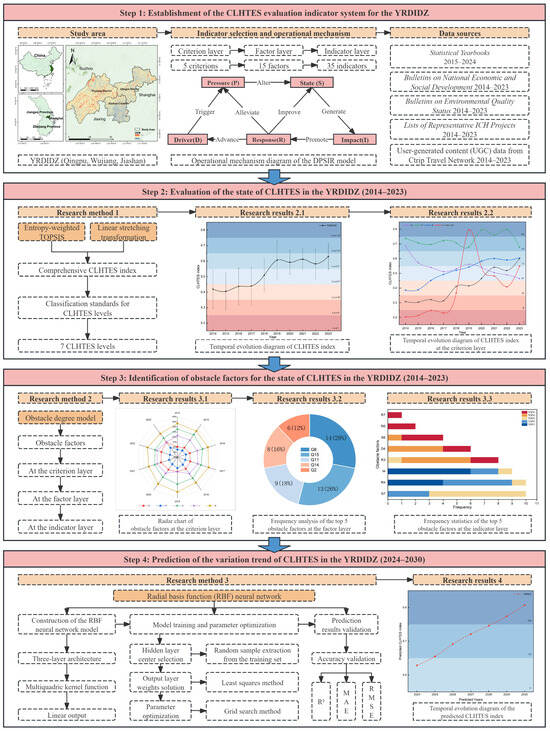
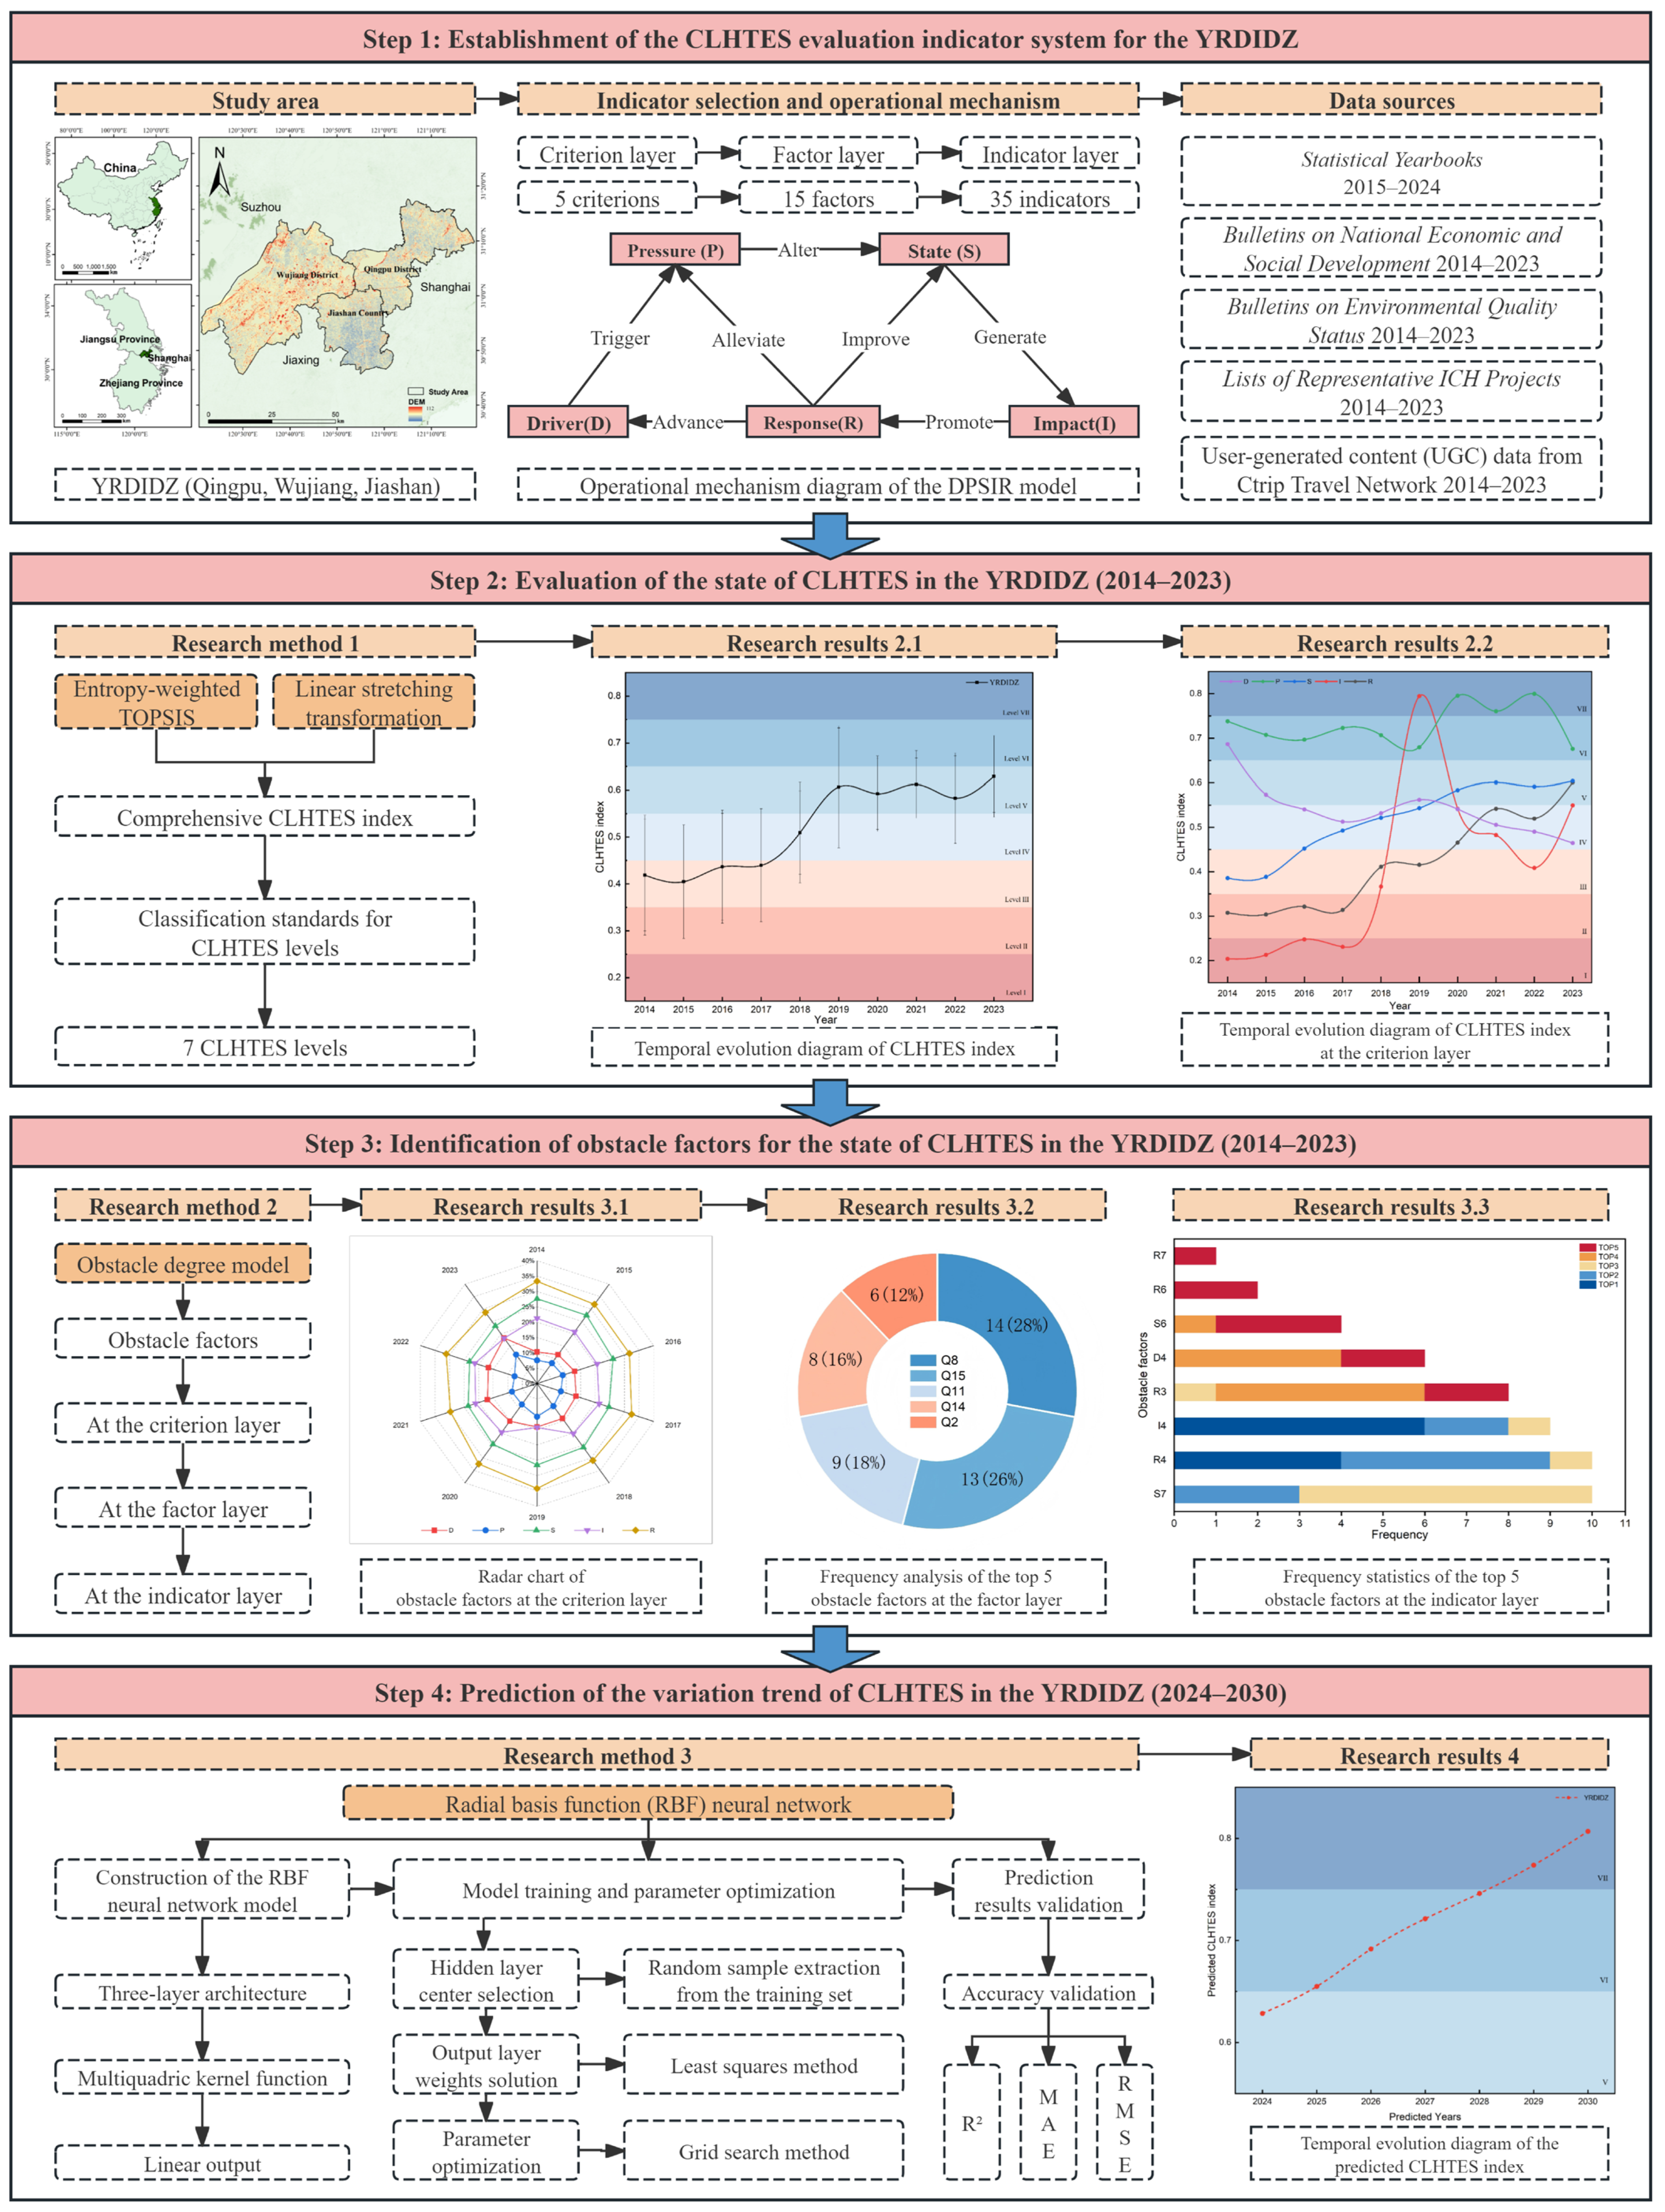
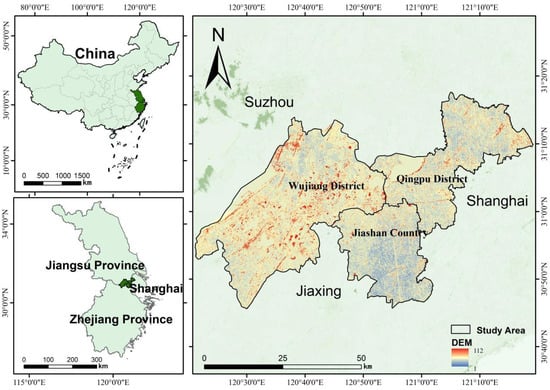
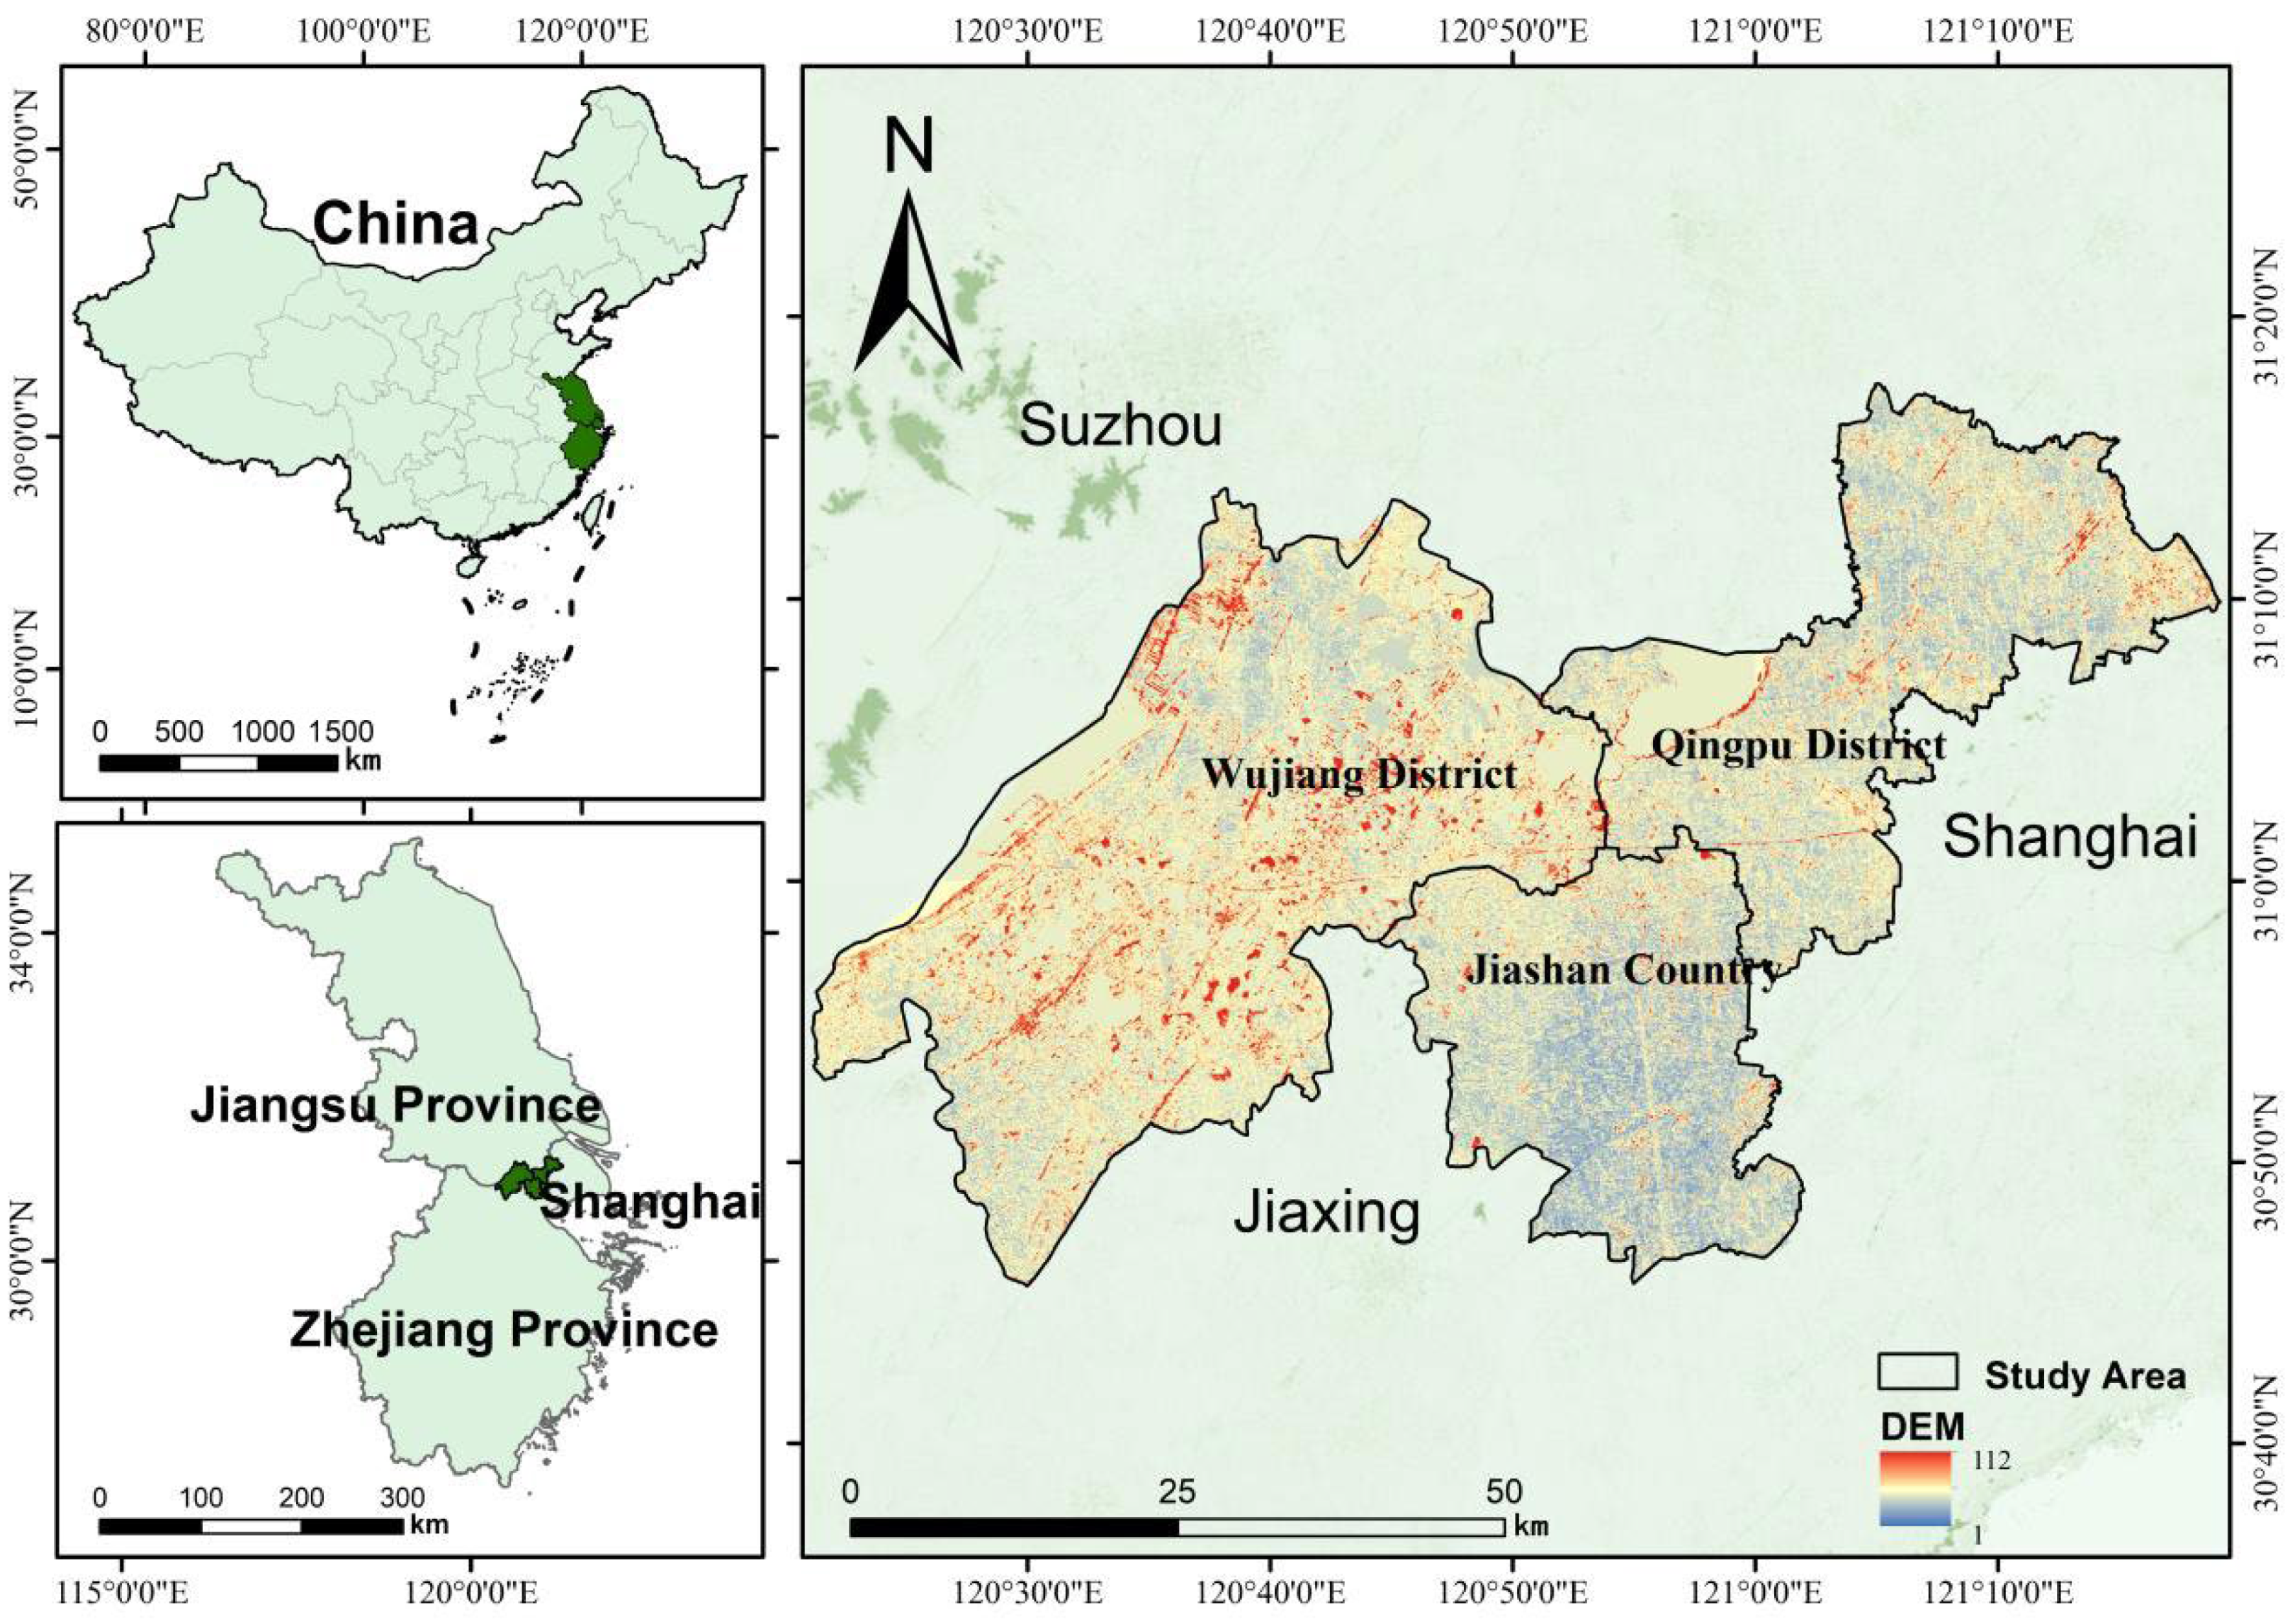
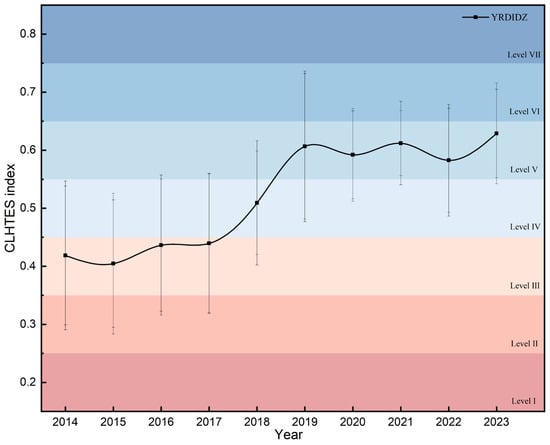
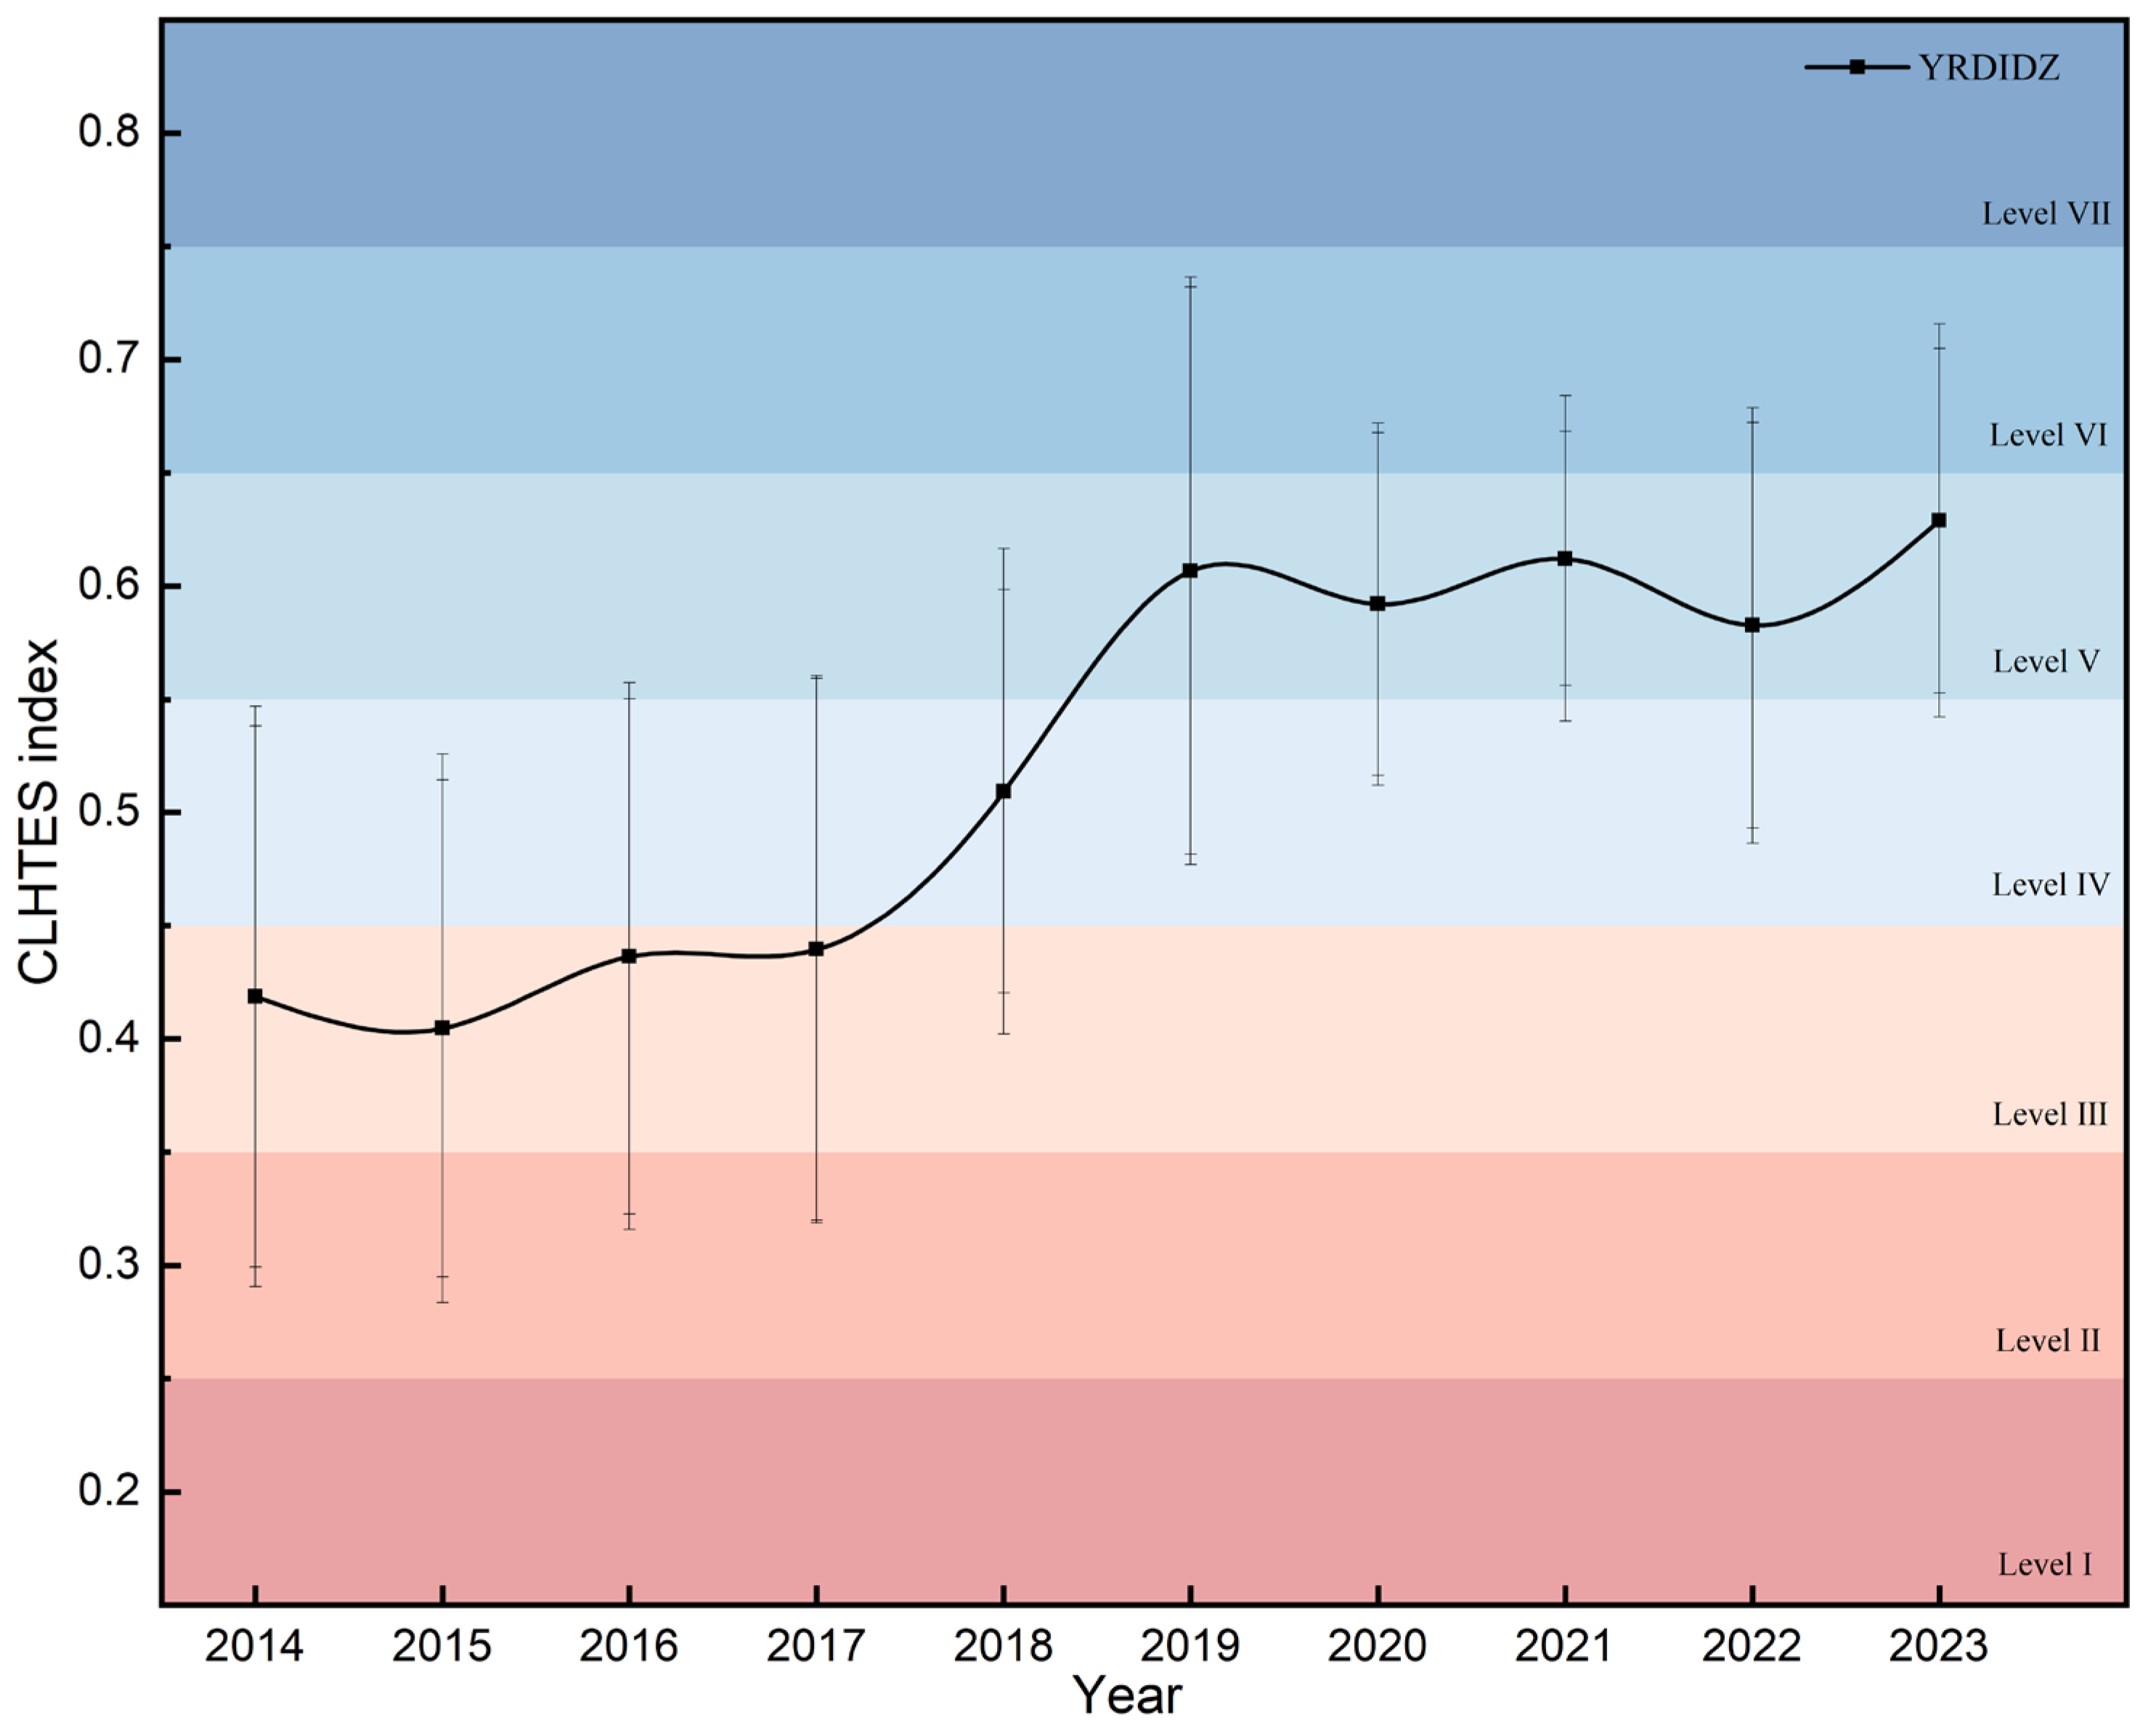
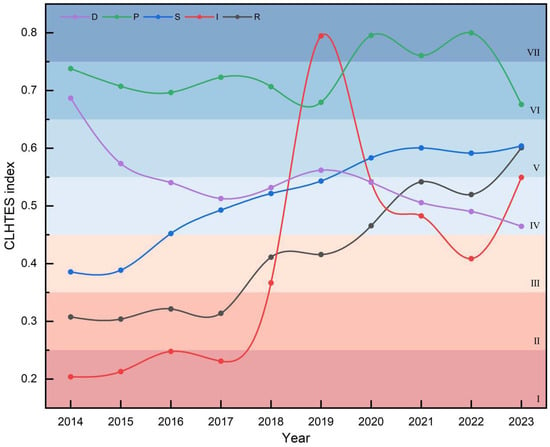
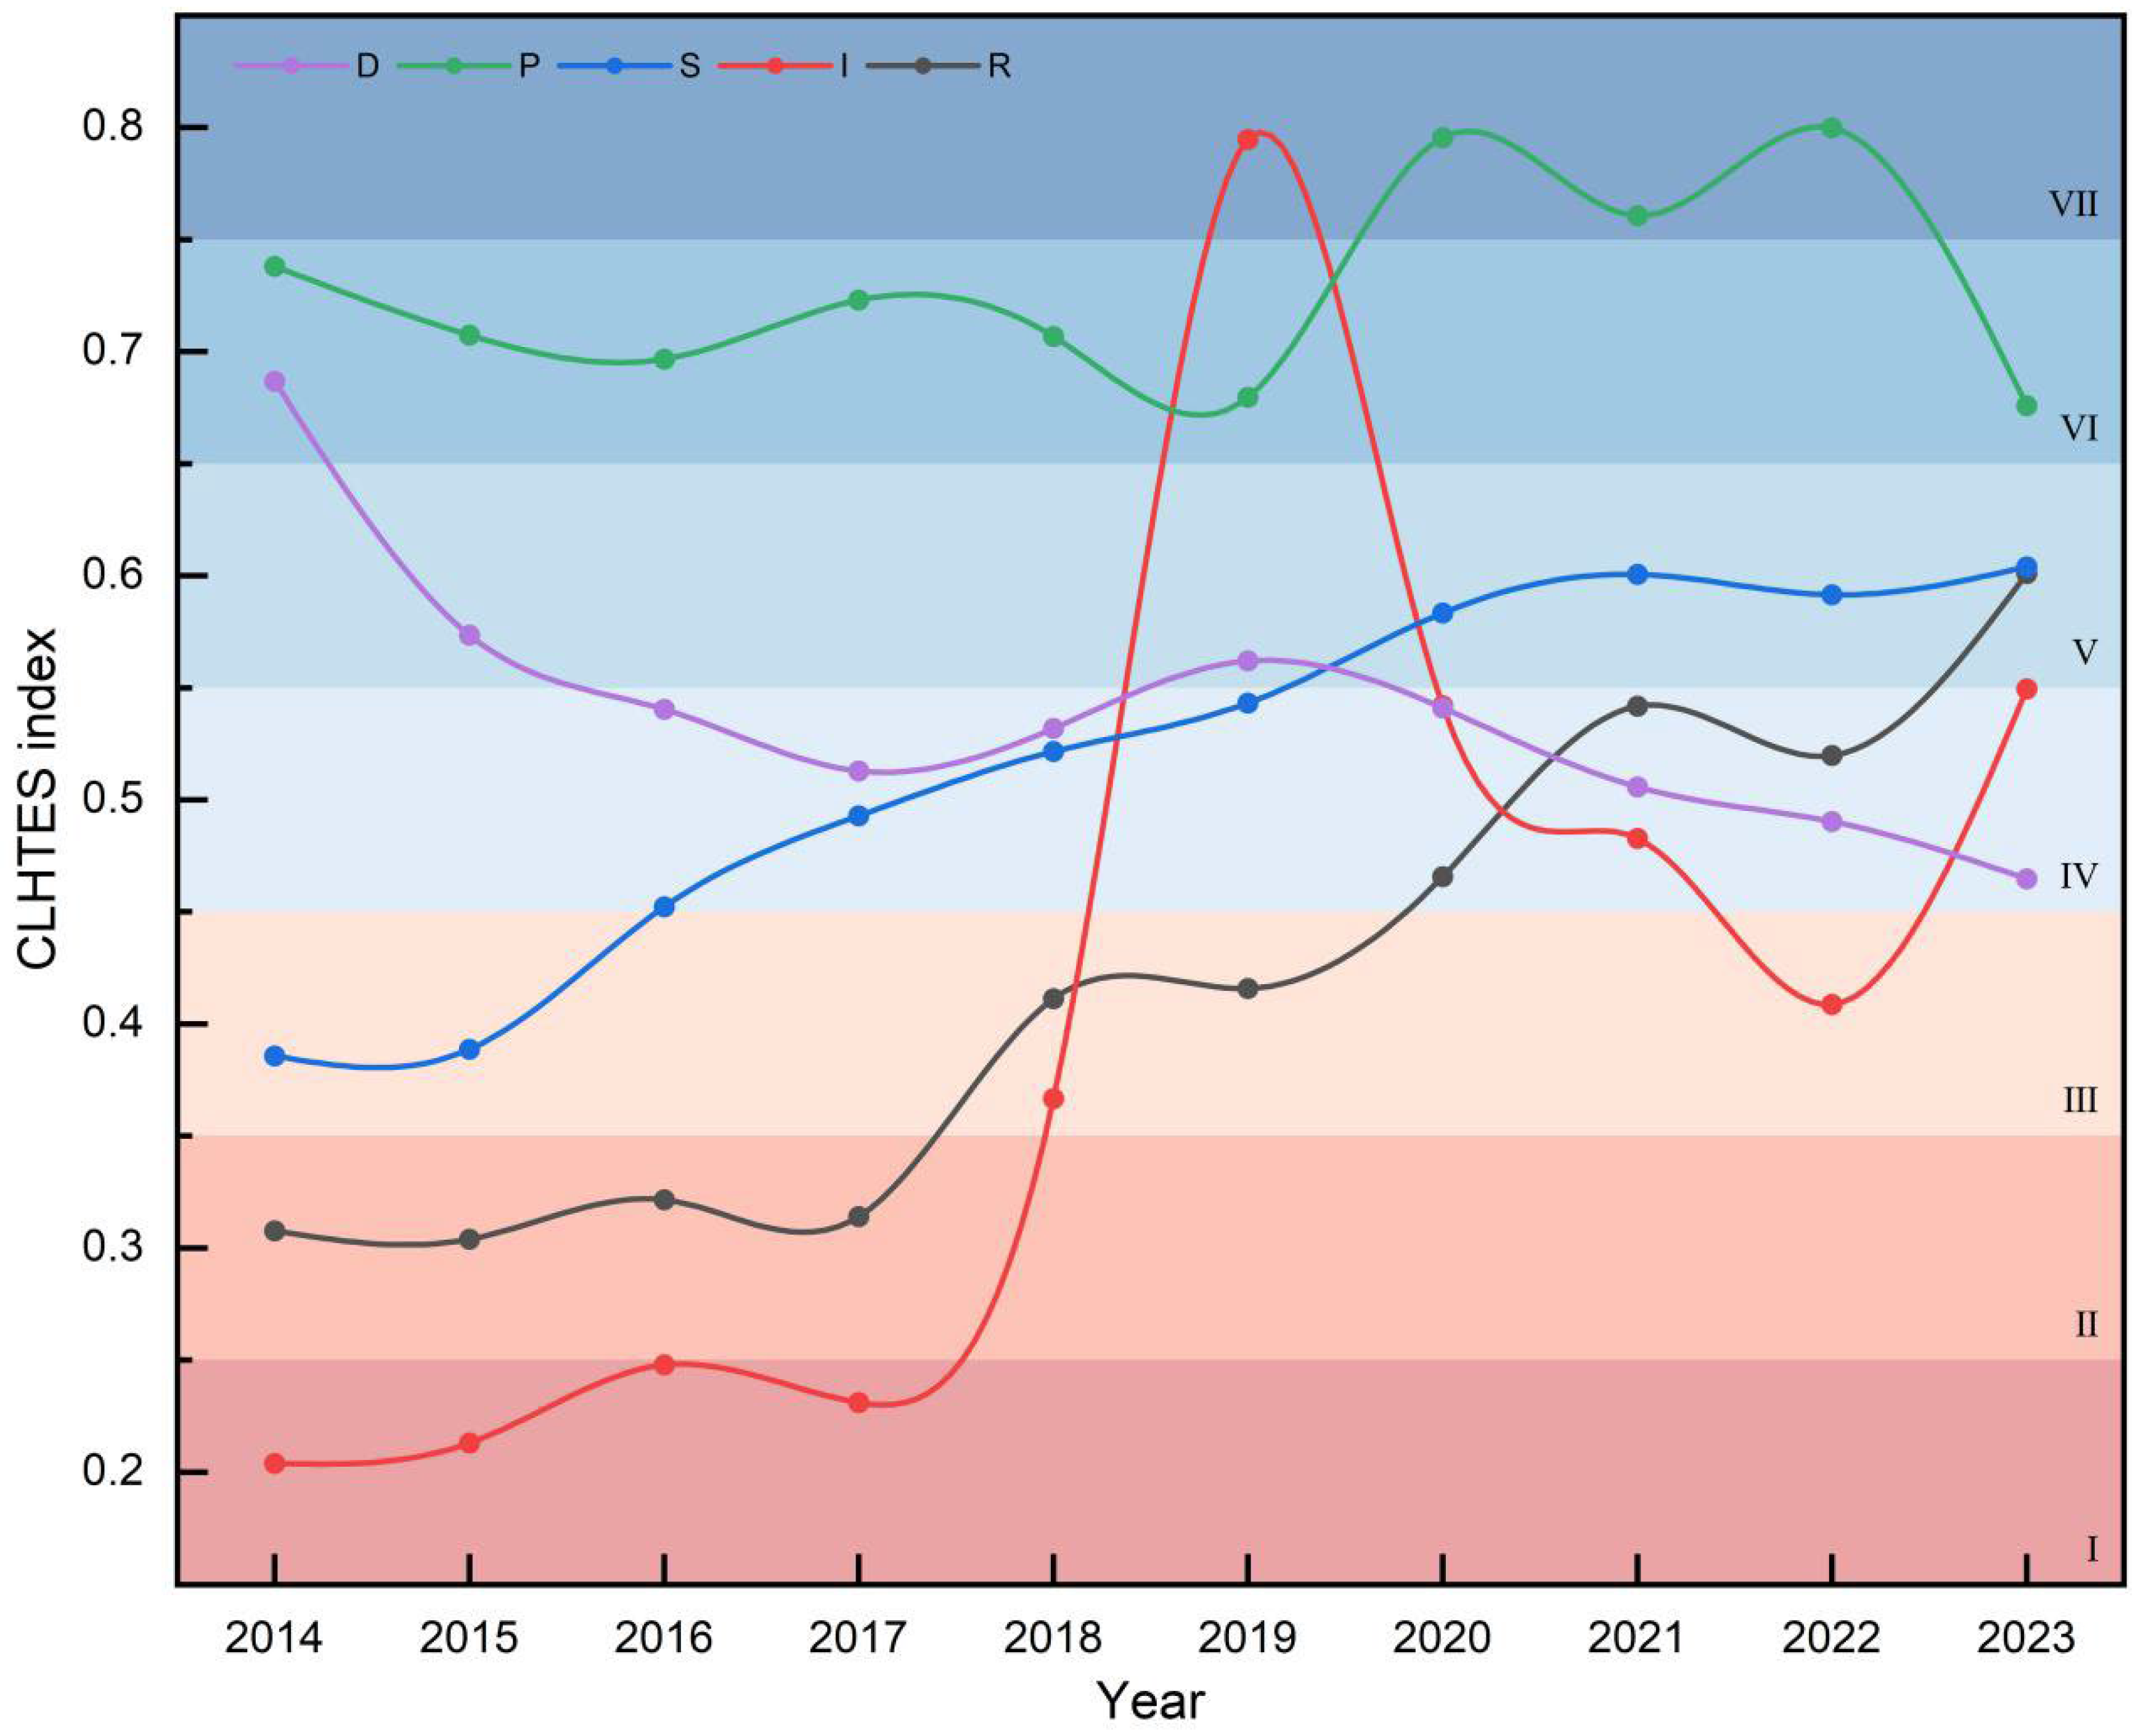
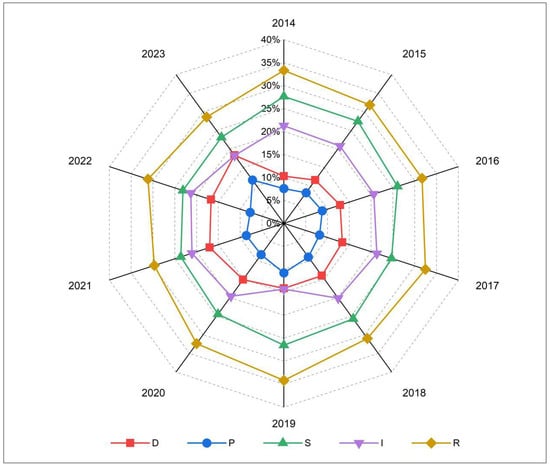
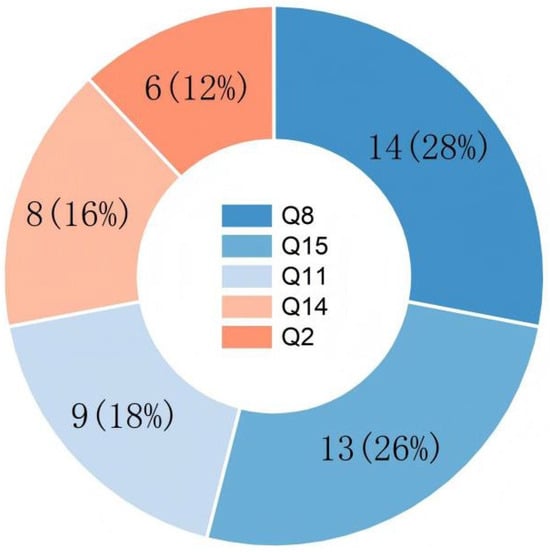
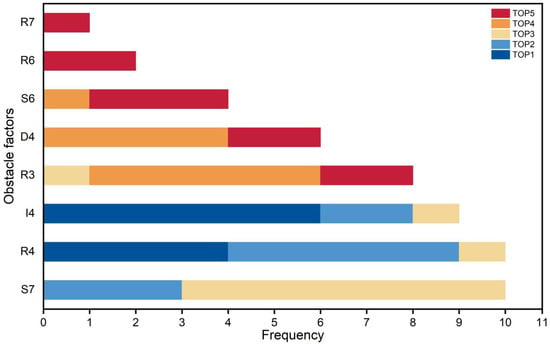
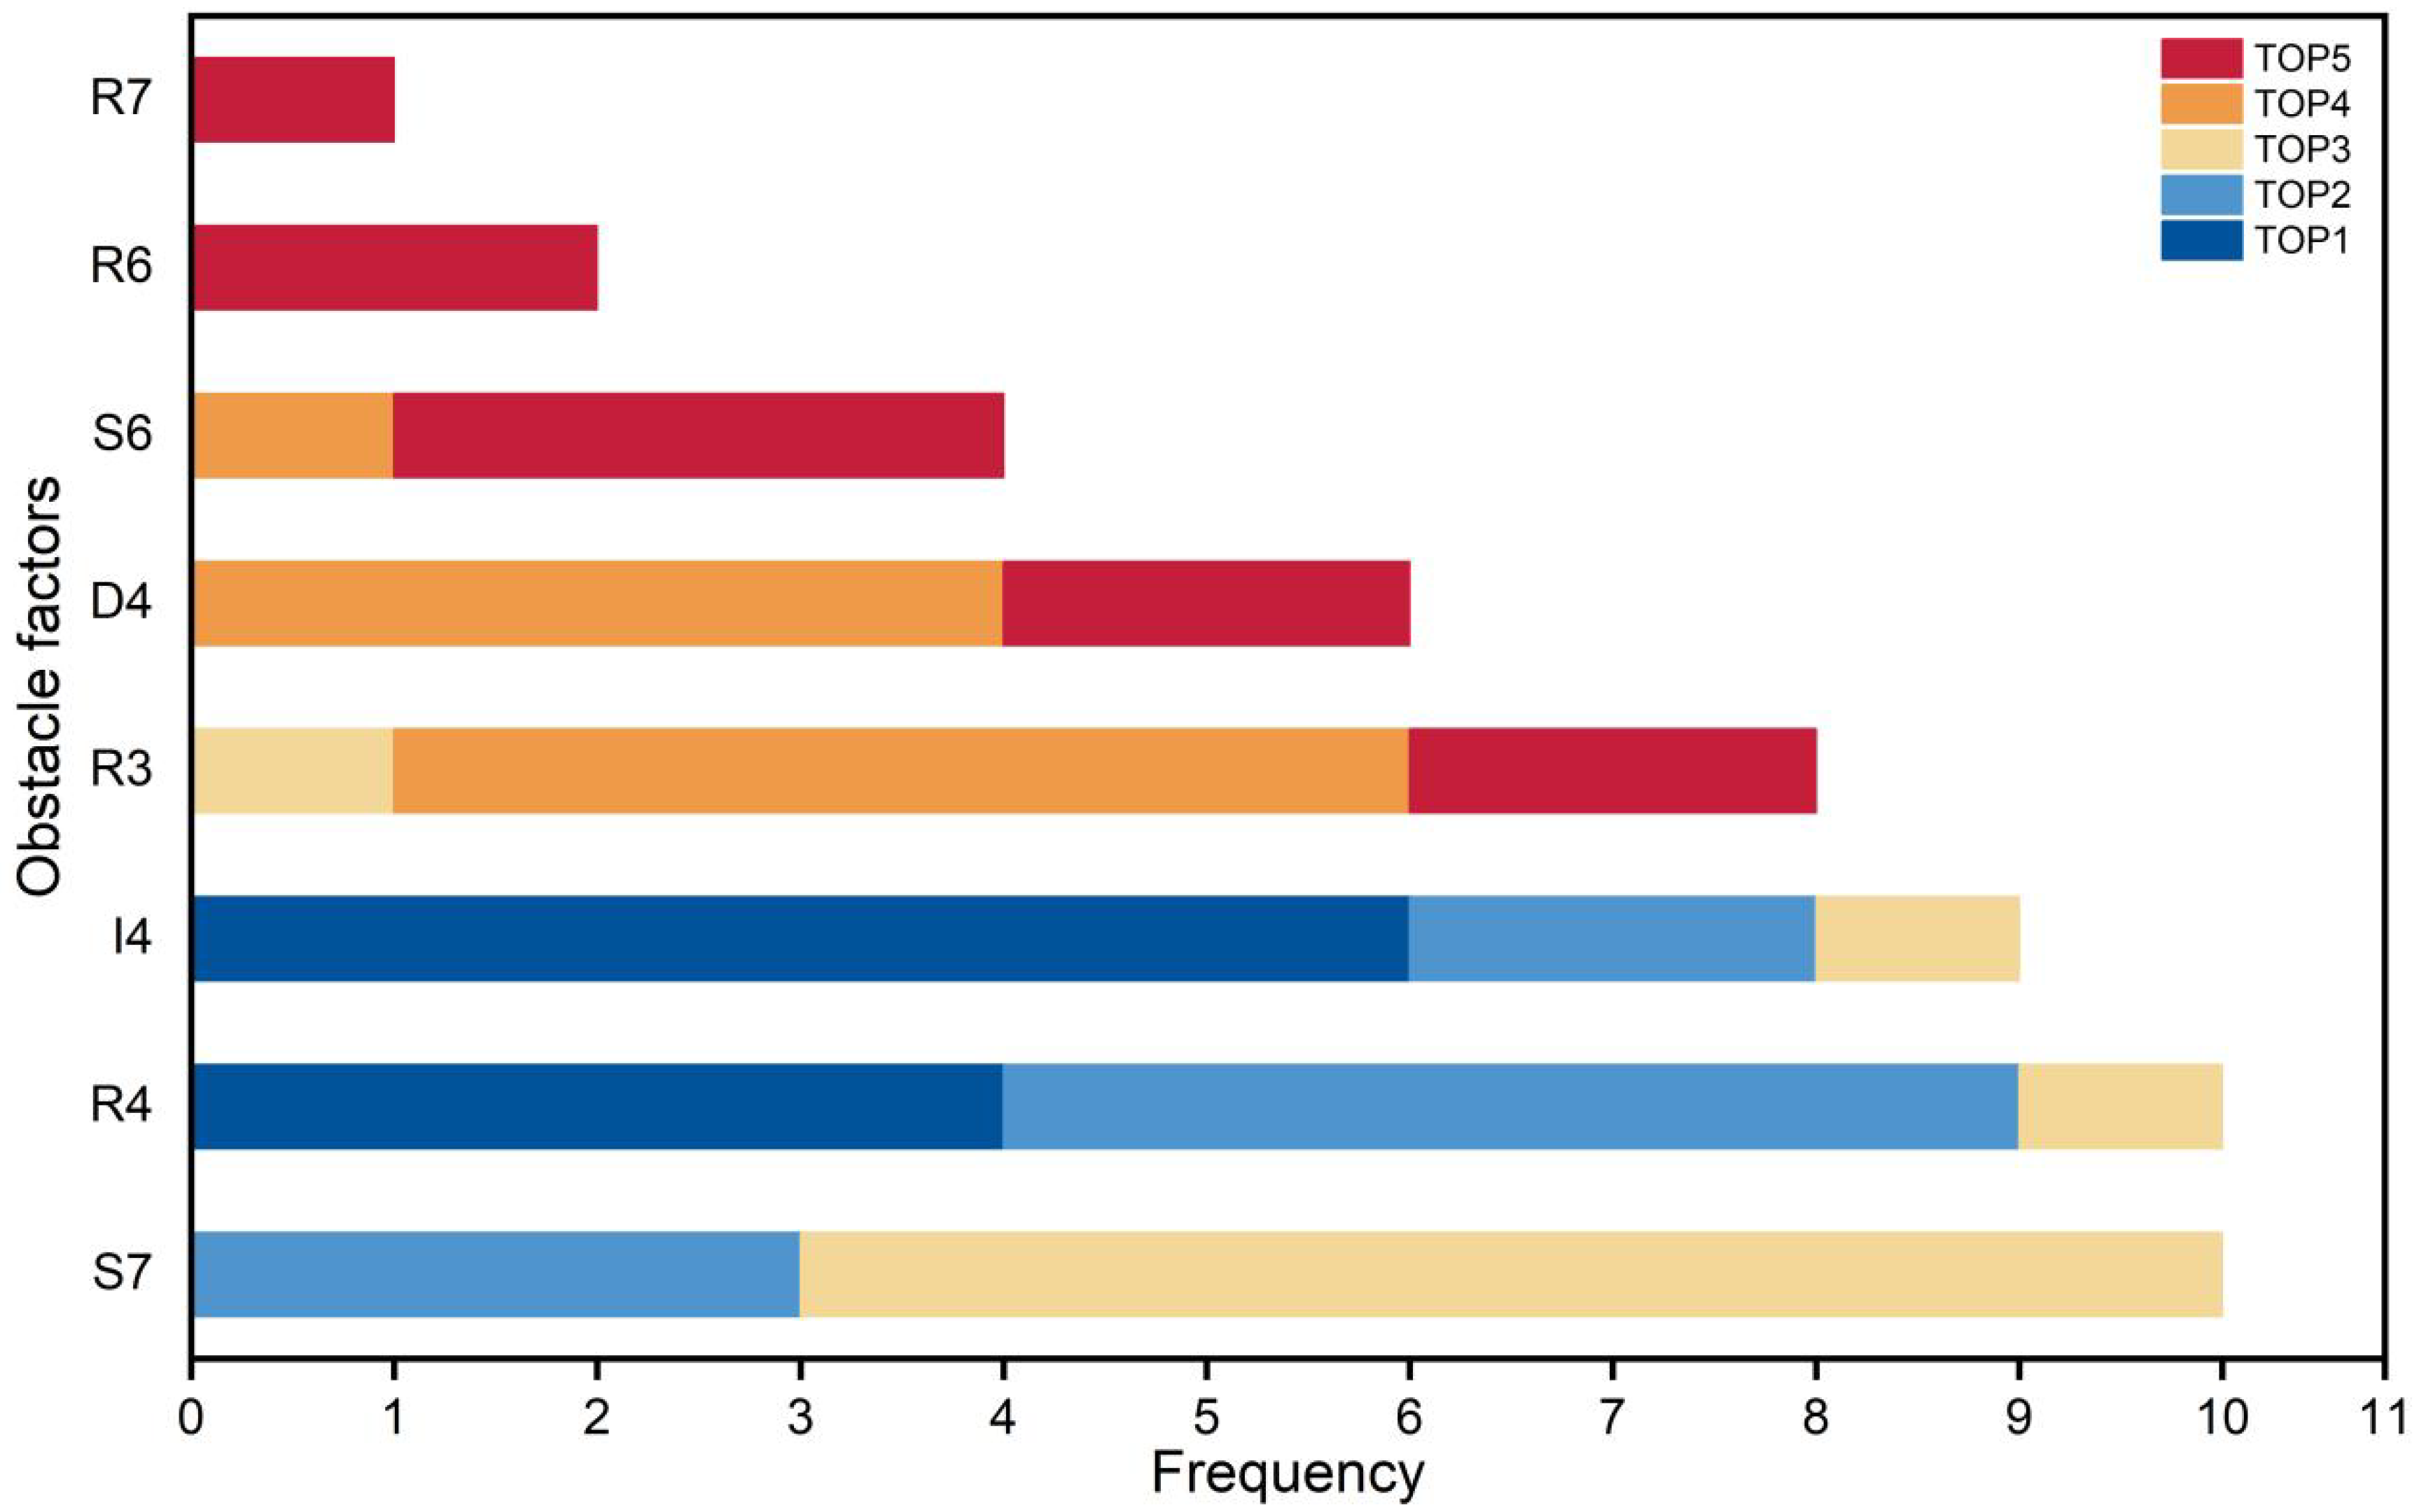
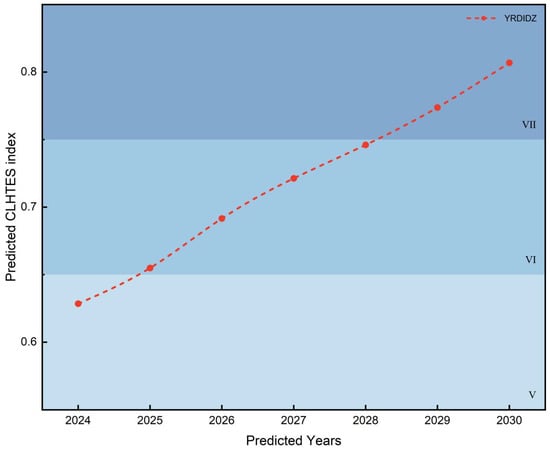
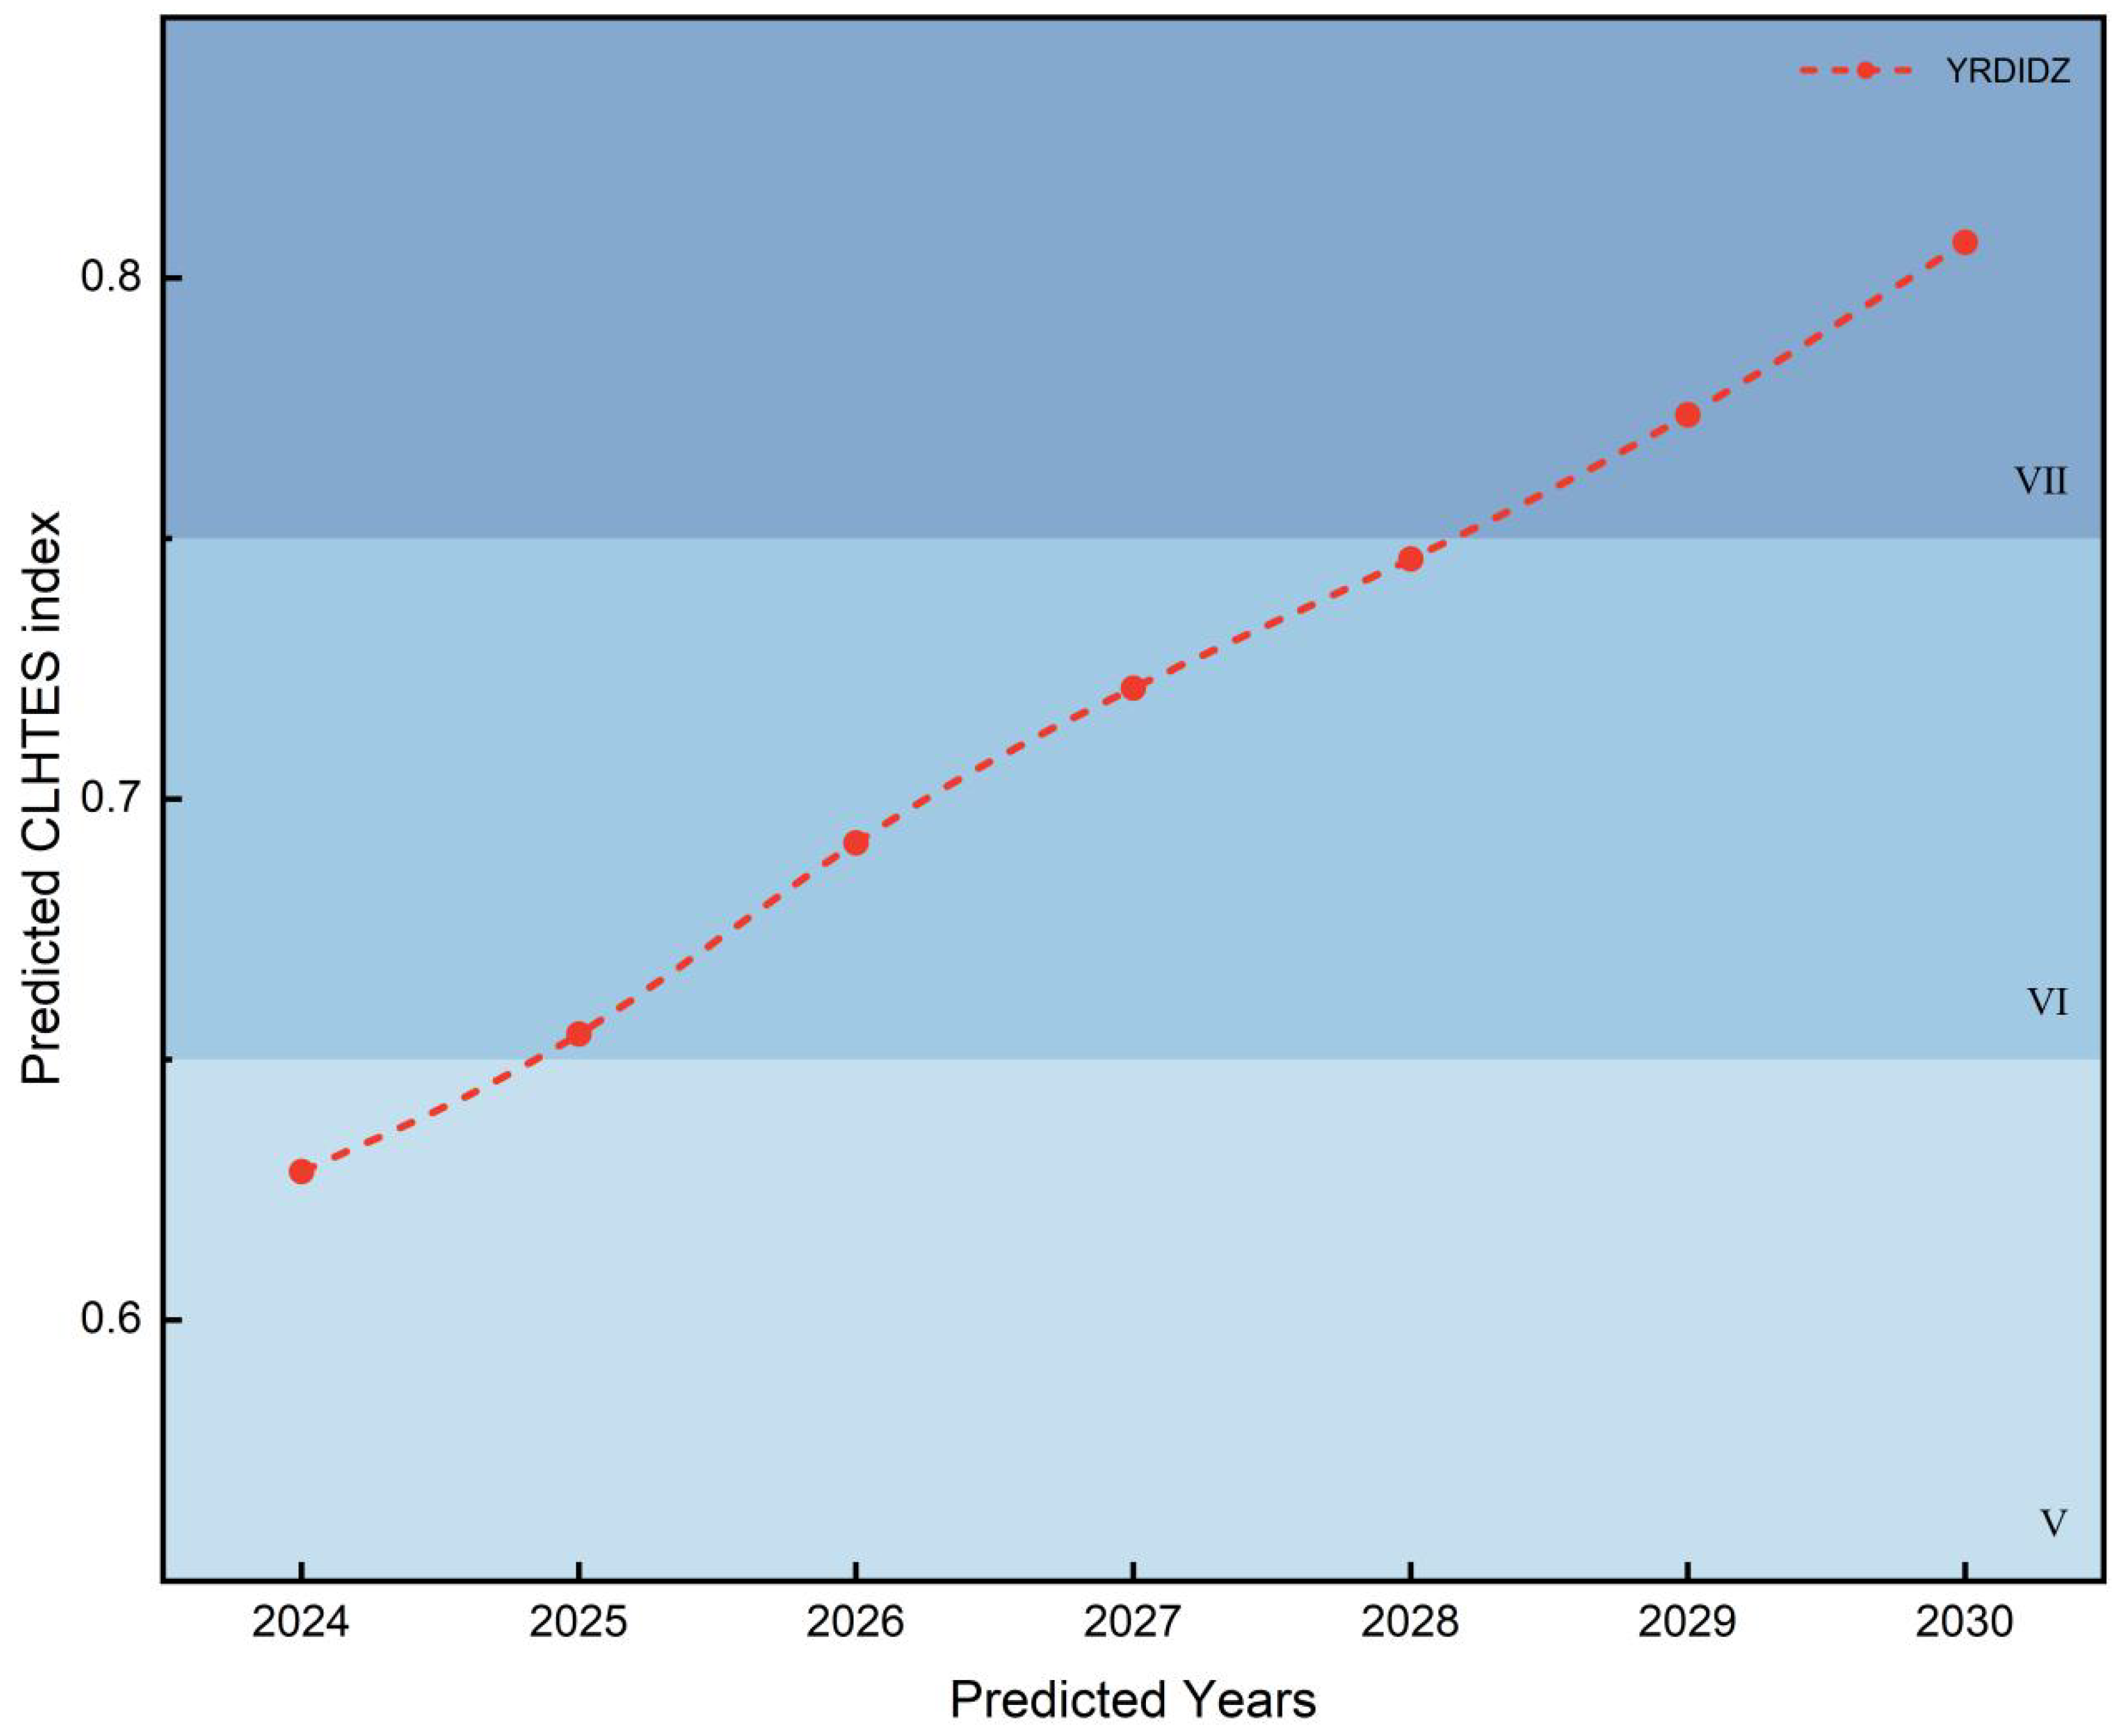

Disclaimer/Publisher’s Note: The statements, opinions and data contained in all publications are solely those of the individual author(s) and contributor(s) and not of MDPI and/or the editor(s). MDPI and/or the editor(s) disclaim responsibility for any injury to people or property resulting from any ideas, methods, instructions or products referred to in the content. |
© 2026 by the authors. Licensee MDPI, Basel, Switzerland. This article is an open access article distributed under the terms and conditions of the Creative Commons Attribution (CC BY) license.