


Abstract
Climate change and rapid urbanization are intensifying urban pluvial flooding and threatening sustainable urban development. This study proposes a three-stage, four-dimensional framework (TSFD-UPFR) to assess urban pluvial flood resilience across resistance, response, and recovery phases that integrate natural, infrastructural, social, and economic dimensions. Using a representative urban catchment affected by a typical extreme rainfall event, we couple hydrological–hydrodynamic simulations with multi-source remote sensing and socio-economic indicators at a 100 m grid resolution to enable spatially explicit assessment. The results indicate moderate overall resilience with pronounced spatial heterogeneity. Resistance is primarily constrained by drainage capacity and impervious surfaces, response is shaped by road connectivity and public service accessibility, and recovery is determined by essential facility restoration and economic support. Low-resilience clusters are concentrated in dense built-up areas and transport hubs, revealing structural weaknesses in adaptive capacity. By linking flood processes with socio-economic recovery dynamics, the framework captures cross-stage interactions within urban systems. The findings support climate-adaptive planning, targeted infrastructure investment, and resilience-oriented governance, contributing to sustainable and equitable urban transformation in megacities facing intensifying extreme rainfall.
1. Introduction
Global climate change and rapid urbanization are intensifying extreme rainfall events, posing major challenges to sustainable urban development [1]. Urban pluvial flooding leads not only to economic losses and infrastructure disruption but also to widening social inequities and ecological stress [2,3]. As cities transition toward resilience-oriented flood governance, enhancing urban pluvial flood resilience has emerged as a key pathway for achieving Sustainable Development Goal 11 (Sustainable Cities and Communities) and as a central concern in megacity disaster mitigation and adaptive urban management [4,5].
Urban pluvial flood resilience (UPFR) represents the capacity of an urban system to absorb disturbances, maintain essential functions, and recover rapidly throughout the flood process [6]. Within the broader sustainability framework, resilience is regarded as a critical attribute of socio-ecological systems that enables cities to cope with climate uncertainty and maintain long-term functional stability [7]. UPFR is shaped by the interaction of natural conditions, infrastructure networks, and socioeconomic systems, and its spatial heterogeneity reflects the uneven distribution of adaptive capacity across urban landscapes [8,9,10].
In recent years, research has advanced the conceptualization of UPFR through multidimensional indicator systems, hydrodynamic modeling, and remote sensing approaches. Indicator frameworks have evolved from single-dimension perspectives to more integrated structures. Representative examples include the 4R framework, which emphasizes robustness, redundancy, resourcefulness, and rapidity [11], and stage-based concepts organized around pressure, state, and response [12]. These developments have strengthened the theoretical foundation of resilience assessment. Assessment indicators have become increasingly comprehensive over time. Early studies focused on physical factors such as terrain and drainage infrastructure. More recent research incorporates urban form, ecological conditions, socioeconomic characteristics, and governance variables, providing a more complete representation of resilience drivers [13,14,15]. Methodologically, many studies combine multi-indicator evaluation, GIS-based spatial analysis, and hydrological or hydrodynamic simulation [16,17]. Hydrodynamic models are used to simulate flood processes, while remote sensing techniques provide high-resolution spatial information [18]. Research now spans multiple spatial scales, including urban agglomerations, river basins, regions, and grid-level units [19,20], supporting both system-level assessment and detection of local variability.
However, several challenges limit the contribution of existing studies to sustainable urban governance. First, coarse spatial units such as administrative districts or sub-catchments mask localized structural weaknesses, constraining targeted and equitable resilience planning. Second, the reliance on temporally decoupled static indicators and the subsequent collapsing of multi-stage characteristics into a single composite score obscures the dynamic evolution of adaptive capacity across the disaster cycle. Third, fragmented integration of physical, ecological, and socioeconomic dimensions hampers a comprehensive understanding of urban systems as coupled socio-ecological entities. Critically, few studies dynamically link simulated flood processes with their socioeconomic consequences, restricting the evaluation of actual recovery capacity.
In response to these limitations, this study investigates a representative upstream catchment of the Liangshui River in Beijing, a rapidly urbanizing megacity experiencing increasing climate-related flood pressures. An extreme rainfall event is used as a benchmark scenario to evaluate system performance under severe stress conditions. By focusing on a high-density urban watershed with complex socio-infrastructural interactions, the study provides a suitable context for evaluating resilience within a sustainable urban development perspective.
Building upon a unified multi-source evaluation system, we develop a dynamic framework for UPFR that integrates resistance, response, and recovery across natural, infrastructure, social, and economic dimensions. The framework enables a process-oriented understanding of how UPFR is distributed spatially and how stage-specific mechanisms shape overall resilience.
This study advances resilience assessment within the broader sustainability discourse in three key ways. First, it operationalizes dynamic resilience across the full disaster cycle through an integrated, process-informed, and event-aligned framework. Second, it reveals fine-scale spatial heterogeneity at a 100 m grid resolution, identifying localized structural weaknesses that constrain sustainable urban adaptation. Third, it dynamically bridges physical flood parameters with socio-economic recovery responses, offering robust evidence to support climate adaptation planning, targeted infrastructure investment, and resilience-oriented urban governance.
2. Study Area
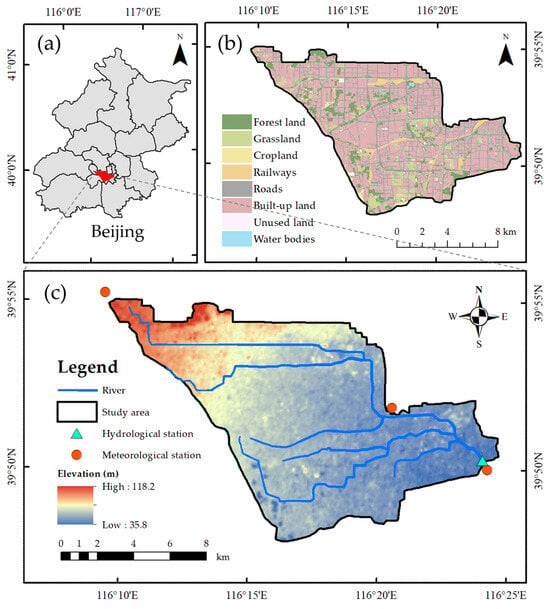
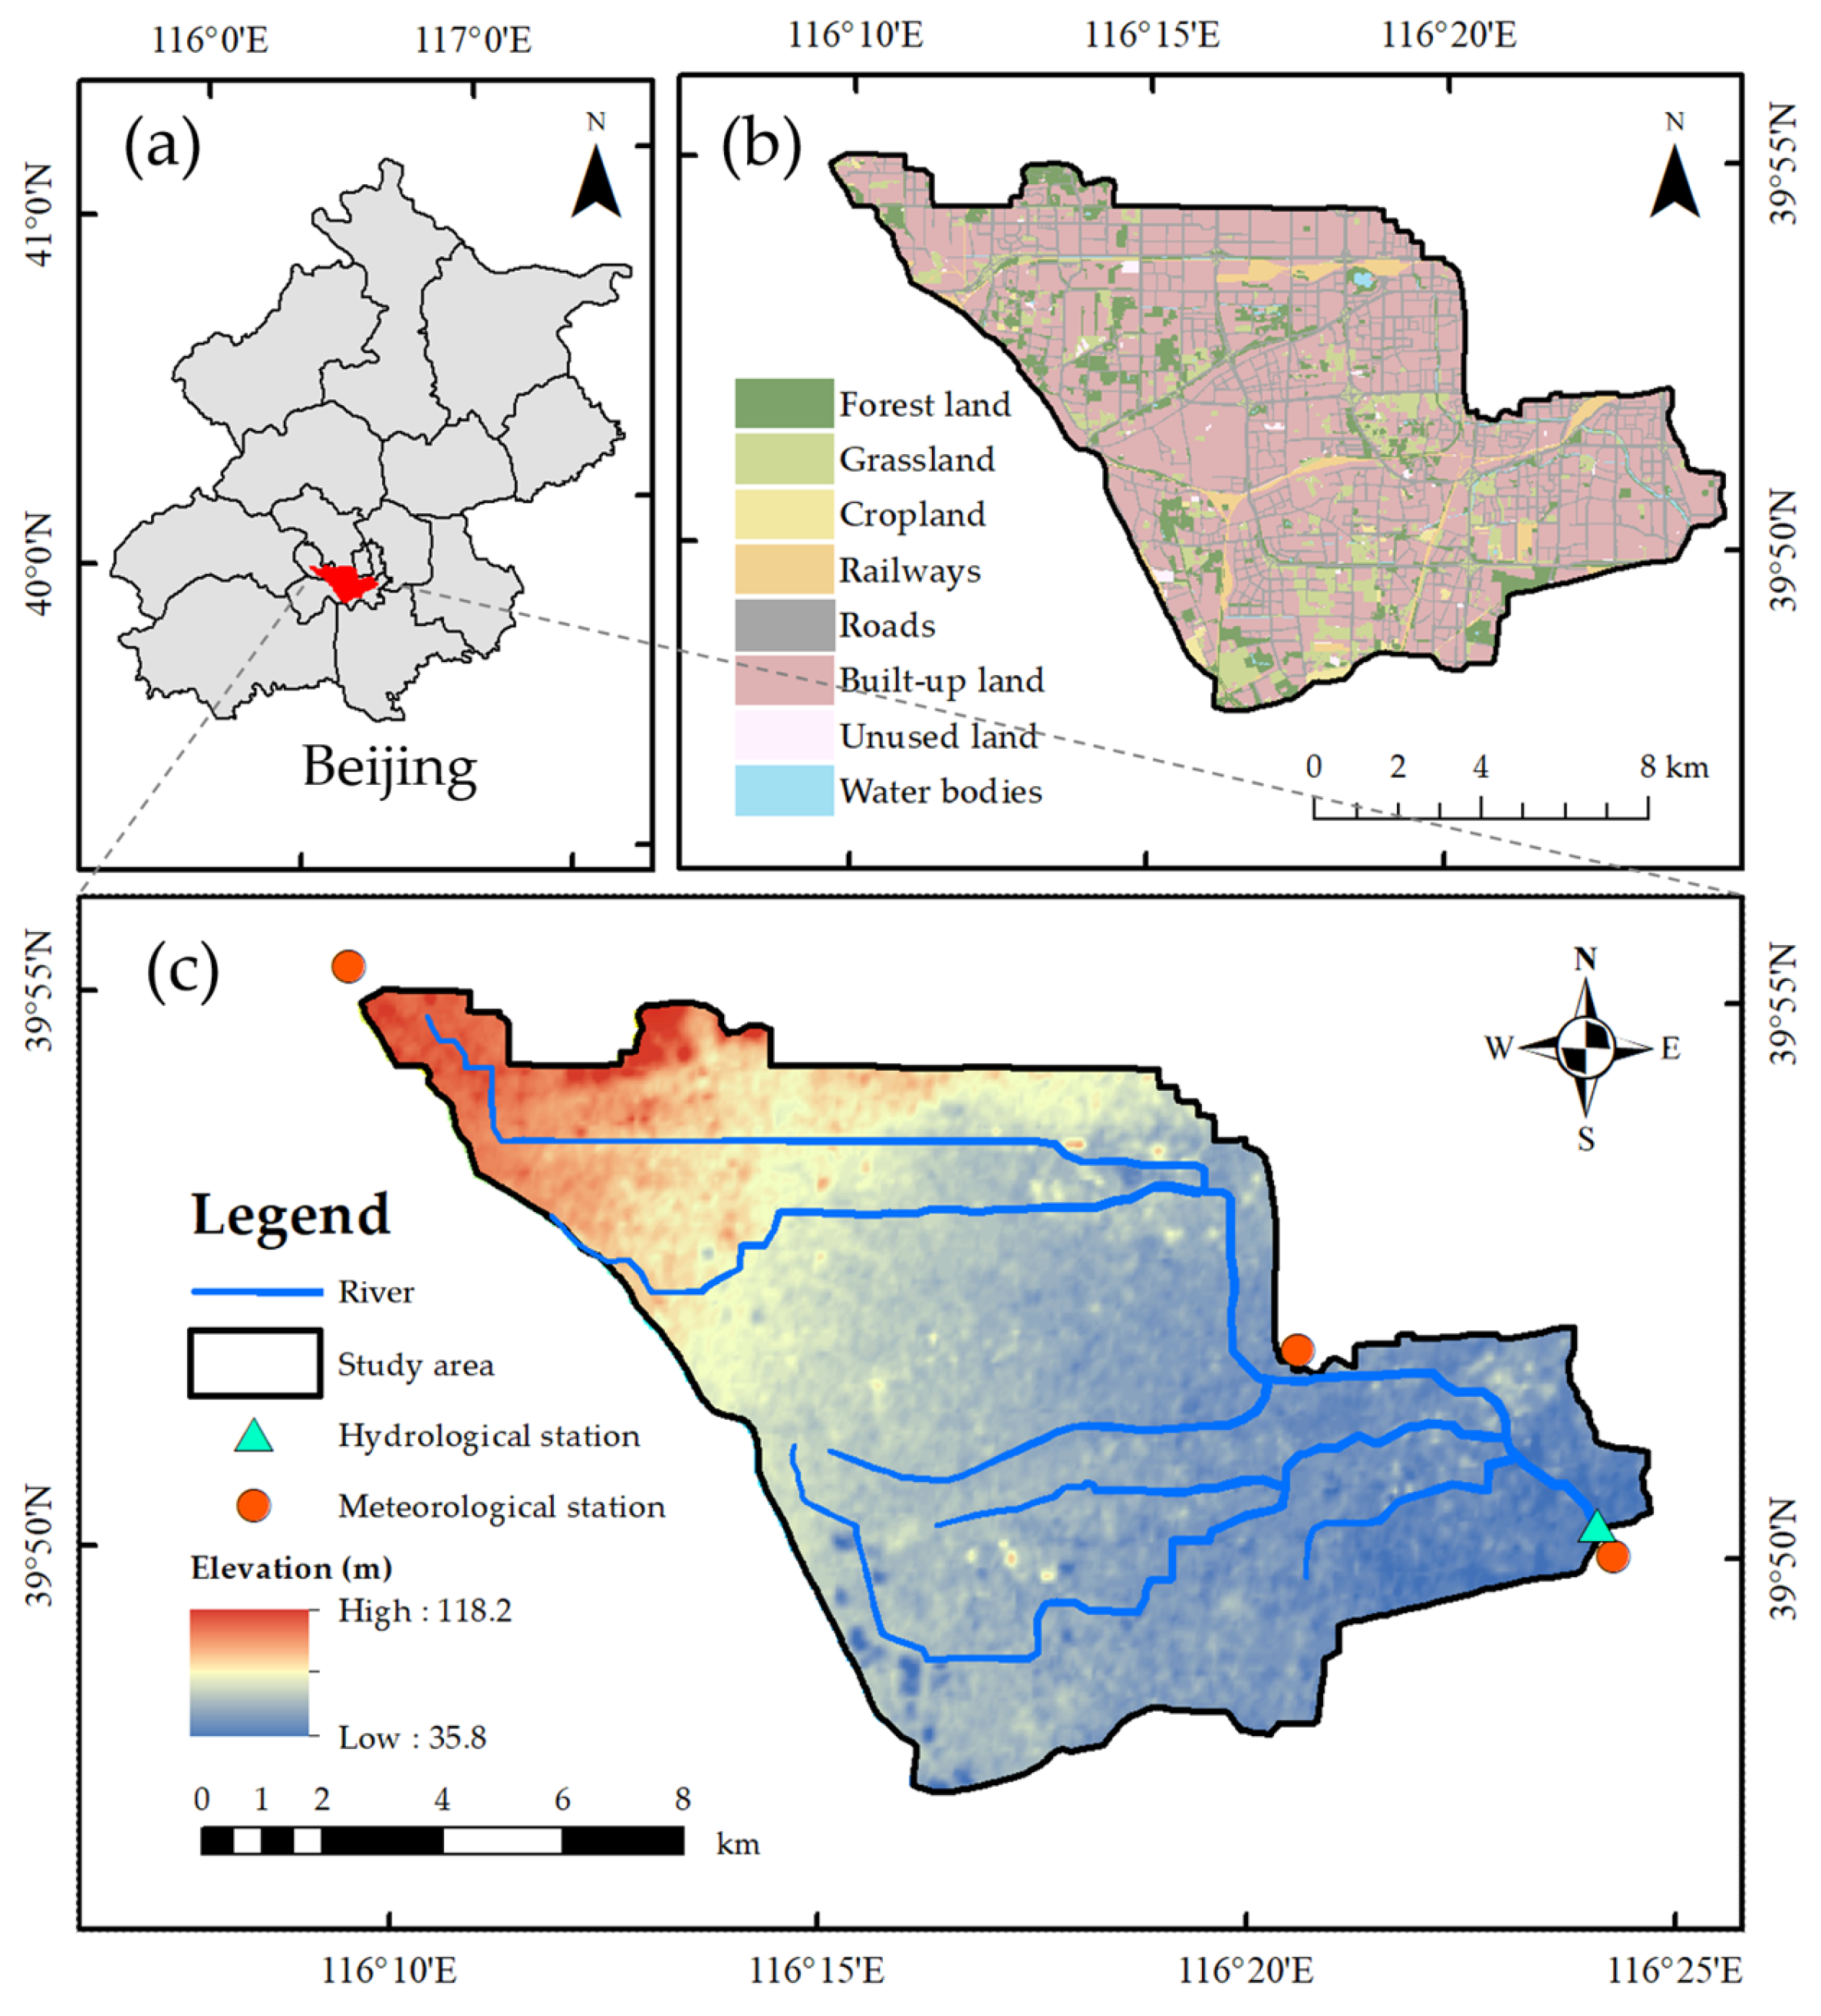
The Liangshui River is an important flood drainage channel in southern Beijing. It conveys runoff from the southern urban districts and diverts part of the floodwater from the central city [21]. It plays a key role in the municipal flood control system. This study focuses on the upstream catchment above the Dahongmen Sluice, as shown in Figure 1. The study area is located between 116°09′ and 116°25′ E and 39°48′ and 39°56′ N. The main river channel is 25.71 km long, and the total area is 131.47 km2.
Figure 1.
Spatial information of the study area: (a) location in Beijing; (b) land use types; (c) elevation, river network, and locations of hydrological and meteorological stations.
The terrain slopes from northwest to southeast. Approximately 80% of the area consists of plains. Built-up land accounts for about 81% of the study area, resulting in a highly impervious surface environment. The area contains a dense river network, including the Shuiya Canal, Xinfengcao River, Zaoyu Canal, and Macao River. The long-term mean annual precipitation is 522.4 mm. About 81.6% of the rainfall occurs between June and September. The combination of flat terrain, concentrated rainfall, and intense urbanization creates a high risk of urban flooding.
As the core upstream catchment of the Liangshui River, this area exhibits high-density urban development, typical surface characteristics, and frequent flood hazards from intense rainfall, making it a representative case for studying UPFR [22].
3. Methods and Data
3.1. Development of the UPFR Framework
Urban pluvial flood resilience (UPFR) can be conceptualized within the framework of disaster evolution theory [23]. In this study, UPFR is structured into three stages: resistance, response, and recovery. These stages correspond to pre-flood defense capacity, emergency management during flooding, and post-flood functional restoration. To operationalize this structure, a three-stage four-dimensional (TSFD) framework for UPFR is developed. It incorporates the four interrelated dimensions of nature, infrastructure, society and economy.
Indicator selection follows a set of clearly defined criteria. Each indicator must reflect the underlying mechanisms of pluvial flooding and correspond to the functional requirements of a specific stage. Data availability and measurability are also considered. Based on previous studies [19,24,25], the characteristics of extreme urban pluvial floods in the study area, and expert consultation, we select 22 indicators, as shown in Table 1. Spearman’s rank correlation analysis is conducted to assess indicator independence [26]. The results show that the absolute values of pairwise correlation coefficients among the 22 indicators with 97.8% falling below 0.4 (p < 0.05), indicating that the overall indicator system exhibits weak inter-indicator dependence and no widespread structural redundancy. The full correlation matrix is provided in Appendix A.1.
Table 1.
Indicators selection.
Indicators are then assigned to stages according to their functional roles in shaping resilience. The resistance stage focuses on natural storage and engineered flood control capacity. The response stage emphasizes the maintenance of critical urban functions and emergency support capacity. The recovery stage highlights ecological restoration efficiency and socioeconomic recovery capacity.
All indicators are classified as positive or negative based on their influence on resilience. They are standardized before further analysis. The framework provides a systematic basis for weight determination and UPFR assessment.
3.2. Data Sources
This study adopts the 20 July 2016 rainfall event in Beijing as the research scenario. The selected rainfall event represents one of the most intense and prolonged storm events recorded in Beijing [27], making it an appropriate stress-test scenario for evaluating urban flood resilience. All datasets are aligned with the 2016 study period to ensure temporal consistency.
The data include hydrological observations, a digital elevation model, remote sensing images, land use data, drainage network data, point of interest data, population statistics, gross domestic product data, and nighttime light data. Detailed sources are listed in Table 2.
Table 2.
Data sources and applications.
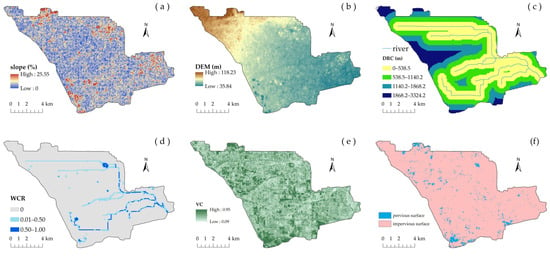
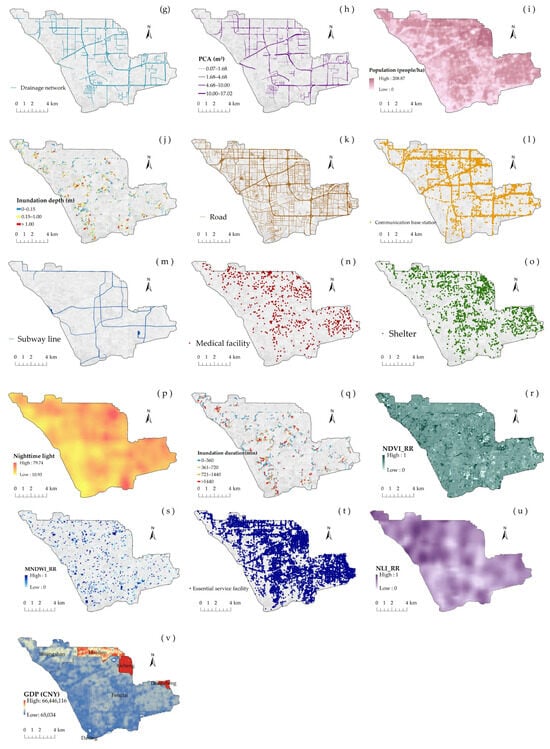
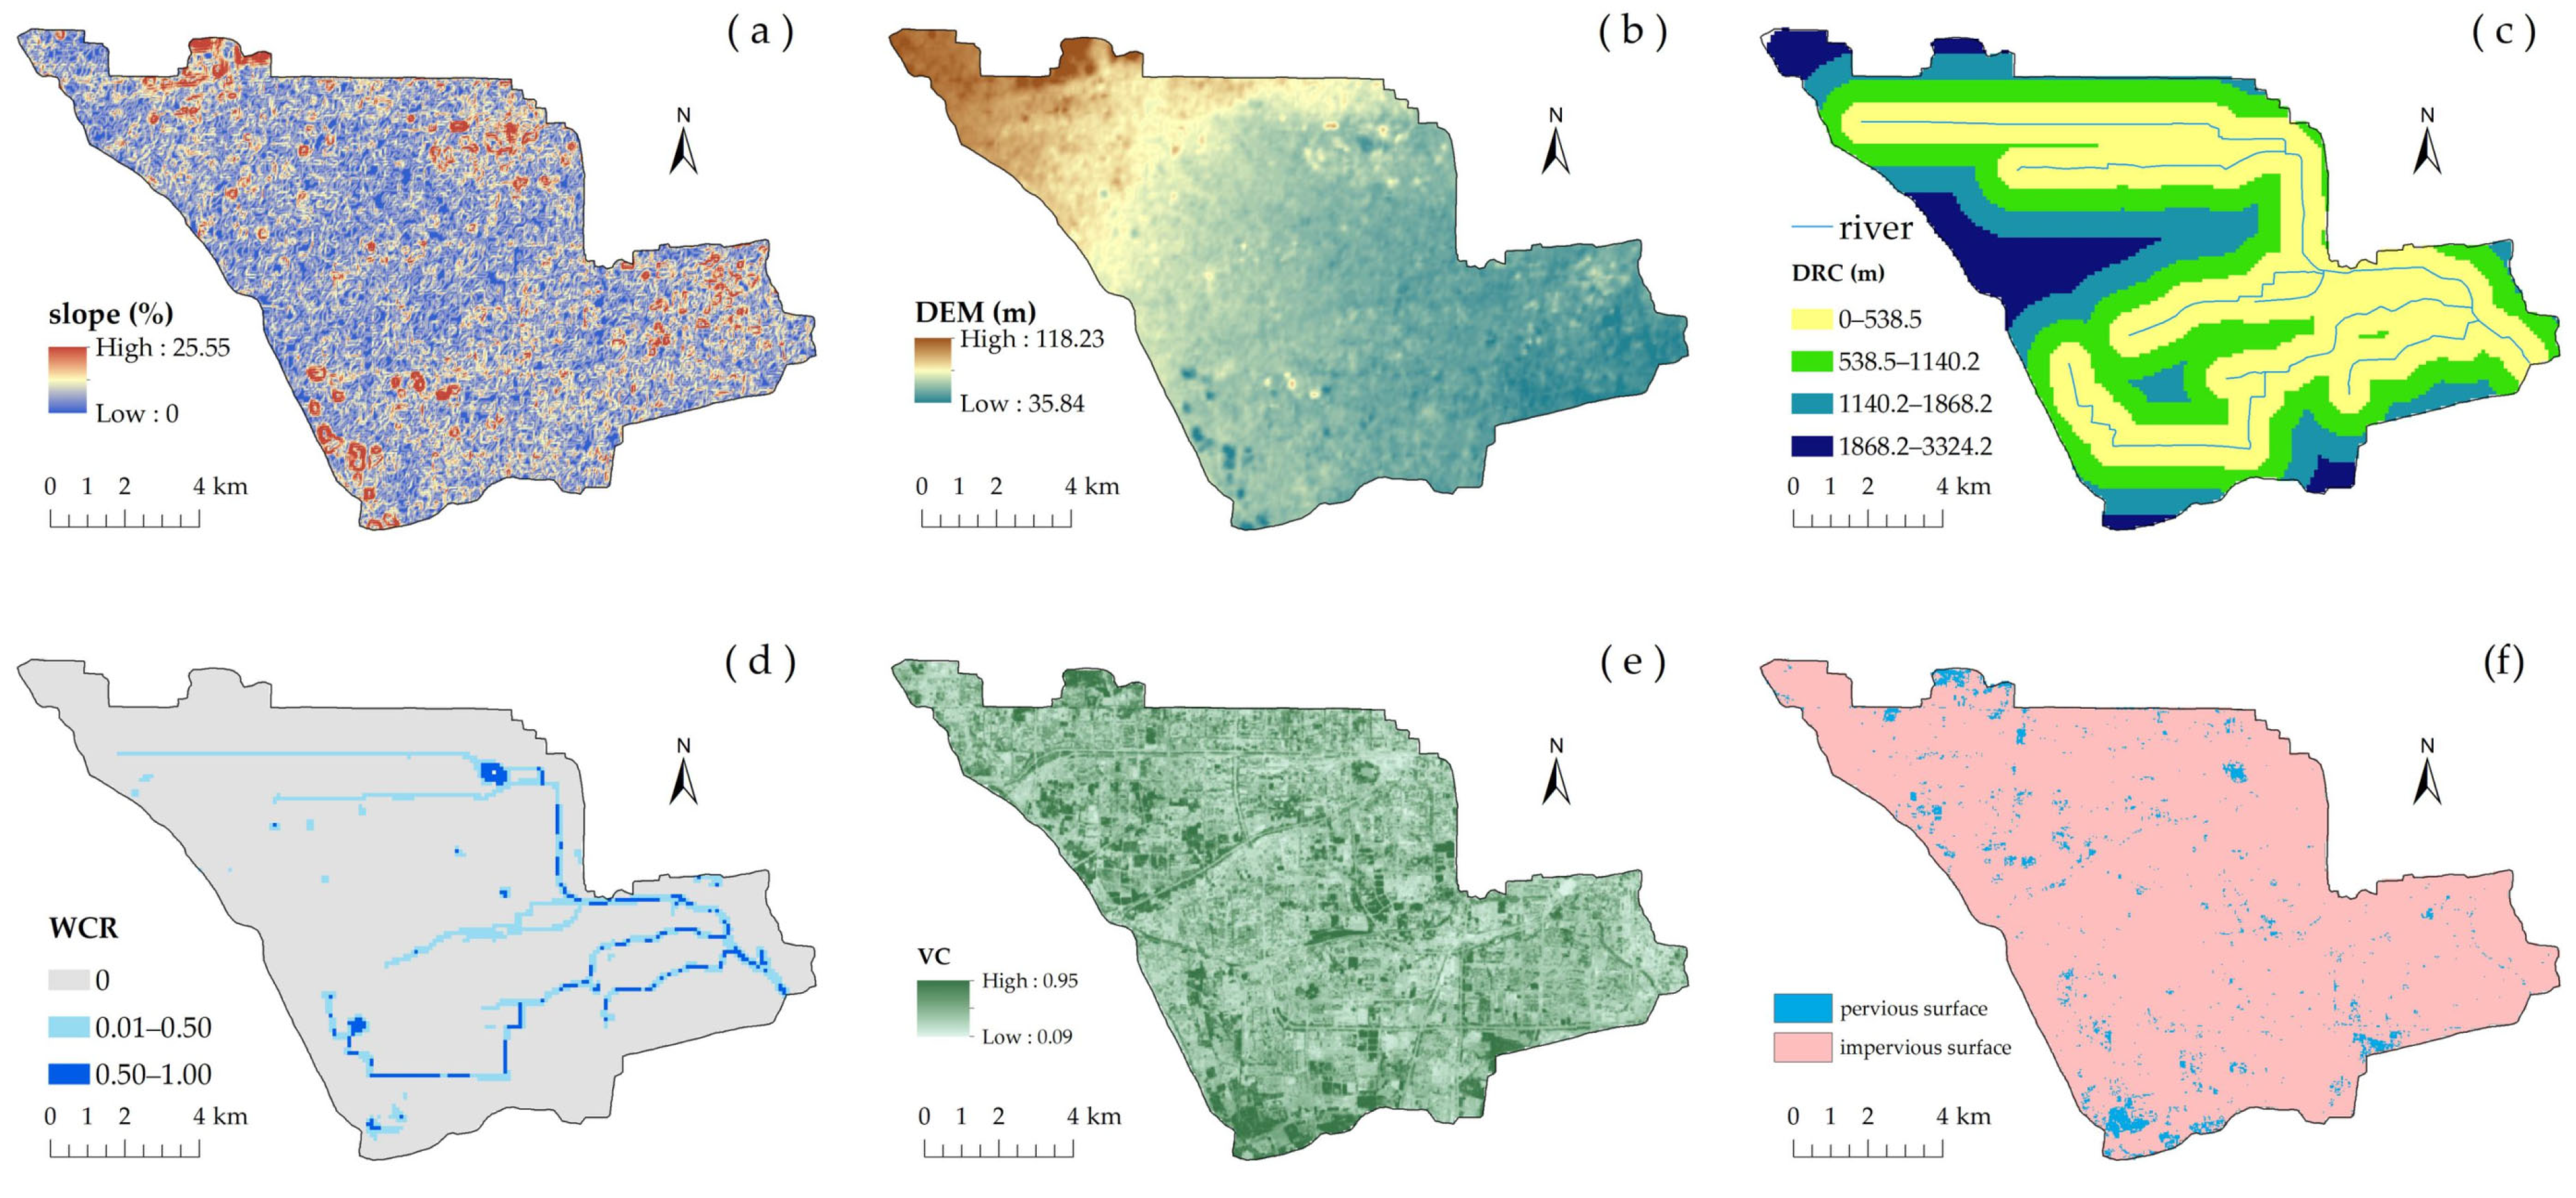
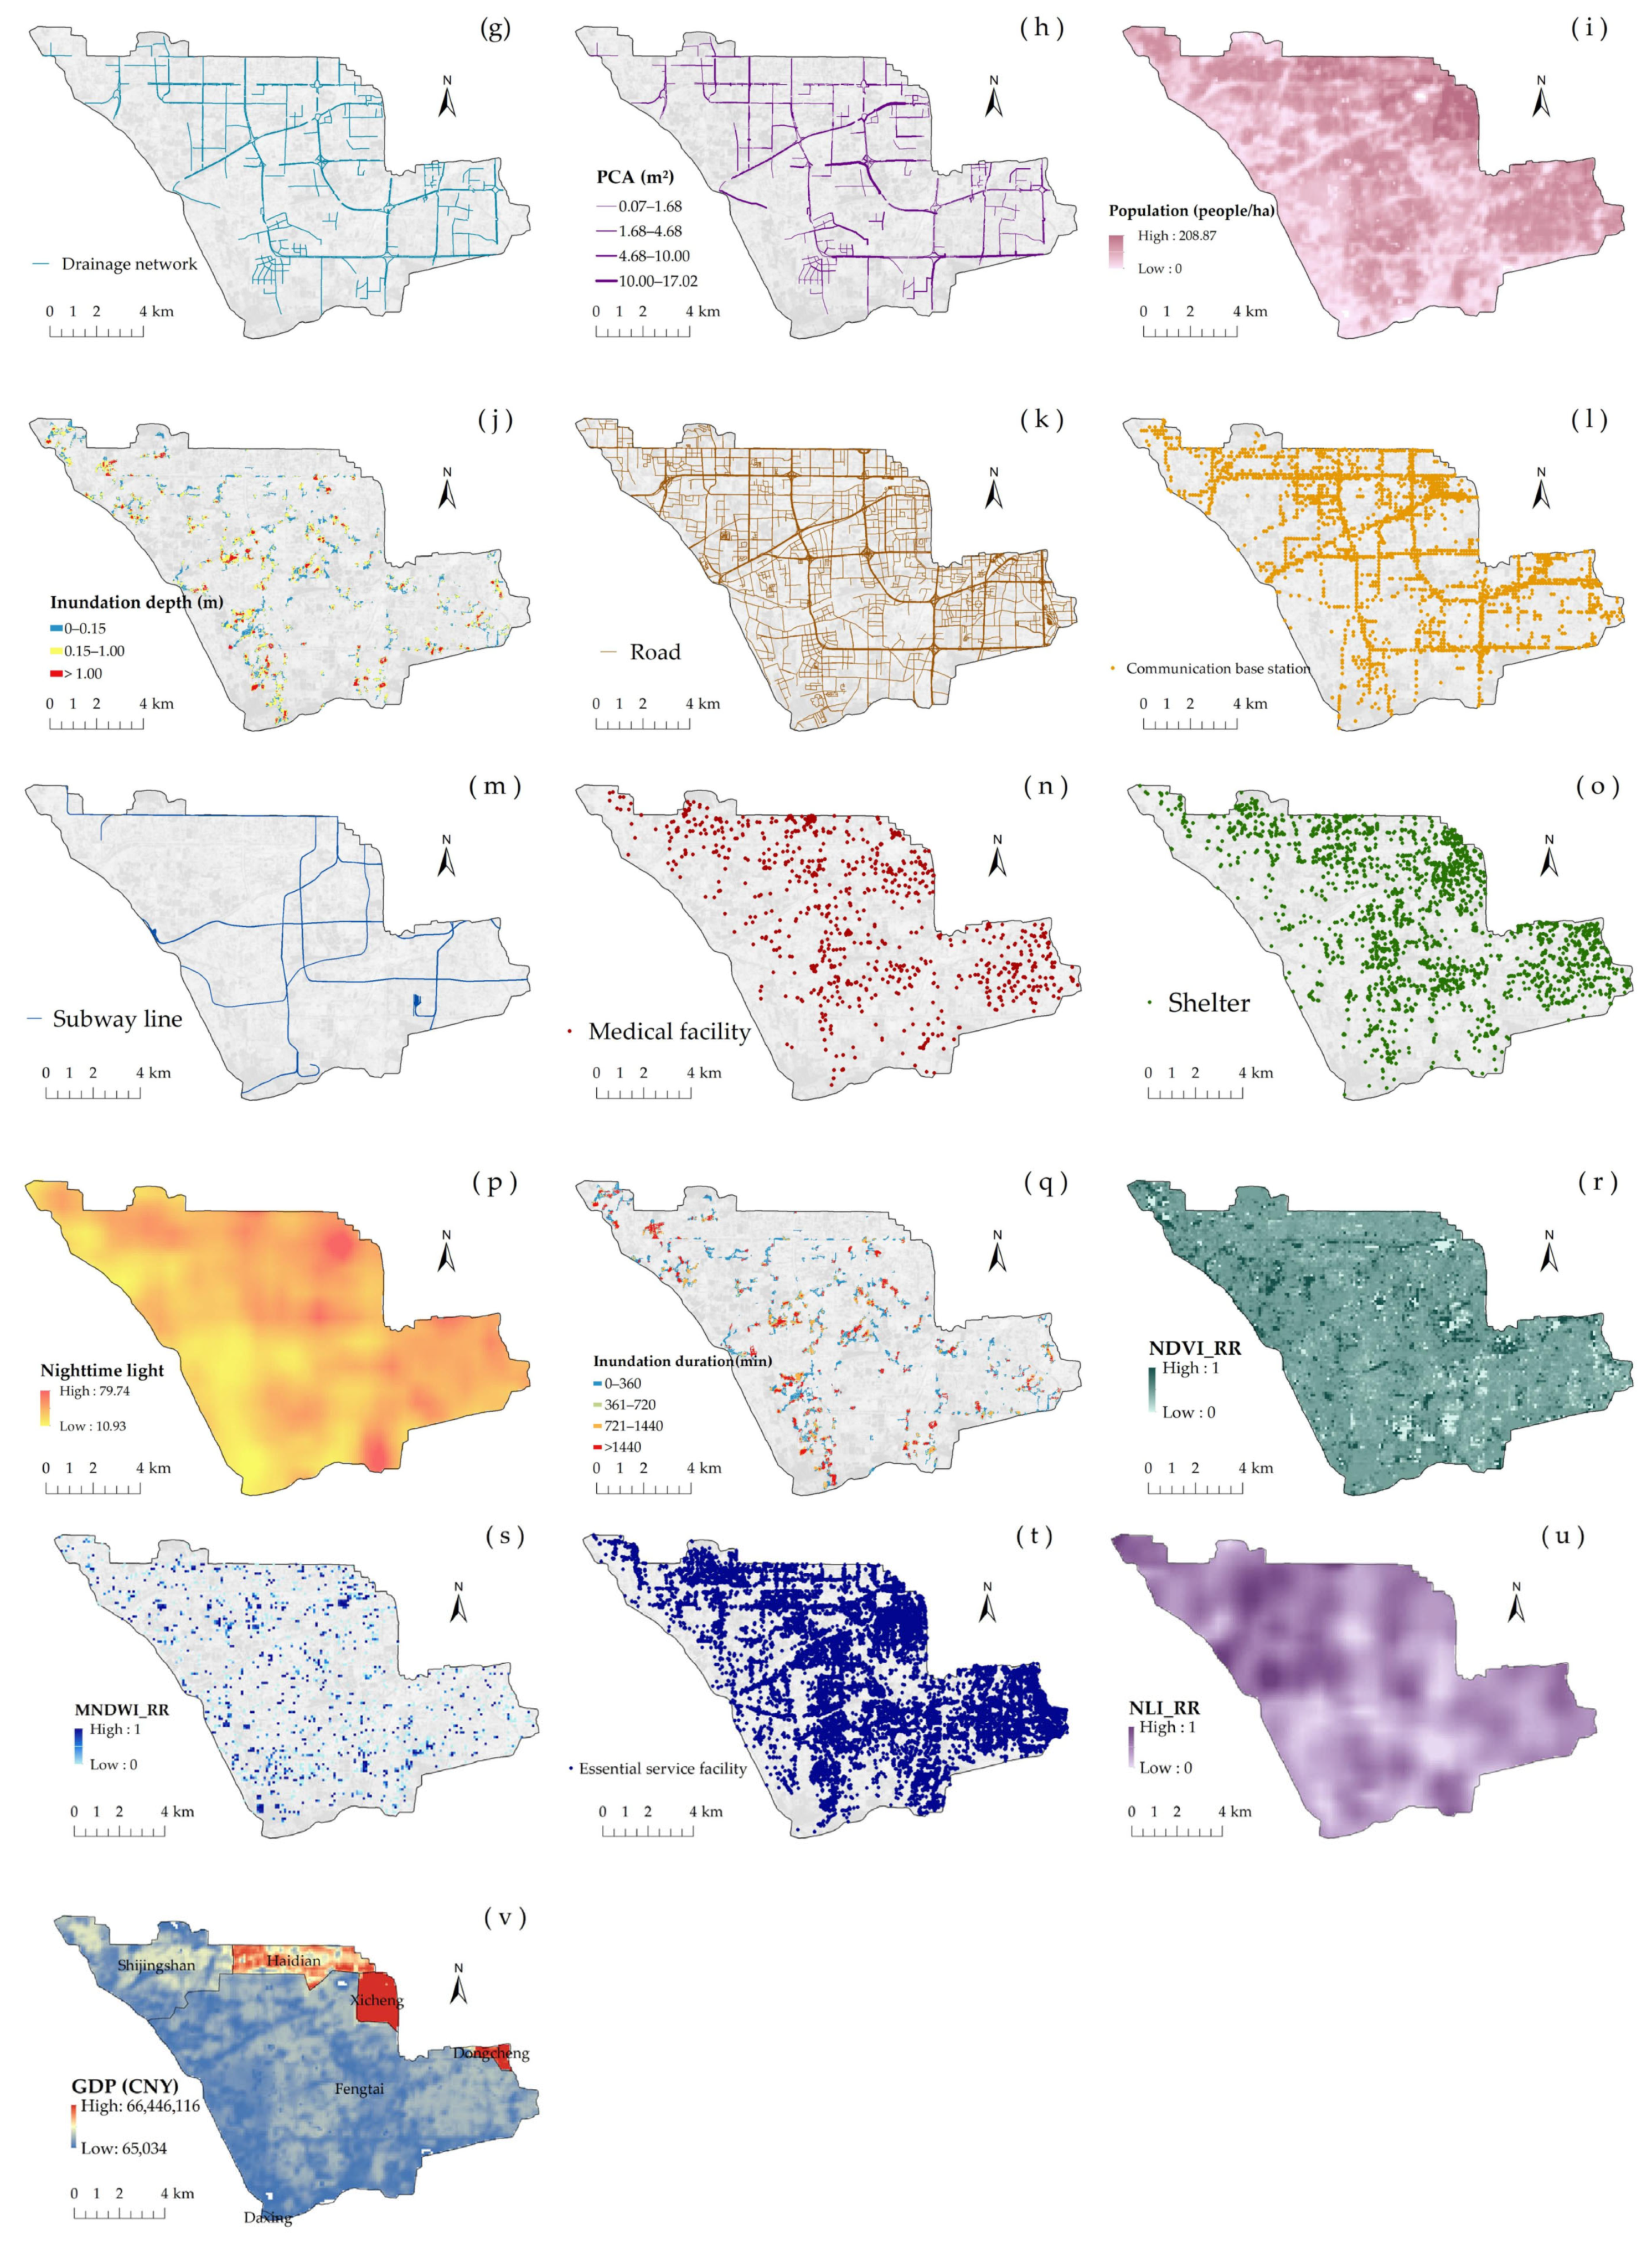
Based on these datasets, spatial layers are constructed for the 22 indicators used in the TSFD-UPFR framework. Figure 2 presents the spatial distribution of these indicators across the study area. The maps illustrate the spatial heterogeneity of natural conditions, infrastructure configuration, social attributes, and economic activity. These spatial datasets provide the basis for subsequent stage-specific and overall UPFR assessment.
Figure 2.
Spatial distribution of data sources for the 22 indicators: (a) slope; (b) DEM; (c) distance to river channel; (d) water coverage ratio; (e) vegetation coverage ratio; (f) pervious surface and impervious surface; (g) drainage network; (h) pipe cross-sectional area; (i) population; (j) inundation depth; (k) road; (l) communication base station; (m) subway line; (n) medical facility; (o) shelter; (p) nighttime light; (q) inundation duration; (r) NDVI recovery rate; (s) MNDWI recovery rate; (t) essential service facility; (u) Nighttime light recovery rate; (v) GDP.
3.3. Indicator Quantification
Because the spatial resolutions of the multi-source data vary, all indicators are resampled to a 100 m × 100 m grid. The study area is divided into 13,832 grid cells. This resolution aligns with the original resolution of key data such as population and GDP. It also captures spatial heterogeneity in urban surfaces, drainage networks, transportation, and public service facilities. The 100 m grid balances assessment accuracy and computational efficiency. Continuous indicators are resampled using bilinear interpolation, whereas discrete indicators are resampled using the nearest-neighbor method to preserve spatial characteristics and physical consistency.
3.3.1. Dynamic Physical Indicators Based on Hydrological–Hydrodynamic Coupled Model
InfoWorks ICM (2021.1, Innovyze Ltd., Wallingford, UK) is a comprehensive urban water simulation and management model. It can simulate interactions between drainage networks and rivers, and between one-dimensional pipelines and two-dimensional surface water. The model provides a integrated representation of urban rainfall-runoff processes [39].
The 20 July 2016 rainfall event was simulated using the InfoWorks ICM model to quantify the resulting urban pluvial flooding in the study area. The model builds upon an existing coupled hydrological–hydrodynamic model for the upstream Liangshui River catchment above the Dahongmen Sluice. Measured river cross-sections and water level data were used to calibrate the one-dimensional river module and downstream boundary conditions. This calibration improves the representation of river surcharge and interactions with the drainage system.
The model generates two-dimensional inundation results at 30 min intervals. Key indicators include ID and MID. MID represents the duration during which water depth exceeds 0.15 m in each grid cell. It reflects surface water retention and drainage efficiency decline. These indicators describe the intensity and duration of urban flooding during the event. They also provide a physical basis for subsequent recovery assessment. The InfoWorks ICM model categorizes underlying surfaces into pervious and impermeable types. The Horton method is used for runoff yield calculation on permeable surfaces, and the fixed runoff coefficient method for impermeable surfaces. The SWMM model simulates the surface concentration process. Details of the model construction for the study area are reported in [40], and the calibrated model parameters are listed in Table 3.
Table 3.
Model parameter values.
3.3.2. Natural and Infrastructure Indicators
Slope and ELV are derived from DEM data. DRC is calculated using the Euclidean distance method. WCR is derived from land-use data and remote-sensing imagery with manual verification. VC is represented by the annual maximum NDVI. ISR is obtained from remote-sensing–based inversion products. These indicators describe natural storage capacity, surface permeability, and runoff generation characteristics.
Infrastructure indicators include DND, PCA, RND, CBSD, and PUS. All infrastructure indicators are expressed as densities or proportions per unit area. This ensures comparability across grids and reflects the supply intensity and spatial distribution of engineered facilities.
3.3.3. Social and Recovery-Capacity Indicators
- (1)
- Social service support indicators
MFD and SD are derived from POI data. MFD includes hospitals, clinics, and pharmacies with clear medical functions and identifiable spatial locations. SD includes schools, sports venues, parks, public squares, and major transport hubs that can serve as emergency shelters. Indicator selection follows three criteria, including functional relevance, spatial identifiability, and clearly defined disaster-time service attributes. All indicators are calculated as densities per unit area.
- (2)
- Ecological and hydrological recovery indicators
NDVI_RR and MNDWI_RR are calculated using Sentinel-2 L2A surface reflectance images. The pre-event image was acquired on 2 July 2016 and the post-event image on 21 August 2016, both with cloud cover below 5%. The 32-day interval between the flood event (20 July 2016) and the post-event image was constrained by the availability of cloud-free imagery; all intermediate acquisitions had cloud cover exceeding 50% and were therefore unusable. During this interval, only light rainfall events occurred, with no storms of comparable magnitude to the 20 July event, limiting the potential confounding influence on the recovery signal. Clouds and residual invalid pixels were masked prior to index calculation, and recovery was defined as the ratio of post-event to pre-event index values for each grid cell.
- (3)
- Social function recovery indicators
ESFRR is proposed to characterize the recovery capacity of essential social services. POIs representing supermarkets, convenience stores, markets, pharmacies, and basic restaurants are selected. Selection criteria include direct support of daily living needs, maintenance of core social functions during disasters, and stable, quantifiable spatial distribution.
The severity classification of urban pluvial flooding is established as follows. Inundated areas are first delineated according to the water depth and duration simulated by InfoWorks ICM simulation results. Depth and duration thresholds are defined with reference to observational records from Beijing’s 21 July 2012 and 20 July 2016 extreme rainfall events, the Standard for Design of Outdoor Wastewater Engineering (2021 Edition, GB 50014-2021) [45], and official disaster reports issued by the Beijing Water Authority. Specifically, the depth of 0.15 m corresponds to the minimum ponding threshold defined in GB 50014-2021; 0.20 m approximates the typical entrance step height of ground-floor commercial premises; 0.50 m marks the level at which floodwater enters commercial spaces and causes partial business suspension, consistent with field damage records; and 1.00 m indicates severe structural inundation requiring prolonged closure. Duration thresholds (6, 12, 24 h) reflect graded emergency response categories used in Beijing’s urban flood management practice. Each inundated polygon is assigned a severity class based on its maximum depth and longest duration; when the two criteria correspond to different levels, the higher class is adopted. The resulting classification is summarized in Table 4.
Table 4.
Severity classification criteria for urban pluvial flooding.
Buffer radii are assigned to each severity class to represent the estimated lateral extent of flood-induced service disruption beyond the directly inundated area, ranging from immediate storefront frontage to neighborhood-scale inaccessibility, informed by typical urban block dimensions in the study area. For each inundation polygon classified as “Moderate”, “Severe”, or “Very Severe”, a buffer zone is generated outward from its boundary. The actual buffer radius is determined by linear interpolation within the class-specific range according to the local depth and duration values. “Mild” impacts represent only brief and shallow surface ponding from which facilities can resume operations within hours and are therefore not treated as causing functional loss in the recovery-stage assessment.
ESFRR is calculated by overlaying the essential service facility POIs with the generated buffer zones. Any facility POI that falls within a buffer zone is considered non-functional. ESFRR is then defined for each grid cell as the ratio of remaining functional facilities to the total number of pre-event facilities, reflecting the recovery capacity of the essential social service system under physical flood impacts.
- (4)
- Socioeconomic recovery indicators
NLI_RR is calculated as the ratio of post-event to pre-event daily nighttime light intensity. It reflects the restoration of urban socioeconomic activity after flooding. Compared with static economic statistics, nighttime light data capture short-term fluctuations in human activity and commercial operations.
GDP represents baseline economic capacity and long-term recovery potential. Conventional GDP data at 1 km resolution cannot reflect intra-urban heterogeneity. To improve spatial resolution, 100 m GDP grids are generated by disaggregating administrative-level GDP using 100 m population raster data as weights. This approach produces a fine-scale representation of economic strength across the study area.
To ensure consistency and comparability across indicators, all variables are normalized using the min–max method [46]. The normalization formula is given below. For MNDWI_RR, surface water may temporarily expand in some areas after the flood. Therefore, it is normalized using 100% as the benchmark for normal recovery, with the pre-flood water pattern as the reference.
This normalization quantifies the deviation of post-event surface water conditions from their normal state. In Formulas (1) and (2), Xij and Zij represent the original and normalized values of the j-th indicator for the i-th cell, respectively.
3.4. Indicator Weight Calculation
To quantify the contribution of each indicator to UPFR, a combined weighting approach is applied. This approach integrates objective data characteristics with expert judgment.
Objective weights are calculated using the CRITIC method [47]. For a set of n evaluation indicators, the information content Cj of the j-th indicator is calculated as
where σj is the standard deviation of indicator j, reflecting its ability to distinguish among samples; rjk is the Pearson correlation coefficient between indicators j and k, and the term (1 − rjk) quantifies the conflict between the two indicators. The objective weight of indicator j is then obtained by normalization:
Subjective weights are determined using the Analytic Hierarchy Process (AHP) [48]. Seven experts with over ten years of professional experience were consulted, including two hydrologists, two urban drainage engineers, one urban planner, and two emergency management specialists. Judgment matrices were elicited independently via structured questionnaires using Saaty’s 1–9 fundamental scale (Table 5). All individual judgment matrices satisfied the consistency requirement with CR < 0.1. A consensus matrix was then formed by aggregating individual matrices using the geometric mean method, which also passed the consistency test with CR < 0.1. The consensus judgment matrices for the three criterion layers and the 22 indicator layers, along with their consistency test results, are provided in Appendix A.2. (Table A1, Table A2, Table A3, Table A4 and Table A5). The resulting weight vector is denoted .
Table 5.
Evaluation scale between two parameters in AHP.
Combined weights are determined using the game theory-based combined weighting method (GT-CWM), which treats each weighting approach as a player in a cooperative game to reach a Nash equilibrium [49,50]. Let = and = denote the two weight vectors for n indicators. The combined weight vector is expressed as
where , > 0 are the combination coefficients to be optimized, so as to minimize the overall deviation between the combined weight vector and each individual weighting scheme.
where ⋅denotes the L2-norm (Euclidean norm). At the Nash equilibrium, the first-order optimality conditions of each weight method must be satisfied simultaneously. Taking the partial derivative of the i-th weights method’s objective with respect to and setting it to zero. Expanding these two conditions gives the following linear system:
After solving for and , the coefficients are normalized to ensure they sum to unity:
The final combined weight for indicator j is
This produces combined weights for all 22 indicators. The resulting weights are used to calculate the UPFR index and for subsequent spatial analysis.
The UPFR index is calculated by applying a weighted linear summation to the standardized indicator layers in ArcGIS 10.2, as expressed in Equation (10), where R denotes the UPFR and represents the combined weight of the j-th indicator.
4. Results
4.1. Model Simulation Results
To evaluate the applicability of the InfoWorks ICM model for the 20 July 2016 extreme rainfall event, the simulation was comprehensively validated using discharge hydrographs, water depth, and inundation extent. The model was calibrated and validated against five independent rainfall events spanning 2011–2016, achieving Nash-Sutcliffe efficiency coefficients (NSE) above 0.8, peak flow relative errors within 10%, and peak time errors not exceeding 30 min for all events (Appendix A.3).
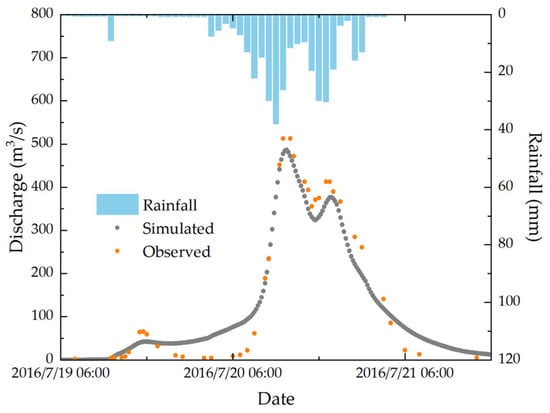
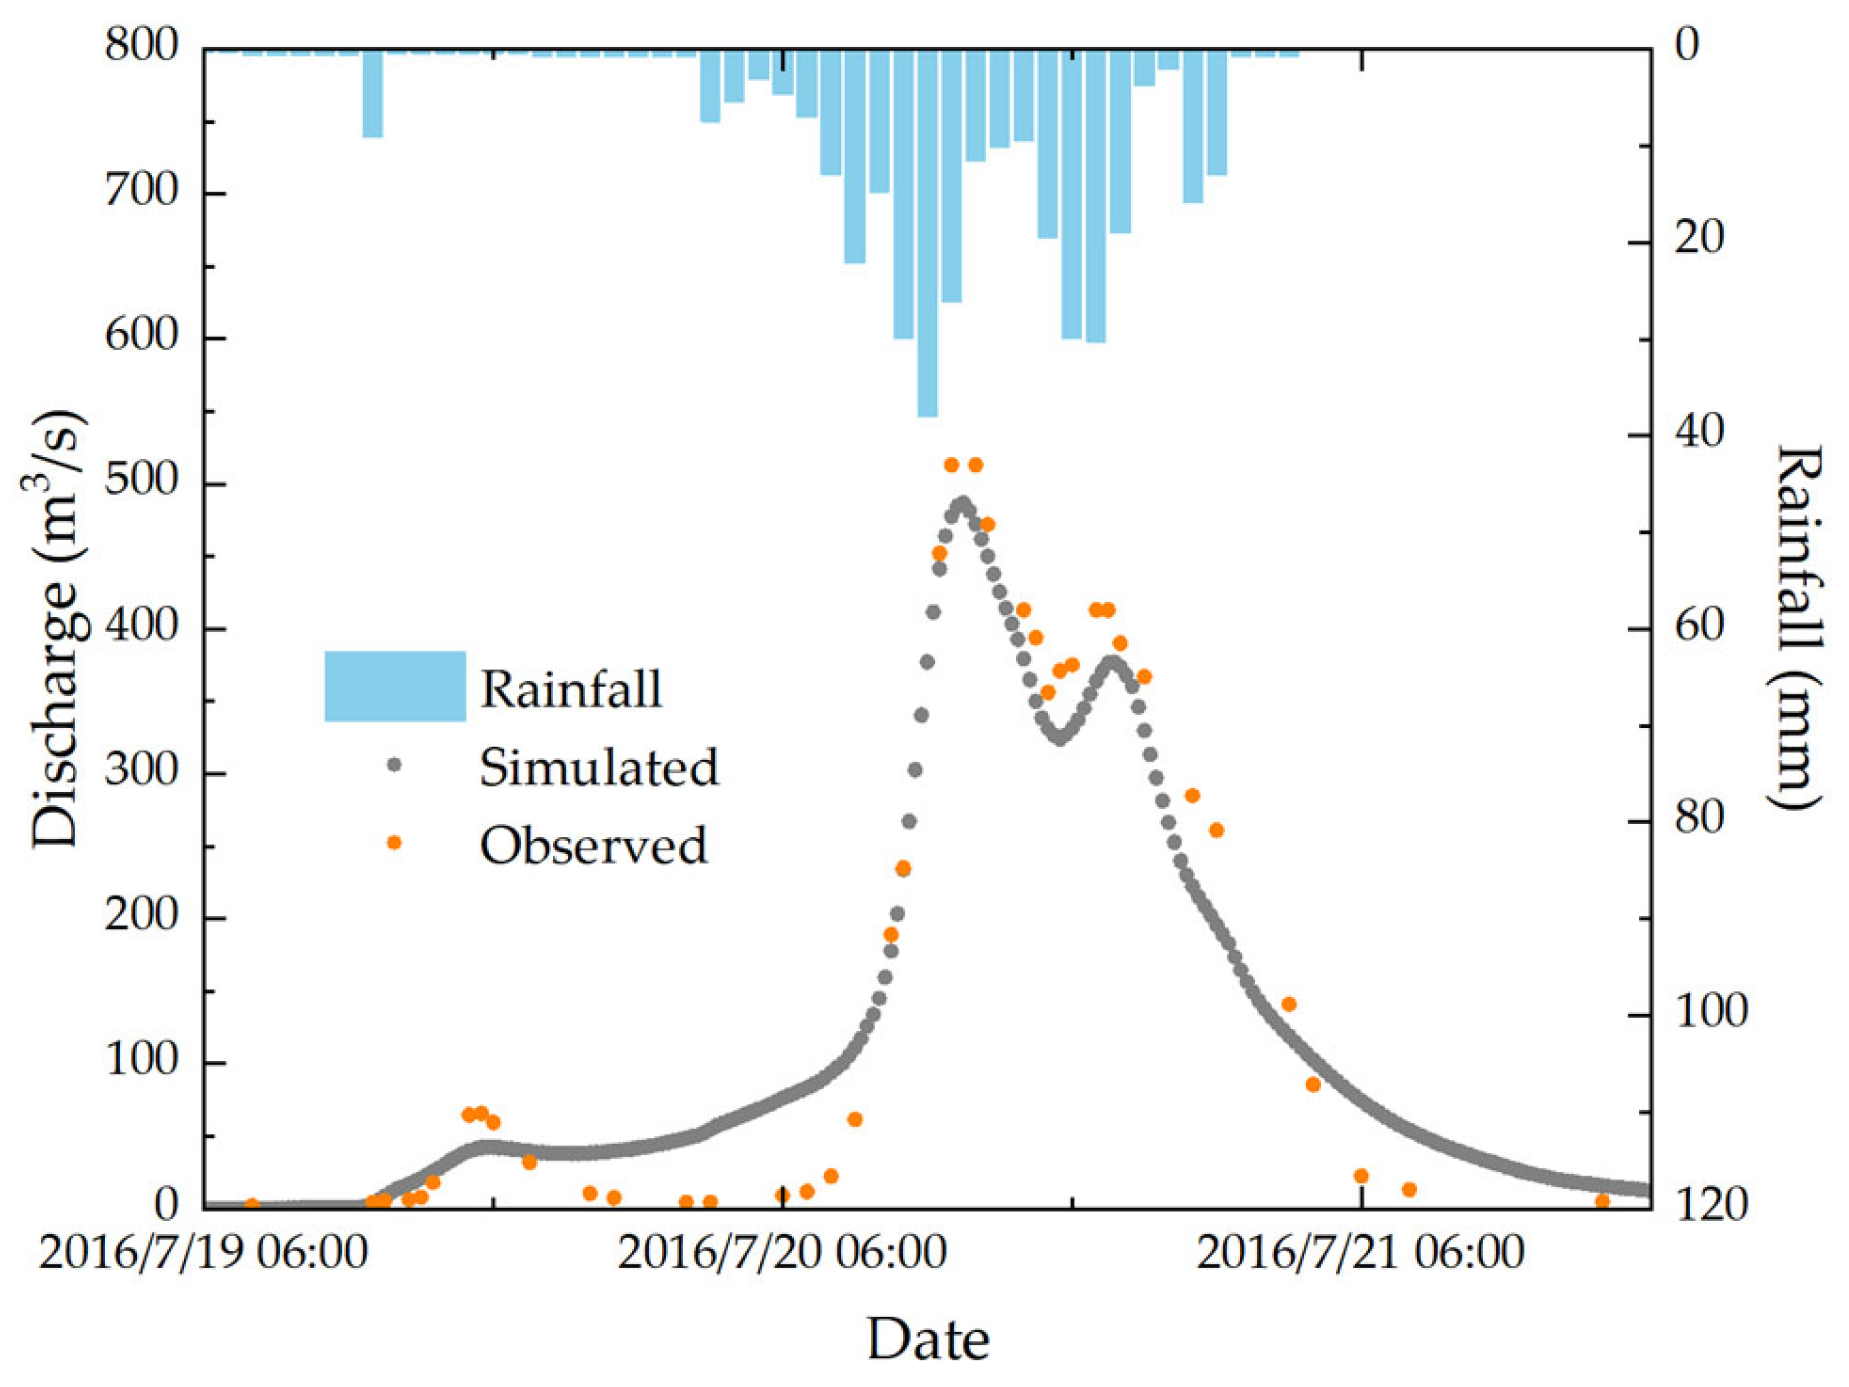
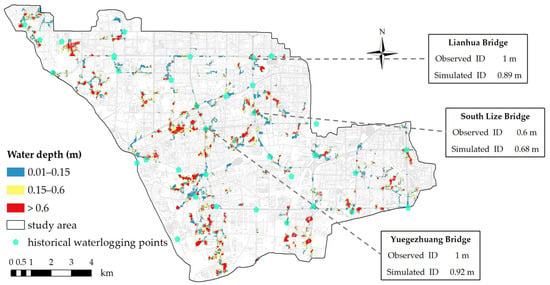
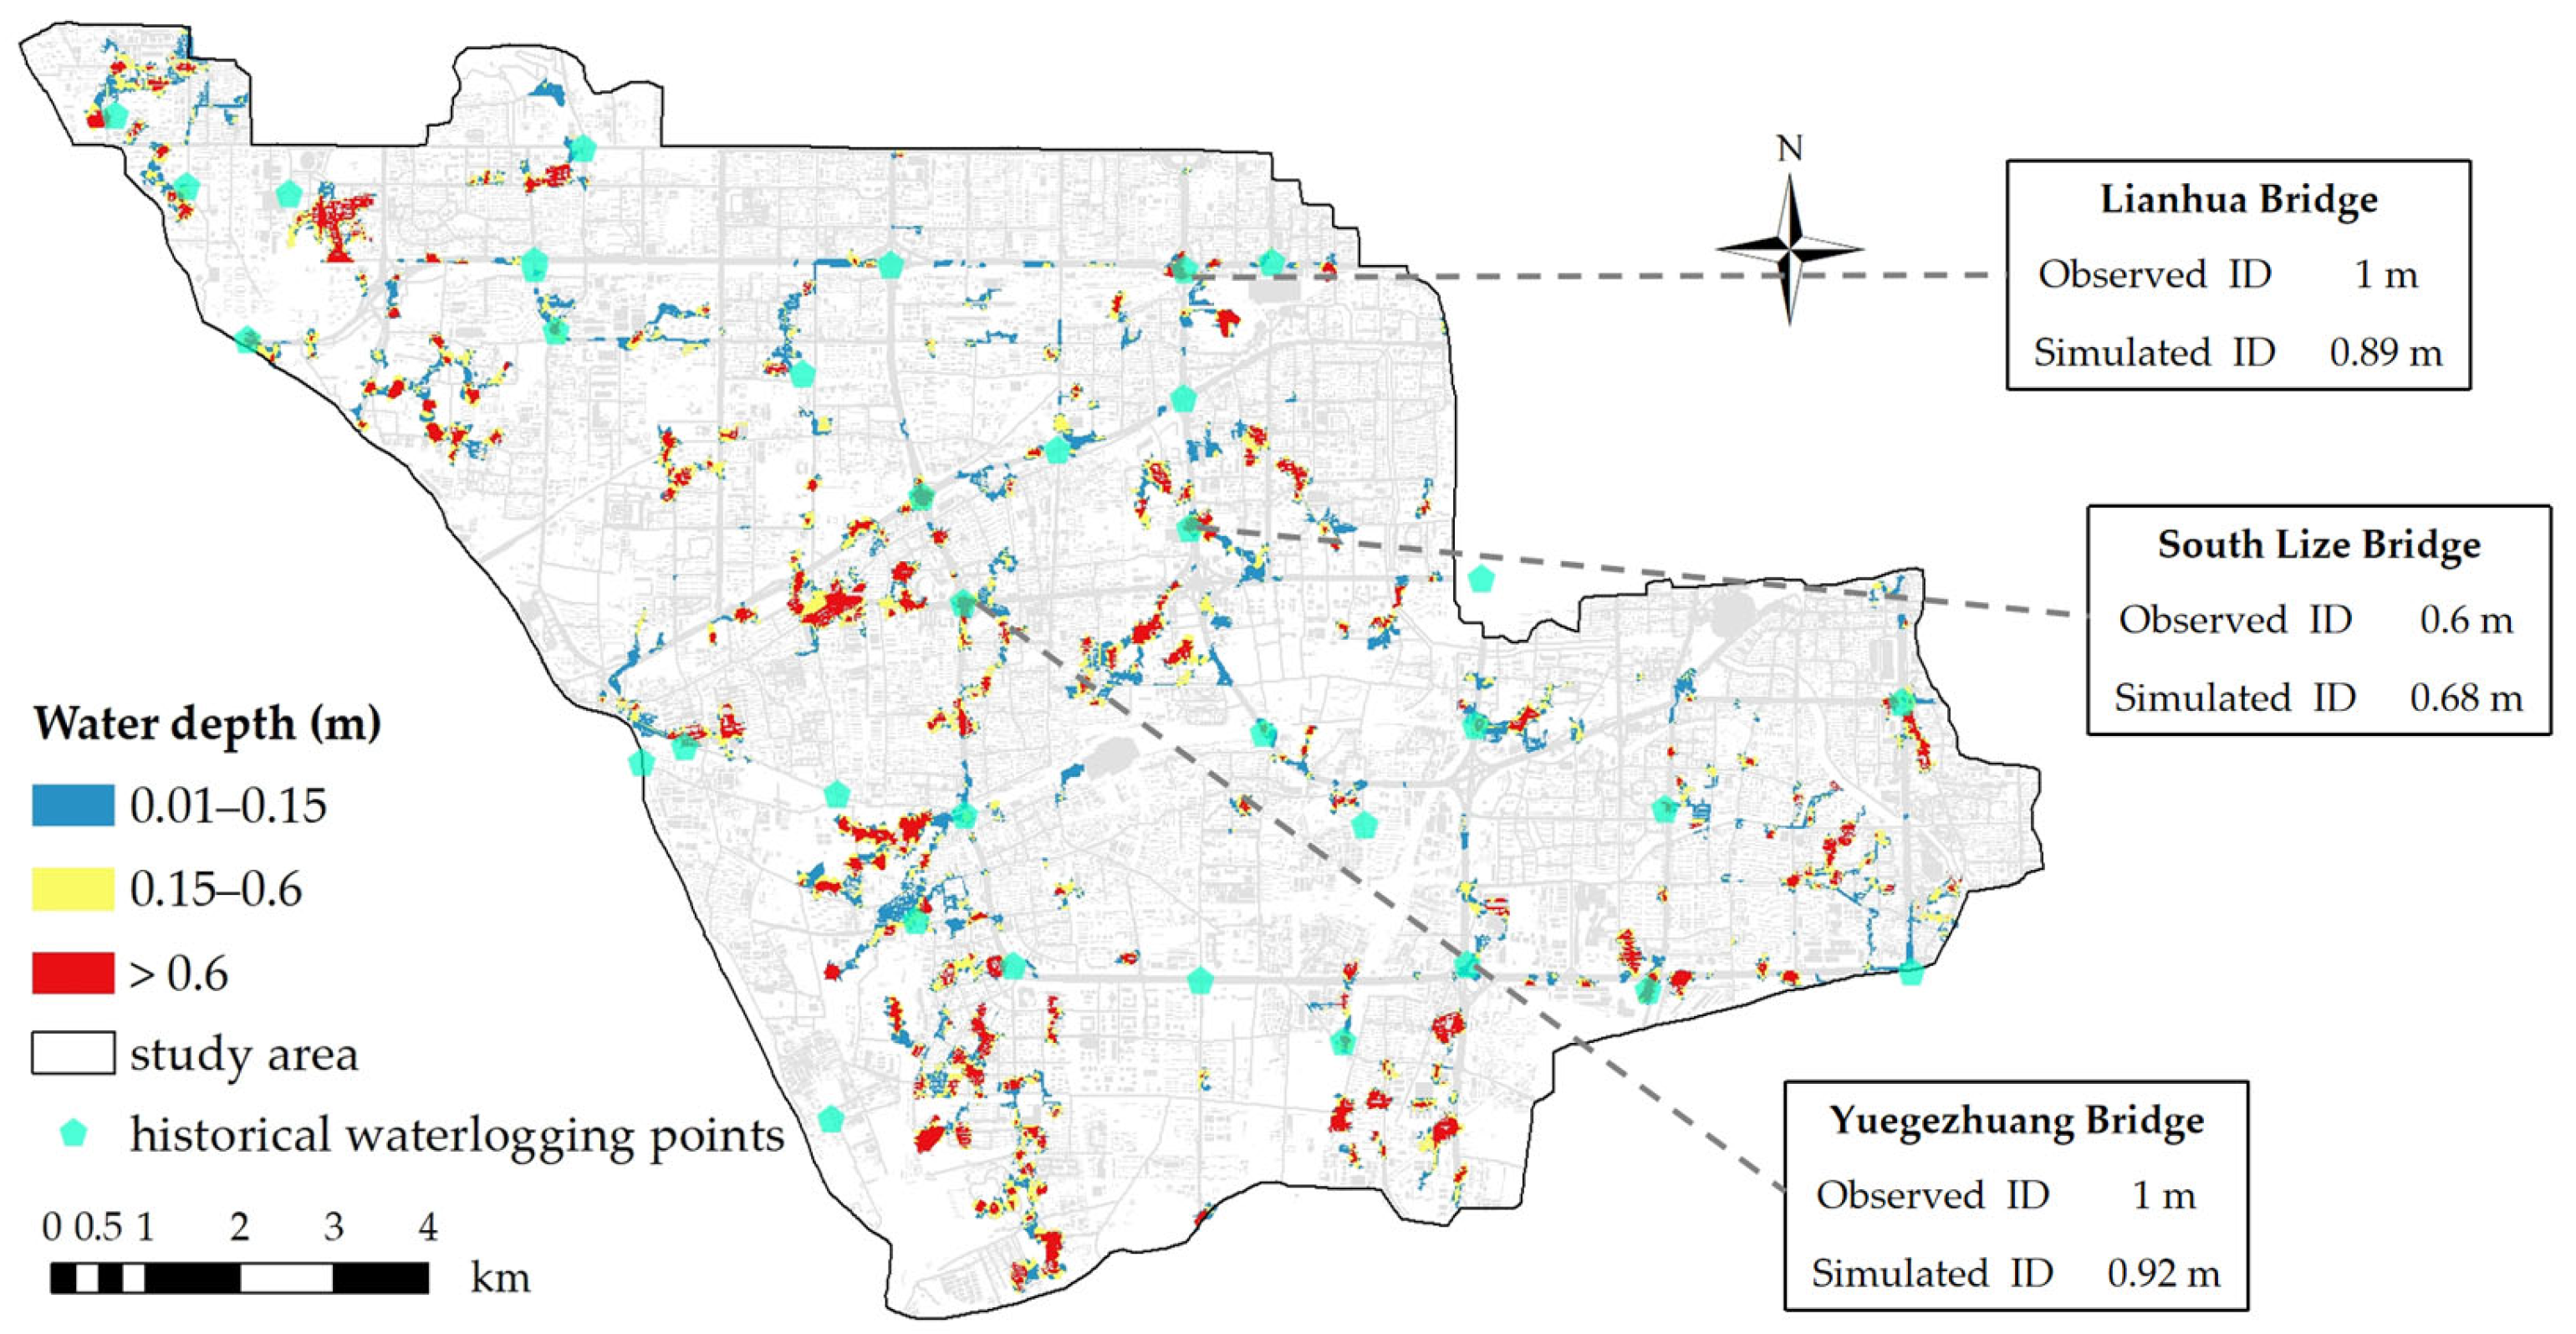
For the 20 July 2016 event, the simulated discharge at the Dahongmen Sluice closely follows the observed data. Both the timing and magnitude of the flood peak are well captured (Figure 3). At typical flood-prone locations, simulated water depths are generally consistent with observations, with most relative errors below 15%. Simulated inundation areas also correspond well with historical waterlogging points, and high-inundation zones overlap with severely flooded areas (Figure 4).
Figure 3.
Observed and simulated discharge hydrographs at the outlet of the study area.
Figure 4.
Spatial distribution of simulated waterlogging depth under the rainstorm scenario of 20 July 2016.
These results indicate that the model can reliably reproduce the waterlogging and inundation processes under extreme rainfall. This provided a solid basis for calculating subsequent resilience indicators. Key dynamic variables, including inundation depth and duration, were extracted from the validated model for quantitative analysis of the response and recovery stages.
4.2. Indicator Weights
To ensure scientific rigor and stability in indicator weighting, a combined approach was applied that integrates CRITIC, AHP, and a game-theory-based fusion method. This approach balances objective and subjective weights and avoids bias from using a single method. The resulting integrated weights for all 22 indicators are listed in Table 6. These weights were applied to spatial indicator data in ArcGIS to calculate the comprehensive UPFR index.
Table 6.
Indicators weights.
4.3. Statistical Distribution of UPFR
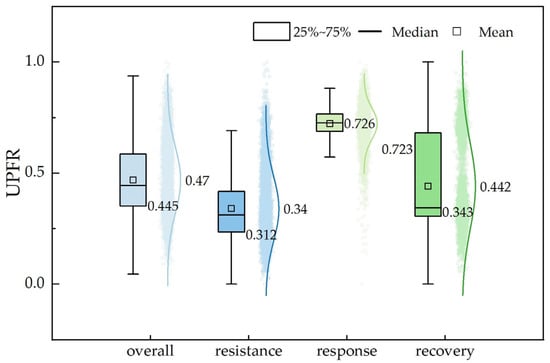
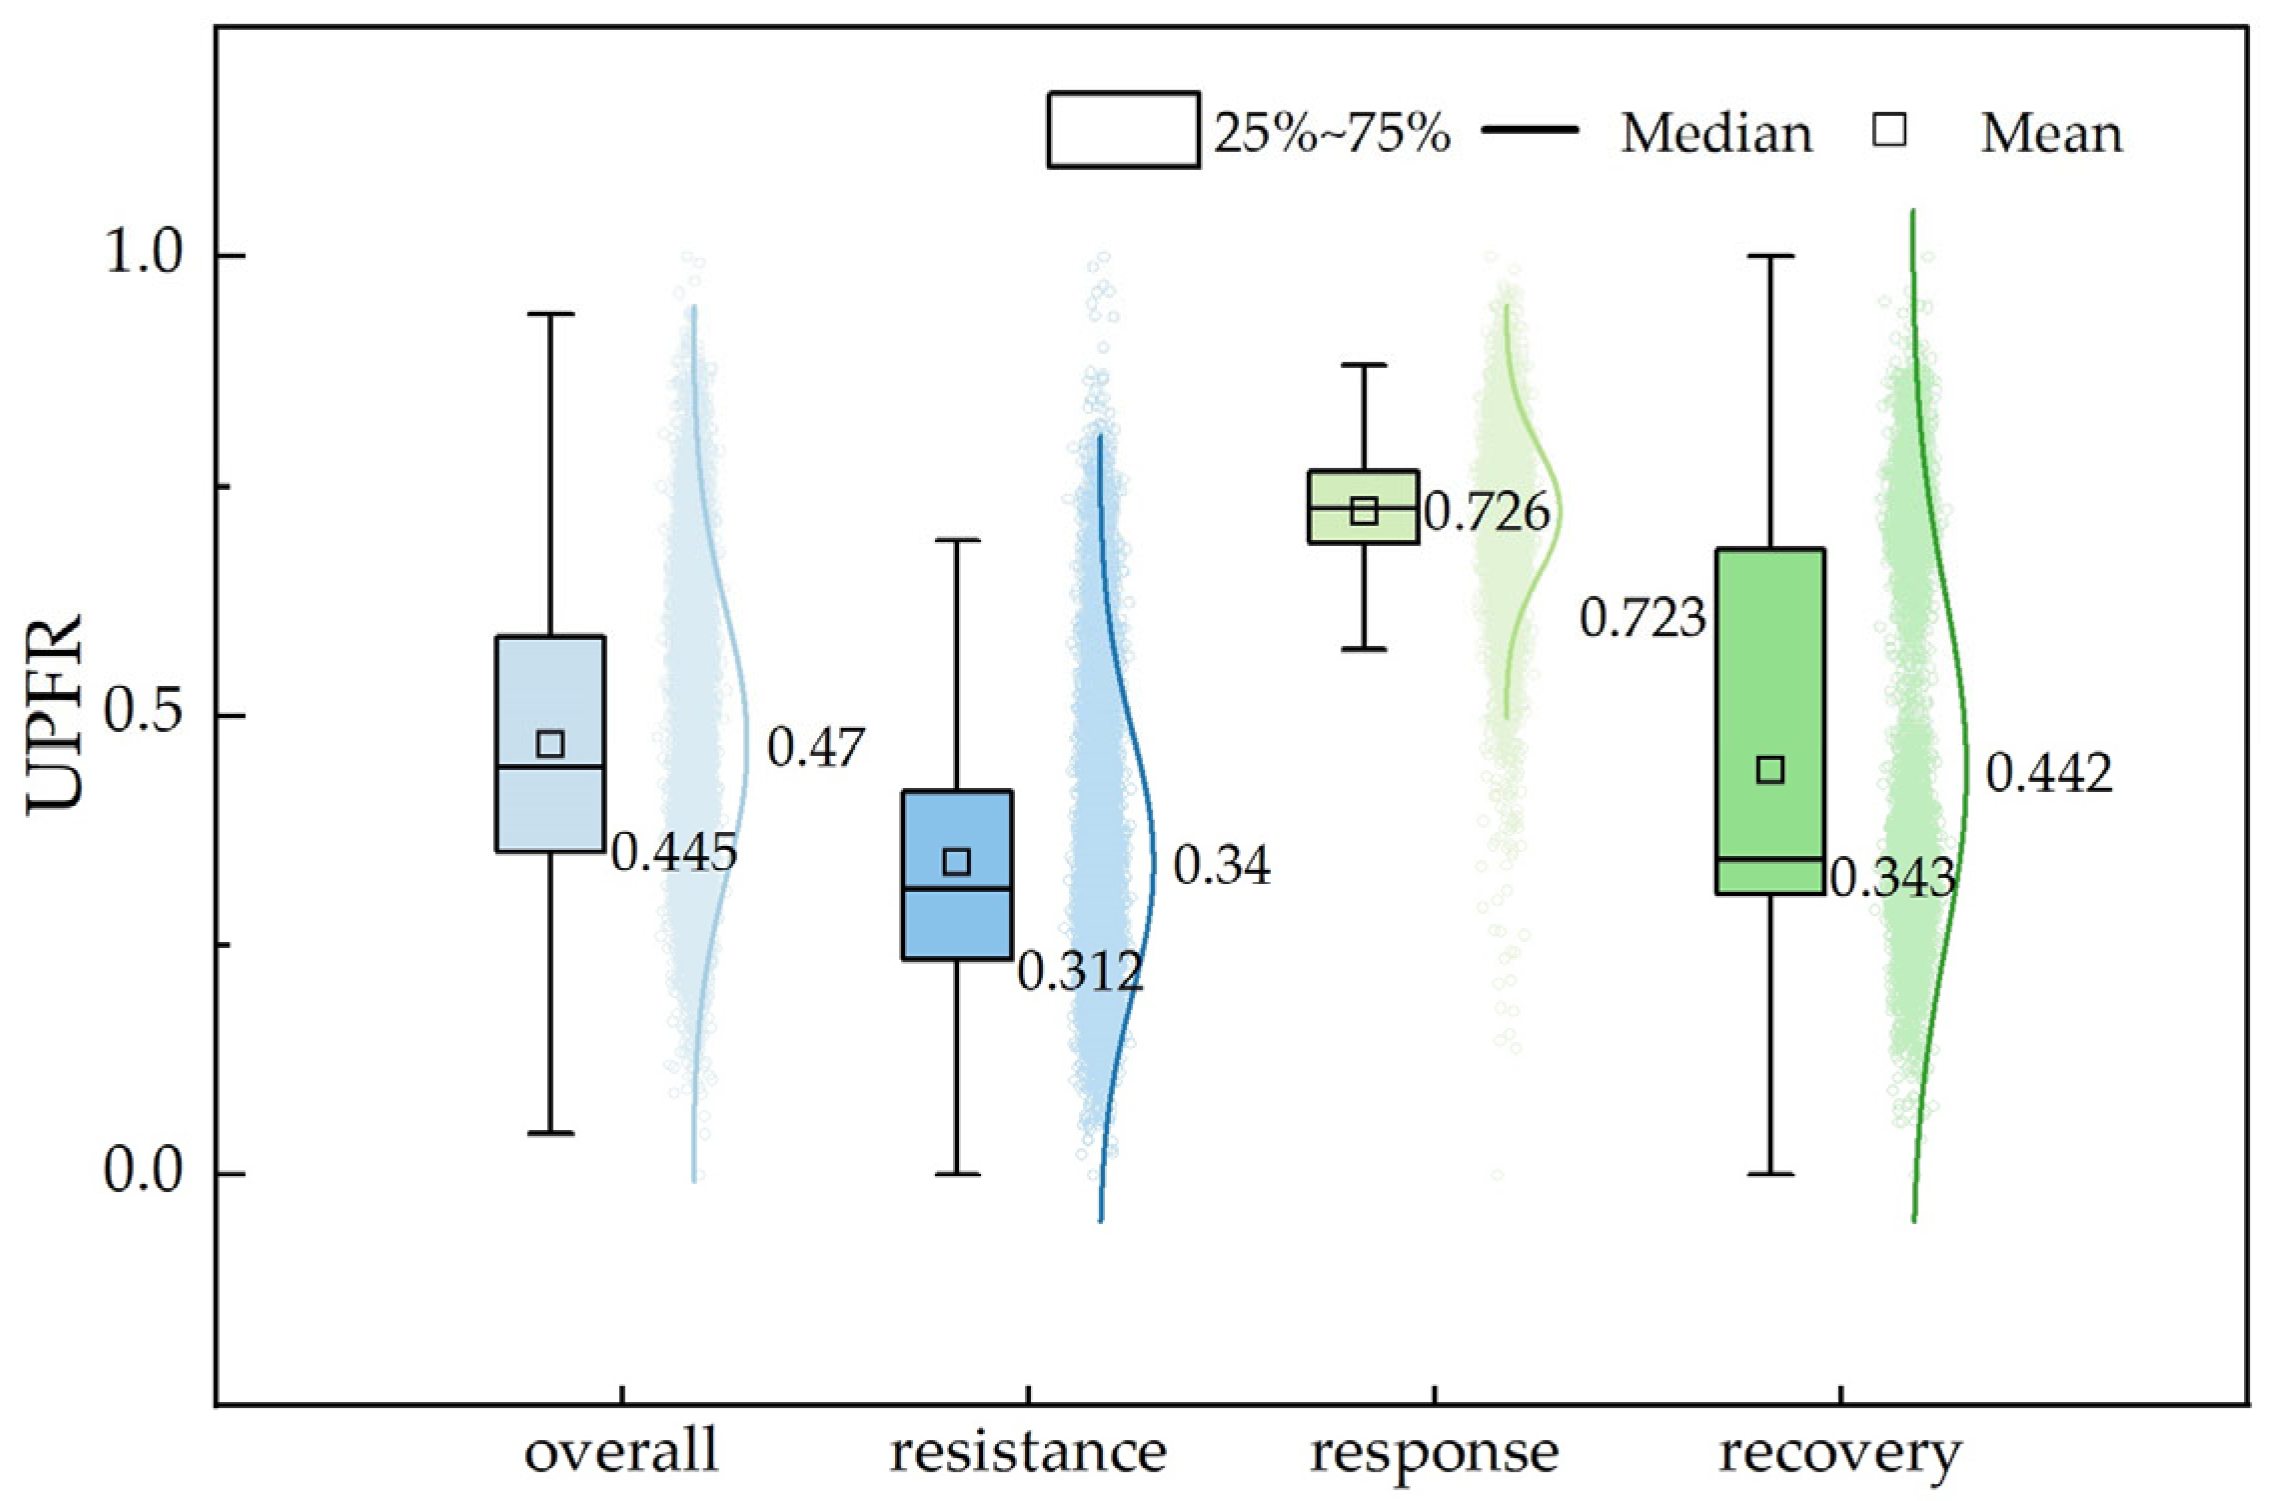
Figure 5 shows boxplots of the overall and stage-specific UPFR indices in the study area. These plots illustrate the statistical distribution of resilience across the study area. The overall UPFR has a mean of 0.470 and a median of 0.445, indicating a moderate resilience level. About 50% of the grid cells fall within 0.35–0.59. The data were moderately dispersed, and the mean was slightly higher than the median, indicating a mild right skew. This suggests that high-resilience cells were limited in number and exerted only a minor influence on the overall average, while most areas remain at moderate resilience.
Figure 5.
Boxplots of UPFR distribution for the overall, resistance, response, and recovery stages.
When examined separately, the three stages exhibited clear differences in UPFR. Resilience is highest in the response stage, followed by recovery and resistance. Resistance has the lowest resilience, with a median of 0.312 and a mean of 0.340. Most values fall between 0.23 and 0.42. The distribution is slightly right-skewed, showing that a few high-resilience cells slightly raise the mean, but most grids remain below the median. Spatial differences were relatively small. Response has the highest resilience, with a median of 0.726 and a mean of 0.723. Values are concentrated between 0.68 and 0.77. Dispersion is the lowest among the stages, indicating a balanced distribution across the area. Recovery lies between resistance and response, with a median of 0.343 and a mean of 0.442. Its values are widely distributed (0.31–0.68) and show a clear right skew. This indicates that a small number of high-resilience cells substantially increased the mean, and the wide range reflects pronounced spatial disparities in recovery capacity.
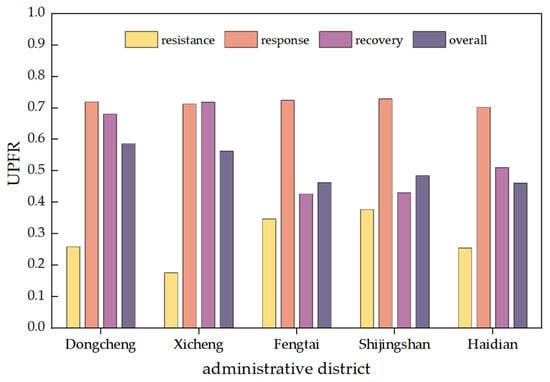
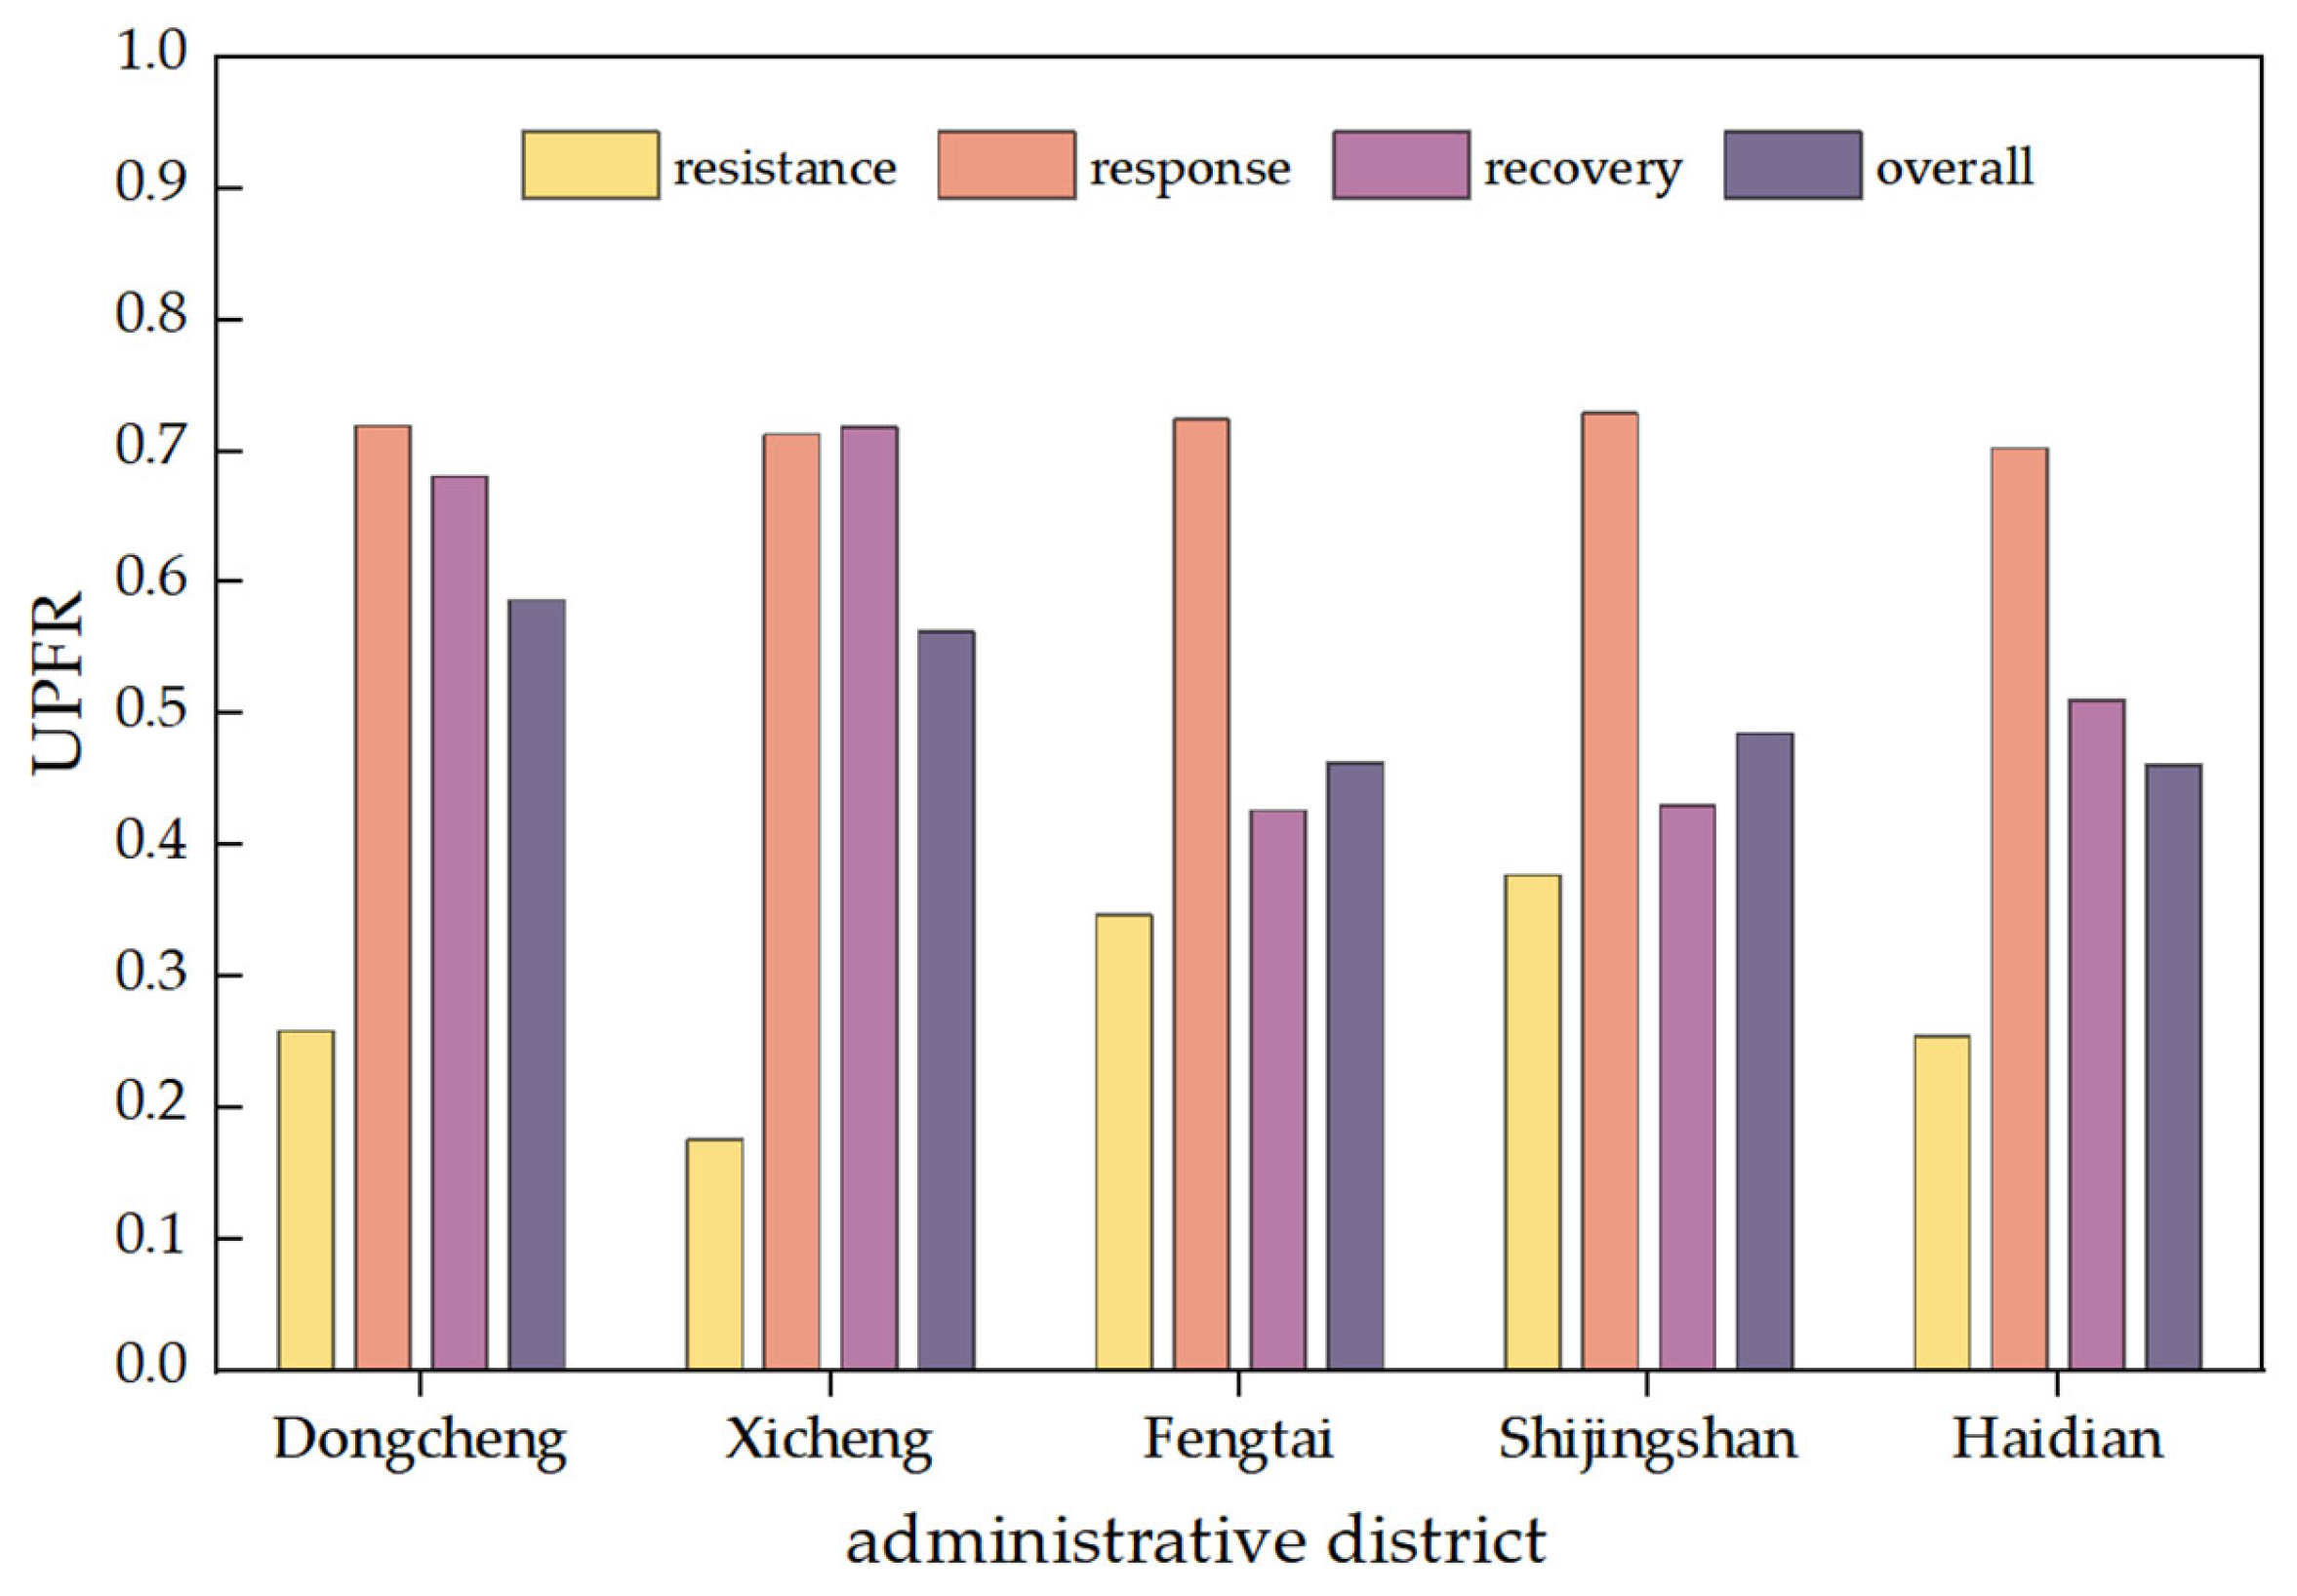
Figure 6 shows stage-specific and overall UPFR averaged by administrative district. Daxing District accounted for only 0.13% of the study area and was therefore excluded from this comparison. For overall UPFR, Dongcheng and Xicheng Districts have averages of 0.586 and 0.562, above the overall mean (0.470). Shijingshan District is at 0.485, representing a mid-level. Fengtai and Haidian Districts are slightly below the mean (0.463 and 0.461).
Figure 6.
Mean values of overall and stage-specific UPFR by administrative district.
Stage-specific UPFR exhibited distinct spatial patterns across districts. In the resistance stage, resilience follows a clear decreasing trend, with Shijingshan showing the highest value (0.377), followed by Fengtai (0.347), Dongcheng (0.258), Haidian (0.255), and Xicheng (0.176). Resilience during the response stage was relatively high and uniform across districts, ranging from 0.70 to 0.73. In the recovery stage, pronounced differences are observed, with Xicheng having the highest resilience (0.718), followed by Dongcheng (0.681), Haidian (0.510), Shijingshan (0.430), and Fengtai (0.426).
Together with Figure 5, these results indicate that UPFR values span a wide range across the study area. Grid-level differences within the same district remain significant, indicating that resilience exhibits both inter-district gradients and intra-district spatial heterogeneity.
4.4. Spatial Distribution of UPFR
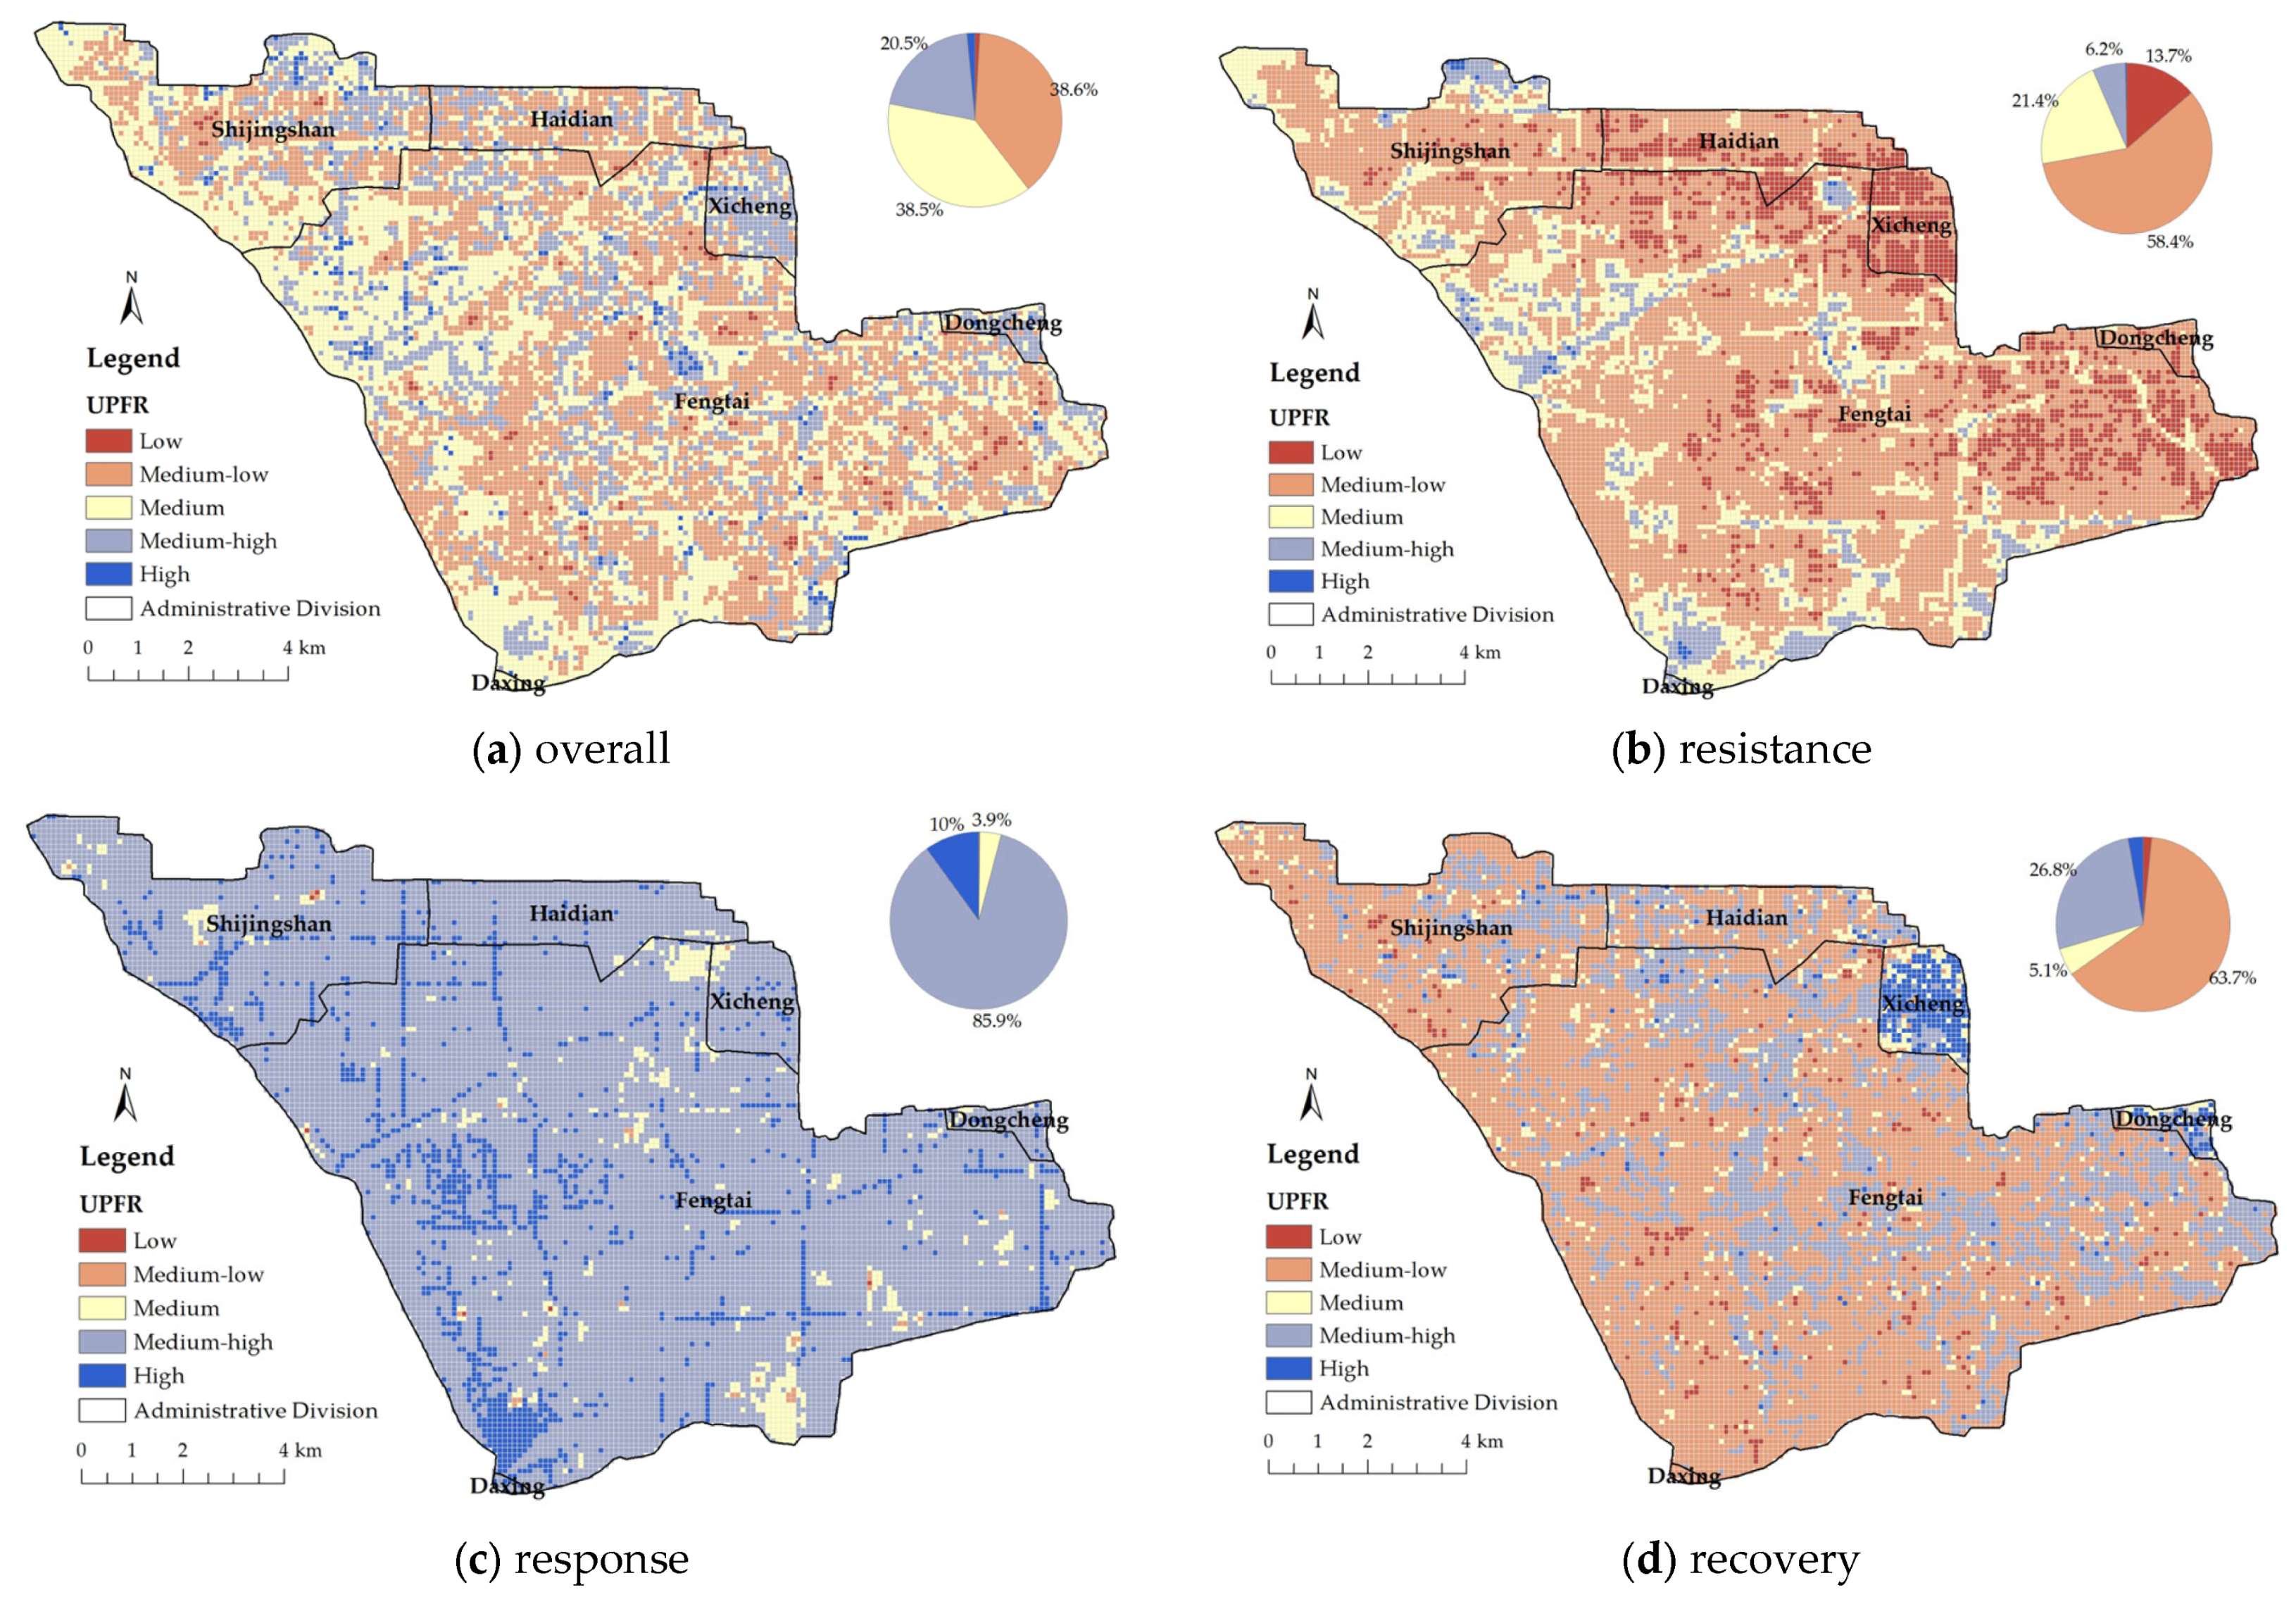
The UPFR index ranges from 0 to 1, with higher values indicating a stronger capacity to cope with urban pluvial flooding [51]. For clarity, resilience is categorized into five levels: low (0–0.2), medium-low (0.2–0.4), medium (0.4–0.6), medium-high (0.6–0.8), and high (0.8–1). Figure 7 presents the spatial distribution of overall and stage-specific UPFR under the 20 July 2016 extreme rainfall scenario. The same five-level classification is applied consistently to the three stage-specific indices to enable cross-stage comparison.
Figure 7.
Spatial distribution and area proportion of UPFR at different levels for the (a) overall, (b) resistance, (c) response, and (d) recovery stages in the study area.
4.4.1. Overall UPFR
High-resilience areas are mainly concentrated in the core urban districts of Dongcheng and Xicheng. Additional high-resilience patches were observed in the northern part of Laoshan Park in Shijingshan District, waterfront parks in western and central-southern Fengtai District, and other ecological or riparian zones (Figure 7a). Low-resilience areas are widely distributed around Shijingshan Stadium, Beijing West Station, Fengtai Station, Lize Business District, Fengtai Technology Park, and residential areas along Dahongmen West Road. Consequently, urban cores and green spaces exhibited higher resilience, whereas high-density built-up areas and transport hubs showed lower resilience.
Medium-resilience grids account for 43.3% of the study area, while medium-low grids account for 41.7%, together representing over 85% of the total area. Medium-high grids occupy 12.3%, and high- and low-resilience grids each account for less than 2%. The overall UPFR is dominated by medium and medium-low levels, exhibiting a distribution pattern characterized by central concentration and fewer values at both extremes.
4.4.2. Stage-Specific UPFR
The resistance stage exhibited scattered high values alongside widespread low values (Figure 7b). High-resilience points are located in Shijingshan, Fengtai waterfront parks, and ecological zones along the Beijing-Hong Kong-Macau Expressway. Low-resilience values dominate dense built-up areas and low-lying river corridors in Xicheng, Dongcheng, southern Haidian, and eastern Fengtai.
The response stage was more spatially uniform and continuous across the study area, with high values concentrated along major roads and expressways (Figure 7c). Low-resilience grids are scattered around transport hubs and dense urban zones, such as Kefeng Bridge, Lize Bridge, Beijing West Station, Xinfadi, Shijingshan Stadium, and the Huaifang West Road Railway Bridge.
The recovery stage exhibited the most pronounced spatial variation (Figure 7d). High-resilience zones cluster in core districts (Xicheng and Dongcheng), while low-resilience zones extend across southwestern Fengtai and Shijingshan. These include transport hubs, dense residential areas, and several parks, such as Fengtai Station, Beijing West Station, Yuegezhuang Bridge, Kefeng Bridge, Fengyu Road Railway Bridge, Yuquanying North Railway Bridge, Lize Business District, Kandan Park, World Park, and Yamenkou Forest Park. This distribution formed a clear resilience gradient from the urban core to the surrounding areas.
5. Discussion
5.1. Rationality and Robustness of Integrated Weights
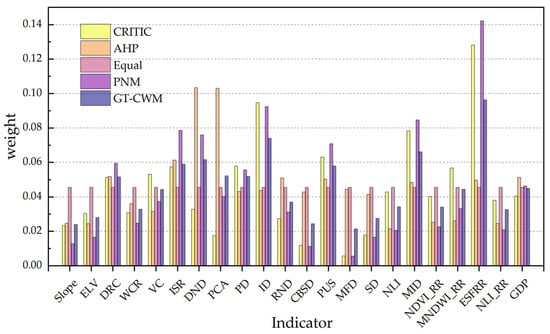
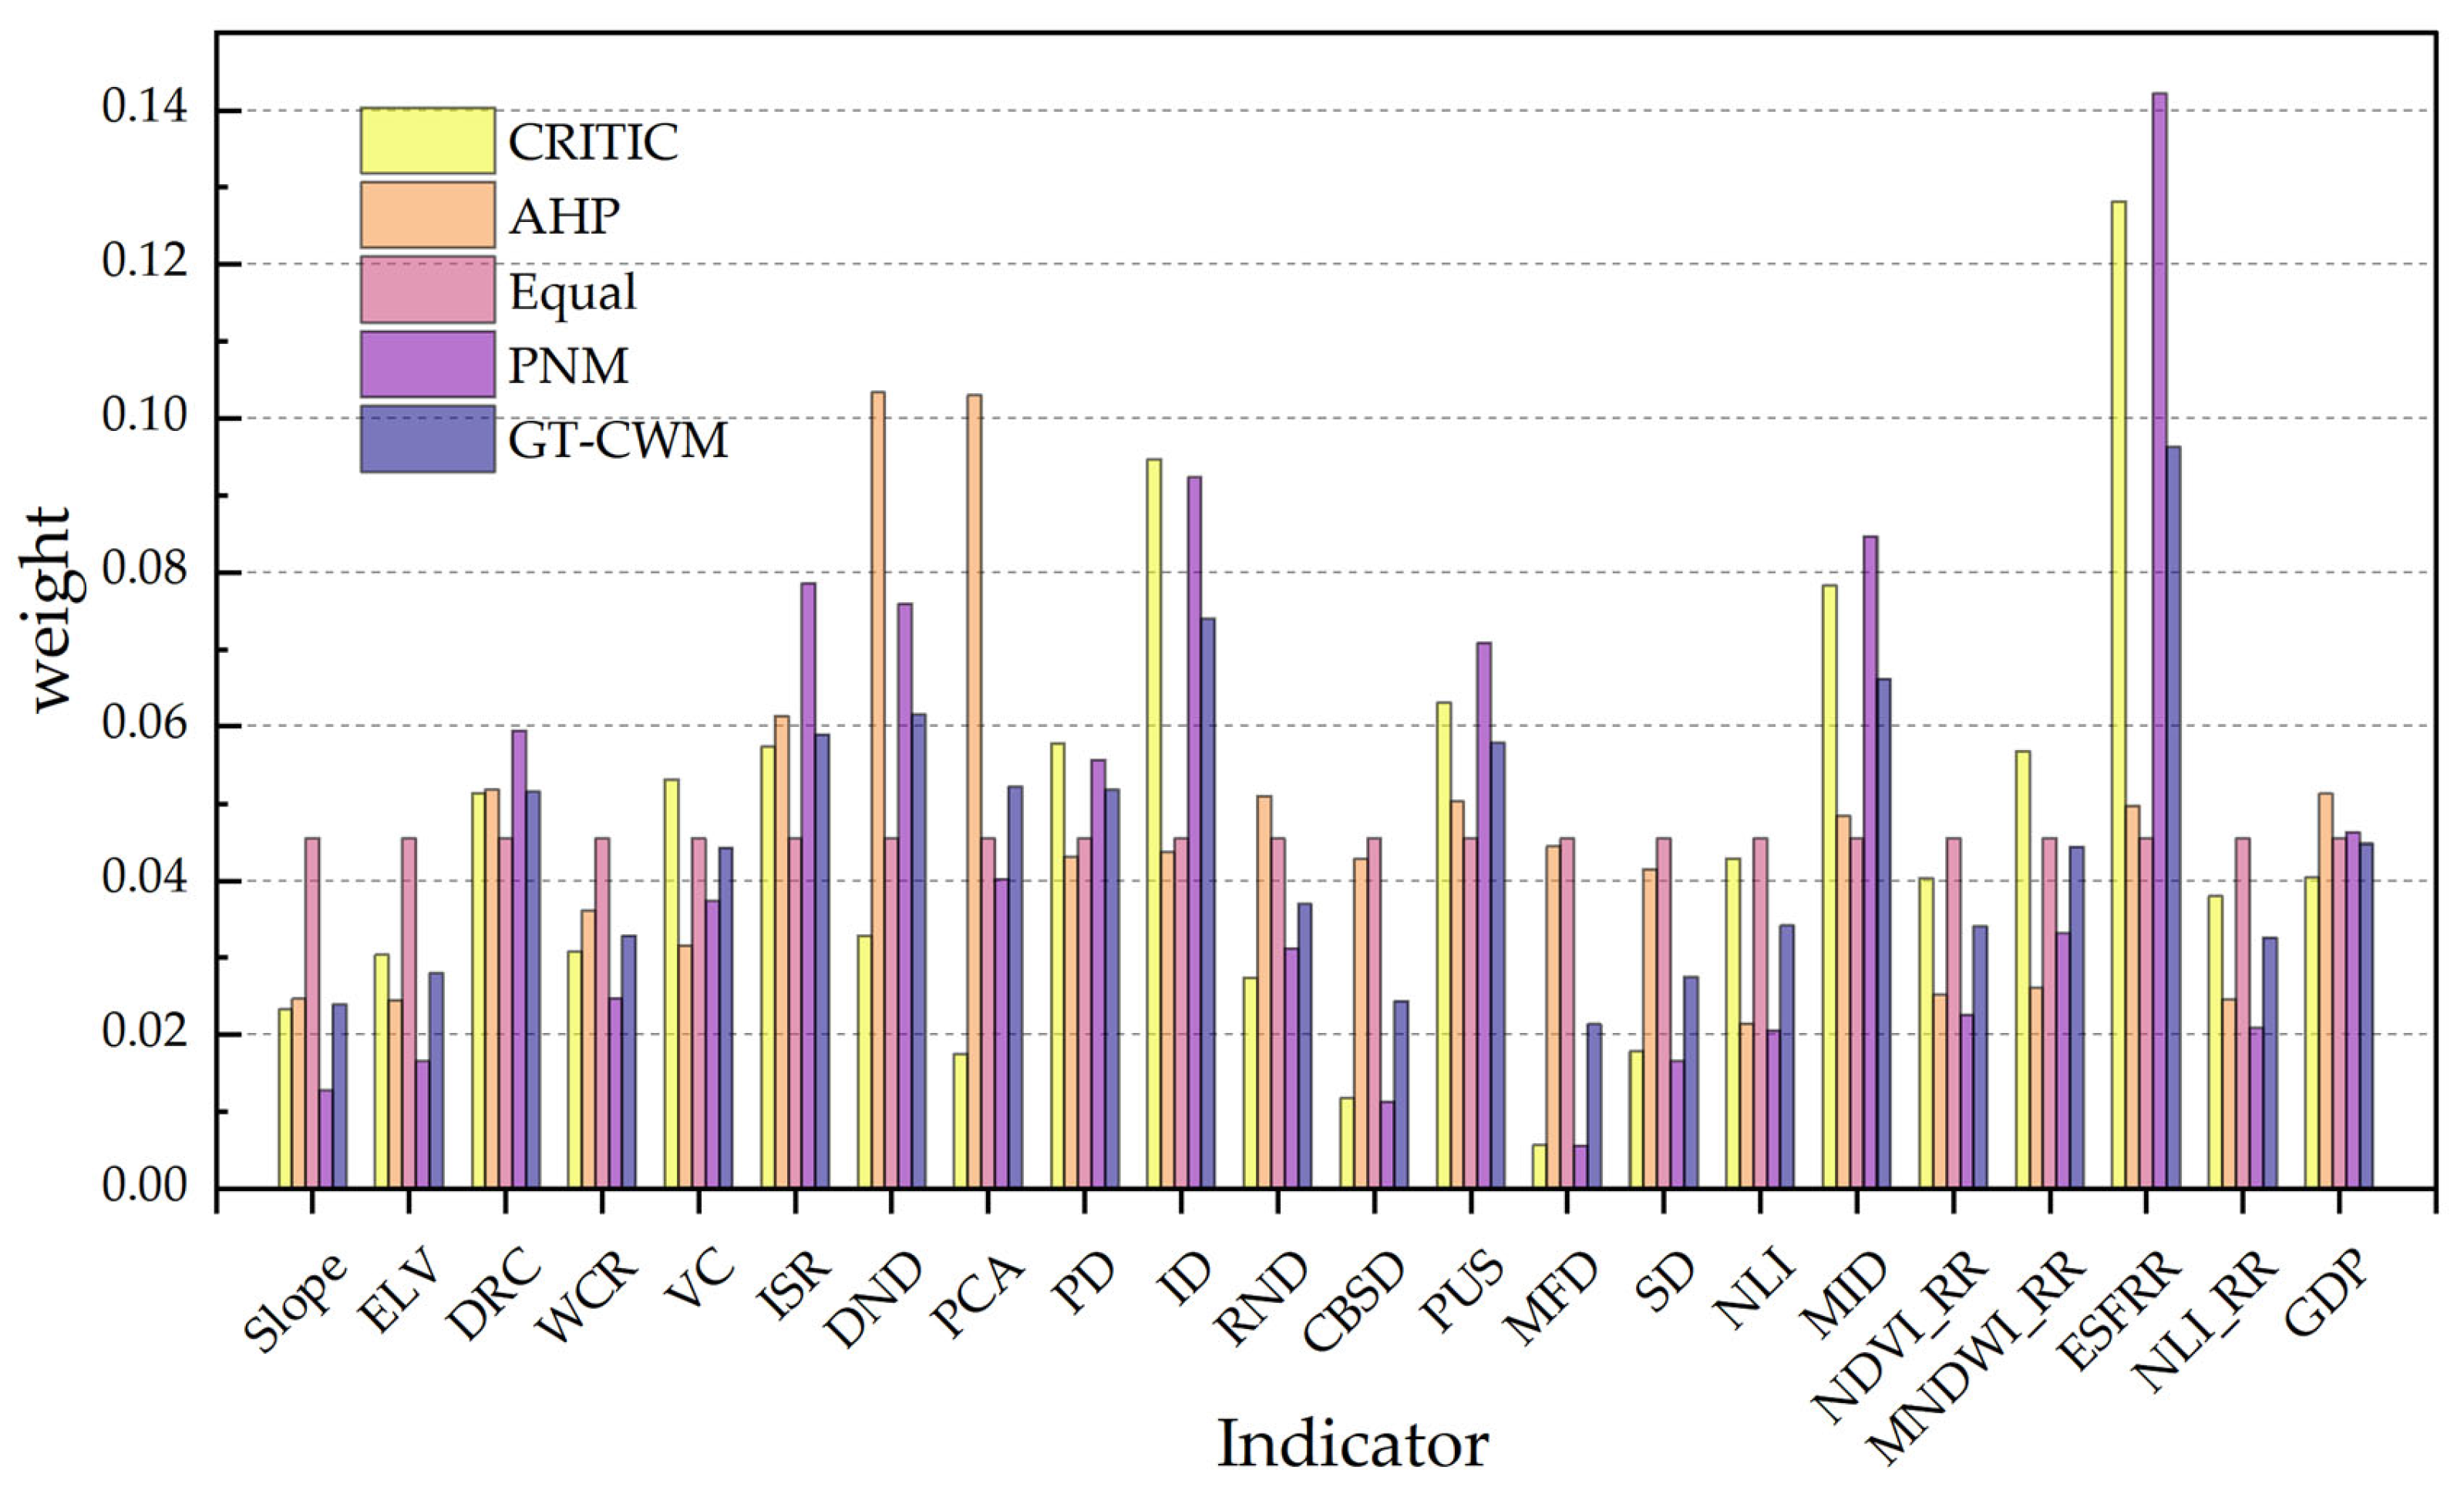
The reliability of the integrated weights directly affects the accuracy of the UPFR assessment. To evaluate their robustness, a sensitivity analysis was conducted by recalculating the UPFR index under four alternative weighting schemes, including the CRITIC-only, AHP-only, equal weights (1/22 per indicator), and product normalization method (PNM). The resulting UPFR values across all 13,832 grid cells were then compared using the Spearman rank correlation coefficient. Table 7 presents the full correlation matrix, and Figure 8 presents the indicator weights under different weighting methods.
Table 7.
Spearman rank correlation matrix of UPFR under different weighting schemes.
Figure 8.
Comparison of indicator weights under different methods.
All pairwise Spearman correlations exceed 0.86 (p < 0.001), indicating that the spatial ranking of grid-level UPFR is highly stable regardless of the weighting method applied. Among all schemes, the weights of GT-CWM achieve the highest average correlation with the other four approaches (mean ρ = 0.9584), confirming their effectiveness in reconciling divergent perspectives. The relatively lower correlation between CRITIC-only and AHP-only (ρ = 0.8666) reflects the inherent divergence between data-driven variability assessment and expert domain knowledge. Specifically, the CRITIC method assigns the highest weights to flood-impact indicators such as ESFRR, ID, and MID, whereas the AHP method prioritizes infrastructure capacity indicators such as DND and PCA. This divergence demonstrates that the two methods capture complementary dimensions of information and further justifies the necessity of a combination approach.
Despite these differences in individual weighting schemes, the identification of core driving indicators remains highly stable across methods. ESFRR, ID, and MID consistently rank among the top three in all non-equal-weight schemes, while ISR and PUS appear in the top six across all four schemes (Figure 8). This consistency confirms that the dominant resilience drivers identified in this study are not artifacts of the specific weighting method employed.
In addition to indicator ranking stability, the GT-CWM produces a more balanced weight distribution compared with the PNM [52]. The PNM tends to concentrate weights on a limited number of indicators, which may introduce bias into the evaluation. In contrast, the GT-CWM maintains the ratio between the highest and lowest weights within a threefold range, thereby highlighting key factors while retaining contributions from other dimensions. The integrated weights also show strong consistency with the characteristics of the 20 July 2016 rainfall event. Relatively higher weights are reasonably assigned to core prevention and control indicators that reflect drainage capacity and disaster intensity. This allocation enhances the practical relevance and physical interpretability of the UPFR assessment.
Collectively, the sensitivity analysis demonstrates that the GT-CWM improves both the balance and robustness of the assessment results, and that the main conclusions of this study remain stable under alternative weighting configurations.
5.2. Dominant Mechanisms and Systemic Implications for Sustainable Urban Resilience
Core driving indicators for each resilience stage were identified based on integrated weight rankings (Table 6), spatial correspondence analysis (Figure 2 and Figure 7), and consistency with urban flood formation mechanisms. The spatial differentiation of UPFR reflects stage-specific driver dominance and dynamic coupling within the urban socio-ecological system. Resilience emerges not from isolated indicators but from interactions among infrastructure robustness, spatial configuration, and socio-economic adaptive capacity across resistance, response, and recovery phases.
During the resistance stage, resilience is primarily constrained by structural characteristics of the built environment. High impervious surface ratios (ISR) and insufficient drainage capacity (DND, PCA) limit the buffering capacity of the system to rainfall and correspond closely with low-resilience zones. Beyond hydraulic performance, this pattern reflects structural challenges in urban development processes, where impervious expansion and delayed infrastructure upgrading reduce long-term adaptive capacity [52,53]. Integrating green and blue infrastructure and retrofitting drainage systems are therefore essential components of climate-adaptive urban transformation rather than purely technical interventions.
In the response stage, relatively balanced resilience indicates the stabilizing role of urban network systems. Road connectivity (RND) and accessibility to essential public services (MFD, SD) enhance emergency mobility and resource allocation, mitigating localized inundation impacts. This finding underscores the importance of network redundancy and equitable service distribution in maintaining functional continuity under stress [54,55]. Inclusive infrastructure planning thus strengthens resilience not only structurally but also socially.
The recovery stage exhibits the greatest spatial variability, revealing disparities in socio-economic adaptive capacity. The polarized distribution of ESFRR and GDP closely matches the recovery resilience pattern, confirming their key role in post-flood functional restoration. Areas with stronger economic support and faster restoration of essential services recover more rapidly, while resource-constrained zones experience prolonged disruption [56]. Such uneven recovery risks reinforcing spatial inequalities if not addressed through targeted governance [57]. Recovery capacity, therefore, reflects institutional coordination as well as financial and social support, highlighting the need to integrate resilience into long-term sustainable development strategies.
These stage-specific findings establish direct linkages with Sustainable Development Goal 11. Constraints identified in the resistance stage inform targeted disaster risk reduction under Target 11.5. Indicators from the response stage support inclusive service provision and transport accessibility under Targets 11.1 and 11.2. Disparities observed in the recovery stage highlight the need for integrated climate adaptation policies under Target 11.b. By quantifying these relationships at the grid level, the framework translates sustainability targets into spatially actionable indicators for resilience-oriented planning.
In summary, the spatial structure of UPFR is shaped by cross-stage coupling. Structural weaknesses in resistance and disparities in recovery exert a lasting influence on system stability, while balanced response capacity partially offsets localized vulnerabilities. This dynamic interaction indicates that sustainable urban resilience depends on coordinated improvements across infrastructure systems, urban networks, and socio-economic structures rather than isolated optimization.
These findings provide important implications for sustainability-oriented governance. Highly impervious areas require priority investment in green infrastructure and drainage retrofitting [58]. Transport hubs and dense functional districts should enhance emergency accessibility and service redundancy to maintain operational continuity. Peripheral areas with weaker recovery capacity need strengthened livelihood support and more equitable resource allocation. Such differentiated strategies are critical for advancing climate-resilient and inclusive urban development.
Beyond diagnosis, the TSFD-UPFR framework has direct implications for resilience-informed decision-making under limited budgets. For example, the spatially explicit resistance map can guide the prioritization of drainage retrofit investments in grids where ISR exceeds 80%, and DND falls below the catchment median, while the recovery map can direct resources toward improving essential service accessibility in peripheral low-recovery zones. Comparing cost-effectiveness across intervention types, such as raising resistance through green infrastructure versus accelerating recovery through service facility restoration, represents a natural next step for operational planning [59,60]. Recent studies on resilience-based restoration and maintenance decisions provide useful approaches for allocating limited resources after system weaknesses are identified [61]. These methods focus on how to use resources more efficiently. Integrating them with the spatially explicit resilience results generated by the TSFD-UPFR framework can further support evidence-based resource allocation in urban flood management.
5.3. Limitations and Future Work
Despite advancing fine-scale resilience assessment, several limitations warrant further consideration within a broader sustainability context.
First, the analysis is based on a single extreme rainfall event, which served as a stress-test scenario. While this approach captures system performance under severe disturbance, resilience dynamics may vary under different rainfall intensities, durations, or compound hazards. Future research should incorporate multiple historical events, synthetic design storms, or climate projection scenarios to evaluate resilience under long-term climate uncertainty and enhance the robustness of adaptive planning strategies.
Second, this study identified core driving indicators through integrated weighting and grid-scale spatial correspondence analysis, but did not quantify their relative contribution, marginal effects, or nonlinear impacts. Future studies could integrate machine-learning methods (e.g., SHAP) and scenario-based modeling to quantify how incremental improvements in key factors (e.g., drainage capacity, impervious surface reduction, service accessibility) affect UPFR. Such analyses could directly inform sustainability-oriented infrastructure prioritization and adaptive investment decision-making.
Third, the case study focuses on a highly urbanized catchment in Beijing, and the current framework does not explicitly incorporate governance and institutional capacity indicators (e.g., emergency response time or flood management budgets). These metrics typically lack the fine-scale spatial variability required for a 100 m grid-level assessment. While some structural indicators (e.g., public service facility distributions) indirectly reflect governance outcomes, directly integrating institutional capacity remains an important direction for future work. Furthermore, differences in climate regimes, governance structures, and urban morphology may influence resilience mechanisms in other contexts. Comparative cross-city or longitudinal studies are therefore required to validate the transferability of the framework and refine its applicability, particularly in scenarios where governance capacity varies systematically across cases.
Additionally, several sources of methodological uncertainty should be acknowledged. Input data span multiple spatial resolutions, but indicators derived from the coarsest data (NLI, NLI_RR at 500 m) account for only 6.7% of total weight, limiting their influence on composite results. Regarding model parameters, all calibrated values fall within literature-reported ranges (Table 3), and the model was validated across three independent dimensions. Formal parameter sensitivity analysis was not feasible due to the computational demands of the closed-source InfoWorks ICM platform; future work could employ open-source alternatives to quantify parameter uncertainty propagation. The weighting sensitivity analysis confirms that the spatial pattern of UPFR is highly stable across five alternative weighting schemes (all pairwise Spearman ρ > 0.86).
Future UPFR research should move toward integrated, dynamic, and forward-looking assessment systems. Combining high-resolution remote sensing, urban sensing networks, and real-time hydrodynamic modeling could support continuous monitoring of adaptive capacity. Embedding resilience evaluation within digital urban governance platforms would further enhance evidence-based decision-making under climate change. By linking physical flood processes with socio-economic adaptation pathways, resilience assessment can evolve into a strategic tool for guiding sustainable urban transformation.
6. Conclusions
This study develops a three-stage, four-dimensional framework to assess urban pluvial flood resilience at a fine spatial scale within a rapidly urbanizing megacity context. By integrating process-based hydrodynamic simulation with multi-source socio-environmental indicators, the framework operationalizes resilience across resistance, response, and recovery phases, enabling dynamic and spatially explicit evaluation of adaptive capacity under extreme rainfall conditions.
The results reveal pronounced spatial heterogeneity in resilience distribution. While emergency response capacity remains relatively strong in central areas, structural weaknesses are concentrated in highly impervious built-up zones and transport-intensive districts. Natural conditions and drainage infrastructure primarily determine resistance-stage capacity, whereas social accessibility and livelihood restoration mechanisms shape response and recovery performance. These findings underscore that urban flood resilience emerges from the coupled interaction of physical systems and socio-economic functions rather than from isolated structural components.
From a sustainability perspective, the study highlights the necessity of shifting from reactive flood control toward resilience-oriented urban transformation. Fine-scale identification of low-resilience hotspots provides an evidence base for prioritizing adaptive infrastructure investment, optimizing sponge city strategies, enhancing emergency accessibility, and strengthening post-disaster recovery mechanisms. Such targeted interventions are essential for reducing spatial inequalities in adaptive capacity and promoting long-term urban stability under climate uncertainty.
More broadly, the proposed framework contributes to integrating disaster-resilience assessment into sustainable urban development planning. By bridging hydrodynamic processes with socio-economic recovery dynamics, the study supports climate adaptation strategies and resilience-oriented governance in megacities facing intensifying extreme weather events.
Author Contributions
Conceptualization, R.L.; methodology, R.L.; software, R.L.; validation, R.L.; formal analysis, R.L.; investigation, R.L.; resources, Z.X.; data curation, R.L.; writing—original draft preparation, R.L.; writing—review and editing, R.L. and Z.X.; visualization, R.L.; supervision, Z.X.; project administration, Z.X.; funding acquisition, Z.X. All authors have read and agreed to the published version of the manuscript.
Funding
This research was funded by the National Natural Science Foundation of China: 52239003.
Institutional Review Board Statement
Not applicable.
Informed Consent Statement
Not applicable.
Data Availability Statement
The data presented in this study are available on request from the corresponding author.
Acknowledgments
We extend our sincere gratitude to the reviewers and editors for their valuable comments, as well as to all those who have supported this research.
Conflicts of Interest
The authors declare no conflicts of interest.
Abbreviations
The following abbreviations were used in this manuscript:
| UPFR | Urban pluvial flood resilience |
| TSFD-UPFR framework | Three-stage four-dimensional urban pluvial flood resilience framework |
| ELV | Elevation |
| DRC | Distance to river channel |
| WCR | Water coverage ratio |
| VC | Vegetation coverage |
| ISR | Impervious surface ratio |
| DND | Drainage network density |
| PCA | Pipe cross-sectional area |
| PD | Population density |
| ID | Inundation depth |
| RND | Road network density |
| CBSD | Communication base station density |
| PUS | Proportion of underground space |
| MFD | Medical facility density |
| SD | Shelter density |
| NLI | Nighttime light intensity |
| MID | Mean inundation duration |
| NDVI_RR | NDVI recovery rate |
| MNDWI_RR | MNDWI recovery rate |
| ESFRR | Essential service facility recovery rate |
| NLI_RR | Nighttime light recovery rate |
| GDP | Gross domestic product |
| AHP | Analytic hierarchy process |
| GT-CWM | Game theory-based combined weighting method |
| PNM | Product normalization method |
Appendix A
Appendix A.1. Spearman Correlation
Figure A1.
Spearman correlation coefficient heatmap of UPFR indicators.
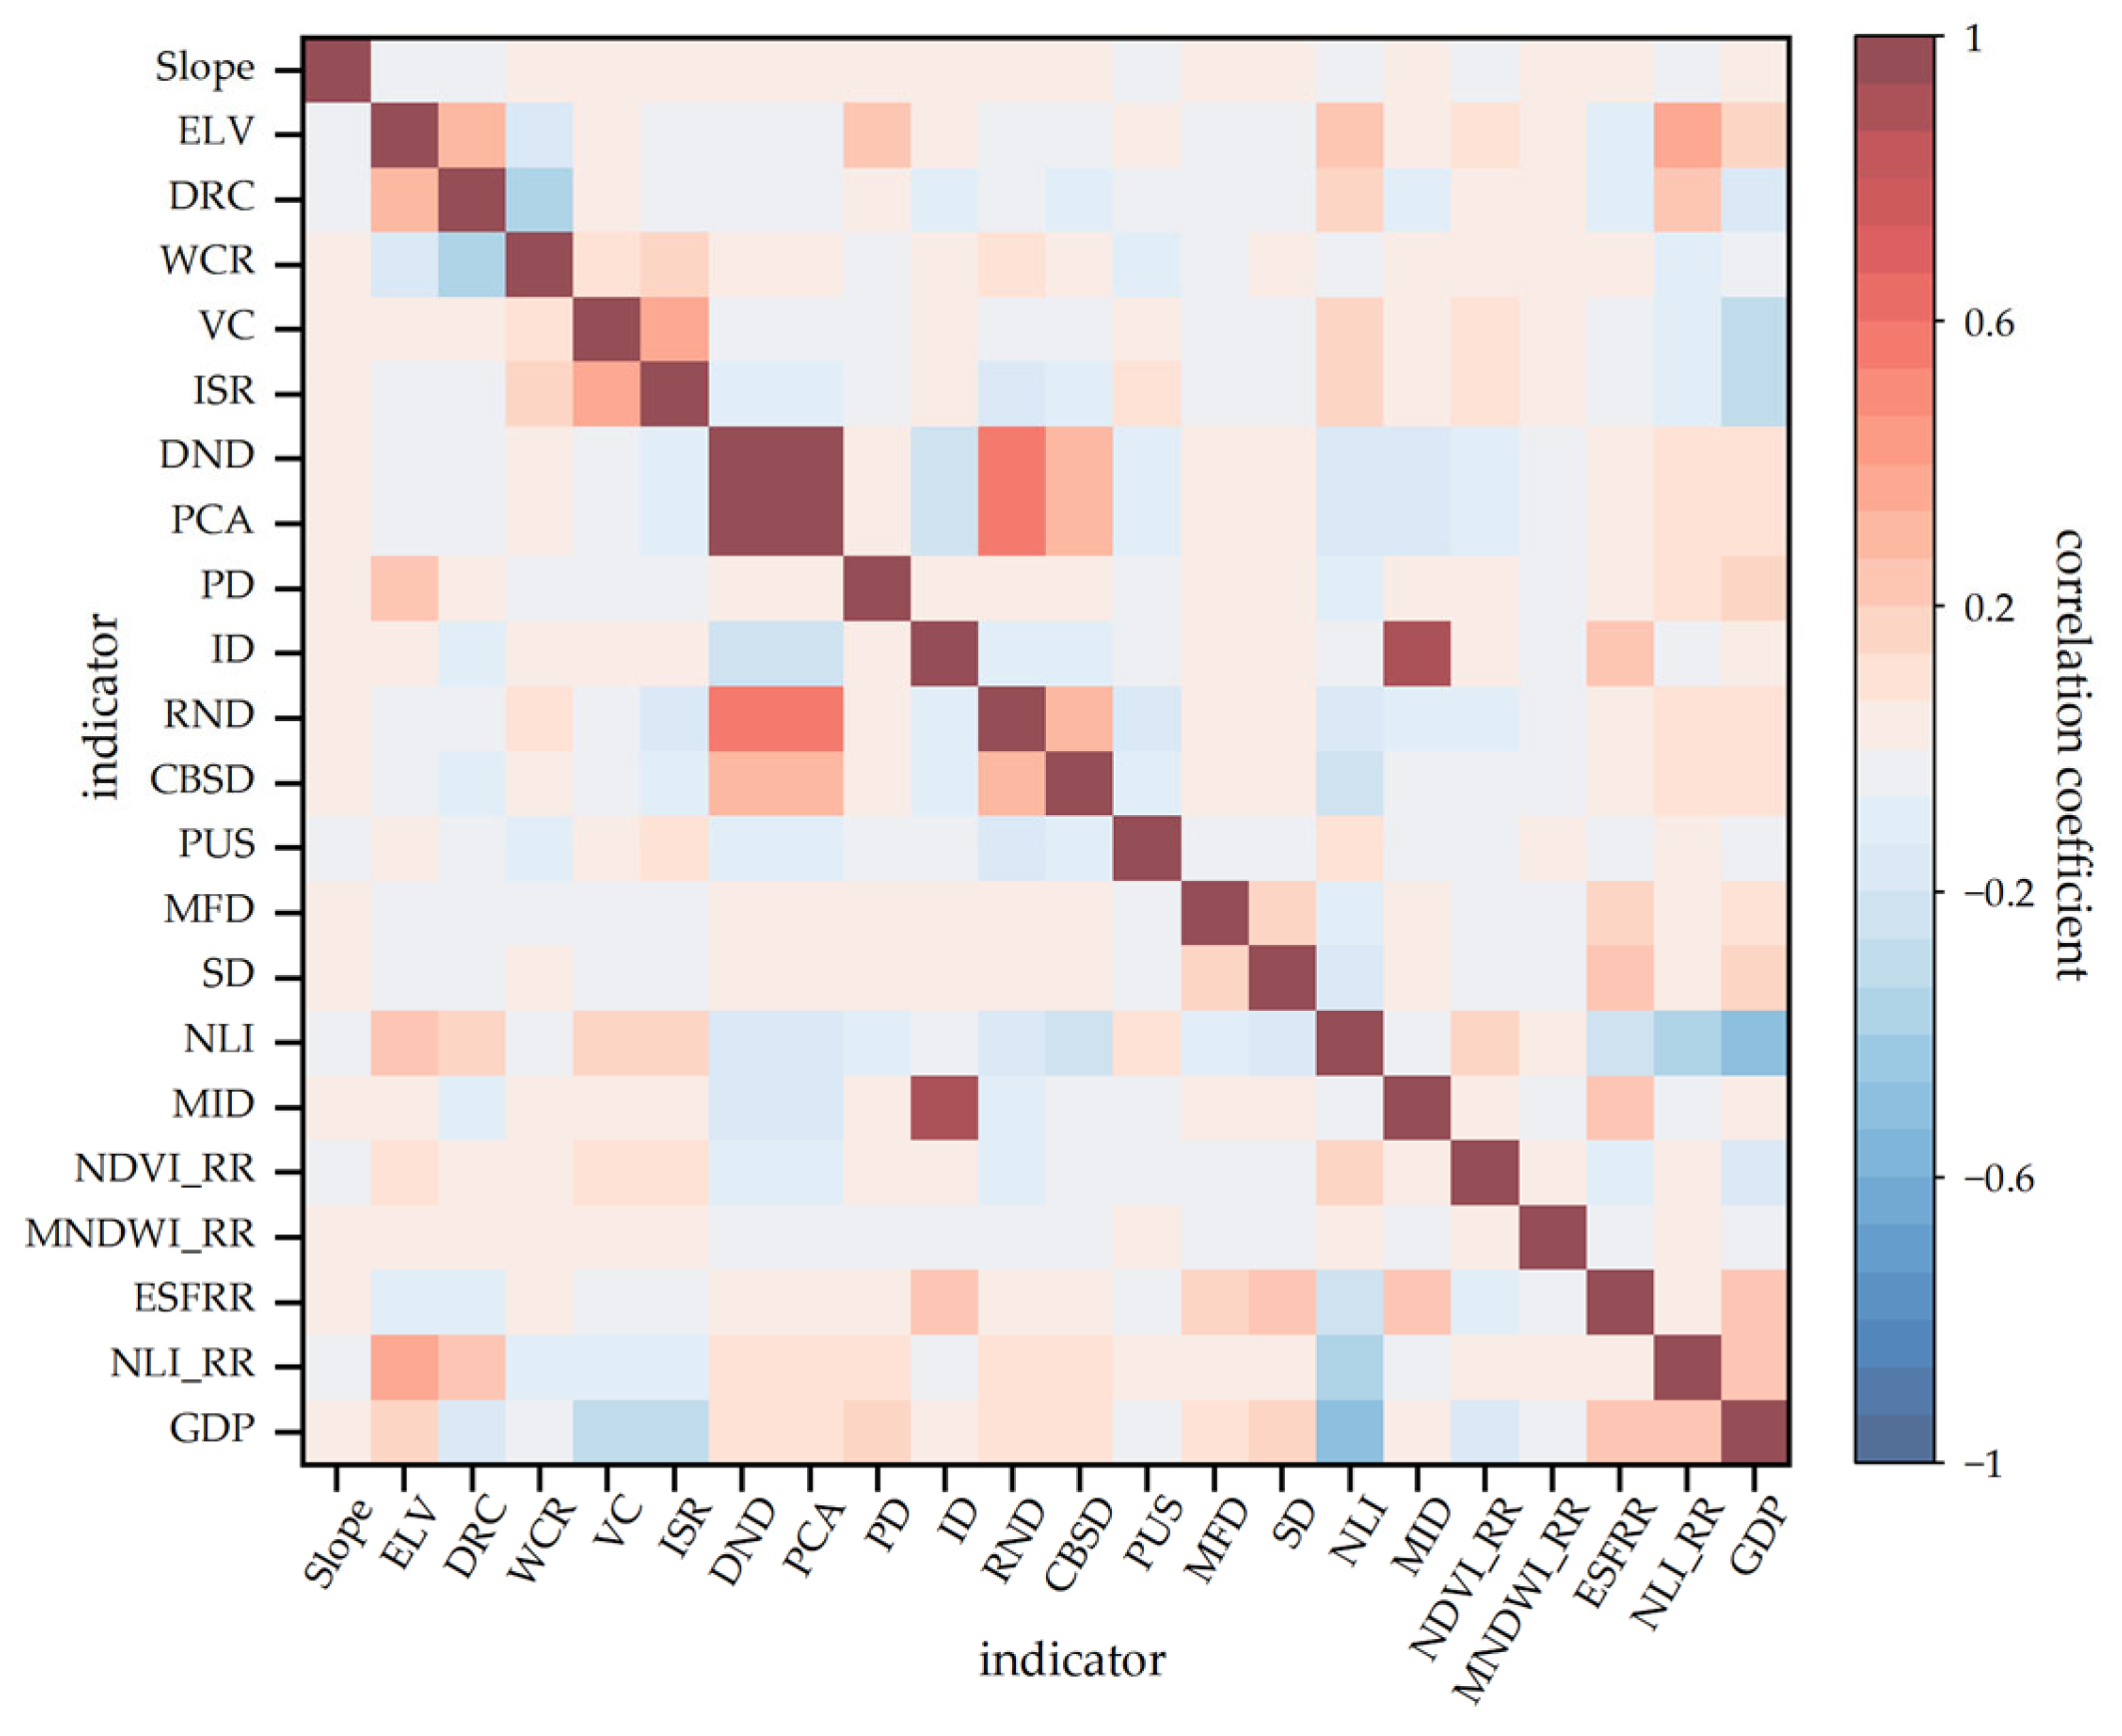
Spearman’s rank correlation analysis is conducted to assess indicator independence. The results show that the absolute values of pairwise correlation coefficients among the 22 indicators range from 0.0001 to 0.99, with 97.8% falling below 0.4 (p < 0.05), indicating weak overall inter-indicator dependence.
Appendix A.2. AHP Consensus Judgment Matrices and Consistency Tests
This appendix presents the consensus pairwise comparison matrices derived from seven domain experts using the geometric mean aggregation method. Table A1 shows the criterion-layer comparison among Resistance, Response, and Recovery. Table A2, Table A3 and Table A4 present the indicator-layer comparisons within each criterion. All matrices satisfy the consistency requirement (CR < 0.10). Table A5 summarizes the local weights, criterion weights, and the resulting global weights used in the combined weighting procedure described in Section 3.4.
Table A1.
Consensus judgment matrix at the criterion layer.
Table A2.
Consensus judgment matrix at the indicator layer under the Resistance criterion.
Table A3.
Consensus judgment matrix at the indicator layer under the Response criterion.
Table A4.
Consensus judgment matrix at the indicator layer under the Recovery criterion.
Table A5.
Summary of AHP local weights, criterion weights, and global weights.
Appendix A.3. Supplementary Validation of the InfoWorks ICM Model
Comparison of observed and simulated discharge hydrographs at the Dahongmen Sluice outlet indicates good agreement between simulated and observed flow processes across all events, with well-matched flood peak timing and magnitude (Figure A2). The Nash-Sutcliffe efficiency coefficient (NSE), peak flow relative error (REp), and peak time absolute error (AEtp) were used to evaluate model accuracy. As shown in Table A6, all NSE values exceed 0.8 during both the calibration and validation periods, REp remain within 10%, and AEtp do not exceed 30 min. These results confirm that the model satisfies the accuracy requirements of the Standard for Hydrological Information and Forecasting (GB/T 22482-2008 [62]).
Figure A2.
Observed and simulated discharge hydrographs at the study area outlet during the calibration period (a,b) and validation period (c–e).
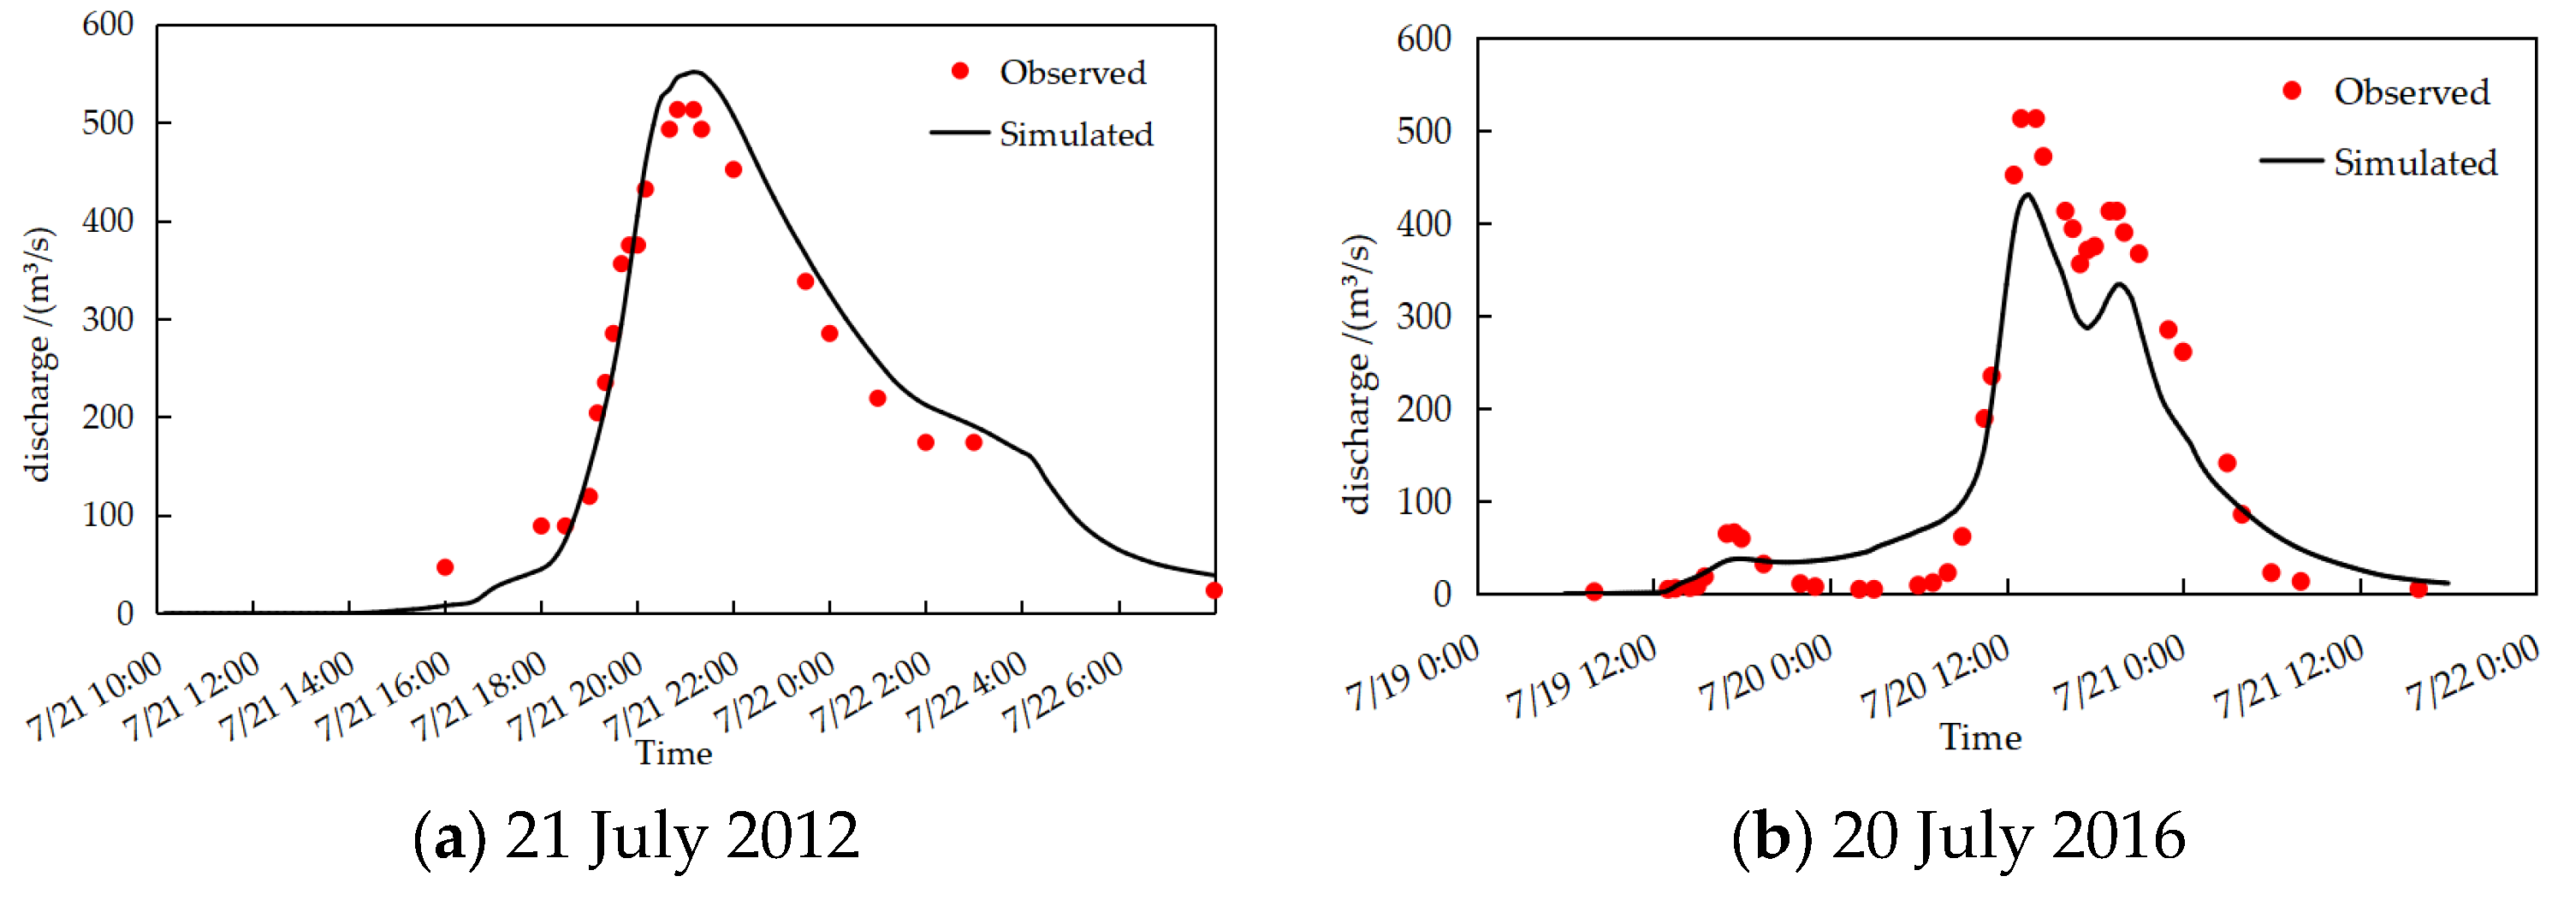
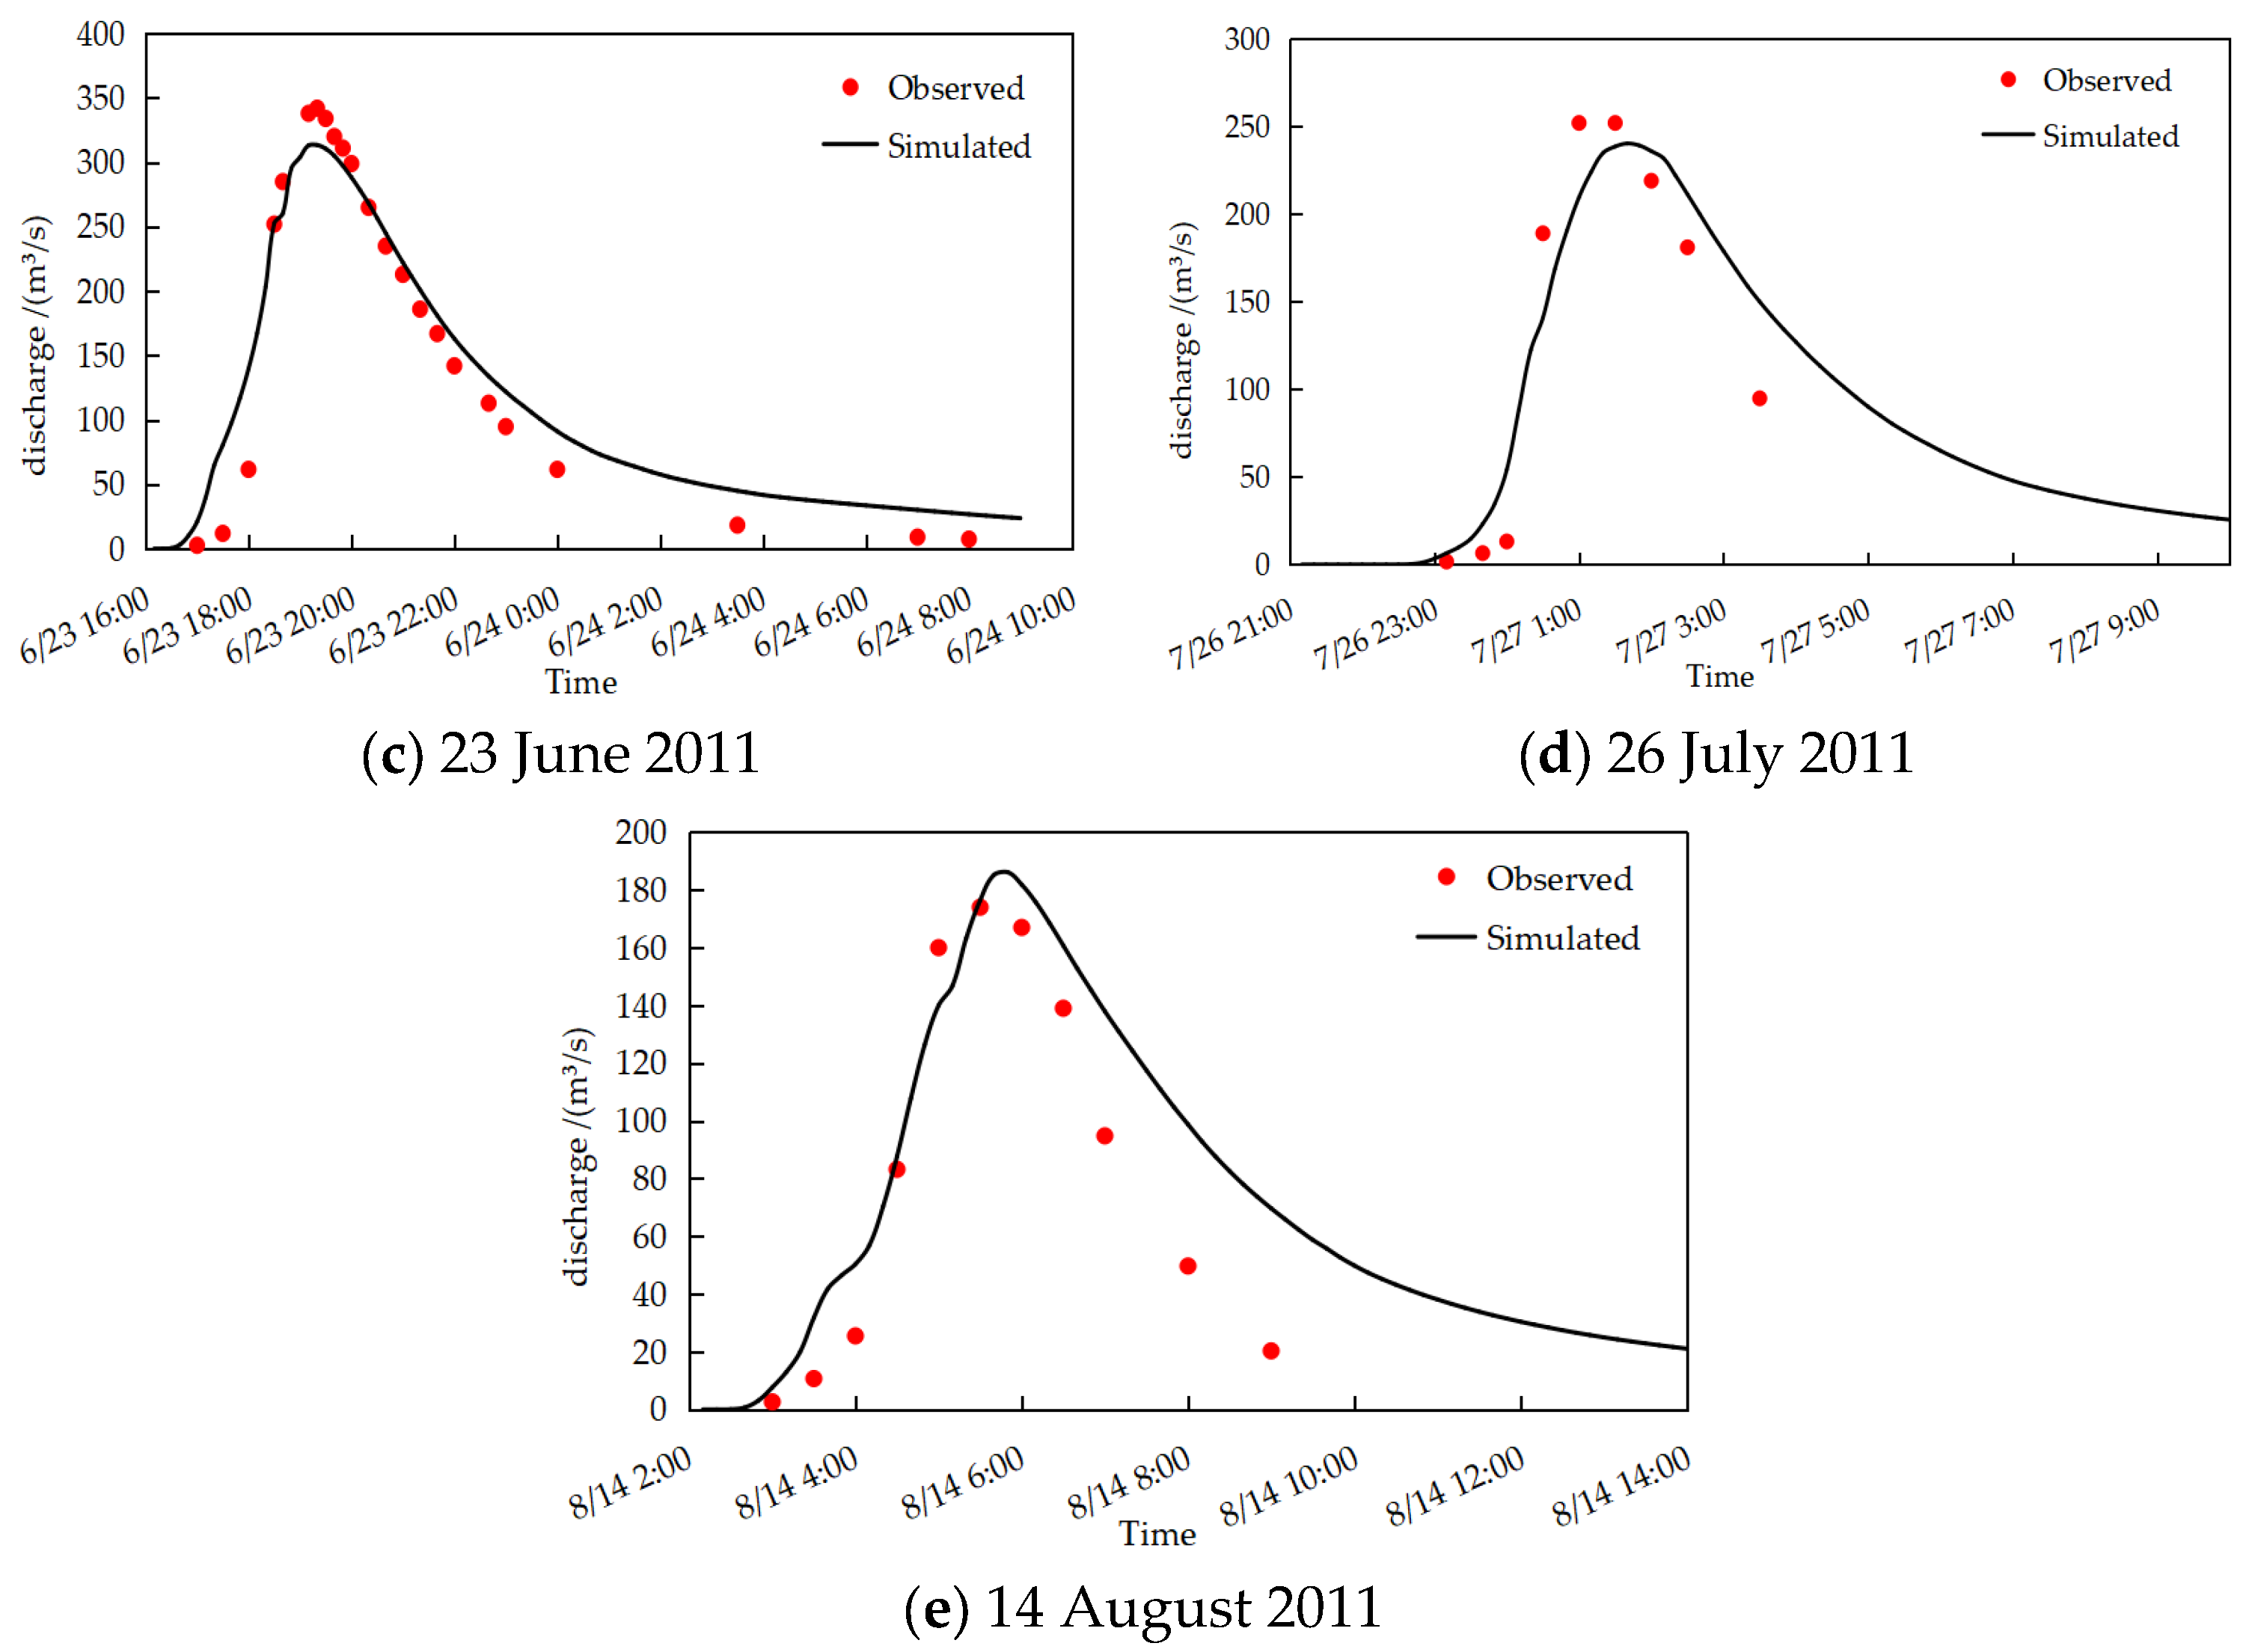
Table A6.
Simulation results of flood hydrograph during calibration and validation periods.
References
- IPCC. Climate Change 2021: The Physical Science Basis. Contribution of Working Group I to the Sixth Assessment Report of the Intergovernmental Panel on Climate Change; Cambridge University Press: Cambridge, UK, 2021. [Google Scholar]
- Rentschler, J.; Avner, P.; Marconcini, M.; Su, R.; Strano, E.; Vousdoukas, M.; Hallegatte, S. Global evidence of rapid urban growth in flood zones since 1985. Nature 2023, 622, 87–92. [Google Scholar] [CrossRef] [Scilit]
- Deng, Z.; Wang, Z.; Wu, X.; Lai, C.; Liu, W. Effect Difference of Climate Change and Urbanization on Extreme Precipitation over the Guangdong-Hong Kong-Macao Greater Bay Area. Atmos. Res. 2023, 282, 106514. [Google Scholar] [CrossRef] [Scilit]
- Xu, Z.; Liao, R.; Shu, X. Urban Flood Control and Resilient City Construction: Transformation, Innovation and Enlightenment. China Water Resour. 2024, 5, 17–23. (In Chinese) [Google Scholar]
- McClymont, K.; Morrison, D.; Beevers, L.; Carmen, E. Flood Resilience: A Systematic Review. J. Environ. Plan. Manag. 2020, 63, 1151–1176. [Google Scholar] [CrossRef] [Scilit]
- Cao, F.; Xu, X.; Zhang, C.; Kong, W. Evaluation of Urban Flood Resilience and Its Space–Time Evolution: A Case Study of Zhejiang Province, China. Ecol. Indic. 2023, 154, 110643. [Google Scholar] [CrossRef] [Scilit]
- Yu, Q.; Li, N.; Wang, Y.Y. Review of Flood Management Based on the Concept of Resilience. China Flood Drought Manag. 2021, 31, 19–25. (In Chinese) [Google Scholar]
- Luo, Y.; Chen, X.; Yao, L. Flood Disaster Resilience Evaluation of Chinese Regions: Integrating the Hesitant Fuzzy Linguistic Term Sets with Prospect Theory. Nat. Hazards 2021, 105, 667–690. [Google Scholar] [CrossRef] [Scilit]
- Moghadas, M.; Asadzadeh, A.; Vafeidis, A.; Fekete, A.; Kötter, T. A Multi-Criteria Approach for Assessing Urban Flood Resilience in Tehran, Iran. Int. J. Disaster Risk Reduct. 2019, 35, 101069. [Google Scholar] [CrossRef] [Scilit]
- Wang, P.; Li, Y.; Zhang, Y. An Urban System Perspective on Urban Flood Resilience Using SEM: Evidence from Nanjing City, China. Nat. Hazards 2021, 109, 2575–2599. [Google Scholar] [CrossRef] [Scilit]
- Bruneau, M.; Chang, S.A.; Eguchi, R.T.; Lee, G.C.; O’Rourke, T.D.; Shinozuka, M.; Tierney, K.; Wallace, W.A.; von Winterfeldt, D. A Framework to Quantitatively Assess and Enhance the Seismic Resilience of Communities. Earthq. Spectra 2003, 19, 733–752. [Google Scholar] [CrossRef] [Scilit]
- Jiao, L.; Wang, L.; Lu, H.; Fan, Y.; Zhang, Y.; Wu, Y. An assessment model for urban resilience based on the pressure-state-response framework and BP-GA neural network. Urban Clim. 2023, 49, 101543. [Google Scholar] [CrossRef] [Scilit]
- Khromova, S.; Villalba Méndez, G.; Eckelman, M.J.; Herreros-Cantis, P.; Langemeyer, J. A social-ecological-technological vulnerability approach for assessing urban hydrological risks. Ecol. Indic. 2025, 173, 113334. [Google Scholar] [CrossRef] [Scilit] [PubMed]
- Zhu, L.; Xie, Z.Q.; Liu, Y.; Yang, L.H.; Tan, J.; Cheng, W.; Cai, Z.L.; Du, Q.Y.; Zhang, S.L. Spatiotemporal evolution and driving factors of urban form resilience under flood hazard disturbance: A case study of 137 cities in the southeast monsoon influence zone of China. Sci. Total Environ. 2025, 990, 179889. [Google Scholar] [CrossRef] [Scilit] [PubMed]
- Peng, L.; Wang, Y.; Yang, L.; Garchagen, M.; Deng, X. A comparative analysis on flood risk assessment and management performances between Beijing and Munich. Environ. Impact Assess. Rev. 2024, 104, 107319. [Google Scholar] [CrossRef] [Scilit]
- Ahmad, S.; Peng, X.R.; Ashraf, A.; Yin, D.K.; Chen, Z.X.; Ahmed, R.; Israr, M.; Jia, H.F. Building resilient urban drainage systems by integrated flood risk index for evidence-based planning. J. Environ. Manag. 2025, 374, 124130. [Google Scholar] [CrossRef] [Scilit]
- Liang, Y.; Liao, W.; Wang, H. Efficient Urban Flooding Management: A Multi-Physical-Process-Oriented Flood Modelling and Analysis Method. Sustainability 2025, 17, 1124. [Google Scholar] [CrossRef] [Scilit]
- Castro-Melgar, I.; Falaras, T.; Basiou, E.; Parcharidis, I. Assessment of the October 2024 Cut-Off Low Event Floods Impact in Valencia (Spain) with Satellite and Geospatial Data. Remote Sens. 2025, 17, 2145. [Google Scholar] [CrossRef] [Scilit]
- Yin, H.; Zhang, F.; Tan, W.F.; Huang, C.; Xiao, R. Urban flood resilience assessment and driving effects exploration: A case study of the Beijing-Tianjin-Hebei urban agglomeration. Int. J. Disaster Risk Reduct. 2025, 126, 105608. [Google Scholar] [CrossRef] [Scilit]
- Zhang, Z.; Zhang, J.; Zhang, Y.; Chen, Y.; Yan, J. Urban Flood Resilience Evaluation Based on GIS and Multi-Source Data: A Case Study of Changchun City. Remote Sens. 2023, 15, 1872. [Google Scholar] [CrossRef] [Scilit]
- Liao, R.; Xu, Z.; Ye, C.; Shu, X.; Yang, D. Simulation of rainstrom waterlogging in Dahongmen drainage area based on SWMM and InfoWorks ICM models. Water Resour. Prot. 2023, 39, 109–117. (In Chinese) [Google Scholar]
- Wang, H.; Wang, S. Analysis of Rainfall and Flood of Liangshui River during the ‘7·20’ Extreme Rainstorm in Beijing. Beijing Water 2017, 1, 36–38. (In Chinese) [Google Scholar]
- Wang, Y.; Zhang, P.; Xie, Y.; Chen, L.; Cai, Y. Machine Learning Insights into the Evolution of Flood Resilience: A Synthesized Framework Study. J. Hydrol. 2024, 643, 131991. [Google Scholar] [CrossRef] [Scilit]
- Xu, F.; Fang, D.; Chen, B.; Wang, H. Resilience Assessment of Subway System to Waterlogging Disaster. Sust. Cities Soc. 2024, 113, 105710. [Google Scholar] [CrossRef] [Scilit]
- Liang, Y.; Wang, C.; Chen, G.; Xie, Z. Evaluation Framework ACR-UFDR for Urban Form Disaster Resilience under Rainstorm and Flood Scenarios: A Case Study in Nanjing, China. Sust. Cities Soc. 2024, 107, 105424. [Google Scholar] [CrossRef] [Scilit]
- Wang, Y.; Wu, R.; Rong, N. Response Relationship between Water Quality in the Lower Reaches of Xijiang River Basin and Land Use at Different Spatial Scales. Water Resour. Prot. 2021, 37, 97–104. (In Chinese) [Google Scholar]
- Lu, T.; Cui, X. Observational Comparison of Two Torrential Rainfall Events in Beijing. Chin. J. Atmos. Sci. 2022, 46, 111–132. (In Chinese) [Google Scholar]
- European Space Agency. Copernicus Data Space Browser. Available online: https://browser.dataspace.copernicus.eu/ (accessed on 13 November 2025).
- Xiong, S.; Zhang, X.; Lei, Y.; Tan, G.; Wang, H.; Du, S. Time-Series China Urban Land Use Mapping (2016–2022): An Approach for Achieving Spatial-Consistency and Semantic-Transition Rationality in Temporal Domain. Remote Sens. Environ. 2024, 312, 114344. [Google Scholar] [CrossRef] [Scilit]
- National Ecosystem Science Data Center. NDVI Dataset. Available online: https://nesdc.org.cn/ (accessed on 15 November 2025).
- Gong, P.; Li, X.C.; Wang, J.; Bai, Y.; Chen, B.; Hu, T.Y.; Liu, X.P.; Xu, B.; Yang, J.; Zhang, W.; et al. Annual Maps of Global Artificial Impervious Areas (GAIA) between 1985 and 2018. Remote Sens. Environ. 2020, 236, 111510. [Google Scholar] [CrossRef] [Scilit]
- WorldPop. WorldPop Population Dataset: China Population Counts 2015–2030. Available online: https://data.humdata.org/dataset/worldpop-population-counts-2015-2030-chn (accessed on 20 November 2025).
- OpenStreetMap. OpenStreetMap Road and Subway Network. Available online: https://www.openstreetmap.org/ (accessed on 20 November 2025).
- OpenCelliD. OpenCelliD Communication Base Station Data. Available online: https://opencellid.org (accessed on 15 November 2025).
- Baidu Maps. POI Data from Baidu Maps API. Available online: https://lbsyun.baidu.com/ (accessed on 22 November 2025).
- Amap (AutoNavi). POI Data from Amap API. Available online: https://lbs.amap.com/ (accessed on 23 November 2025).
- NOAA-NCEI Earth Observation Group. VIIRS Nighttime Lights (VNL) Annual Composites. Available online: https://eogdata.mines.edu/products/vnl/ (accessed on 18 November 2025).
- NASA LP DAAC. Black Marble VNP46A2 Nighttime Light Daily Data. Available online: https://ladsweb.modaps.eosdis.nasa.gov/ (accessed on 18 November 2025).
- Zhang, R.; Li, Y.; Chen, T.; Zhou, L. Flood risk identification in high-density urban areas of Macau based on disaster scenario simulation. Int. J. Disaster Risk Reduct. 2024, 107, 104485. [Google Scholar] [CrossRef] [Scilit]
- Liao, R.; Xu, Z.; Huang, Y. Dynamic Response of Urban Pluvial Flood Resilience Under a Multi-Dimensional Assessment Framework. Sustainability 2025, 17, 10044. [Google Scholar] [CrossRef] [Scilit]
- Zhang, J.; Fang, H.; Zhang, Z.; Di, D. Deep learning-based rapid prediction of urban emergency response capability: A perspective considering the coupled effect of rainfall and drainage pipeline siltation. J. Hydrol. 2026, 664, 134555. [Google Scholar] [CrossRef] [Scilit]
- Tang, Z.; Wang, P.; Li, Y.; Chen, C.; Lou, Y.; Hu, T. Contributions of Urbanization and Population Growth to Changes in Urban Flood Exposure in Recent Decades. Sustain. Cities Soc. 2025, 130, 106592. [Google Scholar] [CrossRef] [Scilit]
- Xiao, H.; Zhang, J.; Wang, F.; Kong, L. A new framework for early-warning classification of urban waterlogging risk based on waterlogging risk angle. Sustain. Cities Soc. 2025, 127, 106460. [Google Scholar] [CrossRef] [Scilit]
- Li, J.; Hou, H.; Zhang, Y.; Huang, R.; Hu, T. Scenario-Based Simulation of Impervious Surfaces for Detecting the Effects of Landscape Patterns on Urban Waterlogging. Remote Sens. 2024, 16, 2130. [Google Scholar] [CrossRef] [Scilit]
- GB 50014-2021; Standard for Design of Outdoor Wastewater Engineering. China Planning Press: Beijing, China, 2021.
- Zhang, T.; Wu, K.; Wang, X.; Li, X.; Li, L.; Chen, L. Impact of Land Use Patterns on Flood Risk in the Chang-Zhu-Tan Urban Agglomeration, China. Remote Sens. 2025, 17, 2889. [Google Scholar] [CrossRef] [Scilit]
- Diakoulaki, D.; Mavrotas, G.; Papayannakis, L. Determining Objective Weights in Multiple Criteria Problems: The CRITIC Method. Comput. Oper. Res. 1995, 22, 763–770. [Google Scholar] [CrossRef] [Scilit]
- Saaty, T.L. Fundamentals of Decision Making and Priority Theory with the Analytic Hierarchy Process; RWS Publications: Pittsburgh, PA, USA, 1994. [Google Scholar]
- Yang, Z.; Shang, K. Cloud Model Assessment of Urban Flood Resilience Based on PSR Model and Game Theory. Int. J. Disaster Risk Reduct. 2023, 97, 104050. [Google Scholar] [CrossRef] [Scilit]
- Peng, T.; Deng, H.; Lin, Y.; Jin, Z. Assessment on water resources carrying capacity in karst areas by using an innovative DPESBRM concept model and cloud model. Sci. Total Environ. 2021, 767, 144353. [Google Scholar] [CrossRef] [Scilit]
- Ambily, P.; Chithra, N.R.; Firoz, C.M. A Novel Framework for Prioritization and Spatial Suitability Assessment of Blue-Green Infrastructure for Urban Pluvial Flood Resilience. J. Hydrol. 2025, 655, 132976. [Google Scholar] [CrossRef] [Scilit]
- Yuan, D.; Wang, H.; Wang, C.; Yan, C.; Xu, L.; Zhang, C.; Wang, J.; Kou, Y. Characteristics of Urban Flood Resilience Evolution and Analysis of Influencing Factors: A Case Study of Yingtan City, China. Water 2024, 16, 834. [Google Scholar] [CrossRef] [Scilit]
- Li, J.; Strong, C.; Wang, J.; Burian, S. An Event-Based Resilience Index to Assess the Impacts of Land Imperviousness and Climate Changes on Flooding Risks in Urban Drainage Systems. Water 2023, 15, 2663. [Google Scholar] [CrossRef] [Scilit]
- Xia, J.; Liu, T.; Hou, H.; Zhang, H.; Hu, T. Urban Pluvial Flood Susceptibility Assessment for the Central Lin’an District in Hangzhou, China, Using the GNNWLR Model with SHAP Interpretability. J. Hydrol. Reg. Stud. 2026, 64, 103232. [Google Scholar] [CrossRef] [Scilit]
- Erdem, U.; Sharifi, A.; Ökmen, Z. Neighborhood-Scale Assessment of Urban Flood Impacts on Transportation Network Resilience: A Case Study of Mavişehir, İzmir. Int. J. Disaster Risk Reduct. 2026, 132, 105970. [Google Scholar] [CrossRef] [Scilit]
- Deng, J.; Zhang, R.; Chen, S.; Li, Z.; Gao, L.; Li, Y.; Wei, C. Spatiotemporal Evolution and Influencing Factors of Flood Resilience in Beibu Gulf Urban Agglomeration. Int. J. Disaster Risk Reduct. 2024, 114, 104905. [Google Scholar] [CrossRef] [Scilit]
- Ji, J.; Fang, L.; Chen, J.; Ding, T. A Novel Framework for Urban Flood Resilience Assessment at the Urban Agglomeration Scale. Int. J. Disaster Risk Reduct. 2024, 108, 104519. [Google Scholar] [CrossRef] [Scilit]
- Cuce, P.M.; Cuce, E.; Santamouris, M. Towards Sustainable and Climate-Resilient Cities: Mitigating Urban Heat Islands Through Green Infrastructure. Sustainability 2025, 17, 1303. [Google Scholar] [CrossRef] [Scilit]
- Liu, Y.; Qi, W.; Li, M.; Wu, S.; Pang, J.; Zhao, Z. A conceptual framework for implementing green-grey infrastructures to mitigate urban flood through source-to-hazard intervention pattern. Int. J. Disaster Risk Reduct. 2025, 121, 105432. [Google Scholar] [CrossRef] [Scilit]
- Wu, W.; Jamali, B.; Marshall, L.; Deletic, A.; Zhang, K. A water sensitive urban design (WSUD) planning framework for catchment-scale urban pluvial flood mitigation targets. Water Res. 2025, 285, 124095. [Google Scholar] [CrossRef] [Scilit]
- Wei, Y.; Cheng, Y.; Liao, H. Optimal resilience-based restoration of a system subject to recurrent dependent hazards. Reliab. Eng. Syst. Saf. 2024, 247, 110137. [Google Scholar] [CrossRef] [Scilit]
- GB/T 22482-2008; Standard for Hydrological Information and Hydrological Forecasting. China Standards Press: Beijing, China, 2008.

Disclaimer/Publisher’s Note: The statements, opinions and data contained in all publications are solely those of the individual author(s) and contributor(s) and not of MDPI and/or the editor(s). MDPI and/or the editor(s) disclaim responsibility for any injury to people or property resulting from any ideas, methods, instructions or products referred to in the content. |
© 2026 by the authors. Licensee MDPI, Basel, Switzerland. This article is an open access article distributed under the terms and conditions of the Creative Commons Attribution (CC BY) license.