1. Introduction
Rivers sustain some of Earth’s most biodiverse and productive ecosystems while remaining among the most heavily modified aquatic environments globally [
1,
2]. More than half of the world’s large river systems (172 of 292 assessed) are affected by dams, including the eight most biogeographically diverse, and only 37% of rivers longer than 1000 km remain free-flowing along their entire length [
2,
3]. At least 3700 major dams with a capacity exceeding 1 MW are either planned or under construction worldwide, primarily in emerging economies [
4]. In high-diversity river basins such as the Amazon, Congo, and Mekong, this acceleration in dam construction poses substantial threats to aquatic biodiversity and commercially important fisheries that conventional economic assessments tend to underestimate [
5]. Contemporary dam development is characterized by the proliferation of cascade configurations, in which multiple dams are arranged in series along a single river, producing cumulative ecological impacts that exceed those of any individual structure [
6,
7]. How cascade hydropower development reorganizes river ecosystems across multiple levels of biological organization therefore remains a central question in freshwater ecology and water resource management.
Cascade dam development modifies river ecosystems through predictable physical and chemical alterations whose intensity attenuates with increasing distance from the dam [
6,
8]. Hypolimnetic releases from thermally stratified reservoirs discharge anomalously cold, oxygen-depleted water into downstream reaches, depressing water temperatures and suppressing natural thermal variability [
9]. Such cold-water pollution can persist for hundreds of kilometers below large bottom-release dams, disrupting ecological processes including fish spawning, and thermal suppression magnitudes of up to 10 °C have been recorded under high reservoir storage volumes [
9,
10]. Concurrently, sediment retention within impoundments reduces downstream turbidity, generating steep longitudinal gradients in light availability and optical water properties [
6,
11]. These physical discontinuities disrupt the biological and material continuum predicted by the River Continuum Concept, producing spatial sequences of altered organic matter processing, nutrient cycling, and community structure, as formalized in the Serial Discontinuity Concept [
8,
12]. Incorporating thermal and hydrological regimes into environmental flow prescriptions has consequently emerged as a major challenge for restoring ecological integrity in dam-regulated rivers [
13]. On the Hanjiang River, cascade dams and tributary inflows have been shown to disrupt longitudinal phytoplankton biogeography by altering water travel time and shifting the dominant control from hydrodynamics to water quality, documenting the spatial extent of environmental restructuring under multi-dam configurations [
14].
Single-trophic investigations have established that dam-mediated biological impacts are measurable and trophic-level-specific, yet have almost exclusively been conducted in isolation from one another. On the Hanjiang River, ecological health in cascade reservoir reaches was rated as “fair”, with dam impacts and pollutant emissions identified as the dominant drivers of planktonic assemblage condition [
15]. Environmental selection, mediated by dam-induced physico-chemical modification, dominates zooplankton community assembly in dam-controlled river reaches, whereas dispersal processes assume greater relative importance in hydrologically homogenized downstream zones [
16]. Among benthic macroinvertebrates, dam-regulation-induced flow fluctuations alter drift patterns and community stability [
17]. Dam construction on the Hanjiang was associated with a decline in pollution-sensitive Ephemeroptera, Plecoptera, and Trichoptera (EPT) taxa alongside a concurrent increase in tolerant Gastropoda and Oligochaeta, reflecting replacement of rheophilic communities by lentic-adapted assemblages [
18]. Studies of smaller dam systems have further demonstrated that impoundment reduces richness and diversity of phytoplankton and benthos in the post-dam phase, with the hydrodynamic transition from lotic to semi-lentic conditions identified as the primary driver [
19]. Long-term environmental flow augmentation produced significant recovery of benthic invertebrate communities in a regulated river, confirming that hydrological regime governs benthic community structure [
20]. Despite this accumulation of evidence, the simultaneous, mechanistically connected responses of multiple trophic levels to cascade dam regulation have not been investigated.
Whether the trophic-level-specific biological responses to cascade dam development are mechanistically coupled through direct food-web interactions or are independently mediated by shared environmental gradients remains unresolved. Prior work in cascade dam systems demonstrated that both bottom-up factors (particularly flow velocity and nutrient concentrations) and top-down factors (higher trophic levels) control microbial food web patterns [
21], but whether analogous mechanisms govern multi-trophic macrobiotic communities has not been established. Multi-trophic investigations in dam-disturbed river basins indicate that impoundment and urbanization together impose strong environmental filtering effects on community structure across trophic levels, with structural equation modelling revealing that indirect, pollutant-mediated pathways account for the majority of diversity decline [
22]. Studies of pelagic food web dynamics along environmental gradients further show that the net effect of environmental drivers equals or exceeds bottom-up and top-down effects for all food web components [
23]. Nevertheless, the relative importance of direct trophic coupling versus shared environmental responses remains largely unpartitioned through causal modelling in regulated river systems where multiple trophic levels are surveyed simultaneously. Multi-taxon surveys in unregulated rivers have documented weak congruence in diversity patterns across trophic groups, indicating that individual biological groups cannot serve as reliable biodiversity surrogates [
24]. Whether cascade dam development amplifies or attenuates this cross-trophic decoupling, and through what mechanism, remains unknown. Distinguishing between environmental mediation and direct trophic cascading has direct management implications: if environmental filtering predominates, restoring flow and water quality conditions would be expected to simultaneously rehabilitate multiple trophic levels, whereas if direct trophic cascading governs community structure, food-web architecture itself requires active management.
The middle-lower Hanjiang River, the largest tributary of the Yangtze River (total length 1577 km), offers a natural experiment well suited to investigating these questions. Seven cascade hydraulic structures have been constructed or are under construction along the 430 km middle-lower trunk channel, from Danjiangkou Reservoir to Xinglong, establishing an uninterrupted cascade impoundment zone in the upper portion of the study reach and a downstream reach below Xinglong Dam [
15,
25]. Danjiangkou Reservoir, the primary water source for the South-to-North Water Diversion Middle Route Project, generates pronounced hypolimnetic releases and clear-water effects that propagate far downstream, imposing a steep longitudinal gradient in associated hydrochemical variables [
26,
27]. This configuration provides a continuous distance-from-dam gradient suitable for testing environmental filtering mechanisms and a contrast between impounded and downstream reach types, making the Hanjiang River a tractable system for examining the environmental restructuring of multi-trophic communities under cascade regulation [
14].
To fill this gap, phytoplankton, zooplankton, and benthic macroinvertebrate communities were surveyed simultaneously at seven stations spanning the 430 km cascade gradient of the middle-lower Hanjiang River over eight seasonal sampling campaigns (2015–2017). Piecewise structural equation modelling (piecewiseSEM) was applied to partition the causal pathways linking cascade dam spatial configuration to multi-trophic community diversity. Variance partitioning and Mantel tests were used to quantify the relative contributions of environmental, spatial, temporal, and biotic components to community variation, and species co-occurrence network analysis was used to identify hub species and characterise cross-trophic interaction architecture. Three specific objectives were addressed: (1) to characterise the spatial effects of cascade dam development on physicochemical variables along the longitudinal gradient; (2) to compare the diversity responses of the three trophic levels to the environmental gradient and identify trophic-level-specific environmental drivers; and (3) to quantify the relative contributions of environmental mediation and direct trophic coupling in driving multi-trophic community variation. By resolving which mechanism prevails, this study aims to inform trophic-level-specific management prescriptions for cascade-regulated rivers, including targeted environmental flow recommendations and ecological monitoring strategies relevant to large-scale water transfer operations.
2. Methods
2.1. Study Area and Sampling Design
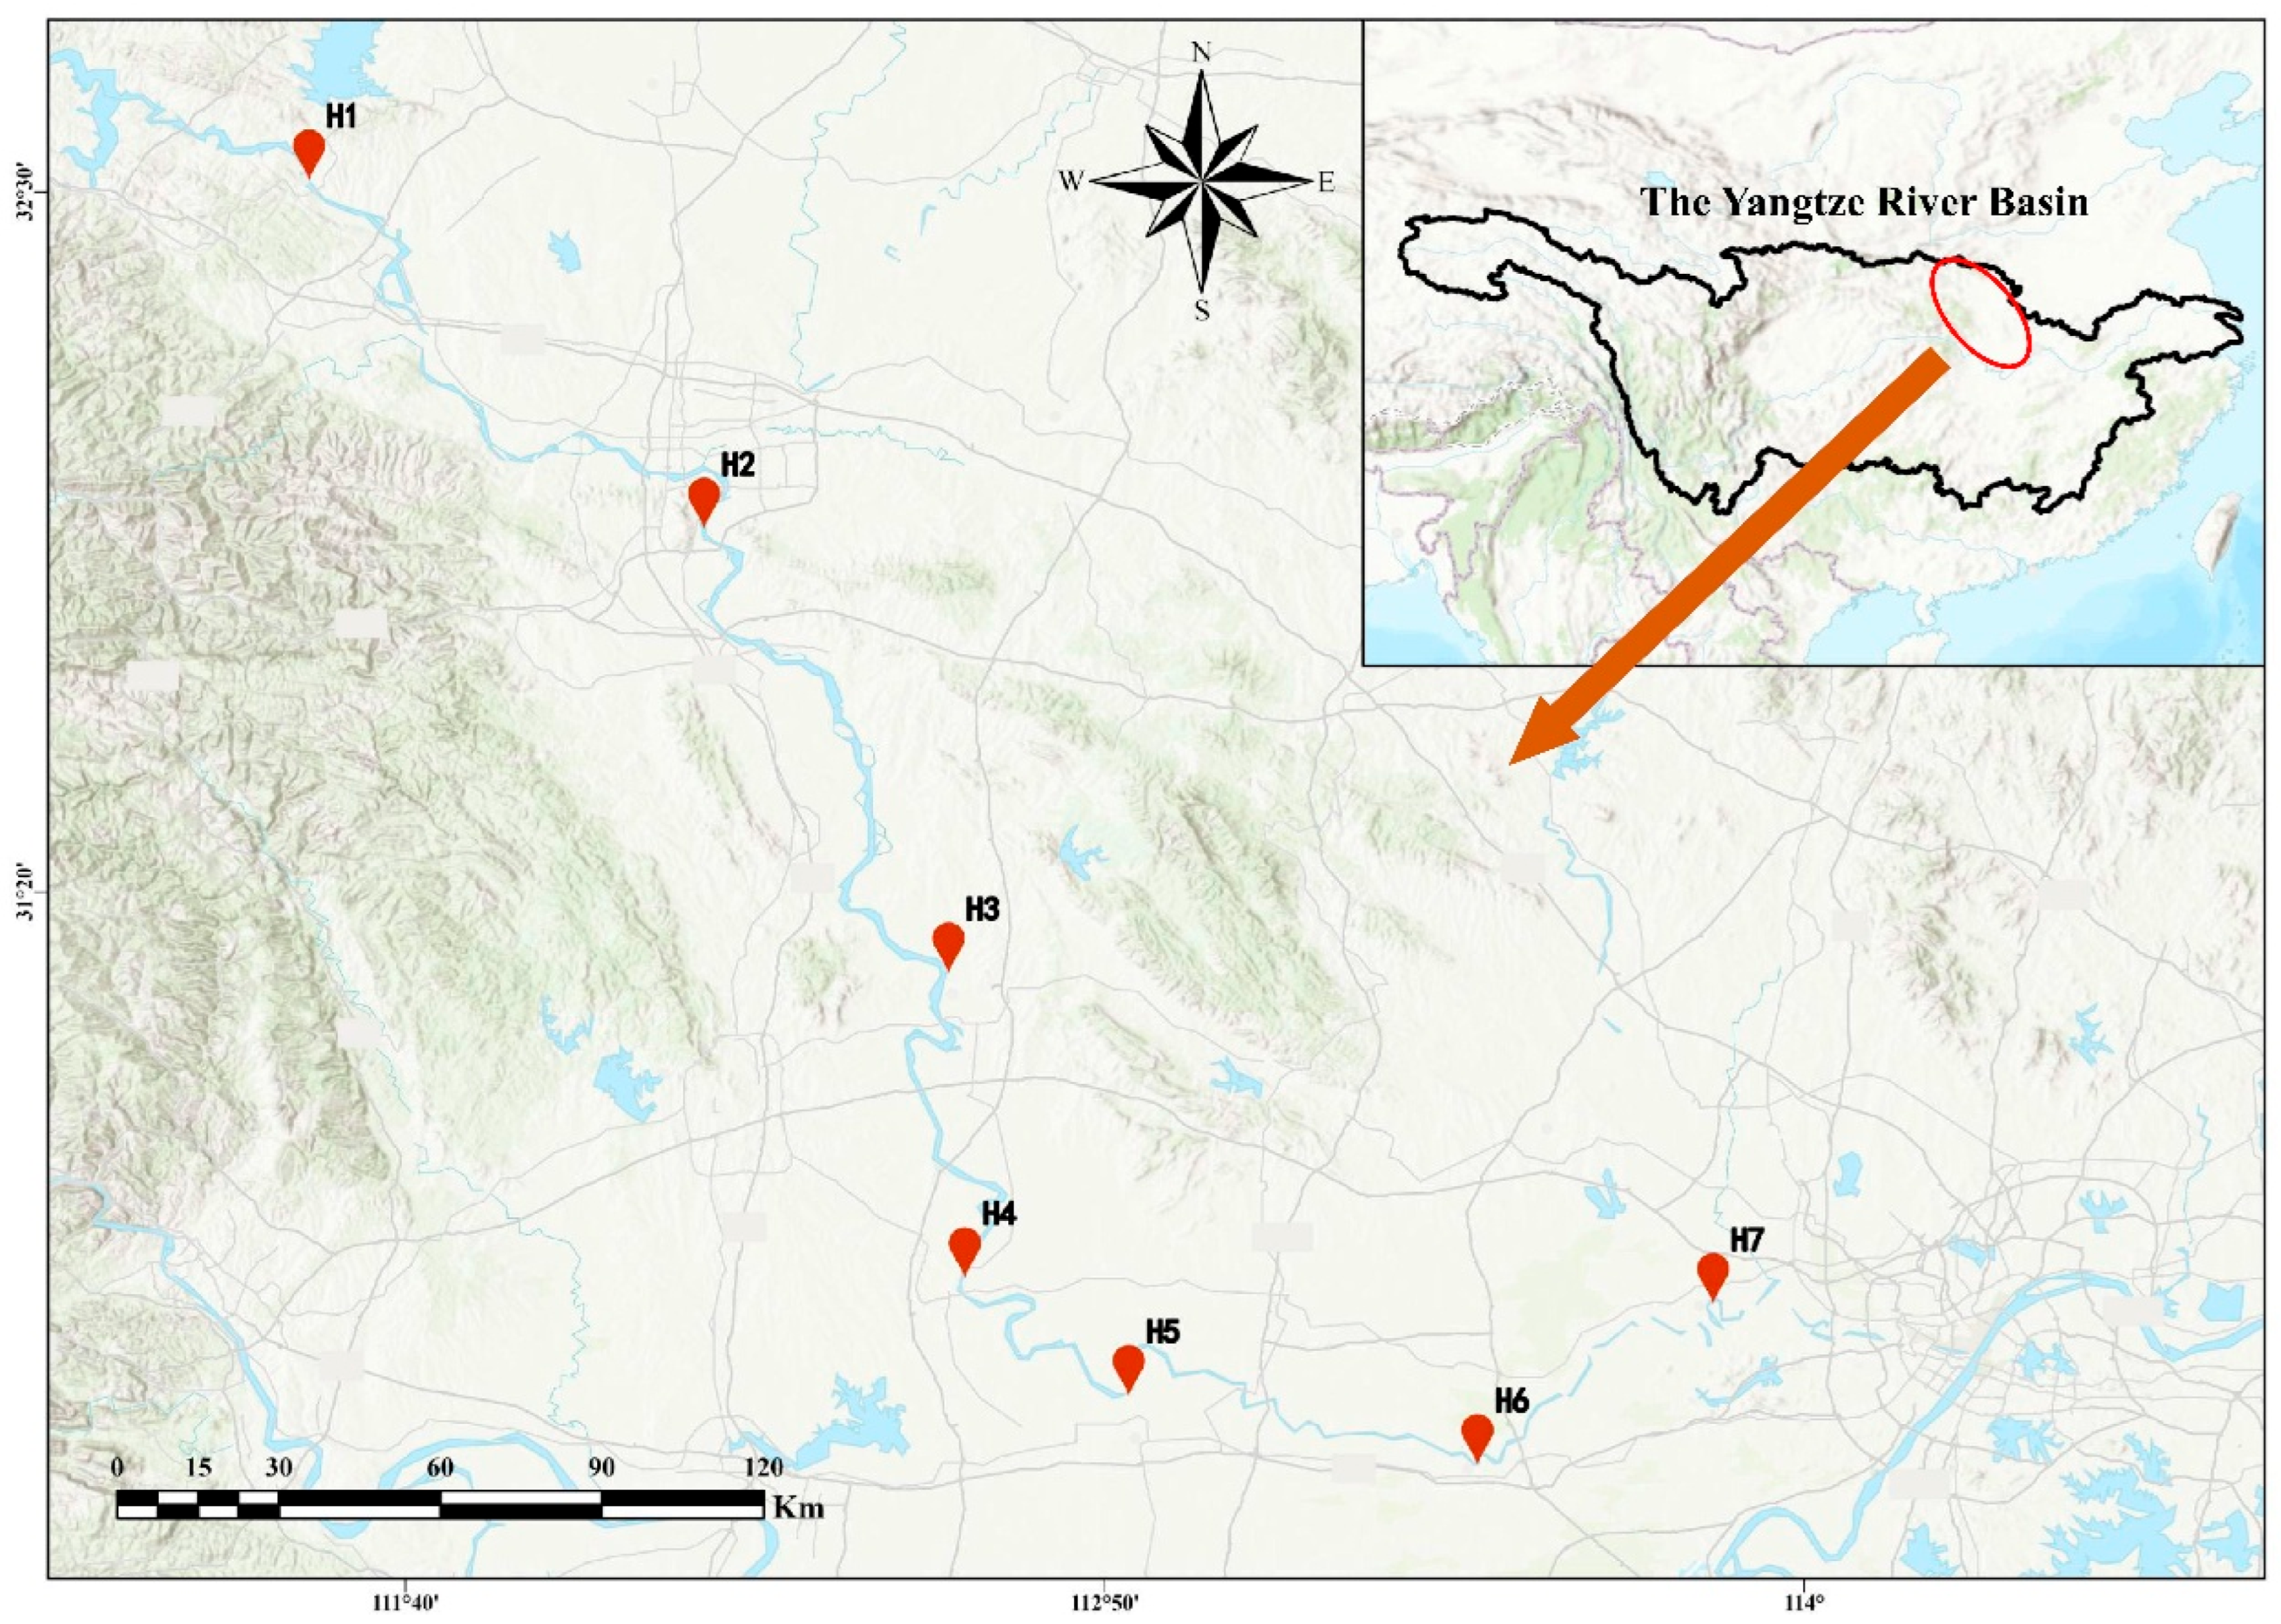
The study was conducted across the Hanjiang River in the middle and lower reaches of the Yangtze River Basin, downstream of Danjiangkou Reservoir (the primary water source for China’s South-to-North Water Diversion Project). Seven fixed sampling stations (H1–H7) were established along a continuous longitudinal gradient spanning approximately 430 km from Huangjiagan (H1, 6 km below Danjiangkou Dam) to Hanchuan (H7;
Figure 1). Stations were classified into two river reach types based on local hydrological regulation: an impounded reach (H1–H4: Huangjiagan, Xiangyang, Huangzhuang, and Shayang), where the channel is controlled by a cascade of operational dams (Danjiangkou, Wangfuzhou, and Cuijiaying); and a downstream reach (H5–H7: Zekou, Xiantao, and Hanchuan), located below Xinglong Dam where the channel transitions to more riverine hydraulic conditions, though these stations remain subject to attenuated upstream dam regulation rather than being entirely free-flowing. The distance from Danjiangkou Dam ranged from 6 km (H1) to approximately 430 km (H7), providing a continuous spatial gradient for assessing dam-regulated environmental effects (
Table 1).
Sampling was conducted over eight seasonal surveys: three surveys in 2015 (April, August, and October), four in 2016 (February, April, August, and November), and one in 2017 (February), yielding 56 sample units in total (8 seasons × 7 stations). After cross-matching among trophic levels to retain only sample units with complete biological data across all three groups, 49 matched sample units were retained for joint multi-trophic analyses.
2.2. Biological Sampling
At each station, triplicate 1-litre water samples for phytoplankton were collected from the near-surface layer (~0.5 m depth) using a horizontal Van Dorn water sampler. Samples were immediately fixed in the field with acidified Lugol’s iodine solution to a final concentration of approximately 1% (
v/
v). In the laboratory, fixed samples were gently homogenised and allowed to settle in calibrated Utermöhl sedimentation cylinders for a minimum of 48 h. Phytoplankton cells were enumerated and identified to species level under an Olympus CX31 biological microscope (Olympus Corporation, Tokyo, Japan) at 400× magnification following the Utermöhl sedimentation method [
28]. Cell densities were expressed as cells L
−1. For each station–season combination, the arithmetic mean of the three replicate samples was used as the representative cell density for all subsequent analyses. Taxonomic identification followed Hu and Wei [
29]. A total of 91 phytoplankton taxa belonging to seven phyla were recorded across all stations and seasons.
Zooplankton sampling encompassed two fractions corresponding to size and taxonomic composition. Metazoan zooplankton (rotifers, cladocerans, and copepods) were sampled by filtering a fixed volume of 20 litres of surface water through a 64 μm mesh plankton net; concentrated samples were transferred into 50 mL polyethylene vials and preserved immediately in 4% buffered formalin. Metazoan zooplankton were enumerated and identified under an Olympus CX31 biological microscope (Olympus Corporation, Tokyo, Japan) at 40–400× magnification. Protozoans (primarily ciliates and flagellates) were sampled as 1-litre unfiltered water aliquots, fixed with Lugol’s iodine (1% final concentration), settled for 24 h, and enumerated under an Olympus CKX41 inverted microscope (Olympus Corporation, Tokyo, Japan) at 200–400× magnification. All zooplankton samples were identified to the lowest feasible taxonomic level (species or morphospecies), and abundances were expressed as individuals L
−1. Zooplankton were identified following three fauna identification guides [
30,
31,
32]. A combined dataset of 73 zooplankton taxa (including both metazoan and protozoan groups) was used for community analyses.
Benthic communities were sampled using a Peterson grab sampler (sampling area 0.025 m
2). Three replicate grabs were taken at each station per sampling occasion to account for within-site spatial variability and averaged to yield a single density estimate (ind. m
−2) per sampling unit for all downstream analyses. All material retrieved was immediately washed through a 500 μm stainless-steel sieve on-site to remove fine sediment. Retained organisms were transferred to labelled polyethylene bags and preserved in 75% ethanol for later laboratory processing. Specimens were sorted under an Olympus SZX7 stereomicroscope (Olympus Corporation, Tokyo, Japan) and identified to species or genus level. Aquatic insects were identified following two fauna identification guides [
33]. Abundances were expressed as individuals m
−2. In total, 43 benthic macroinvertebrate taxa were recorded across all samples.
2.3. Environmental Measurements
Seven physicochemical variables were measured at each station during every sampling campaign. Water temperature (°C), dissolved oxygen (mg L−1), pH, electrical conductivity (mS cm−1), and total dissolved solids (TDS, g L−1) were determined in situ using a calibrated multi-parameter water quality meter (YSI Pro Plus, YSI Inc./Xylem Inc., Yellow Springs, OH, USA). Water transparency was measured as Secchi depth (m) using a standard 30 cm diameter Secchi disk. Turbidity (NTU) was measured with a portable turbidimeter (Hach 2100Q, Hach Company, Loveland, CO, USA).
In addition, two biological proxy variables were measured to characterize phytoplankton biomass and cyanobacterial abundance in the water column. Chlorophyll-a concentration was determined spectrophotometrically following the hot-ethanol extraction method with correction for phaeopigments [
34,
35]. Water samples (500–1000 mL) were filtered through GF/C glass-fiber filters (Whatman (London, UK), 1.2 μm pore size) within 4 h of collection. Filters were extracted in 90% hot ethanol (80 °C, 5 min), cooled to room temperature, and absorbance was measured at 665 nm and 750 nm before and after acidification with 1 mol L
−1 HCl using a UV-visible spectrophotometer. Chlorophyll-a concentrations were calculated after subtraction of the phaeopigment contribution. All 49 matched samples were processed for chlorophyll-a. Cyanobacterial concentration (cells mL
−1) was estimated in situ using a phycocyanin-specific fluorescence probe calibrated against direct microscopic counts, with values cross-validated against microscopic enumeration when phytoplankton samples were processed.
Chlorophyll-a and cyanobacterial concentration were included in the environmental variable set because they integrate the dam-regulated changes in light availability, nutrient supply, and hydrodynamics into ecologically interpretable measures of water-column productivity and trophic status. Chlorophyll-a is a widely adopted proxy for phytoplankton standing biomass [
36]. In cascade dam systems, the spatial distribution of phytoplankton biomass often exhibits a longitudinal decline across successive reservoirs due to nutrient retention by upstream dams [
37]. This longitudinal productivity gradient directly determines the food resource base available to zooplankton grazers and, through sedimentation, contributes to organic matter inputs for benthic consumers. Cyanobacterial concentration was measured because harmful algal blooms have been recognized since the 1990s as one of the most persistent water quality concerns in the middle and lower Hanjiang River, and the reduced discharge following the South-to-North Water Diversion has further increased bloom risk [
38]. Shifts in cyanobacterial dominance can restructure zooplankton communities through toxin production and reduced food quality [
39]. Both variables were treated as environmental descriptors of conditions experienced by consumers rather than as response variables of the phytoplankton community itself.
2.4. Spatial Classification and Environmental Gradient Analysis
The along-river distance from Danjiangkou Dam to each sampling station (dist_DJK, km) was calculated as the one-dimensional river channel distance and used as the primary continuous spatial predictor throughout all analyses. A binary river-type variable was encoded as 1 for impounded reaches (H1–H4) and 0 for downstream reaches (H5–H7) to enable categorical comparisons. For analyses requiring a categorical spatial classification at finer resolution, stations were additionally assigned to one of three distance zones: proximal (≤150 km, comprising H1 and H2), middle (150–300 km, comprising H3 and H4), and distal (>300 km, comprising H5, H6, and H7). Species abundance data for each trophic group were organized as sample × species matrices, with rows corresponding to individual station–season combinations and columns corresponding to taxa. Only the 49 temporally matched sample units were used in all multivariate community analyses to ensure consistent biological and environmental pairing across trophic levels.
To characterize the spatial structure of physicochemical conditions along the longitudinal gradient, Spearman rank correlation coefficients (ρ) were calculated between each environmental variable and dist_DJK. Differences in environmental conditions between impounded and downstream reaches were tested using Welch’s two-sample t-tests, which do not assume equality of variance and are appropriate for unbalanced comparisons. The multivariate structure of the physicochemical and biological proxy dataset was summarized by principal component analysis (PCA) performed on the standardized (z-score) variable matrix. Variance explained by the first two principal components was extracted from the constrained ordination eigenvalue decomposition, and species (variable) scores were used as loading vectors in biplot representation.
2.5. Community Diversity Analysis and Spatial Gradient Analysis
Alpha diversity for each trophic group was quantified at the sample level using four complementary indices: species richness (
S), Shannon–Wiener diversity index (
H′ = −Σ
pi ln
pi), Simpson’s diversity index (1 −
D = 1 − Σ
pi2), and Pielou’s evenness index (
J′ =
H′/ln
S). Differences in alpha diversity metrics between impounded and downstream reaches were tested with Wilcoxon rank-sum tests, given that normality cannot be assumed for diversity index distributions. Beta diversity was partitioned into its turnover (species replacement) and nestedness (species loss or gain) components using the Sørensen-based additive decomposition framework implemented in the betapart package (version 1.6.1) [
40]. Mean pairwise values of total Sørensen dissimilarity, turnover, and nestedness were reported for each trophic level. Homogeneity of multivariate dispersions was assessed using the betadisper() function followed by permutation tests in vegan to verify that observed community differences among groups were not artefacts of unequal within-group variance.
Non-metric multidimensional scaling (NMDS) ordinations were computed for each trophic level with Bray–Curtis dissimilarity, two ordination dimensions, and a maximum of 100 random starts. Ordination solutions with stress values below 0.2 were retained as acceptable representations of community structure. Environmental variables were passively fitted onto the ordination space using the envfit() function (999 permutations) to identify which physicochemical gradients explained the greatest proportion of NMDS axis variation.
The effect of the longitudinal spatial gradient on community composition was evaluated using two complementary approaches. First, permutational multivariate analysis of variance (PERMANOVA) was applied to test whether distance from Danjiangkou Dam (as a continuous predictor) and season (as a categorical predictor) each explained a significant proportion of Bray–Curtis dissimilarity. A parallel PERMANOVA was run substituting the three categorical distance zones for continuous distance to quantify zone-level compositional differences while accounting for seasonality. Second, community distance-decay relationships were examined by regressing pairwise community similarity against the pairwise geographic distance using ordinary least-squares linear regression across all pairwise combinations of the 49 matched samples (n = 1176 pairs per trophic level). The coefficient of determination (R2) and slope of the distance-decay regression were used to characterize the rate of community turnover with increasing geographic separation.
To disentangle the relative contributions of geographic isolation and environmental heterogeneity to community turnover, standard and partial Mantel tests were performed. The community dissimilarity matrix (Bray–Curtis) was related to (i) the geographic distance matrix, (ii) the Euclidean distance matrix derived from standardized environmental variables, and (iii) the partial effect of geographic distance after controlling for environmental distances.
Variance partitioning was conducted using the varpart() function in vegan to decompose the total explained variation in Hellinger-transformed community matrices into four non-overlapping and overlapping fractions corresponding to four groups of explanatory variables: environmental (seven physicochemical and two biological proxy variables), spatial (dist_DJK and binary river-type), temporal (dummy-coded season variables), and biotic (B; cross-trophic abundance proxies representing potential trophic interactions). The biotic component was defined separately for each trophic level to represent the most ecologically relevant inter-trophic linkage: zooplankton total abundance (ind L−1; top-down grazing pressure) for phytoplankton; phytoplankton total abundance (cells L−1; bottom-up food resource) for zooplankton; and the combined total abundance of phytoplankton and zooplankton (as a coarse proxy for pelagic trophic input potentially available to the benthos) for benthic macroinvertebrates. Adjusted R2 values were reported for all fractions, and negative adjusted R2 values (indicating negligible unique explanatory power) were set to zero for graphical display.
2.6. Piecewise Structural Equation Modelling
To quantify the direct and indirect causal pathways from cascade dam spatial configuration through environmental mediators to the Shannon diversity of each trophic level, piecewise structural equation modelling (piecewiseSEM) was employed using the piecewiseSEM package [
41]. All variables entering the SEM were standardized to zero mean and unit variance (z-scores) prior to analysis to permit direct comparison of standardized path coefficients across pathways. The response variables were the Shannon diversity indices of phytoplankton, zooplankton, and benthic macroinvertebrates; the focal exogenous predictor was distance from Danjiangkou Dam (Dist); and five environmental variables served as candidate mediators: water transparency (SD), turbidity (Turb), water temperature (WT), electrical conductivity (Cond), and pH.
Multiple candidate model structures were evaluated in an iterative process guided by d-separation (d-sep) tests, which identify statistically significant missing paths that are implied conditional independence claims of the current model. The d-sep tests revealed several additional paths that improved model fit, including relationships between water temperature and turbidity (p = 0.004), water temperature and pH (p = 0.055), a direct path from distance to benthic diversity (p = 0.077), and a cross-trophic path from zooplankton to benthic diversity (p = 0.097). Overall model fit was assessed using the piecewise Fisher’s C statistic, which follows a chi-squared distribution; a non-significant p-value (p > 0.05) indicates that the model-implied conditional independences are consistent with the data (Fisher’s C = 38.815, df = 40, p = 0.524 for the selected model). Standardized path coefficients and coefficients of determination (R2) for each response variable are reported.
2.7. Co-Occurrence Network Analysis and Hub Species Identification
A cross-trophic species co-occurrence network was constructed from the 49 matched samples to reveal potential ecological interactions among phytoplankton and zooplankton species. Prior to correlation analysis, rare species were excluded by retaining only those taxa that occurred in at least 20% of the 49 samples (minimum 10 occurrences). Spearman rank correlation coefficients were calculated for all pairwise species combinations using the full abundance data. Because multiple simultaneous tests inflate the probability of false-positive associations, raw p-values were corrected for multiple comparisons using the Benjamini–Hochberg (BH) false discovery rate (FDR) procedure. Species pairs were connected by an edge in the network if their absolute Spearman correlation coefficient exceeded 0.5 (|ρ| ≥ 0.5) and the BH-adjusted p-value was less than 0.01. This threshold was selected to balance network sparsity with biological relevance while ensuring statistical rigour.
Network topology was characterized by the following metrics calculated using the igraph package: (i) network density (proportion of realized to possible edges); (ii) mean clustering coefficient (transitivity; reflecting the tendency of species to form cliques); (iii) modularity (Q; reflecting community structure within the network), calculated using the Louvain community detection algorithm; and (iv) the positive-to-negative edge ratio. Hub species (those disproportionately well-connected within the network and therefore putatively important for sustaining network cohesion) were identified as species whose degree centrality values fell within the top 10% of the degree distribution. For each hub species, betweenness centrality (fraction of shortest paths passing through the node) and eigenvector centrality (reflecting connection to other highly connected nodes) were additionally computed to characterize their network roles. The environmental associations of hub species were characterized by computing Spearman correlation coefficients between hub species abundance and each of the measured environmental and biological proxy variables.
All statistical analyses were performed in R 4.5.0 [
42]. Statistical significance was assessed at α = 0.05 unless otherwise stated. All permutation-based procedures used 999 permutations.
3. Results
3.1. Environmental Gradients and Spatial Community Responses
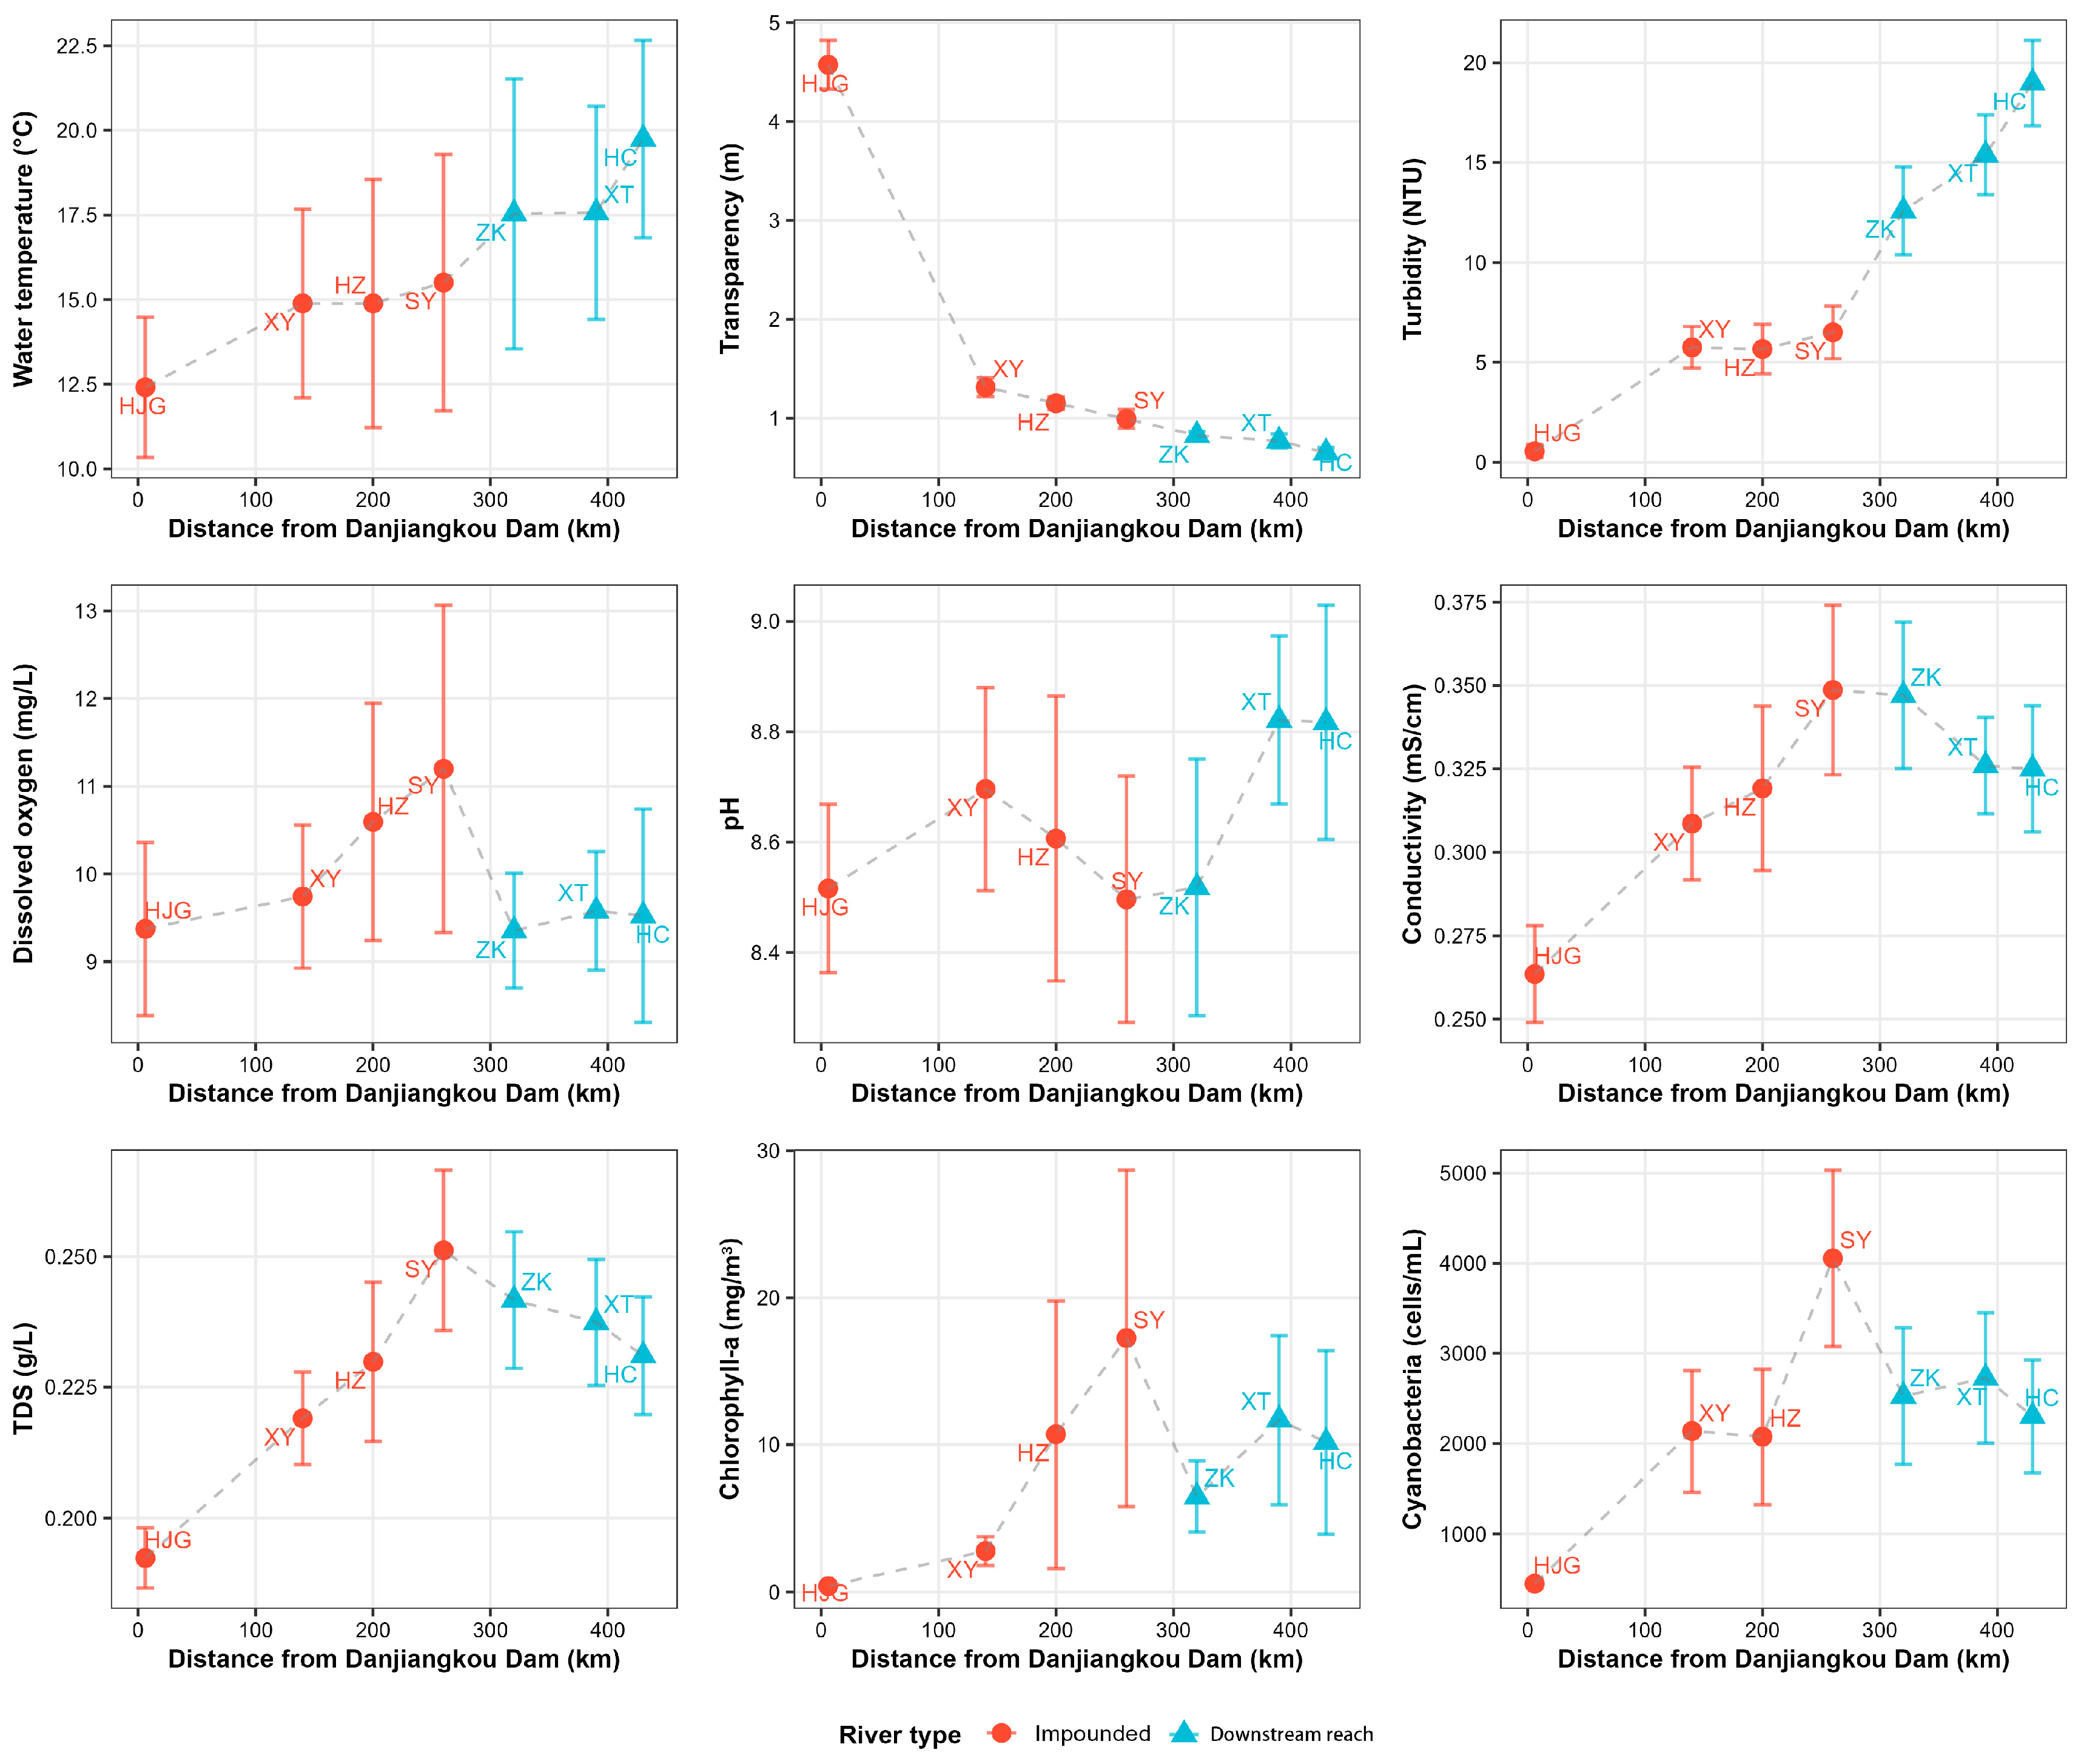
Environmental conditions along the middle-lower Hanjiang River exhibited pronounced longitudinal gradients associated with cascade dam development (
Figure 2). Transparency showed the strongest spatial signal, declining sharply from 3.6–5.4 m at the most proximal station (H1, 6 km from Danjiangkou Dam) to less than 1.0 m at downstream stations (ρ = −0.881,
p < 0.01). Turbidity increased correspondingly with distance from the dam (ρ = 0.830,
p < 0.01). Water temperature exhibited a weak but significant positive trend along the longitudinal gradient (ρ = 0.288,
p < 0.05), consistent with the attenuation of hypolimnetic releases from Danjiangkou Dam. Among hydrochemical variables, conductivity (ρ = 0.363,
p < 0.05), TDS (ρ = 0.452,
p < 0.01), increased with distance from the dam, whereas dissolved oxygen and pH showed no significant spatial trends (
p > 0.05). The two biological proxy variables, chlorophyll-a (ρ = 0.615,
p < 0.01), and cyanobacterial concentration (ρ = 0.439,
p < 0.01), first increased and then decreased along the longitudinal gradient while maintaining an overall rising trend.
Comparisons between impounded reaches (H1–H4) and downstream reaches (H5–H7) confirmed that the most prominent contrasts occurred in optical variables: transparency was approximately three-fold higher in impounded reaches (2.14 ± 1.62 m vs. 0.75 ± 0.17 m;
t = 4.52,
p < 0.01), while turbidity was roughly four-fold lower (4.41 ± 3.51 NTU vs. 15.79 ± 5.90 NTU;
t = −7.85,
p < 0.01). No significant differences were detected for the remaining variables (all
p > 0.05). Principal component analysis of environmental and biological proxy variables captured 55.3% of total variance in the first two axes (
Figure S1). PC1 (28.9%) separated samples along a turbidity–transparency gradient, while PC2 (26.3%) represented a dissolved oxygen–productivity axis.
3.2. Spatial Patterns of Multi-Trophic Communities
Mean species richness per sample was highest for phytoplankton (17.4 ± 6.2), followed by zooplankton (13.0 ± 5.3) and benthos (5.9 ± 3.5). Shannon diversity indices followed the same ranking: phytoplankton (H′ = 1.96 ± 0.78), zooplankton (H′ = 1.56 ± 0.56), and benthos (H′ = 1.12 ± 0.56). No significant differences in alpha diversity were detected between impounded and downstream reaches for any trophic level or diversity metric (all p > 0.05). Beta diversity was high across all trophic levels, with Sørensen dissimilarity of 0.631 (phytoplankton), 0.673 (zooplankton), and 0.692 (benthos). The turnover component dominated in all cases, accounting for 82.8%, 85.1%, and 76.2% of total beta diversity for phytoplankton, zooplankton, and benthos, respectively, indicating that community differences among sites were predominantly attributable to species replacement rather than species loss.
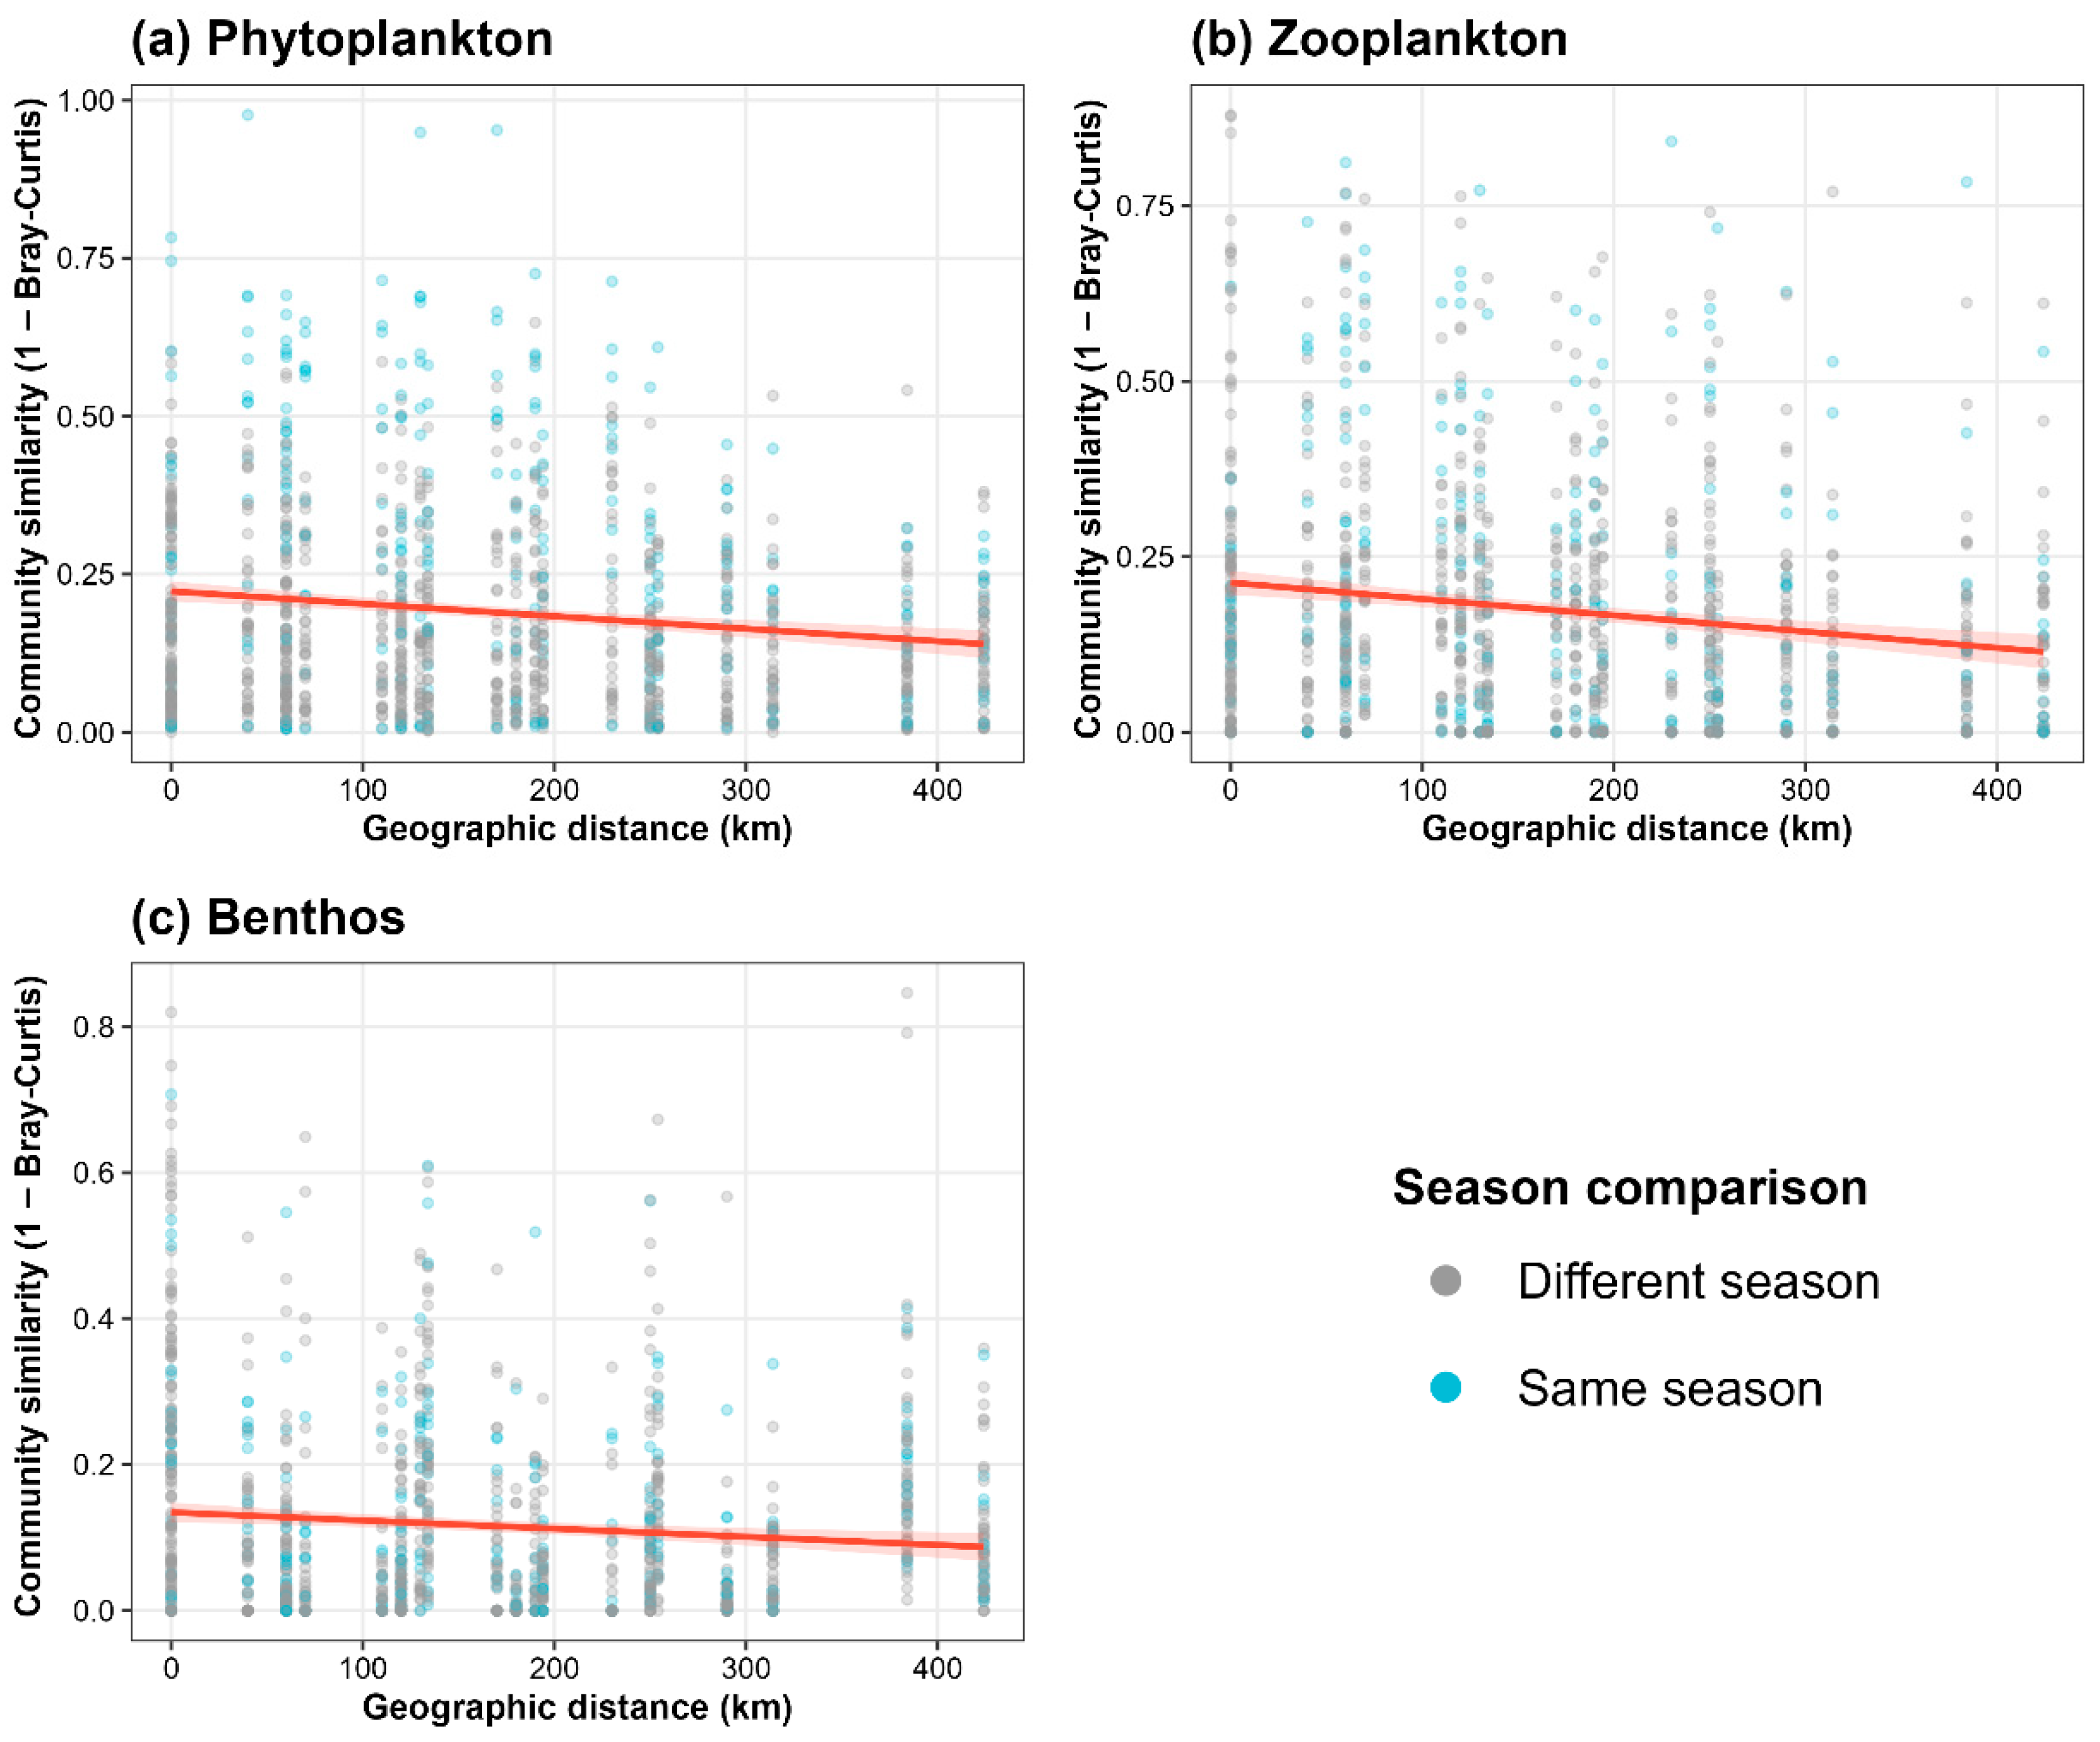
Community similarity decreased significantly with increasing geographic distance for all three trophic levels (
Figure 3). Linear distance-decay relationships were statistically significant for phytoplankton (
R2 = 0.021,
p < 0.01), zooplankton (
R2 = 0.024,
p < 0.01), and benthos (
R2 = 0.009,
p < 0.01), although the low
R2 values and large number of pairwise comparisons (
n = 1176) suggest that these results represent supplementary evidence of spatial structure. Zooplankton exhibited the steepest distance-decay slope among the three trophic levels. Using distance as a continuous predictor, the explained variance was 6.1% for phytoplankton, 4.4% for zooplankton, and 6.4% for benthos (all
p < 0.01). When sampling sites were further grouped into three distance zones, the explained variance increased further, reaching 7.3% for phytoplankton, 6.3% for zooplankton, and 13.1% for benthos (all
p < 0.05). Season was a significant predictor for phytoplankton (
R2 = 24.6%,
p < 0.01) and zooplankton (
R2 = 12.9%,
p < 0.01) but had a weaker effect on benthos (
R2 = 7.7%,
p < 0.05).
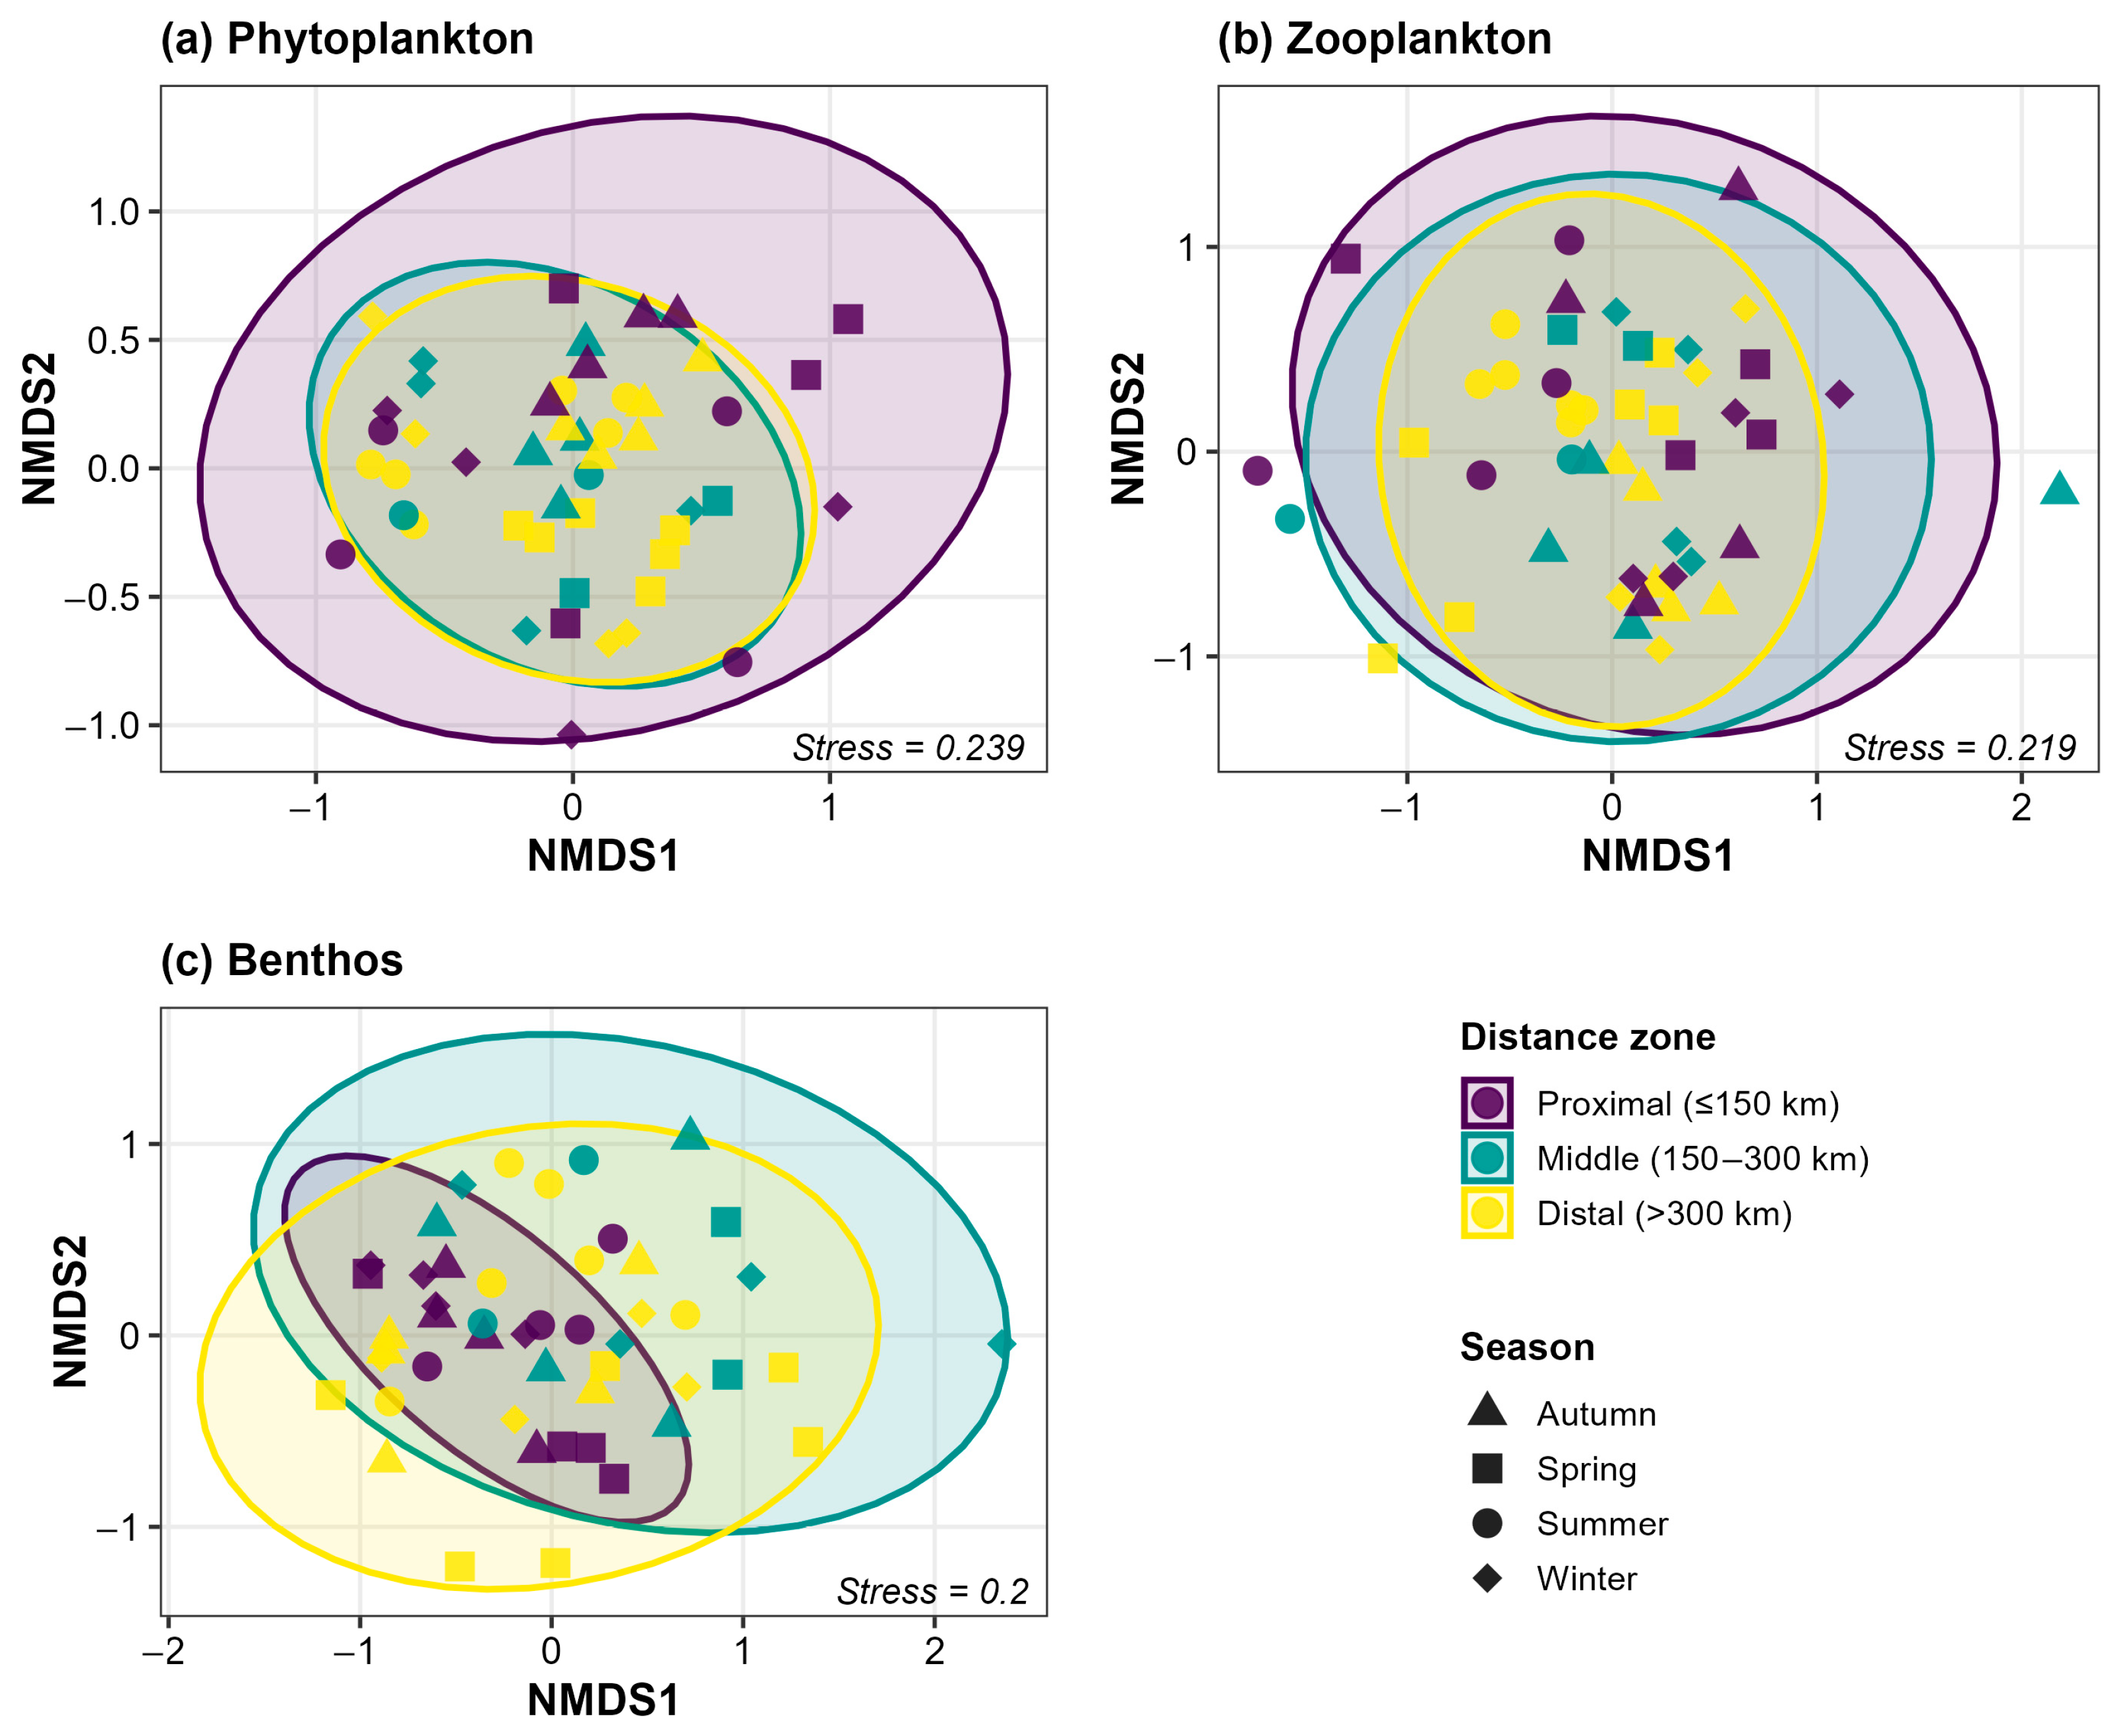
Non-metric multidimensional scaling (NMDS) ordination revealed gradual shifts in community composition along the distance gradient, with 95% confidence ellipses of the three distance zones showing clear separation for all trophic levels (
Figure 4). Mantel tests clarified the relative contributions of geographic distance and environmental heterogeneity to community turnover (
Table S1). For phytoplankton, community dissimilarity was correlated with geographic distance, but the partial Mantel test controlling for environmental distance rendered the geographic effect non-significant (
r = −0.045,
p = 0.802). A similar pattern was observed for zooplankton (geographic
r = 0.149,
p < 0.01; environmental
r = 0.265,
p < 0.01; partial
r = 0.070,
p = 0.099), confirming that the spatial patterns of planktonic communities were largely mediated by environmental gradients rather than by dispersal limitation alone. For benthos, none of the Mantel tests reached significance (geographic
r = 0.043,
p = 0.189; environmental
r = −0.059,
p = 0.822), suggesting that benthic community variation was associated with unmeasured factors such as substrate heterogeneity or hydrological connectivity.
3.3. Differential Environmental Drivers Across Trophic Levels
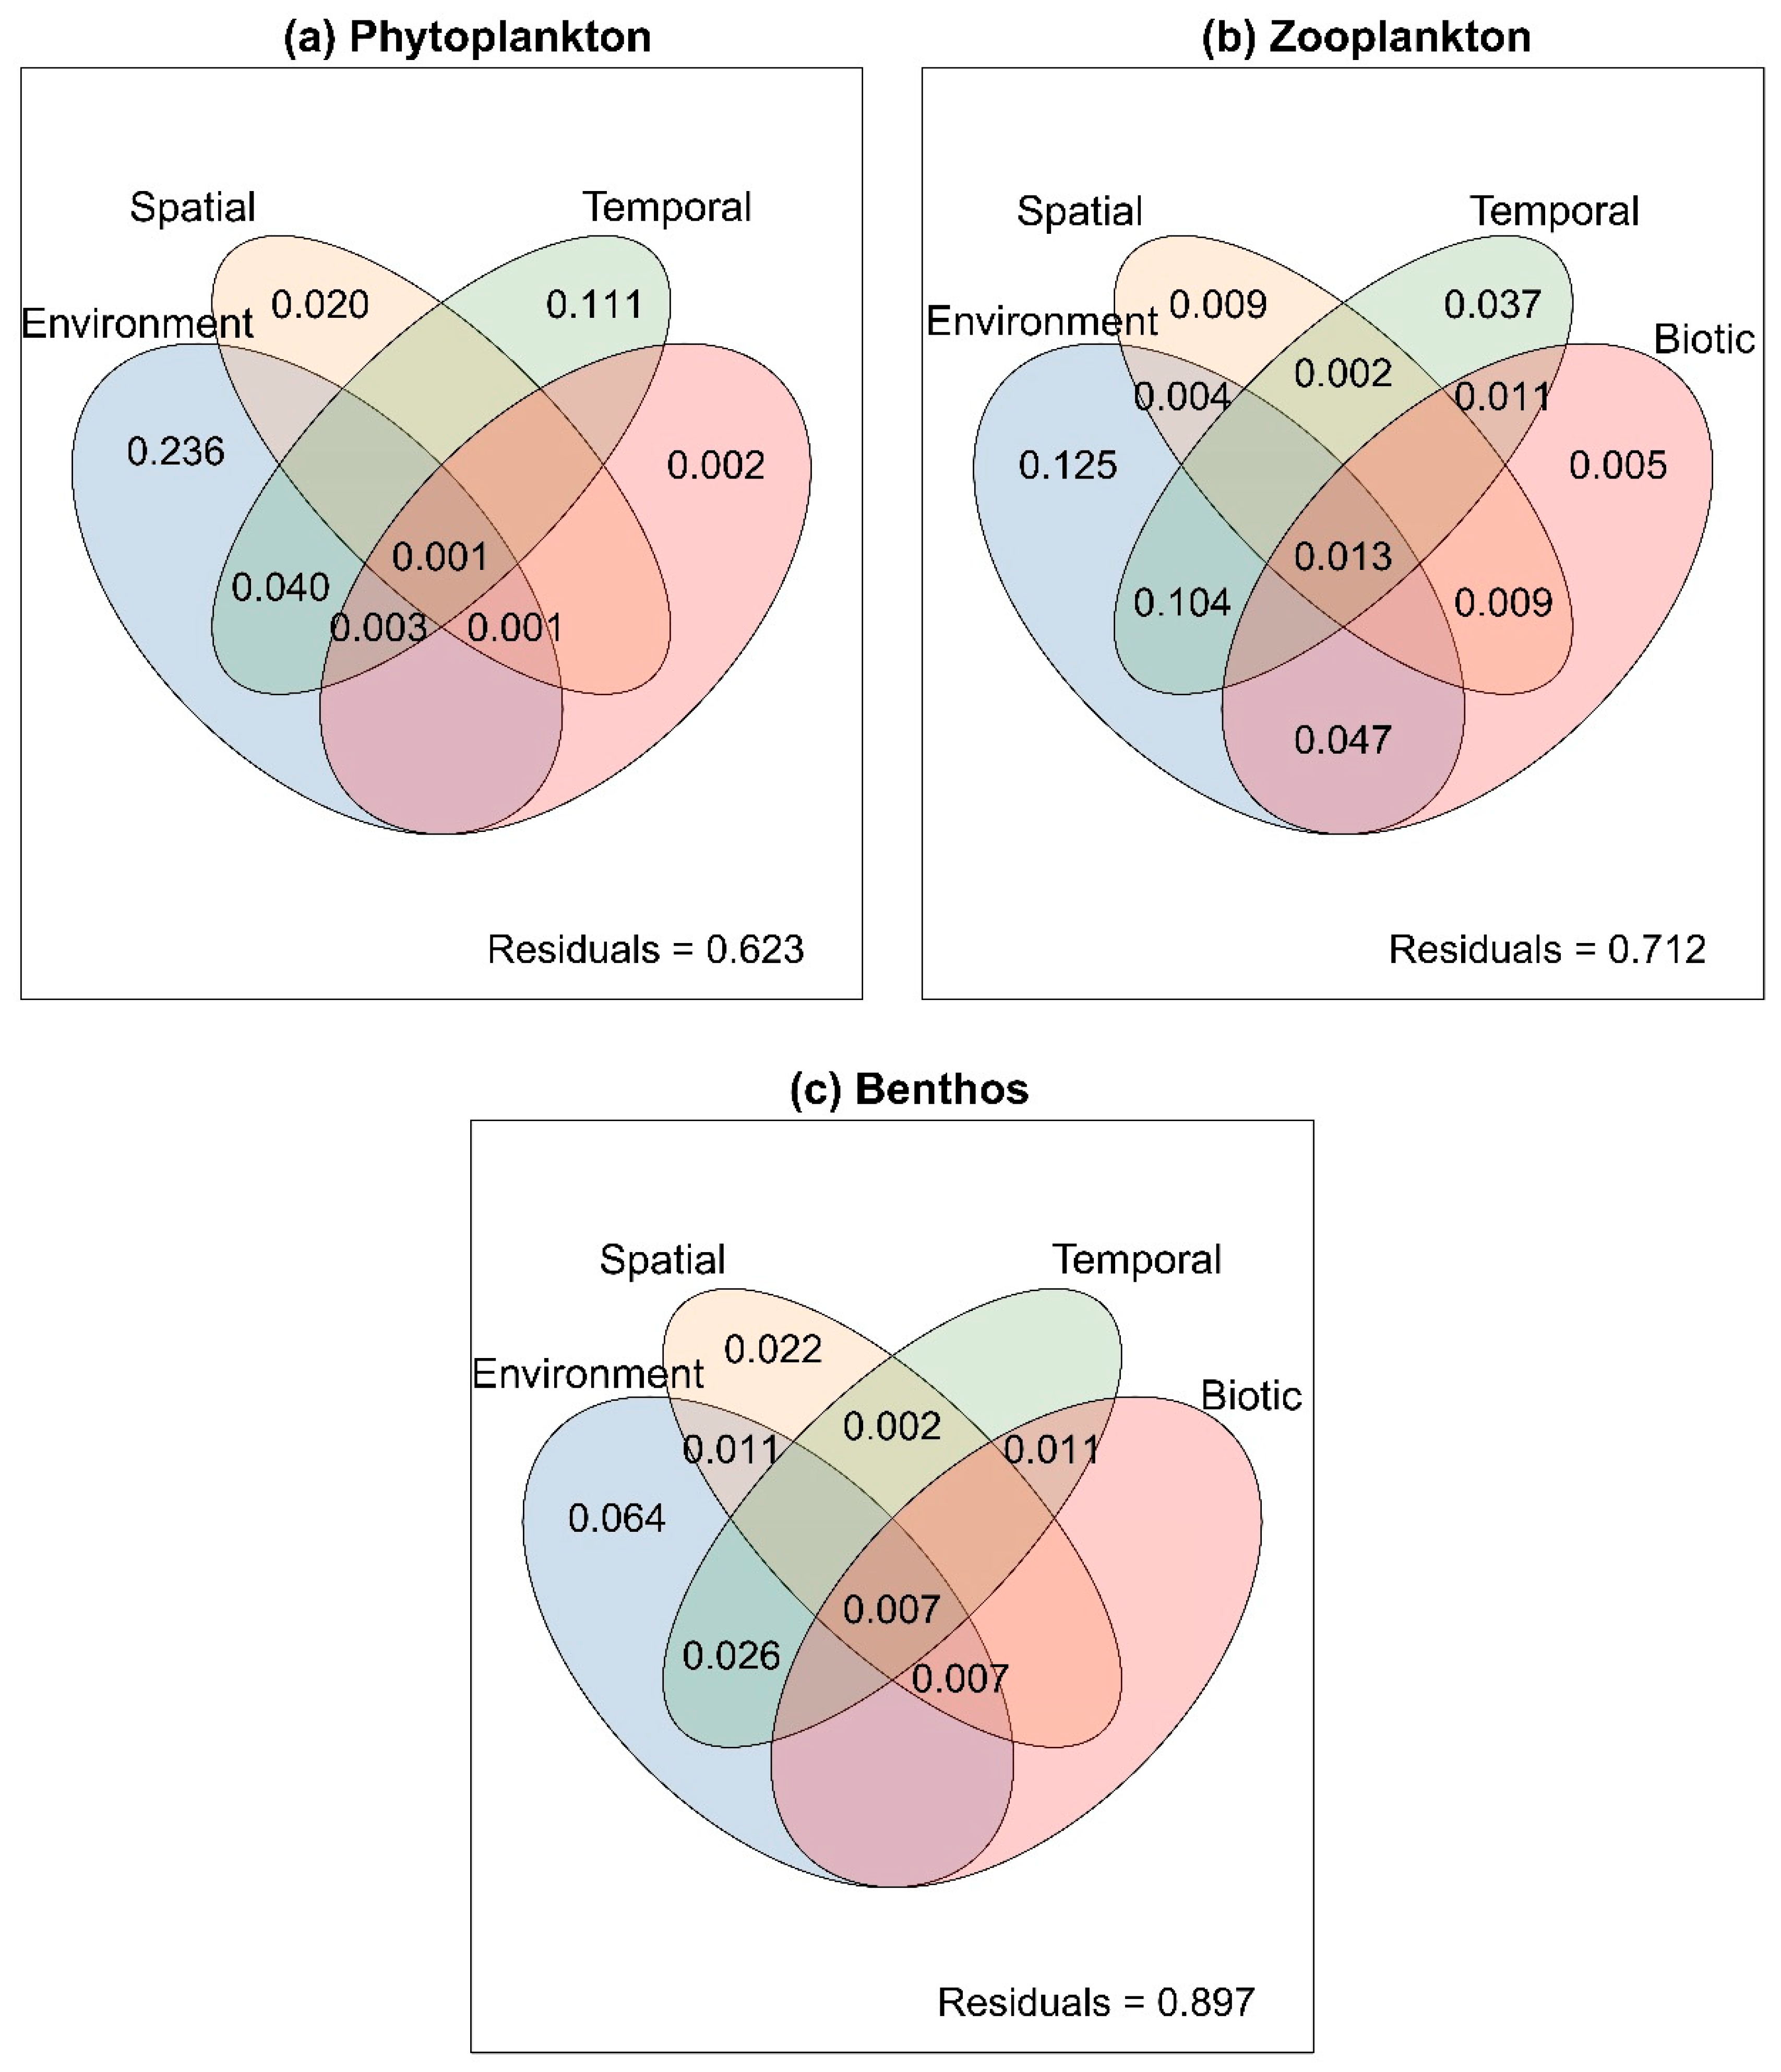
Variance partitioning decomposed community variation into environmental, spatial, temporal, and biotic factors (
Figure 5). The total explained variance was 42.9% for phytoplankton, 37.7% for zooplankton, and 22.7% for benthos. Environmental variables constituted the largest unique component for all three trophic levels, explaining 24.1% for phytoplankton, 12.2% for zooplankton, and 8.9% for benthos. The temporal component was the second most important for phytoplankton (11.6%) and zooplankton (3.1%), while for benthos, the spatial component was the most important (9.7%), indicating that benthic community composition was more strongly structured by spatial configuration than by measured environmental gradients. The biotic component contributed negligibly to all three trophic levels, suggesting that direct trophic interactions explained minimal additional variance and the progressively weaker coupling between measured environmental gradients and community composition from producers to benthic consumers. Residual variance was substantial across all trophic levels.
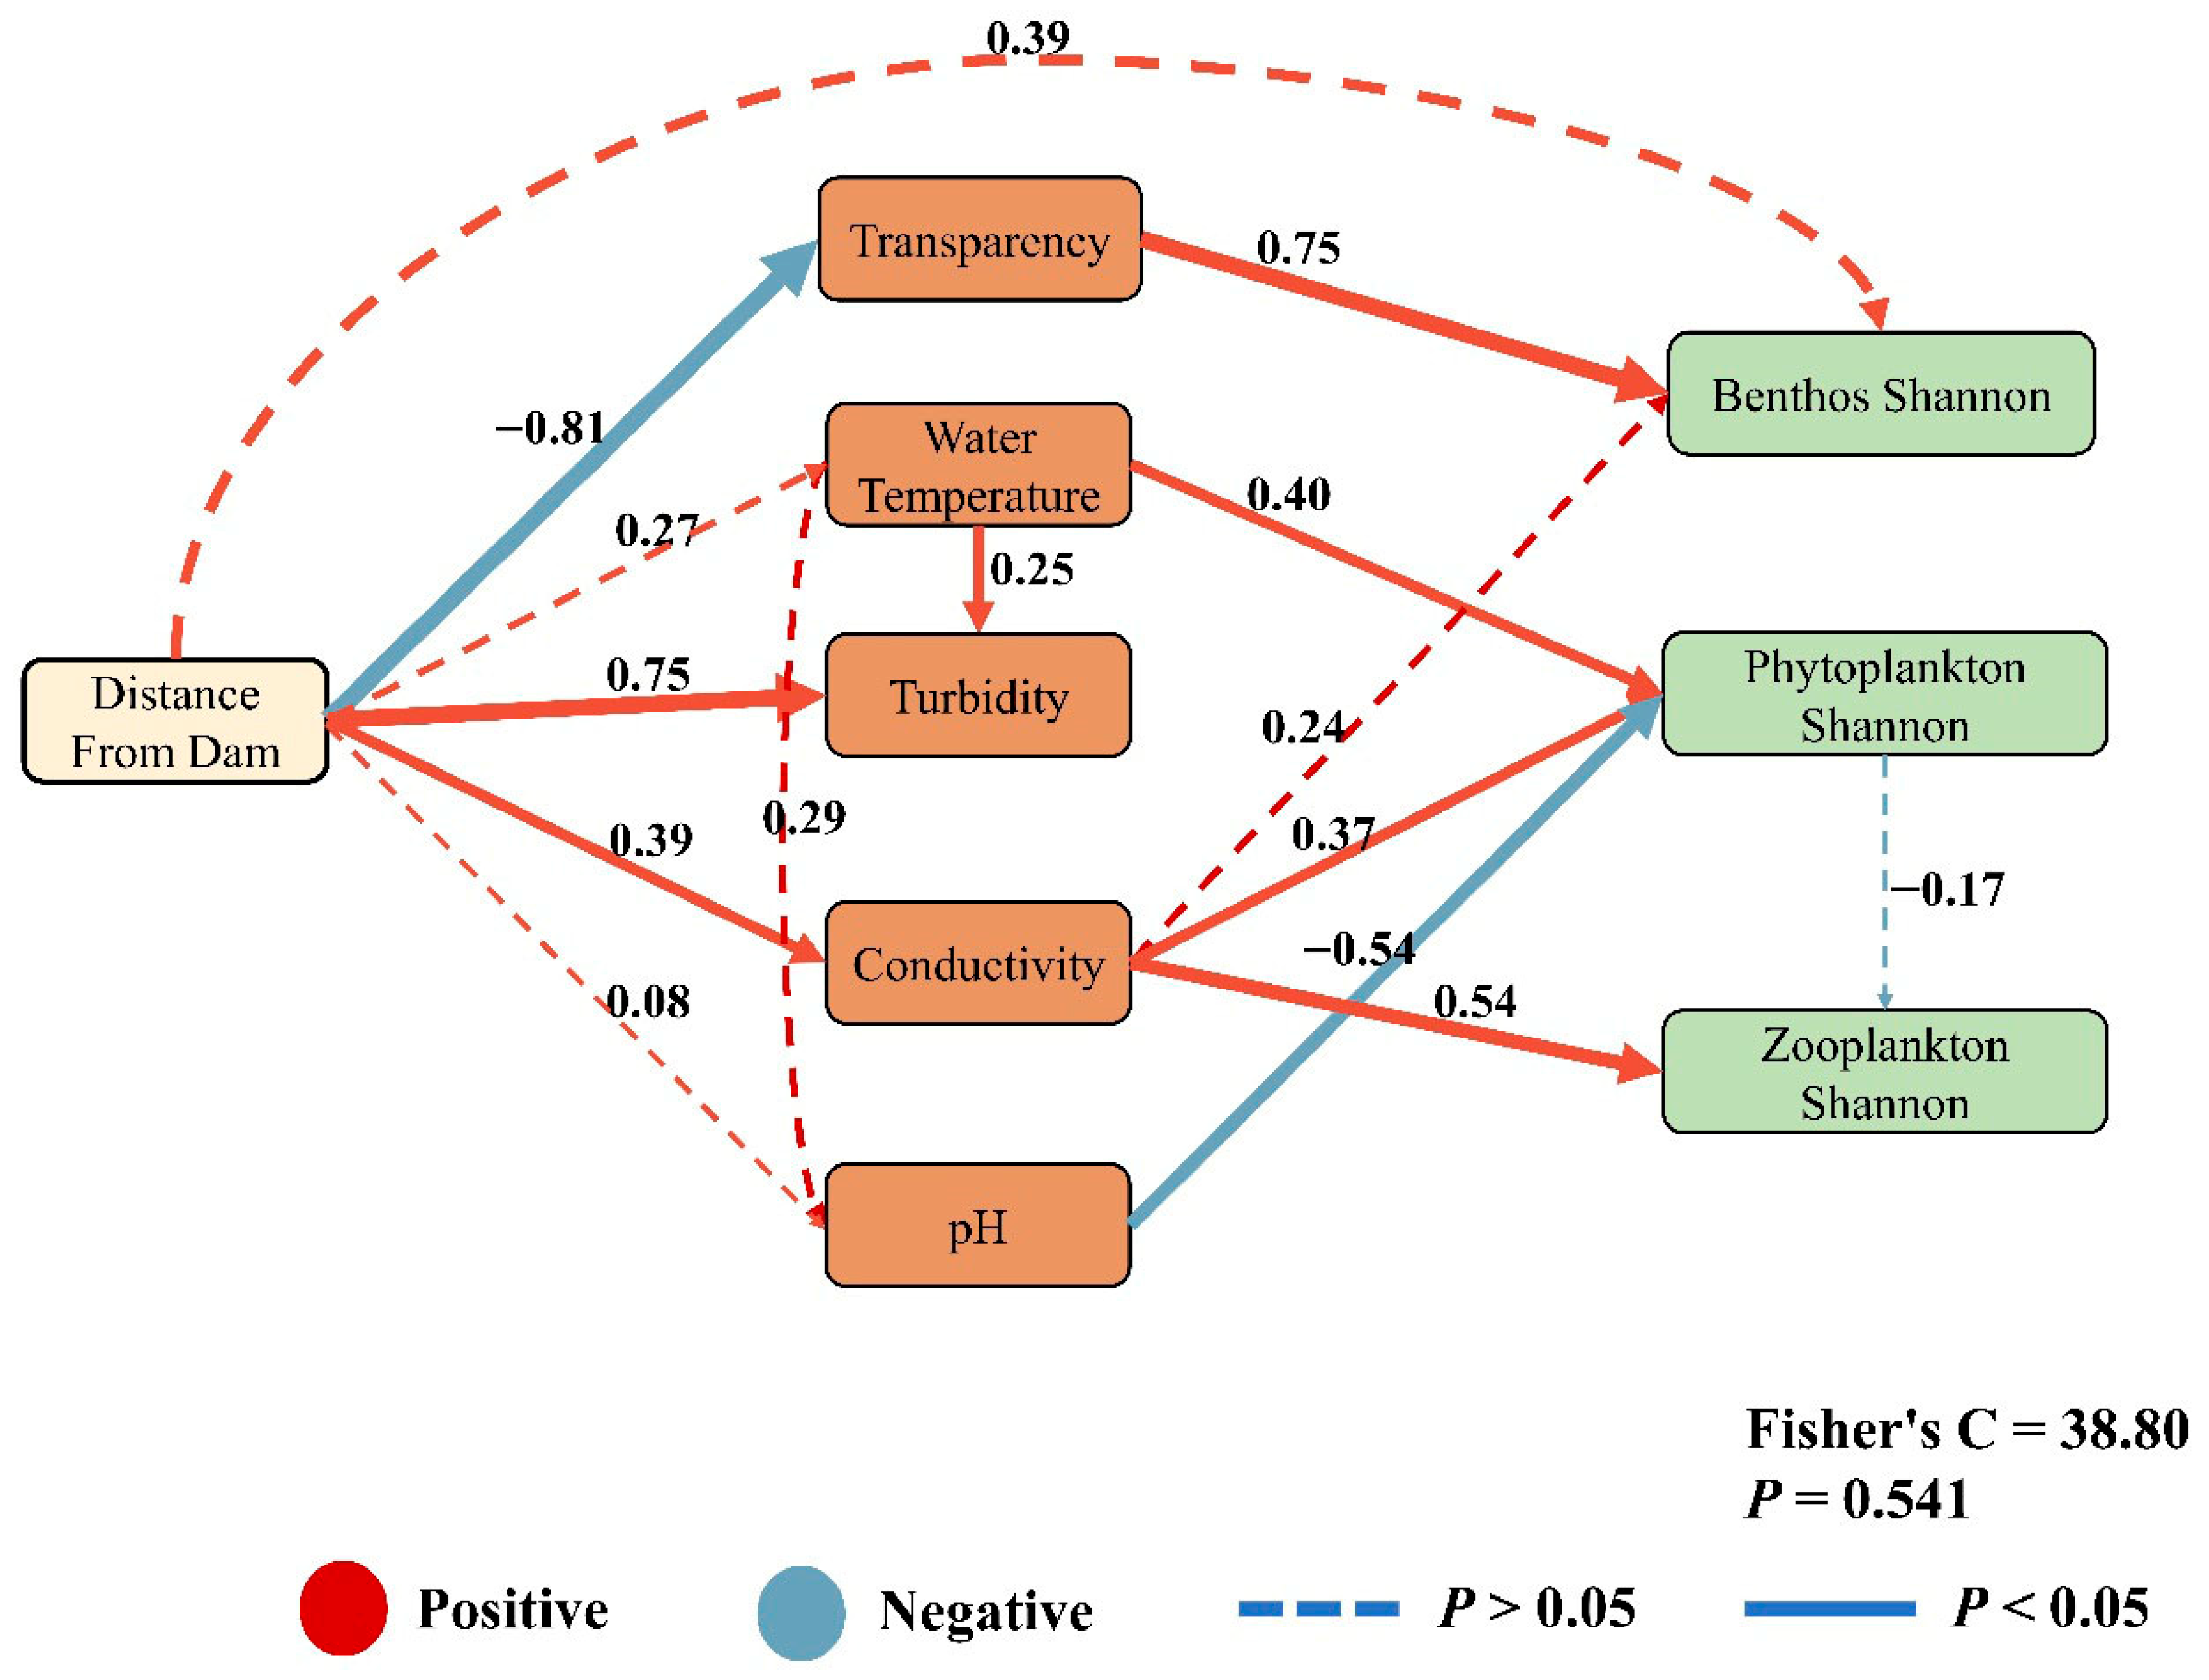
Piecewise structural equation modeling was employed to test the hypothesized causal pathways from cascade dam spatial configuration through environmental mediators to Shannon diversity of three trophic levels (
Figure 6). The selected model (Fisher’s C = 38.815, df = 40,
p = 0.524) incorporated five environmental mediators (transparency, turbidity, water temperature, conductivity, and pH) linking distance from Danjiangkou Dam to biological responses. Distance from the dam was the dominant predictor of transparency (β = −0.81,
p < 0.01;
R2 = 0.66) and turbidity (β = 0.75,
p < 0.01), with water temperature contributing additionally to turbidity (β = 0.25,
p < 0.01; combined
R2 = 0.72). Distance also significantly predicted conductivity (β = 0.39,
p < 0.01;
R2 = 0.15) and was marginally associated with water temperature (β = 0.27,
p = 0.056;
R2 = 0.08).
The three trophic levels exhibited markedly different responses to environmental mediators within the SEM framework. Phytoplankton Shannon diversity was the most responsive to environmental conditions (R2 = 0.52), with pH exerting the strongest negative effect (β = −0.54, p < 0.01), followed by significant positive effects of water temperature (β = 0.40, p < 0.01) and conductivity (β = 0.37, p < 0.01). Zooplankton Shannon diversity (R2 = 0.24) was primarily driven by conductivity (β = 0.54, p < 0.01), while the path from phytoplankton diversity was non-significant (β = −0.17, p = 0.255), indicating that the two planktonic groups responded independently to shared environmental drivers rather than through direct trophic cascading of diversity. Benthic macroinvertebrate Shannon diversity (R2 = 0.23) was most strongly predicted by transparency (β = 0.75, p < 0.01), with a marginally significant direct effect of distance (β = 0.39, p = 0.090).
3.4. Cross-Trophic Co-Occurrence Network and Hub Species
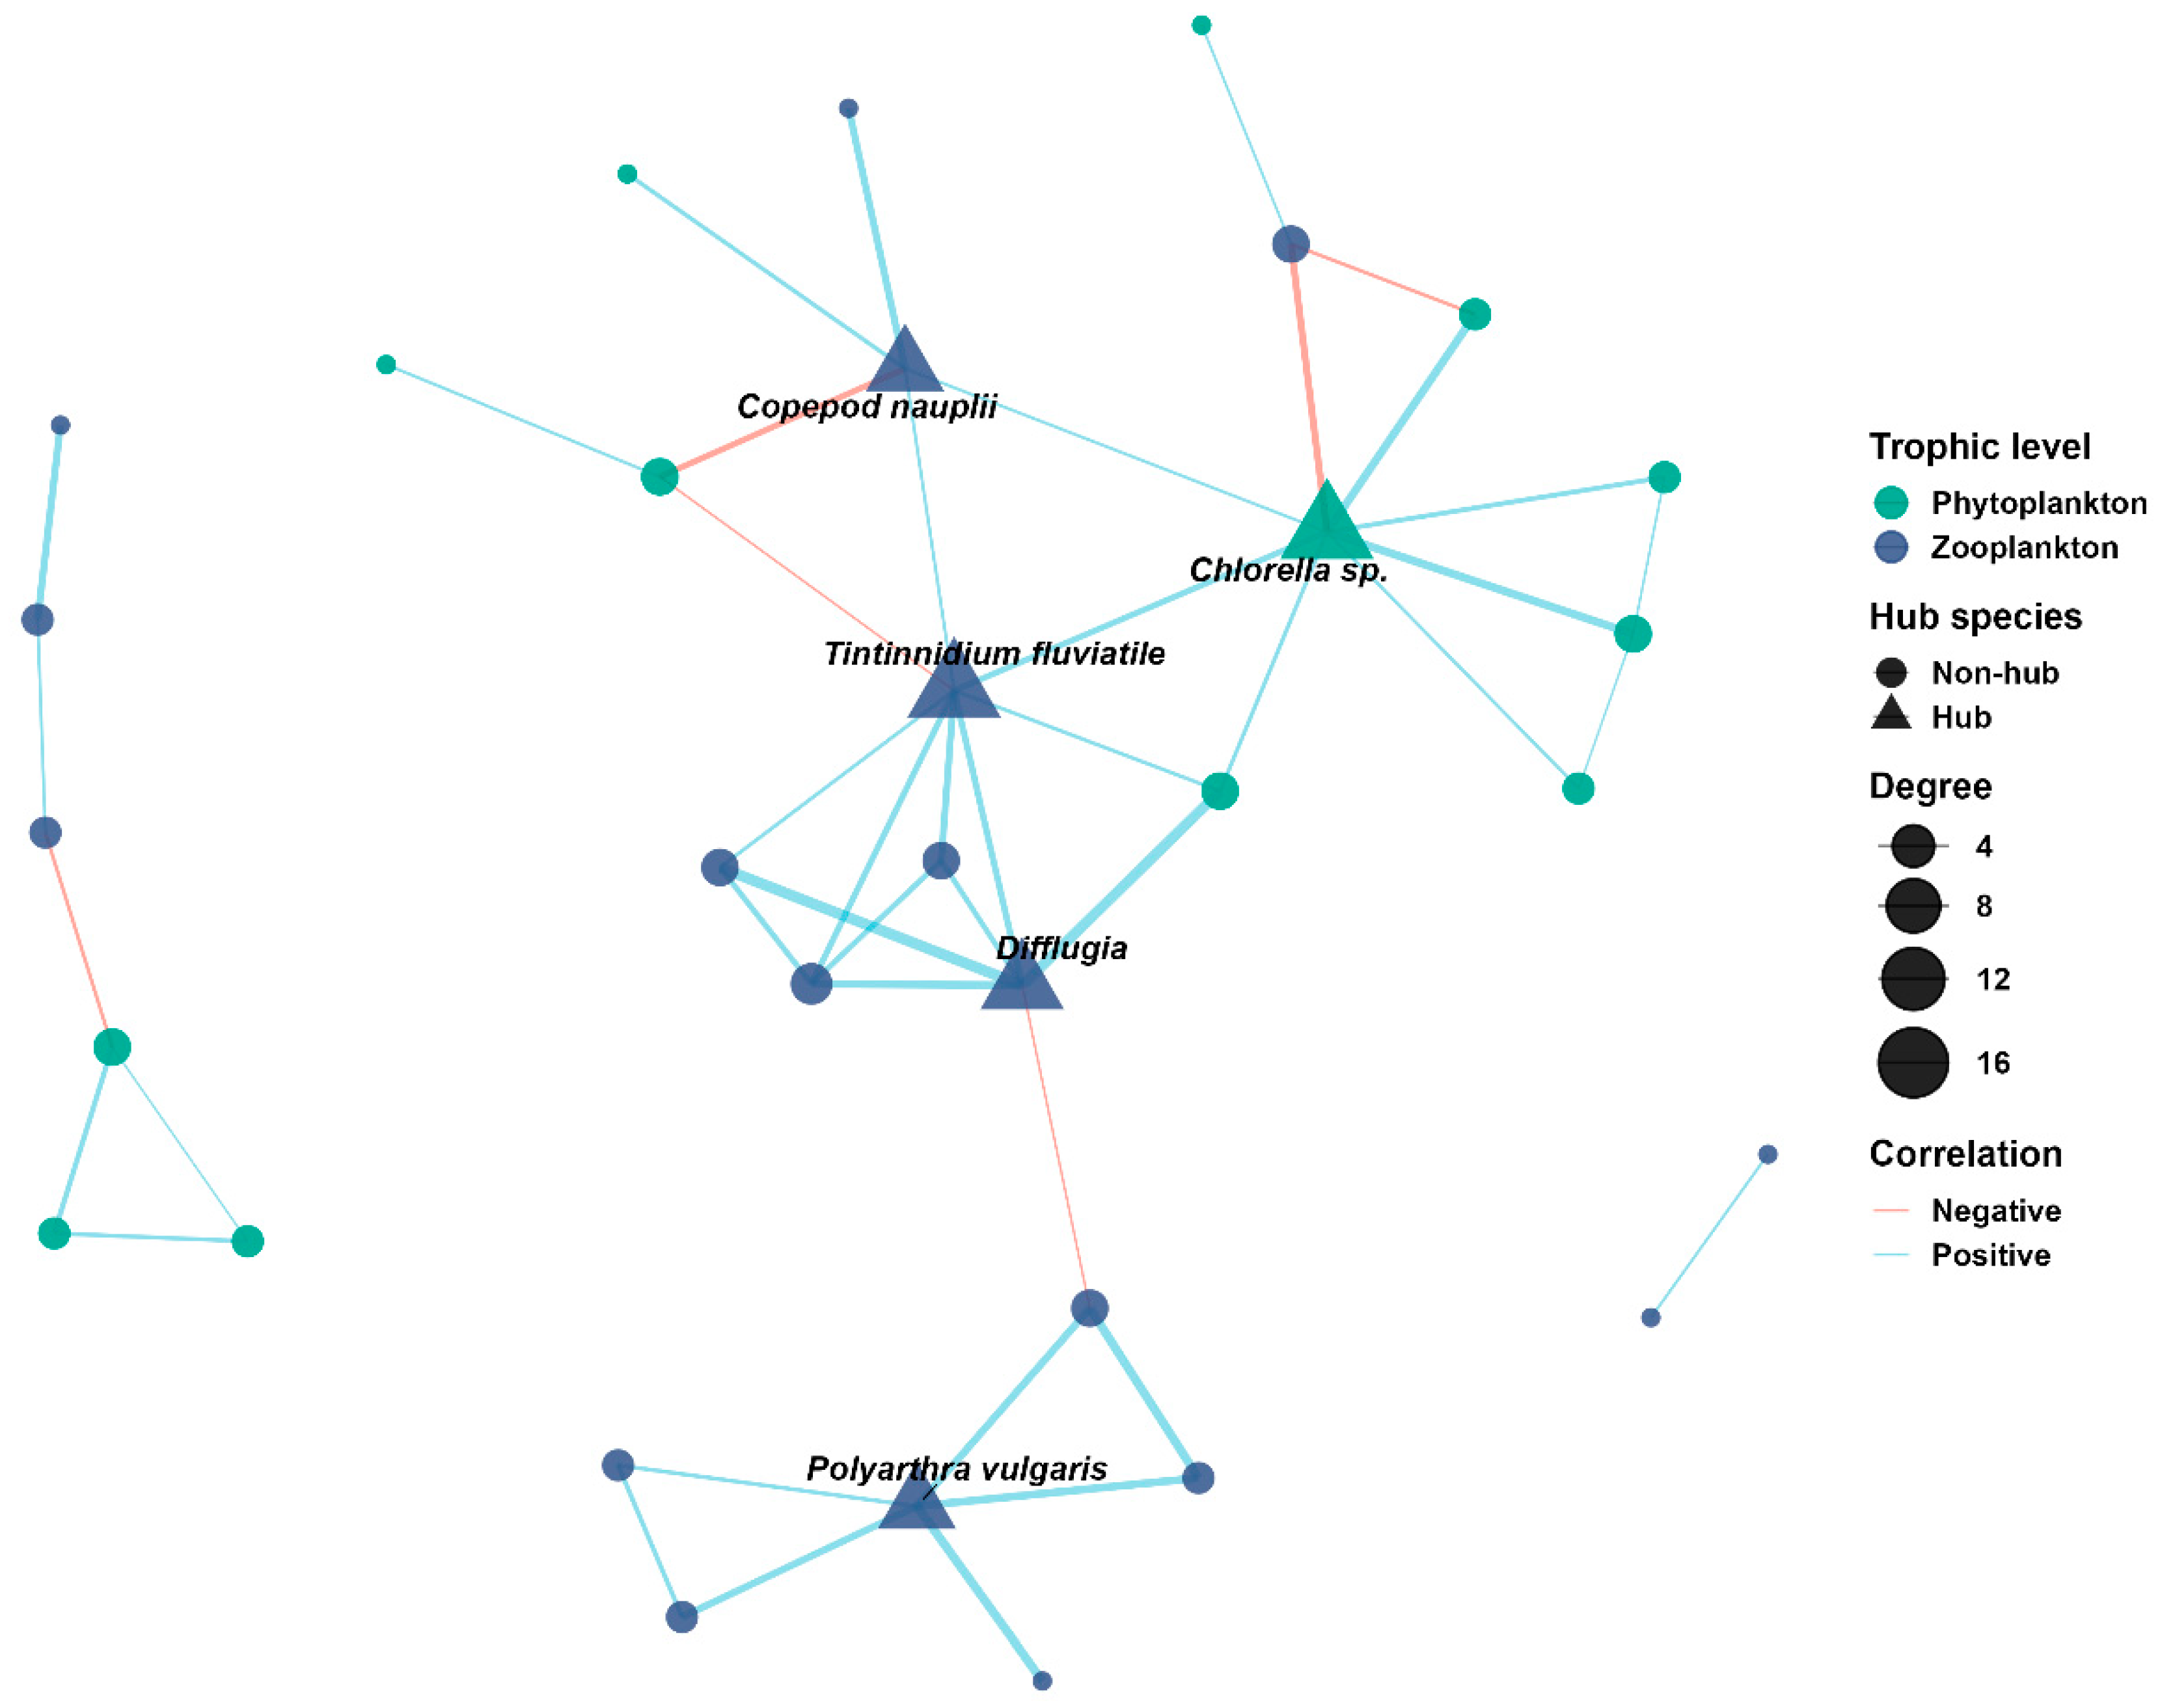
A species co-occurrence network was constructed from Spearman rank correlations among 66 species (occurrence frequency ≥ 20%) across 49 matched samples, applying a threshold of |
r| ≥ 0.5 with Benjamini–Hochberg adjusted at
p < 0.01 (
Figure 7). The resulting network comprised 32 nodes (13 phytoplankton and 19 zooplankton species) connected by 44 edges (38 positive, 6 negative). No benthic macroinvertebrate species met the correlation threshold, resulting in a complete absence of benthos from the network. This pattern is consistent with the SEM and Mantel test results, indicating that benthic assemblages were structured by distinct processes.
The network exhibited low density (0.089), moderate clustering (0.389), high modularity (Q = 0.656), and comprised three independent connected components, indicating that species associations were selective and organized into distinct functional modules. Positive correlations strongly predominated, with a positive-to-negative ratio of 6.33:1. Within-trophic connections accounted for 75% of all edges (22 zooplankton–zooplankton, 11 phytoplankton–phytoplankton), and were overwhelmingly positive (97%). Cross-trophic connections (11 edges) displayed a contrasting pattern, with nearly balanced positive and negative associations (6 positive, 5 negative; ratio = 1.2:1), suggesting that inter-trophic interactions included both facilitative and antagonistic components.
Five hub species were identified based on the top 10% of degree centrality (
Table S3).
Tintinnidium fluviatile (Zooplankton, tintinnid ciliate) and
Chlorella sp. (Phytoplankton, green alga) shared the highest degree (8 connections each).
Tintinnidium fluviatile possessed the highest betweenness centrality (0.308) and eigenvector centrality (1.000) in the network, functioning as the primary bridge connecting multiple modules.
Chlorella sp. was the sole phytoplankton hub species (betweenness = 0.239, eigenvector = 0.639). The remaining three hubs were zooplankton:
Difflugia sp. (degree = 6),
Polyarthra vulgaris (degree = 5), and copepod nauplii (degree = 5). All five hub species functioned as positive connectors (positive correlation ratio ≥ 75%). Correlation analysis between hub species abundance and environmental variables revealed that both top-ranked hubs were associated with downstream mineralized conditions (
Table S2):
Chlorella sp. correlated positively with conductivity (ρ = 0.491,
p < 0.01) and TDS (ρ = 0.476,
p < 0.01), and negatively with transparency (ρ = −0.286,
p < 0.05);
Tintinnidium fluviatile correlated positively with TDS (ρ = 0.583,
p < 0.01) and conductivity (ρ = 0.422,
p < 0.01), and negatively with pH (ρ = −0.363,
p < 0.05).
4. Discussion
4.1. Environmental Filtering over Trophic Cascading
Cascade dam development restructures multi-trophic aquatic communities primarily through environmental filtering rather than through direct trophic cascading in the Hanjiang River. SEM revealed that the path from phytoplankton Shannon diversity to zooplankton Shannon diversity was non-significant (beta = −0.17,
p = 0.255), indicating that diversity did not propagate along the food chain; instead, each trophic level responded to distinct environmental mediators (phytoplankton to pH, water temperature, and conductivity; zooplankton to conductivity; benthos to transparency). This independence of trophic-level responses is consistent with a 40-year estuarine food web analysis in which the net effect of environmental drivers equaled or exceeded bottom-up and top-down effects for all pelagic components [
23]. A similar conclusion was reached in the Yangtze River Estuary, where SEM detected no significant top-down or bottom-up cascade pathways among fish and plankton communities affected by seawall construction [
43]. Our variance partitioning results reinforce this interpretation from a complementary analytical angle: the biotic component, representing direct trophic interactions, contributed negligibly to community variation across all three groups (phytoplankton: 0.2%; zooplankton: 0.4%; benthos: −0.1%), while environmental variables constituted the largest unique fraction for every trophic level (8.9–24.1%). An analogous partitioning of pathways has been documented in the Shaying River Basin, where SEM-identified indirect pollutant-mediated pathways, rather than direct biotic interactions, accounted for the majority of multi-trophic diversity decline under co-occurring damming and urbanization [
22]. These convergent results across methodologically distinct studies and geographically separate river systems suggest that environmental filtering may be a general mechanism by which hydraulic infrastructure restructures multi-trophic communities in regulated rivers.
Partial Mantel tests provided a third, independent line of evidence for the primacy of environmental filtering. Controlling for environmental distance eliminated the geographic effect on phytoplankton community dissimilarity (partial
r = −0.045,
p = 0.802) and reduced it to marginal significance for zooplankton (partial
r = 0.070,
p = 0.099), confirming that the observed spatial turnover in planktonic communities was mediated by environmental heterogeneity rather than by geographic isolation. This result aligns with the hierarchical filtering framework in which landscape-scale spatial configuration generates nested environmental filters that select for species with appropriate functional traits at progressively finer scales [
44]. In the Hanjiang cascade system, distance from the Danjiangkou Dam, which operates as such a landscape-scale filter, explained 66% of the variance in water transparency and 72% of that in turbidity within the structural equation model (SEM), with the environmental gradients it generates independently driving species selection within each trophic level. A comparable analytical framework (variance partitioning, SEM, and co-occurrence networks) applied to multi-trophic communities in the Minjiang River similarly found that environmental drivers and assembly mechanisms differed significantly among trophic groups, with deterministic processes dominating zooplankton and benthos while stochastic processes were more prominent for phytoplankton [
45]. The consistency between these findings and our own, despite differences in river system and dam configuration, supports the generality of the environmental filtering mechanism in dam-regulated rivers, while the trophic-level-specific differences in filtering pathways call for further examination (
Section 4.2).
We acknowledge that variance partitioning estimates are sensitive to variable selection and collinearity structure, and that near-zero adjusted R2 values for the biotic component should be interpreted as the explanatory power of our chosen proxy (total abundance of adjacent trophic levels). Total abundance is an admittedly coarse proxy that does not capture species identity, size structure, or functional trait-mediated interactions, all of which may contribute to trophic coupling at finer resolutions than our seasonal sampling design can detect. Nevertheless, the convergence of negligible biotic fractions in variance partitioning, non-significant cross-trophic diversity pathways in SEM, and non-significant partial Mantel correlations across three independent analytical frameworks supports the interpretation that environmentally mediated pathways were the dominant detectable mechanism at the spatiotemporal scale of this study.
Distance-decay relationships and NMDS ordinations revealed that community composition changed gradually along the longitudinal gradient rather than exhibiting discrete discontinuities at individual dam locations. All three trophic levels showed significant distance-decay of community similarity (all
p < 0.01), and 95% confidence ellipses for the three distance zones exhibited clear but overlapping separation in ordination space. The low
R2 values (0.009–0.024) indicate that geographic distance explains only a small fraction of pairwise community dissimilarity, and these values should be interpreted as evidence that a spatial gradient exists, rather than as an indication of strong deterministic spatial structuring. This pattern of gradual community change more closely resembles the predictions of the River Continuum Concept (RCC) [
12], which posits continuous shifts in community structure along longitudinal environmental gradients, than those of the Serial Discontinuity Concept (SDC) [
46,
47], which predicts discrete resets at each dam location. In the middle-lower Hanjiang, where cascade dams are arranged as run-of-river impoundments with relatively short inter-dam distances (30–119 km), the cumulative effect appears to be a smoothly attenuating environmental gradient dominated by the uppermost structure (Danjiangkou Dam), rather than a series of independent discontinuities. Distance from Danjiangkou Dam alone explained 66% of the variance in transparency and 72% in turbidity within the SEM framework, confirming the pervasive influence of this single mega-dam across the entire 430 km study reach. The applicability of the Serial Discontinuity Concept may depend on cascade configuration: in closely spaced run-of-river cascades dominated by a single large upstream reservoir, the resulting environmental gradient may approximate the continuous longitudinal patterns envisioned by RCC rather than the serial discontinuities predicted by SDC. However, we acknowledge that our study characterizes community compositional patterns rather than formally testing framework-specific predictions (e.g., ecosystem metabolism ratios, functional feeding group proportions), and that comparative studies across cascade systems with contrasting configurations would be needed to evaluate this hypothesis.
4.2. Trophic-Level-Specific Environmental Responses
Although environmental filtering was identified as the dominant structuring mechanism for all three trophic levels, the specific environmental mediators, the strength of environmental coupling, and the nature of community turnover differed systematically among trophic levels. Total explained variance declined from phytoplankton (42.9%) through zooplankton (37.7%) to benthos (22.7%), and R-squared values in the SEM followed the same declining trend (0.52, 0.24, 0.23). This progressive weakening of environmental coupling reflects an ecological gradient: from autotrophic producers suspended in the water column, through pelagic consumers, to organisms inhabiting the benthic boundary layer, the direct dependence on water-column physiochemistry diminishes. A similar declining trend in environmental explanatory power has been reported for multi-trophic assemblages in Northeast China, where geo-climatic and environmental factors explained progressively less variance from benthic algae to fish, and stochastic processes gained relative importance at higher trophic levels [
48]. The pattern is consistent with a cross-continental synthesis of 355 freshwater sites showing that temporal variability in abundance and the strength of environmental synchrony both shifted systematically across trophic levels [
49]. Our results confirm this trophic-level hierarchy of environmental coupling and demonstrate that it holds within a single river system subject to a unified cascade dam gradient.
Among the trophic-level-specific findings, the dominant role of pH in structuring phytoplankton diversity (beta = −0.54,
p < 0.01) warrants attention. The negative relationship between pH and phytoplankton Shannon diversity likely reflects self-regulatory feedback intrinsic to primary production. Experimental evidence has confirmed that CO
2 depletion during bloom development shifts interspecific competition from nutrient- to carbon-based interactions, reducing species coexistence under high-pH conditions [
50]. Field studies in reservoir ecosystems have corroborated this mechanism: CO
2(aq) deficiency associated with elevated pH was shown to favour cyanobacterial dominance (
r = −0.80,
p < 0.01 between cyanobacterial abundance and CO
2(aq)), and dissolved CO
2 availability regulated the transition from Cyanophyta to Bacillariophyta dominance in river-fed reservoirs on the Chinese Loess Plateau [
51,
52]. Under this interpretation, pH is an endogenous indicator of ecosystem productivity state, and its negative association with diversity reflects the competitive dominance of a few carbon-efficient taxa under high-pH, carbon-limited conditions. This finding demonstrates that the environmental mediators through which cascade dams restructure biological communities are not limited to the physical variables most obviously altered by dam infrastructure (temperature, transparency) but extend to hydrochemical variables that covary with the longitudinal environmental gradient.
The predominance of conductivity as the primary driver of zooplankton Shannon diversity (beta = 0.54,
p < 0.01) points to a mineralization gradient as the principal axis of zooplankton community differentiation. Conductivity integrates the concentration of dissolved ions and is a proxy for the overall mineralization status of the water column. Along the Hanjiang longitudinal gradient, conductivity increased significantly with distance from Danjiangkou Dam (rho = 0.363,
p < 0.05), reflecting cumulative inputs from tributaries, agricultural runoff, and urban discharges. The positive association between conductivity and zooplankton diversity is consistent with observations from diverse freshwater systems: positive correlations between conductivity and Rotifera and Cladocera abundance have been documented along the Nile River [
53]; zooplankton species richness, density, and biomass display a unimodal relationship with salinity (measured as conductivity), peaking at 400–1000 μS/cm in subtropical plateau lakes [
54]; and conductivity has been identified as a direct positive predictor of zooplankton species richness in Cerrado streams [
55]. These convergent findings suggest that, within the freshwater range, increasing ionic concentration provides a richer nutritional base supporting a more diverse assemblage of rotifers, protozoans, and microcrustaceans. This interpretation is corroborated by the environmental correlates of the two top-ranked hub species in the co-occurrence network: both Tintinnidium fluviatile and Chlorella sp. were positively associated with TDS (rho = 0.583 and 0.476, respectively) and conductivity (rho = 0.422 and 0.491), and negatively associated with transparency, indicating that the most ecologically connected species in the network are adapted to downstream, mineralized, turbid conditions. The predominant role of conductivity in driving zooplankton diversity supports the environmental co-response interpretation in this study, whereby phytoplankton and zooplankton tracked parallel but independently structured environmental gradients, generating apparent co-variation without direct trophic coupling.
The contrasting beta diversity patterns across trophic levels provide additional insight into the nature of community turnover along the cascade gradient. Species turnover (replacement) dominated over nestedness for all three groups (82.8%, 85.1%, and 76.2% of total Sorensen dissimilarity for phytoplankton, zooplankton, and benthos, respectively), indicating that cascade dam development restructures community composition through directional species replacement driven by shifting environmental conditions, rather than simply eroding diversity along the longitudinal gradient. The slightly lower turnover component in benthos (76.2%) relative to planktonic groups may indicate a modest contribution of nestedness (species loss) in benthic communities, potentially reflecting the decline of sensitive rheophilic taxa (e.g., EPT taxa) in downstream reaches where substrate instability and fine sediment deposition increase. A decline in pollution-sensitive EPT taxa with a concurrent increase in tolerant Gastropoda and Oligochaeta has been documented at dam-affected reaches of the Hanjiang River [
18], and similar dam-induced shifts from sensitive to tolerant benthic assemblages have been reported in other cascade-regulated rivers [
19]. The dominance of turnover in our data points to environmental filtering as the prevailing assembly mechanism, while the residual nestedness component in benthos hints at a superimposed habitat degradation signal specific to the benthic boundary layer.
4.3. Benthic Decoupling from Pelagic Dynamics
The most consistent pattern across all analyses was the systematic decoupling of benthic macroinvertebrate communities from the environmental filtering framework that effectively structured the two planktonic trophic levels. In the co-occurrence network, no benthic species met the correlation threshold for inclusion, resulting in a network composed entirely of phytoplankton and zooplankton nodes. In Mantel tests, benthic community dissimilarity was not significantly correlated with either geographic distance (r = 0.043, p = 0.189) or environmental distance (r = −0.059, p = 0.822), in contrast to the significant environmental correlations observed for phytoplankton (r = 0.460, p < 0.01) and zooplankton (r = 0.265, p < 0.01). In variance partitioning, the spatial component for benthos (9.7%) exceeded the pure environmental component (8.9%), reversing the pattern observed for both planktonic groups where environmental effects consistently dominated.
This benthic decoupling indicated that benthic macroinvertebrate communities in the Hanjiang River are structured by a different set of environmental drivers not captured by the nine water-column variables measured in this study. Benthic organisms inhabit the sediment-water interface, where community composition is predominantly governed by substrate grain size, substrate stability, benthic organic matter availability, interstitial dissolved oxygen gradients, and near-bed hydraulic conditions, all of which are poorly correlated with surface water-column measurements [
56]. Cascade dams exert their most consequential effects on benthic habitats through sediment trapping, which generates sediment-starved “hungry water” flows with excess transport capacity that incises the channel bed and progressively winnows fine and medium gravels from the substrate without upstream replenishment [
57]. The high pure spatial component (9.7%) in variance partitioning for benthos is consistent with, and we hypothesize reflects, a spatially structured substrate gradient that was not directly measured in this study. Based on established understanding of dam-induced sediment starvation and evidence from other cascade systems [
57,
58], distance from the dam systematically alters the balance between sediment supply and transport capacity, producing a longitudinal gradient from substrate coarsening (near-dam armouring) to substrate fining (downstream siltation). This interpretation remains a hypothesis pending direct substrate characterization (grain size distribution, substrate stability, benthic organic matter content), but it generates a testable prediction: incorporating substrate measurements into future variance partitioning analyses should transfer explanatory power from the spatial to the environmental fraction for benthic communities.
This interpretation is consistent with findings from the Sélune River (Normandy, France), where an examination of ecological consequences revealed that benthic macroinvertebrates were the most sensitive to habitat changes induced by dam impoundment [
59]. Moreover, a tripartite classification of dam responses was proposed, distinguishing groups insensitive to dam effects (e.g., phytoplankton), groups sensitive to habitat modification but not dispersal-limited (e.g., benthos), and groups whose dispersal is directly impeded by dam barriers [
59]. Phytoplankton and zooplankton diversity showed no significant differences between impounded and downstream reaches in this study (all
p > 0.05), while benthic communities, although also lacking significant reach-type differences in alpha diversity, were structured by spatial factors best explained by habitat modification rather than dispersal limitation. A stable isotope analysis conducted in a dammed river system demonstrated that habitat heterogeneity within reaches can provide trophic refugia that buffer benthic communities against the nutritional subsidy of reservoir-derived plankton, suggesting that the co-occurrence of diverse habitat types may locally attenuate the trophic impact of impoundments on benthic food webs [
60].
The positive effect of transparency on benthic diversity in the SEM (
β = 0.75,
p < 0.01) reflects the role of transparency as a statistical proxy for unmeasured benthic habitat conditions rather than as a proximate ecological driver, given that transparency is a water-column property with no direct mechanistic link to organisms inhabiting the sediment surface. Two non-mutually exclusive explanations are proposed. First, high transparency permits photosynthetically active radiation to reach the riverbed, supporting the growth of benthic algae (periphyton) that are an essential food resource for scraping and grazing benthic taxa, including mayfly (Ephemeroptera) and caddisfly (Trichoptera) larvae that are among the most species-rich benthic orders. Second, transparency in this system is a proxy for the suite of unmeasured benthic habitat conditions that covary with proximity to Danjiangkou Dam. Near-dam stations (H1–H2), where transparency is highest (3.6–5.4 m), receive discharge that is simultaneously depleted of fine suspended sediment, resulting in coarser, more stable substrates that favor EPT-dominated communities [
61,
62]. As distance from the dam increases, transparency declines sharply (reflecting sediment re-entrainment,
Figure 2), and the associated substrate fining and instability progressively exclude sensitive taxa and favor tolerant, burrowing forms such as Oligochaeta and Chironomidae [
63,
64]. SEM implicitly revealed that transparency, while not the proximate ecological driver, was an effective statistical mediator of the dam-to-benthos pathway. A similar dual-pathway mechanism was identified in the upper Yangtze River, where flow velocity influenced benthic communities both directly (favoring rheophilic taxa) and indirectly (by modifying sediment conditions), demonstrating the importance of distinguishing proximate ecological drivers from their statistical proxies in SEM frameworks [
58].
The complete absence of benthic species from the cross-trophic co-occurrence network adds a temporal dimension to the benthic decoupling phenomenon. Planktonic organisms, with generation times of days to weeks, respond rapidly to environmental fluctuations and exhibit synchronized population dynamics, whereas benthic macroinvertebrates, with generation times of months to years, integrate environmental conditions over longer time horizons and exhibit more temporally buffered population dynamics [
65,
66]. Even when planktonic and benthic communities are exposed to the same environmental gradient, their abundance fluctuations are unlikely to covary at the seasonal sampling resolution employed in this study, rendering cross-compartment correlations non-significant. This interpretation is consistent with independent multi-group assessments showing that phytoplankton community indices fluctuate substantially across seasons while benthic macroinvertebrate indices remain temporally stable [
67], and with evidence that benthic community dynamics in running waters are driven primarily by large-scale hydrological forcing rather than local pelagic cues [
68]. The benthic compartment therefore operates under distinct ecological processes from the pelagic compartment, and managing cascading dam impacts on benthic communities requires attention to substrate dynamics and hydrological regime rather than physiochemistry.
4.4. Network Architecture as Environmental Filtering
The cross-trophic co-occurrence network exhibited three structural features indicating that the observed species associations were shaped predominantly by shared environmental responses rather than by direct biotic interactions. First, positive correlations outnumbered negative correlations across the network (positive-to-negative ratio = 6.33:1), with within-trophic edges being almost exclusively positive (97%). Positive associations among species occupying the same trophic level may reflect shared habitat preferences rather than direct facilitative interactions, although co-occurrence patterns alone cannot reliably distinguish among underlying mechanisms [
69]. In a connected lake to the Yangtze River, positive co-occurrence between rotifers and chlorophytes was similarly attributed to shared environmental preferences, with both taxa favoring conditions of lower transparency and higher pH, rather than to mutualistic biotic interactions [
70]. The predominance of positive associations in our network is therefore consistent with the environmental co-response mechanism established in
Section 4.1,
Section 4.2 and
Section 4.3, whereby the cascade dam gradient generates correlated environmental conditions that simultaneously favor co-adapted species assemblages, producing positive co-occurrence signals within trophic levels.
The contrasting pattern for cross-trophic connections adds mechanistic detail. Unlike the uniformly positive within-trophic associations, cross-trophic edges displayed a near-balanced positive-to-negative ratio (6:5), a pattern consistent with a mixture of shared environmental responses and potential trophic interactions, although co-occurrence sign structure cannot reliably distinguish among these mechanisms. This contrasting sign distribution between within-trophic (97% positive) and cross-trophic edges (55% positive, 45% negative) is consistent with the interpretation that environmental co-responses dominate within-trophic associations, while cross-trophic associations additionally incorporate facilitative (e.g., nutrient recycling by grazers benefiting certain algae) and antagonistic (e.g., selective grazing suppressing palatable phytoplankton taxa) processes. A comparable partitioning was observed in 49 Quebec lakes, where concordant species within each trophic level varied jointly along environmental gradients, but cross-trophic concordance patterns were more heterogeneous and modulated by the interaction of eutrophication and acidification gradients [
71]. Disentangling environmentally driven from biotically driven associations through network sign structure remains challenging and would benefit from direct validation approaches such as grazing exclusion experiments or stable isotope analysis in future dam impact studies.
Second, high modularity (Q = 0.656) and fragmented topology (three independent connected components) indicate that species associations were organized into discrete clusters rather than uniformly distributed. In freshwater co-occurrence networks, modular structure typically reflects the spatial or temporal partitioning of environmental niches, with species within a module sharing similar environmental optima and species in different modules being segregated by distinct environmental regimes [
72]. In the Hanjiang River, the three connected components likely correspond to species assemblages adapted to different segments of the longitudinal environmental gradient, such as a clear-water near-dam assemblage and a turbid, mineralized downstream assemblage. This interpretation is supported by the environmental correlates of the two top-ranked hub species. Both
Tintinnidium fluviatile and
Chlorella sp. were positively associated with downstream mineralized conditions (TDS: rho = 0.583 and 0.476; conductivity: rho = 0.422 and 0.491) and negatively associated with transparency, indicating that these network keystones function as ecological indicators of the downstream environmental regime rather than as trophic regulators.
Third, the ecological roles of hub species clarify the relationship between environmental filtering and network centrality. In a freshwater river continuum, module hub taxa were found to be predominantly generalist species with broad environmental tolerances and high regional abundances, whereas connector taxa linking different modules were more environmentally constrained [
73]. This framework explains the hub identity observed in our network.
Tintinnidium fluviatile, a tintinnid ciliate with the highest betweenness centrality (0.308) and eigenvector centrality (1.000), functions as the primary inter-module bridge, a role that likely derives from its capacity to persist across a wide range of environmental conditions along the longitudinal gradient, thereby connecting species assemblages that are otherwise environmentally segregated. All five hub species were positive connectors (positive correlation ratio ≥ 75%), further supporting their identity as environmentally tolerant generalists that co-occur with diverse taxa across multiple habitat types.
These network properties have implications for ecosystem assessment that extend beyond community composition. A full-factorial mesocosm experiment demonstrated that multi-trophic network complexity outperformed single-taxon biodiversity as a predictor of ecosystem multifunctionality under multiple environmental stressors, with SEM confirming that models incorporating network topology explained more variance in ecosystem functioning than those based on biodiversity alone [
74]. Applied to the Hanjiang River, this finding suggests that the environmentally structured network observed here, with its modular organization, hub species associated with specific environmental regimes, and absence of benthic nodes, may capture dimensions of ecosystem integrity that conventional diversity indices do not detect. Monitoring the stability and connectivity of cross-trophic co-occurrence networks could provide a more sensitive tool for assessing the cumulative effects of cascade dam development on aquatic ecosystem functioning.
4.5. Implications for Cascade-Scale Ecological Management
Our analyses yield some conclusions with direct management relevance for the middle-lower Hanjiang River. The cascade dam system restructures multi-trophic communities through environmental filtering driven by a spatially coherent transparency-turbidity gradient, not through disrupted trophic interactions. Restoring the physicochemical gradient is therefore more effective than manipulating biological communities directly. Moreover, the three trophic levels respond to different environmental mediators and operate under different temporal and spatial constraints, so no single biological group or water-column variable can represent ecosystem-wide condition.
Taken together, these findings point to three actionable management priorities. (1) Sediment connectivity could be restored through coordinated flushing from cascade structures during early wet-season periods, when natural transport capacity is highest and ecological sensitivity is lower. Such operations can moderate the transparency gradient that structures planktonic communities and improve the substrate conditions on which benthic diversity depends. The urgency of this measure is compounded by inter-basin water transfer under the South-to-North Water Diversion Project, which further reduces dry-season flows and exacerbates downstream sediment starvation [
75]. (2) Long-term monitoring should transition from single-trophic, water-column-centered assessments to multi-trophic programs that include benthic macroinvertebrate surveys and substrate characterization (grain size, stability, organic matter content). Without this shift, the current paradigm will continue to systematically underrepresent the trophic level most sensitive to the geomorphic consequences of cascade development. (3) Dam operation protocols should move beyond single-dam mitigation toward cascade-scale coordination, jointly optimizing flow regulation, sediment release, and thermal regime management across the full chain of structures. This whole-system perspective is essential given that Danjiangkou Dam dominates the environmental gradient across the entire study reach, while downstream impoundments modulate rather than reset this signal.
4.6. Limitation
Our seasonal sampling design (8 campaigns over 3 years) was optimized to capture persistent spatial patterns along the longitudinal dam gradient but was insufficient to resolve short-term trophic dynamics that operate on timescales of days to weeks for planktonic communities. Trophic interactions such as grazing-induced phytoplankton suppression and predator-prey oscillations require weekly or sub-weekly sampling and time-series analytical approaches (e.g., cross-lag correlation, Granger causality) that were beyond the scope of this study. The detectability of different food web interactions depends on the timescale of analysis, with bottom-up effects of phytoplankton on zooplankton detectable primarily at annual timescales, while temperature effects were observed only at monthly resolution [
23]. Our seasonal resolution is thus appropriate for detecting environmentally mediated spatial structuring but may underestimate the strength of trophic interactions that are expressed at finer temporal scales. Future studies employing high-frequency automated sampling (e.g., phytoplankton fluorescence sensors, zooplankton imaging systems) would be needed to quantify the magnitude of trophic coupling within the dam gradient at ecologically relevant timescales.
Our 7-station design provided fewer spatial replicates than the number of cascade structures within the study reach, precluding the statistical isolation of individual dam contributions or the estimation of interaction terms among dams. The use of distance from Danjiangkou Dam as a continuous predictor is a simplification that assumes monotonic attenuation of the upstream mega-dam signal, an assumption supported by the SEM results (66% and 72% of transparency and turbidity variance explained by dist_DJK) but that may underestimate the localized effects of downstream run-of-river dams on community composition. Future studies incorporating finer-scale spatial sampling (e.g., paired stations immediately upstream and downstream of each dam) would enable explicit partitioning of individual dam effects within the cascade.





 ,
,