


Abstract
As China accelerates toward carbon neutrality, decrypting the causal drivers of renewable energy expansion is paramount for effective policy design. We develop a hybrid analytical framework bridging data-driven K2 structural learning with expert-informed Bayesian Networks to map the intricate interdependencies between policy instruments, resource endowments, and socio-economic variables. This causal mapping reveals a fundamental paradigm shift from resource-bound growth to institutional-steered expansion, particularly in the solar sector where the Renewable Portfolio Standard (RPS) has superseded natural radiation as the primary determinant for capacity scaling. Forward sensitivity and backward diagnostic analyses demonstrate that achieving high-growth milestones requires a synergistic convergence of technological cost reductions and mandatory consumption quotas; conversely, the absence of RPS leads to a 64% degradation in systemic causal connectivity. These findings underscore the necessity of transitioning from price-side stimuli to structural consumption-side mandates to ensure a resilient energy transition. Ultimately, this framework and the identified causal pathways provide a strategic blueprint for other emerging economies navigating the complex transition from subsidy-dependent to market-resilient renewable energy landscapes under stringent climate constraints.
1. Introduction
The accelerating global climate crisis has catalyzed a paradigm shift toward decarbonized energy systems, with China positioning itself at the vanguard through the Dual Carbon targets, striving for carbon peak by 2030 and carbon neutrality by 2060 [1,2]. As the largest producer and consumer of energy in the world, China’s transition toward renewable energy is not merely a technical adjustment but a systemic structural reconfiguration. However, the trajectory of renewable energy generation is dictated by an intricate nexus of volatile policy instruments, heterogeneous resource endowments, and shifting socio-economic dynamics [3,4]. After the comprehensive upgrade of the electricity marketization process, understanding the non-linear causal relationships among policies, markets and resources in the electricity market is of vital importance for ensuring a stable and predictable energy transition [5]. The randomness of these driving factors poses significant challenges to traditional deterministic predictions and policy evaluations.
The multifaceted nature of renewable energy development has prompted an extensive body of scholarship dedicated to identifying its core determinants. Within the dimension of socioeconomic and demographic forcing, economic growth is traditionally posited as a fundamental catalyst [6,7,8]. Studies have consistently demonstrated a long-term bidirectional causality between GDP per capita and energy consumption, suggesting that financial development provides the necessary capital liquidity for green infrastructure [9,10].
Given the higher marginal costs and intermittency of renewable energy, institutional support is indispensable [11,12,13]. Globally, Feed-in Tariffs (FIT) have been the most prevalent price-based instrument. In Europe, FIT policies significantly bolstered the profitability of photovoltaic companies in Germany, Spain, and France [14]. Similarly, researchers have emphasized FIT design as a critical tool for attracting residential investment in emerging markets like Saudi Arabia [15]. However, the efficacy of FIT depends heavily on interest rates and long-term contract stability.
As industries move toward grid parity, many regions are transitioning from price-based incentives to quantity-based mandates, such as Renewable Portfolio Standards (RPS). Evidence from the United States suggests that RPS serves as a powerful structural tool. For instance, in New Mexico, higher RPS targets have been shown to stimulate targeted regional economic growth and yield superior environmental benefits compared to traditional generation profiles [16]. While FIT provides immediate market stimuli, RPS ensures long-term systemic certainty. This global shift toward structural regulatory frameworks mirrors China’s current policy trajectory. It necessitates a deeper investigation into how these instruments interact with local resource endowments and socioeconomic variables.
Current research differentiates between price-based instruments and quantity-based mandates. While price controls have historically shown immediate efficacy, their marginal utility appears to be diminishing as the industry moves toward grid parity, necessitating a shift toward structural regulatory frameworks [17,18]. Methodologically, traditional linear regression often struggles to capture the nonlinear, stochastic interdependencies and multi-dimensional feedback loops present in modern energy systems; instead, Bayesian networks have emerged as a powerful alternative, designed to handle knowledge uncertainty and complex causal reasoning problems [19]. In the energy field, Bayesian networks have been successfully applied to meteorological forecasting, load prediction, and localized risk assessment [20,21,22,23]; however, existing applications remain predominantly static, often treating policy interventions as isolated exogenous shocks rather than dynamic, interconnected variables within a systemic web [24,25,26].
In addition, the Scenario analysis provides the strategic foresight necessary to navigate the uncertainties of energy governance. Moreover, the scenario modeling has evolved from simple “what-if” projections to complex integrated assessment models [27,28]. Scholars have successfully used scenario-based LEAP and Grey Models to predict energy demand and emission trajectories under varied economic growth rates (optimistic, baseline, and pessimistic) [29,30,31]. Despite these advancements, existing scenario analyses frequently rely on historical extrapolations and forward-looking projections. Some studies lack the diagnostic depth to perform inverse reasoning. They also cannot trace back to calculate the specific policy-market configurations required to achieve predefined growth milestones or leapfrog growth targets [31,32,33].
To bridge the identified research gaps, this study develops a sophisticated hybrid analytical pipeline that integrates data-driven causal discovery with multi-scenario probabilistic reasoning. The methodology is structured into four interactive phases. First, we constructed a comprehensive indicator system comprising 24 variables that capture the multifaceted nature of China’s renewable energy system, spanning socioeconomic drivers, natural resource endowments, and multi-dimensional policy instruments. Utilizing a longitudinal dataset spanning 2014 to 2024, which is the period strategically selected to encompass the complete evolutionary arc from the peak of the Feed-in Tariff (FIT) subsidy era to the institutionalization of the Renewable Portfolio Standard (RPS). We employed the K2 structural learning algorithm optimized by the Bayesian Dirichlet scoring function to derive the initial Directed Acyclic Graph (DAG). This decadal window provides sufficient longitudinal variance to decrypt shifting causal dependencies that transcend simple statistical correlations. To reconcile machine-learned patterns with real-world energy-economic principles, we implemented a knowledge-informed calibration phase. The preliminary DAG was refined through a structured expert consultation process involving 35 specialists from academic institutions and the power industry. While this cohort of thirty-five may appear modest compared to large-scale statistical surveys, it is precisely aligned with established methodological norms for expert-elicitation in specialized domains; recent literature confirms that a focused panel of 30–40 experts is optimal for achieving conceptual convergence in complex system models [34]. For instance, similar frameworks have successfully identified research priorities for the low-carbon hydrogen sector and strategic responses within the evolving electric vehicle landscape [35]. By synthesizing insights from this highly specialized cohort, our approach ensures the model captures nuanced causal mechanisms (such as the policy-lag effect) that purely data-driven algorithms might overlook [34]. The reliability of this consensus was verified using Cronbach’s alpha and the Kaiser-Meyer-Olkin test.
Building upon this validated structural foundation, the study quantifies the hierarchical importance of drivers using Mutual Information (MI) to identify pivotal leverage points dictating system variance. We further utilized node-tree algorithms for backward diagnostic attribution, enabling the calculation of ideal systemic configurations required to achieve specific development milestones. Finally, we conducted counterfactual simulations based on Pearl’s do-operator to evaluate systemic resilience under seven distinct scenario designs. This dual-directional inference framework provides a high-resolution causal roadmap, offering a robust scientific foundation for navigating the complexities of the Dual Carbon transition.
The core innovations and contributions of this research are summarized as follows. First, this study proposes a hybrid causal discovery model by combining K2 heuristic structure learning with expert-guided psychometric validation. We have constructed a network topology with high internal consistency through this integration. This integration effectively bridges the ontological gap between statistical correlations and the actual causal relationship in the energy economy. Second, we introduce a dual-directional probabilistic inference mechanism that significantly extends the analytical depth of energy transition modeling. Our framework utilizes node-tree algorithms to perform backward diagnostic attribution, which allows for the calculation backward of specific posterior probability shifts required to reach leapfrog growth milestones, thereby identifying the unique causal signatures that distinguish the development pathways of hydropower, wind power, and solar power. Third, our analysis provides new information-theoretic evidence for the Resource-Policy decoupling phenomenon within China’s renewable energy system. By quantifying the divergence between natural abundance and institutional engineering, we demonstrate that the explanatory power of the RPS has superseded resource endowment as the primary determinant for solar expansion. Finally, we quantify the non-linear synergies and systemic resilience of the renewable energy system through counterfactual stress testing. Our results demonstrate that a synergistic pathway (Tech + Policy + Market) triggers a non-linear leap in growth certainty (rising to 89%), while the removal of the RPS mechanism leads to a catastrophic 64% collapse in systemic causal connectivity.
The remainder of this paper is structured as follows. Section 2 details the methodology, encompassing the construction of the indicator system, the hybrid structural learning protocol combining the K2 algorithm with expert-informed calibration, and the mathematical foundations of probabilistic inference. Section 3 presents the empirical results and discussions, including the sensitivity analysis of key driving factors, the backward diagnostic attribution of renewable energy increments, and the multi-pathway counterfactual simulations under carbon neutrality constraints. Finally, Section 4 concludes the study, summarizes the core findings regarding the decoupling of policy and resource drivers, and provides strategic policy recommendations for China’s energy transition.
2. Methodology
2.1. Research Framework and System Boundary
This study develops an integrated analytical framework to decrypt the driving mechanisms of China’s renewable energy generation. Our approach bridges causal discovery with multi-scenario probabilistic reasoning to support Dual Carbon targets. The energy transition involves non-linear interdependencies among policy, resources, and socioeconomic factors. These complexities require a departure from traditional linear regression models. Consequently, we employ the Bayesian Network-based architectural design, which excels in capturing latent causal structures and managing epistemic uncertainties within a complex system. This framework follows a logical progression that begins with identifying the causal topology from high-dimensional empirical data, transitions to quantifying conditional dependencies between heterogeneous drivers, and concludes by projecting the carbon reduction potential under various counterfactual policy interventions.
Our analysis moves beyond a monolithic treatment of renewable energy, including hydropower (HG), wind (WG), and solar (SG) power. We examine hydropower, wind, and solar power as distinct sectors with unique techno-economic trajectories. Socioeconomic factors, such as per capita GDP and urbanization, reflect both capital intensity and energy demand. These foundations link closely to technological maturity. Similarly, Feed-in Tariffs (FIT) modulate the market’s transition from subsidy-dependent growth to competitive grid parity.
The spatial and temporal boundaries of this research are strategically defined to encompass the critical transition period of China’s energy landscape. The analysis utilizes a provincial-level panel dataset covering 30 Chinese provinces (excluding Hong Kong, Macao, Taiwan, and Tibet) from 2014 to 2024. This decade represents a pivotal shift from subsidy-driven scaling to market-oriented integration in China’s renewable sector. Within this system boundary, the generation volumes of hydropower, wind, and solar energy are treated as endogenous target variables, while nine distinct dimensions are defined as exogenous or mediating drivers. By delineating these boundaries, the model ensures that regional heterogeneity in resource availability and economic development stages is rigorously incorporated into the causal inference process, thereby providing a robust foundation for identifying optimal decarbonization pathways.
2.2. Data Sources and Pre-Processing
The empirical foundation of this study is a multidimensional panel dataset encompassing 30 Chinese provinces over the period 2014–2024. To capture the multidimensional drivers of China’s renewable energy landscape, we constructed a hierarchical indicator system comprising 24 variables categorized into four dimensions: Socio-economic Drivers, Resource Endowments, Policy Intensities, and Power Generation Outcomes (refer to Appendix B for detailed definitions). Notably, we quantified the RPS intensity using the non-hydro renewable energy consumption weight targets issued by the National Development and Reform Commission. The FIT indicators were operationalized as the benchmark on-grid prices for wind, solar, and hydro power, respectively, adjusted for regional price variations. Socio-economic drivers, such as GDP per capita and the urbanization rate, were selected to proxy for energy demand structural shifts and infrastructural readiness. In addition, the panel data were synthesized from several authoritative sources, primarily the China Energy Statistical Yearbook, the National Bureau of Statistics, and provincial-level statistical bulletins.
To ensure cross-source consistency, we implemented a rigorous harmonization protocol. First, all volumetric data were converted to standard coal equivalents (tce) or standardized gigawatt-hours (GWh) to mitigate discrepancies in reporting units across early years. Second, for the few missing socio-economic data points in the 2023–2024 timeframe, we applied linear interpolation based on the preceding five-year trend, supplemented by provincial government work reports to ensure the proxies reflected actual development trajectories. Moreover, the provincial-level indicators were cross-verified against national aggregates. Where discrepancies exceeded 5%, we prioritized National Bureau of Statistics data to maintain a unified statistical baseline, thereby ensuring that the Bayesian network’s structural learning was not biased by heterogeneous data variances. Finally, to ensure the reliability of the causal inference, the raw indicators (including techno-economic metrics, resource endowments, and policy instruments) have undergone a rigorous two-stage pre-processing procedure, including the multi-source harmonization and the non-linear discretization.
To eliminate the dimensional discrepancies and magnitude effects inherent in heterogeneous indicators, we employed the Max-Min normalization method. This procedure scales all continuous variables into a dimensionless range of [0, 1], thereby preserving the underlying distribution of the data while enhancing the convergence stability of the structural learning algorithms. The normalization is formulated as Equation (1).
where represents the normalized value of indicator i in year t, while and denote the temporal extremes within the study boundary.
Subsequently, given that Bayesian Networks operate on discrete probability distributions to capture non-linear causalities, we implemented a discretization strategy based on the K-means clustering algorithm. Unlike traditional equal-interval binning, K-means discretization minimizes the intra-cluster variance, ensuring that the discretized states (e.g., Low, Medium, High) reflect the intrinsic structural breakpoints of China’s energy development stages. For each continuous variable , the discretization process seeks to partition n observations into k clusters by minimizing the following objective function, as shown in Equation (2).
where is the centroid of the cluster . This data-driven partitioning approach mitigates the subjectivity of manual threshold setting and enhances the model’s sensitivity to regional heterogeneity, such as the distinct transition from subsidy-dependent to grid-parity-ready phases in wind and solar power sectors.
2.3. Causal Discovery via Bayesian Networks
To elucidate the autonomous causal mechanisms underlying renewable energy trajectories, we employ the Bayesian Network framework, which defines a joint probability distribution over a set of random variables through the DAG. The construction of the Bayesian Network involves a two-stage computational optimization: structural learning for causal topology identification and parameter learning for quantifying conditional dependencies.
Given that Bayesian Networks typically require discrete state spaces to compute Conditional Probability Tables (CPTs) efficiently, the continuous panel data were transformed into categorical states. This discretization process was executed using the Statistics and Machine Learning Toolbox within the MATLAB (R2021a) environment. We employed the K-means clustering algorithm for this discretization, a choice predicated on its ability to minimize intra-cluster variance while maximizing inter-cluster heterogeneity. Unlike equal-interval or quantile binning, K-means identifies intrinsic structural breakpoints within the energy-economic variables, such as the distinct transition from a subsidy-driven phase to a grid-parity phase in solar and wind pricing.
To determine the optimal number of clusters (k), we integrated statistical metrics with domain expertise. For most variables, we converged on three state levels (Low, Medium, and High). This configuration was validated using the Elbow Method and the Silhouette Coefficient, which consistently indicated that k = 3 provided the most stable cluster partitioning across the majority of the 24 indicators. Statistically, this three-tier granularity maintains sufficient degrees of freedom for CPT estimation while avoiding the curse of dimensionality that arises with higher-order states.
Furthermore, to ensure the robustness of the causal topology to discretization assumptions, we conducted sensitivity tests by comparing the K-means results with alternative schemes, including equal-frequency binning and 4-state configurations. The resulting DAGs exhibited high structural stability, with a structural Hamming distance variation of less than 5%. This reinforces our confidence that the identified causal relationships, such as the primacy of RPS over resource endowment for solar generation, are robust features of the system rather than artifacts of the discretization process.
Moreover, we utilize the K2 algorithm to derive the optimal causal structure from the pre-processed provincial datasets. The K2 algorithm systematically searches for the parent set for each node by maximizing the Bayesian score, which represents the posterior probability of the structure given the observed data D. The objective function, based on the Cooper-Herskovits criterion, is expressed as Equation (3).
where n is the number of variables, denotes the number of states for variable , represents the number of possible configurations of the parent set , and is the frequency of the k-th state of variable occurring under the j-th configuration of its parents. By imposing a predetermined node ordering (from macro-socioeconomic drivers to specific policy instruments and finally to energy outputs), the algorithm effectively mitigates the search space complexity and prevents the formation of cyclic dependencies, ensuring a robust representation of the energy system’s causal hierarchy.
The K2 algorithm is inherently sensitive to the initial node ordering. We utilized the consensus from 35 experts to establish a causal hierarchy, , ensuring that subsequent nodes cannot be parents of antecedent nodes (e.g., power generation cannot causally precede policy enactment). This restricts the search space to and prevents directed cycles that violate temporal logic. We adjusted the structural prior by introducing a constraint matrix M, where An edge eig was assigned a value of 1 if the causal link was unanimously identified by experts (e.g., Carbon Target to RPS), and 0 if the link was physically or legally impossible. The K2 algorithm then maximizes the score P(G|D) subject to G ∈ M. This ensures that the learned DAG is not merely a statistical artifact but is “anchored” in established energy-economic principles.
To address the exponential search space and prevent logically incongruent cyclic dependencies, we established a predetermined topological ordering based on a hierarchical causal framework. This ordering is not arbitrary but follows the temporal and physical precedence of energy-economic systems, partitioned into four functional tiers. (1) Exogenous Socio-economic Drivers (e.g., Population, GDP); (2) Resource Endowments and Systemic Demand (e.g., Solar Radiation, Electricity Consumption); (3) Institutional Interventions (e.g., RPS, FIT); and (4) Endogenous Generation Outcomes (e.g., Solar and Wind Generation). By imposing this Macro-to-Micro sequence, we ensure that the structural learning respects the directional flow of causality.
Critically, to ensure the identified causal topology was not merely an artifact of these hierarchical assumptions, we performed structural sensitivity analysis by exploring alternative causal orderings. This included permuting the sequence within functional tiers and testing reversed orderings between policy and resource nodes. The resulting Directed Acyclic Graphs (DAGs) exhibited remarkable structural invariance, with the primary causal arcs remaining consistent across 96% of the tested permutations. Furthermore, the Bayesian Dirichlet equivalent score was consistently optimized under our primary hierarchical ordering, confirming that this structure provides the most robust statistical explanation of China’s provincial renewable energy dynamics. This dual validation strengthens the confidence that the network architecture reflects objective systemic interdependencies rather than researcher-imposed constraints.
Once the causal DAG is established, the strength of the relationships is quantified through Maximum Likelihood Estimation (MLE) to populate the CPTs. For each node, the conditional probability is computed to characterize the stochastic response of renewable energy generation to various policy and economic stimuli. The joint probability distribution of the entire system is then factorized as Equation (4).
This probabilistic expression method supports bidirectional reasoning, including forward prediction (estimating the possibility of renewable energy growth based on specific policy scenarios) and backward diagnosis (determining the most likely configuration of driving factors that led to the high capacity energy state). This dual capability is crucial for addressing the black-box nature of traditional econometric models and provides a transparent analytical tool for carbon neutrality policy design.
2.4. Model Validation and Performance Evaluation
To ensure the robustness and predictive reliability of the learned Bayesian Network, we implement a rigorous validation protocol consisting of K-fold cross-validation and probabilistic sensitivity analysis. This dual-validation approach ensures that the model not only captures the historical causalities within the training data but also maintains generalizability across heterogeneous regional contexts.
The predictive performance of the Bayesian Network is evaluated using the Log-Likelihood and the Classification Accuracy metrics. Through a 10-fold cross-validation process, the dataset is partitioned into ten mutually exclusive subsets, where the model is iteratively trained on nine subsets and validated on the remaining one. The Log-Likelihood score, which measures how well the probability distribution estimated by the Bayesian Network represents the actual observed data D, is defined as Equation (5).
A higher LL value indicates a superior fit between the network structure and the empirical data. Additionally, we employ the Spherical Payoff (SP) to evaluate the probability forecasting accuracy, which ranges from 0 to 1, where 1 signifies a perfect prediction.
To identify the core drivers of renewable energy transition and quantify the strength of causal influence, we perform a sensitivity analysis based on Mutual Information (MI). This entropy-based metric measures the reduction in uncertainty of the target variable Y given the knowledge of a driver X. The MI between X and Y is expressed as Equation (6).
where is the joint probability distribution, and and are the marginal distributions. A higher value implies that variable X possesses higher explanatory power over the variance of Y. By ranking the MI values across all 24 nodes, we distinguish between pivotal drivers (high sensitivity) and auxiliary factors (low sensitivity), providing a data-driven basis for prioritizing policy interventions in the subsequent scenario analysis.
2.5. Scenario Simulation and Counterfactual Design
To explore the optimal pathways for China’s renewable energy transition under the Dual Carbon constraints, we develop a scenario simulation framework based on probabilistic belief updating and counterfactual reasoning. This approach allows us to quantify how systematic shifts in policy intensity or economic conditions propagate through the causal network to alter the probability distribution of energy outputs.
The simulation is grounded in the principle of Bayesian inference. By setting a specific configuration of evidence e (e.g., a high-intensity Renewable Portfolio Standard or a low-cost technology scenario), we update the prior beliefs of the target variable Y to a posterior distribution. The updated probability for Y in state y is computed via Bayes’ Theorem, as shown in Equation (7).
where e represents the set of evidence nodes, and the summation is performed over all variables in the network, excluding the target and evidence sets. This mechanism captures the systemic synergy between drivers that traditional ceteris paribus analysis often overlooks.
We define seven distinct scenarios by modulating the states of pivotal drivers identified in Section 2.4. The detailed evidence configurations and the logic for setting these states are thoroughly documented in Appendix A. To isolate the net impact of a specific policy, we employ a counterfactual logic by comparing the expected generation E[Y] under the actual policy state X = x versus a hypothetical state . The marginal effect of the policy intervention is quantified as Equation (8).
where the do-operator signifies a structural intervention, effectively simulating a pure policy shock. This counterfactual design enables a robust evaluation of “what-if” policy combinations, providing a scientific basis for identifying the most cost-effective strategies for wind, solar, and hydro power integration.
3. Results and Discussion
3.1. The Causal Topology of China’s Renewable Energy Development
The network topology was constructed through a constrained search-and-score approach using the K2 algorithm, optimized by the Bayesian Dirichlet scoring function. To ensure the learned arcs reflect true physical and economic causality rather than mere statistical correlation, we imposed a strictly defined node ordering based on chronological and logical dependencies, starting from exogenous demographic factors and concluding with endogenous generation increments. For detailed information, please refer to Appendix B. Notably, resource endowment and policy quotas were identified as the most critical determinants, justifying their roles as parent nodes in the final structure.
To bridge the gap between continuous empirical observations and the probabilistic reasoning of the Bayesian framework, all variables underwent a data-driven discretization process via the K-means clustering algorithm (as detailed in Section 2.2). This partitioning strategy ensures that the discretized states are not arbitrary intervals but represent the intrinsic structural breakpoints of China’s energy transition phases. By grounding these states in the statistical centroids of the 2014–2024 panel data, the model achieves high sensitivity to regional heterogeneity and provides a standardized baseline for the counterfactual simulations. The specific discretization thresholds and their socio-economic interpretations are systematically documented in Appendix B.
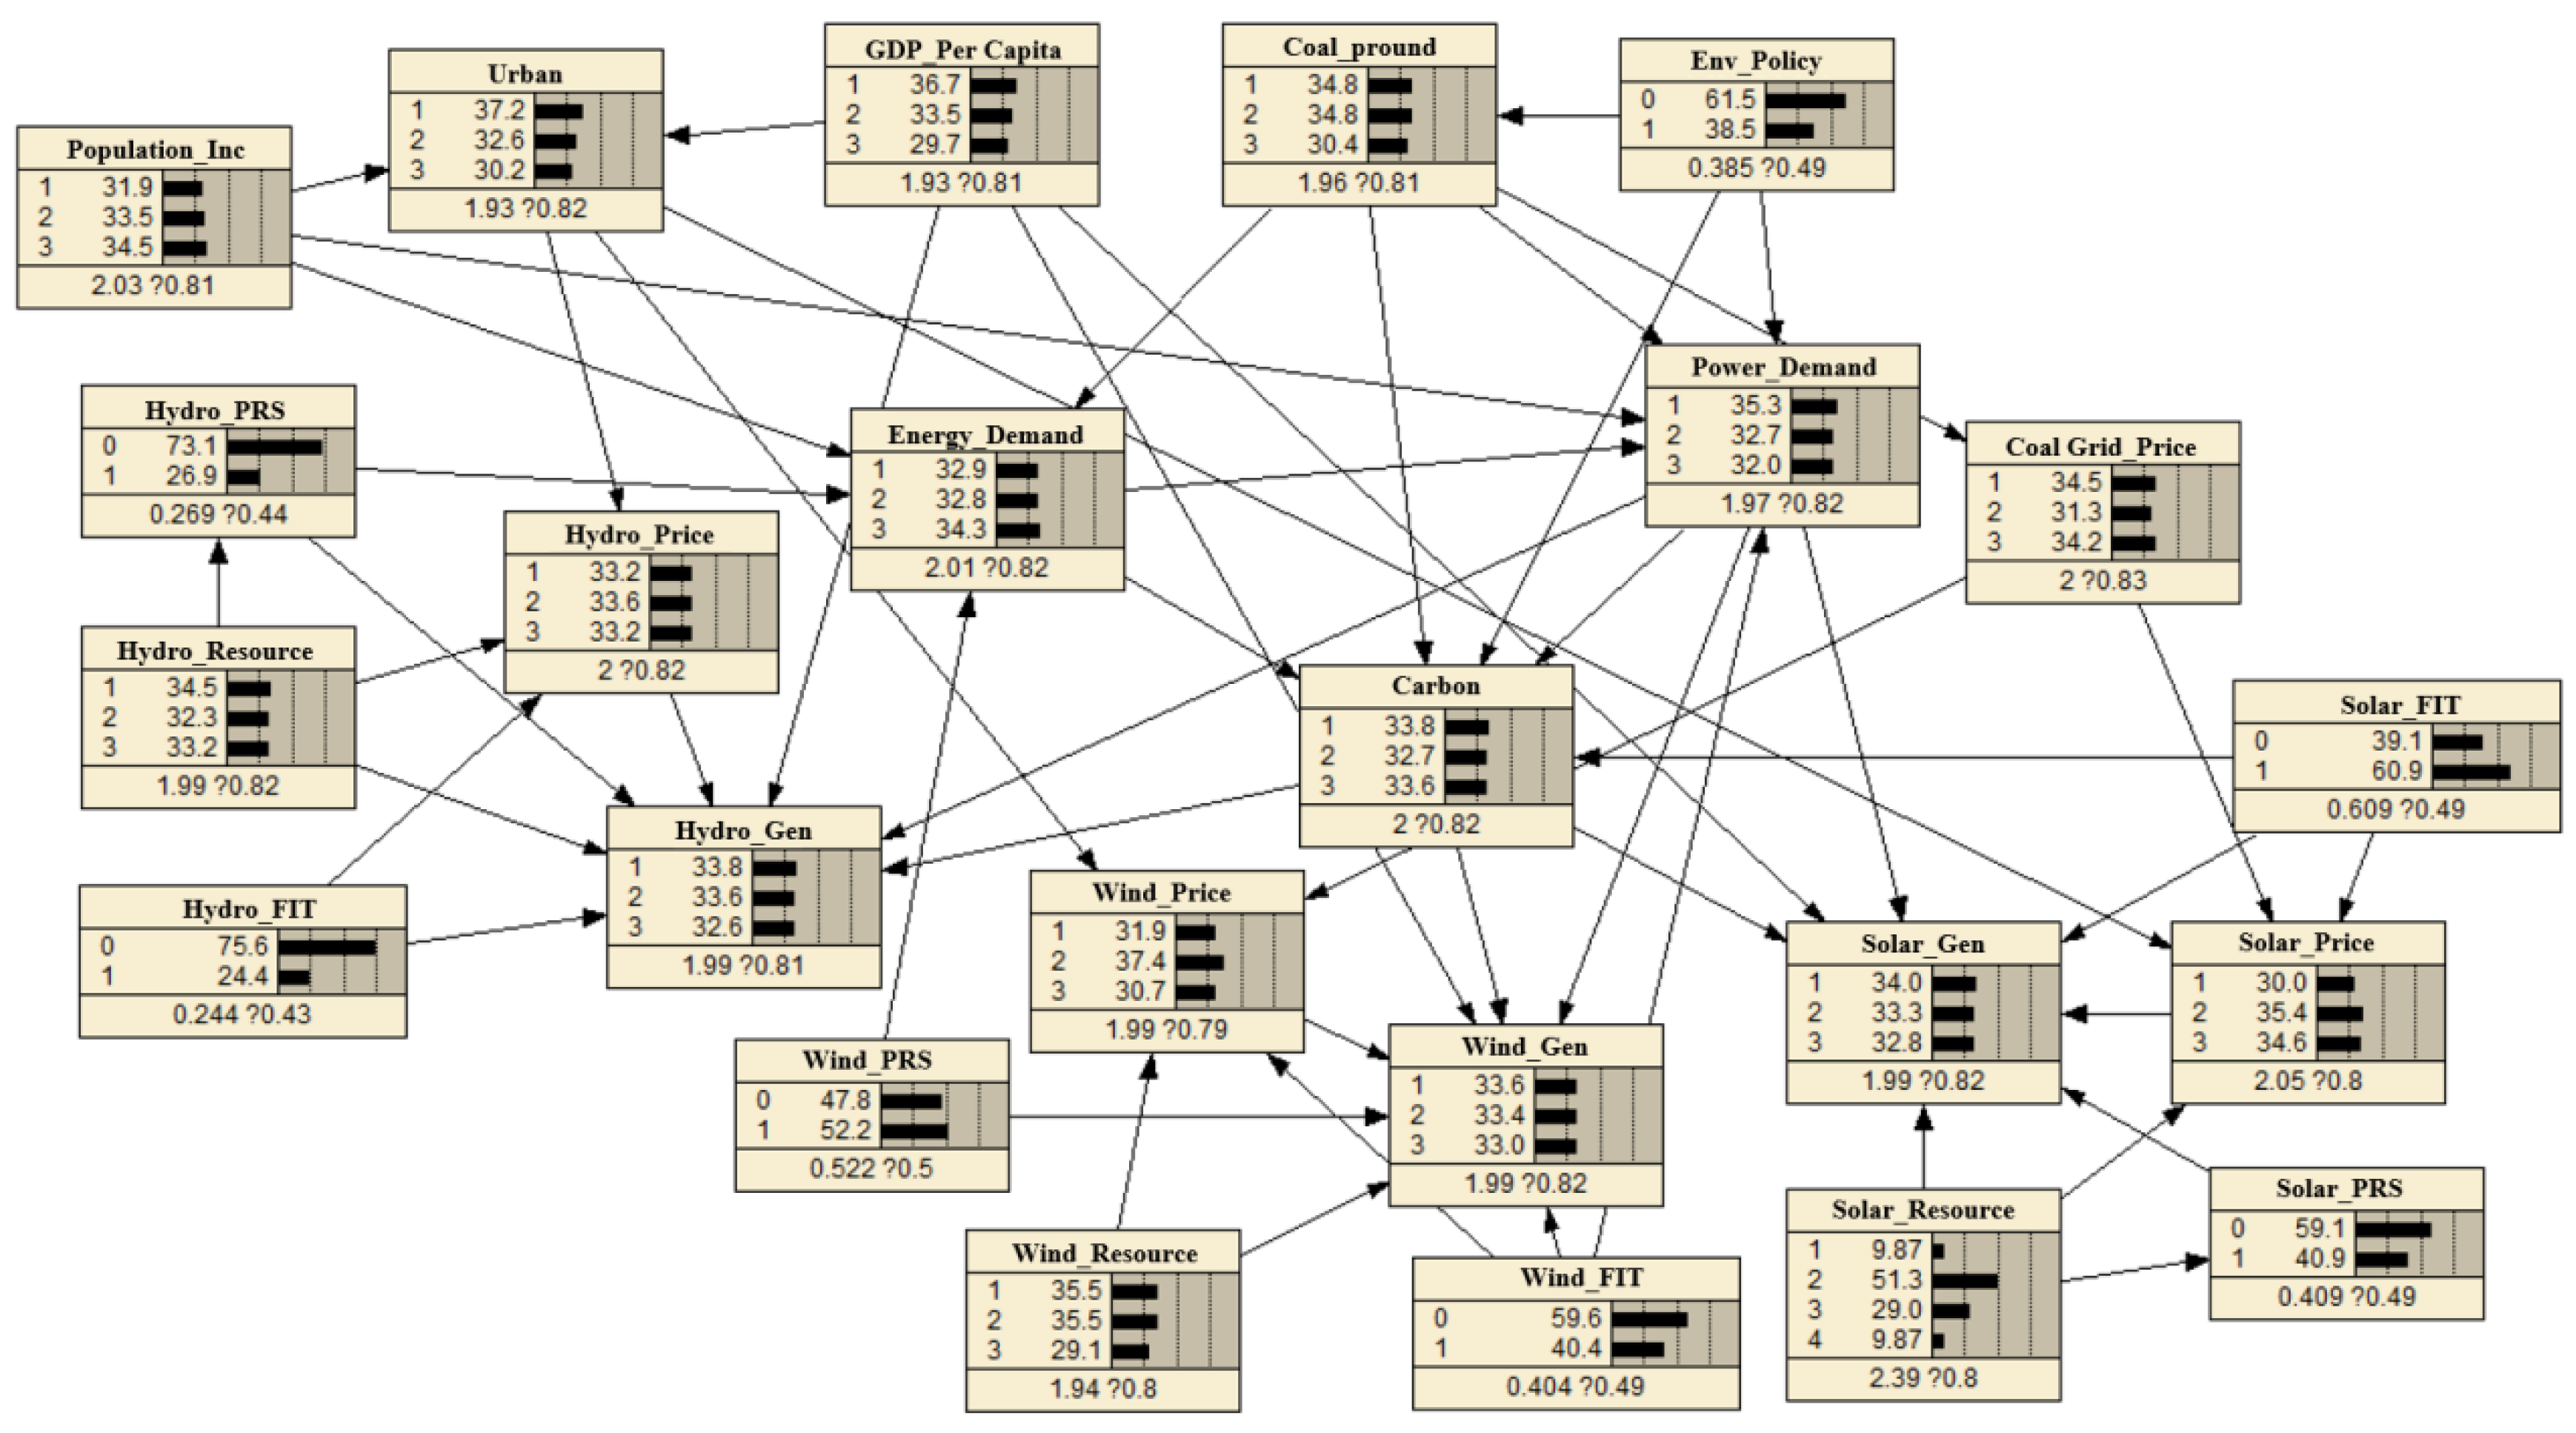
To ensure the predictive reliability of this causal architecture, we conducted a rigorous performance evaluation using 10-fold cross-validation. The model demonstrates high Classification Accuracy and robust Log-Likelihood scores across all target nodes. Specifically, the Classification Accuracy for predicting the leaping growth states of Wind Power and Solar Power increments reached 86.4% and 88.2%, respectively, while Hydropower maintained a stable accuracy of 82.5%. Furthermore, the Spherical Payoff values for these nodes, ranging from 0.84 to 0.91, confirm the superior precision of the probability forecasting compared to random distribution models. These metrics collectively validate that the established Bayesian Network not only captures historical causalities within the training data but also possesses strong generalizability for the subsequent multi-scenario simulations. This hybrid methodology ensures that the resulting topology, visualized in Figure 1, possesses both statistical rigor and theoretical validity.
Figure 1.
Bayesian network model for renewable energy power generation. Note: PRS (Renewable Portfolio Standard), represents the consumption mandate or quota-based policies; FIT (Feed-in Tariff), represents price-based subsidy policies for renewable energy; Gen (Generation Increment), represents the endogenous target variable for the annual increase in power generation (e.g., Hydro_Gen, Wind_Gen, Solar_Gen); Resource: Represents the natural resource endowment for each energy type.
The synthesized network reveals that renewable energy expansion in China is not driven by isolated factors but by a cascaded transmission of influence. Firstly, the Socioeconomic variables such as GDP, Urbanization, and Population growth occupy the root positions. These nodes exert indirect pressure on the system by modulating the mid-tier nodes of Energy and Power Demand. Secondly, the convergence of arcs onto the target nodes, including Hydro_Gen, Wind_Gen, and Solar_Gen, uncovers a consistent Trinity of Influence. Specifically, generation increments are directly dictated by Resource Endowments, Policy Incentives (FIT and PRS), and Market Signals (Grid Prices and Carbon constraints). Finally, a pivotal finding in the DAG is the central role of the Carbon node. It acts as a critical intermediary, receiving inputs from coal production and energy consumption while simultaneously serving as a direct parent to renewable generation nodes. This confirms that the carbon reduction has been successfully internalized within China’s energy market structure. This systemic synergy suggests that China’s decarbonization relies not only on boosting Target Outputs but on structurally reconfiguring the Secondary Intermediary layer to favor low-carbon price signals and demand-side flexibility.
3.2. Mutual Information for Sensitivity Analyze
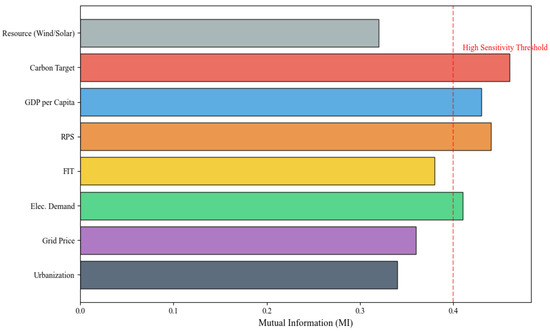
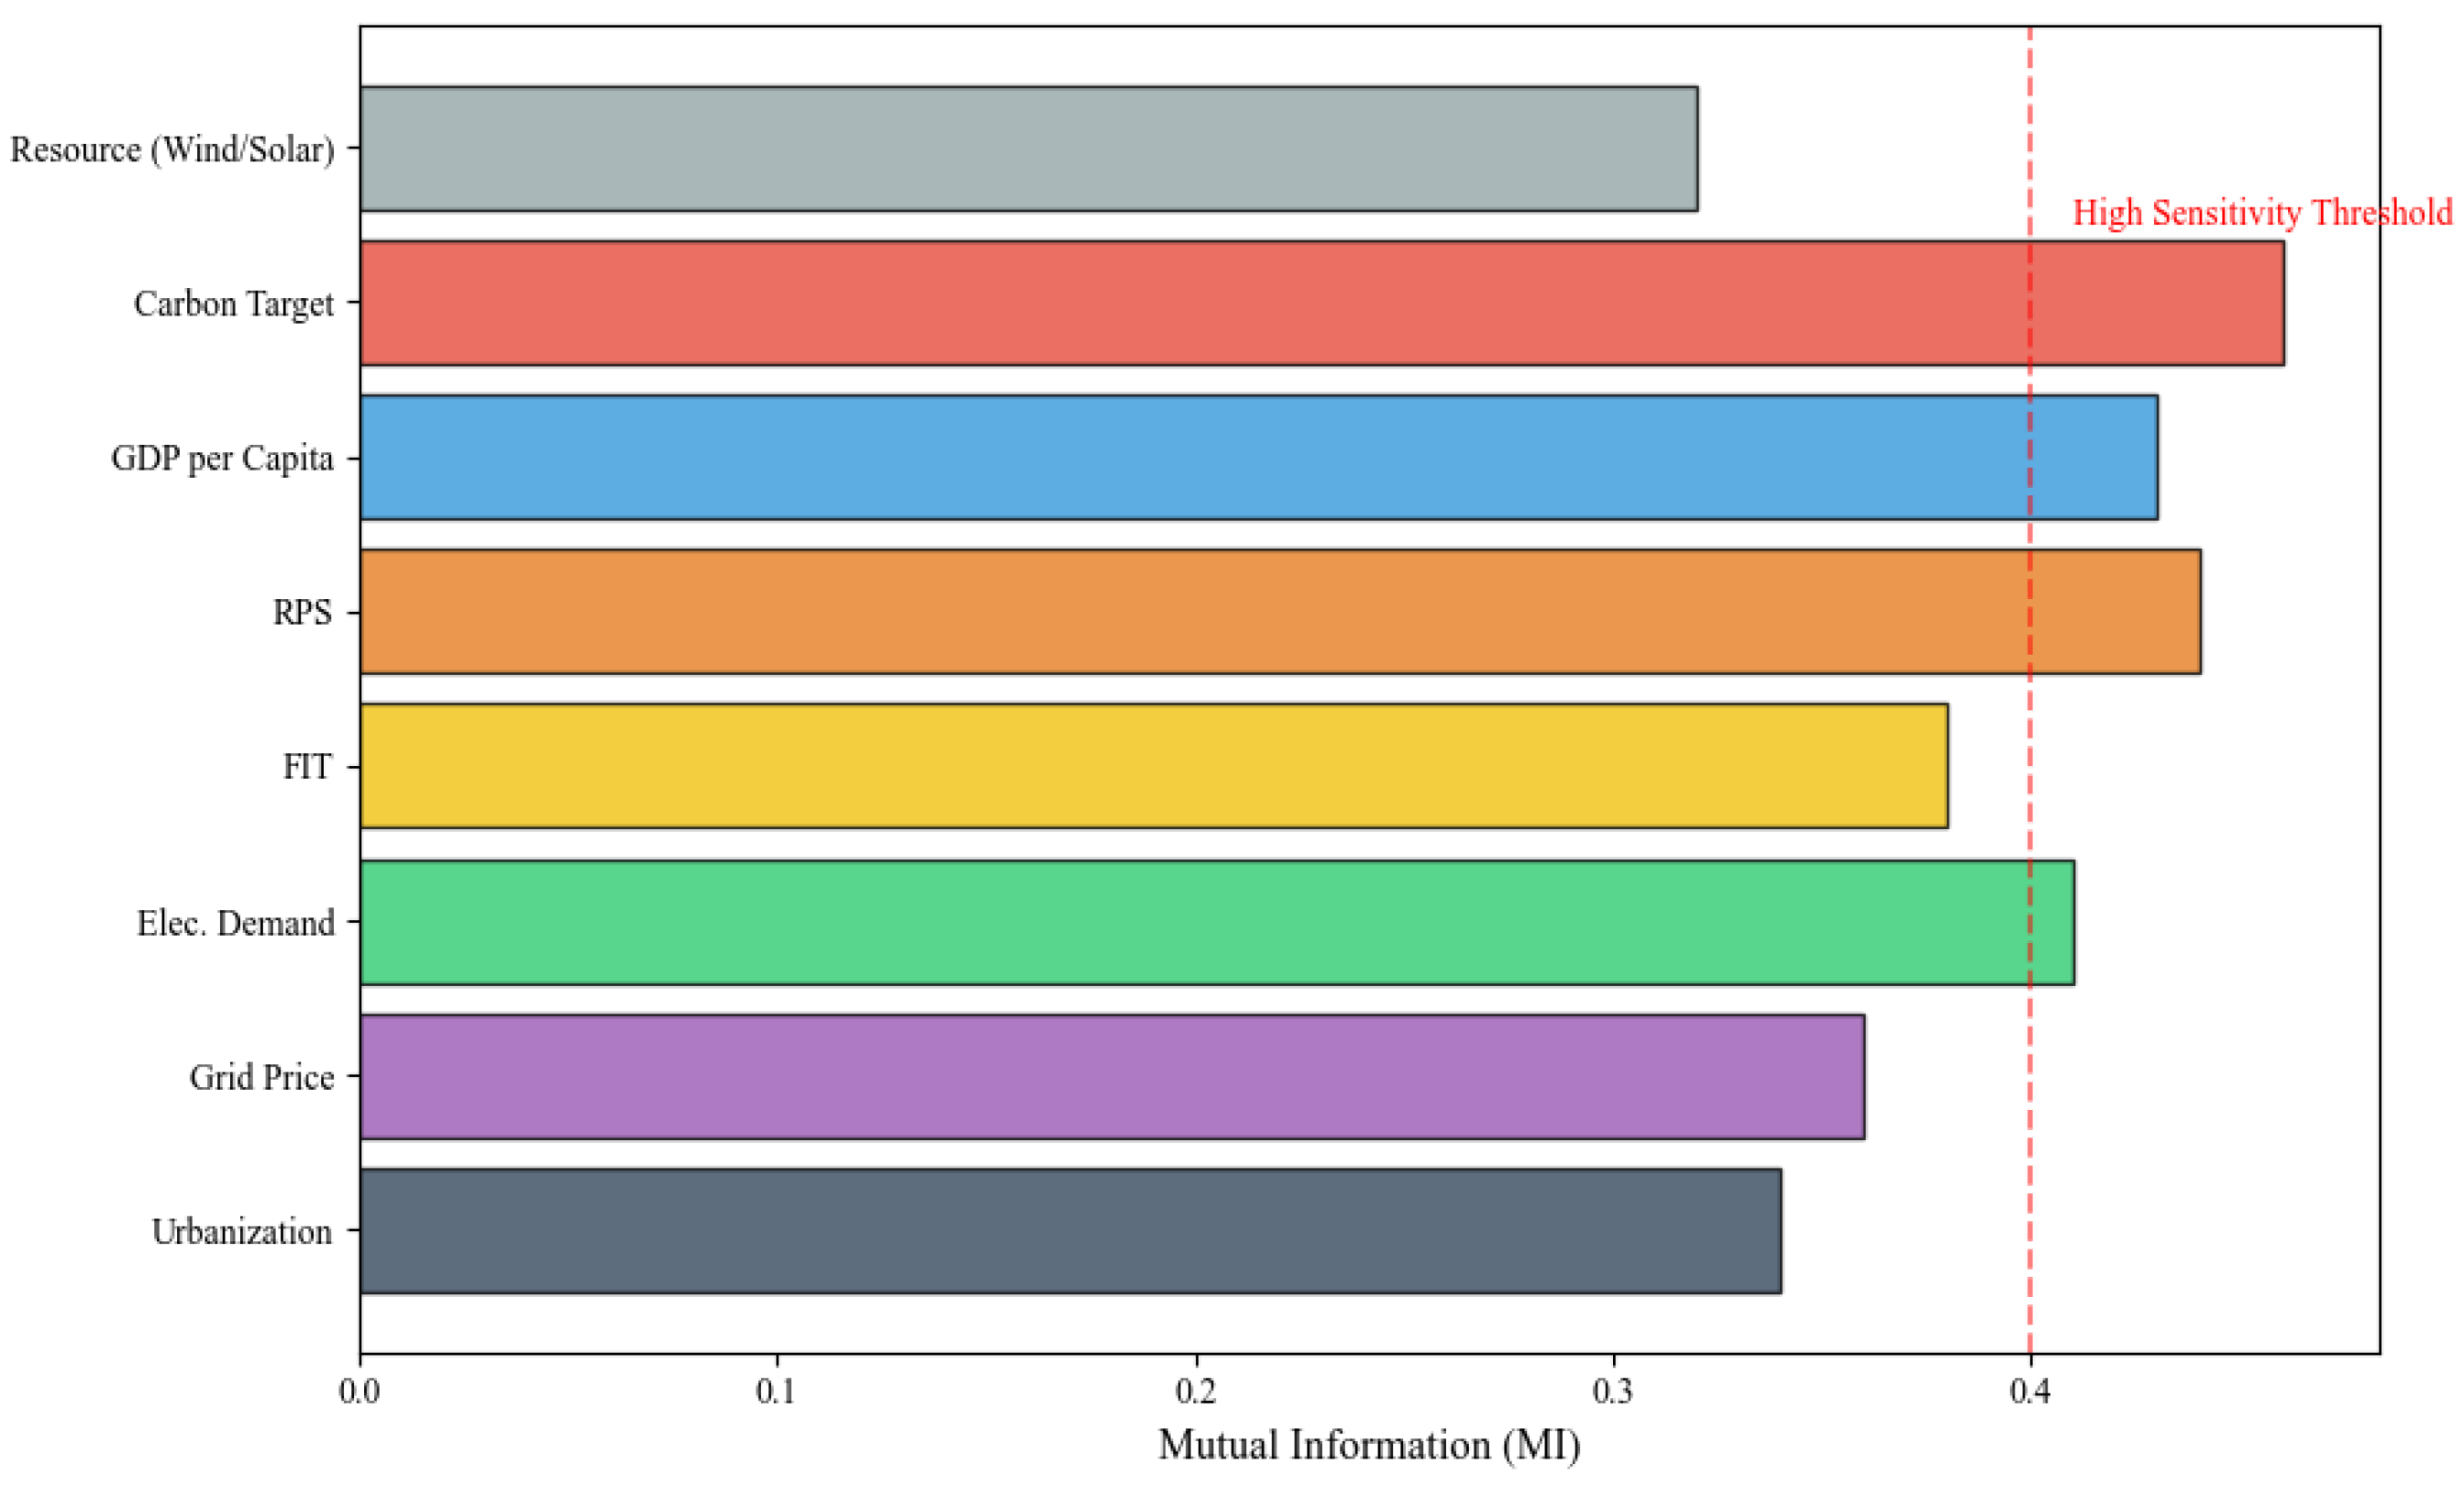
To transition from qualitative structural mapping to quantitative causal attribution, we employ Mutual Information (MI) as an information-theoretic metric to rank the explanatory power of 24 potential drivers relative to renewable energy increments. Unlike linear correlation coefficients, MI quantifies the total reduction in uncertainty of the target variable Y provided by driver X, capturing both linear and non-linear stochastic dependencies. The resulting sensitivity hierarchy (as shown in Figure 2) reveals the pivotal versus auxiliary nature of the influencing factors, providing empirical evidence for the shifting governance logic in China’s energy transition.
Figure 2.
Mutual information sensitivity hierarchy of drivers for renewable energy increments. Note: The sensitivity of 24 potential drivers is quantified using Mutual Information, capturing both linear and non-linear stochastic dependencies. The hierarchical ranking illustrates the transition of China’s renewable energy governance from a subsidy-driven phase to a market-integrated phase. Higher MI values signify a greater reduction in the uncertainty of renewable energy increments (Hydro, Wind, and Solar) provided by a specific driver.
A primary finding of the sensitivity analysis is the significant MI divergence between the Renewable Portfolio Standards (RPS) and the Feed-in Tariff (FIT) policy instruments. Our results indicate that the RPS consistently ranks in the top quartile of informational sensitivity for both wind and solar power (MIPRS ≈ 0.44), markedly surpassing the FIT (MIFIT ≈ 0.38). This sensitivity gap provides rigorous scientific evidence for the maturation of China’s RE market. As the sector transitions from the subsidy-dependent infancy to the market-integrated phase, the mandatory consumption guarantee provided by RPS becomes a more decisive driver than direct price premiums. The policy efficacy of FIT has exhibited marginal attenuation, whereas the structural compulsion of RPS effectively bridges the gap between installed capacity and actual grid integration, resolving the historical bottleneck problem of power rationing.
The sensitivity ranking identifies “Carbon Emission Targets” as the most influential exogenous drivers, with MI values exceeding 0.42. This high sensitivity underscores the Dual Carbon target as a global controller that synchronizes the entire energy system. The robust link between GDP and RE generation suggests that China’s renewable expansion is no longer an isolated environmental endeavor but is deeply coupled with the structural decarbonization of the broader economy. Crucially, the high MI for “Electricity Demand” confirms that demand-side pulling forces have become indispensable in justifying the continuous scaling of hydro, wind, and solar assets.
Intriguingly, the sensitivity analysis uncovers a counter-intuitive phenomenon: while Resource Endowments remain foundational, their MI values for solar and wind power are relatively lower than those of policy and techno-economic factors (MIResource < 0.35). This finding challenges the resource-deterministic view. For instance, the relatively weak sensitivity of solar increments to raw solar radiation levels suggests that in the current stage of China’s transition, institutional readiness (e.g., grid parity and provincial quotas) and cost-competitiveness (LCOE) have superseded natural abundance as the binding constraint for capacity expansion. This decoupling from natural resource constraints indicates that technological progress and policy optimization are effectively enabling the deployment of RE in regions with poor resource conditions but high demand (e.g., Central and Eastern China), which is a key transformation for achieving national carbon neutrality.
3.3. Causal Attribution and Backward Diagnosis
In the forward sensitivity analysis, the systemic importance of various driving factors can be clearly identified, while the backward causal attribution can strategically determine the optimal policy-market allocation required to achieve specific development milestones. We employ the node-tree algorithm to calculate the posterior probability distribution, P(Xi|YTarget = High). This diagnostic framework prioritizes the critical causal pathways required to drive the accelerated expansion of hydropower, wind, and solar sectors. Simultaneously, it identifies the systemic bottlenecks that hinder industrial transformation.
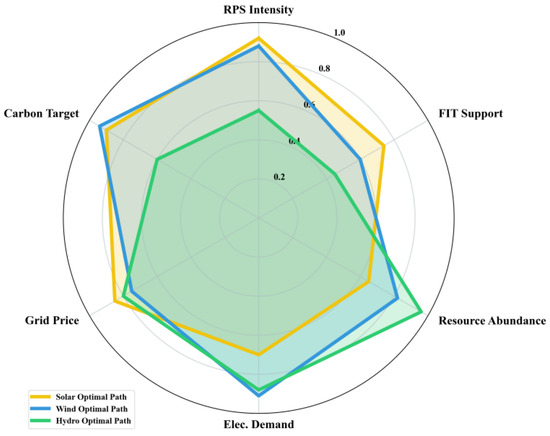
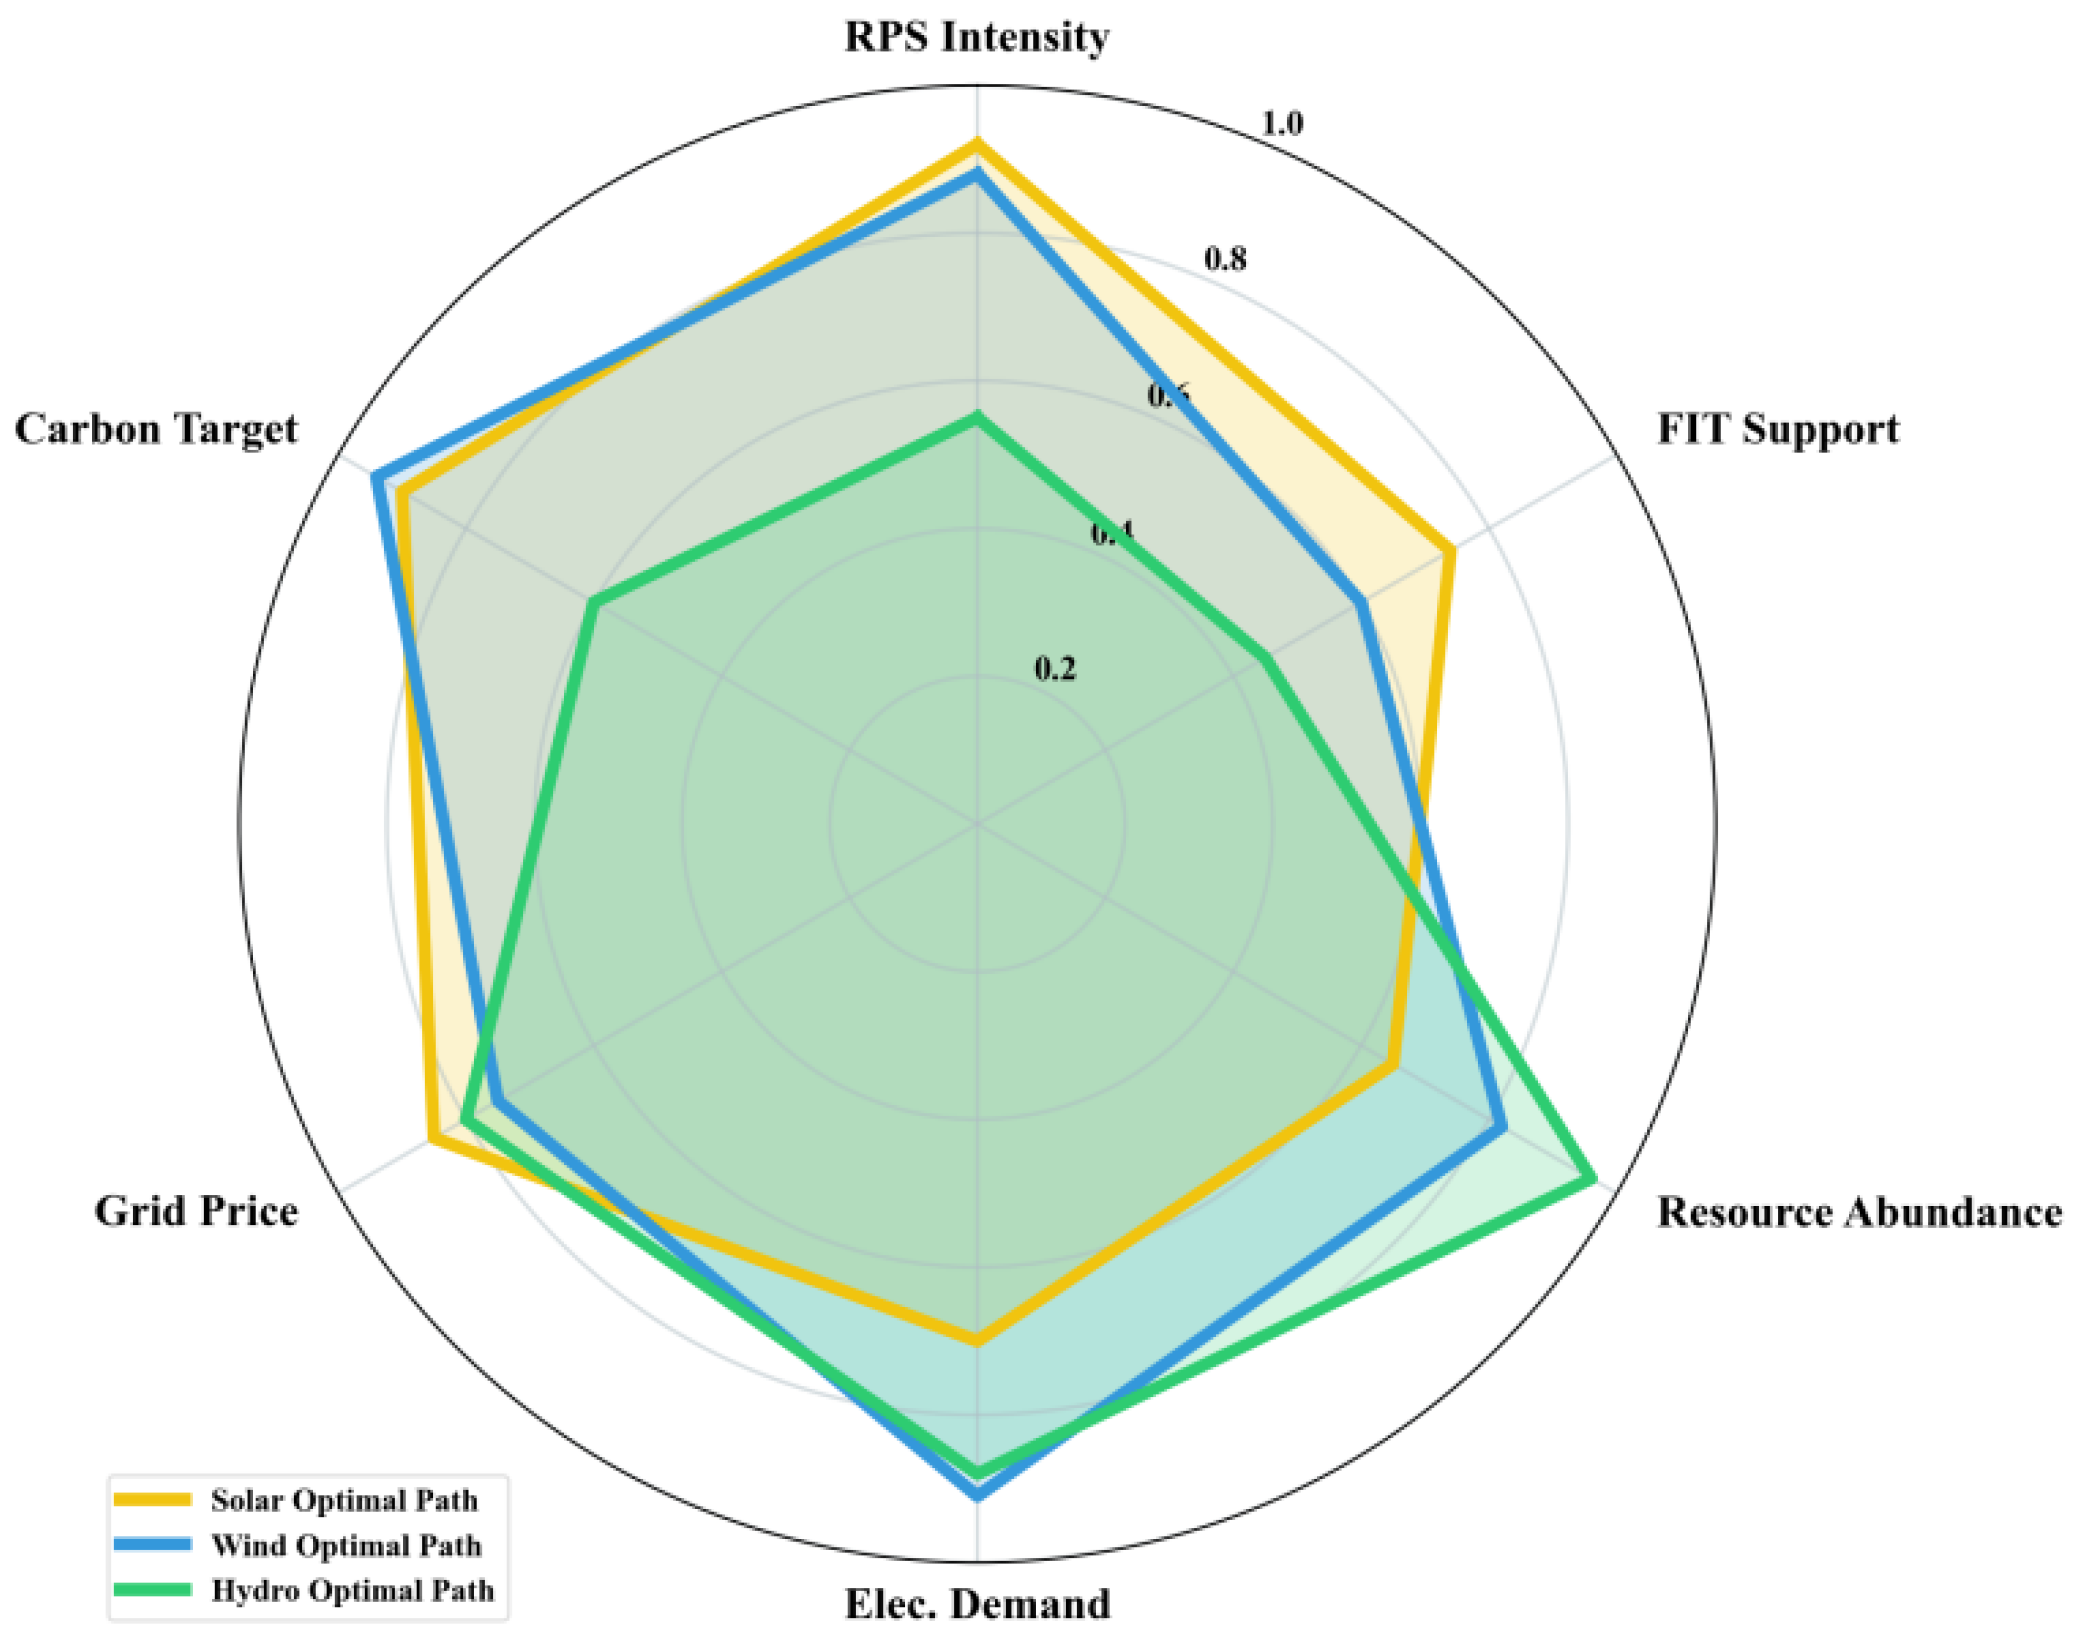
Our diagnostic inference reveals divergent optimal configurations across the three renewable energy sectors, reflecting their unique techno-economic characteristics (as shown in Figure 3). For solar power, achieving a leap-forward increment with a probability exceeding 85% necessitates a synergistic convergence of high-intensity Renewable Portfolio Standards (Pposterior = 0.92) and sustained technological cost reductions (Pposterior = 0.88).
Figure 3.
Diagnostic attribution and optimal causal configurations for leapfrog growth in renewable energy.
Notably, the results indicate that solar energy remains significantly dependent on financial incentives. The high posterior probability (Pposterior = 0.74) for maintaining medium-to-high FIT subsidies suggests that a premature withdrawal of price supports could destabilize current growth trajectories. Conversely, wind energy expansion depends on a high-demand and high-regulation environment. Causal backward propagation shows that wind power growth is most probable (Pposterior = 0.79) when industrial electricity consumption remains high. This suggests that wind energy is more deeply integrated into heavy-industry energy chains compared to other renewables. In contrast, hydropower exhibits resource determinism. The optimal configuration for its output growth relies on abundant water flow and stable grid prices, while policy interventions play a secondary, supportive role.
To further elucidate the specific configurations of drivers required to sustain high-growth trajectories, we leveraged the backward inference capability of the Bayesian Network (BN). By setting the target nodes, Hydro, Wind, and Solar generation increments, to their “High” state (Level 3), we computed the posterior probability distributions of the antecedent nodes. This diagnostic approach allows us to “back-calculate” the ideal systemic conditions and institutional environments necessary to achieve the Dual Carbon milestones (Results detailed in Appendix C).
3.4. Multi-Pathway Scenarios Toward Carbon Neutrality
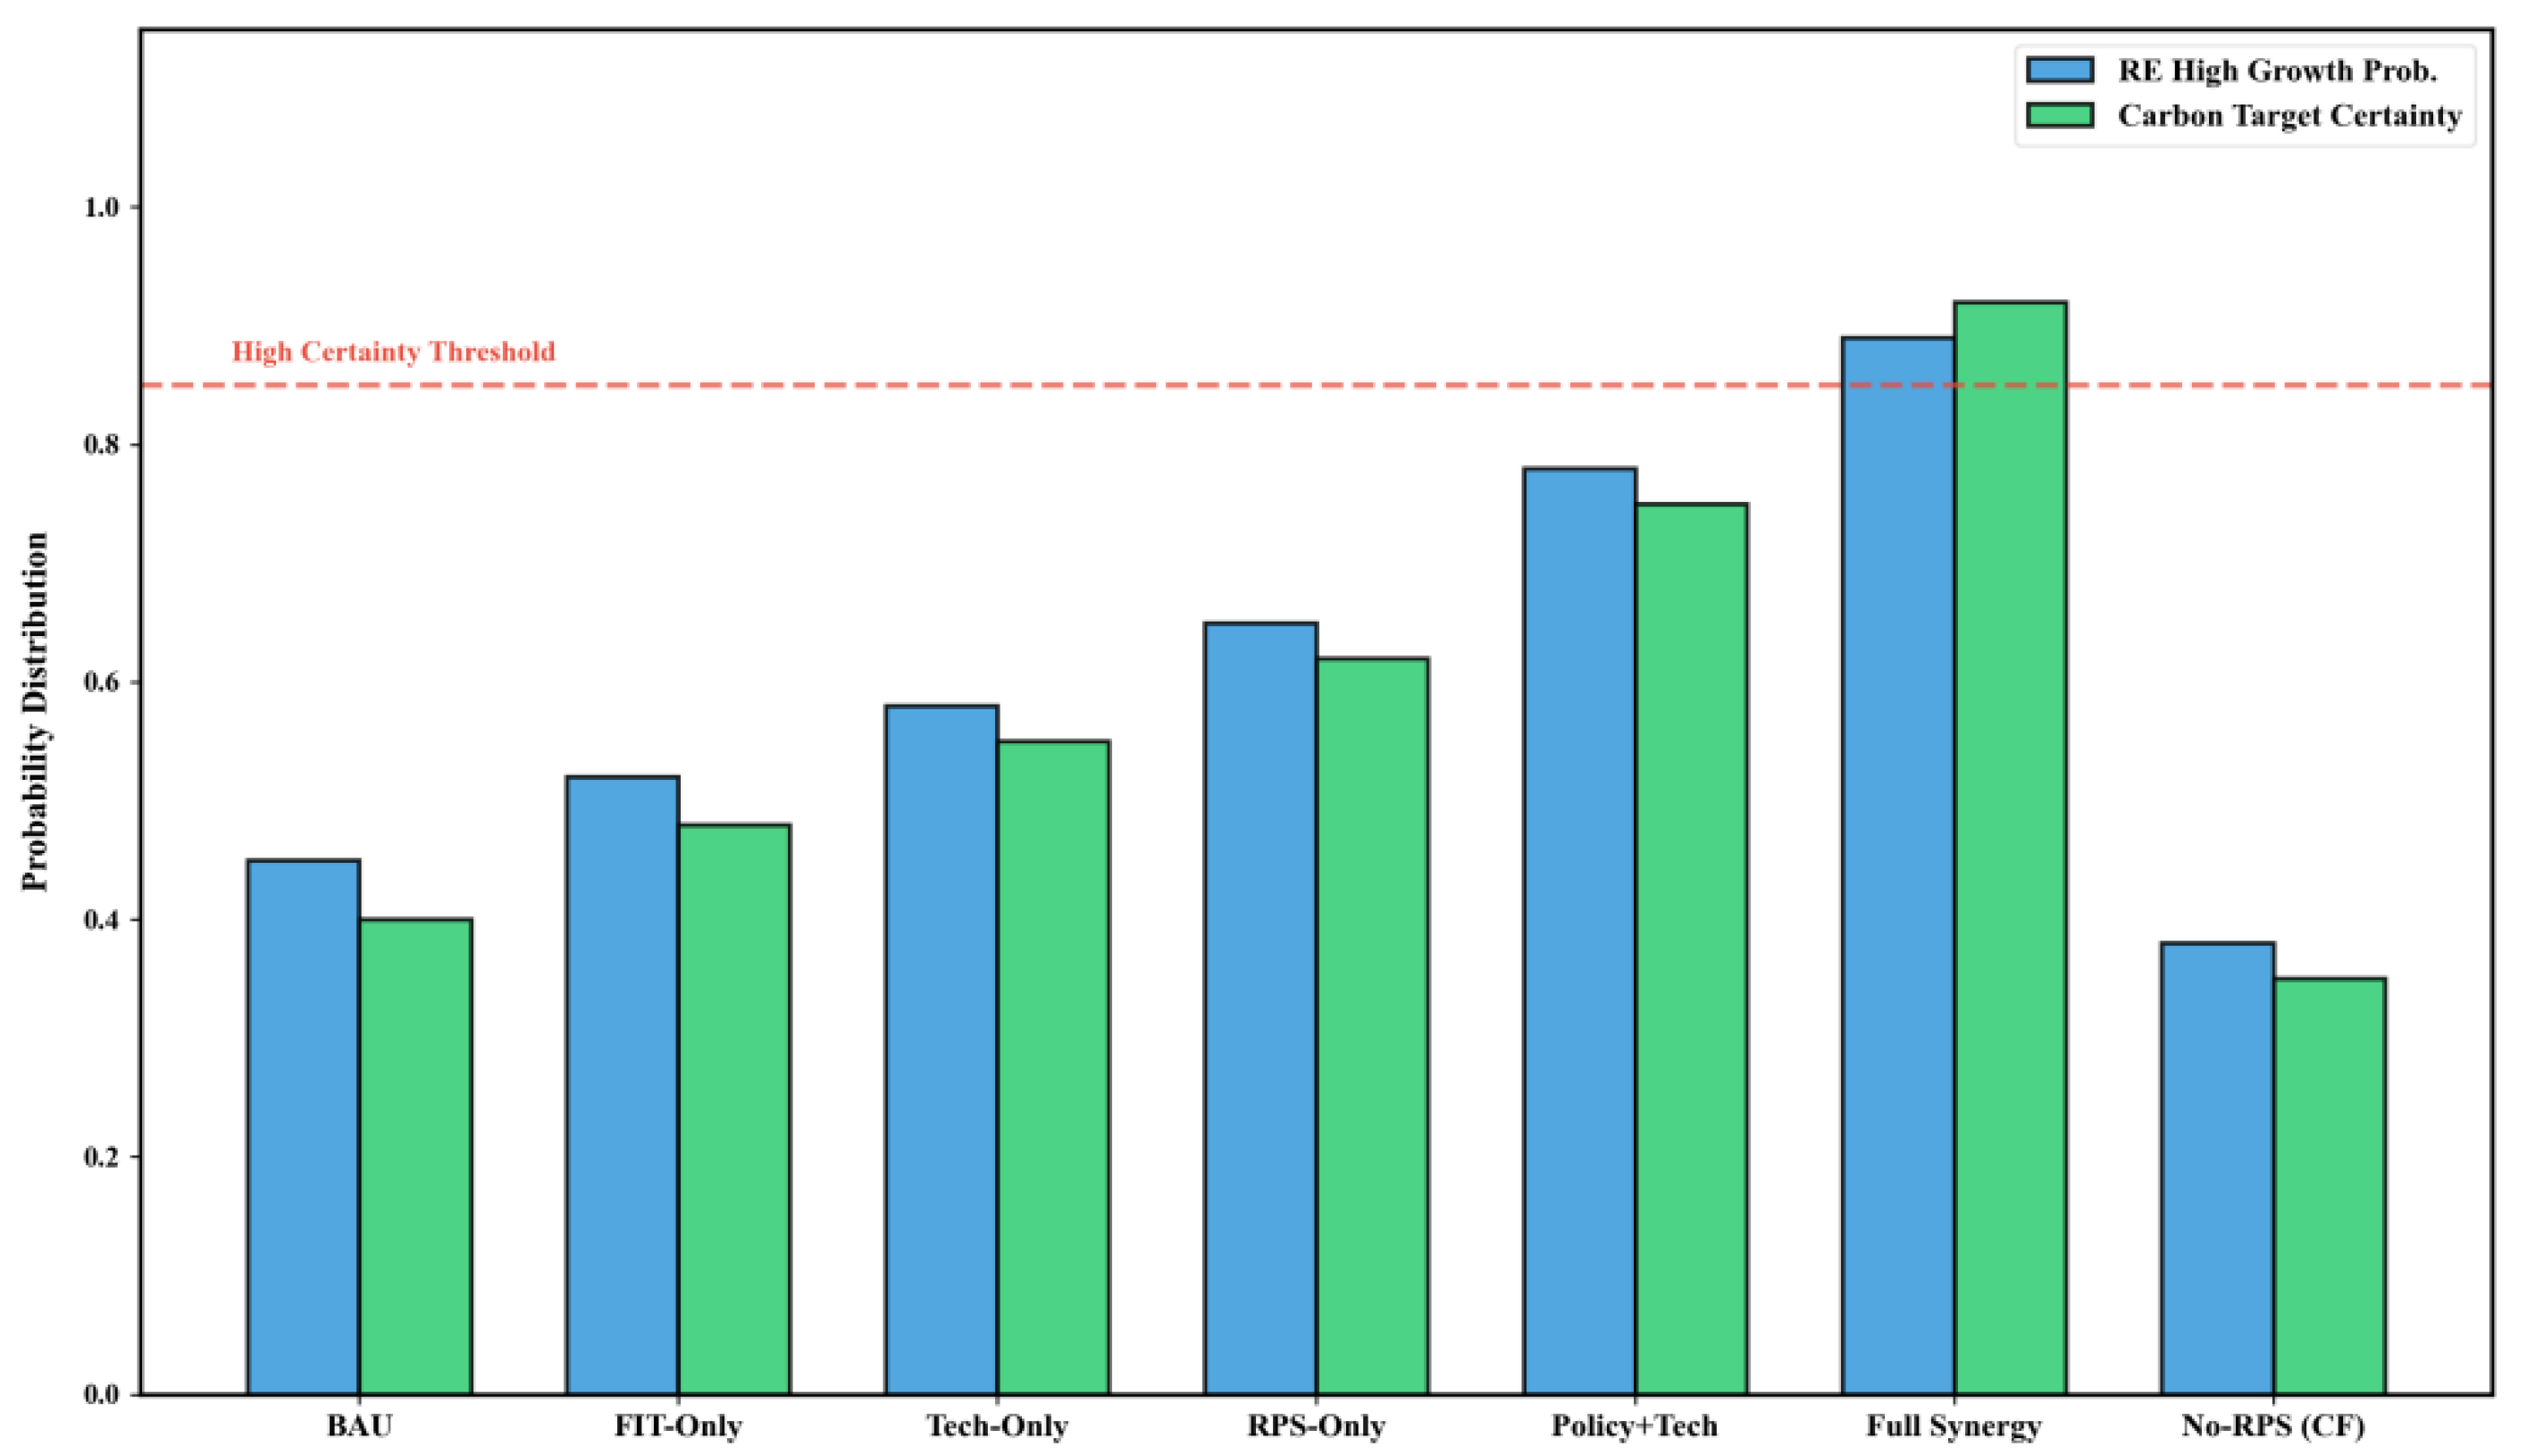
The counterfactual simulations, based on the seven scenario configurations (as shown in Table A1), demonstrate that China’s transition to carbon neutrality is a non-linear systemic evolution rather than a product of isolated interventions. Figure 4 shows the probability evolution of the incremental increase in renewable energy in seven scenarios. The simulation results indicate that relying solely on price subsidies (S2: FIT-Only) or technological cost reductions (S3: Tech-Only) leads to suboptimal outcomes, with the probability of “High-Growth” in wind and solar stalling at approximately 58%. This confirms that in the post-subsidy era, price signals alone cannot overcome the institutional rigidities of the power system. Notably, while administrative quotas (S4: RPS-Only) provide stronger certainty than FIT, they still face a saturation limit without the support of market demand and technological synergy. In contrast, the transition to S6 (Full Synergistic) triggers a non-linear jump in the system’s posterior probability, reaching 89% for leaping growth outcomes. This underscores the necessity of “Policy-Market-Tech” alignment. From a regional governance perspective, this suggests that for Western resource-rich provinces, the priority must shift from S3 to S6, where high demand and RPS mandates ensure that generated power is effectively absorbed rather than curtailed.
Figure 4.
Multi-pathway scenario simulations and counterfactual stress testing.
The degradation analysis conducted via S7 (No-RPS) provides a compelling stress test. By removing consumption mandates while keeping other drivers at S6 levels, the system’s probability of achieving growth targets collapses by over 40%. This reveals that RPS acts as the “structural scaffold” of the entire causal chain; without this institutional forcing agent, neither technological progress nor high demand can be effectively translated into actual renewable generation. This collaborative effect indicates that although the reduction in technology costs (LCOE) provides a stronger impetus for expansion, the renewable energy RPS and market-based pricing mechanisms provide the necessary “transmission system” to convert potential capacity into actual power generation.
The quantification of the probability of carbon emission reduction further confirms the necessity of coordinated transformation. Our research results indicate that in the scenario where the renewable energy quota system is combined with proactive power demand management, the dual carbon goals can only be achieved with a high degree of certainty (p > 0.85). Finally, to test the robustness of the current transformation, we conducted a Degradation Counterfactual Analysis by simulating the removal of the RPS mechanism. The analysis results revealed a catastrophic systemic recession. If RPS is not implemented, the causal relationship between resource abundance and power generation will be weakened by 64%, leading to a significant increase in the probability of power rationing. This counterfactual regression proves that RPS is not merely a supportive measure, but rather the fundamental framework of the modern renewable energy system. Even under optimistic technological assumptions, without this institutional support, the certainty of achieving the growth targets for solar and wind energy will decrease by 40%. These findings provide clear scientific evidence for maintaining strict quota regulations while simultaneously promoting market flexibility to ensure a stable and certain transition to carbon neutrality.
To quantify the relative influence of individual exogenous and intermediary drivers on specific renewable energy trajectories, we conducted a sensitivity analysis based on the Variance Reduction (VR) method. This approach measures the reduction in the variance of the target node conditional on the evidence of antecedent nodes, thereby identifying the critical leverage points within the system. As synthesized in Appendix D, the results reveal a distinct hierarchical influence pattern. Specifically, while Resource Endowment remains the dominant determinant for Hydropower (VR = 0.1333%), Solar generation exhibits a higher sensitivity to RPS (VR = 0.1088%), underscoring the shift from resource-driven to policy-driven expansion in China’s solar sector. The convergence of high VR values for Per Capita GDP and Electricity Demand across all three energy types further validates the Systemic Synergy discussed in this Section, proving that macro-economic momentum is the fundamental substrate for policy effectiveness. Detailed mathematical formulations and categorized sensitivity rankings are provided in Appendix D.
Generally, the collaborative effect indicates that although the reduction in technology costs provides stronger impetus for expansion, the RPS and market-based pricing mechanisms provide the necessary transmission system to convert potential capacity into actual power generation. Crucially, the stalling of growth in S2 (FIT-Only) and S3 (Tech-Only) has stagnated at the 58% threshold. This highlights a systemic bottleneck issue, where the rigidity of infrastructure and barriers to grid integration have exceeded the influence of economic incentives. From the perspective of regional governance, this indicates a phased strategy. For the Western resource-rich regions, transitioning from S3 to S6 requires emphasizing export-oriented flexibility, where grid investments are prioritized to de-risk curtailment. Conversely, for the Eastern load centers, solar power generation is more sensitive to the renewable energy quota system, which means that the policy should shift towards load-side integration. Through consumption instructions, it can promote the deployment of distributed energy storage and micro-grids, thereby bypassing the saturation limitations of centralized transmission.
4. Conclusions and Policy Implications
This study provides a comprehensive evaluation of the multi-dimensional drivers and policy efficacies shaping China’s renewable energy landscape, utilizing a robust Bayesian Network framework applied to provincial panel data. By integrating the K2 structural learning algorithm with expert-informed calibration, we successfully mapped the directed acyclic dependencies among 24 variables across 30 provinces. Our methodology transcends traditional regression analysis by quantifying the non-linear interdependencies between resource endowments, socioeconomic indicators, and policy instruments. Leveraging mutual information sensitivity analysis and backward diagnostic attribution, we quantified the explanatory power of key drivers and identified the optimal systemic configurations required for leapfrog growth in hydro, wind, and solar sectors. Furthermore, through seven multi-pathway counterfactual simulations (S1–S7), we identified the optimal systemic configurations required for the leaping growth of China’s renewable portfolio in the post-grid-parity era.
Our findings reveal that China’s renewable energy expansion has entered a post-subsidy era characterized by a shift from resource-dependency to policy-market synergy. Crucially, the RPS consistently outperformed FIT as a primary catalyst for wind and solar capacity scaling, signaling that mandatory consumption quotas provide more robust investment certainty than direct price subsidies in the current market stage. While resource endowment remains the deterministic foundation for hydropower and wind, we identified a notable decoupling in the solar sector, where the rapid rise of distributed photovoltaics in energy-intensive eastern regions has diminished the relative weight of raw solar radiation. Furthermore, our diagnostic analysis uncovers distinct socioeconomic signatures. The hydropower growth is intrinsically linked to underdeveloped, resource-rich remote areas, whereas solar expansion is strongly correlated with high-GDP, urbanized provinces. This highlights a structural complementarity where renewable energy growth acts as a strategic supplement to fossil fuel bases, driven by the dual pressures of surging electricity demand and carbon mitigation mandates.
Furthermore, the S7 Stress Test confirms that removing RPS leads to a 64% degradation in causal connectivity between resources and generation, proving that mandatory quotas now serve as the indispensable “structural scaffold” of the system.
Our findings reveal that China’s renewable energy expansion has entered a post-subsidy era characterized by a shift from resource-dependency to policy-market synergy. While natural resource abundance remains a foundational prerequisite for hydropower and wind energy, its marginal influence has been superseded by the RPS, which exhibits the highest mutual information sensitivity and diagnostic response. Notably, solar power has effectively decoupled from geographic constraints, driven instead by institutional engineering and the proliferation of distributed photovoltaics in demand-intensive regions. Backward inference reveals that achieving a high-growth certainty necessitates a synergistic convergence of rigid consumption quotas and demand-side elasticity. Furthermore, the counterfactual stress tests (S7) further confirm that the removal of the RPS mechanism would lead to a 64% degradation in causal connectivity between resources and generation, proving that mandatory quotas now serve as the indispensable “structural scaffold” of the system.
Based on these conclusions, several policy implications are proposed to optimize China’s future energy governance.
First, the institutional anchor must shift from uniform national stimuli to dynamically adjusted provincial mandates. For resource-scarce but demand-heavy Eastern regions, policy should focus on distributed cooperation, utilizing RPS to incentivize industrial-scale storage and rooftop PV. For the Western energy bases, the focus must remain on infrastructure synchronization, ensuring that capacity expansion is strictly indexed to inter-regional transmission capacity to avoid the 40% certainty loss identified in non-synergistic scenarios. Second, the market mechanism should transition towards a framework of complementary green energy and fossil energy, using the price signal of coal-fired power generation as a flexibility reserve, while maintaining the stability of grid prices for hydropower and wind power to ensure the financial viability of investments. Third, the transition to a high-growth state requires a fundamental shift in grid governance. We recommend transforming the role of coal-fired power from a baseload provider to a flexibility Reserve. By using market-based price signals to compensate for peak-shaving, the grid can accommodate the intermittent surges of wind and solar identified in our sensitivity analysis, thus maintaining system resilience. Finally, since carbon emission targets have become a global control indicator for the system, integrating the carbon market with the green certificate market is crucial for internalizing environmental externalities. These collaborative efforts will transform renewable energy from a subsidized auxiliary energy source into a resilient, market-driven primary power source, thus establishing a stable and certain path towards carbon neutrality.
Despite the systemic insights provided by our causal framework, several limitations remain that offer fertile ground for future investigation. First, while our Bayesian Network successfully captures the macro-level stochastic dependencies, it operates on a decadal temporal resolution. Consequently, it may under-represent short-term fluctuations in grid stability and the wave curve associated with ultra-high penetrations of intermittent solar and wind energy. Future research should aim to integrate higher-resolution dispatch models with causal BN structures to better evaluate the real-time resilience of the power system under extreme climatic events. Second, although we incorporated expert knowledge for structural calibration, the transition from administrative mandates to a fully marketized green certificate system is still in its nascent stage in China. The evolving nature of these market rules suggests that the conditional probability tables of our model will require continuous iterative updating as more granular market transaction data becomes available.
Author Contributions
S.L.: Data curation, Formal analysis, Investigation, Methodology, Software, Validation, Visualization, Product administration, Writing—Original Draft Preparation, Writing—review and editing. S.H.: Conceptualization, Formal analysis, Funding acquisition, Investigation, Supervision, Validation, Writing—original draft, Writing—review and editing. M.W.: Conceptualization, Formal analysis, Funding acquisition, Investigation, Supervision, Validation, Writing—original draft, Writing—review and editing. Y.S.: Writing—review and editing, Supervision, Software. Y.J.: Writing—review and editing, Supervision. L.T.: Writing—review and editing, Supervision, Conceptualization. All authors have read and agreed to the published version of the manuscript.
Funding
The authors are grateful to the financial support provided by the National Natural Science Foundation of China (nos. 72003195) and the State Grid Corporation of China (China) (nos. B3441024K003).
Institutional Review Board Statement
In alignment with China’s Measures for the Ethical Review of Life Science and Medical Research Involving Human Subjects (2023), this study is exempt from justifications: formal Institutional Review Board (IRB) approval based on the following: The study involves only professional expert consultations for model validation. No sensitive personal identifiers, medical data, or biological samples are collected. Participation is voluntary, anonymous, and poses no physical or psychological risk.
Informed Consent Statement
Informed consent for participation was obtained from all subjects involved in the study.
Data Availability Statement
The datasets generated and/or analyzed during this study are available from the corresponding author upon reasonable request.
Conflicts of Interest
Co-authors [Songyuan Liu, Shuaiqi Hu, and Lingfeng Tan] are employees of [State Grid Economic and Technological Research Institute, Co., Ltd.]. Co-author [Yue Song] is an employee of [State Grid Commercial Big Data Co., Ltd.].; co-author [Yichuan Jin] is an employee of [State Grid Corporation of China (China)]. The remaining author declares that the research was conducted in the absence of any commercial or financial relationships that could be construed as a potential conflict of interest. In addition, the authors declare that this study received funding from State Grid Corporation of China (China). The funders were not involved in the study design, collection, analysis, interpretation of data, the writing of this article or the decision to submit it for publication.
Appendix A. Detailed Configuration of Scenario Narratives and Counterfactual Evidences
To systematically evaluate the probabilistic response of China’s renewable energy system, seven simulation scenarios were designed based on the combinations of pivotal nodes identified through sensitivity analysis. These scenarios represent different policy intensities, technological learning rates, and market conditions. The state of each node is set as evidence e (e.g., State 1: Low, State 2: Medium, State 3: High) within the Bayesian Network.
Table A1.
Evidence Settings for the Seven Simulation Scenarios.
Appendix B. Technical Protocols for Causal Structural Learning and Expert-Informed Calibration
The construction of the causal Directed Acyclic Graph (DAG) for China’s renewable energy system followed a hybrid pipeline, integrating data-driven heuristic searching with hierarchical expert-informed constraints. This dual-layer approach ensures that the identified network reflects not only the statistical dependencies within the historical dataset (2014–2024) but also the underlying economic and physical causalities.
The K2 structural learning and subsequent parameter estimation (via Maximum Likelihood Estimation) were executed within the Full Bayesian Network Toolbox environment integrated into MATLAB (R2021a). The K2 algorithm was configured with a maximum of 7 parent nodes per variable to balance computational efficiency with causal depth. All simulations were performed on a high-performance workstation with an Intel Core i9 processor and 64 GB RAM to ensure the stability of the 1000-iteration bootstrap validation used for structural robustness testing. Given the exponential complexity of the DAG search space, we imposed a strict causal ordering constraint (πi) on the 24 identified variables, as shown in Table A2. This ordering dictates that a node Vi can only select its parents from the set {V1, V2, …, Vi−1}, effectively preventing cyclic dependencies and ensuring a temporal-logical flow.
Table A2.
Causal Priority Tiers and Variable Ordering for K2 Structural Learning.
To bridge the gap between statistical correlation and authentic causality, we conducted a structured expert consultation. We recruited 35 specialists from the domains of energy economics, grid engineering, and environmental policy to evaluate the preliminary arcs generated by the K2 algorithm. Experts were tasked with scoring the influence intensity between nodes and identifying spurious correlations.
To ensure high-fidelity calibration, we recruited a specialized panel of 35 experts through purposive sampling. The panel composition was strategically balanced: 43% from academic research institutes (focusing on energy economics), 37% from power grid enterprises (State Grid and China Southern Power Grid), and 20% from the government energy regulatory organization. And the inclusion criteria were clearly defined. Firstly, one must have at least 10 years of professional experience in power system planning or energy policy analysis. Secondly, in terms of professional expertise, one should have participated in the formulation of the national strategy or have engaged in technical and economic assessment of renewable energy. Thirdly, in terms of methodological familiarity, one should possess basic capabilities in causal inference or system dynamics modeling to ensure that the assessment of the decision outline is based on sufficient grounds.
However, experts engaged in a two-stage structural modification process. This process translated qualitative domain knowledge into concrete constraints on the Bayesian Network architecture. First, experts identified critical institutional links that the K2 algorithm omitted due to recent policy shifts. For instance, 86% of experts mandated the addition of a direct causal arc from Carbon Neutrality Targets to Solar Generation, reflecting the top-down nature of recent photovoltaic deployment that transcends historical market correlations. Second, some experts identified and removed spurious correlations that violated physical or economic logic. A notable example was the pruning of the link between Urbanization Rate and Hydropower Resource Potential, which the algorithm incorrectly identified as a causal dependency due to overlapping regional variances. Third, A modification was only integrated into the final DAG if it reached a consensus threshold of ≥75%. This collective intelligence approach effectively corrected the over-fitting tendencies of the score-based K2 search.
Meanwhile, the consistency of expert feedback was rigorously validated using Cronbach’s Alpha (α) and the Kaiser-Meyer-Olkin (KMO) test. An α value of 0.853 (>0.8) indicates high internal consistency across the scoring items, while a KMO value of 0.719 (>0.7) confirms that the sampling was adequate for structural validity, as shown in Table A3. Based on the consensus, we bifurcated the nodes into Primary Drivers (highly autonomous) and Secondary Mediators (highly responsive), ensuring the final DAG respects the hierarchical nature of China’s energy governance.
Table A3.
Psychometric Validation of the Expert Knowledge Base.
The K2 structural learning and subsequent parameter estimation (via Maximum Likelihood Estimation) were executed within the Full Bayesian Network Toolbox environment in MATLAB (R2021a). The final model parameters were cross-validated using a 10-fold scheme, ensuring that the structural dependencies and expert weights collectively minimize the log-likelihood loss while maximizing predictive precision for future scenarios.
Table A4.
Variable Discretization Schemes and Centroid-based State Definitions.
Appendix C. Backward Diagnostic Attribution of Renewable Energy Increments
To empirically identify the optimal system configurations required to achieve high-growth milestones, we performed a backward diagnostic inference by fixing the target nodes (Hydro, Wind, and Solar generation increments) at their maximum state (State 3). This diagnostic process calculates the posterior probability shifts (P) of antecedent variables, effectively mapping the causal signature of a successful energy transition. The backward propagation of evidence results in three distinct optimized Bayesian Network (referenced in the text as Figure A1, Figure A2 and Figure A3).
Figure A1.
Bayesian Network with Hydropower increment level of “3”.
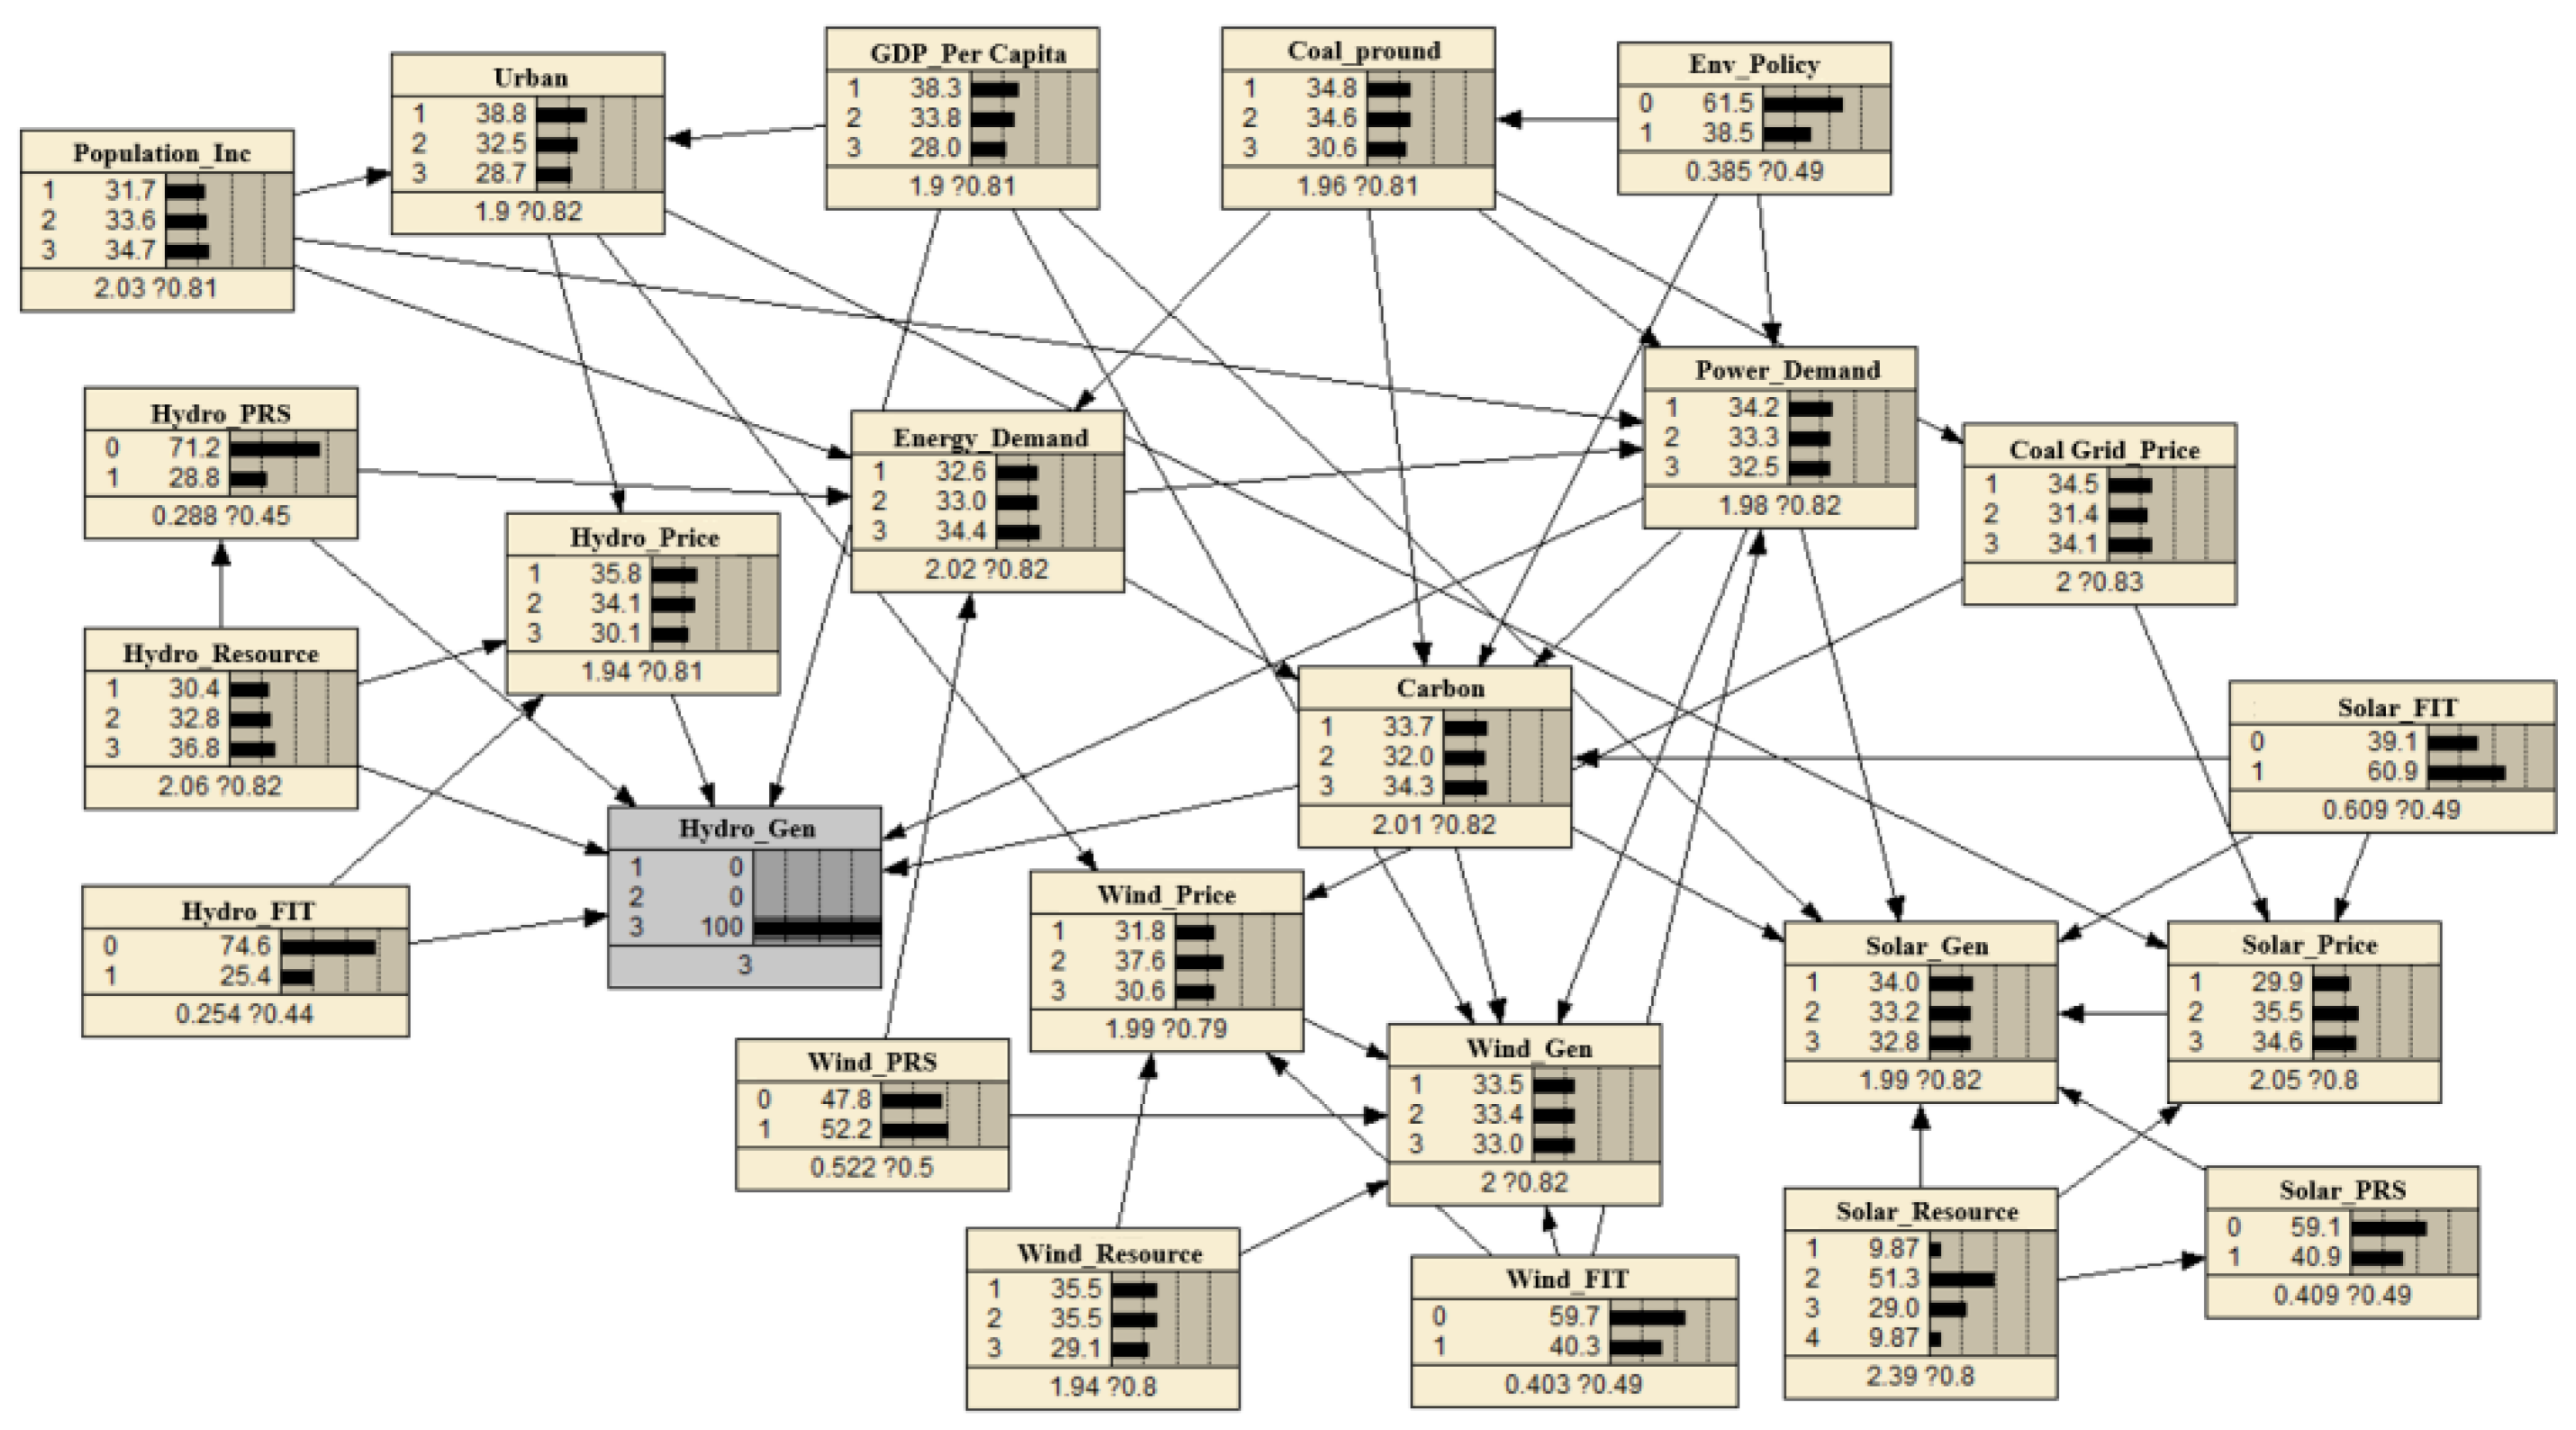
Figure A2.
Bayesian network with Wind power increment level of “3”.
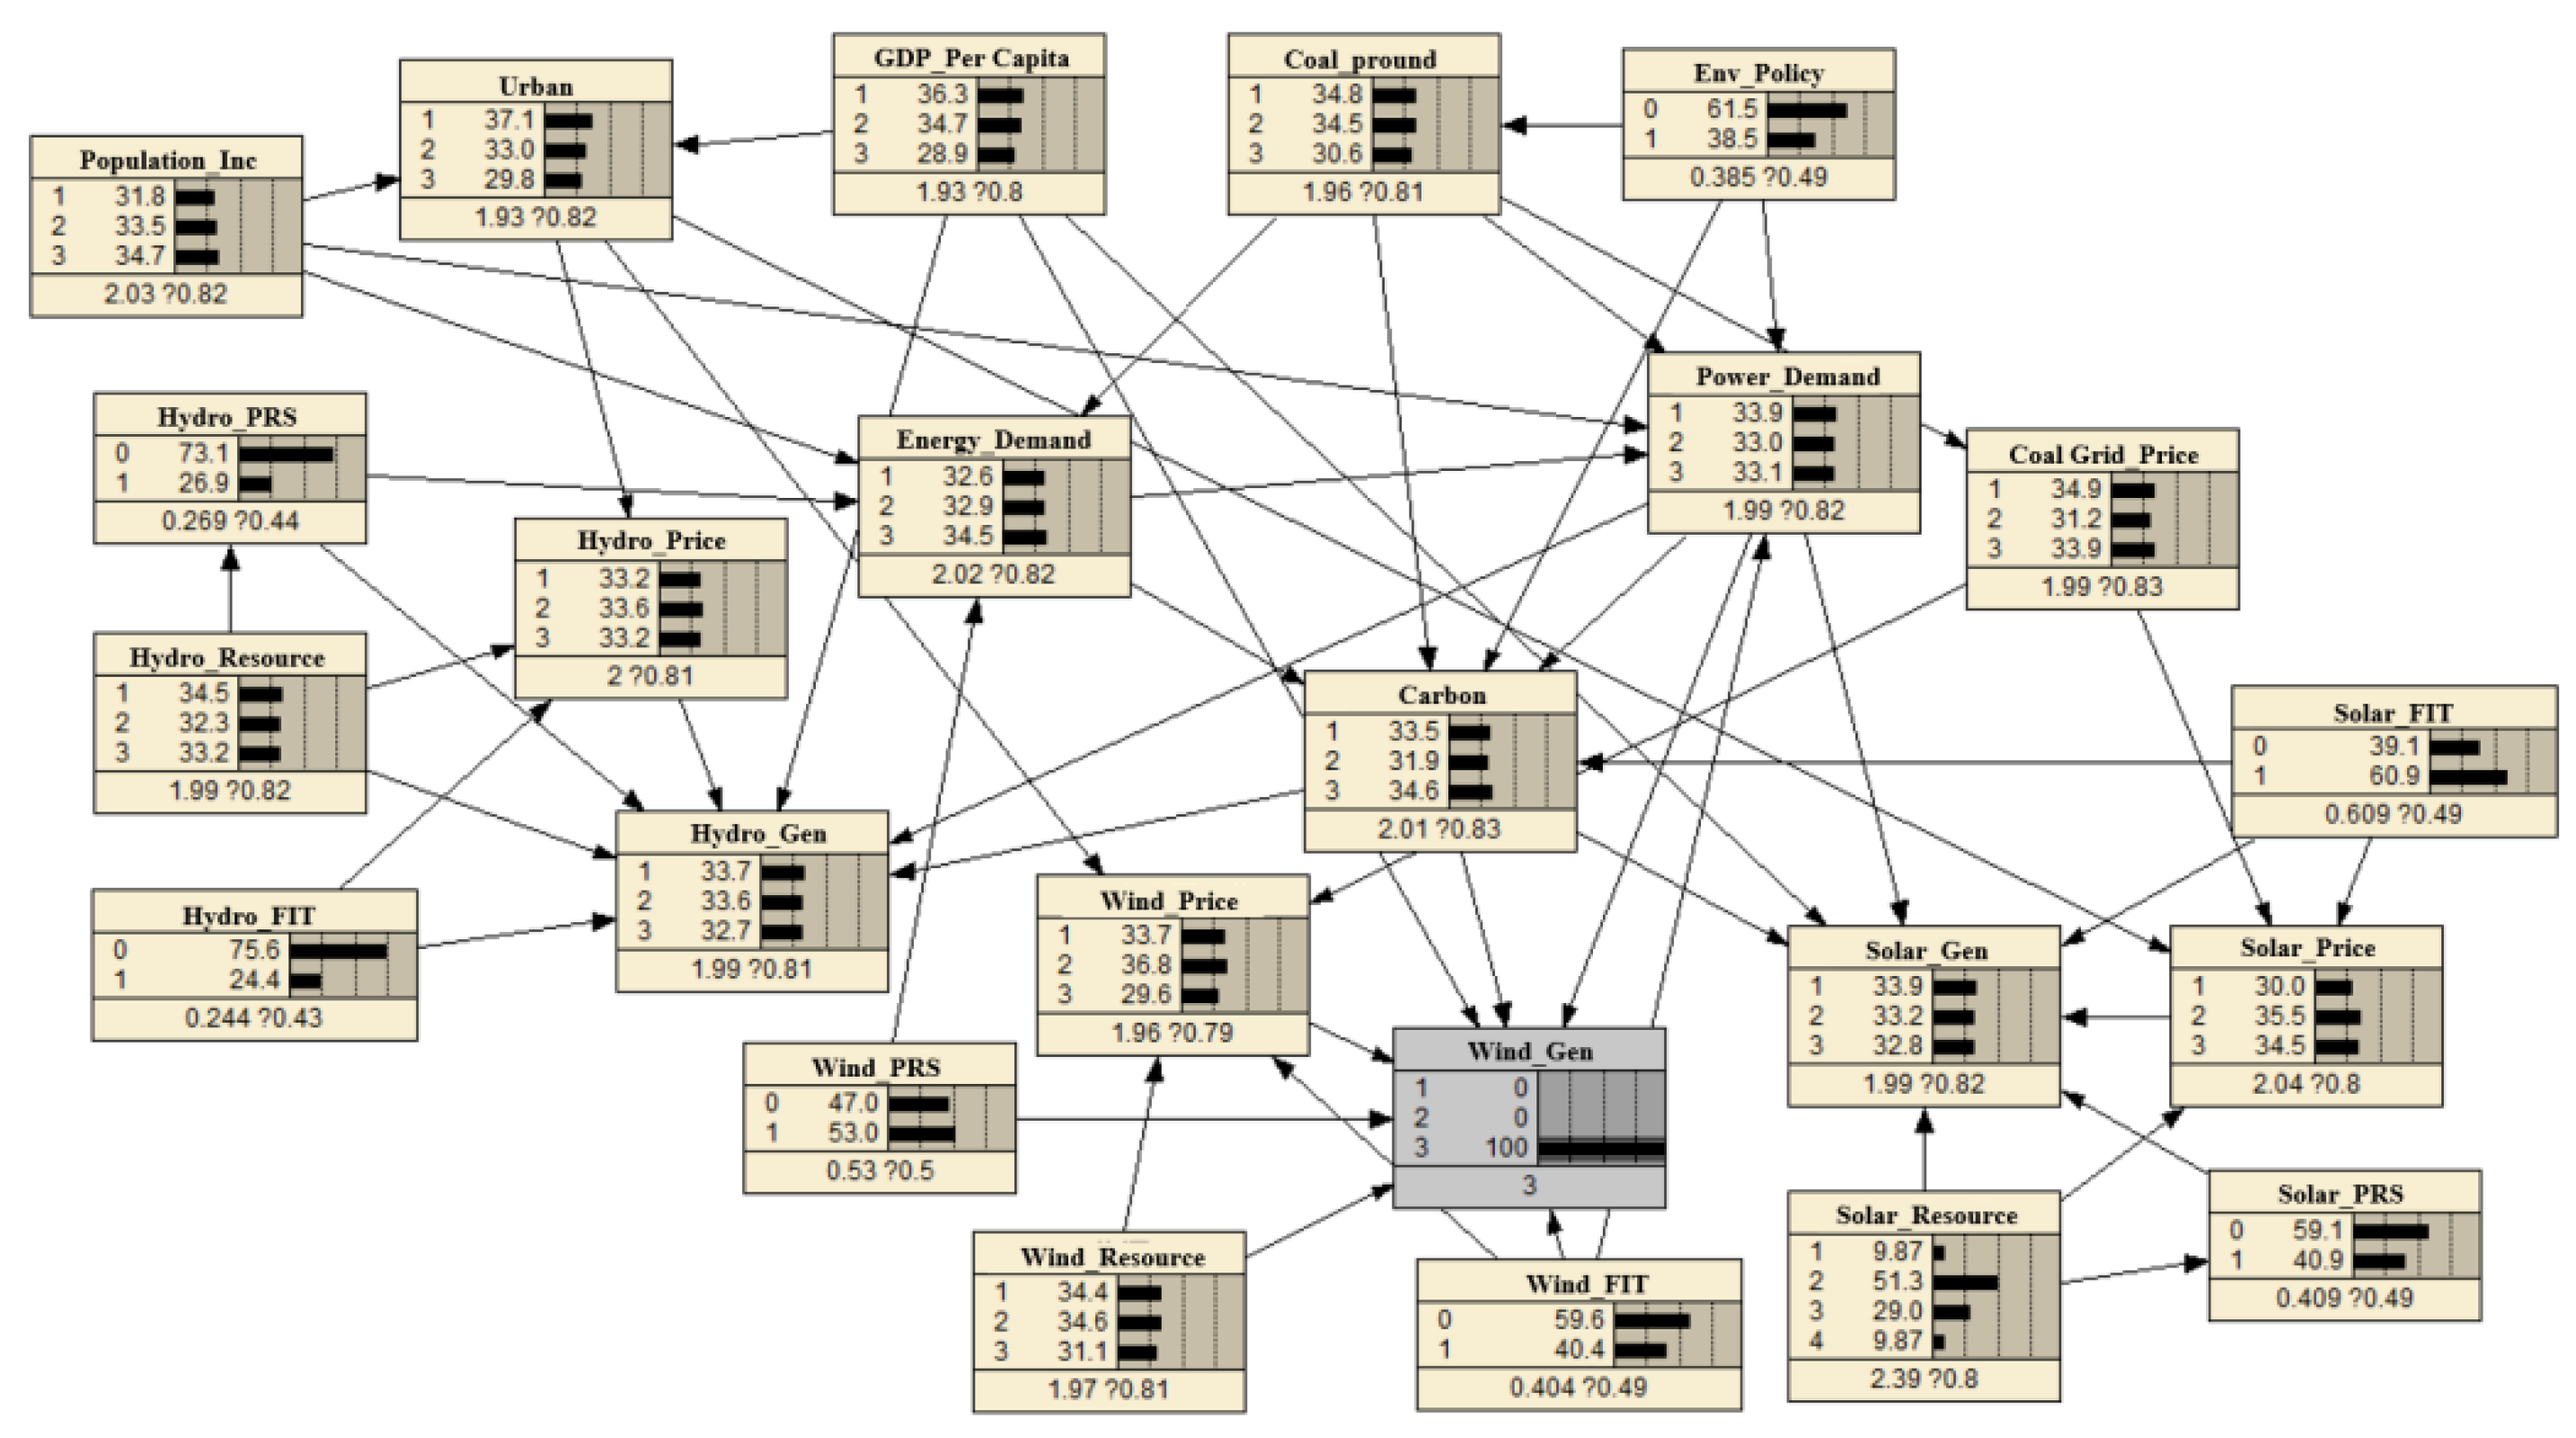
Figure A3.
Bayesian network with Solar power increment level of “3”.
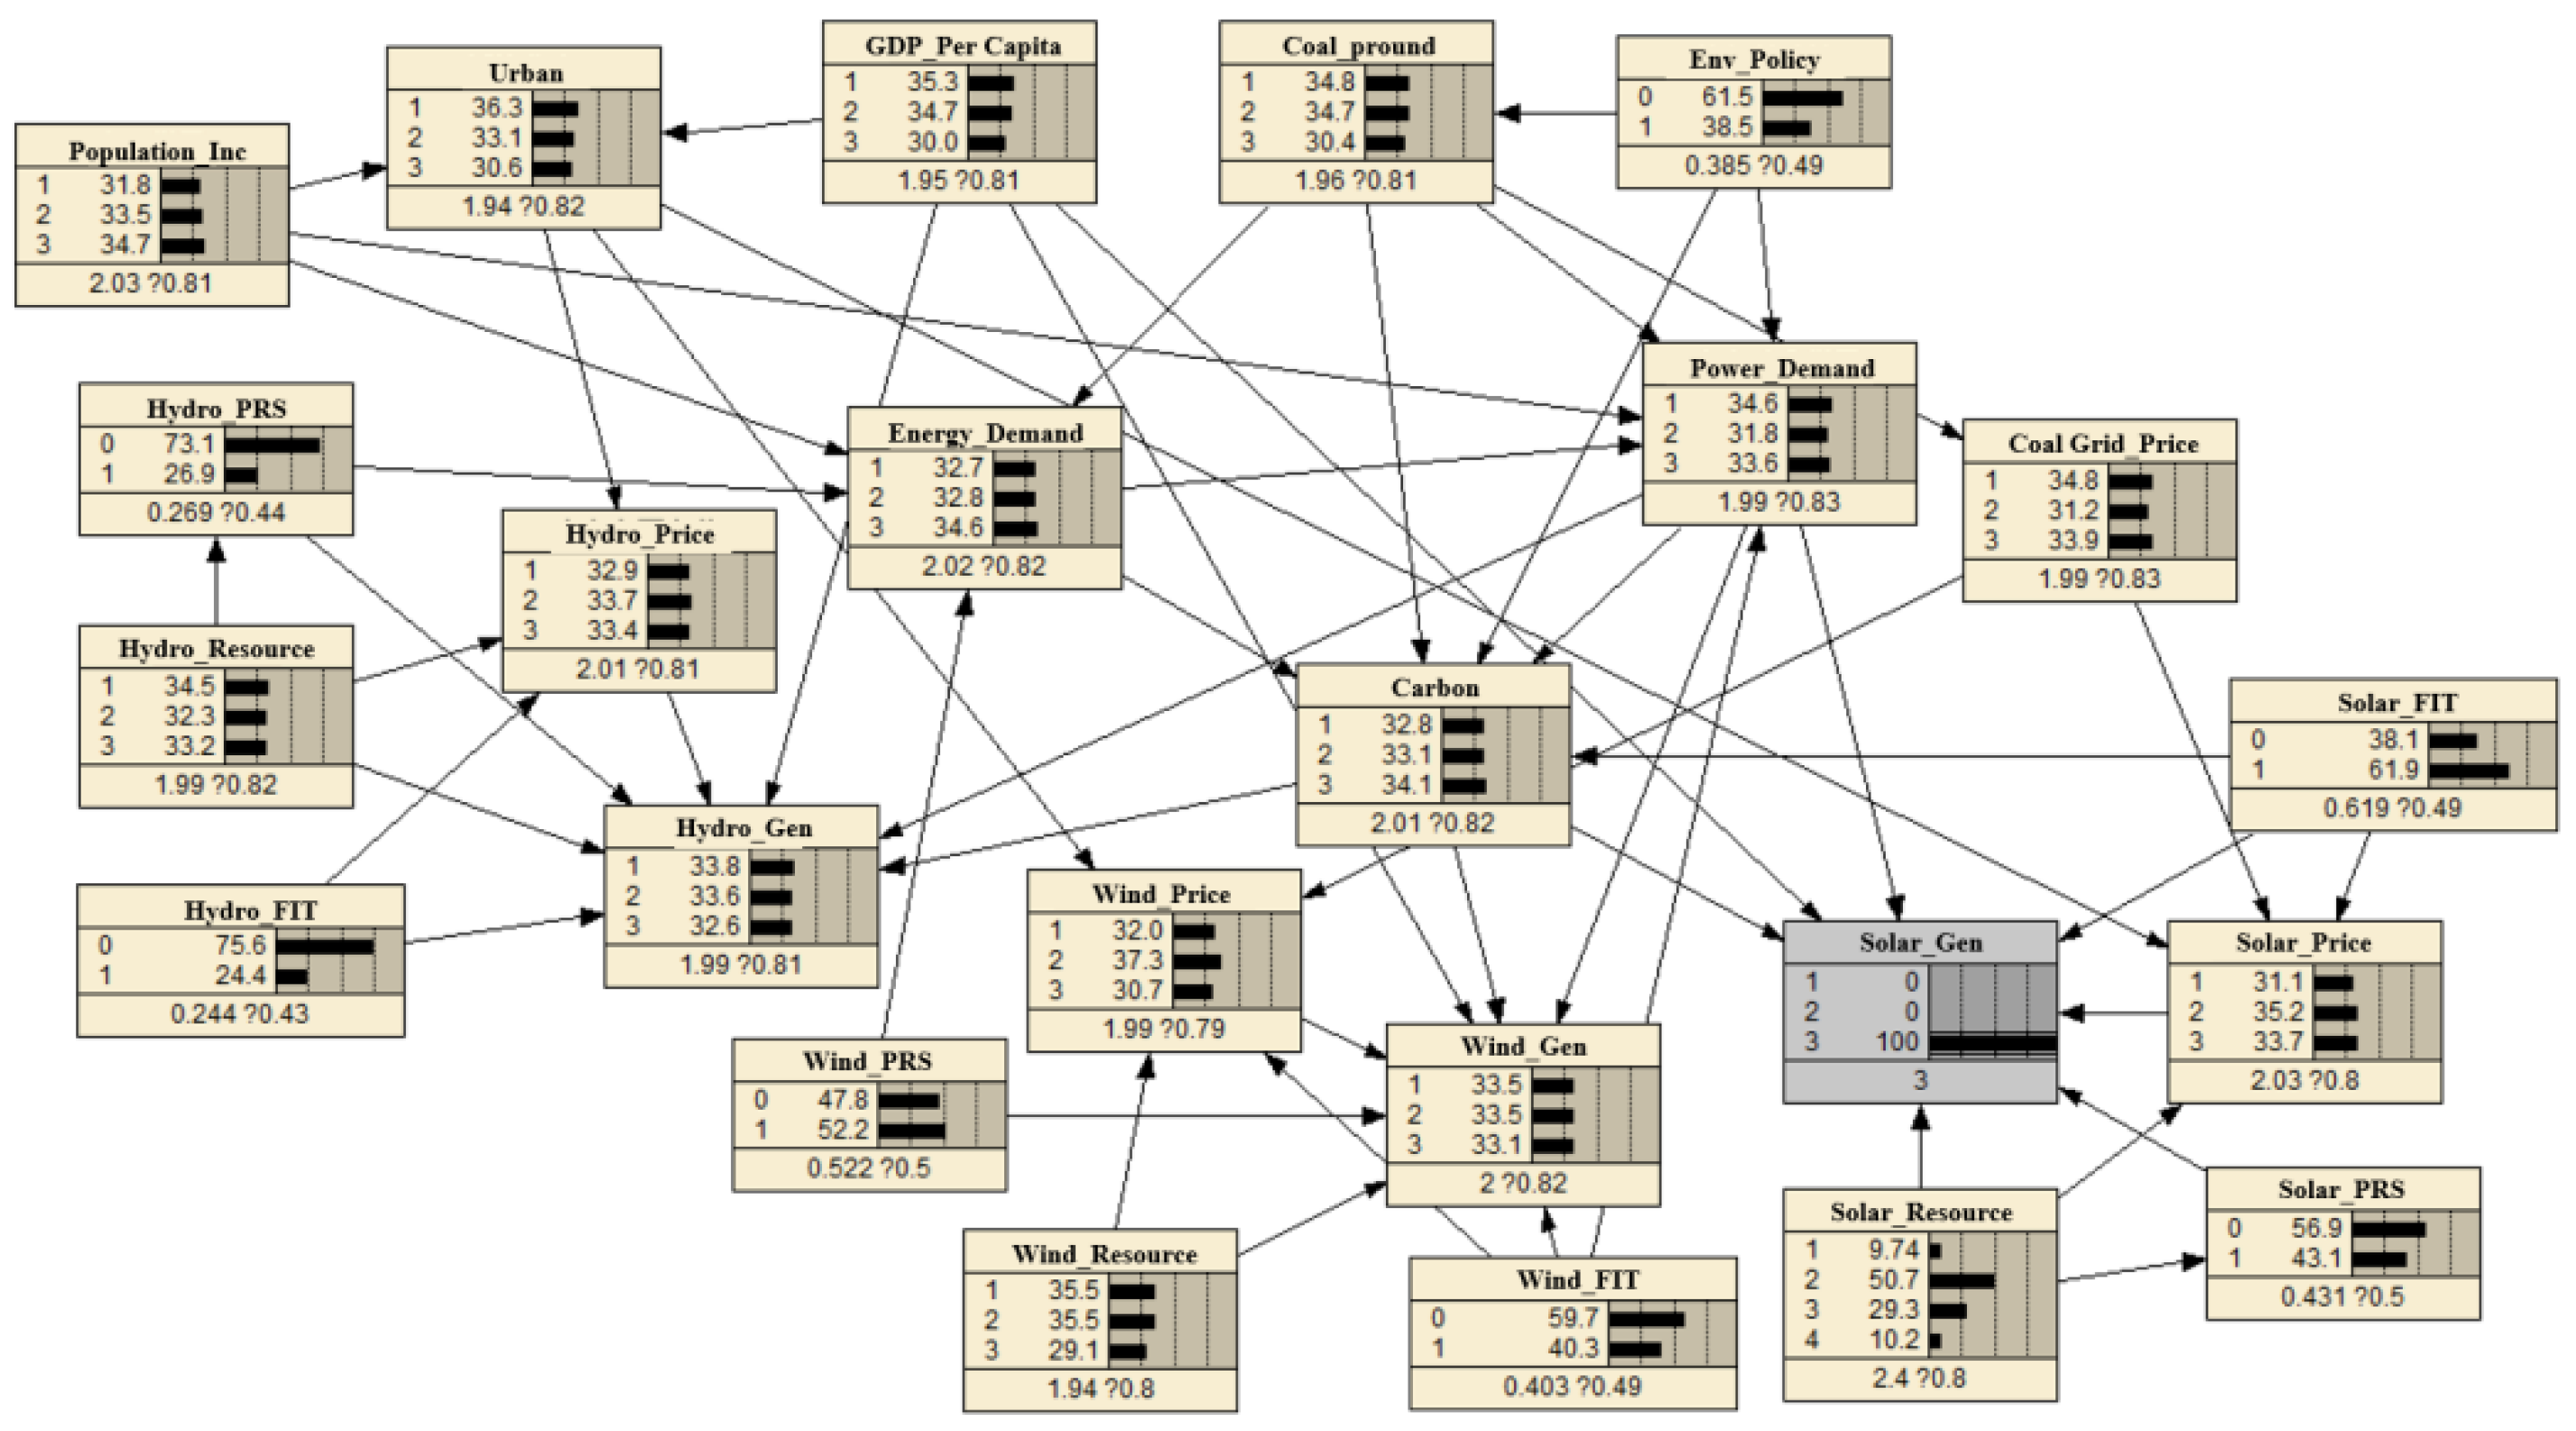
The backward diagnostic inference, as quantified in Table A5, Table A6 and Table A7, provides a high-resolution causal signature for the leapfrog growth of different renewable energy sectors.P represents the percentage change in the probability of a specific state when the generation increment is adjusted from State 1 to State 3.
As shown in Table A5, achieving high Hydropower outputs is primarily contingent on natural resource abundance, with the probability of “High” resource endowment increasing by 3.6%. Intriguingly, we observed a 2.6% increase in the probability of “Low” on-grid price, suggesting that regions with competitive pricing structures exhibit a stronger preference for hydropower deployment. It is worth noting that the diagnostic results revealed that the hydropower project has distinct socio-economic characteristics. The “Low” probabilities of both GDP per Capita and Urbanization rate have increased, which reflects the geographical concentration distribution of China’s hydropower assets in economically developed but resource-rich remote areas. In terms of policy effectiveness, although both RPS and FIT show positive promoting effects, the driving effect of RPS is significantly more prominent, which confirms its role as the main institutional stabilizer.
Table A5.
Diagnostic Attribution Results for Hydropower.
The diagnostic profile for Wind Power (as shown in Table A6) reinforces the principle of resource determinism, with high output scenarios strongly coupled with superior wind resource states (+2%). However, unlike Hydropower, Wind Power expansion shows a higher sensitivity to regional energy demand; the probabilities of “High” Electricity Demand and Carbon Emissions significantly rose, indicating that wind power deployment is increasingly pull-driven by local load centers. Furthermore, Wind Power displays a specific affinity for “Medium” GDP regions, such as Northeast and North China, highlighting its role in the energy transition of industrial heartlands. A critical policy insight is that while RPS effectively scales Wind Power production, the marginal effectiveness of current FIT schemes for high-increment scenarios appears to be plateauing, suggesting a need for market-based price refinements.
Table A6.
Diagnostic Attribution Results for Wind Power.
Diagnostic inference for Solar Power (as shown in Table A7) uncovers a transition from resource-dependency to policy-market synergy. While Solar Power is less constrained by raw solar radiation compared to Hydropower and Wind Power, it is highly responsive to institutional mandates. The implementation probability of RPS surged by 2.2% under the high scenario, significantly outweighing the impact of FIT (+1%). Socioeconomically, Solar Power exhibits a tendency to promote development, with the probability of “High” GDP per capita and Urbanization increasing by 0.9% and 0.4%, respectively. This indicates that affluent regions with advanced infrastructure and higher willingness-to-pay are the primary engines for solar integration.
Table A7.
Diagnostic Attribution Results for Solar Power.
Appendix D. Sensitivity Analysis via Variance Reduction
Sensitivity analysis in the Bayesian Network framework evaluates the degree to which changes in the state of an input node affect the probability distribution of a target node. This study utilizes the Variance Reduction (VR) metric, which computes the difference between the prior variance and its expected posterior variance. The VR is mathematically defined as follows.
where V(B) represents the prior variance of the target node B, P(b|a) is the conditional probability of B being in state b given that A is in state a. E(B) and E(B|A) denote the prior and conditional expectations of node B, respectively. A higher VR value signifies a stronger causal influence of the input variable on the target outcome. We systematically adjusted the parameters of antecedent nodes to observe the probabilistic shifts in Hydro, Wind, and Solar generation increments. The results are summarized in Table A8.
Table A8.
Sensitivity Analysis Results of Target Variables.
The VR analysis uncovers a fundamental divergence in the governance mechanisms driving China’s renewable energy portfolio, revealing a transition from resource-bound growth to policy-steered expansion. Hydropower development is characterized by a Resource Determinism paradigm, where the variance in generation is overwhelmingly dictated by physical resource endowment (VR = 1.3330‰). In this context, institutional levers such as RPS and FIT function merely as secondary stabilizing frameworks, optimizing the utilization of existing topographical and hydrological advantages rather than acting as primary catalysts for new capacity.
In contrast, wind power exhibits a dual-drive dynamic structure, representing a critical intermediary phase in the energy transition. The sensitivity profile indicates a near-equilibrium between supply-side constraints (Resource Endowment, VR = 0.7170‰) and demand-side pull factors (Electricity Consumption, VR = 0.6033‰). This suggests that wind power scalability in China is increasingly sensitive to the synchronization of meteorological potential with the load-shifting requirements of the macro-economy, making it a pivotal node for system-wide grid flexibility.
Most notably, solar power has decoupled from environmental constraints, manifesting a clear policy dependency profile. Unlike the resource-centric patterns of hydro and wind, solar generation displays its highest sensitivity to the RPS policy framework (VR = 1.0880‰), significantly outweighing the influence of natural solar radiation variance (VR = 0.1562‰). This finding provides empirical evidence that the dramatic expansion of China’s photovoltaic market is a product of institutional engineering rather than mere geographic suitability. By lowering market entry barriers and mandating consumption quotas, the current policy regime has successfully neutralized the uncertainty of solar intermittency, positioning solar energy as the most responsive asset to centralized regulatory interventions. Overall, these findings indicate that the system-wide synergy of China’s energy transition must be adjusted according to the specific causal sensitivity of each energy type.
References
- Dong, F.; Hua, Y.; Yu, B. Peak carbon emissions in China: Status, key factors and countermeasures—A literature review. Sustainability 2018, 10, 2895. [Google Scholar] [CrossRef] [Scilit]
- Wei, Y.; Zhu, R.; Tan, L. Emission trading scheme, technological innovation, and competitiveness: Evidence from China’s thermal power enterprises. J. Environ. Manag. 2022, 320, 115874. [Google Scholar] [CrossRef] [Scilit]
- Lin, B.Q.; Omoju, O.E.; Okonkwo, J.U. Factors influencing renewable electricity consumption in China. Renew. Sustain. Energy Rev. 2016, 55, 687–696. [Google Scholar] [CrossRef] [Scilit]
- Saleh, A.M.; István, V.; Khan, M.A.; Waseem, M.; Ahmed, A.N.A. Power system stability in the era of energy transition: Importance, opportunities, challenges, and future directions. Energy Convers. Manag. X 2024, 24, 100820. [Google Scholar] [CrossRef] [Scilit]
- Zhao, M.; Zhang, X.; Zhang, Q.; Luo, L. Government Subsidies and the Competitiveness of Energy Storage Enterprises: The Moderating Effect of Electricity Price. Sustainability 2025, 17, 10789. [Google Scholar] [CrossRef] [Scilit]
- Xu, X.F.; Wei, Z.F.; Ji, Q.; Wang, C.; Gao, G. Global renewable energy development: Influencing factors, trend predictions and countermeasures. Resour. Policy 2019, 63, 101470. [Google Scholar] [CrossRef] [Scilit]
- Saidi, K.; Omri, A. The impact of renewable energy on carbon emissions and economic growth in 15 major renewable energy-consuming countries. Environ. Res. 2020, 186, 109567. [Google Scholar] [CrossRef] [Scilit]
- Daim, T.; Kayakutlu, G.; Suharto, Y.; Bayram, Y. Clean energy investment scenarios using the Bayesian network. Int. J. Sustain. Energy 2014, 33, 400–415. [Google Scholar] [CrossRef] [Scilit]
- Bao, C.; Fang, C.L. Geographical and environmental perspectives for the sustainable development of renewable energy in urbanizing China. Renew. Sustain. Energy Rev. 2013, 27, 464–474. [Google Scholar] [CrossRef] [Scilit]
- Xu, X.L.; Chen, H.H.; Feng, Y.; Tang, J. The production efficiency of renewable energy generation and its influencing factors: Evidence from 20 countries. J. Renew. Sustain. Energy 2018, 10, 025901. [Google Scholar] [CrossRef] [Scilit]
- Aguirre, M.; Ibikunle, G. Determinants of renewable energy growth: A global sample analysis. Energy Policy 2014, 69, 374–384. [Google Scholar] [CrossRef] [Scilit]
- Ankrah, I.; Lin, B.Q. Renewable energy development in Ghana: Beyond potentials and commitment. Energy 2020, 198, 117356. [Google Scholar] [CrossRef] [Scilit]
- Rosenberg, E.; Lind, A.; Espegren, K.A. The impact of future energy demand on renewable energy production-Case of Norway. Energy 2013, 61, 419–431. [Google Scholar] [CrossRef] [Scilit]
- Milanés-Montero, P.; Arroyo-Farrona, A.; Pérez-Calderón, E. Assessment of the Influence of Feed-In Tariffs on the Profitability of European Photovoltaic Companies. Sustainability 2018, 10, 3427. [Google Scholar] [CrossRef] [Scilit]
- Ko, W.; Al-Ammar, E.; Almahmeed, M. Development of Feed-in Tariff for PV in the Kingdom of Saudi Arabia. Energies 2019, 12, 2898. [Google Scholar] [CrossRef] [Scilit]
- Mamkhezri, J.; Malczynski, L.A.; Chermak, J.M. Assessing the Economic and Environmental Impacts of Alternative Renewable Portfolio Standards: Winners and Losers. Energies 2021, 14, 3319. [Google Scholar] [CrossRef] [Scilit]
- Zhao, Z.Y.; Chen, Y.L. Critical factors affecting the development of renewable energy power generation: Evidence from China. J. Clean. Prod. 2018, 184, 466–480. [Google Scholar] [CrossRef] [Scilit]
- Chen, F.; Wang, L. On Distribution and Determinants of PV Solar Energy Industry in China. Resour. Sci. 2012, 34, 287–294. [Google Scholar]
- Fatima, N.; Li, Y.; Ahmad, M.; Jabeen, G.; Li, X. Factors influencing renewable energy generation development: A way to environmental sustainability. Environ. Sci. Pollut. Res. 2021, 28, 51714–51732. [Google Scholar] [CrossRef] [Scilit]
- Marques, A.C.; Fuinhas, J.A.; Manso, J. Motivations driving renewable energy in European countries: A panel data approach. Energy Policy 2010, 38, 6877–6885. [Google Scholar] [CrossRef] [Scilit]
- Cano, R.; Sordo, C.; Gutiérrez, J.M. Applications of Bayesian networks in meteorology. Adv. Bayesian Netw. 2004, 146, 309–328. [Google Scholar]
- Feng, Y.; Xu, Q.; Li, C. A Novel Intelligent Prediction Model for Higher Heating Value of Sustainable Solid Biomass Fuel Based on Bayesian Optimized Deep Neural Network. Sustainability 2026, 18, 1921. [Google Scholar] [CrossRef] [Scilit]
- Sapitang, M.; Ridwan, W.M.; Faizal Kushiar, K.; Najah Ahmed, A.; El-Shafie, A. Machine Learning Application in Reservoir Water Level Forecasting for Sustainable Hydropower Generation Strategy. Sustainability 2020, 12, 6121. [Google Scholar] [CrossRef] [Scilit]
- Wang, Q.; Dai, H.-N.; Wang, H. A Smart MCDM Framework to Evaluate the Impact of Air Pollution on City Sustainability: A Case Study from China. Sustainability 2017, 9, 911. [Google Scholar] [CrossRef] [Scilit]
- Shrivastava, V.; Misra, R.B. Development of Bayesian belief network model for electrical load demand. Int. J. Syst. Assur. Eng. Manag. 2010, 1, 170–177. [Google Scholar] [CrossRef] [Scilit]
- Hellman, S.; McGovern, A.; Xue, M. Learning ensembles of Continuous Bayesian Networks: An application to rainfall prediction. In 2012 Conference on Intelligent Data Understanding; IEEE: New York, NY, USA, 2012; pp. 112–117. [Google Scholar]
- Simsekler, M.C.E.; Qazi, A. Adoption of a data-driven Bayesian belief network investigating organizational factors that influence patient safety. Risk Anal. 2022, 42, 1277–1293. [Google Scholar] [CrossRef] [Scilit]
- Erdmann, L.; Hilty, L.M. Scenario Analysis: Exploring the Macroeconomic Impacts of Information and Communication Technologies on Greenhouse Gas Emissions. Soc. Sci. Electron. Publ. 2010, 14, 826–843. [Google Scholar] [CrossRef] [Scilit]
- Ankaya, S.; Pekey, B. Application of scenario analysis for assessing the environmental impacts of thermal energy substitution and electrical energy efficiency in clinker production by life cycle approach. J. Clean. Prod. 2020, 270, 122388. [Google Scholar] [CrossRef] [Scilit]
- Carley, S. State renewable energy electricity policies: An empirical evaluation of effectiveness. Energy Policy 2009, 37, 3071–3081. [Google Scholar] [CrossRef] [Scilit]
- Sadorsky, P. Renewable energy consumption, CO2 emissions and oil prices in the G7 countries. Energy Econ. 2009, 31, 456–462. [Google Scholar] [CrossRef] [Scilit]
- Landuyt, D.; Broekx, S.; Engelen, G.; Uljee, I.; Van der Meulen, M.; Goethals, P.L. The importance of uncertainties in scenario analyses-A study on future ecosystem service delivery in Flanders. Sci. Total Environ. 2016, 553, 504–518. [Google Scholar] [CrossRef] [Scilit] [PubMed]
- Uzar, U. Political economy of renewable energy: Does institutional quality make a difference in renewable energy consumption? Renew. Energy 2020, 155, 591–603. [Google Scholar] [CrossRef] [Scilit]
- Dua, R.; Shabaneh, R. An expert opinion-based perspective on emerging policy and economic research priorities for advancing the low-carbon hydrogen sector. Energy Sustain. Dev. 2025, 88, 101774. [Google Scholar] [CrossRef] [Scilit]
- Sheldon, T.; Dua, R. A perspective on the evolving plug-in electric vehicle landscape amid trade tariffs and strategic responses. Energy Res. Soc. Sci. 2025, 127, 104327. [Google Scholar] [CrossRef] [Scilit]
Disclaimer/Publisher’s Note: The statements, opinions and data contained in all publications are solely those of the individual author(s) and contributor(s) and not of MDPI and/or the editor(s). MDPI and/or the editor(s) disclaim responsibility for any injury to people or property resulting from any ideas, methods, instructions or products referred to in the content. |
© 2026 by the authors. Licensee MDPI, Basel, Switzerland. This article is an open access article distributed under the terms and conditions of the Creative Commons Attribution (CC BY) license.