


Abstract
This study analyzes the evolution of rural welfare vulnerability among agricultural households in Peru under the influence of extreme climate events, particularly those associated with the El Niño–Southern Oscillation. The research employs a Socio-Climatic Vulnerability Index (SCVI) constructed from microdata of the National Household Survey (ENAHO) covering the period 2000–2018. Using a longitudinal and territorial perspective, the study evaluates how climate shocks affect household welfare dynamics across Peru’s major geographic regions. The results show that extreme weather events systematically increase rural vulnerability in the years they occur, followed by partial recovery in subsequent periods, indicating temporary but recurrent welfare disruptions. Significant regional heterogeneity is observed. Coastal departments exhibit increasing vulnerability linked to hydro-meteorological exposure and rapid territorial expansion. The Andean region shows the highest and most volatile vulnerability levels due to geographic isolation, infrastructure constraints, and persistent socioeconomic inequalities. Amazonian regions present relatively lower initial vulnerability but display gradual increases associated with climate variability and limited connectivity. Decomposition of the SCVI reveals that improvements in demographic and educational conditions contribute positively to resilience, whereas the productive-economic dimension remains highly sensitive to climatic shocks. Although agricultural households demonstrate adaptive responses and coping strategies, structural gaps hinder full welfare recovery. These findings highlight the need for territorially differentiated climate adaptation policies that strengthen human capital, diversify rural livelihoods, and improve institutional support to enhance long-term resilience in vulnerable rural communities.
1. Introduction
The impact of climate change is complex and ever-changing, generating significant uncertainty in the global economy. In this regard, forecasts by the Intergovernmental Panel on Climate Change (IPCC) indicate that as the global average temperature has increased, climate change has intensified the risks of droughts, extreme temperatures, and persistent storms [1]. The IPCC further highlights that climate change has reduced food security and compromised water security, thereby hindering progress toward the Sustainable Development Goals. These changes have caused substantial environmental damage and have adversely affected livelihoods worldwide, particularly in the agricultural sector. Kim et al. [2] highlight the imminent threat of climate disaster, characterized by an unprecedented increase in global surface temperature that is expected to generate profound challenges for human productivity, health, and well-being. Similarly, Zakharova et al. [3] estimate that Gross Domestic Product (GDP) growth losses could reach approximately 2% by 2060 as a result of projected temperature increases (1.5–4.5 °C), with the primary drivers of this contraction being negative public health outcomes and damage to agriculture. With respect to global agriculture, Hultgren et al. [4] demonstrate that producers may respond to changing environmental conditions through a range of adaptive strategies. However, these responses depend on access to improved technologies, infrastructure, banking services, credit, and insurance, all of which influence producer decision-making. Despite the expansion of global research on agricultural productivity risks associated with climate change, it remains crucial to recognize that the most severe impacts are likely to occur in developing countries, where research gaps persist.
Climate change constitutes a systemic challenge to the agricultural sector, particularly given its close relationship with rural poverty, precarious livelihoods, and overall well-being. These conditions are especially vulnerable when climate variability directly affects agriculture as the primary means of production. Previous studies have quantified the vulnerability of agricultural households to extreme climate events from both economic and social perspectives, emphasizing the strong interdependence between rural poverty and food insecurity, given that agriculture represents the main source of income for rural populations [5,6]. The findings indicate that increased frequency and intensity of extreme weather events heighten vulnerability, particularly among impoverished populations in developing countries. Accordingly, it is essential to examine more closely the differentiated and sometimes contradictory effects that extreme climatic events exert on agricultural communities. Tesema et al. [7] emphasize that designing effective adaptation policies for the agricultural sector requires a thorough understanding of the specific adjustments and resilience strategies that farmers employ to manage climate-related challenges. Similarly, Li et al. [8] analyze rural resilience in developing countries under conditions of climate volatility and identify adverse effects that not only reduce household economic growth rates but also increase economic volatility, thereby elevating consumption risk. In light of this evidence, it can be argued that structural deficiencies within developing economies, combined with limited institutional capacity to support impoverished populations, disproportionately affect the most vulnerable segments of society, particularly in their ability to adapt to and mitigate climate-related shocks.
Extreme events such as droughts, storms, and recurrent pest outbreaks directly affect household income, agricultural employment stability, and food security, generating temporary or permanent declines in living standards [9]. Given these dynamics, there is a clear need for mechanisms that comprehensively assess rural welfare by incorporating not only current living conditions but also adaptive capacity, resilience, and vulnerability to climate shocks [10]. In this context, Iskandar et al. [11] recently examined global research trends on the relationship between social vulnerability and climate change, seeking to understand the susceptibility of individuals, households, and communities to climate hazards arising from underlying socioeconomic conditions and limited adaptive capacity. Their findings underscore the importance of adopting a holistic approach that integrates political-economic dynamics, societal needs, and environmental factors, particularly in developing countries, in order to design locally appropriate adaptation strategies. Furthermore, Balestri [12] explores the relationship between climate change vulnerability and multidimensional poverty, demonstrating that countries with higher climate sensitivity systematically exhibit higher levels of multidimensional poverty, particularly during extreme climate events. These interconnections have also been documented in empirical studies of rural communities, which confirm that multidimensional poverty and climate vulnerability co-vary, resulting in limited adaptive capacity and constrained natural and financial assets, thereby increasing household risk during climate-related disasters such as floods and droughts [13,14,15]. Consequently, nations and regions with elevated climate vulnerability frequently display disproportionately high levels of multidimensional poverty. This pattern highlights the importance of deepening our understanding of the interrelationships between climate exposure and structural social conditions.
Previous empirical research documents a range of methodological approaches used in vulnerability assessments to analyze interactions between human systems and their social and physical environments. Zainab and Shah [16] compare different indices employed to measure climate vulnerability in developing countries (e.g., the Livelihood Vulnerability Index and the Sustainable Livelihood Framework), outlining their characteristics, advantages, and limitations. Regarding index adaptability, existing research demonstrates that vulnerability indexes have been continuously modified to suit specific study objectives and data availability. Empirical findings from Rai et al. [17] and Wangmo et al. [18] show that the Livelihood Vulnerability Index (LVI) and the LVI-IPCC (Intergovernmental Panel on Climate Change) framework do not consistently produce convergent results. This divergence underscores the necessity of evaluating contextual vulnerability conditions when designing climate change interventions. Moreover, scholars emphasize the importance of incorporating local knowledge in indicator selection to ensure that vulnerability measures accurately reflect lived experiences of climate shocks.
This study seeks to assess social vulnerability to extreme weather events among rural agricultural households in Peru in order to quantify and monitor household welfare within a framework of climate risk. The proposed index represents an adaptation of existing social and climate vulnerability indexes [10,19,20,21,22,23,24] and is conceptualized as a Socio-Climatic Vulnerability Index (SCVI). The SCVI is evaluated across five periods corresponding to cyclical extreme weather events, including phases of the El Niño–Southern Oscillation (ENSO), and analyzes changes in rural household welfare during periods of climatic shock and subsequent recovery. Geographic variables are incorporated to assess the spatial distribution of welfare and its association with areas of heightened climate vulnerability. This methodological framework pursues two principal objectives: (i) to describe changes in rural household well-being within a climate risk context by assessing patterns of recovery and deterioration, and (ii) to identify socio-climatic vulnerability based on the spatial distribution and time period under evaluation across Peruvian regions.
1.1. A Look at Peruvian Agricultural Households and Their Vulnerability to Climate Change
In the Peruvian context, the 2012 National Agricultural Census [25] reports that family farming represents 97% of the country’s 2.2 million agricultural units and employs more than 3 million workers, accounting for 83% of the national agricultural labor force of 3.8 million. Maletta [26] similarly observes that the Peruvian agricultural sector is characterized by the predominance of family farms, numbering approximately 2.19 million. Of these, 72% are classified as subsistence or sub-subsistence operations, 19% fall into an intermediate category representing a transition toward surplus production, and only 5% are categorized as surplus producers. Aragón et al. [27] find that agricultural households engaged in subsistence farming are disproportionately poor and depend primarily on agriculture as their main source of income. This dependence renders them highly vulnerable to climate variability, as adverse weather events directly reduce agricultural output and income. Consequently, the interrelationship between agricultural poverty and climate change presents significant challenges for food security, rural economic stability, and environmental sustainability.
Trivelli [28] notes that family farming accounts for 95% of agricultural producers nationwide and constitutes the primary driver of the domestic food supply. Within this context, a dynamic relationship emerges between the adverse effects of extreme weather events and long-term production outcomes among family farmers [29,30]. Several structural vulnerabilities may hinder the implementation of preventive measures to address climate change impacts. These include limited trust between farmers and public or private institutions, which negatively affects farmers’ perceptions regarding access to and use of specialized climate information, thereby generating persistent information gaps [29]. Given the pronounced heterogeneity of agricultural conditions across Peru, climate impacts must be analyzed through a territorial approach [31,32]. Such an approach enables the design of differentiated policy strategies tailored to the specific characteristics, risks, and development potential of local contexts. Because the vast majority of Peruvian agricultural households depend on farming as their principal source of income, extreme weather events may generate substantial income losses and reductions in household consumption among the most vulnerable groups. These dynamics contribute to the persistence and deepening of agricultural poverty.
Regarding Peru’s broader exposure to climate events, the country is highly vulnerable due to its diverse geographic and climatic conditions, as well as its recurrent exposure to periodic fluctuations in extreme weather phenomena such as ENSO [33,34]. In 2017, an ENSO event had a significant negative impact on national economic performance, reducing GDP growth due to severe damage to agricultural infrastructure in coastal regions and disruptions to transportation and commercialization routes [35]. This episode underscores the structural vulnerability of the agricultural sector across multiple regions of the country. Peru is also exposed to other cyclical extreme weather events, including ENSO-related episodes [29,34]. Depending on their intensity, such climate shocks can compromise farm viability and threaten the sustainability of agricultural units, particularly smallholder farms [30,36]. Consistent with this evidence, a report by the Central Reserve Bank of Peru [37] indicates that among populations residing in territories directly affected by ENSO, the probability that households incur expenditures below the monetary poverty line increases in the immediate aftermath of the event. Accordingly, systematically quantifying and monitoring the well-being of rural agricultural households from a multisectoral perspective, while accounting for the specific preconditions of each territory, facilitates the design of targeted strategies aimed at supporting the most vulnerable agricultural households and promoting inclusive rural development policies.
1.2. The Effects of Extreme Weather Events: Coastal El Niño in Peru
According to Takahashi et al. [38], ENSO involves a warming of sea surface temperatures off the northern coast of Peru and is typically characterized by intense rainfall and flooding in affected regions. For this reason, ENSO is considered an extreme weather event, given its capacity to produce dramatic shifts in climatic conditions across the country, affecting not only directly exposed areas but also more distant regions. Research by Yglesias-González et al. [35] reports that during the 2017 ENSO event, ranked third in historical impact according to official records, river overflows caused by elevated water flows significantly affected the health and socioeconomic well-being of approximately 1.9 million people nationwide. These events led to the displacement of nearly 194,000 individuals and caused damage to more than 300,000 homes.
More broadly, analyses of vulnerability to extreme weather events in Peru provide diverse perspectives on the adaptation and mitigation strategies available to the agricultural sector [29,39]. Because climate events such as ENSO can impair households’ future income-generating capacity, examining their effects on the socio-climatic vulnerability of agricultural households is essential for economic, social, and environmental reasons. In particular, investigating the impact of extreme climate events on household consumption contributes to the development of mitigation and adaptation strategies designed to prevent long-term economic insecurity [40,41,42]. Rural welfare constitutes a central dimension of human development in predominantly agricultural and geographically dispersed territories, where the interaction among socioeconomic conditions, household productive capacity, and exposure to climatic hazards produces complex vulnerability dynamics [43,44,45]. From a broader perspective, cyclical extreme weather events such as ENSO in developing countries affect not only agricultural and livestock production but also generate wider social consequences, especially within rural communities [46].
2. Materials and Methods
2.1. Data
This study draws on data from the National Household Survey (ENAHO, by the acronyms in Spanish) conducted by the National Institute of Statistics and Informatics (INEI, by the acronyms in Spanish), covering the period 2000–2018 [47,48,49,50,51,52,53,54,55,56]. The initial integrated dataset comprised 654,377 household records. In the first stage of data processing, the database was restricted to the years defined as temporal layers corresponding to the occurrence and post-occurrence periods of the ENSO phenomenon (T1–T5), consistent with the study’s temporal design. In the second stage, the sample was limited to households that reported having been affected by at least one extreme weather event during the previous twelve months, thereby ensuring the analytical relevance of the dataset for measuring socio-climatic vulnerability. In the third stage, the analytical universe was further restricted to households engaged in agricultural activities, as the study focuses specifically on rural production systems exposed to climate shocks.
In order to ensure consistency between sociodemographic characteristics and household production patterns, the analysis was subsequently limited to heads of household, who constitute the primary decision-making unit within the family’s production system. At this stage, the relevant variables for the analysis of socio-climatic vulnerability were selected, including sociodemographic characteristics, indicators of productive capacity, and variables related to responses to climate events. These variables subsequently entered a cleaning and validation process, which entailed verifying category consistency, identifying and handling missing values, removing records with incomplete information, and excluding inconsistent values. The subsequent application of these criteria resulted in a dataset that comprised 82,295 observations of heads of household exclusively. Following the sequential application of a set of analytical filters, the final sample consisted of 11,288 valid observations, as displayed in Figure 1. The specific regulations implemented in this process are outlined in Supplementary Section S1.
Figure 1.
Flow diagram of sample selection for the study. Source: Prepared by the authors.
2.2. Coverage and Stratification
Table 1 presents an analysis that covers the entire national territory and accounts for ecological heterogeneity and temporal variations in exposure to natural disasters [30]. As shown in Table 1, the coastal and mountainous regions in the northern part of the country, areas directly affected during ENSO episodes, are those in which agricultural activity is most vulnerable to climate risk.
Table 1.
Level of agricultural risk to extreme weather events by Peruvian region.
Temporal Layers
The temporal layers selected for this study correspond to the years in which the El Niño Coastal Index (ICEN, by its Spanish acronym) officially declared the occurrence of ENSO. The ICEN is used for the official diagnosis of El Niño and La Niña events in Peru [38] and serves as a reliable indicator of regional climate variability in the eastern equatorial Pacific Ocean, particularly in the areas off the coasts of Ecuador and northern Peru.
Table 2 provides a comprehensive overview of the temporal layers corresponding to specific ENSO episodes, together with their immediate post-occurrence periods, within the time frame 2000–2018. The study focuses on this period because the ENAHO survey [47,48,49,50,51,52,53,54,55,56] included the information-collection module “Adverse Situations” during these years (ENAHO 2000 [47]- MODULE 85. Question—In the last 12 months, was your household affected by natural disasters (drought, storm, pest infestation, flooding, etc.)?). Each temporal layer (e.g., T1 = 2000–2001) consists of two consecutive years: the first corresponds to the year of ENSO occurrence, and the second represents the post-occurrence phase, during which processes of recovery, adjustment, or adaptation in productive and social systems are expected to unfold.
Table 2.
Temporal structure of the phases of the ENSO phenomenon (2000–2018).
This temporal design enables the integrated analysis of both the direct impacts associated with the climatic event (ENSO) and the lagged effects that may persist beyond the year of the shock. Furthermore, grouping years into two-year periods reduces interannual variability and is particularly appropriate for analyzing climatic phenomena whose effects on agriculture and rural well-being extend beyond a single calendar year.
2.3. Socio-Climatic Vulnerability Index (SCVI)
The SCVI is designed within the literature on multidimensional measurement of climate vulnerability, which has been extensively developed through approaches that integrate exposure, sensitivity, and adaptive capacity [17,18,19]. However, many existing indices rely on aggregated information at the national or regional level, limiting their capacity to capture intra-territorial heterogeneity and the specific interactions between socioeconomic conditions and local productive systems [57,58]. In this context, assessing risks from climate variability could introduce a relevant methodological from agricultural households, thereby enabling a more detailed assessment of socio-climatic vulnerability and its structural determinants. This integration is of particular importance in rural contexts, where vulnerability is influenced by a combination of household social conditions and their integration into productive systems that are highly sensitive to climate variability [20,59,60,61,62,63].
2.3.1. Conceptual Dimensions
The SCVI is conceived as a multidimensional synthetic indicator designed to assess the quality of life and adaptive capacity of agricultural households in the face of climatic, economic, and social shocks. Its formulation is grounded in socio-ecological resilience and multidimensional well-being frameworks, which recognise that rural development cannot be explained solely by income levels, but must also account for access to resources, education, health, social cohesion, and environmental exposure [20,23,62].
From a conceptual standpoint, the index adopts a multidimensional approach to well-being and socio-ecological resilience, recognizing that rural welfare under climate stress results from the interaction among human capital, productive capacity, adaptation strategies, and exposure to climate risks [10,19,20]. Empirically, the selection of indicators is determined by the availability, consistency, and comparability of data provided by ENAHO, one of the principal sources for analyzing rural household welfare and vulnerability in Peru [47,48,49,50,51,52,53,54,55,56].
In contexts characterized by family-based and subsistence agriculture, the literature has extensively documented the limitations of net income as a measure of well-being. These limitations arise from informality, self-consumption, and the difficulty of valuing non-monetary costs, particularly family labor [63]. For this reason, the present study prioritizes productive, demographic, and coping-related variables that are systematically collected over time, exhibit stable measurement properties, and have been widely validated as appropriate proxies for well-being, resilience, and vulnerability in rural and climate-sensitive contexts [22,23,24].
2.3.2. Structural Dimensions of the Index
The index is structured around four analytical dimensions, each representing a key component of rural welfare in vulnerable agricultural contexts [20,64,65]. Table 3 presents the four dimensions that constitute the SCVI, integrating demographic, productive, resilience, and climatic variables to enable a comprehensive evaluation of agricultural household welfare.
Table 3.
The major components and sub-components of the SCVI developed for each Peruvian region.
- 1.
- Demographic and Educational (E)
This dimension represents the structural human capital of agricultural households and includes variables such as age, gender, marital status, and educational level. Previous studies have shown that rural education is positively correlated with agricultural productivity, technological adoption, and income diversification. As such, it is a key factor in improving welfare and reducing multidimensional poverty [66]. Education also strengthens adaptive capacity in the face of environmental and economic shocks by reinforcing social resilience and supporting sustainable rural development [43]. In addition, demographic characteristics such as age and gender influence the adoption of innovations and productive efficiency [67]. Older producers tend to exhibit a lower propensity for technological change [68], while rural women face greater constraints in accessing assets and opportunities, which affects both their individual welfare and that of the household [69,70].
- 2.
- Productive—Economic (P)
This dimension quantifies the economic potential and income stability derived from agricultural, livestock, and forestry activities. In household surveys, net income is often subject to substantial measurement error due to the informality of transactions, the coexistence of market production and self-consumption, and the difficulty of consistently valuing non-monetary costs such as family labor and own inputs [71,72]. These limitations frequently result in underestimation and high volatility, reducing comparability across households and over time, particularly in contexts dominated by family and subsistence farming [73]. For this reason, the total value of production constitutes a more stable and reliable measure of a household’s productive capacity, as it reflects economic potential independently of cost structure [74].
Salvati and Carllucci [75] use logarithmic transformations in productive and economic indicators within a local-scale sustainable development index, demonstrating their effectiveness in reducing the influence of extreme values and capturing structural regional differences. Previous research indicates that productive diversification and physical capital intensity in agriculture are directly associated with improved agricultural welfare, as they enhance household resilience to climatic and market shocks [41,45]. From a territorial perspective, variability across the Peruvian Coast, Highlands, and Jungle regions reflects structural differences in infrastructure, access to credit, and agroecological conditions, all of which shape productivity and, consequently, levels of well-being.
- 3.
- Resilience (R)
This dimension measures the capacity of agricultural households to resist, adapt to, and recover from climatic or economic shocks by integrating variables such as adopted coping strategies, recovery time, and response capacity [76]. The indicator captures the effectiveness with which rural producers manage crises without compromising future stability. Resilience is reinforced by productive diversification, technological innovation, and social capital, all of which strengthen the adaptability of agricultural systems [42,44]. Households that employ multiple coping strategies and experience shorter recovery periods tend to exhibit higher levels of well-being and economic sustainability, as their structural vulnerability to climate change is reduced [40]. Agricultural households currently face challenges in adapting to prevailing climatic conditions, which suggests that recovery time from extreme weather events may need to be adapted to accommodate future climate change [14,15].
- 4.
- Climate Vulnerability (V)
This dimension evaluates the degree of exposure and sensitivity of agricultural households to extreme weather events by combining reported experiences of natural disasters with the time required to restore productive activities [77]. Climate vulnerability constitutes a structural constraint on rural development because it increases economic instability, reduces food security, and weakens producers’ adaptive capacity [78]. Vulnerability also depends on the social and institutional strength of territories to implement effective adaptation and mitigation strategies [79]. Consequently, geographical areas with greater sensitivity and weaker resilience become more vulnerable to extreme weather conditions.
2.4. General Index Equation-Socio-Climatic Vulnerability Index
The index is calculated as a weighted combination of four dimensions: educational-demographic (E), productive-economic (P), resilience (R), and climate vulnerability (V). The subsequent general formulation has been proposed on the basis of the empirical application of the LVI development by Rai et al. [17] and Hahn et al. [19]. As explained by Han et al. [19], the vulnerability index uses a balanced weighted average approach. In this methodology, each subcomponent contributes equally to the overall index, even though each main component comprises a different number of subcomponents. The SCVI formula employs a simple approach by assigning equal weights to all primary components [17]. In this regard, given that each of the subcomponents is measured on a different scale, each of them is standardized as an index (1):
where
= the original sub-component for each region.
= minimum values for each sub-component determined using data from all regions.
= maximum values for each sub-component determined using data from all regions.
The minimum and maximum values for each of these subcomponents are used to standardize the index, determined using data from all the households across the twenty-four study regions. Subsequently, the standardized values of each subcomponent were calculated, and the average of these values was determined using Equation (2). This calculation method was used to determine the value of each main component for each region [14,19,21].
where
= one of the four major components for each region.
= represents the sub-components, indexed by i, that make up each major component.
= the number of sub-components in each major component.
After calculating the values for each of the four major components (Table 3) for a region, they were then averaged using Equation (3) in order to obtain the region-level SCVI.
Therefore, the SCVI general Equation (4) be expressed as:
where the Socio-Climatic Vulnerability Index for the Peruvian regions r, equals the weighted average of the four major components (demographic and educational, productive-economic, resilience and climate vulnerability). The weights of each major component, , are determined by the number of sub-components that constitute each major component, with the objective being to ensure that all sub-components contribute equally to the overall SCVI [17]. In this study, the SCVI is measured on a scale ranging from 0 (least vulnerable) to 0.5 (most vulnerable).
3. Results
3.1. Dimensions of the SCVI
An analysis of the age structure of farmers between periods T1 and T5 reveals a bimodal distribution, with a predominance of middle-aged and older producers (40–70 years) for both genders. Male producers exhibit greater age dispersion, whereas female producers are more concentrated in slightly older age groups, suggesting lower female participation among younger cohorts. Over time, the overall mean age has remained relatively stable at approximately 50 years. However, a slight shift toward older age groups is evident in the most recent cohorts (T4 and T5). This trend reflects the progressive aging of the agricultural population and may be associated with limited generational replacement, as well as the migration of younger individuals to urban areas (Figure 2).
Figure 2.
Age distribution of producers by gender and analysis period. Note: T = temporary layers. Source: Prepared by the authors.
Figure 3 illustrates changes in producers’ educational attainment and shows a steady improvement in access to formal education over time. In the initial periods (T1 and T2), incomplete primary education predominates, accounting for approximately 38% and 35%, respectively. This level is followed by completed primary education and incomplete secondary education. Beginning in T3, the lowest levels of educational attainment decline progressively, accompanied by a corresponding increase in the proportion of producers with completed secondary education and non-university higher education. This trend becomes more pronounced in T4 and T5. In the final period (T5), the share of producers with incomplete primary education decreases to approximately 27%, while the proportions with completed secondary education and baccalaureate-level education reach 15% and 4%, respectively. These findings indicate a sustained process of improvement in agricultural human capital, likely associated with the expansion of basic and technical education in rural areas. Nevertheless, substantial educational gaps relative to the national average persist.
Figure 3.
Percentage distribution of producers’ educational level. Note: T = temporary layers. Source: Prepared by the authors.
The distribution of producers by marital status remains relatively stable across periods, with married producers representing between 39% and 51% of the total (Figure 4). Cohabiting producers constitute the second-largest group and show a steady increase, rising from 14% in T1 to more than 31% in T5. This pattern suggests a gradual consolidation of nonmarital unions in rural areas. In contrast, single producers account for a smaller share, approximately 10%, while widowed, separated, and divorced individuals remain marginal categories, each representing less than 6%. Overall, these findings indicate the predominance of consolidated family units within the rural social structure, alongside a gradual shift toward more flexible forms of cohabitation in recent periods. This shift may be associated with sociocultural changes and increased economic autonomy among agricultural households.
Figure 4.
Percentage distribution of marital status. Note. T = temporary layers. Source: Prepared by the authors.
Figure 5 presents the percentage distribution of producers by job role across the five periods analyzed. Self-employed workers clearly predominate, consistently accounting for between 75% and 87% of the total. This pattern confirms the largely family-based and autonomous nature of rural productive units in Peru. In contrast, the proportion of employers or business owners declines over time, decreasing from approximately 17% in T1 to around 8% in T5. This reduction may reflect increasing fragmentation or a decline in the number of production units with the capacity to hire labor. The shares of wage workers and unpaid family workers remain marginal, each below 10%, with limited variation across periods. Overall, this structure reinforces the characterization of the Peruvian rural economy as centered on small-scale, self-managed agriculture, in which producers simultaneously assume managerial, labor, and economic decision-making roles.
Figure 5.
Percentage distribution of the job role of producers. Note. T = temporary layers. Source: Prepared by the authors.
Figure 6 shows a sustained predominance of agricultural activity, which accounts for between 55% and 80% of total production value, thereby consolidating its role as the principal economic driver of rural areas. This share increases progressively from T1 (approximately 55%) and stabilizes at around 80% in T4 and T5, suggesting growing specialization in agricultural production. Livestock activities retain a secondary, yet still relevant, role. However, their share declines from roughly 45% in T1 to between 18% and 20% in later periods. Forestry activities remain negligible, representing less than 2% throughout the study period, with no discernible trend. Overall, these dynamics indicate a reconfiguration of the rural productive system toward greater dependence on agriculture. This shift may be associated with the expansion of cash crops and reduced diversification into livestock and forestry activities. Such trends may have important implications for the resilience and long-term sustainability of agricultural livelihoods.
Figure 6.
Percentage composition of the economic value generated by productive activity. Note. T = temporary layers. Source: Prepared by the authors.
Figure 7 illustrates the temporal evolution of total production, measured in physical volume (left panel) and economic value (right panel), distinguishing between periods of occurrence and post-occurrence of climatic events. Overall, total production increases steadily across the five periods, both in quantity and in value, indicating recovery and gradual expansion of the rural production system. Production levels display marked instability in the initial stage, particularly in T1, followed by stabilization and sustained growth through T5. In post-occurrence periods, production remains relatively high, suggesting a resilience effect characterized by faster recovery after adverse climatic shocks. These findings suggest that farming communities have strengthened their adaptive capacity and productive response to extreme weather events. Nevertheless, growth rates remain uneven across periods and may be influenced by factors such as access to credit, technological adoption, and diversification of productive activities.
Figure 7.
Total production evolution (quantity and value). Note. T = temporary layers. Source: Prepared by the authors.
Figure 8 illustrates the evolution of the percentage distribution of agricultural producers by type of activity within the sample, distinguishing between periods of climatic event occurrence and post-occurrence. Agricultural activity clearly predominates, consistently exceeding 80% across most strata. This pattern confirms the sector’s structural reliance on agriculture as its principal economic base. Livestock activities account for between 5% and 10%, with modest fluctuations over time, while forestry activities remain below 30% throughout the study period. During periods of climatic events, a slight contraction in agricultural activity is observed, particularly in T1 and T2. This contraction is accompanied by a temporary decline in livestock activity, suggesting short-term adjustment strategies in response to adverse conditions. In post-occurrence periods, agricultural activity rebounds rapidly, reaffirming both its centrality and its resilience within household economies. Most producers remain primarily engaged in agriculture and display limited diversification into livestock or forestry activities, a pattern that may heighten vulnerability to climatic and market shocks.
Figure 8.
Percentage of agricultural producers by type of activity. Note. T = temporary layers. Source: Prepared by the authors.
Figure 9 presents the distribution of primary coping strategies adopted by agricultural producers in response to the occurrence and post-occurrence of natural disasters. Between T1 and T4, most farmers reported that they did not implement specific coping strategies during either the occurrence or post-occurrence phases of the ENSO phenomenon. However, during the occurrence phase of T5, a clearer diversification of resilience strategies becomes evident. With regard to coping strategies employed by the producers, a substantial proportion of producers report relying on additional work and reduced consumption. This combination accounts for between 30% and 50% of responses across most of the periods analyzed. Government assistance peaks in T5 at approximately 10%, indicating increased state intervention during disaster phases. Autonomous strategies, such as the use of savings, reduced consumption, or family loans, represent smaller and more variable shares, suggesting limited individual capacity to absorb climatic shocks. External support mechanisms, including assistance from NGOs or labor loans, remain marginal, below 10%, indicating restricted access to, or limited effectiveness of, formal protection mechanisms. Overall, this pattern suggests increasing reliance on public assistance and family labor as primary sources of resilience to climatic impacts. However, dependence on predominantly reactive strategies may undermine the long-term sustainability of agricultural welfare if not accompanied by preventive measures or greater productive diversification.
Figure 9.
Coping strategies for natural disasters. Source: Prepared by the authors.
3.2. Socio-Climatic Vulnerability Index by Region
Table 4 shows the overall SCVI for each region, categorised by year of occurrence and post-occurrence values for the temporary layer during the recurrence of the ENSO phenomenon in the Peruvian context. In this regard, it was ascertained that the SCVI in the majority of regions tends to decrease in the post-ENSO periods. The temporal evolution of the SCVI across the Peruvian regions between the temporary layers (T1-T5) reveals heterogeneous trajectories, with some regions showing declining vulnerability, others exhibiting relative stability, and several demonstrating increasing trends. Overall, most regions experienced a decline around the middle of the study period (T3), followed by partial recovery or renewed increases in subsequent years (T4 & T5).
Table 4.
Overall SCVI for each Peruvian region according to the temporary proposal for ENSO occurrence and post-occurrence between 2000 and 2018.
In line with, the temporal evolution of the SCVI in the coastal regions of Perú: Áncash, Arequipa, Ica, La Libertad, Lambayeque, Lima, Moquegua, Piura, Tacna, and Tumbes, overall, most coastal regions exhibit moderate variability in SCVI values, with relatively similar magnitudes across the period analyzed. However, the direction and intensity of temporal changes differ among regions, reflecting diverse vulnerability dynamics along the Peruvian coast. In Arequipa, the index shows a clearly decreasing trend over the study period. The SCVI declined from 0.394 in 2001 (T1) to 0.356 in 2018 (T5), representing one of the most pronounced reductions among the coastal regions. Although a slight increase was observed after T3, the index remained consistently below its initial levels by the end of the period. A similar but less pronounced pattern is observed in Lima, where the SCVI decreased slightly overall. The index declined from 0.388 in 2000 to 0.374 in 2018.
In contrast, several coastal regions have shown a general increasing trend. Piura has demonstrated a marked upward trend, with the index increasing from 0.270 in 2000 (T1) to 0.395 in 2018 (T5). A similar pattern is observed in La Libertad, where the index increased from 0.349 in 2000 to 0.403 in 2018. For both regions, the data demonstrates moderate fluctuations during the early and middle years, but a more consistent increase after T3, reaching its highest value during the final years analyzed. In addition, moderate increases have been observed in Lambayeque and Tumbes. In Lambayeque, the SCVI exhibited a marginal increase from 0.382 in 2000 to 0.397 in 2018, with the lowest value recorded around 2010 (approximately 0.292). After this period, the index increased gradually and then stabilised at its initial level. Tumbes also experienced a gradual rise from 0.292 in 2000 to 0.345 in 2018, with fluctuations in intermediate years but a generally increasing tendency after 2010. It is important to note that the region group under discussion is directly affected by the ENSO phenomenon. The other coastal regions are displaying relatively stable trajectories, with moderate increases over time. Áncash shows an overall upward trend, with the index rising from 0.315 in 2000 to approximately 0.387 in 2018. Similarly, Ica, Moquegua, and Tacna demonstrate that the SCVI follows a predictable pattern: an initial decline, followed by an increase. This pattern indicates a recovery of vulnerability levels during the latter years of the study period.
In the Andean region, which includes Cajamarca, Áncash, Huánuco, Pasco, Junín, Huancavelica, Ayacucho, Apurímac, Cusco, and Puno, there is greater variability and, in general, higher levels of vulnerability than in the coastal and Amazonian regions. It is evident that several departments initiated the period with relatively elevated index values (e.g., Huancavelica and Apurímac), reflecting historically higher socio-climatic exposure and sensitivity. Temporal patterns across the Andean region are characterized by a combination of early declines and subsequent increases. For instance, certain regions demonstrated relatively stable long-term behaviour, characterized by fluctuations in values that ultimately returned to levels close to those observed at the start of the period under consideration. Cajamarca provides a clear example of this pattern, with the index remaining almost unchanged between T1 (0.391) and T5 (0.391), despite a temporary decline around T3. Similarly, Junín exhibited moderate fluctuations over the study period, declining in T3 and subsequently recovering to levels comparable to the initial values. Apurímac exhibited a comparable trajectory, with early declines followed by increases after T3 that brought the index close to its initial level by the end of the period. In contrast, a number of regions have demonstrated a clear increasing trend, indicating a progressive rise in vulnerability over time. Puno demonstrated the most significant increase, with the index rising from 0.289 in 2000 to 0.440 in 2018, reaching some of the highest values recorded in the dataset during the final years. Pasco also exhibited significant growth, with an increase from 0.264 to 0.389. However, it should be noted that not all Andean regions follow the same trajectory. It is evident that certain departments, including Cajamarca and Junín, demonstrate notable stability over extended periods, exhibiting only marginal long-term fluctuations despite occasional intermediate fluctuations.
In the Amazonian regions, it is generally observed that the Amazonas, Loreto, San Martín, Madre de Dios, and Ucayali regions present lower initial vulnerability levels than the Andean and Coastal regions. However, there has been a progressive increase in several regions over time. As is the case in the Coastal and Andean regions, a temporary reduction around T3 can be observed in most Amazonian regions. After this point, the index generally increases steadily towards T5, particularly in San Martín, Loreto, and Madre de Dios. This pattern indicates a gradual intensification of socio-climatic vulnerability in the Amazon basin during the most recent decade. It should be noted that Amazonas is an exception to this rule, as it has shown a net decrease over the entire study period, despite some variability. The SCVI in this region has shown a decline from 0.430 in 2000 to 0.347 in 2018. The highest level was recorded at the beginning of the period, followed by a gradual reduction with intermediate fluctuations. The lowest value was recorded at T3 (0.274), after which the index showed a slight increase but remained below the initial levels. However, the dominant regional tendency is one of moderate but sustained growth in vulnerability after T4.
Figures in Supplementary Section S2 show the spatial distribution of the average SCVI value at the regional level in Peru during the temporary layers of ENSO phenomenon occurrence and post-occurrence.
4. Discussion
This study contributes to the literature on rural development and climate change by providing longitudinal empirical evidence on how extreme weather events, particularly those associated with the ENSO, affect the welfare of agricultural households in a middle-income country characterized by pronounced territorial heterogeneity, such as Peru.
4.1. Climate Shocks: Vulnerability in a Framework of Climate Risks
In line with the first objective, the results show that years of extreme weather events, such as the ENSO phenomenon, cause systematic damage to the welfare of Peruvian households [29,30,36]. This is evidenced by the SCVI measure, which was verified for each layer. The findings reveal an increase in the SCVI measures among Peruvian agricultural households during years where extreme weather events have taken place. This increase was observed across the entire study period (2000–2018). These findings align with the conclusions reached in the studies of Yglesias-González et al. [35] and Aragón et al. [27], which demonstrated that Peruvian agricultural households, reliant on agriculture as their primary means of subsistence, exhibit heightened vulnerability to climate variability, manifesting in diminishing production levels after adverse weather events.
The coastal departments show heterogeneous but generally increasing vulnerability trends in the later years of the study period. One of the main drivers of this pattern is the strong exposure of the Peruvian coast to extreme hydro-meteorological events associated with ENSO variability. During warm ENSO phases, coastal regions frequently experience intense rainfall, flooding, and landslides that can significantly disrupt infrastructure, agricultural production, and urban systems. These events particularly affect northern coastal departments such as Piura, Lambayeque, and La Libertad, where flood-prone river basins and rapidly expanding urban settlements increase socio-climatic risk. The observed increase in vulnerability after approximately 2010 in several coastal regions may therefore reflect the combined effects of climate variability, urban expansion, and exposure to extreme rainfall events associated with ENSO episodes. These dynamics illustrate how economic development alone does not necessarily translate into reduced socio-climatic vulnerability when risk-sensitive planning and resilient infrastructure are insufficient. The results of the study are consistent with the findings of a study on the relationship between vulnerability and climate shocks, which was conducted among farmers on the Peruvian coast [26,31]. Therefore, the level of vulnerability of a farming household in this region is dependent on the type of strategy used to cope with the shock.
The Andean region presents the highest variability and, in several cases, the highest vulnerability levels across the study period. This pattern is closely related to the complex topography and environmental conditions of the Andean mountain system, represented by the Andes Mountains. Geographical isolation also plays a major role. Many Andean communities are located in remote mountainous areas with limited accessibility, which constrains the development and maintenance of infrastructure such as transportation networks, health services, irrigation systems, and early warning mechanisms. As a result, adaptive capacity tends to be lower in these regions compared with the coastal macro-region. Limited connectivity and institutional capacity can also delay emergency responses during extreme climate events.
Socioeconomic disparities further amplify vulnerability. The Andean region historically exhibits higher levels of poverty and lower access to basic services relative to the coastal region [28,31]. Therefore, these structural inequalities affect households’ ability to implement adaptation strategies, diversify livelihoods, and recover from climate-related shocks. For example, agricultural livelihoods in the Andes often depend on rainfall variability and small-scale subsistence systems that are highly sensitive to climatic fluctuations. The pronounced increases observed in some departments during the later years of the study period may also be linked to intensifying climate variability in high-mountain environments, including shifts in precipitation patterns and glacier retreat. These environmental changes can alter water availability and agricultural productivity, thereby increasing socio-climatic vulnerability.
The Amazonian regions generally display lower initial vulnerability values but show gradual increases over time [36]. Although many communities have historically adapted to seasonal hydrological cycles, increasing climatic variability can intensify the magnitude and frequency of extreme events. Infrastructure limitations also play an important role in shaping vulnerability dynamics. Compared with coastal regions, many Amazonian departments have lower levels of transportation connectivity, limited health and education infrastructure, and restricted access to markets and public services. These conditions reduce adaptive capacity and increase the potential impacts of climate-related disturbances.
4.2. Influence of Major Components in the SCVI
The results demonstrate that the demographic and educational dimension (E) has shown a consistent upward trend across the five periods evaluated (T1–T5). This is further substantiated by the verified evolution of the base variables: age, educational level, marital status, and gender. This suggests that, while there have been improvements in the sociodemographic characteristics of agricultural households, socio-climatic vulnerability could be further reduced by strengthening this dimension. As Wang [63] noted, education level has a significant impact on the employment choices of family members in the labor force, which, in turn, has a considerable effect on farmers’ future per capita consumption levels and their resilience capacities. The education level of the sample population has improved over time, suggesting a positive contribution to the measurement of the E dimension. The women heads of household in this Peruvian rural sample are generally older and less formally educated than their male counterparts, which may indicate heightened vulnerability within this population [17]. This comprehensive review of the results indicates that education is a key factor in strengthening the resilience of agricultural households [14,15]. Nevertheless, the assessment indicates that aspects still require ongoing attention to ensure the sustainability of the positive trend in dimension E of the SCVI.
With regard to the productive/economic dimension (P), measured as the total production and income of agricultural households, there is clear evidence of a lasting impact on overall production and income when comparing the quantity produced and total income obtained in a year in which the phenomenon occurs with those of the following year. Although the recovery period following the occurrence of the ENSO phenomenon shows improved levels of production and income, indicating resilience in the recovery of agricultural production activities, the overall trend shows a decline in total production, especially in periods when extreme weather events occur consecutively. It was identified that agricultural producers in developing countries face increased risk related to the intensification of climate change effects, thereby affecting the welfare vulnerability of agricultural households [14]. In this context, Hultgren et al. [4] identified that income stability enables producers to respond more effectively and in more diversified ways to conditions of climate volatility, thereby mitigating the effects of increased frequency of climate events.
In relation to farmers’ productive resilience (R), a high level of resilience is consistently observed during ENSO periods and recovery periods. Furthermore, producers indicated that the coping strategies employed primarily involved increasing working hours and reducing consumption. However, the T5 evaluation period (2017–2018) demonstrated greater diversification in producers’ coping strategies. These results are consistent with Rai et al. [17], who indicate that farming households employ local response mechanisms consisting of a combination of adaptation measures to adjust to climate change. Iskandar et al. [11] highlighted the importance of measuring the resilience of livelihoods to climate change, given that such communities rely on sectors that are susceptible to increasingly frequent weather fluctuations.
Regarding climate vulnerability, the results show that years of extreme weather events cause systematic damage to rural welfare, as evidenced by increases in the SCVI, especially through the productive-economic and climate vulnerability dimensions. This finding is consistent with a substantial body of literature documenting that climate shocks directly affect agricultural income, consumption, and food security among poor rural households, thereby increasing their exposure to transient or persistent poverty [15,16,27].
Finally, the intertemporal analysis reveals that post-occurrence periods are associated with partial recovery of welfare, reflected in the progressive stabilization of the SCVI across the periods under assessment. This pattern suggests the presence of adaptive capacities and accumulated learning in response to recurring shocks. This finding is consistent with approaches that conceptualize resilience not as the absence of impact, but as the ability to absorb disturbances and reorganize without the collapse of core operations [23,40]. Nevertheless, the persistence of a structural gap between welfare levels observed during occurrence and post-occurrence periods indicates that recovery remains incomplete.
5. Conclusions
The findings of this study indicate the regional trajectories of the SCVI, revealing differentiated spatial dynamics across the coastal, Andean, and Amazonian regions of Peru. These patterns reflect the interaction between climatic exposure, geographical constraints, infrastructure distribution, and large-scale climate variability, particularly the influence of the ENSO phenomenon occurrence. The results suggest that vulnerability of Peruvian agricultural households was shaped not only by environmental conditions but also by structural socioeconomic and territorial factors that vary substantially across the country. Therefore, the SCVI demonstrates its capacity to integrate these dimensions into a cohesive analytical framework. The evidence supports the conclusion that the index is a useful tool for territorial monitoring of rural welfare and for identifying priority regions for policy intervention.
In this regard, the findings underscore the need to implement customized and localized approaches to climate change adaptation in the design of evidence-based public policy. Comprehensive strategies are particularly necessary in the agricultural household, combining investments in human capital, productive diversification, institutional strengthening, and facilitated access to formal social and financial protection mechanisms. In the absence of such structural interventions, the improvements observed during post-occurrence periods are likely to remain transient and reversible when confronted with extreme weather events, especially in a context of increasing climate variability, as is the case in developing countries such as Peru.
Supplementary Materials
The following supporting information can be downloaded at: https://www.mdpi.com/article/10.3390/su18073477/s1, Table S1: Data cleaning procedures for components and subcomponents; Table S2: Results of sub-component indicators for each Peruvian region from T1 to T5 (2000–2018); Table S3: Calculating the sub-component indicators for the SCVI for Peruvian region; Figure S1: Results of Overall SCVI for each Peruvian region from T1 (2000–2001); Figure S2: Results of Overall SCVI for each Peruvian region from T2 (2003–2004); Figure S3: Results of Overall SCVI for each Peruvian region from T1 (2010–2011); Figure S4: Results of Overall SCVI for each Peruvian region from T1 (2015–2016); Figure S5: Results of Overall SCVI for each Peruvian region from T1 (2017–2018).
Author Contributions
Conceptualization, R.R.-S.; methodology, R.R.-S. and M.d.P.B.C.; software, R.R.-S. and M.d.P.B.C.; validation, R.R.-S. and A.B.-S.; formal analysis, R.R.-S. and M.d.P.B.C.; investigation, R.R.-S., M.d.P.B.C. and A.B.-S.; data curation, R.R.-S.; writing—original draft preparation, R.R.-S., J.A.C.T. and M.d.P.B.C.; visualization, M.d.P.B.C.; supervision, R.R.-S., J.A.C.T. and A.B.-S.; project administration, R.R.-S.; funding acquisition, R.R.-S.; writing—review & editing, R.R.-S. and M.d.P.B.C. All authors have read and agreed to the published version of the manuscript.
Funding
This project received funding from the National Council for Science, Technology, and Technological Innovation (CONCYTEC), the National Program for Scientific Research and Advanced Studies (PROCIENCIA), and Universidad Tecnológica del Perú (UTP), within the framework of the competition E041-2024-04 Research Projects in Social Sciences, grant number PE501088121-2024. The APC was funded by CONCYTEC and PROCIENCIA.
Institutional Review Board Statement
Ethical review and approval were waived for this study as it utilized open data, the National Household Survey. The utilization of publicly obtainable data is exempt from the requirement for Institutional Review Board approval, given that the data does not encompass any private, identifiable information.
Informed Consent Statement
Not applicable.
Data Availability Statement
Anonymized data collected and utilized in this project can be accessed as open data via Microdatos INEI, available online: https://proyectos.inei.gob.pe/microdatos/ (accessed on 1 October 2024).
Conflicts of Interest
The authors declare that they have no known competing financial interests or personal relationships that could have appeared to influence the work reported in this paper.
Abbreviations
The following abbreviations are used in this manuscript:
| SCVI | Socio-Climatic Vulnerability Index |
| ENSO | El Niño–Southern Oscillation |
| IPCC | Intergovernmental Panel on Climate Change |
| INEI | National Institute of Statistics and Informatics |
| LVI | Livelihood Vulnerability Index |
References
- IPCC. Climate Change and Land: An IPCC Special Report on Climate Change, Desertification, Land Degradation, Sustainable Land Management, Food Security, and Greenhouse Gas Fluxes in Terrestrial Ecosystems; IPCC: Geneva, Switzerland, 2023. [Google Scholar]
- Kim, Y.; Oka, K.; Kawazu, E.C.; Ng, C.F.S.; Seposo, X.; Ueda, K.; Hashizume, M.; Honda, Y. Enhancing health resilience in Japan in a changing climate. Lancet Reg. Health West. Pac. 2023, 40, 100970. [Google Scholar] [CrossRef] [Scilit]
- Zakharova, O.; Karagulian, E.; Viktorova, N.; Gamukin, V.; Yablochkina, V. Risk assessment of socio-economic vulnerability to climate change: Case study of Tyumen region. World 2025, 6, 6. [Google Scholar] [CrossRef] [Scilit]
- Hultgren, A.; Carleton, T.; Delgado, M.; Gergel, D.R.; Greenstone, M.; Houser, T.; Hsiang, S.; Jina, A.; Kopp, R.E.; Malevich, S.B.; et al. Impacts of climate change on global agriculture accounting for adaptation. Nature 2025, 642, 644–652. [Google Scholar] [CrossRef] [Scilit] [PubMed]
- Ahmed, S.A.; Diffenbaugh, N.S.; Hertel, T.W. Climate volatility deepens poverty vulnerability in developing countries. Environ. Res. Lett. 2009, 4, 034004. [Google Scholar] [CrossRef] [Scilit]
- Gitz, V.; Meybeck, A.; Lipper, L.; Young, C.D.; Braatz, S. Climate change and food security: Risks and responses. Food Agric. Organ. United Nations (FAO) Rep. 2016, 110, 3–36. [Google Scholar]
- Tessema, Y.A.; Joerin, J.; Patt, A. Climate change as a motivating factor for farm-adjustments: Rethinking the link. Clim. Risk Manag. 2019, 23, 136–145. [Google Scholar] [CrossRef] [Scilit]
- Li, H.; Liu, M.; Lu, Q. Impact of climate change on household development resilience: Evidence from rural China. J. Clean. Prod. 2024, 434, 139689. [Google Scholar] [CrossRef] [Scilit]
- Bekee, B.; Valdivia, C. Resilience of rural households: Insights from a multidisciplinary literature. Sustainability 2023, 15, 5500. [Google Scholar] [CrossRef] [Scilit]
- Woodhill, J.; Kishore, A.; Njuki, J.; Jones, K.; Hasnain, S. Food systems and rural wellbeing: Challenges and opportunities. Food Secur. 2022, 14, 1099–1121. [Google Scholar] [CrossRef] [Scilit]
- Iskandar, I.; Anas, A.; Bahri, S.; Menne, F.; Baharuddin, T. Social vulnerability and climate change: A bibliometric analysis. Cogent Soc. Sci. 2024, 10, 2402849. [Google Scholar] [CrossRef] [Scilit]
- Balestri, S. A double constraint to development: How multidimensional poverty interacts with vulnerability to climate change. J. Econ. Interact. Coord. 2025. [Google Scholar] [CrossRef] [Scilit]
- Johnson, D.; Blackett, P.; Allison, A.E.F.; Broadbent, A.M. Measuring social vulnerability to climate change at the coast: Embracing complexity and context for more accurate and equitable analysis. Water 2023, 15, 3408. [Google Scholar] [CrossRef] [Scilit]
- Liu, X.; Liu, S.; Wang, R.; Tang, H.; Zhang, F.; Jia, L.; Sun, X. Vulnerability of farmer households to climate change in rocky desertification areas—A case study of Guizhou Province. Land 2024, 13, 582. [Google Scholar] [CrossRef] [Scilit]
- Rana, I.A.; Khan, M.M.; Lodhi, R.H.; Altaf, S.; Nawaz, A.; Najam, F.A. Multidimensional poverty vis-à-vis climate change vulnerability: Empirical evidence from flood-prone rural communities of Charsadda and Nowshera districts in Pakistan. World Dev. Sustain. 2023, 2, 100064. [Google Scholar] [CrossRef] [Scilit]
- Zainab, A.; Shah, K.U. Taking stock of recent progress in livelihood vulnerability assessments to climate change in the developing world. Climate 2024, 12, 100. [Google Scholar] [CrossRef] [Scilit]
- Rai, P.; Bajgai, Y.; Rabgyal, J.; Katwal, T.B.; Delmond, A.R. Empirical evidence of the livelihood vulnerability to climate change impacts: A case of potato-based mountain farming systems in Bhutan. Sustainability 2022, 14, 2339. [Google Scholar] [CrossRef] [Scilit]
- Wangmo, S.; Dorji, U.; Dorji, N. Assessing the livelihood vulnerability to impact of climate change in Western Bhutan. J. Agric. Ecol. Res. Int. 2023, 24, 21–39. [Google Scholar] [CrossRef] [Scilit]
- Hahn, M.B.; Riederer, A.M.; Foster, S.O. The Livelihood Vulnerability Index: A pragmatic approach to assessing risks from climate variability and change—A case study in Mozambique. Glob. Environ. Change 2009, 19, 74–88. [Google Scholar] [CrossRef] [Scilit]
- Mah, J.C.; Penwarden, J.L.; Pott, H.; Theou, O.; Andrew, M.K. Social vulnerability indices: A scoping review. BMC Public Health 2023, 23, 1253. [Google Scholar] [CrossRef] [Scilit]
- Li, G.; He, S.; Ma, W.; Huang, Z.; Peng, Y.; Ding, G. Assessing Rural Development vulnerability index: A spatio-temporal analysis of post-poverty alleviation areas in Hunan, China. Sustainability 2025, 17, 6033. [Google Scholar] [CrossRef] [Scilit]
- Arouri, M.; Nguyen, C.; Youssef, A.B. Natural disasters, household welfare, and resilience: Evidence from rural Vietnam. World Dev. 2015, 70, 59–77. [Google Scholar] [CrossRef] [Scilit]
- Jones, L.; Tanner, T. ‘Subjective resilience’: Using perceptions to quantify household resilience to climate extremes and disasters. Reg. Environ. Change 2017, 17, 229–243. [Google Scholar] [CrossRef] [Scilit]
- Kibria, A.S.M.G.; Costanza, R.; Gasparatos, A.; Soto, J. A composite human wellbeing index for ecosystem-dependent communities: A case study in the Sundarbans, Bangladesh. Ecosyst. Serv. 2022, 53, 101389. [Google Scholar] [CrossRef] [Scilit]
- INEI. IV Censo Nacional Agropecuario 2012: Resultados Definitivos; Instituto Nacional de Estadística e Informática: Lima, Peru, 2013. [Google Scholar]
- Maletta, H. La pequeña agricultura familiar en el Perú: Una tipología microrregionalizada. In IV Censo Nacional Agropecuario 2012; FAO: Rome, Italy, 2017. [Google Scholar]
- Aragón, F.M.; Oteiza, F.; Rud, J.P. Climate change and agriculture: Subsistence farmers’ response to extreme heat. Am. Econ. J. Econ. Policy 2021, 13, 1–35. [Google Scholar] [CrossRef] [Scilit]
- Trivelli, C. Finanzas Agropecuarias: Desafío Pendiente en la Agenda Agraria en Perú; LAC Working Paper; Instituto de Estudios Peruanos (IEP): Lima, Peru, 2021; Volume 15. [Google Scholar]
- Blazquez-Soriano, A.; Ramos-Sandoval, R. Information transfer as a tool to improve the resilience of farmers against the effects of climate change: The case of the Peruvian National Agrarian Innovation System. Agric. Syst. 2022, 200, 103431. [Google Scholar] [CrossRef] [Scilit]
- Trivelli, C.; Boucher, S. Vulnerabilidad y Shocks Climáticos: El Costo de la Sequía Para los Productores Agropecuarios de Piura y el Valle del Mantaro; CIES: Lima, Peru, 2005. [Google Scholar]
- Mendoza, W. Crecimiento Económico e Inclusión Social: El Caso del Perú; CIES Working Paper; Instituto de Estudios Peruanos (IEP): Lima, Peru, 2023. [Google Scholar]
- Keenan, M.; Fort, R.; Vargas, R. Shocked into side-selling? Production shocks and organic coffee farmers’ marketing decisions. Food Policy 2024, 125, 102631. [Google Scholar] [CrossRef] [Scilit]
- Banco Interamericano de Desarrollo (BID); CEPAL. La Economía del Cambio Climático en el Perú; BID: Washington, DC, USA; CEPAL: Santiago, Chile, 2014. [Google Scholar]
- Apaéstegui, J.; Takahashi, K.; Ortlieb, L.; Sifeddine, A.; Macharé, J. El Fenómeno El Niño durante el último milenio. In Boletín Técnico: Generación de Modelos Climáticos Para el Pronóstico de la Ocurrencia del Fenómeno el Niño; Instituto Geofísico del Perú: Lima, Peru, 2015; Volume 2, pp. 4–8. [Google Scholar]
- Yglesias-González, M.; Valdés-Velásquez, A.; Hartinger, S.M.; Takahashi, K.; Salvatierra, G.; Velarde, R.; Contreras, A.; Santa María, H.; Romanello, M.; Paz-Soldán, V.; et al. Reflections on the impact and response to the Peruvian 2017 Coastal El Niño event: Looking to the past to prepare for the future. PLoS ONE 2023, 18, e0290767. [Google Scholar] [CrossRef] [Scilit]
- Campos Trigoso, J.A.; Rituay, P.; Aldea, C.; Bustos Chavez, M.P.; García, L.; Ramos-Sandoval, R. Sensitivity and adaptive capacity to climate change in organised coffee growers in Amazonas, Peru. Sustainability 2025, 17, 10666. [Google Scholar] [CrossRef] [Scilit]
- Banco Central de Reserva del Perú (BCRP). Panorama actual y proyecciones macroeconómicas 2023–2025. In Reporte de Inflación; BCRP: Lima, Peru, 2023. [Google Scholar]
- Takahashi, K.; Mosquera, K.; Reupo, J. El Índice Costero El Niño (ICEN): Historia y actualización. In Boletín Técnico: Generación de Modelos Climáticos Para el Pronóstico de la Ocurrencia del Fenómeno el Niño; Instituto Geofísico del Perú: Lima, Peru, 2014; Volume 1, pp. 8–9. [Google Scholar]
- Escobal, J.; Fort, R.; Zegarra, E. Agricultura Peruana: Nuevas Miradas Desde el Censo Agropecuario; Grupo de Análisis para el Desarrollo: Lima, Peru, 2016. [Google Scholar]
- Crane, T.A.; Roncoli, C.; Hoogenboom, G. Adaptation to climate change and climate variability: The importance of understanding agriculture as performance. NJAS Wagening. J. Life Sci. 2011, 57, 179–185. [Google Scholar] [CrossRef] [Scilit]
- Khanal, U.; Wilson, C.; Lee, B.; Hoang, V.N. Do climate change adaptation practices improve technical efficiency of smallholder farmers? Evidence from Nepal. Clim. Change 2018, 147, 507–521. [Google Scholar] [CrossRef] [Scilit]
- Descheemaeker, K.; Oosting, S.J.; Homann-Kee Tui, S.; Masikati, P.; Falconnier, G.N.; Giller, K.E. Climate change adaptation and mitigation in smallholder crop–livestock systems in sub-Saharan Africa: A call for integrated impact assessments. Reg. Environ. Change 2016, 16, 2331–2343. [Google Scholar] [CrossRef] [Scilit]
- Hou, T.; Zhang, R.; Xie, Y.; Yin, Q.; Cai, W.; Dong, W.; Deng, G. Education and subjective well-being in Chinese rural population: A multi-group structural equation model. PLoS ONE 2022, 17, e0264108. [Google Scholar] [CrossRef] [Scilit]
- Jayadas, A.; Ambujam, N.K. Research and design of a farmer resilience index in coastal farming communities of Tamil Nadu, India. J. Water Clim. Change 2021, 12, 3143–3158. [Google Scholar] [CrossRef] [Scilit]
- Sinore, T.; Wang, F. Climate change impact and adaptation options in sub-Saharan Africa: A systematic review. Environ. Dev. Sustain. 2025, 1–29. [Google Scholar] [CrossRef] [Scilit]
- Baez, J.E.; Kronick, D.; Mason, A.D. Rural households in a changing climate. World Bank Res. Obs. 2013, 28, 267–289. [Google Scholar] [CrossRef] [Scilit]
- Instituto Nacional de Estadística e Informática (INEI). Perú—Encuesta Nacional de Hogares 2000; INEI: Lima, Peru, 2001; Available online: https://proyectos.inei.gob.pe/microdatos/ (accessed on 1 October 2024).
- Instituto Nacional de Estadística e Informática (INEI). Perú—Encuesta Nacional de Hogares 2001; INEI: Lima, Peru, 2002; Available online: https://proyectos.inei.gob.pe/microdatos/ (accessed on 1 October 2024).
- Instituto Nacional de Estadística e Informática (INEI). Perú—Encuesta Nacional de Hogares 2003; INEI: Lima, Peru, 2004; Available online: https://proyectos.inei.gob.pe/microdatos/ (accessed on 1 October 2024).
- Instituto Nacional de Estadística e Informática (INEI). Perú—Encuesta Nacional de Hogares 2004; INEI: Lima, Peru, 2005; Available online: https://proyectos.inei.gob.pe/microdatos/ (accessed on 1 October 2024).
- Instituto Nacional de Estadística e Informática (INEI). Perú—Encuesta Nacional de Hogares 2010; INEI: Lima, Peru, 2011; Available online: https://proyectos.inei.gob.pe/microdatos/ (accessed on 15 September 2024).
- Instituto Nacional de Estadística e Informática (INEI). Perú—Encuesta Nacional de Hogares 2011; INEI: Lima, Peru, 2012; Available online: https://proyectos.inei.gob.pe/microdatos/ (accessed on 1 October 2024).
- Instituto Nacional de Estadística e Informática (INEI). Perú—Encuesta Nacional de Hogares 2015; INEI: Lima, Peru, 2016; Available online: https://proyectos.inei.gob.pe/microdatos/ (accessed on 1 October 2024).
- Instituto Nacional de Estadística e Informática (INEI). Perú—Encuesta Nacional de Hogares 2016; INEI: Lima, Peru, 2017; Available online: https://proyectos.inei.gob.pe/microdatos/ (accessed on 1 October 2024).
- Instituto Nacional de Estadística e Informática (INEI). Perú—Encuesta Nacional de Hogares 2017; INEI: Lima, Peru, 2018; Available online: https://proyectos.inei.gob.pe/microdatos/ (accessed on 1 October 2024).
- Instituto Nacional de Estadística e Informática (INEI). Perú—Encuesta Nacional de Hogares 2018; INEI: Lima, Peru, 2020; Available online: https://proyectos.inei.gob.pe/microdatos/ (accessed on 1 October 2024).
- Hinkel, J. ‘Indicators of vulnerability and adaptive capacity’: Towards a clarification of the science–policy interface. Glob. Environ. Change 2011, 21, 198–208. [Google Scholar] [CrossRef] [Scilit]
- Eakin, H.; Bojórquez-Tapia, L.A. Insights into the composition of household vulnerability from multicriteria decision analysis. Glob. Environ. Change 2008, 18, 112–127. [Google Scholar] [CrossRef] [Scilit]
- Alkire, S.; Foster, J. Counting and multidimensional poverty measurement. J. Public Econ. 2011, 95, 476–487. [Google Scholar] [CrossRef] [Scilit]
- Cutter, S.L.; Barnes, L.; Berry, M.; Burton, C.; Evans, E.; Tate, E.; Webb, J. A place-based model for understanding community resilience to natural disasters. Glob. Environ. Change 2008, 18, 598–606. [Google Scholar] [CrossRef] [Scilit]
- O’brien, K.; Eriksen, S.; Nygaard, L.P.; Schjolden, A. Why different interpretations of vulnerability matter in climate change discourses. Clim. Policy 2007, 7, 73–88. [Google Scholar] [CrossRef]
- Jones, L.; Samman, E.; Vinck, P. Subjective measures of household resilience to climate variability and change: Insights from a nationally representative survey of Tanzania. Ecol. Soc. 2018, 23, 29. [Google Scholar] [CrossRef] [Scilit]
- Wang, X. Research on rural households’ poverty vulnerability in poor mountainous areas: An empirical analysis in the upper reaches of the Min River, China. Sustainability 2025, 17, 4568. [Google Scholar] [CrossRef] [Scilit]
- Edmonds, H.K.; Lovell, J.E.; Lovell, C.A.K. A new composite climate change vulnerability index. Ecol. Indic. 2020, 117, 106529. [Google Scholar] [CrossRef] [Scilit]
- Onyeyirichi, O.A.; Deepika, M.G. Rural multidimensional poverty and livelihood mix: A micro level study in Bihar, India. Heliyon 2025, 11, e42772. [Google Scholar] [CrossRef] [Scilit]
- Zhang, M.; Qin, J.; Tan, H.; Mao, H.; Tu, X.; Jian, J. Education level of farmers, market-oriented reforms, and the utilization efficiency of agricultural water resources in China. Econ. Change Restruct. 2023, 56, 3927–3947. [Google Scholar] [CrossRef] [Scilit]
- Misra, R.; Tewari, N. Gendering the impact of climate change on agriculture in Asia. In Climate, Environment and Agricultural Development; Rai, P.K., Rai, S., Eds.; Springer: Singapore, 2024; pp. 237–248. [Google Scholar] [CrossRef] [Scilit]
- Mohanty, S.K.; Arokiasamy, P.; Nayak, I.; Shekhar, P. Economic well-being of middle-aged and elderly adults in India: Variations by household composition. J. Soc. Econ. Dev. 2023, 1–19. [Google Scholar] [CrossRef] [Scilit]
- Brown, P.; Daigneault, A.; Dawson, J. Age, values, farming objectives, past management decisions, and future intentions in New Zealand agriculture. J. Environ. Manag. 2019, 231, 110–120. [Google Scholar] [CrossRef] [Scilit]
- Odishika, V.A.; Ajudua, E.I. Gender wealth gap in asset ownership and household welfare in Lagos State, Nigeria. Int. J. Intellect. Discourse 2023, 6, 48–63. [Google Scholar]
- Deaton, A.S. The Analysis of Household Surveys: A Microeconometric Approach to Development Policy; The World Bank: Washington, DC, USA, 1997. [Google Scholar]
- Campos, J.A.; Foster, W. Medición de la pobreza. Consecuencias de compatibilizar ingresos de encuestas de hogares con cuentas nacionales. Estud. Públicos 2013, 130, 53–94. [Google Scholar] [CrossRef] [Scilit]
- Harré, M.S.; Eremenko, A.; Glavatskiy, K.; Hopmere, M.; Pinheiro, L.; Watson, S.; Crawford, L. Complexity economics in a time of crisis: Heterogeneous agents, interconnections, and contagion. Systems 2021, 9, 73. [Google Scholar] [CrossRef] [Scilit]
- Céspedes, N.; Lavado Padilla, P.A.; Ramírez Rondán, N. (Eds.) Productividad en el Perú: Medición, Determinantes e Implicancias, 1st ed.; Versión e-Book Edition; Universidad del Pacífico: Lima, Peru, 2016; Available online: http://hdl.handle.net/11354/1083 (accessed on 30 October 2025).
- Salvati, L.; Carlucci, M. A composite index of sustainable development at the local scale: Italy as a case study. Ecol. Indic. 2014, 43, 162–171. [Google Scholar] [CrossRef] [Scilit]
- Escobar Cárdenas, M.J.; Fernández Villamizar, M.F. La Seguridad Alimentaria y el Cambio Climático: Un Estudio Acerca de la Resiliencia de los Hogares Según la Estructura Familiar; Universidad de los Andes: Bogota, Colombia, 2023; Available online: https://hdl.handle.net/1992/73136 (accessed on 29 September 2025).
- Hernández Ramírez, C.; Bonales Valencia, J.; Francisco, C.; Paniagua, O. Agricultural vulnerability models under climate change effects. Cimexus 2014, 9, 31–48. [Google Scholar]
- Bournaris, T.; Moulogianni, C.; Vlontzos, G.; Georgilas, I. Methodologies used to assess the impacts of climate change in agricultural economics: A rapid review. Int. J. Sustain. Agric. Manag. Inform. 2021, 7, 253–269. [Google Scholar] [CrossRef] [Scilit]
- Sullivan, C. Calculating a Water Poverty Index. World Dev. 2002, 30, 1195–1210. [Google Scholar] [CrossRef] [Scilit]
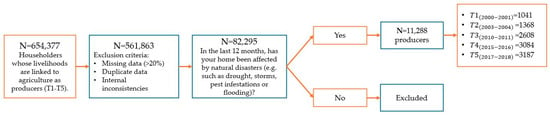
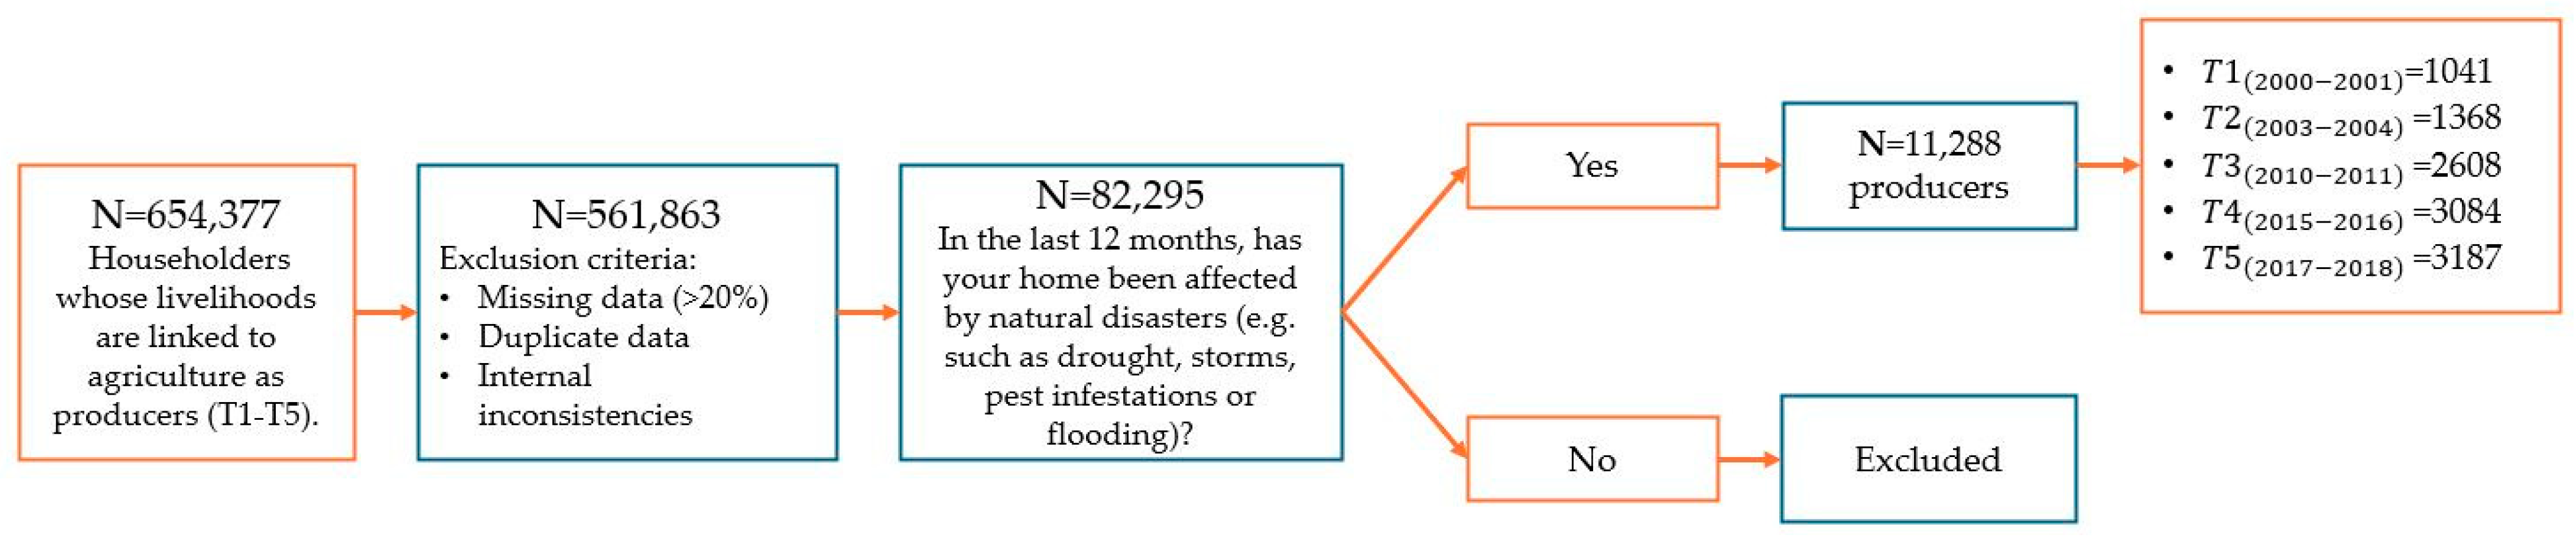
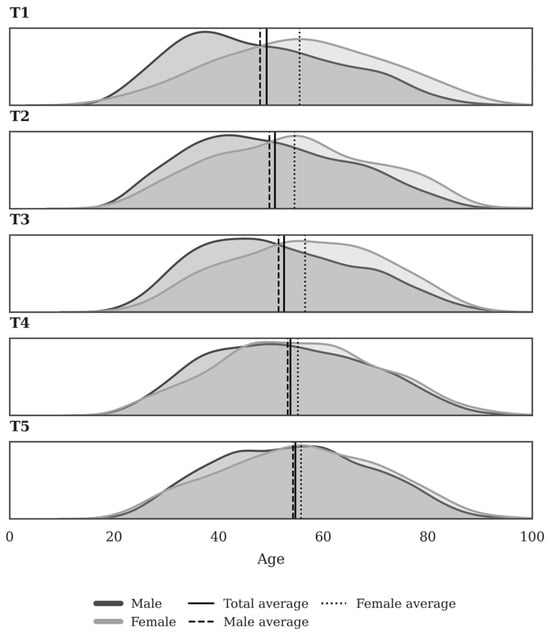
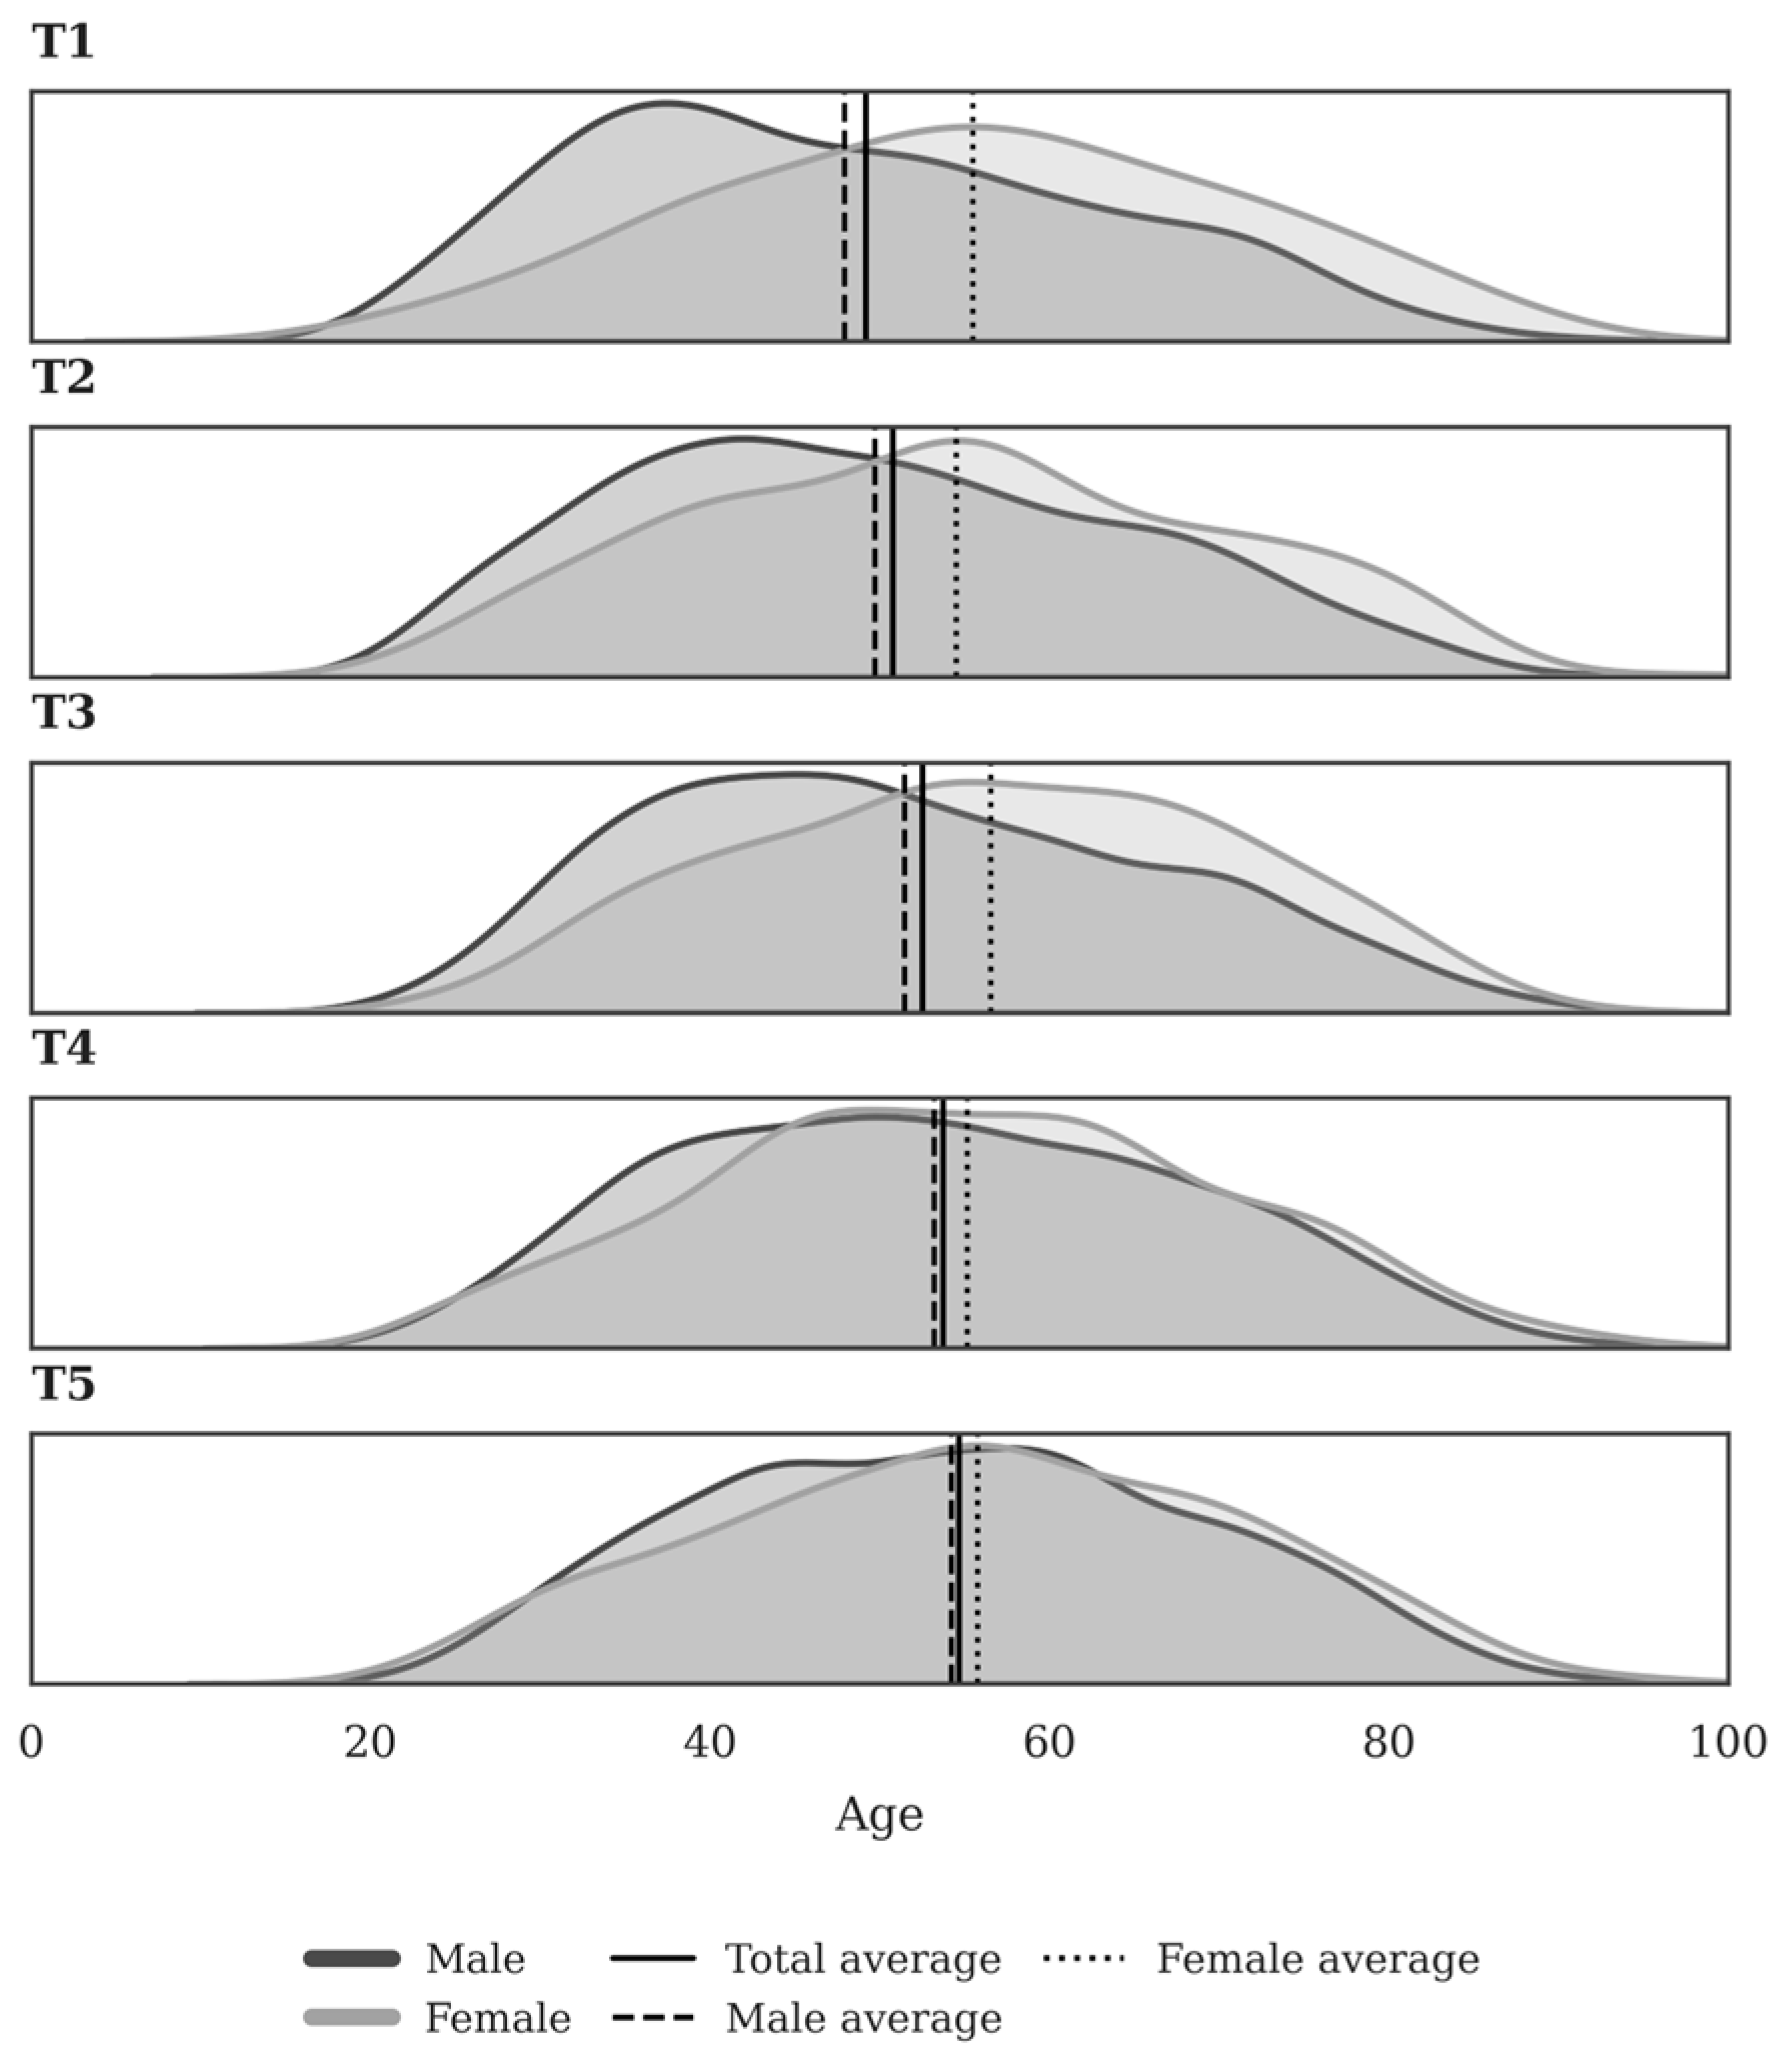
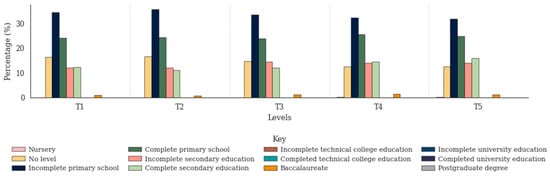
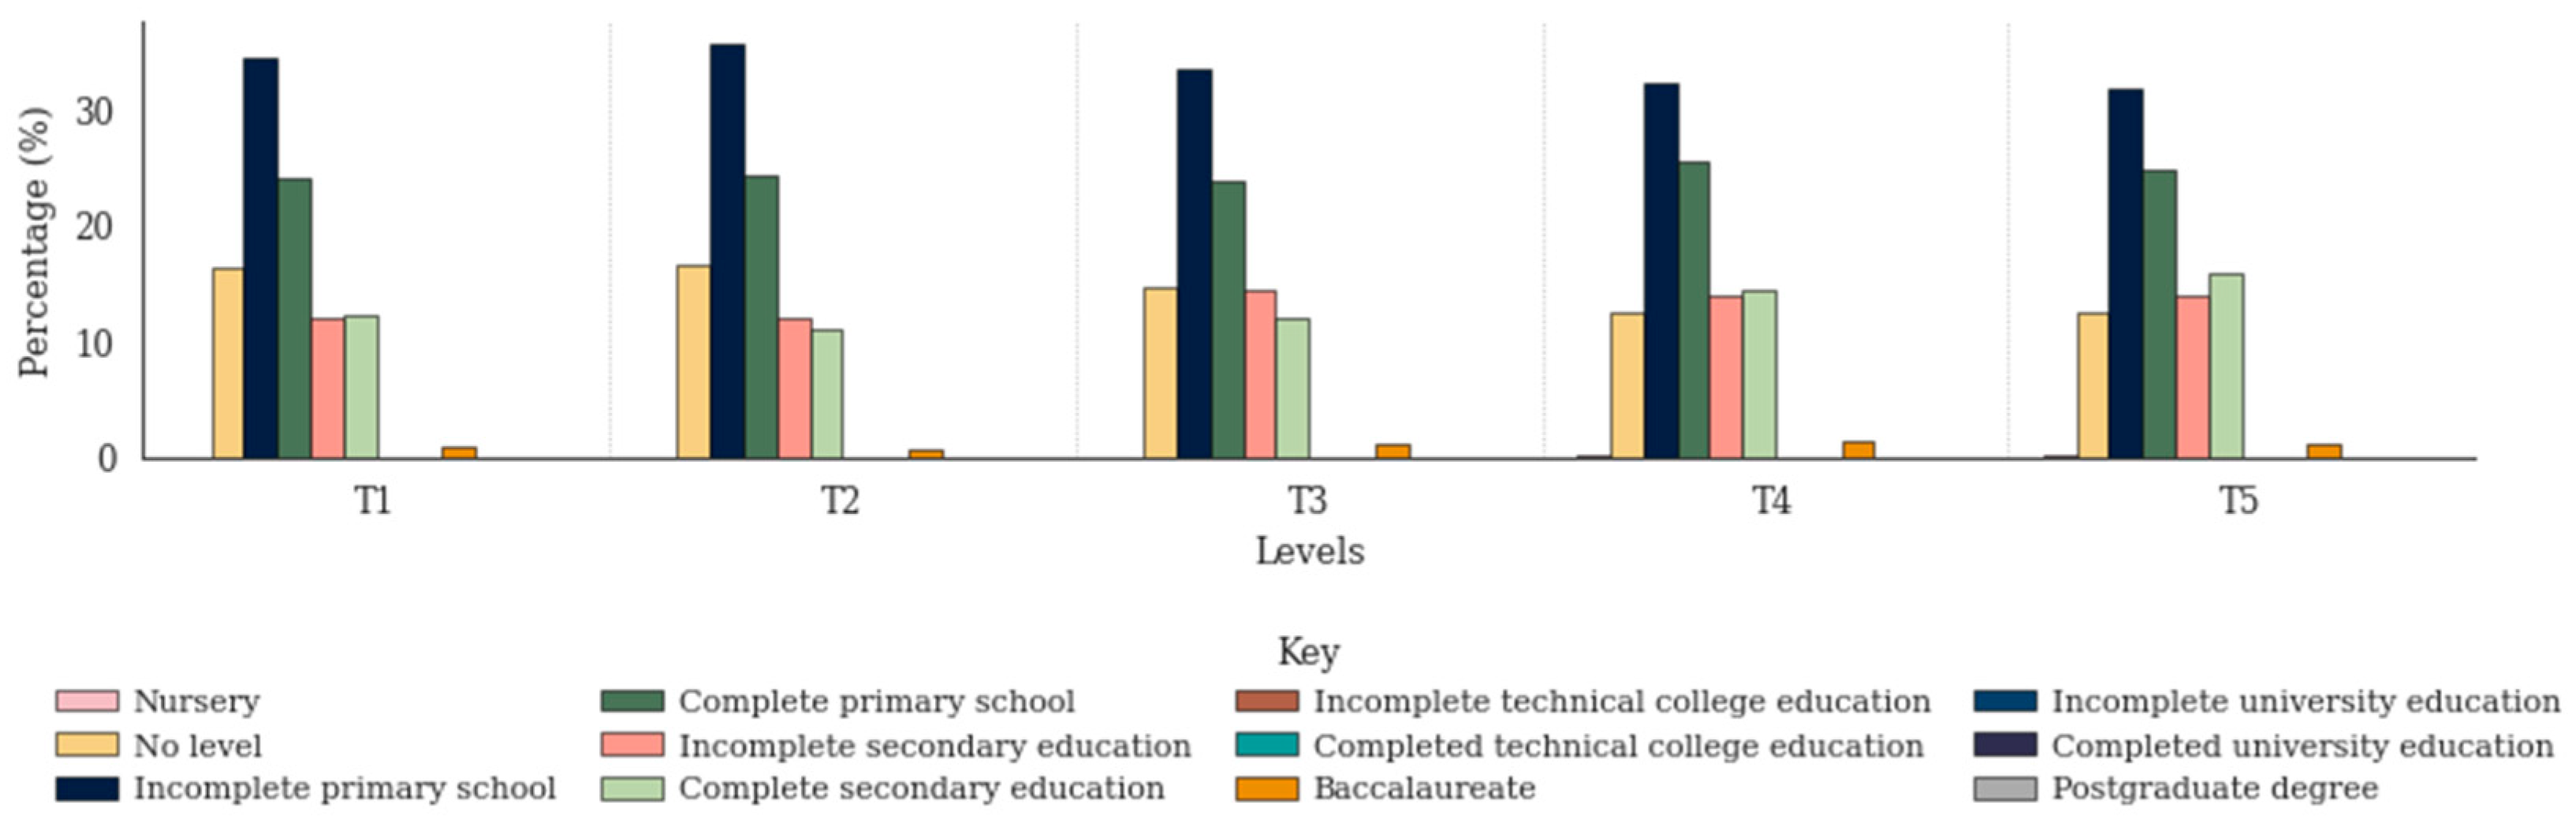
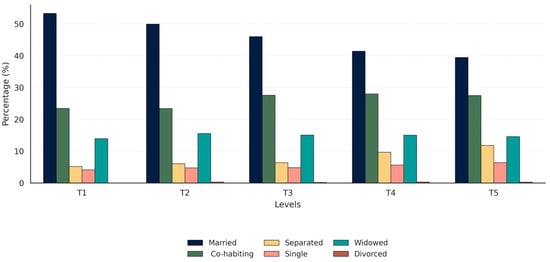
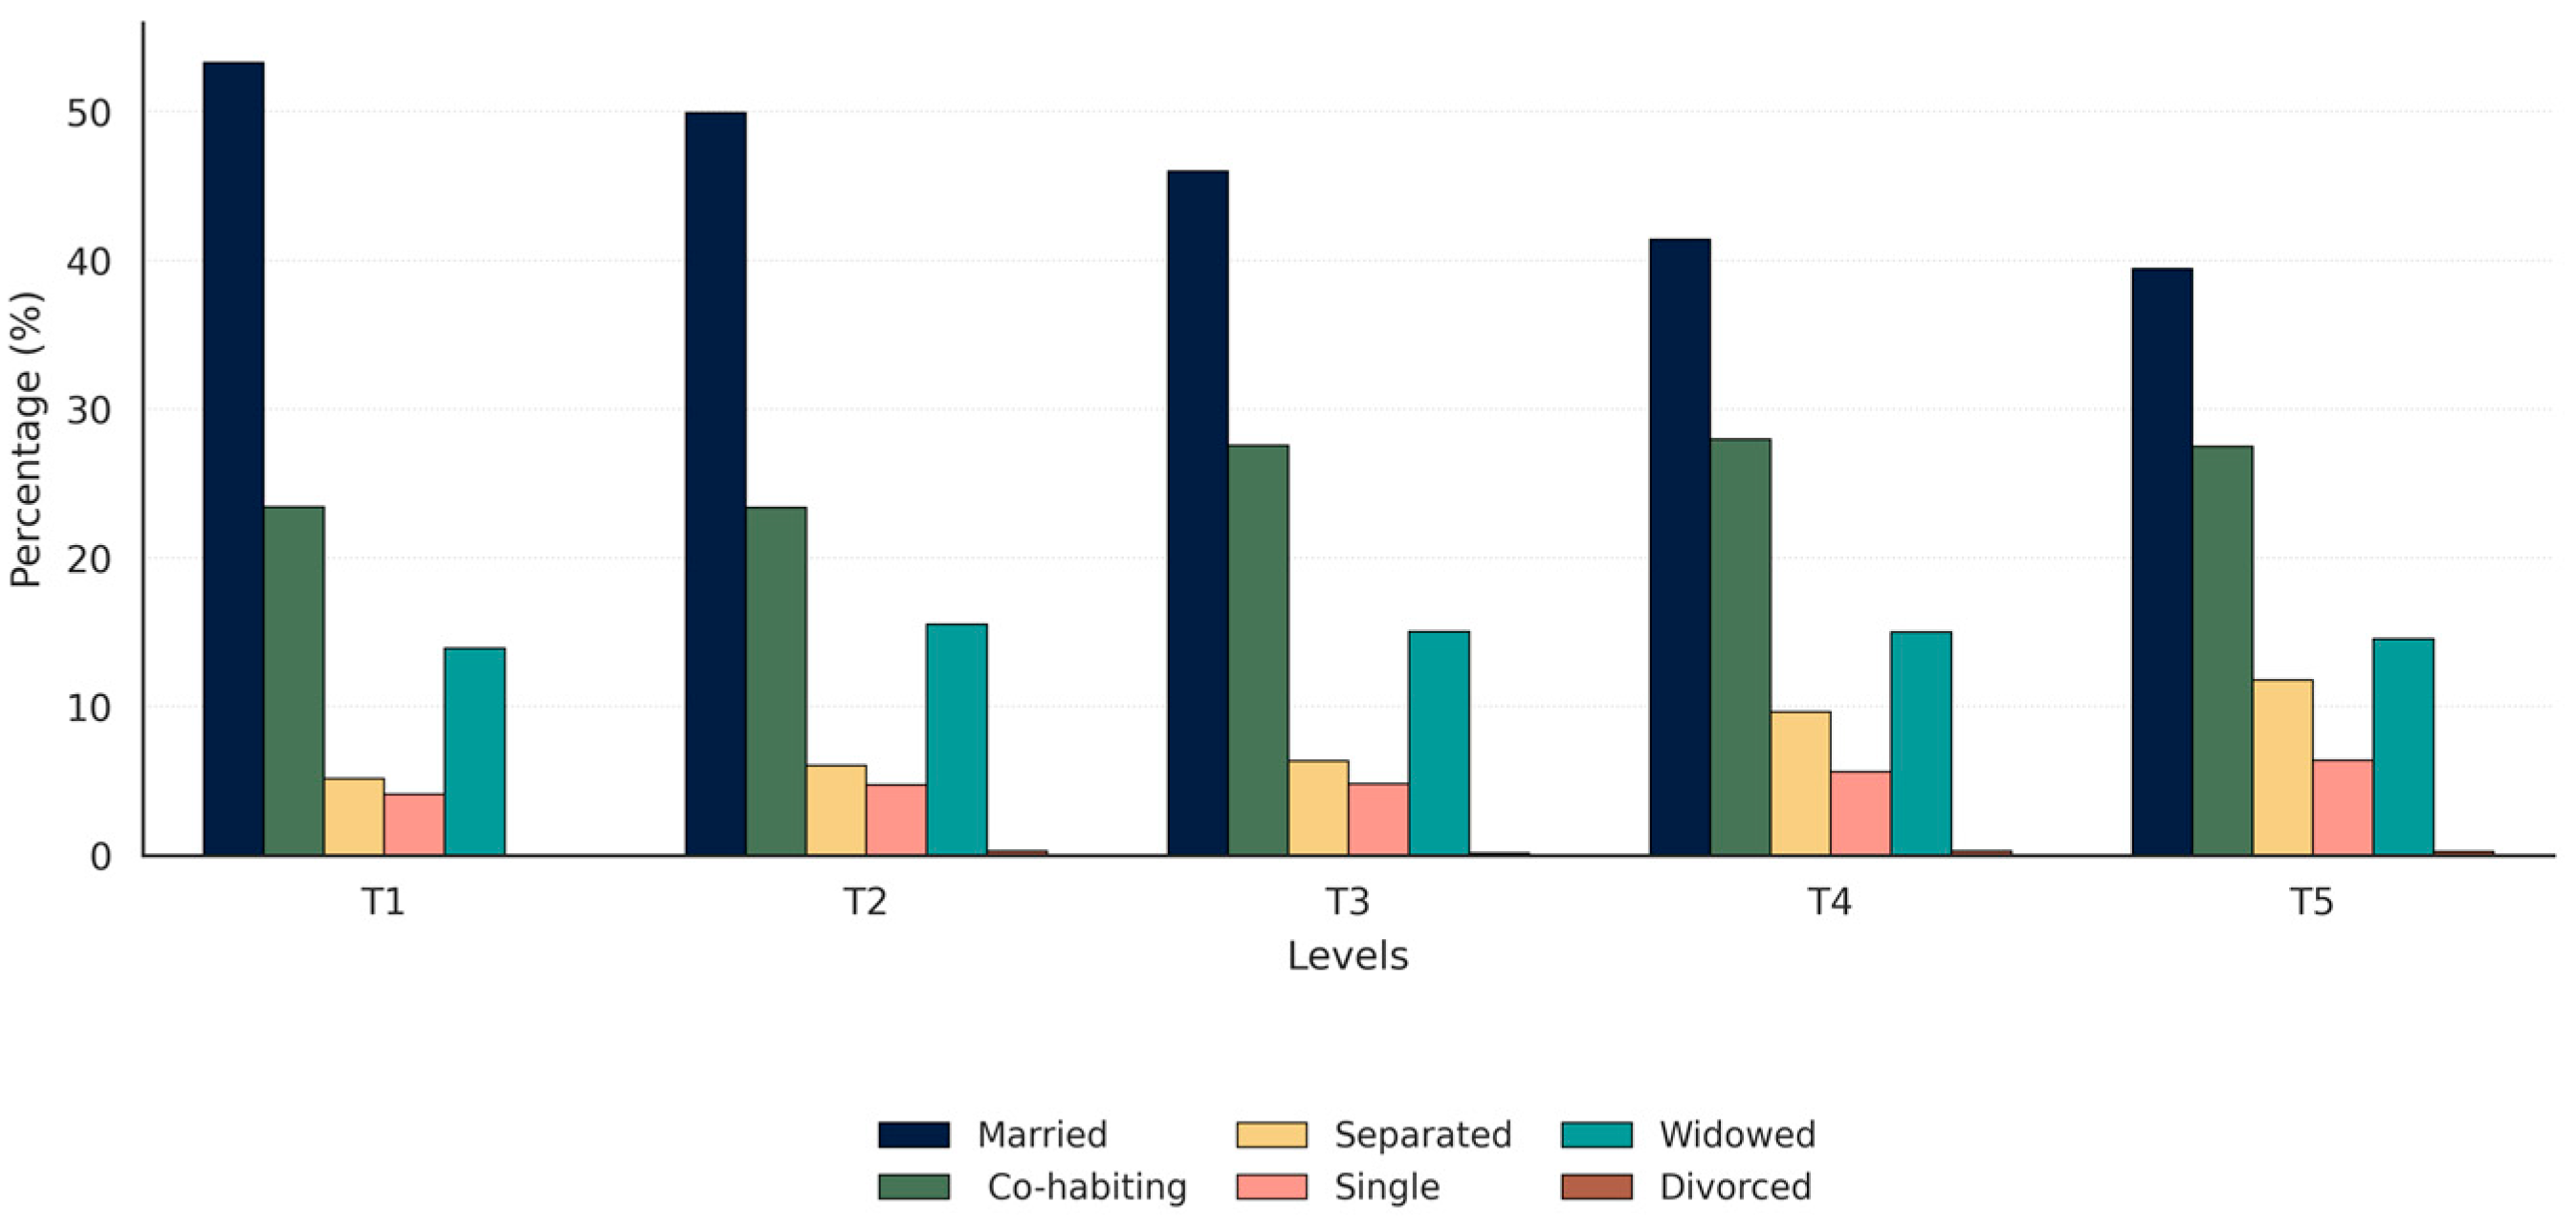
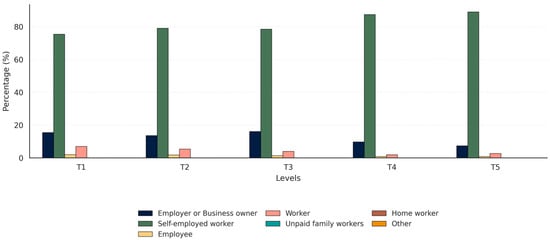
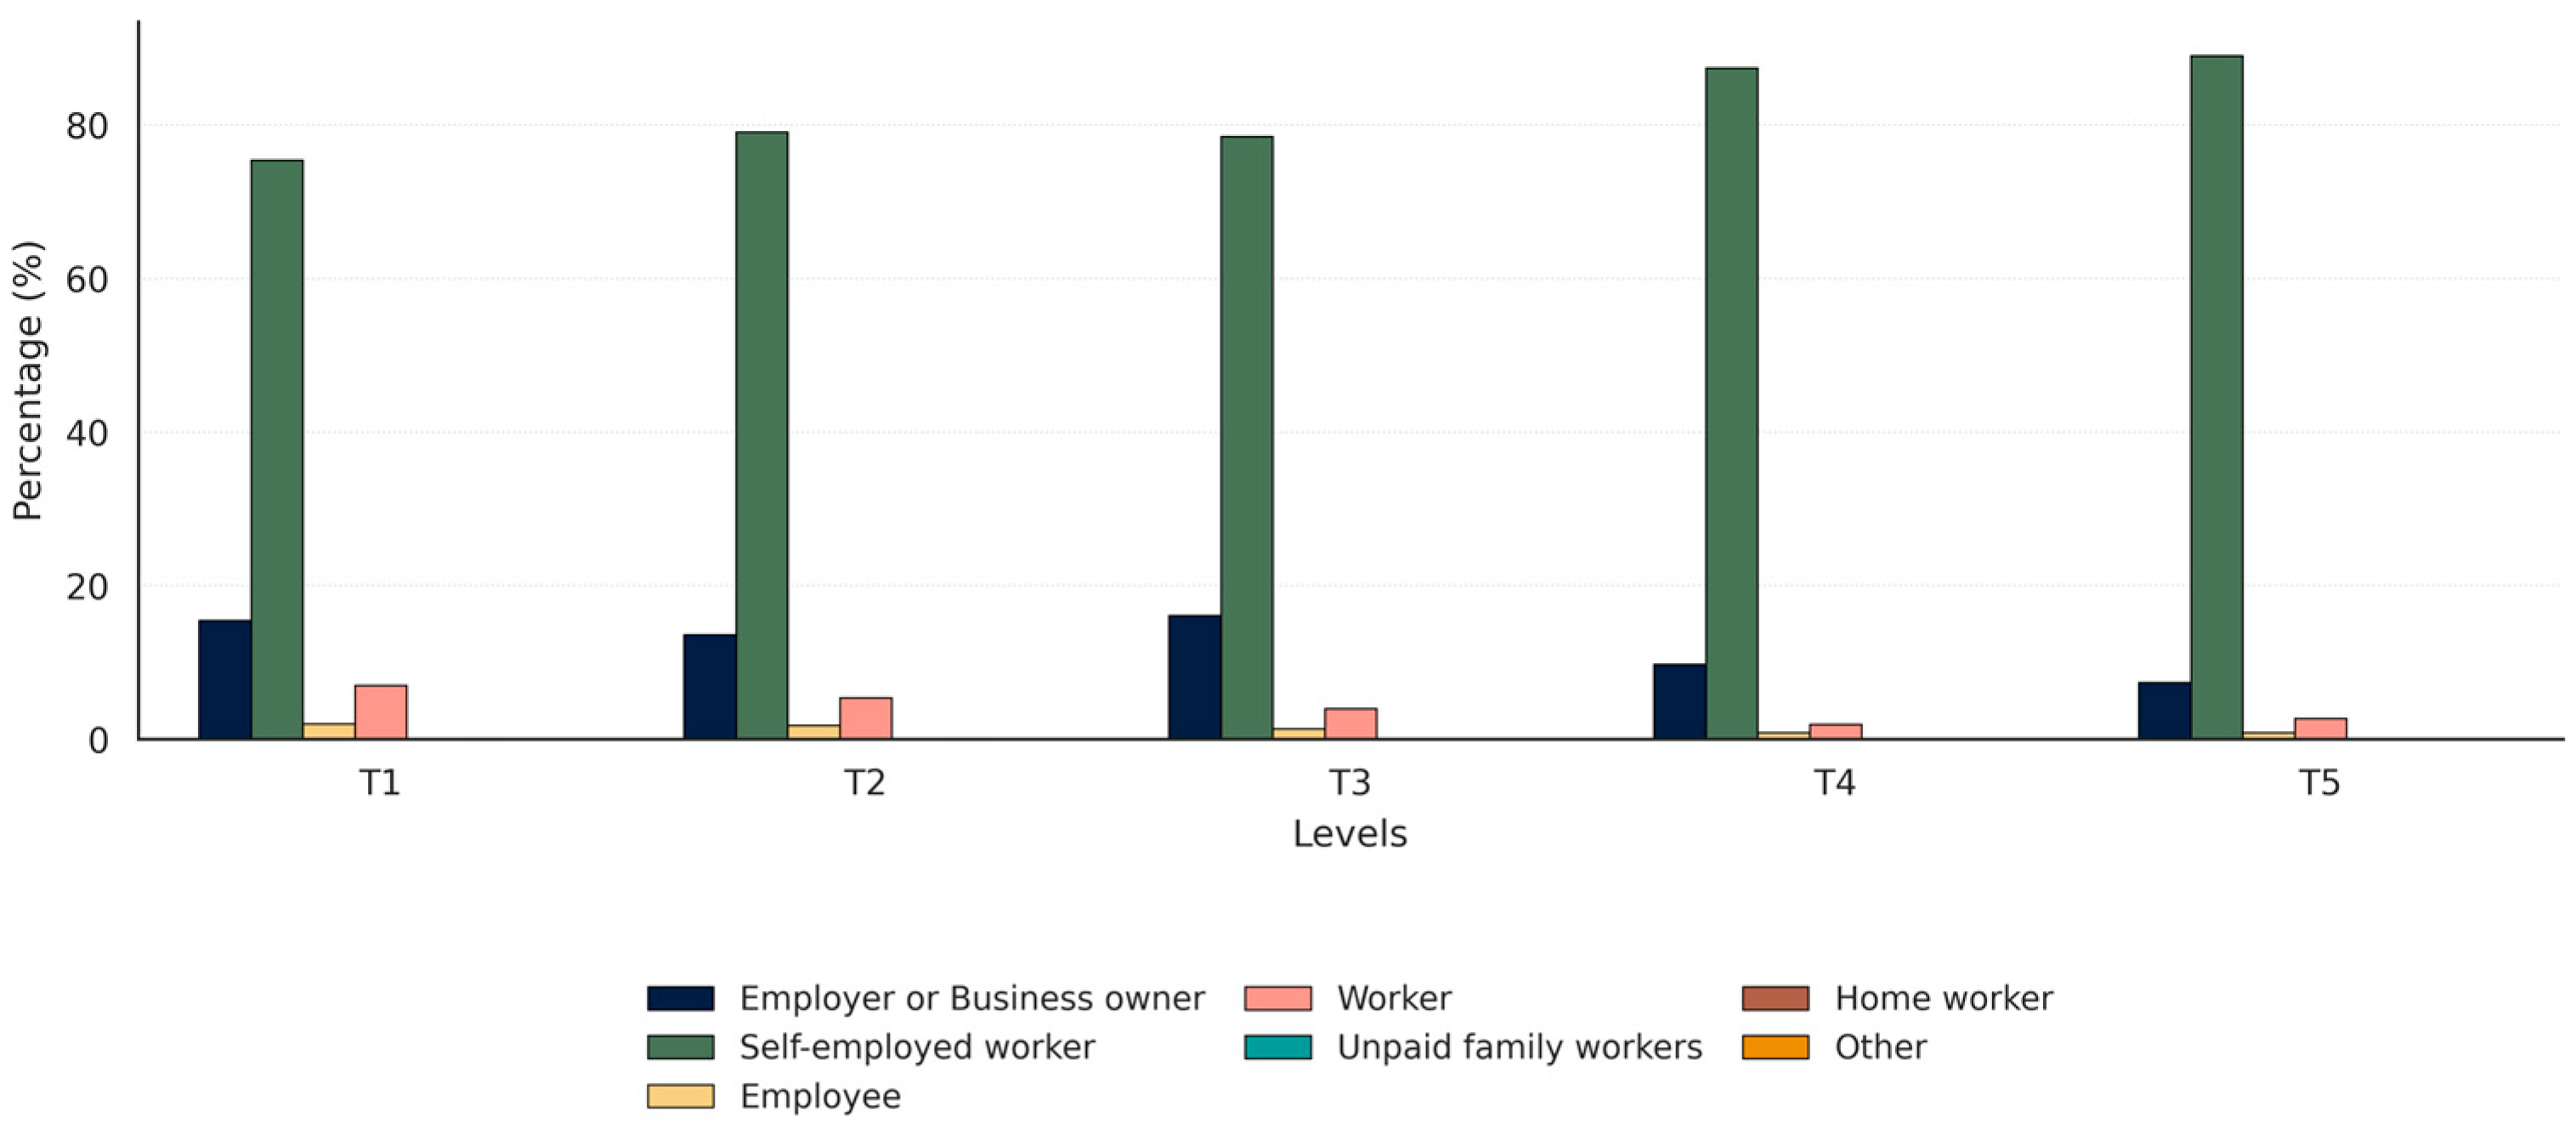
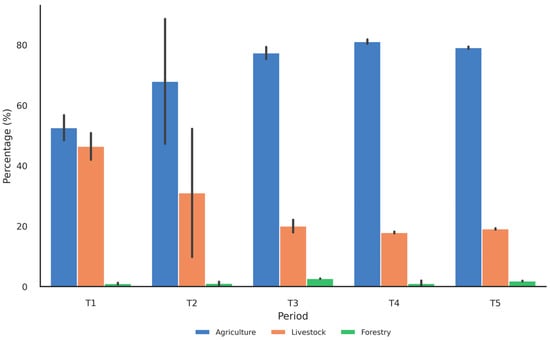
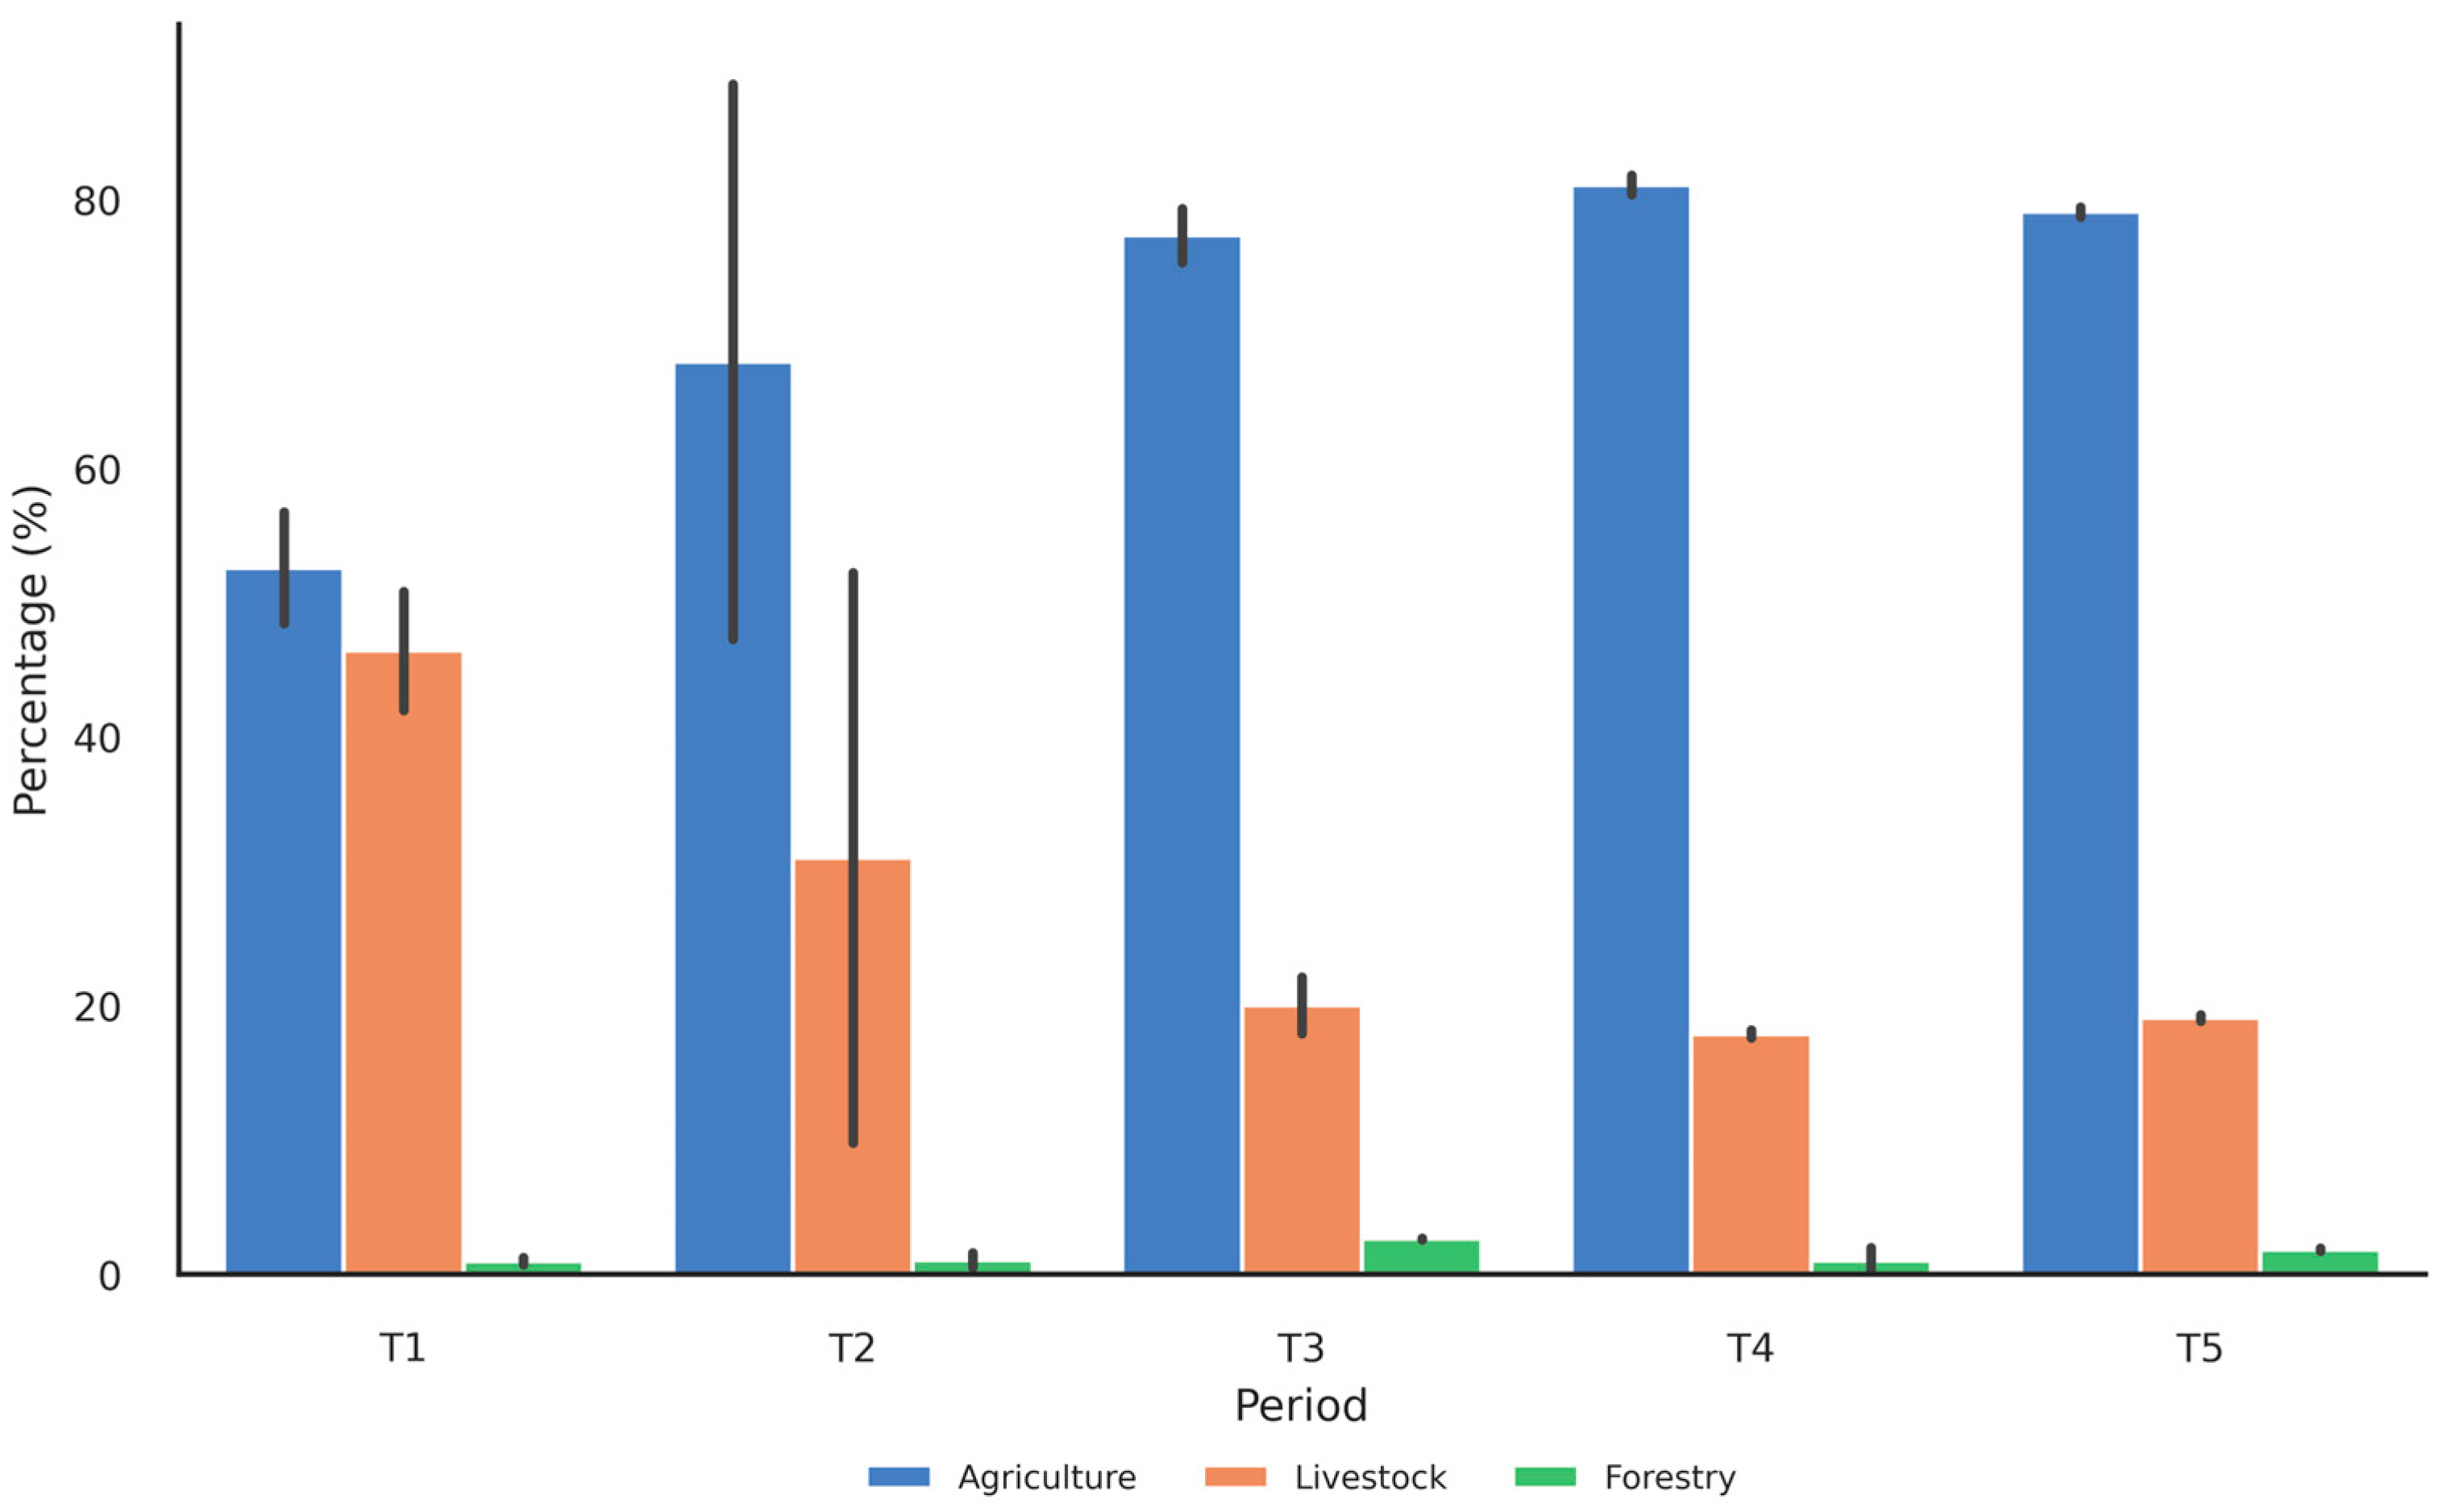
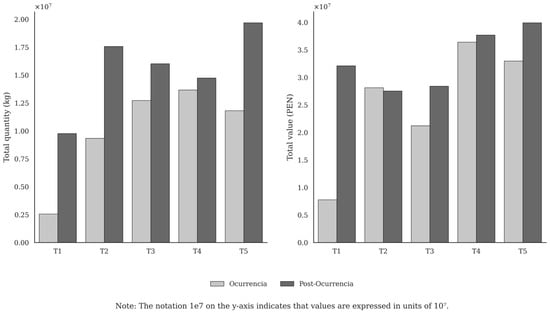
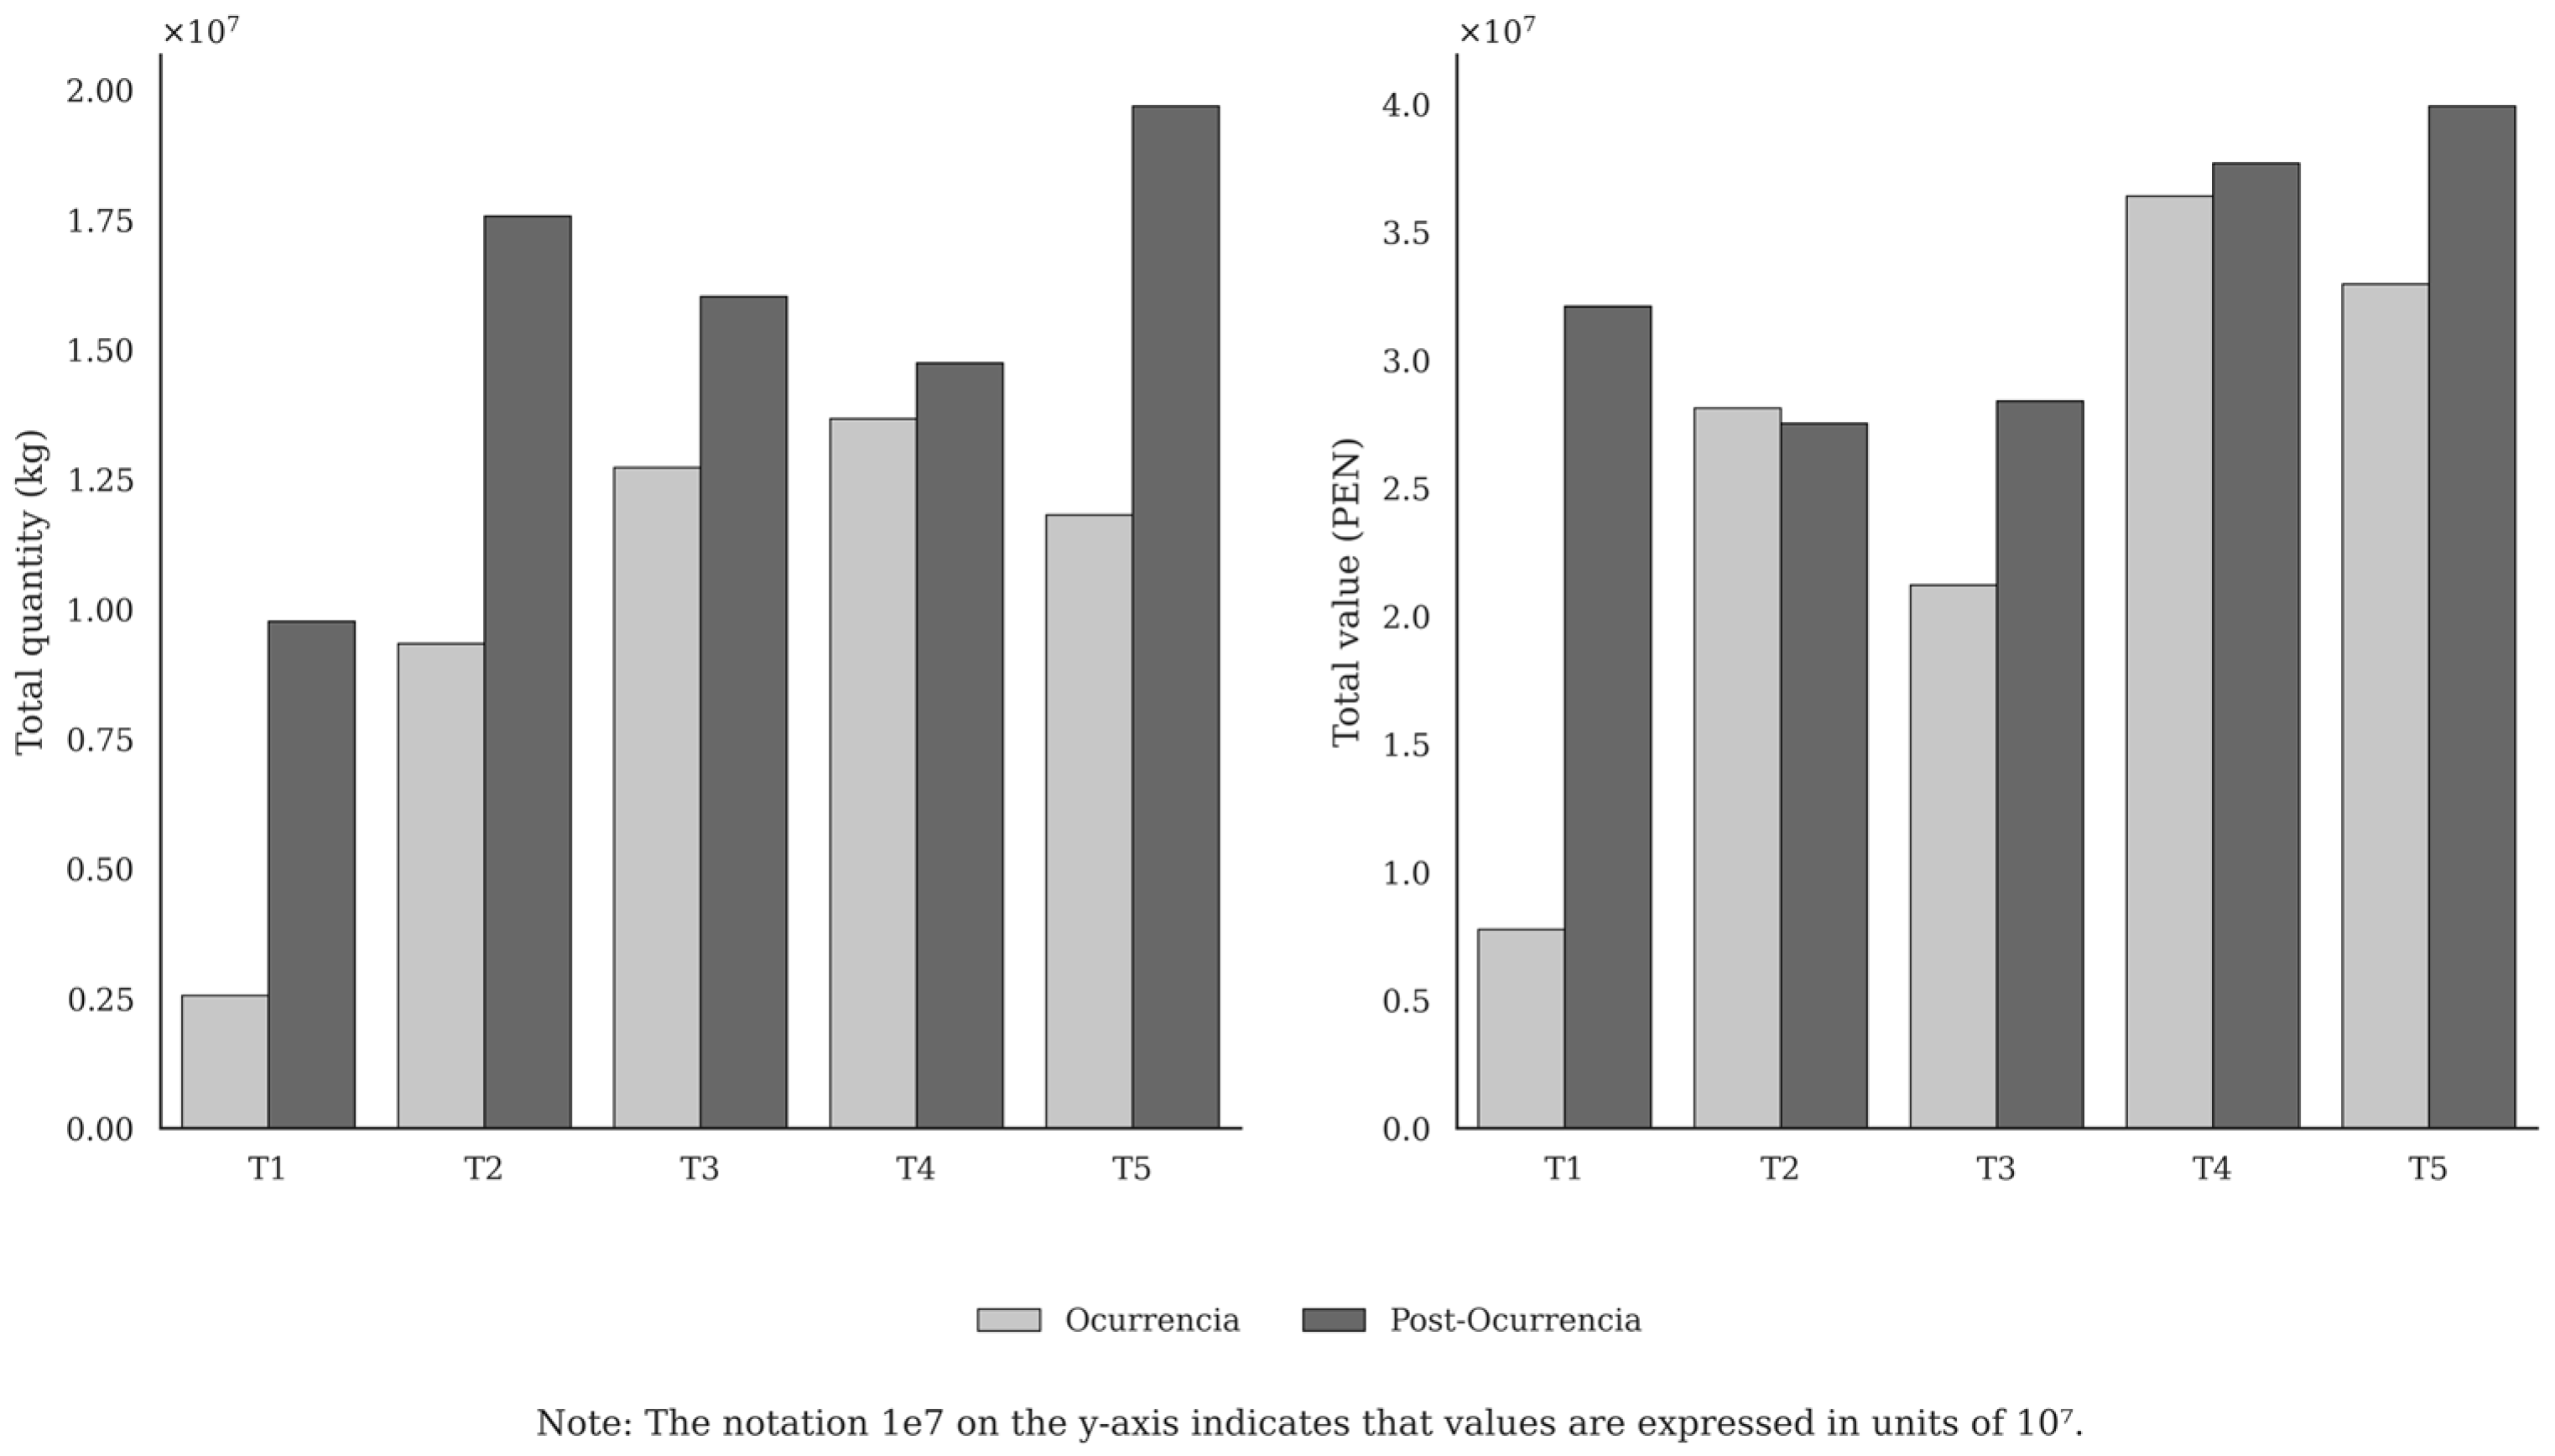
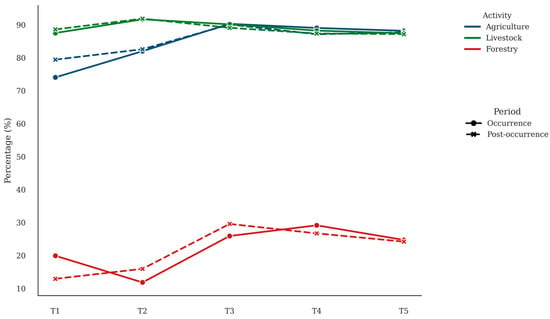
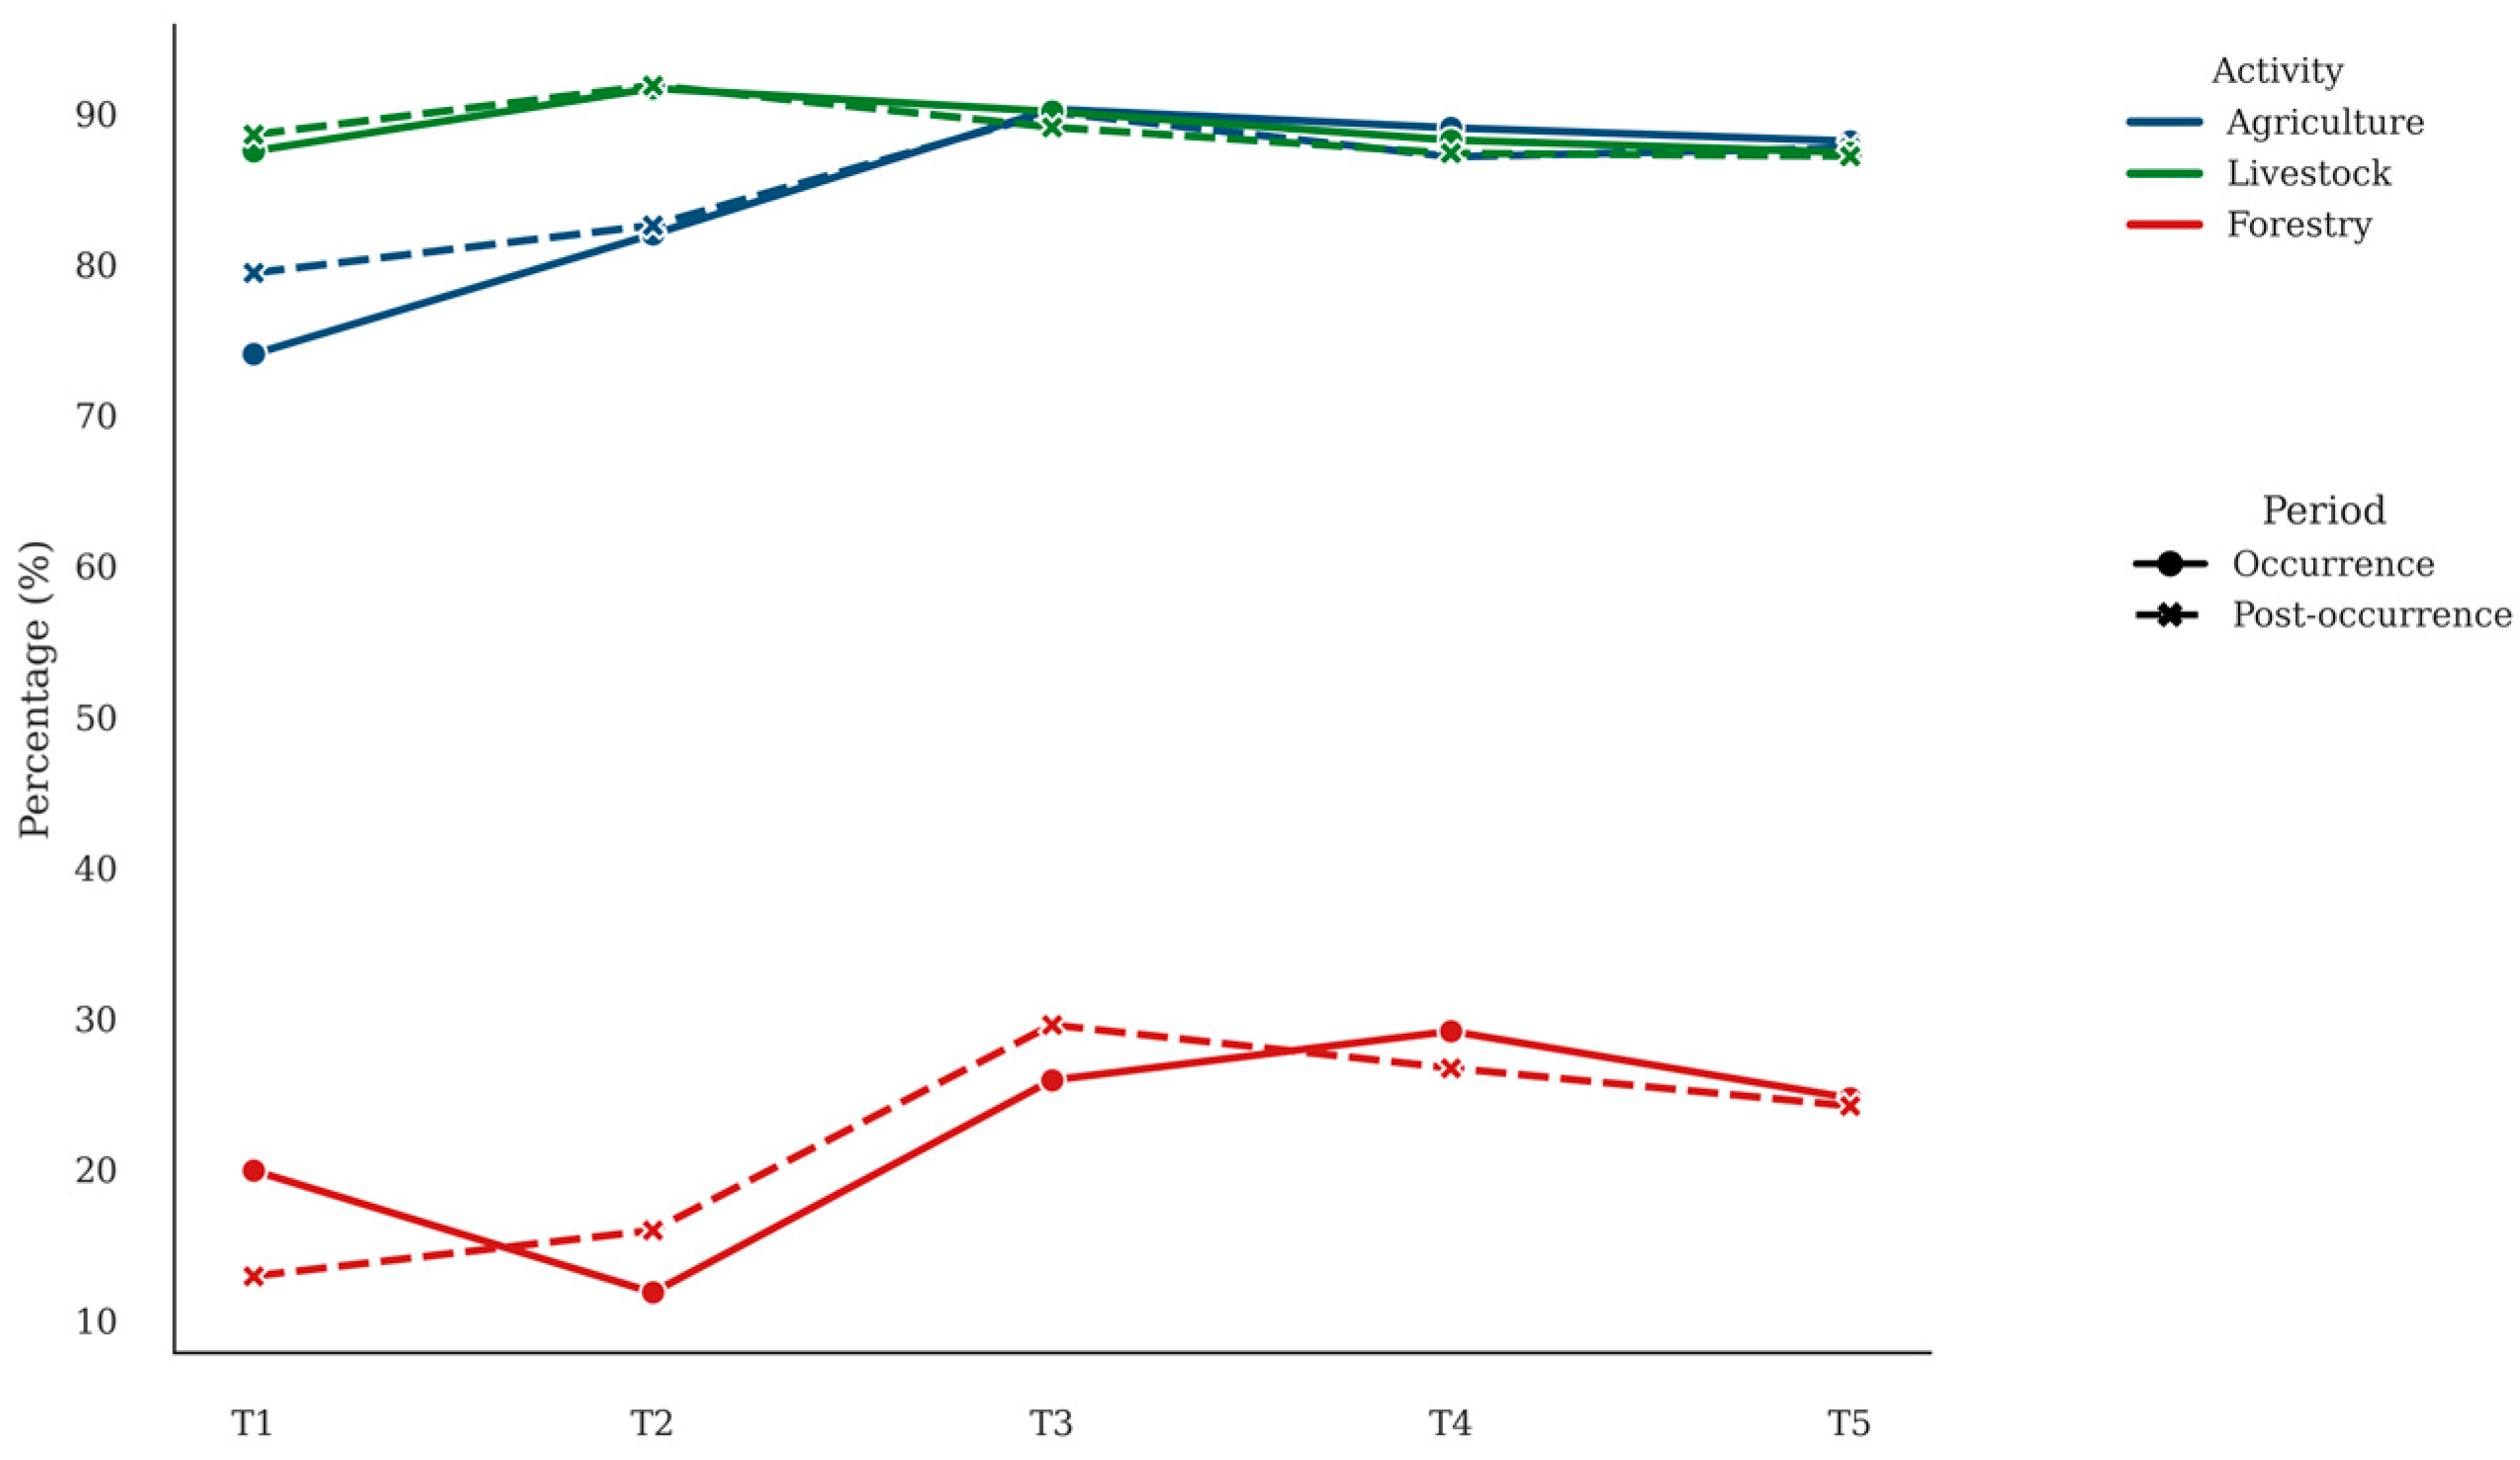
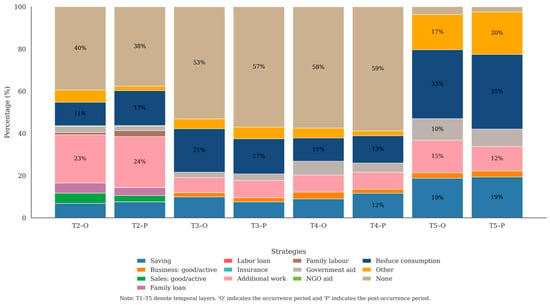
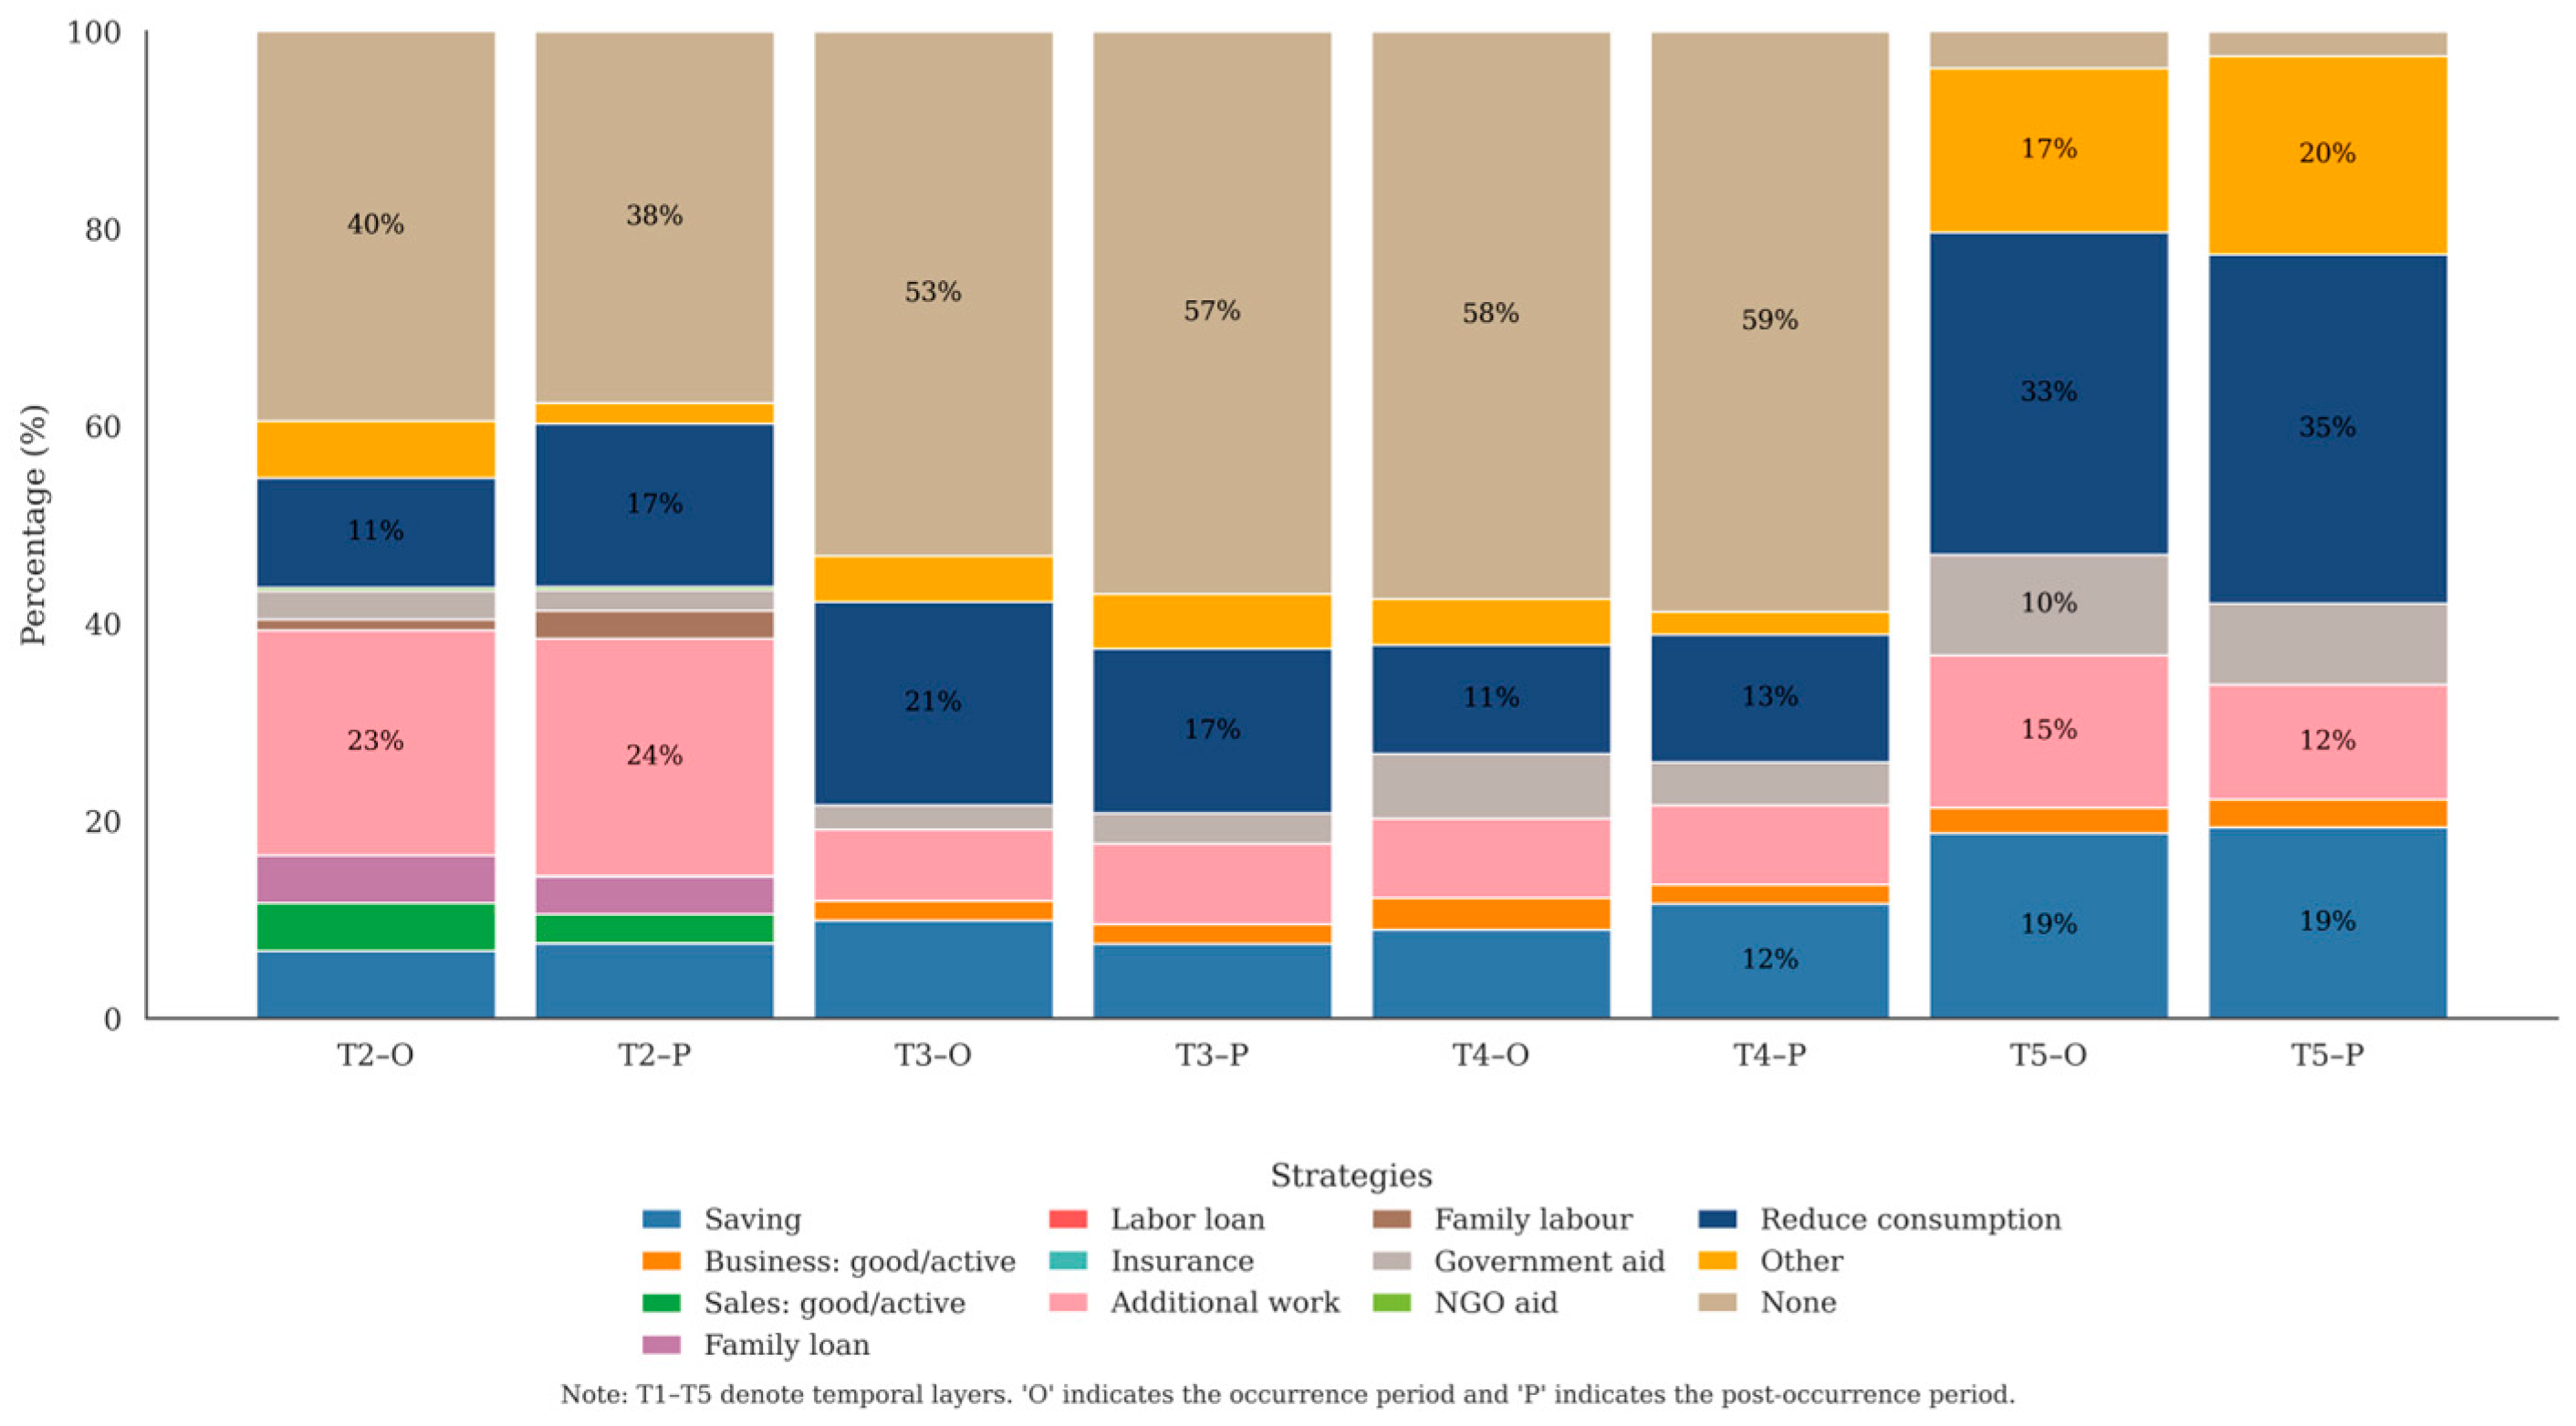

Disclaimer/Publisher’s Note: The statements, opinions and data contained in all publications are solely those of the individual author(s) and contributor(s) and not of MDPI and/or the editor(s). MDPI and/or the editor(s) disclaim responsibility for any injury to people or property resulting from any ideas, methods, instructions or products referred to in the content. |
© 2026 by the authors. Licensee MDPI, Basel, Switzerland. This article is an open access article distributed under the terms and conditions of the Creative Commons Attribution (CC BY) license.