


Abstract
The valorization of agro-industrial byproducts through pyrolysis represents a sustainable route for generating multifunctional raw materials within the framework of a circular bioeconomy. In this study, rice husk (RH) and sugarcane bagasse (SCB) were pyrolyzed in a semi-continuous reactor at 500 °C in order to compare product yields and to characterize resulting gas, aqueous and tar fractions. SCB produced the highest bio-oil yield (44.2 wt%), whereas RH generated the highest char yield (42.9 wt%), consistent with its higher ash and lignin contents. In both cases, tar represented about 12 wt% of the bio-oil. Detailed characterization revealed that the liquid products contained oxygenated compounds of interest, mainly carboxylic acids, ketones, and phenols. Acetic acid was the predominant compound in the aqueous phases, while tars were composed mainly of phenols, ketones, furans, and acids. Particularly, phenols accounted for 52.6% and 37.8% of the total chromatographic area in RH and SCB tars, respectively, whereas ketones represented about 10% in both cases. These results show that pyrolysis of agro-industrial residues not only enables energy recovery but also provides liquid fractions enriched in value-added chemicals.
1. Introduction
The growing demand for renewable energy and chemical resources, together with the need to reduce the environmental impact of agro-industrial residues, has driven the development of thermochemical processes applied to residual lignocellulosic biomass. Among these processes, pyrolysis stands out as a versatile technology capable of converting a wide range of low-cost lignocellulosic feedstocks into diverse liquid, solid, and gaseous products. These products not only have direct energetic applications but also serve as chemical platforms to produce value-added compounds which can be used in sectors such as materials science, fine chemistry, and renewable energy.
Biomass pyrolysis is the thermal decomposition of organic matter in the absence of oxygen, or in the presence of an amount significantly lower than that required for complete combustion. During this process, a complex network of sequential and parallel reactions occurs, including dehydration, decarboxylation, isomerization, depolymerization, aromatization, and carbonization, leading to the cleavage of chemical bonds within the biopolymers which constitute the biomass, and the formation of new bonds in intermediate products, ultimately yielding liquids (bio-oils), permanent gases, and solid char [1,2]. Bio-oils are often considered the sole liquid product of pyrolysis; however, when their water content exceeds approximately 30 to 45 wt% [3], or when immiscible chemical species are present, phase separation occurs, resulting in two distinct fractions: an aqueous phase and an oily, tar-like phase. The physical and chemical properties of the raw material, the reactor configuration and the operational parameters of the pyrolysis process directly influence the yields and composition of the resulting products and their respective fractions [4].
Among the most abundant lignocellulosic residues of agro-industrial origin suitable for pyrolysis are rice husk (RH) and sugarcane bagasse (SCB). The conventional management of these byproducts poses environmental and economic challenges. Globally, the International Grains Council (IGC) estimates that the 2023/24 world rice production reached approximately 523 million tons, generating over 100 million tons of rice husk. Regarding sugarcane, the Food and Agriculture Organization of the United Nations (FAO) reported a global annual production exceeding 2 billion tons, of which 30 to 40 wt% is bagasse, thus representing an estimated worldwide generation of 300 to 700 million tons of SCB.
Rice husk is a lignocellulosic material characterized by its high silica content (16 to 21 wt%), of which 85 to 90% is amorphous [5]. This particular composition makes it an attractive source for functional silica, pozzolanic materials in cement, reinforcing agents in polymers, and adsorbents, among other uses [6]. In addition, rice husk has been utilized as a solid fuel (pellets, briquettes) in industrial boilers and as a precursor for biochar, activated carbon, and advanced carbon-based materials [5,6].
Sugarcane bagasse, on the other hand, has a high holocellulose content and a relatively low ash content compared with materials such as rice husk. Traditionally, it has been used as an internal energy source in sugar industries, where it is combusted in cogeneration boilers to produce steam and electricity, often allowing sugar mills to achieve energy self-sufficiency or even export surplus electricity. Furthermore, it has been employed as a wood substitute in the manufacture of paper and cardboard, fiberboards, biodegradable packaging, and plant-fiber composites, as well as in the production of biofuels such as biogas, bioethanol, and biohydrogen through both biological and thermochemical routes [7].
The compositional differences between rice husk and sugarcane bagasse directly affect the product distribution during pyrolysis, influencing the yields of solid (char), liquid (bio-oil), and gaseous fractions, as well as their physicochemical properties.
The transition towards a circular bioeconomy has intensified interest in bio-oil as a renewable source of oxygenated compounds for biorefinery applications. In this framework, fractionation into aqueous and oily (tar) phases provides a relevant basis for its characterization, since both phases comprise compounds with distinct chemical features and potential upgrading pathways. Previous studies demonstrated the potential of these fractions as sources of phenolic compounds and carbohydrate-derived molecules of industrial relevance [8,9,10,11].
However, research has predominantly focused on the aqueous phase, whereas the tar fraction remains insufficiently characterized despite its potential as a source of value-added chemicals and functional materials. Accordingly, the novelty of the present study lies in the comparative characterization of both the aqueous and oily phases derived from rice husk and sugarcane bagasse pyrolysis, using as-provided feedstocks to preserve their raw chemical features. The results provide a basis for the design of future valorization strategies and for subsequent life-cycle and techno-economic assessments of agro-industrial waste-based biorefineries.
In this context, this work aims to study the pyrolysis of rice husk and sugarcane bagasse under controlled conditions, evaluate the yield and composition of the obtained products, and analyze the potential of the aqueous and oily fractions of the resulting bio-oils as multifunctional feedstocks. Emphasis in the analytical effort is given to the tar fractions, as they have not received as much attention in the literature as the aqueous fractions. This approach seeks to contribute to the integral valorization of agro-industrial residues by proposing technological alternatives aligned with the principles of sustainability and circular bioeconomy.
2. Materials and Methods
2.1. Raw Biomass Materials
The rice husk (RH) (Oryza sativa L.) was provided by a rice mill located in Santa Fe Province, Argentina, with particle sizes ranging from 1.68 to 2.38 mm.
The sugarcane bagasse (SCB) (Saccharum officinarum L.) was supplied by a sugar mill in Tucumán Province, Argentina, with particle sizes between 0.59 and 0.84 mm.
RH and SCB were used as received, as the driving idea is the valorization of residual biomass with the characteristics it possesses at the time of disposal. In this way, preliminary processing steps such as drying, grinding, and sieving were avoided.
2.2. Biomass Characterization
The moisture content was determined according to ASTM D3173 [12]. The ash content, that is, the inorganic residue obtained after biomass combustion, was determined using ASTM D3174 [13]. Volatile matter, defined as the gaseous components (excluding water vapor) released from organic matter upon heating, was determined following ASTM D3175 [14]. The fixed carbon content was calculated by difference from the volatile matter and ash values, expressed on a dry basis.
Elemental analysis of the biomasses was performed by combustion in pure oxygen at 1000 °C, converting the organic components into simple gases (CO2, H2O, N2, and SO2). Gas separation was achieved using a Porapak-packed gas chromatography column, and detection was carried out with a thermal conductivity detector (TCD). Analyses were performed on a LECO CHN628 analyzer (LECO Corporation, St. Joseph, MI, USA), previously calibrated using a sulfanilamide standard.
The higher heating value (HHV) of the biomasses was estimated using Dulong’s formula (Equation (1)) [15], based on their elemental composition:
where C, H, and O represent the mass percentages of carbon, hydrogen, and oxygen, respectively, on a dry basis.
The lignocellulosic composition of the biomasses was determined according to the methods of Neutral Detergent Fiber (NDFa) (ANKOM, ISO 16472:2006 [16]), Acid Detergent Fiber (ADFs) (ANKOM, ISO 13906:2008 [17]), and Acid Detergent Lignin (ADL) (PROMEFA V2 protocol for ANKOM equipment). The following relationships were applied in the calculations: the lignin content (%) corresponded to the ADL value; the cellulose content (%) was obtained by subtracting the ADL value from the ADFs value; and the hemicellulose content (%) was determined by subtracting the ADFs value from the NDFa value.
Thermogravimetric analysis (TGA) of the biomasses was performed using a Mettler Toledo STARe TGA/SDTA851 module (TA Instrumetns Inc., New Castle, DE, USA), equipped with an automatic control and data acquisition system. Each sample was heated from room temperature to 900 °C at 10 °C min−1 under a 20 mL min−1 nitrogen flow.
Differential scanning calorimetry (DSC) was carried out using a Mettler Toledo 821e module (TA Instrumetns Inc., New Castle, DE, USA) with dual furnaces (sample and reference crucibles). Samples were heated from 30 °C to 600 °C at 10 °C min−1 under a 20 mL min−1 nitrogen flow.
The inorganic composition of the biomasses was determined by X-ray fluorescence spectroscopy (XRF) using a Shimadzu EDX-720 spectrometer (Shimadzu Corporation, Kyoto, Japan). Solid samples were mounted on a polypropylene window sample holder, vacuum-dried, and analyzed across the elemental range from sodium (Na) to uranium (U).
2.3. Pyrolysis Experiments
2.3.1. Equipment
The pyrolysis experiments were conducted in a semi-continuous system designed and built at INCAPE (see Figure 1). The reactor features a quick-coupling system that allows its insertion into the furnace once the desired temperature is reached, ensuring fast heating of the loaded biomass. The system also enables removal of the solid products without cooling the furnace, which enhances operational efficiency. The setup includes liquid collection and gas sampling systems. The horizontally operated reactor is a cylindrical stainless-steel tube, 4.2 cm internal diameter and 90 cm length, equipped with a 600 µm stainless-steel mesh basket to contain the biomass and a gas inlet nozzle.
Figure 1.
Schematic representation of the biomass pyrolysis system.
The heating system consists of an ORL TL 2Z tubular electric furnace with dual digital temperature controllers. A guide tube slightly larger than the reactor diameter ensures uniform heating inside the furnace. Once inserted, the reactor is quickly coupled to a non-refrigerated liquid trap connected to a condensation system comprising a cooling coil and jacketed collector, with an exhaust line for non-condensable gases.
2.3.2. Experimental Procedure
The furnace was heated to the pyrolysis temperature (500 °C) and maintained for 30 min to stabilize. The biomass was then loaded into the reactor, sealed with the carrier gas inlet lid, and nitrogen was introduced at 90 mL min−1. The reactor was slid into the guide tube and coupled to the condensation system (trap–condenser–collector).
Pyrolysis was carried out for 30 min, during which the liquid products accumulated in the trap and collector, while the gases were vented after sampling. Gas samples were taken using 3 L Tedlar bags for subsequent chromatographic analysis. After completion, the reactor was disconnected, cooled to room temperature under N2 flow, and the char was recovered from the basket and weighed. The bio-oil was separated into aqueous and tar phases by centrifugation at 3000 rpm for 15 min, and each phase was weighed with a precision balance. Gas yield was determined by difference in the mass balance. Pyrolysis experiments for each biomass were carried out in triplicate mode under the same operating conditions, and product yields are reported including the standard deviation
Given the system configuration, new biomass batches (100 g (RH) and 130 g (SCB)) could be loaded after each run, allowing to accumulate enough product masses to meet different needs. Different biomass loads were used in order to obtain comparable bed fillings in the reactor, considering the different bulk densities and packing characteristics of RH and SCB.
2.4. Characterization of the Aqueous Bio-Oil Fraction
The aqueous fractions were analyzed by capillary gas chromatography (GC) using an Agilent 6890N chromatograph (Agilent Technologies, Santa Clara, CA, USA) equipped with an HP-5 column (30 m × 0.32 mm i.d., 0.25 µm film thickness, 5% phenyl methylpolysiloxane) and a flame ionization detector (FID). Data were processed using the Hewlett-Packard (Singapore) 3398A ChemStation software (G2070AA Rev. A.09.03). The oven program was: 30 °C for 2 min; ramp of 10 °C min−1 to 200 °C (hold 1 min); ramp of 30 °C min−1 to 320 °C (hold 18 min). Both the injector and detector temperatures were maintained at 300 °C.
Product identification was confirmed by GC-MS using a Shimadzu GC-2030 chromatograph (Shimadzu Corporation, Kyoto, Japan) coupled to a Shimadzu QP2020NX mass spectrometer (Shimadzu Corporation, Kyoto, Japan) with a SH-Rxi-5Sil MS column (30 m × 0.25 mm i.d., 0.25 µm film thickness). Interface and ion source temperatures were 310 °C and 220 °C, respectively. Spectra were matched against NIST and WR libraries.
Response factors were determined for standard mixtures representing acids (acetic acid), aldehydes and heterocyclic compounds (furfural), esters (ethyl acetate), phenols (phenol, guaiacol, syringol), ketones (acetone, 2-hydroxi-3-methyl-2-cyclopenten-1-one), alcohols (methanol) and ethers (1,2,4-trimethoxybencene), using tetralin as the internal reference (response factor = 1). Unidentified peaks (<0.5% total area) were assigned averaged response factors based on similar retention times.
Water content was determined by Karl Fischer titration (IRAM 21320 [18]). Density was measured gravimetrically using a 10 mL volumetric flask and precision balance at ambient temperature. pH was determined using DF pH indicator strips.
2.5. Characterization of the Tar Fraction
Tar phase in the bio-oils was analyzed by GC–MS using the same instrumentation and temperature programs described above, with the injector at 300 °C and detector interface at 310 °C. Data were collected over an m/z range of 40–600 at a scan rate of 5 scans s−1. Tar samples were diluted to 1 wt% in dichloromethane prior to analysis to obtain appropriate signal intensity for GC-MS analysis and to avoid detector saturation by major components. Chemical composition was determined semi-quantitatively (area %), assigning compounds with library matches > 80%. The relative content of each identified compound was calculated as the percentage of its chromatographic peak area with respect to the total integrated peak area. The relative abundance of each chemical family was obtained by summing the area percentages of the compounds assigned to that family.
Elemental composition and HHV of the tars were determined using the same procedures as for the biomasses. Water content was also measured by Karl Fischer titration.
Tars were further analyzed by Nuclear Magnetic Resonance (1H NMR) spectroscopy on a 300 MHz Bruker Avance Multinuclear spectrometer at 25 °C in CDCl3, and by Fourier-Transform Infrared (FTIR) spectroscopy (Shimadzu Prestige-21, Shimadzu Corporation; 400–4000 cm−1, 80 scans) to identify functional groups. Samples for FTIR analysis were prepared as KBr pellets (1:100 wt/wt) of ~13 mm diameter and 1 mm thickness.
2.6. Analysis of Pyrolysis Gases
The gaseous products were analyzed by capillary GC using an Agilent 6890N with on-column injection, GS-Carbon PLOT column (30 m × 0.53 mm i.d., 3 µm film), and TCD. CO2 was used as the cryogenic gas. The oven program was 0 °C for 2 min, ramp 10 °C min−1 to 200 °C (hold 2 min), with detector temperature at 180 °C. Identification and quantification were performed using certified calibration gases (H2, CO, CH4, CO2; Indura Argentina S.A., Garín, Argentina) and the corresponding calibration curves.
The lower heating value (LHV) of the gas mixture was calculated from its composition using Equation (2):
where is the volume fraction and LHVi (MJ m−3) is the lower heating value of each component, taken from Perry’s Chemical Engineers’ Handbook [19].
3. Results and Discussion
3.1. Biomass Composition
A detailed understanding of the chemical composition and physicochemical characteristics of biomass is essential for establishing correlations between the quantity and quality of the pyrolysis products and the structural components of the feedstock. Table 1 presents the proximate, ultimate, and lignocellulosic compositions, as well as the higher heating values (HHV), of the raw biomasses. In Table 1, “Others” corresponds to the organic material not accounted for as cellulose, hemicellulose or lignin and was calculated by difference; it may include extractives, proteins and other minor non-structural components.
Table 1.
Biomass composition.
The moisture content of both biomasses was below 12 wt%, which is suitably appropriate for thermochemical conversion processes. Low moisture is desirable because excess water requires additional drying energy, hinders reactor ignition (especially at pilot or industrial scale), and decreases the calorific value of the pyrolysis gas. Moreover, higher water content in the raw biomass leads to increased water content in the liquid pyrolysis product (bio-oil).
As shown in Table 1, RH and SCB exhibited markedly different compositions. RH contained significantly more ash than SCB, a characteristic which is widely reported for this material (for example, 20.26 wt% [20]). In pyrolysis, high ash content generally decreases the bio-oil yield and increases char and gas production [1].
The volatile matter, which was much higher in the case of SCB, represents gaseous and vaporized organic compounds released during thermal decomposition. The fixed carbon corresponds to the non-volatile fraction of the biomass, consisting mainly of polyaromatic hydrocarbons and oxygenated structures. The distribution of carbon between volatile and fixed carbon phases is consistent with the higher C and O contents observed in SCB compared to RH.
RH exhibited a substantially higher lignin content than SCB, although both biowastes contained less lignin than typical hardwood (18–25 wt%) and softwood sawdust (25–35 wt%) [21]. Some authors reported slightly higher lignin and hemicellulose contents in RH, for example, between 23.4–29.3 wt% for hemicellulose and 19.2–24.8 wt% for lignin [2]. Higher lignin content is associated with slower thermal decomposition and the need for higher process temperatures. In contrast, biomass richer in cellulose and hemicellulose decomposes faster and produces higher yields of gaseous and liquid products, with less solid residue [1]. The higher holocellulose (cellulose + hemicellulose) content of SCB compared with RH is consistent with reported literature values [22].
The HHVs were within the typical range but slightly lower than those reported in the literature (15.8 MJ kg−1 for rice husk [20] and 17–20 MJ kg−1 for sugarcane bagasse [23]).
These compositional differences directly influence the distribution of pyrolysis products and their physicochemical properties, as it will be discussed in the following sections.
3.2. Thermogravimetric and Calorimetric Analyses
The results from the thermogravimetric (TGA) and differential thermogravimetric (DTG) analyses of the raw biomasses are shown in Figure 2. The profiles are typical of lignocellulosic materials [24], where three temperature regions can be distinguished. The first region (from room temperature to ~170 °C) corresponds to mass loss due to the evaporation of water and light volatiles. The second region (170–580 °C) is the main pyrolysis stage driven by the release of many compounds from the decomposition of hemicellulose, cellulose, and a large fraction of lignin. The third region (580–900 °C) exhibits minor additional mass loss and is attributed to the degradation of residual lignin and carbonaceous matter.
Figure 2.
TGA and DTG analyses of the biomasses. (a) rice husk (RH); (b) sugarcane bagasse (SCB).
Moisture and light-volatile release presented peaks at 55.4 °C (RH) and 67.0 °C (SCB), with mass losses of 8.20 and 7.30 wt%, respectively. The largest degradation occurred in the second stage of heating (200–400 °C), during which 40–70 wt% of the biomass decomposed. Two thermal events were observed in this stage: the first one, starting at ~200 °C, peaked at 295 °C (RH) and 305 °C (SCB), which is mainly associated with hemicellulose degradation; the second one, starting at ~310 °C, peaked at 340 °C (RH) and 350 °C (SCB) and corresponds to cellulose decomposition. In the third stage (≥400 °C), gradual decomposition of part of the lignin and of the residual carbonaceous material was observed. The residual matter remaining at the end of the analysis corresponds primarily to ash and fixed carbon [24].
RH exhibited more residual carbon, consistently with its higher ash content, whereas SCB showed the largest mass loss in the second stage, in line with its higher holocellulose content and lower ash, producing little residual material.
The results of differential scanning calorimetry (DSC) analysis are shown in Figure 3. Each material shows an endothermic peak with a minimum around 100 °C, associated with moisture removal. Three subsequent exothermic peaks are then observed, with maxima at 291 °C (RH) and 298 °C (SCB), 353 °C (RH) and 364 °C (SCB), and 411 °C (RH) and 400 °C (SCB). These peaks are assigned to the thermal degradation of hemicellulose, cellulose, and lignin, respectively [25].
Figure 3.
DSC analysis of the biomasses.
These observations (mass-loss stages and exothermic events) are consistent with the compositional differences discussed in Section 3.1 and define the basis for interpreting ash-related phenomena in the next subsection.
3.3. Ash Composition
Ash represents the inorganic fraction of biomass and is mainly composed of oxides of various chemical elements. The composition of ash varies significantly among different biomass. For instance, herbaceous biomasses and agricultural residues generally show higher ash contents than woody biomass and higher proportions of elements such as Cl, K, N, Na, S, and Si [21].
Table 2 shows the inorganic composition of the biomass ashes. Silica (SiO2) was the predominant component in both biomasses; particularly, SiO2 accounted for 90.2% of the ash in RH, making this feedstock an important source of silica, as widely reported in the literature [5,6,21]. The calcination and pyrolysis of RH are among the most extensively studied methods for producing nanostructured silica, which has various applications in construction, the chemical and electronic industries, glass and ceramic manufacturing, cement doping, and the production of polymeric composite materials, among other potential uses [5,6].
Table 2.
Ash composition (wt%).
In contrast, ash from SCB contained a relatively high proportion of CaO, along with smaller amounts of Al2O3, Fe2O3, K2O, and Cl oxides. Other authors also identified these compounds, e.g., Vassilev et al. [21] and Katare and Madurwar [26], with different orders of prevalence. Katare and Madurwar [26] reported that the ash composition of sugarcane bagasse varies depending on industrial operations and combustion conditions, but is primarily composed of SiO2 and CaO. Similarly, Vassilev et al. [21] found Fe2O3 contents in sugarcane bagasse comparable to those observed in this study.
It is necessary to know the composition of ash biomass if its application as a solid fuel is considered, as the interaction of the mineral components of ash at different temperatures gives rise to a complex series of processes such as agglomeration, sintering, and clinker formation. These phenomena cause several operational problems in boilers, including reduced heat transfer rates, material corrosion, fouling, slag or deposit formation on surfaces and obstruction of gas flow paths [27]. Several regression models and other predictive criteria have been developed over the years to help assess slagging and fouling tendencies based solely on the ash composition [28]. Most widely used parameters include the ratio of basic to acidic oxides (B/A), the bed agglomeration index (BAI), the fouling index (Fu), and the slag viscosity index (Sr) [28]. These indices were calculated for both biomasses using Equations (3) to (6) and are presented in Table 3. MgO and Na2O were not detected by XRF in either biomass ash; therefore, they were taken as zero in the calculations of these indices.
Table 3.
Slagging, fouling, and sintering indices of the biomasses.
Both biomasses showed B/A values below 0.5 and, therefore, a low tendency for slag formation, considering that ashes exhibit a low slagging tendency when B/A < 0.5, a medium tendency when 0.5 < B/A < 1, a high tendency when 1 < B/A < 1.75, and a severe tendency when B/A > 1.75 [28].
The BAI allows assessing operational problems during fluidized-bed combustion, which is the technology commonly used in power plants. Some authors have reported that bed agglomeration in fluidized-bed furnaces operating between 760 and 900 °C is dominated by the presence of silica, and bed agglomeration occurs when BAI < 0.15 [28]. However, the BAI index does not consider the content of SiO2 when predicting deposit formation (Equation (4)). It was observed that RH may lead to agglomeration, since its BAI value is below 0.15, whereas SCB does not exhibit such a tendency.
The fouling index (Fu) is used to evaluate the stickiness of ash, which leads to deposit formation. Low fouling is expected for Fu < 0.6, high fouling for Fu values up to 40, and extremely high fouling for Fu > 40 [28]. RH exhibits a very low Fu value and, consequently, a low probability of fouling, whereas SCB shows a high likelihood of this phenomenon occurring during combustion.
The slag viscosity index (Sr) is used to assess the tendency for slag formation inside the furnace. High Sr values correspond to high slag viscosity and, consequently, low slagging tendency. Low slagging occurs when Sr > 72, medium when 65 < Sr < 72, and high when Sr < 65 [28]. The low slagging tendency indicated by the B/A analysis is confirmed by Sr values higher than 72 for both biomasses.
3.4. Pyrolysis Yields
The pyrolysis experiments allowed the influence of biomass type on product yields and characteristics to be evaluated. The pyrolysis temperature adopted (500 °C) corresponded to the condition that maximizes liquid yield [1,29].
Table 4 shows the product yields, indicating significant differences which are attributable to the specific characteristics of each biomass. In both cases, the aqueous phase was the predominant fraction.
Table 4.
Product yields (wt%) from the pyrolysis of RH and SCB at 500 °C.
The highest bio-oil yield was obtained from SCB, 88% corresponding to the aqueous phase. This behavior is consistent with the high holocellulose content of SCB (see Table 1). Such a result agrees with previous reports in the literature, as cellulose pyrolysis produces high bio-oil yields, while hemicellulose produces moderate yields [1]. Qu et al. [30] carried out the pyrolysis of the three main components of lignocellulosic biomass between 350 and 650 °C and found yields of bio-oil of 45–65 wt% for cellulose, 43–53 wt% for hemicellulose, and 22–40 wt% for lignin, concluding that cellulose is more volatile than hemicellulose. Accordingly, materials with higher cellulose content are expected to produce higher liquid yields.
In contrast, the pyrolysis of RH was characterized by a high char yield, consistent with the elevated ash and lignin contents of the raw biomass (see Table 1). Both biomasses produced approximately 5 wt% of tar, values which are comparable to those reported in previous studies (3–6 wt%) for pine sawdust, mesquite sawdust, and wheat husk pyrolyzed at 550 °C in a fixed-bed reactor [29].
Other authors reported different pyrolysis product yields for the same biomasses, which depended on the reactor type and operating conditions. For example, Alvarez et al. [31] studied the fast pyrolysis of rice husk at temperatures between 400 and 600 °C using a bench-scale continuous unit equipped with a conical spouted-bed reactor with continuous char removal. They obtained liquid yields between 67 and 71 wt%, gas yields between 1 and 9 wt%, and char yields between 24 and 32 wt%. Tsai et al. [32] performed fast pyrolysis experiments in a horizontal fixed-bed tubular reactor using rice straw, sugarcane bagasse, and coconut shell, reporting that at 500 °C, the char and bio-oil yields were 33 and 47 wt%. These authors also observed a higher liquid yield for sugarcane bagasse compared to the other two biomasses. In a subsequent study, the same group performed pyrolysis experiments with rice husk in the same reactor and observed that the char yield decreased from 84 to 47 wt% as the pyrolysis temperature increased from 400 to 500 °C, while the bio-oil yield increased from 11 to 36 wt% [33].
It is important to emphasize the complexity of comparing the product distributions obtained in this study with those reported in the literature. This is primarily because biomasses of the same type can exhibit markedly different product distributions due to variations in their intrinsic characteristics, which are influenced by factors such as geographic origin (differences in soil and climate), harvesting and pretreatment protocols, among others. Differences in the pyrolysis process itself—reactor type, temperature, pressure, particle size, and moisture content—also play a major role.
Scale-up would likely affect both product yields and composition due to changes in heat transfer, temperature gradients, and vapor residence time. In general, shorter vapor residence times tend to favor liquid production, whereas longer residence times may promote secondary cracking and modify product composition.
Moreover, the results shown in Table 3 indicate that differences in the lignocellulosic composition of the raw biomasses significantly influenced the distribution of their pyrolysis products. Similar conclusions were reported by Biswas et al. [34] for corn cob, wheat straw, rice straw, and rice husk.
3.5. Pyrolysis Gas Composition
The gas product flow during pyrolysis reached its maximum approximately 10 min after the start of each experiment, at which point samples were collected for compositional analysis. As shown in Figure 4, the gases were composed mainly of carbon oxides (CO and CO2) and methane, in addition to the nitrogen used as inert carrier gas.
Figure 4.
Composition and lower heating value (LHV) of the pyrolysis gases.
The low hydrogen concentrations in the gases were similar to those reported by other authors for the same biomasses [31,35]. The proportions of CO and CO2 were comparable, suggesting that the deoxygenation pathways via decarbonylation and decarboxylation reactions occur to a similar extent. The high CH4 content in the gases may be attributed to the cracking of O–CH3 groups from lignin, as concluded by Yang et al. [36], who studied the pyrolysis of cellulose, hemicellulose, and lignin and observed that at 500 °C, lignin produced the highest CH4 yield due to the cracking of these functional groups.
Santamaria et al. [37] reported that the composition of the gas produced during biomass pyrolysis depends on several factors, including reactor configuration, heating rate, residence time, reaction atmosphere, biomass composition, and temperature. Regarding the influence of biomass composition, they found that high CO2 concentrations in the gas stream may result from the abundance of carboxyl groups in the feedstock, and that a high ash content promotes decarboxylation reactions, increasing CO and CO2 yields. A behavior consistent with this view was observed for the biomasses studied in this work.
The heating value and composition of the gases generated from the pyrolysis of RH and SCB make them suitable for use as in situ heat sources for the pyrolysis process itself or for biomass pre-drying [38]; they could also be used as fuel for industrial gas-fired boilers [1].
3.6. Composition and Properties of the Aqueous Phases of the Bio-Oils
Pyrolysis liquids (bio-oils) are highly complex mixtures of various chemical species derived mainly from the depolymerization and fragmentation of the principal biomass components (cellulose, hemicellulose, and lignin), covering a wide range of molecular weights [29]. They can be considered as a microemulsion in which the continuous phase is an aqueous solution of decomposition products, primarily originating from holocellulose, that stabilizes the discontinuous oily phase composed of macromolecules belonging.
The aqueous phase of each bio-oil, characterized by a dark brown color and a distinctive smoky odor, flowed freely and was separated from the tar phase by centrifugation for subsequent characterization. Table 5 shows the physicochemical properties and organic composition of the aqueous bio-oil phases, which are necessary for evaluating potential utilization or valorization alternatives.
Table 5.
Physicochemical properties and organic composition of the aqueous phases of the bio-oils.
The water content of the aqueous phases, originated from both the inherent moisture of the biomasses and the dehydration reactions occurring during pyrolysis, was within the wide range reported in the literature; for example, 49.6 wt% for pine sawdust, 67.6 wt% for mesquite sawdust, and 84.4 wt% for wheat husk [29], approximately 45 wt% for pine sawdust, between 50 and 60 wt% for pure cellulose, and between 69 and 77 wt% for lignin [39]. The water content of the RH aqueous phase was within the range reported for lignin, consistent with the higher lignin content of this biomass, whereas that of SCB fell within the range reported for cellulose, in accordance with its higher cellulose content. However, the aqueous phase of SCB showed a lower water content than that obtained by Vecino Mantilla et al. [40], who conducted sugarcane bagasse pyrolysis in a fixed-bed reactor at temperatures between 460 and 520 °C and obtained between 66 and 73 wt% water in the aqueous bio-oil phase. The opposite trend was observed for rice husk, which showed a higher water content than that reported by Gao et al. [41] for the aqueous phase of rice husk bio-oil produced at 500 °C in a tubular reactor (58.7 wt%).
The density values of the aqueous phases of the bio-oils were close to 1 g mL−1, consistent with the high water content of the aqueous bio-oil phases and with values reported by other authors; for instance, Varma and Mondal [42] reported a density of 1.04 g mL−1, and Vecino Mantilla et al. [40] reported 1.03 g mL−1 for the aqueous phase of sugarcane bagasse bio-oil.
The pH of the aqueous phases indicated high acidity in both cases, consistent with the literature, which reports pH values between 2 and 3 for aqueous bio-oil phases [40,41,42].
Gas chromatography is the analytical method commonly employed to determine the composition of the aqueous fraction of pyrolysis liquids [42]. The gas chromatography analysis identified and quantified 65 compounds, representing approximately 90% of the total organic compounds in the aqueous phases obtained from both biomasses. The compounds were grouped according to their main functional groups, as shown in Table 6.
Table 6.
Properties of the tars.
In both cases, acetic acid was the predominant organic compound, representing 81 wt% (RH) and 85 wt% (SCB) of the acids. This compound is likely formed by the elimination of O-acetyl groups from mannose units in the galactoglucomannan structure [43]. Within the aldehyde group, cinnamaldehyde was the major compound in both cases.
Ketones were represented by both linear compounds (mainly 2-pentanone, 2,3-pentanedione, and acetone, which together accounted for 35.4 wt% of the ketone group in RH bio-oil and 52.3 wt% in SCB bio-oil) and cyclic compounds with five- and six-membered rings, among which 2-cyclopenten-1-one, 2-hydroxy-3-methyl-2-cyclopenten-1-one, and 3-ethyl-2-hydroxy-2-cyclopenten-1-one were the most abundant, representing 24.8 wt% of ketones in RH and 22.2 wt% in SCB.
Phenolic compounds were the third most important group in both aqueous phases. This group included phenol, alkyl phenols, and phenolic ethers, with the alkyl phenols being predominant. In decreasing order of abundance, the alkyl phenols included dimethylphenols, phenol, and methylphenols, while methylguaiacol and 3-methoxyphenol were the main species among the phenolic esters. Phenolic compounds originate from the degradation of lignin, which is composed of three primary monolignols (p-coumaryl, coniferyl, and sinapyl alcohols) that form the basic p-hydroxyphenyl (H), guaiacyl (G), and syringyl (S) units, respectively [39]. Qu et al. [30] analyzed the composition of bio-oils produced from the separate pyrolysis of cellulose, hemicellulose and lignin, founding that phenols represented 75% of the composition in the lignin-derived liquid. When xylan (representing hemicellulose) was pyrolyzed, phenols were also detected, although acids were the major compounds. The authors concluded that lignin contributes significantly to the phenolic compounds in biomass pyrolysis liquids, mainly due to dehydration of hydroxyl functionalities in the lignin side chains and cleavage of ether linkages in the main structure. In this study, the higher phenol content in the RH aqueous phase correlates with its higher lignin content as compared to SCB (see Table 1).
Methanol was the only alcohol identified in the aqueous phases of both biomasses. This compound is formed from the fragmentation of methoxy groups substituting glucuronic acid in hemicellulose [44], from cellulose decomposition [45], and from the cleavage of methoxyl groups in lignin, which releases small molecular compounds such as methane and methanol [2].
Esters represented approximately 1 wt% of the organic portion of the aqueous bio-oil phases for both raw biomasses, vinyl 2-butanoate being the major ester in both cases.
Heterocyclic compounds in the aqueous bio-oil phases were represented by furans (furfural, 2-furanmethanol, 2-acetylfuran, and 5-hydroxymethylfurfural), pyran (3,4-dihydro-2H-pyran), and levoglucosan. The latter accounted for 54% of the total heterocyclic compounds in SCB, consistent with the higher holocellulose content of this biomass. Levoglucosan (1,6-anhydro-β-D-glucopyranose) is mainly produced from cellulose pyrolysis through chain-end depolymerization reactions involving glycosidic bond cleavage (transglycosylation) and, to a lesser extent, from hemicellulose degradation [43,46]. Subsequent dehydration of levoglucosan can form 1,4:3,6-dianhydro-α-D-glucopyranose (DPG); further dehydration and decarbonylation of levoglucosan and DPG lead to 2-furanmethanol formation. Furfural is likely produced by dehydration of 2-furanmethanol [43]. This analysis suggests that numerous dehydration reactions can occur during cellulose and hemicellulose pyrolysis, which is consistent with the high water content of the aqueous bio-oil phases.
The presence of heterocyclic and phenolic compounds makes the aqueous phases of both bio-oils unstable during storage; moreover, their high water content accounts for their immiscibility with hydrocarbons and its low heating value.
3.7. Composition and Properties of the Tars
Tar is the oily or tarry fraction of the pyrolysis liquids, being a dark brown organic liquid with high viscosity and low fluidity. The chemical composition of this fraction is considerably more complex than that of the aqueous phases, and chemical, chromatographic, and spectroscopic methods are generally used to infer the possible molecular structures and to determine the concentrations of the different functional groups present.
Table 6 shows the properties of the tars obtained from the pyrolysis of RH and SCB. The water content in tars may originate either from residual aqueous phase or from the emulsification of water with compounds in the tar itself. Zhang et al. [47] reported 21 wt% water in rice husk tar separated from its corresponding aqueous phase by centrifugation. Vecino Mantilla et al. [40] separated the phases of bio-oil from sugarcane bagasse pyrolysis by liquid–liquid extraction using dichloromethane as solvent in a separatory funnel and obtained tars containing 4.3–6.2 wt% water.
Elemental analysis revealed that the tars contained higher carbon and lower oxygen contents than their respective raw biomasses (see Table 1), resulting in higher heating values. Mullen and Boateng [48] found that pyrolysis tars from switchgrass, barley and oat straw, soybean straw and oak wood contained 65–68 wt% carbon and 24–28 wt% oxygen. They observed that the C contents were higher and O contents lower than those of lignins isolated from biomass through different extraction processes, which typically contain 57–65 wt% carbon and 27–35 wt% oxygen. This comparison is relevant as one of the potential applications of pyrolysis tar is as lignin substitute in phenol–formaldehyde resins and in the production of carbon fibers, as discussed in Section 3.8.
Regarding the heating values, the results obtained were within the range reported by Scholze [49] for tars from the pyrolysis of wood sawdusts (softwoods and hardwoods) and cereal husks (24–29 MJ kg−1). It is also worth noting that the heating value of tars is lower than that of fuel oil, which is commonly used as a fuel in industrial boilers and furnaces and has an HHV of approximately 40 MJ kg−1.
3.7.1. GC-MS Analysis of the Tars
Tars were composed mainly of phenols, ketones, furans, and acids, and GC–MS analysis allowed the identification of 206 compounds, which were classified into 14 groups as shown in Table 7.
Table 7.
Chemical composition of the tars (%area).
The acid content in the tars was lower than that in their corresponding aqueous phases (values reported in Table 5), acetic acid being the predominant compound in both cases. The presence of acids in the tars may be due to incomplete separation of the aqueous phase, similarly to the presence of water itself. These differences between the aqueous and tar phases can be explained by the physicochemical properties of the compounds, particularly polarity, hydrogen-bonding ability, molecular size, and water solubility. Thus, highly polar low-molecular-weight oxygenates tend to remain in the aqueous phase, whereas less polar aromatic oxygenates are preferentially enriched in the tar phase. Although these trends are consistent with compound-specific partition behavior reported for representative bio-oil compounds, the final distribution in real bio-oil systems is also affected by the non-ideal and multicomponent nature of the phases [50,51,52].
Sugars accounted for 6.22% of the total chromatographic area in the SCB tar, a value higher than that of RH tar. Within this group, the main compound was 1,6-anhydro-β-D-glucopyranose (levoglucosan), representing 74% of the sugars in SCB tar. This behavior was also observed in the aqueous phase of the sugarcane bagasse bio-oil and is a consequence of the high holocellulose content of the feedstock, since, as previously mentioned, this compound originates from the degradation of plant carbohydrates [22]. Several studies have shown that levoglucosan present in pyrolysis liquids is produced from cellulose degradation [43,46].
Tar from SCB pyrolysis exhibited the highest aldehyde content, with furfural as the major compound in this group. It is noteworthy that RH tar contained no furfural, 5-hydroxymethylfurfural being its principal aldehyde. Both tars contained approximately 10% (chromatographic area) of ketones, among which hydroxyacetone, 1-acetoxy-2-propanone, 1,2-cyclopentanedione, 3-methyl-2-cyclopenten-1-one, and 3-methyl-1,2-cyclopentanedione were the most abundant.
Phenols were the predominant compounds in both tars, as shown in Table 5. To facilitate a more detailed analysis of these compounds and their relationship with the raw biomass, they were classified into five families according to their chemical nature. They were “phenol and alkyl phenols” (including phenol and its alkyl derivatives), “benzenediols” (compounds with two hydroxyl groups attached to the aromatic ring), “guaiacols” (guaiacol and its derivatives), “syringols” (syringol and its derivatives), and “others”, which includes all other phenolic compounds not belonging to the previous families. A similar classification was used by Wang et al. [3] in their study of wood-derived bio-oils. The results are shown in Figure 5, which shows the percentage contribution of each group relative to the total phenolic content.
Figure 5.
Distribution of phenolic compound families in RH tar and SCB tar.
It can be seen that the RH tar contained a higher proportion of guaiacols than SCB tar, the main compounds being o-guaiacol, 4-methylguaiacol, 4-ethylguaiacol, 4-vinylguaiacol, and trans-isoeugenol. Phenol and alkyl phenols were the next most abundant group, where phenol, 4-methylphenol, 2-methylphenol, and 4-ethylphenol were the predominant compounds. Similar results were reported by Rosado et al. [53] in the pyrolysis of lignin isolated from rice husk, which mainly produced phenolic compounds of the guaiacol type (such as 4-vinylguaiacol, 4-vinylphenol, guaiacol, 4-methylguaiacol, and 4-ethylguaiacol), as well as phenol and alkyl phenols (including phenol, 4-methylphenol, and 4-ethylphenol).
The SCB tar showed a higher content of phenol and alkyl phenols, 4-ethylphenol being the major compound, while guaiacols were the second most abundant group, with 4-vinylguaiacol as the dominant species. Del Río et al. [22] reported similar compounds in the pyrolysis products of sugarcane bagasse and lignin isolated from sugarcane bagasse.
Finally, it is noteworthy that RH tar exhibited the highest benzenediol content and SCB tar the largest abundance of syringols.
3.7.2. 1H NMR Analysis of the Tars
To obtain the approximate proportions of the different proton chemical environments, quantify the integration areas and compare them, the pyrolysis tars were also analyzed by 1H NMR spectroscopy. This characterization technique provided information about the functional groups, degrees of branching or saturation, aromatic content, and other structural features present in the tars. The resulting spectra are shown in Figure 6.
Figure 6.
1H NMR spectra of RH and SCB tars.
The integrated areas corresponding to the selected regions of the spectra, expressed as percentage values, are shown in Table 8. The limits of integration for each type of hydrogen chemical environment in the spectra were selected following the classification proposed by Mullen et al. [54]. The signal at 7.26 ppm, assigned to the deuterated chloroform solvent used, was excluded from the quantification in the 8.5–6.0 ppm range.
Table 8.
1H NMR regions and percentage areas for RH and SCB tars.
In this analysis it was particularly considered that the tars constitute a complex mixture of compounds; hence, the potential types of chemical environments that may be present are indicated. Moreover, the signals are strongly influenced by interactions among the various structural components.
The high-field region of the spectrum, between 0.5 and 1.5 ppm, corresponds to protons belonging to aliphatic functional groups (mainly methyl or methylene) bound to carbon atoms in β or γ positions relative to an aromatic ring, unsaturation, or heteroatom (O or N). Both tars exhibited a low proportion of hydrogen atoms in this region, suggesting that they contain a small number of isolated aliphatic-chain compounds of the ethyl type or larger, and/or a small number of long aliphatic chains bound to an aromatic ring, a double bond, or a heteroatom. These observations are consistent with results from the GC–MS analysis, in which only small amounts of hydrocarbon compounds were detected.
The tars exhibited their strongest resonance in hydrogens bound to α-carbon atoms attached to C=C double bonds (aromatic or olefinic) or to heteroatoms, corresponding to the spectral region between 1.5 and 3.0 ppm. In the case of RH tar, it can be inferred that these α-carbons are bonded to aromatic rings, given the significant hydrogen signal observed in the 6.0–8.5 ppm region (the aromatic proton resonance range). This suggests that RH tar contains a higher proportion of benzene rings or fewer substituents on the aromatic rings than the SCB tar. As this tar did not show strong resonance in the 0.5–1.5 ppm region, likely the aromatic substituents are methyl groups [48].
The following region, between 3.0 and 4.4 ppm, corresponds to hydrogens attached to carbon atoms bonded to oxygen in aliphatic alcohol or ether groups, or to methylene groups linking two aromatic rings. Mullen et al. [54] indicated that the latter may reflect the presence of lignin oligomers remaining in the tar. Both tars showed around 10% of protons resonating in this region, which could be related to the lignin content of the original biomass.
Protons in the 4.4–6.0 ppm region could correspond to hydrogens bound to carbon atoms that are also attached to –OH or –OCH3 groups [42]. These signals may be associated with methoxyphenols derived from lignin, such as guaiacol, syringol, and their derivatives [48], or with carbohydrates such as levoglucosan [54]. Both tars presented similar proportions of protons resonating in this region, which is consistent with the results observed in GC-MS (Section 3.7.1) and FTIR (Section 3.7.3).
The last region, from 6.0 to 8.5 ppm, corresponds to protons directly bound to aromatic rings, either benzenic or heteroaromatic. The RH tar showed a significantly higher proportion of hydrogens resonating in this region. The lower signal observed for SCB tar may not only be due to its lower aromatic content but also to a higher degree of ring substitution, leaving fewer protons within the aromatic ring [48].
In agreement with the observations by Mullen and Boateng [48], it can be concluded that the tars are composed of multiple aromatic units (benzenic or heteroaromatic), which in most cases are highly substituted.
Assignments in the integrated 1H NMR regions were supported by the GC–MS results discussed in Section 3.7.1. Particularly, the 8.5–6.0 ppm region is consistent with the presence of phenols, alkyl phenols, guaiacols, and syringol-type compounds identified in both tars. Likewise, the 6.0–4.4 ppm region may be associated with methoxy-containing phenolic and sugar-derived compounds such as levoglucosan, while the 4.4–3.0 ppm region can be related to protons on carbon atoms bonded to oxygen in alcohols, ethers, and oxygenated cyclic compounds. Signals in the 3.0–1.5 ppm and 1.5–0.5 ppm regions are also consistent with aliphatic side chains and methyl/methylene groups present in several oxygenated and aromatic compounds detected by GC-MS. These assignments should be considered as tentative because of the complexity of the mixtures.
3.7.3. FTIR Analysis of the Tars
The tars were analyzed by FTIR spectroscopy, which allowed the identification of the main functional groups associated with their components. Figure 7 shows the FTIR spectra obtained for RH and SCB tars.
Figure 7.
FTIR spectra of RH and SCB tars.
A broad absorption band was observed in the spectra between 3750 and 3250 cm−1, corresponding to the O–H stretching vibration of hydroxyl groups bound to carbon atoms in alcohols (both aliphatic alcohols and phenols) [55], as well as to the contribution of hydroxyl groups from carboxylic acids [56].
The presence of alkanes was indicated by the C–H stretching vibrations between 3000 and 2800 cm−1 and the bands at 1470 and 1350 cm−1, which correspond to C–H bending vibrations [34]. Distinct absorption bands were also observed between 1750 and 1650 cm−1, attributed to the C=O stretching vibration of carbonyl groups, which indicate the presence of ketones, aldehydes, and carboxylic acids. These signals are consistent with those observed in the 1H NMR spectra in the 1.5–3.0 ppm region.
The spectral region around 1606–1515 cm−1 corresponds to aromatic skeletal vibrations [3], and both tars showed strong signals in this range. Peaks between 1300 and 900 cm−1 were associated with C–O stretching vibrations of carbonyl-containing compounds (i.e., alcohols, esters, carboxylic acids, or ethers). In addition, both tars exhibited C–O stretching vibrations around 1033 cm−1, which can be attributed in a general view to oxygenated compounds containing C–O bonds, such as alcohols, ethers, and carbohydrate-derived species. Compounds such as levoglucosan may contribute to this band, but this assignment cannot be considered specific, as several oxygenated compounds absorb in this region [57].
The region between 900 and 700 cm−1 contained weak signals corresponding to C–H bending vibrations associated with aromatic compounds. The absorption bands in the 924–870 cm−1 and 850–700 cm−1 ranges are characteristic of furfural and furans [58] and were more intense in the spectrum of SCB tar, consistently with the higher holocellulose content of this biomass and the presence of furfural detected by GC–MS (see Section 3.7.1).
The FTIR and 1H NMR analyses indicate that many of the molecules present in RH and SCB tars contain multiple aromatic units substituted with aliphatic chains.
3.8. Bio-Oil Upgrading and Valorization in an Integrated Biorefinery
As it was demonstrated in Section 3.6 and Section 3.7, the bio-oils derived from RH and SCB are highly complex biphasic liquids that separate into an aqueous phase and a tar phase. These bio-oils, like those obtained from other lignocellulosic biomasses, exhibit remarkable versatility as feedstocks, as both their aqueous and oily (tar) fractions contain families of compounds with a wide range of industrial, energy, and environmental potential applications.
The most promising approach for bio-oil valorization lies in the application of the biorefinery concept, which focuses on processing each phase separately to maximize the production of high-value chemical compounds, as shown in Figure 8. This strategy repositions bio-oil from a low-quality end product to a feedstock with high chemical density.
Figure 8.
Proposed biorefinery scheme for the valorization of RH and SCB bio-oils.
3.8.1. Valorization of the Aqueous Phase
The aqueous fraction of the RH and SCB bio-oils is characterized by a high proportion of acids, aldehydes, ketones, light phenols, and heterocyclic compounds, as shown in Section 3.6. Its chemical composition enables both the direct use of this bio-oil fraction in specific applications and its valorization as a promising source of platform molecules.
A well-known direct application of the aqueous phase of bio-oils is as a food flavoring, due to its high content of low molecular weight aldehydes (effective meat browning agents) and phenolic compounds that impart smoky flavors. Various commercial “liquid smoke” flavorings have been patented and marketed in several countries, which are produced via biomass pyrolysis, primarily from wood sawdust [59]. For this purpose, the aqueous phase of the bio-oil is diluted in water at concentrations ranging from high (1:10 to 1:40 v/v) to very low (1:400 to 1:4000 v/v). In some direct treatments, much higher concentrations can be used, with water-to-bio-oil aqueous phase ratios of 3:1 [60]. However, dilution is necessary in part because the whole bio-oil exhibits genotoxic activity [61] due to the presence of PAHs (e.g., benzo[a]pyrene). “Liquid smoke” products must comply with national regulations, and in all cases, proper separation of the tar fraction is essential.
Studies have demonstrated the technical feasibility of producing liquid smoke from the aqueous phases of bio-oils derived from rice husk [62,63] and sugarcane bagasse [64]. These studies showed that the chemical families present (phenols, methoxyphenols, furans, aldehydes, and organic acids) provide the desired smoky aroma to foods while exhibiting additional functional properties (preservative, antimicrobial, and antioxidant) thus adding functional value to flavoring.
The aqueous phases of bio-oils have also shown potential applications in soil improvement (as plant growth stimulants) and pest control [65]. These liquids have demonstrated antifungal, insecticidal, and biocidal properties, making them suitable as wood preservatives, among other applications [66].
Several studies have indicated that the antifungal activity of pyrolysis liquids likely results from a synergistic effect among different chemical compounds that primarily affect fungal enzymatic activity. Acetic acid [67] and furfural [68] have been shown to possess antifungal activity. Notably, acetic acid was the main organic compound in the aqueous phases of the RH and SCB bio-oils, accounting for 24.29 and 35.32 wt%, respectively. Some phenolic compounds also exhibit antifungal properties, including guaiacol derivatives such as 2-methylguaiacol, 2-methoxy-4-methylphenol, and 4-ethyl-2-methoxyphenol, as well as alkylphenols like 3-methylphenol and 4-methylphenol [69], and syringaldehyde [70]. The latter compound is a cinnamaldehyde derivative containing one hydroxyl and two methoxy groups, the aqueous phases of the RH and SCB bio-oils containing 6.78 and 4.80 wt% cinnamaldehyde, respectively. Likewise, these aqueous phases contained 15.04 and 12.14 wt% alkyl and phenolic ethers mainly derived from guaiacol.
Alternatively, rather than direct application, a promising valorization strategy involves the neutralization of the carboxylic acids present, followed by the precipitation of their calcium salts. This can be achieved using Ca(OH)2 or CaCO3 at concentrations sufficient to raise the pH to 10–11. Depending on salt solubility, temperature, and concentration, the calcium carboxylate precipitates can be filtered, dried, and purified if necessary. Under neutralization conditions (heating at 40–70 °C for 1–4 h), some compounds ionize, decompose, or polymerize, forming precipitate phases (such as phenols, furfural, 5-hydroxymethylfurfural, and certain aldehydes) which generate phenolic polymers and humins [9].
Oehr and Barrass [71] demonstrated the high yield (above 90%) of calcium acetate and calcium formate from the aqueous phase of bio-oil derived from wood residues using calcium hydroxide as a neutralizing agent. In a similar study, Park et al. [72] explored the neutralization of the aqueous phase of switchgrass bio-oil and found that NaOH and KOH can perform better than Ca(OH)2 in some cases due to the limited solubility of calcium hydroxide in acidic matrices. However, when solubilization or particle size reduction improves contact efficiency, the formation of calcium salts of carboxylic acids becomes feasible. Calcium salts of carboxylic acids have multiple industrial applications, mainly as de-icing agents, for sulfur dioxide removal during fossil fuel combustion, and as catalysts in coal combustion [73]. Their use as road de-icing agents is technically feasible and environmentally friendly, though not yet economically competitive. Calcium chloride remains less expensive and is therefore more commonly used, despite its phytotoxic effects.
These calcium salts may also serve as precursors for further chemical conversions such as decarboxylation (producing ketones), regeneration, or use as catalysts or functional agents. Zhang et al. [74] demonstrated that calcium salts precipitated from the aqueous phase of rice husk bio-oil using CaCO3 can undergo high-temperature decarboxylation, generating ketones while simultaneously regenerating CaCO3. This process substantially improved the properties of the treated aqueous phase, markedly reducing its acidity (acid number TAN from ~167.62 to ~1.98 mg KOH/g) and increasing its higher heating value (HHV from 18.38 to 27.59 MJ/kg).
This approach transforms problematic acidic compounds responsible for the corrosiveness and low stability of bio-oil into valuable and functional products, simultaneously enhancing the overall quality of the bio-oil for subsequent biorefinery processing. However, several technical challenges remain: (i) the limited solubility of Ca(OH)2 in highly acidic solutions may reduce neutralization efficiency; (ii) the separation of calcium salts must be optimized, as impurities may co-precipitate or remain dissolved, affecting purity and yield; and (iii) heating the aqueous phase with calcium salts may lead to charring or carbonization of organic compounds, reducing liquid yield and generating undesirable residues. Additionally, economic constraints such as the energy costs of heating, concentration, and drying must be addressed.
As the aqueous phases of the RH and SCB bio-oils showed very high carboxylic acid contents (30.13 and 41.73 wt%, respectively) and low pH values (3 in both cases), the implementation of a neutralization step could improve their chemical profile reducing total acidity and enhancing stability, while simultaneously producing calcium carboxylates of added value. In these cases, the resulting salt mixtures would consist primarily of calcium acetate, since acetic acid represented over 80% of total acids (see Table 4), leading to Ca2CO3 theoretical yields of approximately 9 wt% for RH and 26 wt% for SCB.
Process efficiency could be improved by adjusting the following parameters: (i) type and physical form of the calcium base (hydroxide, carbonate, or other salts) to ensure solubility and contact; (ii) acid-to-calcium molar ratio to avoid excess unreacted base; (iii) temperature and concentration conditions (e.g., dilution degree of the aqueous phase) to favor precipitation and minimize losses. In addition, it is necessary to evaluate the quality, purity, moisture content, and occurrence of organic impurities in the isolated calcium carboxylates to assess their commercial feasibility. Further studies are required to address these aspects.
The decarboxylated aqueous fraction can subsequently be processed to obtain levoglucosan, as proposed in Figure 8. Levoglucosan, which represented up to 54% of the total heterocyclic compounds in the SCB bio-oil, is a promising platform molecule due to its high carbon content and potential for conversion into high-value chemicals. Once separated the decarboxylated aqueous fraction, it can be transformed directly into levoglucosane by microorganisms expressing levoglucosan kinase or hydrolyzed into glucose via chemical or enzymatic catalysis for biotechnological applications [9]. These sugars serve as high-quality carbon sources for fermentation processes to produce alcohols (e.g., butanol) or biocatalysts, representing a pathway of considerable economic potential.
Levoglucosan separation from the aqueous bio-oil fraction can be achieved through water removal [75] and subsequent distillation or extraction. Solvents such as hexane and toluene have been used, though more sustainable alternatives are being explored [76]. Achieving high purity is critical to avoid inhibition of downstream processes such as fermentation, since bio-oil contains compounds (particularly phenolics) that can interfere with microbial metabolism [9].
Studies targeting levoglucosan recovery from lignocellulosic bio-oils have demonstrated high recovery efficiencies. Similarly, recoveries above 78% and purities > 95% were achieved using combined processes involving activated carbon adsorption, aqueous extraction, overliming, and evaporation from the aqueous phase of straw bio-oil [77]. The overliming step corresponds precisely to the chemical neutralization and precipitation process proposed in Figure 8.
Based on the present study’s results and the recoveries reported by Wang et al. [77], a theoretical levoglucosan yield of 1.56 wt% relative to the aqueous phase of the SCB bio-oil can be inferred.
3.8.2. Valorization of the Tar
The oily fraction of the bio-oils (tar) is characterized by a high concentration of phenolic compounds and, as shown in Section 3.7, the RH and SCB tars possess high heating values. Recent literature identifies four main technological routes for transforming tar into high-value products: (i) direct use as a substitute for petrochemical derivatives, (ii) fractionation to obtain phenols, (iii) catalytic conversion to fuels and chemical feedstocks, which can be achieved through hydrotreatment, catalytic cracking over zeolites, or reforming processes, and (iv) polymerization to produce carbon fibers.
A valorization route within the biorefinery framework can be proposed for RH and SCB tars, as illustrated in Figure 8, appearing most promising given their chemical composition. In addition, two direct-use applications are also suggested.
The separation of monophenols or the total phenolic fraction from tar can be achieved by selective extraction, fractional distillation, or solvent-assisted fractionation [78]. The complete phenolic fraction of the tar, which is much easier to separate than individual phenols, can be used as a partial or total replacement for phenol in phenol-formaldehyde resins, an application currently gaining significant technological traction, as it reduces dependence on petrochemical phenol. Numerous studies demonstrated the technical and economic feasibility of this approach for tars derived from various agricultural and forestry residues [8,10,79].
The main limitation of this application lies in the occurrence of impurities which could affect curing and mechanical properties; however, studies indicate that partial substitutions of 10–40% of phenol with the phenolic fraction of bio-oil tar do not significantly alter the final resin properties. Specifically for RH and SCB, whose composition profiles were analyzed in detail in Section 3.7, both phenol extraction [80] and use in phenolic resins [81] have been reported. These studies showed that the phenolic fraction from rice husk bio-oil can be efficiently extracted, exhibiting high phenol contents (up to 60%), and that its partial incorporation into phenolic resins as a substitute for petrochemical phenol yields satisfactory mechanical properties. In particular, substitution of 10–20% of phenol with sugarcane bagasse tar maintained shear strength within industrial standards, confirming the technical viability of lignocellulosic-derived phenolic compounds as sustainable precursors for phenolic resins.
Results from the authors’ earlier studies also showed that RH tar exhibits polymeric characteristics similar to those of organosolv lignins, with a number-average molecular weight (Mn) of 327 g·mol−1, a weight-average molecular weight (Mw) of 855 g·mol−1, a polydispersity (D = Mw/Mn) of 2.6, and a peak molecular weight (Mp) of 178 g·mol−1 [82], supporting its suitability as a phenol substitute in resins, analogously to current uses of organosolv lignins.
Zheng et al. [83] performed a combined life cycle and techno-economic assessment of an integrated process for producing levoglucosan, phenol–formaldehyde resins, and calcium carboxylates from bio-oil fractions, based on a model plant processing ~60 t·day−1 of dry cotton straw. Their study showed that such an alternative can be commercially attractive, including low investment risk under modeled conditions. From an environmental standpoint, however, the study highlighted that economic benefits are not always accompanied by sustainability gains. The overall impact strongly depends on operational issues (scale, purification yield, energy supply, and by-product handling). Thus, system-level integration (including energy recovery, effluent management, and utilization of residual streams) is critical for achieving net environmental benefits.
Results of this work and the supporting literature regarding the potential to process bio-oil fractions under a biorefinery scheme, indicate that future developments in this area should simultaneously include: (i) experimentally verifiable improvements in yield and selectivity of the target fractions (ii) evaluation of purification processes under energy-efficiency criteria; and (iii) techno-economic and life-cycle assessments to identify the most influential operational parameters on profitability and sustainability.
Tars could also be used directly by incorporating them into asphalt binders, partially replacing fossil-derived resources, which could then be redirected toward higher-value products. Global demand for asphalt is high due to the need for both new road construction and pavement rehabilitation, as asphalts undergo chemical changes, such as oxidation and colloidal structure modification, that lead to the loss of required physical properties. Several studies have shown that partial replacement of conventional asphalt with lignocellulosic pyrolysis tars is feasible, as the tars can act as asphalt binders, antioxidants that extend service life or rejuvenating agents for aged asphalt [84].
Three bio-asphalts were prepared by incorporating 5.5, 7.5, and 9.5 wt% of RH tar into a conventional CA-30 asphalt to evaluate its rejuvenating effect and determine the most convenient mixing ratio (Unpublished results). The bio-asphalt containing 7.5 wt% tar showed the lowest viscosity at 60 °C, the lowest softening temperature, the lowest Pfeiffer Index (which measures the thermal susceptibility of asphalts by evaluating how its consistency changes with temperature based on penetration tests; higher values indicate asphalts that are less sensitive to temperature variations), and the highest penetration value. These results indicated that asphaltene dispersion capacity, thermal susceptibility, and fluidity were better in the bio-asphalt than in the raw CA-30 asphalt, demonstrating the rejuvenating effect of tar, which was most pronounced at the 7.5 wt% level.
The polymeric characteristics, composition, density, and viscosity of pyrolysis tars also make them appropriate as precursors for biocide encapsulation matrices. In this regard, a novel application was developed using the RH tar produced in this work [85]: sodium alginate films for active packaging were formulated with tar-loaded microparticles containing eugenol. The microparticles were prepared via solvent evaporation and the effects of their incorporation on the films’ mechanical, thermal, and moisture resistance properties, as well as on antimicrobial activity, were evaluated. Films with different degrees of cross-linking using CaCl2 were also prepared and the controlled release profiles of eugenol were studied. The cross-linked films exhibited good mechanical and moisture resistance properties, lower eugenol release rates in water, and antimicrobial activity against Staphylococcus aureus.
Figure 9a,b summarize the proposed mass balance from biomass to bio-oil and its derived products for RH and SCB, integrating the processing routes discussed in Section 3.8.1 and Section 3.8.2. The schemes focus on the liquid products, including bio-oil separation into aqueous and tar fractions and their subsequent valorization. The yields assigned to the downstream products are estimated from literature data reported for these biomasses, whereas the overall pyrolysis yields are reported separately in Table 4.
Figure 9.
Schematic mass balances from biomass to bio-oil and its derived products for (a) RH and (b) SCB. (*) Estimated from references [72,77,80].
3.8.3. Co-Processing of Bio-Oil in FCC
The valorization options for bio-oils discussed in previous sections required the separate processing of the aqueous and tar fractions. However, it is possible to co-process the whole bio-oil in fluid catalytic cracking (FCC) units of petroleum refineries.
In this regard, an important number of studies have been conducted. For instance, Bertero et al. [29] investigated the thermal pre-treatment of the aqueous phases of different biomasses (pine sawdust, carob sawdust and wheat husk) to improve their processability by separating coke precursors and increasing the Effective Hydrogen Index (EHI) in FCC units. Subsequent studies evaluated the conversion of both untreated and thermally treated aqueous phases over commercial equilibrium FCC catalysts under typical industrial operating conditions. The experimental results contributed to elucidate key aspects of the process, showing that hydrocarbons can be obtained from bio-oils and that thermal pre-treatment promotes high deoxygenation levels (up to 95%) while reducing coke formation. This latter outcome is critical when considering co-processing, due to the delicate energy balance which controls the operation of FCC units in refineries. Bio-oil conversion under these conditions primarily yielded C4 olefins and gasoline-range hydrocarbons. These studies employed two types of reactors: a fixed-bed MAT (Microactivity Test) reactor and a CREC Riser Simulator, the latter reproducing most closely the real conditions of industrial FCC operation [86,87].
Previous results showed that the oxygen content of bio-oils does not generate adverse effects on the yields and selectivities of the main FCC products, and that the amount of coke formed during co-processing, particularly when thermally pretreated, is not problematic for commercial operation, thereby confirming its feasibility.
A similar analysis should be performed on another singular characteristic of bio-oils, which is their high water content. Previous laboratory co-processing studies of pine sawdust and mesquite sawdust bio-oil with vacuum gas oil (VGO) using commercial equilibrium catalysts, confirmed that, provided limited amounts of bio-oils are co-processed, no operational problems would arise [11,88]. This aspect was later demonstrated to be a limiting factor from an energy balance perspective, as the high water content of the bio-oil significantly increases the heat demand for vaporization and reduces the net heat available from coke combustion. Consequently, the admissible level of bio-oil co-feeding in FCC operation is restricted to low values (≈5 wt%). These studies and those by Bertero and Sedran [86] and Bertero et al. [89] elucidated key operational aspects such as the most suitable commercial catalysts, achievable optimization levels, and the maximum feasible concentration of bio-oil aqueous phase depending on both the catalyst and the biomass source. Additionally, the effects of co-processing bio-oil and conventional VGO on FCC thermal balance variables were evaluated [88], while complementary studies explored hydrogen transfer reactions, the main coke-forming pathways, between fossil hydrocarbons and oxygenated bio-oil compounds [90].
Y zeolites were modified via alkaline desilication and the resulting materials were formulated into prototype FCC catalysts to assess the catalytic efficiency of FCC catalysts in bio-oil conversion by means of the reaction of the separate bio-oil fractions (aqueous and tar) [91]. The intracrystalline mesoporosity generated in zeolite desilication clearly enhanced diffusion of bulky molecules from both bio-oil phases, leading to higher deoxygenation and hydrocarbon yields. Bertero et al. [92] revalorized spent FCC catalysts through acid and alkaline leaching treatments based on this approach, improving their performance in upgrading pyrolysis liquids derived from wood sawdust and cattle manure, as compared to equilibrium commercial catalysts.
Overall, these results demonstrate that bio-oil co-processing in FCC units is technically feasible and represents a promising pathway for integrating renewable carbon sources into existing refinery infrastructure, without the need for major capital investments, thereby advancing toward more sustainable fuel and chemical production.
4. Conclusions
Several conclusions can be drawn regarding the direct utilization of RH and SCB for energy generation in boilers. Although RH exhibits a low probability of slagging and fouling, it shows a marked tendency toward agglomeration. In contrast, SCB presents a higher propensity for deposit formation. Moreover, the ash compositions, together with the B/A, BAI, Fu, and Sr indices, indicate that the direct combustion of these wastes would likely result in important operational challenges associated with fouling, agglomeration, and slagging. These limitations highlight the constraints of their conventional thermochemical use and underscore the need to explore alternative valorization pathways.
In this context, pyrolysis emerged as a technically feasible and attractive alternative, revealing clear relationships between the lignocellulosic composition of the biomasses and the distribution of the resulting products. Sugarcane bagasse, with its higher cellulose and hemicellulose contents, yielded more bio-oil, particularly the aqueous phase, which was rich in acids and ketones with potential for chemical valorization. In contrast, rice husk produced more char, consistently with its higher ash and lignin contents, suggesting possible applications of this solid fraction in carbon materials or as a silica source.
Compositional analyses of the liquid fractions revealed a marked presence of oxygenated compounds, mainly acids, phenols, ketones, and heterocycles, which represent an attractive platform for the production of value-added chemicals. In addition, the gaseous fraction, composed mainly of CO, CO2, and CH4, exhibited a calorific value suitable for on-site energy recovery.
Overall, these findings demonstrate that pyrolysis is a promising route for the valorization of agro-industrial by-products, enabling both energy recovery and the generation of chemically valuable fractions. From a sustainability perspective, this approach supports the transformation of agricultural residues into useful products within a biorefinery and circular bioeconomy framework. Further techno-economic and life-cycle assessments will be necessary to evaluate the feasibility of the proposed valorization routes at a larger scale.
Author Contributions
Conceptualization, P.S. and M.B.; Methodology, P.S., U.S. and M.B.; Formal Analysis, P.S., U.S. and M.B.; Investigation, P.S.; Resources, U.S. and M.B.; Data Curation, P.S. and M.B.; Writing—Original Draft, P.S. and M.B.; Writing—Review and Editing, U.S. and M.B.; Project Administration, U.S. and M.B.; Funding Acquisition, U.S. and M.B. All authors have read and agreed to the published version of the manuscript.
Funding
This research was funded by National University of Litoral (Santa Fe, Argentina), Secretary of Science and Technology grant number CAID 2024 85520240100154LI; CONICET grant number PIP 2021-3146 and the National Agency for the Promotion of Research, Technological Development and Innovation grant number PICT2019-3391. And The APC was funded by Author Voucher discount code (f3b1245edc51fef5).
Institutional Review Board Statement
Not applicable.
Informed Consent Statement
Not applicable.
Data Availability Statement
The data are contained within the article.
Conflicts of Interest
The authors declare no conflicts of interest.
References
- Guedes, R.E.; Luna, A.S.; Torres, A.R. Operating Parameters for Bio-Oil Production in Biomass Pyrolysis: A Review. J. Anal. Appl. Pyrolysis 2018, 129, 134–149. [Google Scholar] [CrossRef] [Scilit]
- Wang, S.; Dai, G.; Yang, H.; Luo, Z. Lignocellulosic Biomass Pyrolysis Mechanism: A State-of-the-Art Review. Prog. Energy Combust. Sci. 2017, 62, 33–86. [Google Scholar] [CrossRef] [Scilit]
- Wang, S.; Wang, Y.; Cai, Q.; Wang, X.; Jin, H.; Luo, Z. Multi-Step Separation of Monophenols and Pyrolytic Lignins from the Water-Insoluble Phase of Bio-Oil. Sep. Purif. Technol. 2014, 122, 248–255. [Google Scholar] [CrossRef] [Scilit]
- Bertero, M.; De La Puente, G.; Sedran, U. Effect of Pyrolysis Temperature and Thermal Conditioning on the Coke-Forming Potential of Bio-Oils. Energy Fuels 2011, 25, 1267–1275. [Google Scholar] [CrossRef] [Scilit]
- Morimoto, K.; Tsuda, K.; Mizuno, D. Literature Review on the Utilization of Rice Husks: Focus on Application of Materials for Digital Fabrication. Materials 2023, 16, 5597. [Google Scholar] [CrossRef] [Scilit] [PubMed]
- Taiye, M.A.; Hafida, W.; Kong, F.; Zhou, C. A Review of the Use of Rice Husk Silica as a Sustainable Alternative to Traditional Silica Sources in Various Applications. Environ. Prog. Sustain. Energy 2024, 43, e14451. [Google Scholar] [CrossRef] [Scilit]
- Awasthi, S.; Mishra, A.; Pal, D.B. Energy Production from Sugarcane Bagasse and Rice Husk. In Sustainable Clean Energy Production Using Waste Biomass; Pal, D.B., Rai, A.K., Siddiqui, S., Eds.; Clean Energy Production Technologies; Springer Nature: Singapore, 2024; pp. 157–181. ISBN 978-981-97-0839-0. [Google Scholar]
- Adhikari, S.; Auad, M.; Via, B.; Shah, A.; Patil, V. Production of Novolac Resin after Partial Substitution of Phenol from Bio-Oil. Trans. ASABE 2020, 63, 901–912. [Google Scholar] [CrossRef] [Scilit]
- Itabaiana Junior, I.; Avelar Do Nascimento, M.; De Souza, R.O.M.A.; Dufour, A.; Wojcieszak, R. Levoglucosan: A Promising Platform Molecule? Green Chem. 2020, 22, 5859–5880. [Google Scholar] [CrossRef] [Scilit]
- Pienihäkkinen, E.; Stamatopoulos, I.; Krassa, P.; Svensson, I.; Ohra-aho, T.; Lindfors, C.; Oasmaa, A. Production of Pyrolytic Lignin for the Phenolic Resin Synthesis via Fast Pyrolysis. J. Anal. Appl. Pyrolysis 2023, 176, 106239. [Google Scholar] [CrossRef] [Scilit]
- Bertero, M.; García, J.R.; Falco, M.; Sedran, U. Equilibrium FCC Catalysts to Improve Liquid Products from Biomass Pyrolysis. Renew. Energy 2019, 132, 11–18. [Google Scholar] [CrossRef] [Scilit]
- ASTM D3173-11; Standard Test Method for Moisture in the Analysis Sample of Coal and Coke. ASTM International: West Conshohocken, PA, USA, 2017.
- ASTM D3174-12(2018); Standard Test Method for Ash in the Analysis Sample of Coal and Coke from Coal. ASTM International: West Conshohocken, PA, USA, 2020.
- ASTM D3175-20; Standard Test Method for Volatile Matter in the Analysis Sample of Coal and Coke. ASTM International: West Conshohocken, PA, USA, 2020.
- Channiwala, S.A.; Parikh, P.P. A Unified Correlation for Estimating HHV of Solid, Liquid and Gaseous Fuels. Fuel 2002, 81, 1051–1063. [Google Scholar] [CrossRef] [Scilit]
- ISO 16472:2006; Animal Feeding Stuffs—Determination of Amylase-Treated Neutral Detergent Fibre Content (aNDF). International Organization for Standardization: Geneva, Switzerland, 2006.
- ISO 13906:2008; Animal Feeding Stuffs—Determination of Acid Detergent Fibre (ADF) and Acid Detergent Lignin (ADL) Contents. International Organization for Standardization: Geneva, Switzerland, 2008.
- IRAM 21320; Drogas para análisis. Método directo de Karl Fischer para la determinación de agua. Instituto Argentino de Normailización y Certificación: Buenos Aires, Argentina, 1972.
- Perry, R.H.; Green, D.W. Perry’s Chemical Engineers’ Handbook, 8th ed.; McGraw-Hill: New York, NY, USA, 2008; ISBN 978-0-07-159313-7. [Google Scholar]
- Lim, J.S.; Abdul Manan, Z.; Wan Alwi, S.R.; Hashim, H. A Review on Utilisation of Biomass from Rice Industry as a Source of Renewable Energy. Renew. Sustain. Energy Rev. 2012, 16, 3084–3094. [Google Scholar] [CrossRef] [Scilit]
- Vassilev, S.V.; Baxter, D.; Andersen, L.K.; Vassileva, C.G. An Overview of the Chemical Composition of Biomass. Fuel 2010, 89, 913–933. [Google Scholar] [CrossRef] [Scilit]
- Del Río, J.C.; Lino, A.G.; Colodette, J.L.; Lima, C.F.; Gutiérrez, A.; Martínez, Á.T.; Lu, F.; Ralph, J.; Rencoret, J. Differences in the Chemical Structure of the Lignins from Sugarcane Bagasse and Straw. Biomass Bioenergy 2015, 81, 322–338. [Google Scholar] [CrossRef] [Scilit]
- Anukam, A.; Mamphweli, S.; Reddy, P.; Meyer, E.; Okoh, O. Pre-Processing of Sugarcane Bagasse for Gasification in a Downdraft Biomass Gasifier System: A Comprehensive Review. Renew. Sustain. Energy Rev. 2016, 66, 775–801. [Google Scholar] [CrossRef] [Scilit]
- Yang, H.; Yan, R.; Chen, H.; Zheng, C.; Lee, D.H.; Liang, D.T. In-Depth Investigation of Biomass Pyrolysis Based on Three Major Components: Hemicellulose, Cellulose and Lignin. Energy Fuels 2006, 20, 388–393. [Google Scholar] [CrossRef] [Scilit]
- Bryś, A.; Bryś, J.; Ostrowska-Ligęza, E.; Kaleta, A.; Górnicki, K.; Głowacki, S.; Koczoń, P. Wood Biomass Characterization by DSC or FT-IR Spectroscopy. J. Therm. Anal. Calorim. 2016, 126, 27–35. [Google Scholar] [CrossRef] [Scilit]
- Katare, V.D.; Madurwar, M.V. Experimental Characterization of Sugarcane Biomass Ash—A Review. Constr. Build. Mater. 2017, 152, 1–15. [Google Scholar] [CrossRef] [Scilit]
- Wei, W.; Yu, H.; Guo, C.; Zhang, X.; Liu, G.; Cheng, S.; Zhao, B. Effect of Fouling Layer (Acid–Ash Reaction) on Low-Temperature Corrosion Covering Heating Surface in Coal-Fired Flue Gas. Processes 2022, 10, 241. [Google Scholar] [CrossRef] [Scilit]
- Lachman, J.; Baláš, M.; Lisý, M.; Lisá, H.; Milčák, P.; Elbl, P. An Overview of Slagging and Fouling Indicators and Their Applicability to Biomass Fuels. Fuel Process. Technol. 2021, 217, 106804. [Google Scholar] [CrossRef] [Scilit]
- Bertero, M.; De La Puente, G.; Sedran, U. Fuels from Bio-Oils: Bio-Oil Production from Different Residual Sources, Characterization and Thermal Conditioning. Fuel 2012, 95, 263–271. [Google Scholar] [CrossRef] [Scilit]
- Qu, T.; Guo, W.; Shen, L.; Xiao, J.; Zhao, K. Experimental Study of Biomass Pyrolysis Based on Three Major Components: Hemicellulose, Cellulose, and Lignin. Ind. Eng. Chem. Res. 2011, 50, 10424–10433. [Google Scholar] [CrossRef] [Scilit]
- Alvarez, J.; Lopez, G.; Amutio, M.; Bilbao, J.; Olazar, M. Bio-Oil Production from Rice Husk Fast Pyrolysis in a Conical Spouted Bed Reactor. Fuel 2014, 128, 162–169. [Google Scholar] [CrossRef] [Scilit]
- Tsai, W.T.; Lee, M.K.; Chang, Y.M. Fast Pyrolysis of Rice Straw, Sugarcane Bagasse and Coconut Shell in an Induction-Heating Reactor. J. Anal. Appl. Pyrolysis 2006, 76, 230–237. [Google Scholar] [CrossRef] [Scilit]
- Tsai, W.; Lee, M.; Chang, Y. Fast Pyrolysis of Rice Husk: Product Yields and Compositions. Bioresour. Technol. 2007, 98, 22–28. [Google Scholar] [CrossRef] [Scilit] [PubMed]
- Biswas, B.; Pandey, N.; Bisht, Y.; Singh, R.; Kumar, J.; Bhaskar, T. Pyrolysis of Agricultural Biomass Residues: Comparative Study of Corn Cob, Wheat Straw, Rice Straw and Rice Husk. Bioresour. Technol. 2017, 237, 57–63. [Google Scholar] [CrossRef] [Scilit]
- Reed, A.R.; Williams, P.T. Thermal Processing of Biomass Natural Fibre Wastes by Pyrolysis. Int. J. Energy Res. 2004, 28, 131–145. [Google Scholar] [CrossRef] [Scilit]
- Yang, H.; Yan, R.; Chen, H.; Lee, D.H.; Zheng, C. Characteristics of Hemicellulose, Cellulose and Lignin Pyrolysis. Fuel 2007, 86, 1781–1788. [Google Scholar] [CrossRef] [Scilit]
- Santamaria, L.; Beirow, M.; Mangold, F.; Lopez, G.; Olazar, M.; Schmid, M.; Li, Z.; Scheffknecht, G. Influence of Temperature on Products from Fluidized Bed Pyrolysis of Wood and Solid Recovered Fuel. Fuel 2021, 283, 118922. [Google Scholar] [CrossRef] [Scilit]
- Park, J.; Lee, Y.; Ryu, C.; Park, Y.-K. Slow Pyrolysis of Rice Straw: Analysis of Products Properties, Carbon and Energy Yields. Bioresour. Technol. 2014, 155, 63–70. [Google Scholar] [CrossRef] [Scilit]
- Muley, P.D.; Henkel, C.; Abdollahi, K.K.; Marculescu, C.; Boldor, D. A Critical Comparison of Pyrolysis of Cellulose, Lignin, and Pine Sawdust Using an Induction Heating Reactor. Energy Convers. Manag. 2016, 117, 273–280. [Google Scholar] [CrossRef] [Scilit]
- Vecino Mantilla, S.; Gauthier-Maradei, P.; Álvarez Gil, P.; Tarazona Cárdenas, S. Comparative Study of Bio-Oil Production from Sugarcane Bagasse and Palm Empty Fruit Bunch: Yield Optimization and Bio-Oil Characterization. J. Anal. Appl. Pyrolysis 2014, 108, 284–294. [Google Scholar] [CrossRef] [Scilit]
- Gao, W.; Li, H.; Karnowo; Song, B.; Zhang, S. Integrated Leaching and Thermochemical Technologies for Producing High-Value Products from Rice Husk: Leaching of Rice Husk with the Aqueous Phases of Bioliquids. Energies 2020, 13, 6033. [Google Scholar] [CrossRef] [Scilit]
- Varma, A.K.; Mondal, P. Pyrolysis of Sugarcane Bagasse in Semi Batch Reactor: Effects of Process Parameters on Product Yields and Characterization of Products. Ind. Crop. Prod. 2017, 95, 704–717. [Google Scholar] [CrossRef] [Scilit]
- Aho, A.; Kumar, N.; Eränen, K.; Holmbom, B.; Hupa, M.; Salmi, T.; Murzin, D.Y. Pyrolysis of Softwood Carbohydrates in a Fluidized Bed Reactor. Int. J. Mol. Sci. 2008, 9, 1665–1675. [Google Scholar] [CrossRef] [Scilit]
- Güllü, D.; Demirbaş, A. Biomass to Methanol via Pyrolysis Process. Energy Convers. Manag. 2001, 42, 1349–1356. [Google Scholar] [CrossRef] [Scilit]
- Shen, D.K.; Gu, S.; Bridgwater, A.V. Study on the Pyrolytic Behaviour of Xylan-Based Hemicellulose Using TG–FTIR and Py–GC–FTIR. J. Anal. Appl. Pyrolysis 2010, 87, 199–206. [Google Scholar] [CrossRef] [Scilit]
- Wang, F.; Ouyang, D.; Zhou, Z.; Page, S.J.; Liu, D.; Zhao, X. Lignocellulosic Biomass as Sustainable Feedstock and Materials for Power Generation and Energy Storage. J. Energy Chem. 2021, 57, 247–280. [Google Scholar] [CrossRef] [Scilit]
- Zhang, Y.; Chen, D.; Zhang, D.; Zhu, X. TG-FTIR Analysis of Bio-Oil and Its Pyrolysis/Gasification Property. J. Fuel Chem. Technol. 2012, 40, 1194–1199. [Google Scholar] [CrossRef] [Scilit]
- Mullen, C.A.; Boateng, A.A. Characterization of Water Insoluble Solids Isolated from Various Biomass Fast Pyrolysis Oils. J. Anal. Appl. Pyrolysis 2011, 90, 197–203. [Google Scholar] [CrossRef] [Scilit]
- Scholze, B. Long-Term Stability, Catalytic Upgrading, and Applicaton of Pyrolysis Oils: Improving the Properties of a Potential Substitute for Fossil Fuels. Ph.D. Thesis, University of Hamburg, Hamburg, Germany, 2002. [Google Scholar]
- Fele Žilnik, L.; Jazbinšek, A. Recovery of Renewable Phenolic Fraction from Pyrolysis Oil. Sep. Purif. Technol. 2012, 86, 157–170. [Google Scholar] [CrossRef] [Scilit]
- Stephan, C.; Dicko, M.; Stringari, P.; Coquelet, C. Liquid-Liquid Equilibria of Water + Solutes (Acetic Acid/ Acetol/Furfural/Guaiacol/Methanol/Phenol/Propanal) + Solvents (Isopropyl Acetate/Toluene) Ternary Systems for Pyrolysis Oil Fractionation. Fluid Phase Equilibria 2018, 468, 49–57. [Google Scholar] [CrossRef] [Scilit]
- Cesari, L.; Namysl, S.; Canabady-Rochelle, L.; Mutelet, F. Phase Equilibria of Phenolic Compounds in Water or Ethanol. Fluid Phase Equilibria 2017, 453, 58–66. [Google Scholar] [CrossRef] [Scilit]
- Rosado, M.J.; Rencoret, J.; Marques, G.; Gutiérrez, A.; Del Río, J.C. Structural Characteristics of the Guaiacyl-Rich Lignins from Rice (Oryza Sativa L.) Husks and Straw. Front. Plant Sci. 2021, 12, 640475. [Google Scholar] [CrossRef] [Scilit]
- Mullen, C.A.; Strahan, G.D.; Boateng, A.A. Characterization of Various Fast-Pyrolysis Bio-Oils by NMR Spectroscopy. Energy Fuels 2009, 23, 2707–2718. [Google Scholar] [CrossRef] [Scilit]
- Vitolo, S.; Bresci, B.; Seggiani, M.; Gallo, M.G. Catalytic Upgrading of Pyrolytic Oils over HZSM-5 Zeolite: Behaviour of the Catalyst When Used in Repeated Upgrading–Regenerating Cycles. Fuel 2001, 80, 17–26. [Google Scholar] [CrossRef] [Scilit]
- Kanaujia, P.K.; Sharma, Y.K.; Agrawal, U.C.; Garg, M.O. Analytical Approaches to Characterizing Pyrolysis Oil from Biomass. TrAC Trends Anal. Chem. 2013, 42, 125–136. [Google Scholar] [CrossRef] [Scilit]
- Huber, G.W.; Iborra, S.; Corma, A. Synthesis of Transportation Fuels from Biomass: Chemistry, Catalysts, and Engineering. Chem. Rev. 2006, 106, 4044–4098. [Google Scholar] [CrossRef] [Scilit]
- Kwiatkowski, J.S.; Leszczyński, J.; Teca, I. Molecular Structure and Infrared Spectra of Furan, Thiophene, Selenophene and Their 2,5-N and 3,4-N Derivatives: Density Functional Theory and Conventional Post-Hartree-Fock MP2 Studies. J. Mol. Struct. 1997, 436–437, 451–480. [Google Scholar] [CrossRef] [Scilit]
- Xin, X.; Dell, K.; Udugama, I.A.; Young, B.R.; Baroutian, S. Transforming Biomass Pyrolysis Technologies to Produce Liquid Smoke Food Flavouring. J. Clean. Prod. 2021, 294, 125368. [Google Scholar] [CrossRef] [Scilit]
- Montazeri, N.; Oliveira, A.C.M.; Himelbloom, B.H.; Leigh, M.B.; Crapo, C.A. Chemical Characterization of Commercial Liquid Smoke Products. Food Sci. Nutr. 2013, 1, 102–115. [Google Scholar] [CrossRef] [Scilit] [PubMed]
- Selin, E.; Mandava, G.; Vilcu, A.-L.; Oskarsson, A.; Lundqvist, J. An in Vitro-Based Hazard Assessment of Liquid Smoke Food Flavourings. Arch. Toxicol. 2022, 96, 601–611. [Google Scholar] [CrossRef] [Scilit] [PubMed]
- Mansur, D.; Sugiwati, S.; Rizal, W.A.; Suryani, R.; Maryana, R. Pyrolysis of Cajuput (Melaleuca leucadendron) Twigs and Rice (Oryza Sativa) Husks to Produce Liquid Smoke-Containing Fine Chemicals for Antibacterial Agent Application. Biomass Conv. Bioref. 2023, 13, 10561–10574. [Google Scholar] [CrossRef] [Scilit] [PubMed]
- Risfaheri, R.; Hoerudin, H.; Hidayat, T.; Arif, A.B.; Yulianto, A.; Hendriadi, A. Rice Husk for Production of Multifunctional Liquid Smoke. In Rice Husk Biomass; Jawaid, M., Parmar, B., Eds.; Sustainable Materials and Technology; Springer Nature: Singapore, 2025; pp. 125–152. ISBN 978-981-96-1081-5. [Google Scholar]
- Dellarose Boer, F.; Valette, J.; Commandré, J.-M.; Fournier, M.; Thévenon, M.-F. Slow Pyrolysis of Sugarcane Bagasse for the Production of Char and thePotential of Its By-Product for Wood Protection. J. Renew. Mater. 2021, 9, 97–117. [Google Scholar] [CrossRef] [Scilit]
- Ouattara, H.A.A.; Niamké, F.B.; Yao, J.C.; Amusant, N.; Garnier, B. Wood Vinegars: Production Processes, Properties, and Valorization. For. Prod. J. 2023, 73, 239–249. [Google Scholar] [CrossRef] [Scilit]
- Elaieb, M.T.; Valette, J.; Kiény, E.; Pignolet, L.; Ghariani, S.; Candelier, K. Antifungal and Anti-Termite Activities Relating to Chemical Composition of Pyrolysis Liquid from Carbonization of Five Tunisian Wood Species. Waste Biomass Valorization 2025. [Google Scholar] [CrossRef] [Scilit]
- Oramahi, H.A.; Yoshimura, T.; Diba, F.; Setyawati, D.; Nurhaida. Antifungal and Antitermitic Activities of Wood Vinegar from Oil Palm Trunk. J. Wood Sci. 2018, 64, 311–317. [Google Scholar] [CrossRef] [Scilit]
- Pimenta, A.; Fasciotti, M.; Monteiro, T.; Lima, K. Chemical Composition of Pyroligneous Acid Obtained from Eucalyptus GG100 Clone. Molecules 2018, 23, 426. [Google Scholar] [CrossRef] [Scilit]
- Mohan, D.; Pittman, C.U.; Steele, P.H. Pyrolysis of Wood/Biomass for Bio-Oil: A Critical Review. Energy Fuels 2006, 20, 848–889. [Google Scholar] [CrossRef] [Scilit]
- Qin, L.; Li, W.-C.; Liu, L.; Zhu, J.-Q.; Li, X.; Li, B.-Z.; Yuan, Y.-J. Inhibition of Lignin-Derived Phenolic Compounds to Cellulase. Biotechnol. Biofuels 2016, 9, 70. [Google Scholar] [CrossRef] [Scilit]
- Oehr, K.H.; Barrass, G. Biomass Derived Calcium Carboxylates. In Advances in Thermochemical Biomass Conversion; Bridgwater, A.V., Ed.; Springer: Dordrecht, The Netherlands, 1993; pp. 1456–1459. ISBN 978-94-010-4582-7. [Google Scholar]
- Park, L.K.-E.; Ren, S.; Yiacoumi, S.; Ye, X.P.; Borole, A.P.; Tsouris, C. pH Neutralization of Aqueous Bio-Oil from Switchgrass Intermediate Pyrolysis Using Process Intensification Devices. Energy Fuels 2017, 31, 9455–9464. [Google Scholar] [CrossRef] [Scilit]
- Dhyani, V.; Bhaskar, T. A Comprehensive Review on the Pyrolysis of Lignocellulosic Biomass. Renew. Energy 2018, 129, 695–716. [Google Scholar] [CrossRef] [Scilit]
- Zhang, Y.; Cui, H.; Yi, W.; Song, F.; Zhao, P.; Wang, L.; Cui, J. Highly Effective Decarboxylation of the Carboxylic Acids in Fast Pyrolysis Oil of Rice Husk towards Ketones Using CaCO3 as a Recyclable Agent. Biomass Bioenergy 2017, 102, 13–22. [Google Scholar] [CrossRef] [Scilit]
- Lin, R.W. Removal of Water from Bio-Oil 2011. U.S. Patent US8,083,900 B2, 27 December 2011. [Google Scholar]
- Usman, M.; Cheng, S.; Boonyubol, S.; Cross, J.S. Evaluating Green Solvents for Bio-Oil Extraction: Advancements, Challenges, and Future Perspectives. Energies 2023, 16, 5852. [Google Scholar] [CrossRef] [Scilit]
- Wang, H.; Livingston, D.; Srinivasan, R.; Li, Q.; Steele, P.; Yu, F. Detoxification and Fermentation of Pyrolytic Sugar for Ethanol Production. Appl. Biochem. Biotechnol. 2012, 168, 1568–1583. [Google Scholar] [CrossRef] [Scilit]
- Jiang, G.; Lv, D.; Zhang, F.; Ning, A.; Gao, G.; Ren, Y.; Wang, Z. Selective Extraction of Monophenols from Pyrolysis Bio-Oil Based on a Novel Three-Dimensional Visualization Model. Sep. Purif. Technol. 2021, 272, 118902. [Google Scholar] [CrossRef] [Scilit]
- Effendi, A.; Gerhauser, H.; Bridgwater, A.V. Production of Renewable Phenolic Resins by Thermochemical Conversion of Biomass: A Review. Renew. Sustain. Energy Rev. 2008, 12, 2092–2116. [Google Scholar] [CrossRef] [Scilit]
- Fardhyanti, D.S.; Chafidz, A.; Triwibowo, B.; Prasetiawan, H.; Cahyani, N.N.; Andriyani, S. Improving the Quality of Bio-Oil Produced from Rice Husk Pyrolysis by Extraction of Its Phenolic Compounds. J. Bahan Alam Terbarukan 2020, 8, 90–100. [Google Scholar] [CrossRef] [Scilit]
- Ahmad, S.F.K.; Ali, U.F.; Isa, K.; Gopinath, S.C.B. Evaluation of Phenol Formaldehyde Resin Synthesized from Sugarcane Bagasse Bio-Oil under Optimized Parameters. J. Eng. Sci. Technol. 2022, 17, 1523–1531. [Google Scholar]
- Saires, P.; Ariza Barraza, C.; Bertero, M.; Pujro, R.; Falco, M.; Sedran, U. Characterization of Pyrolytic Tars Derived from Different Biomasses. Processes 2024, 12, 817. [Google Scholar] [CrossRef] [Scilit]
- Zheng, J.-L.; Zhu, Y.-H.; Zhu, M.-Q.; Sun, G.-T.; Sun, R.-C. Life-Cycle Assessment and Techno-Economic Analysis of the Utilization of Bio-Oil Components for the Production of Three Chemicals. Green Chem. 2018, 20, 3287–3301. [Google Scholar] [CrossRef] [Scilit]
- Zhang, R.; Wang, H.; Jiang, X.; You, Z.; Yang, X.; Ye, M. Thermal Storage Stability of Bio-Oil Modified Asphalt. J. Mater. Civ. Eng. 2018, 30, 04018054. [Google Scholar] [CrossRef] [Scilit]
- Taverna, M.E.; Busatto, C.A.; Saires, P.J.; Bertero, M.P.; Sedran, U.A.; Estenoz, D.A. Bio-Composite Films Based on Alginate and Rice Husk Tar Microparticles Loaded with Eugenol for Active Packaging. Waste Biomass Valor. 2022, 13, 3061–3070. [Google Scholar] [CrossRef] [Scilit]
- Bertero, M.; Sedran, U. Coprocessing of Bio-Oil in Fluid Catalytic Cracking. In Recent Advances in Thermo-Chemical Conversion of Biomass; Elsevier: Amsterdam, The Netherlands, 2015; pp. 355–381. ISBN 978-0-444-63289-0. [Google Scholar]
- Bertero, M.; Sedran, U. Conversion of Pine Sawdust Bio-Oil (Raw and Thermally Processed) over Equilibrium FCC Catalysts. Bioresour. Technol. 2013, 135, 644–651. [Google Scholar] [CrossRef] [Scilit] [PubMed]
- Panero, M.; Pujro, R.; Falco, M.; Sedran, U.; Bilbao, J.; Arandes, J.M. Limitations in the Energy Balance When VGO/Aqueous Bio-Oil Mixtures Are Co-Processed in FCC Units. Fuel 2022, 324, 124798. [Google Scholar] [CrossRef] [Scilit]
- Bertero, M.; García, J.R.; Falco, M.; Sedran, U. Conversion of Cow Manure Pyrolytic Tar Under FCC Conditions Over Modified Equilibrium Catalysts. Waste Biomass Valor. 2020, 11, 2925–2933. [Google Scholar] [CrossRef] [Scilit]
- Pujro, R.; Panero, M.; Bertero, M.; Sedran, U.; Falco, M. Hydrogen Transfer between Hydrocarbons and Oxygenated Compounds in Coprocessing Bio-Oils in Fluid Catalytic Cracking. Energy Fuels 2019, 33, 6473–6482. [Google Scholar] [CrossRef] [Scilit]
- García, J.R.; Bertero, M.; Falco, M.; Sedran, U. Catalytic Cracking of Bio-Oils Improved by the Formation of Mesopores by Means of Y Zeolite Desilication. Appl. Catal. A Gen. 2015, 503, 1–8. [Google Scholar] [CrossRef] [Scilit]
- Bertero, M.; García, J.R.; Falco, M.; Sedran, U. FCC Matrix Components and Their Combination with Y Zeolite to Enhance the Deoxygenation of Bio-Oils. Bioenerg. Res. 2022, 15, 1327–1341. [Google Scholar] [CrossRef] [Scilit]
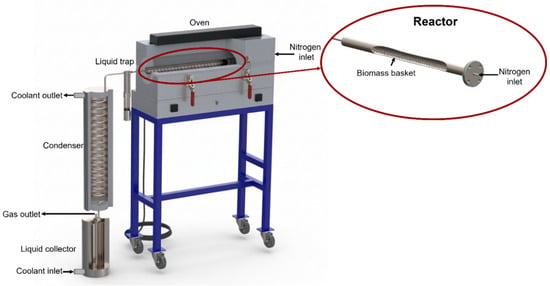
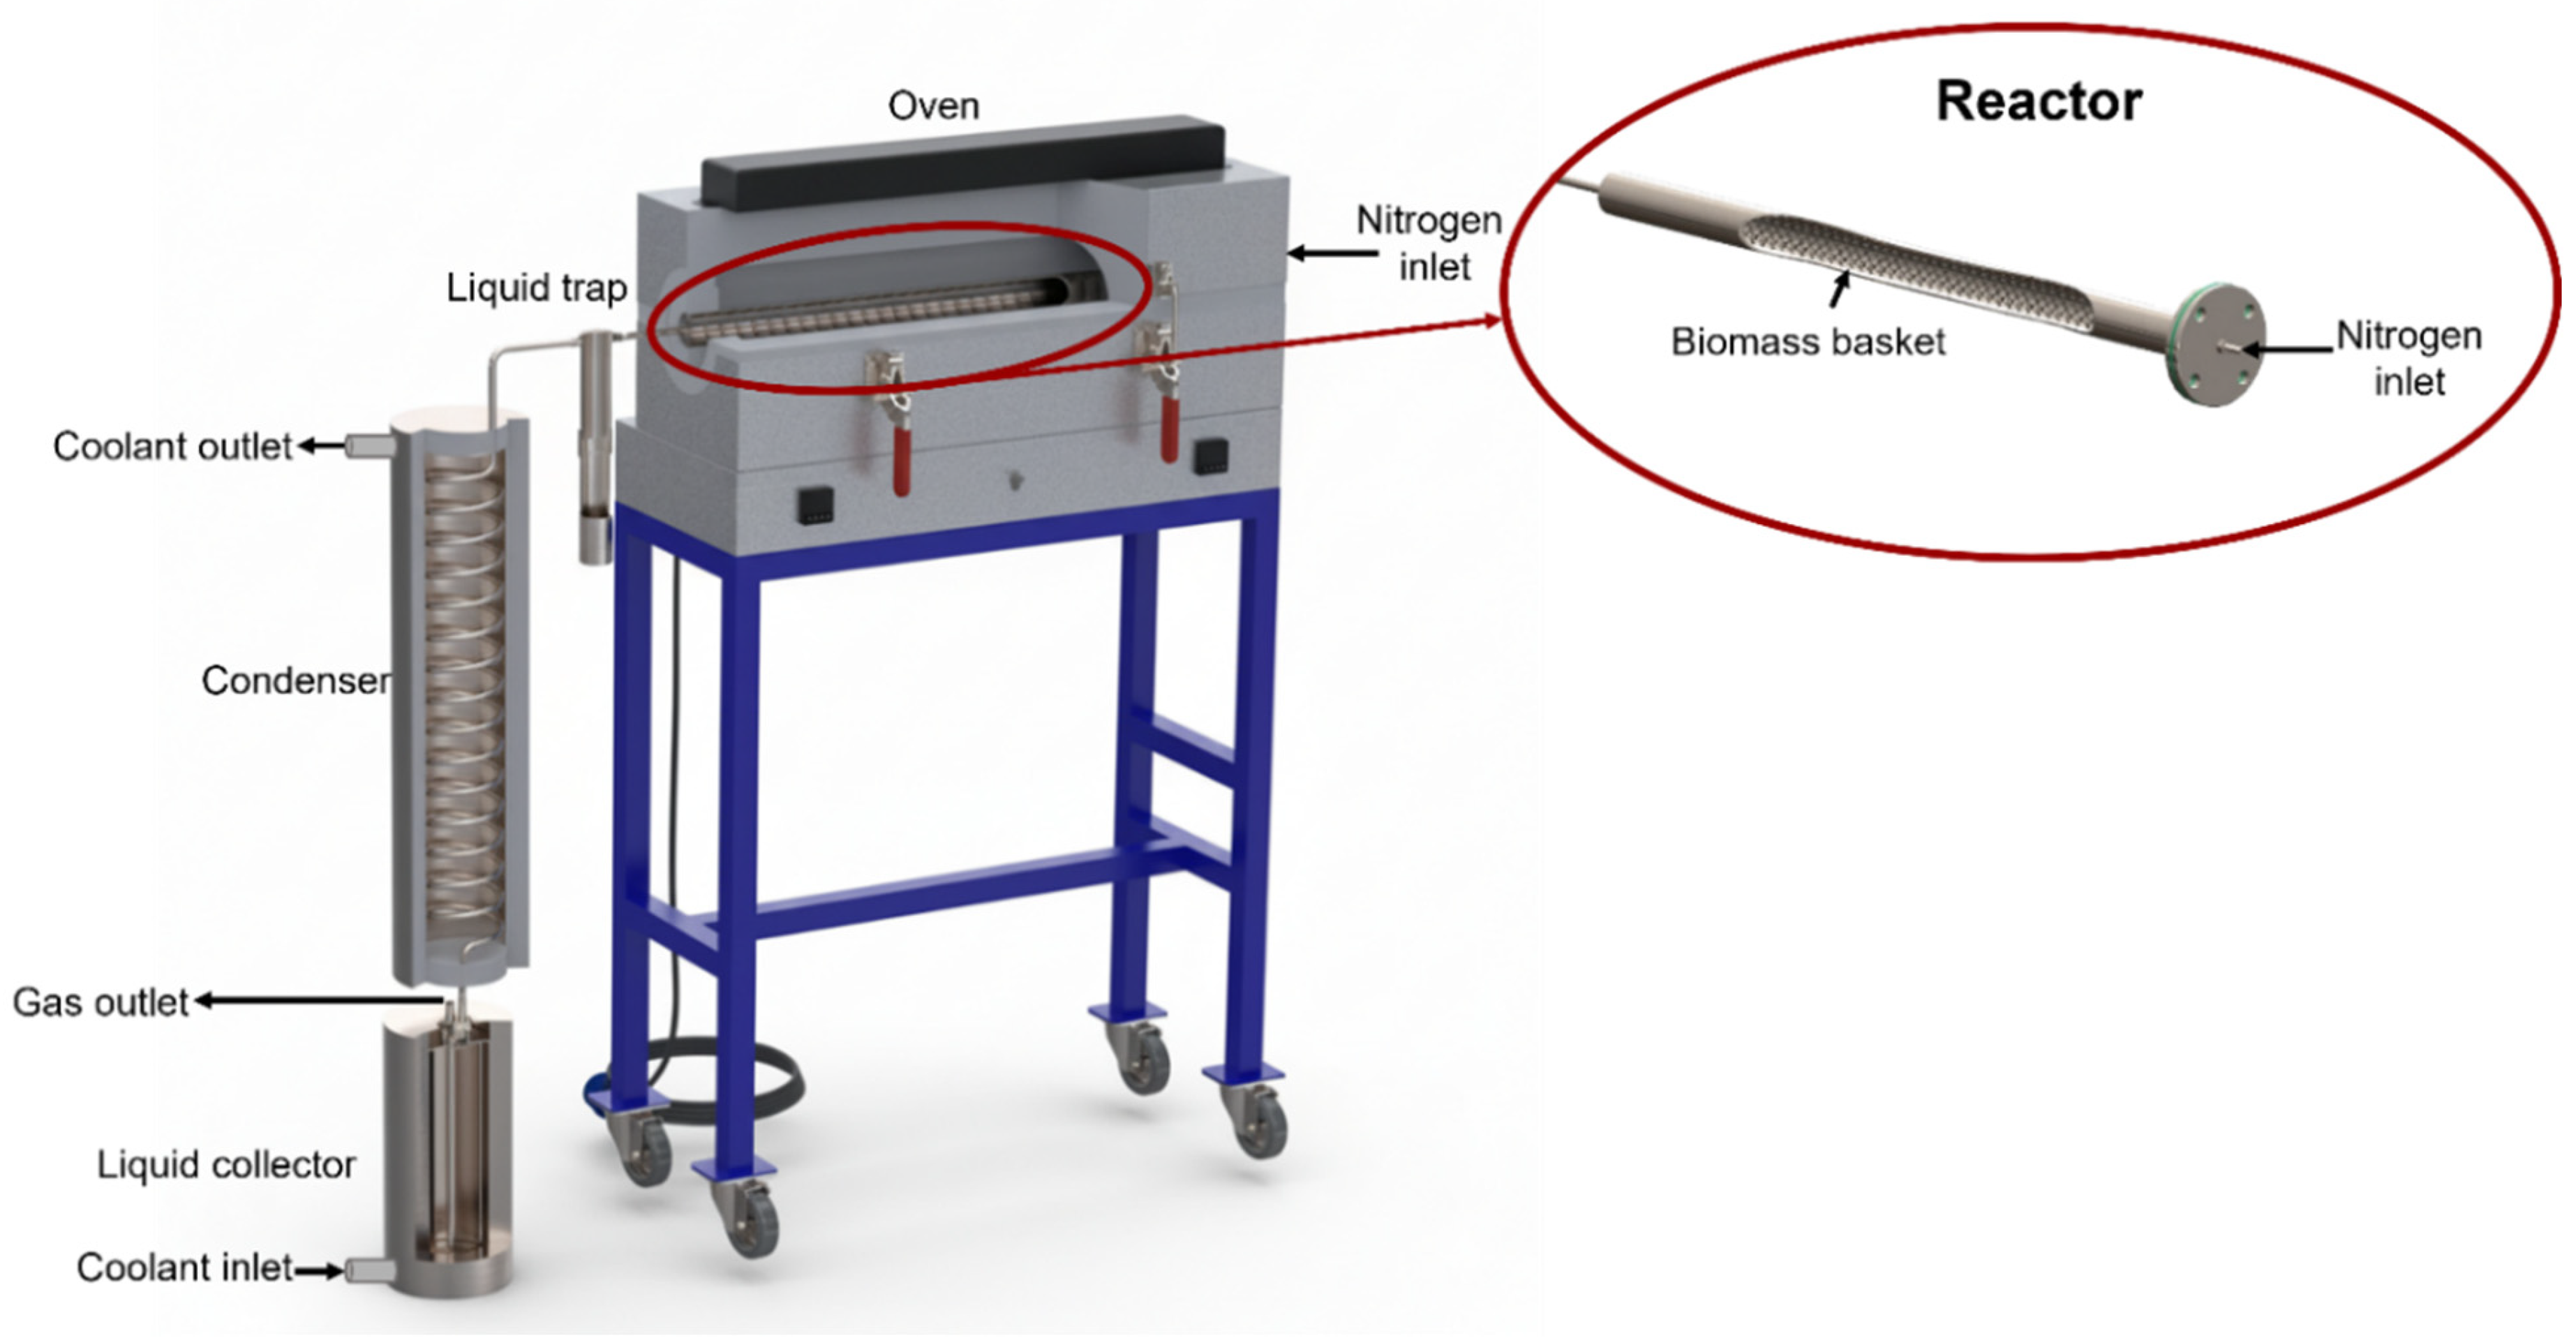
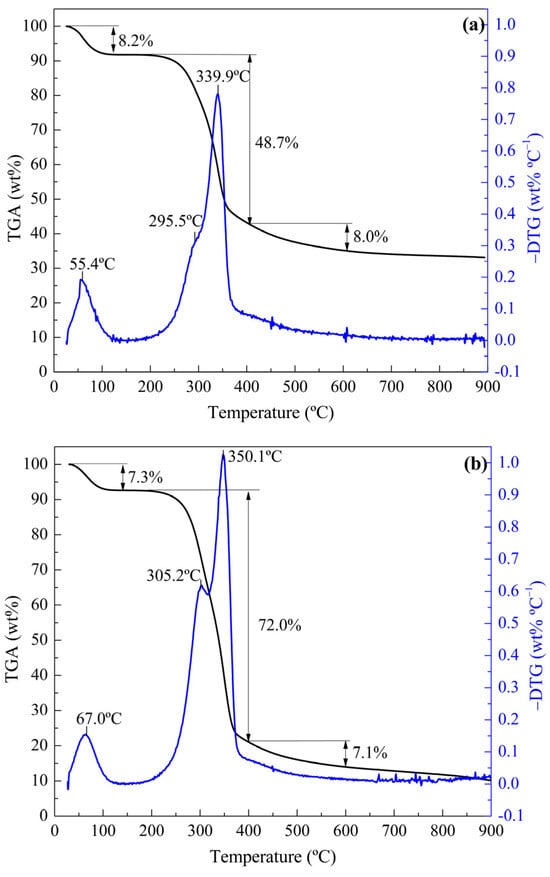
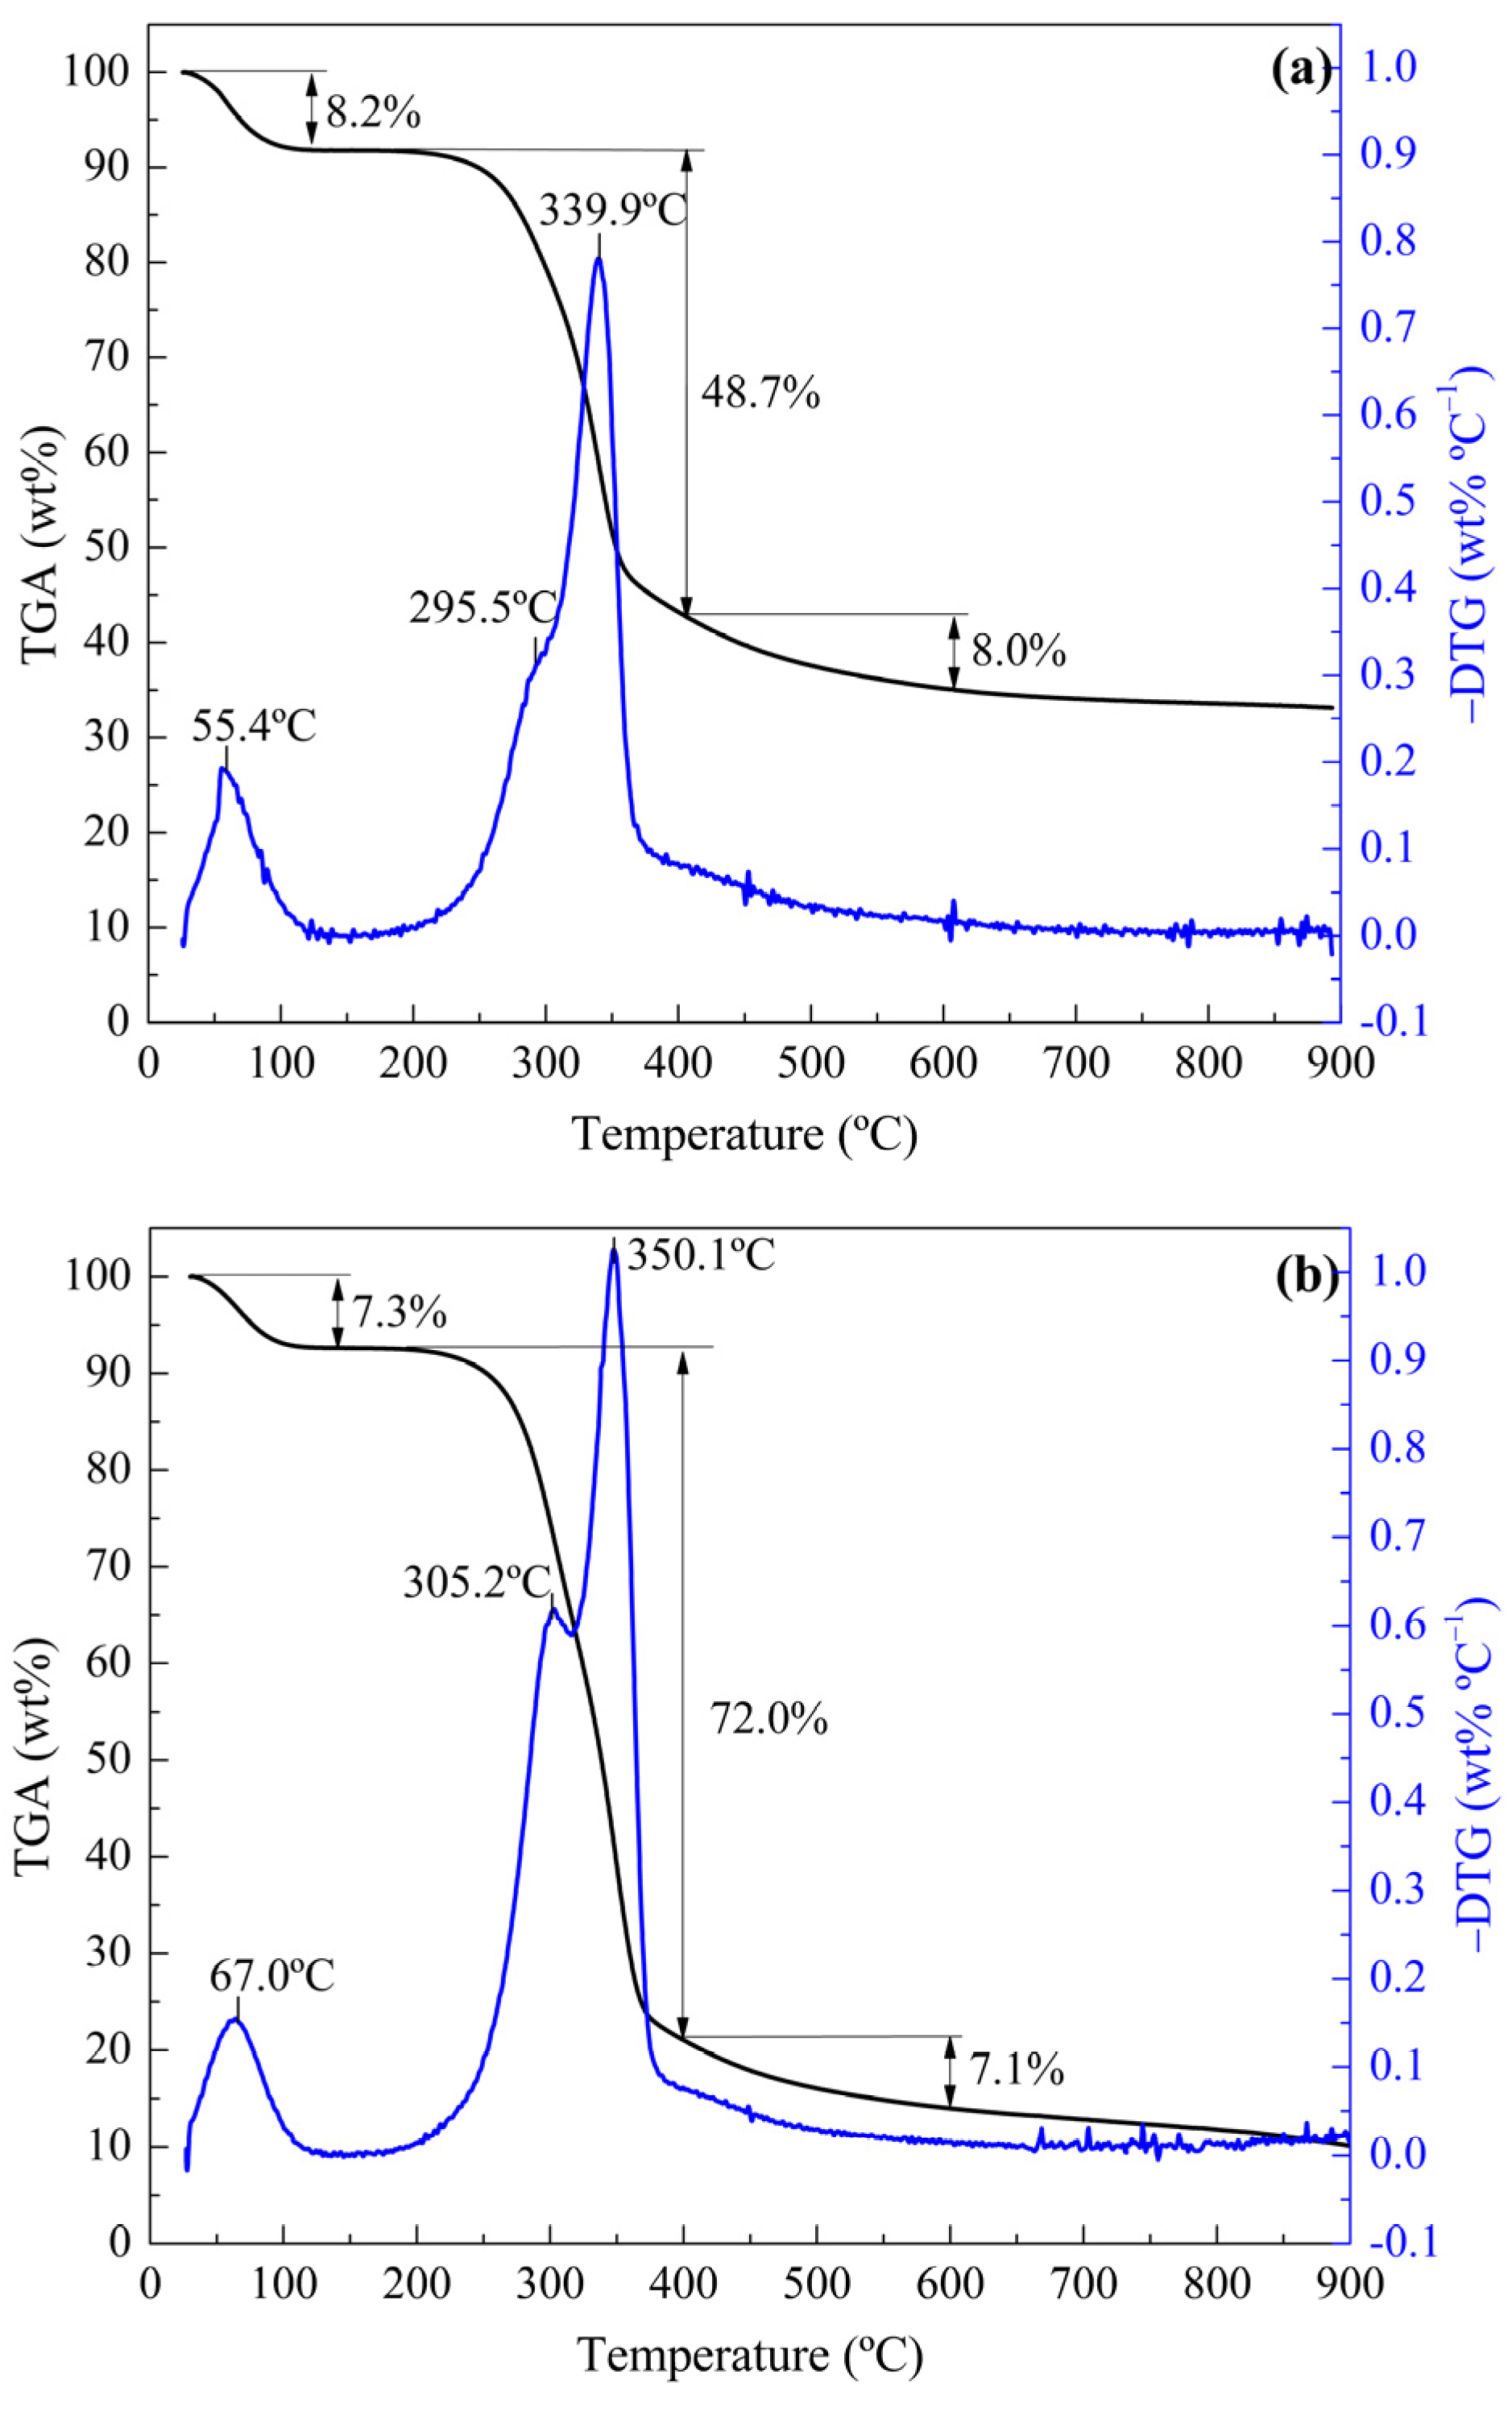
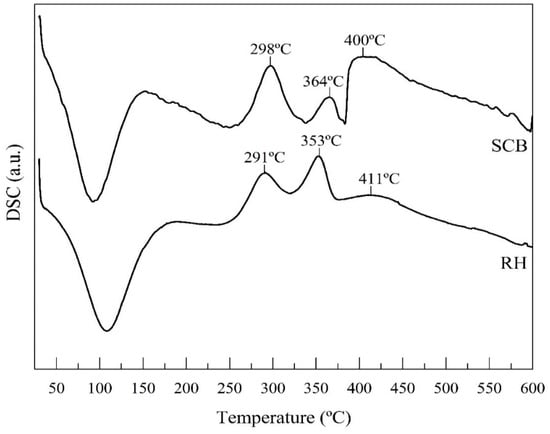
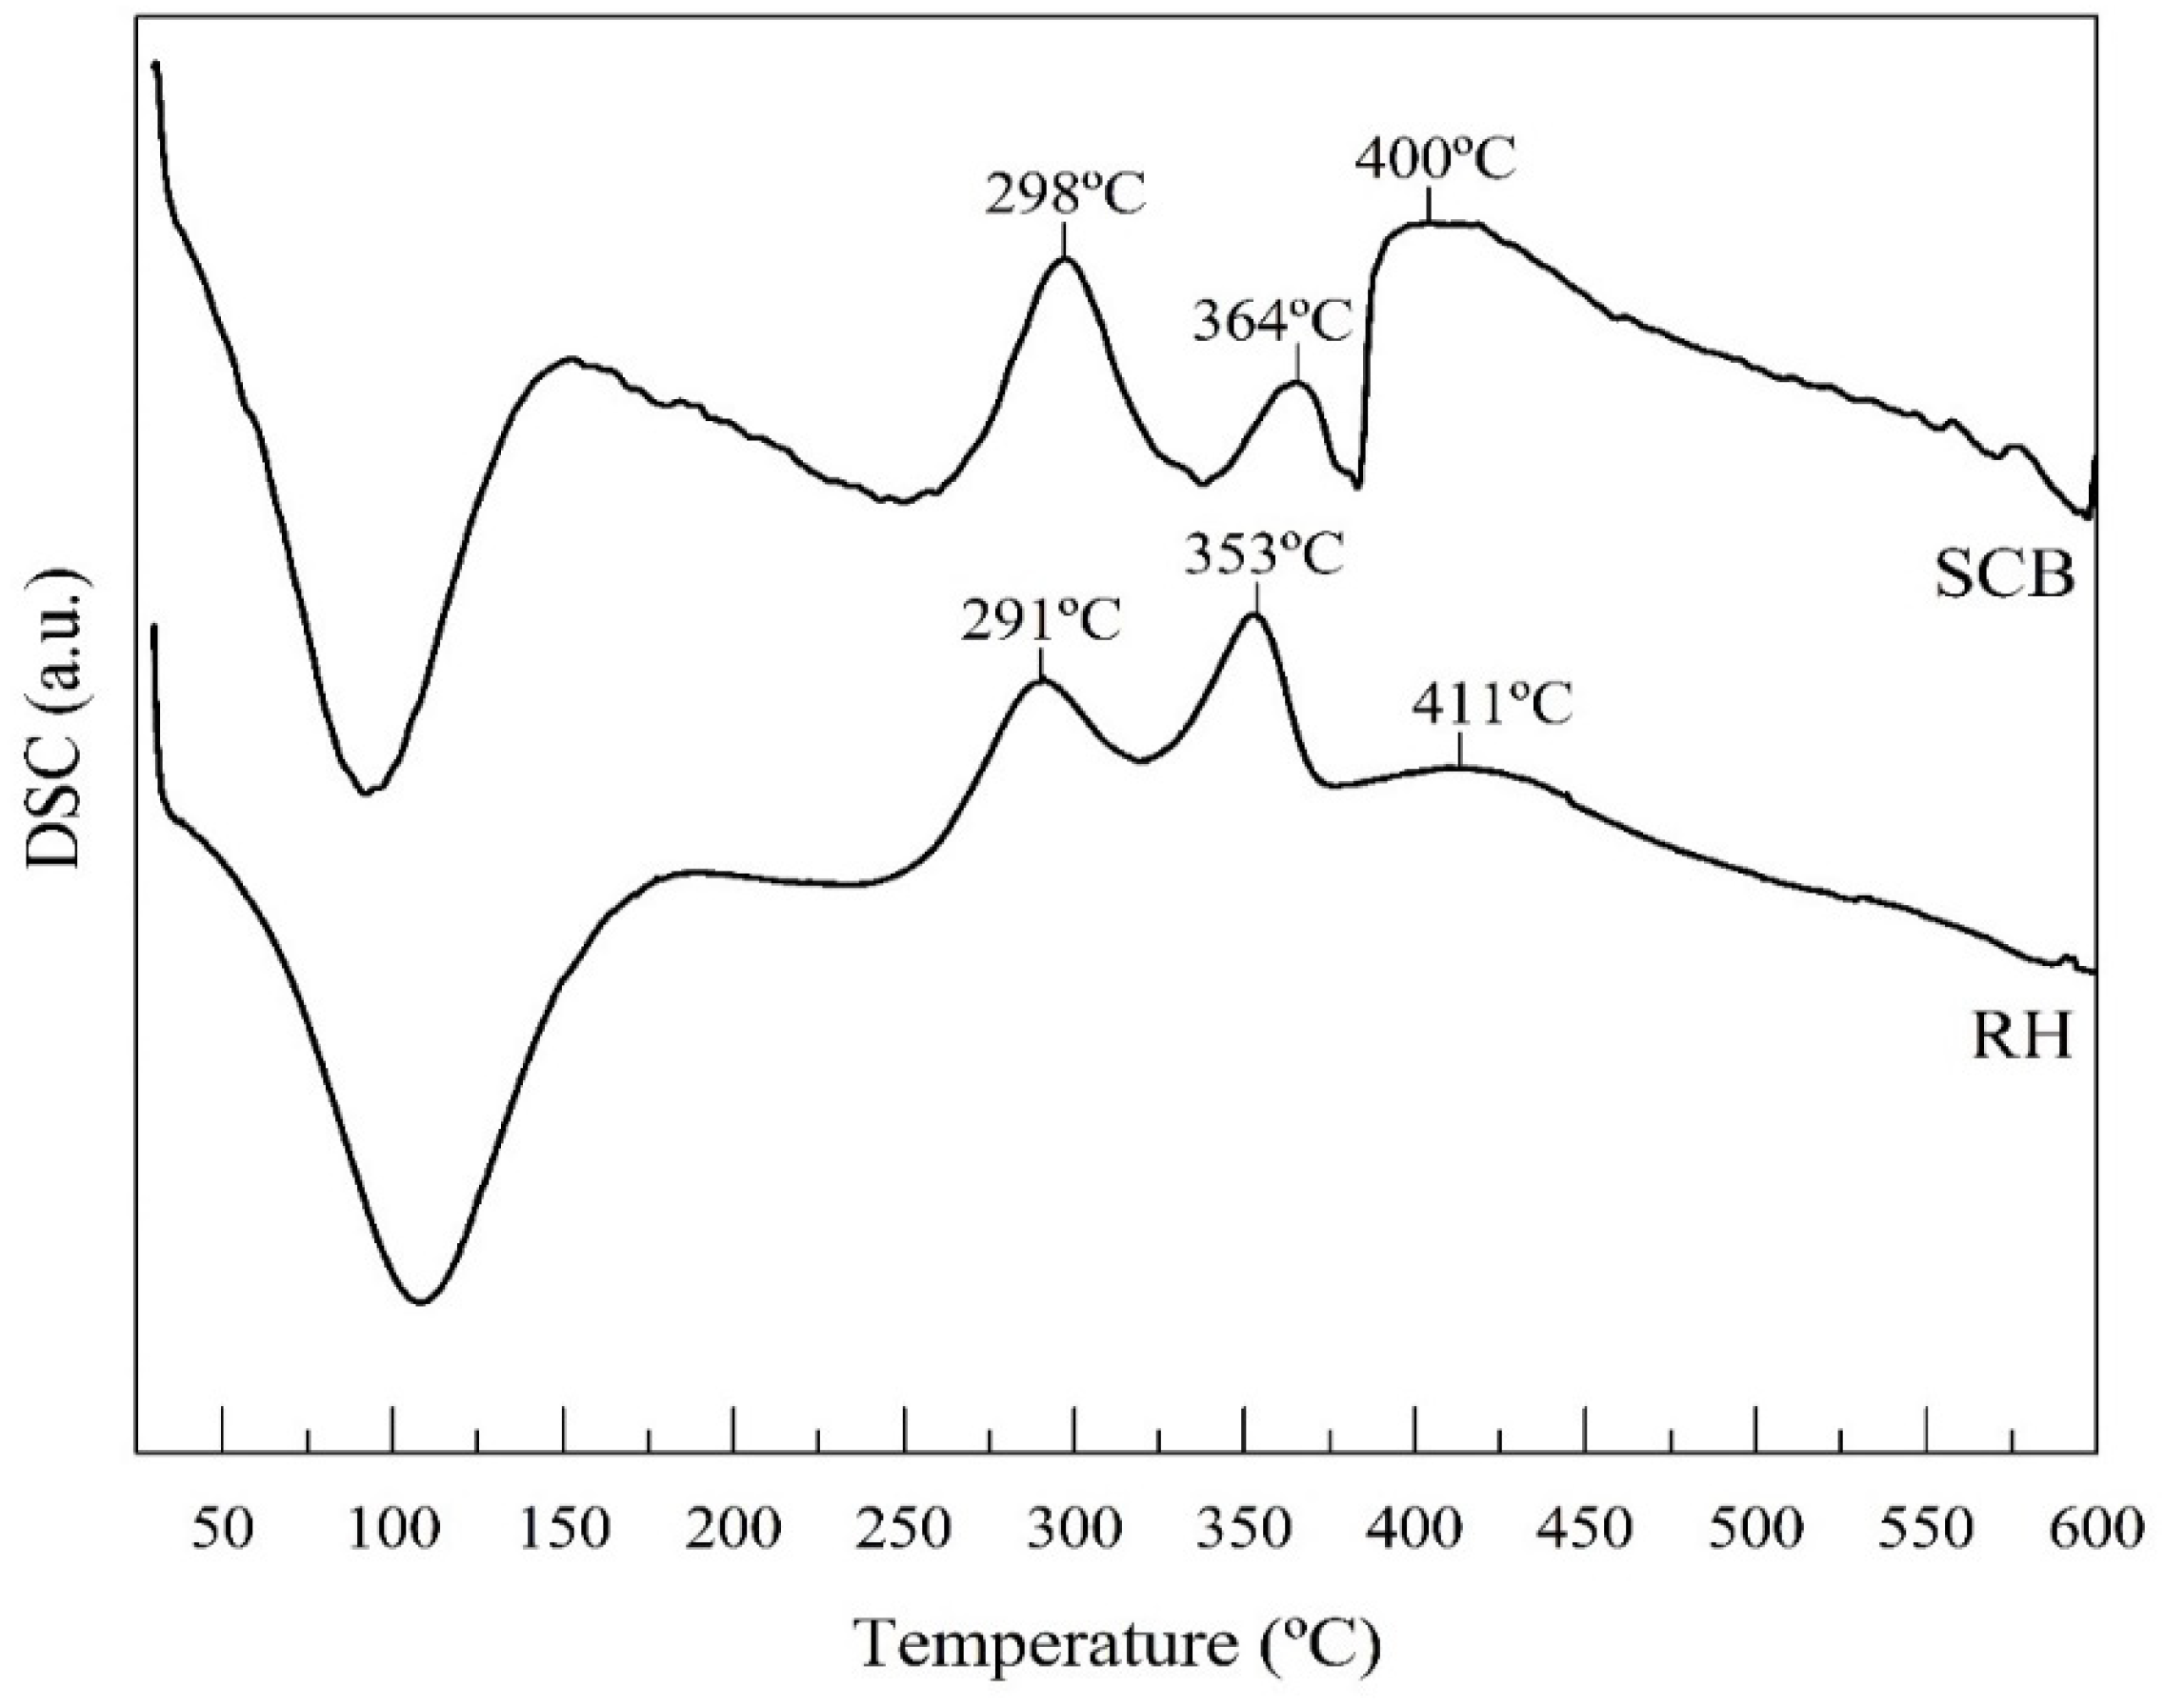
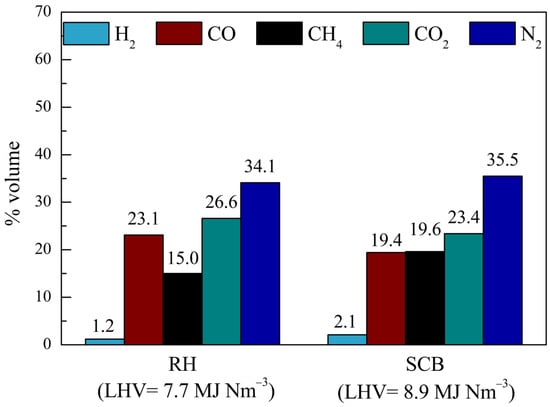
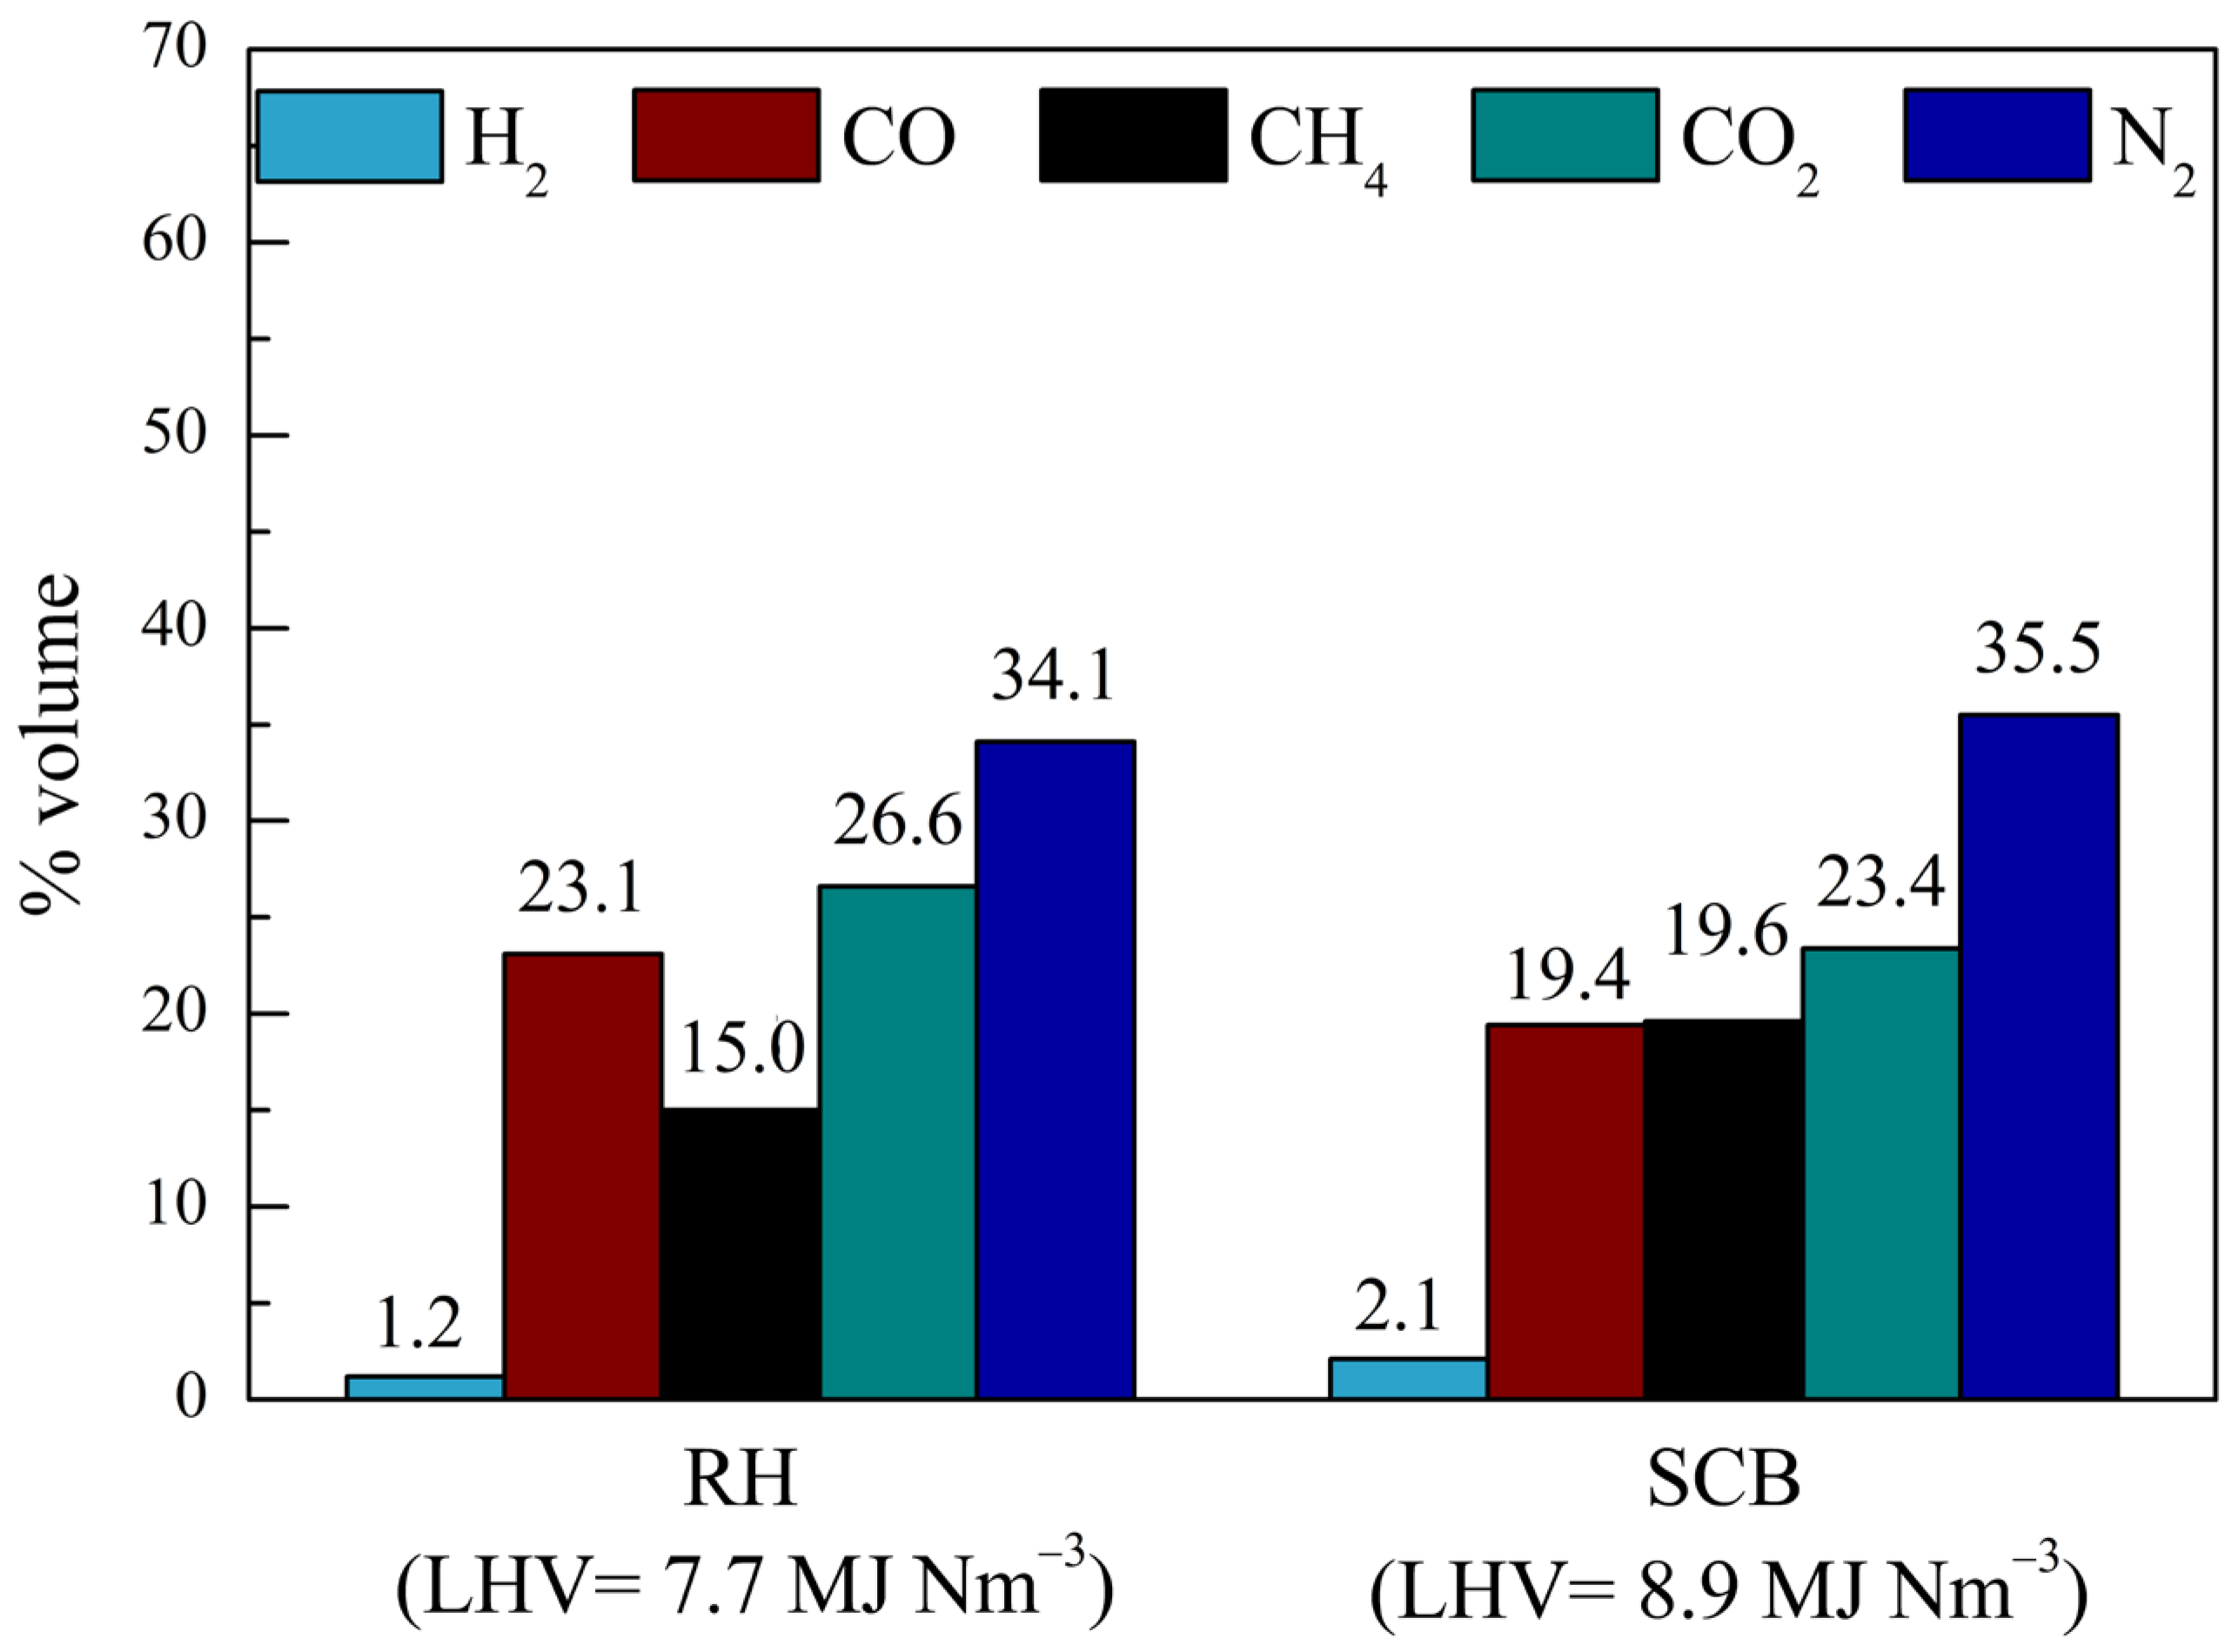
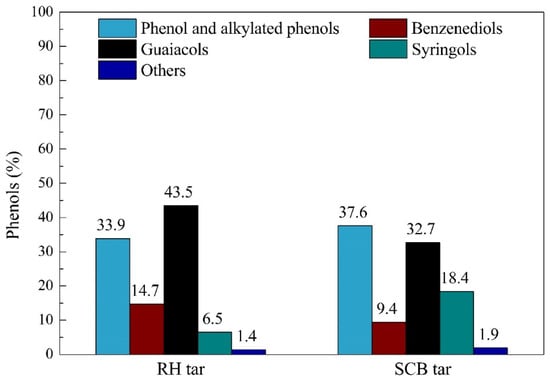
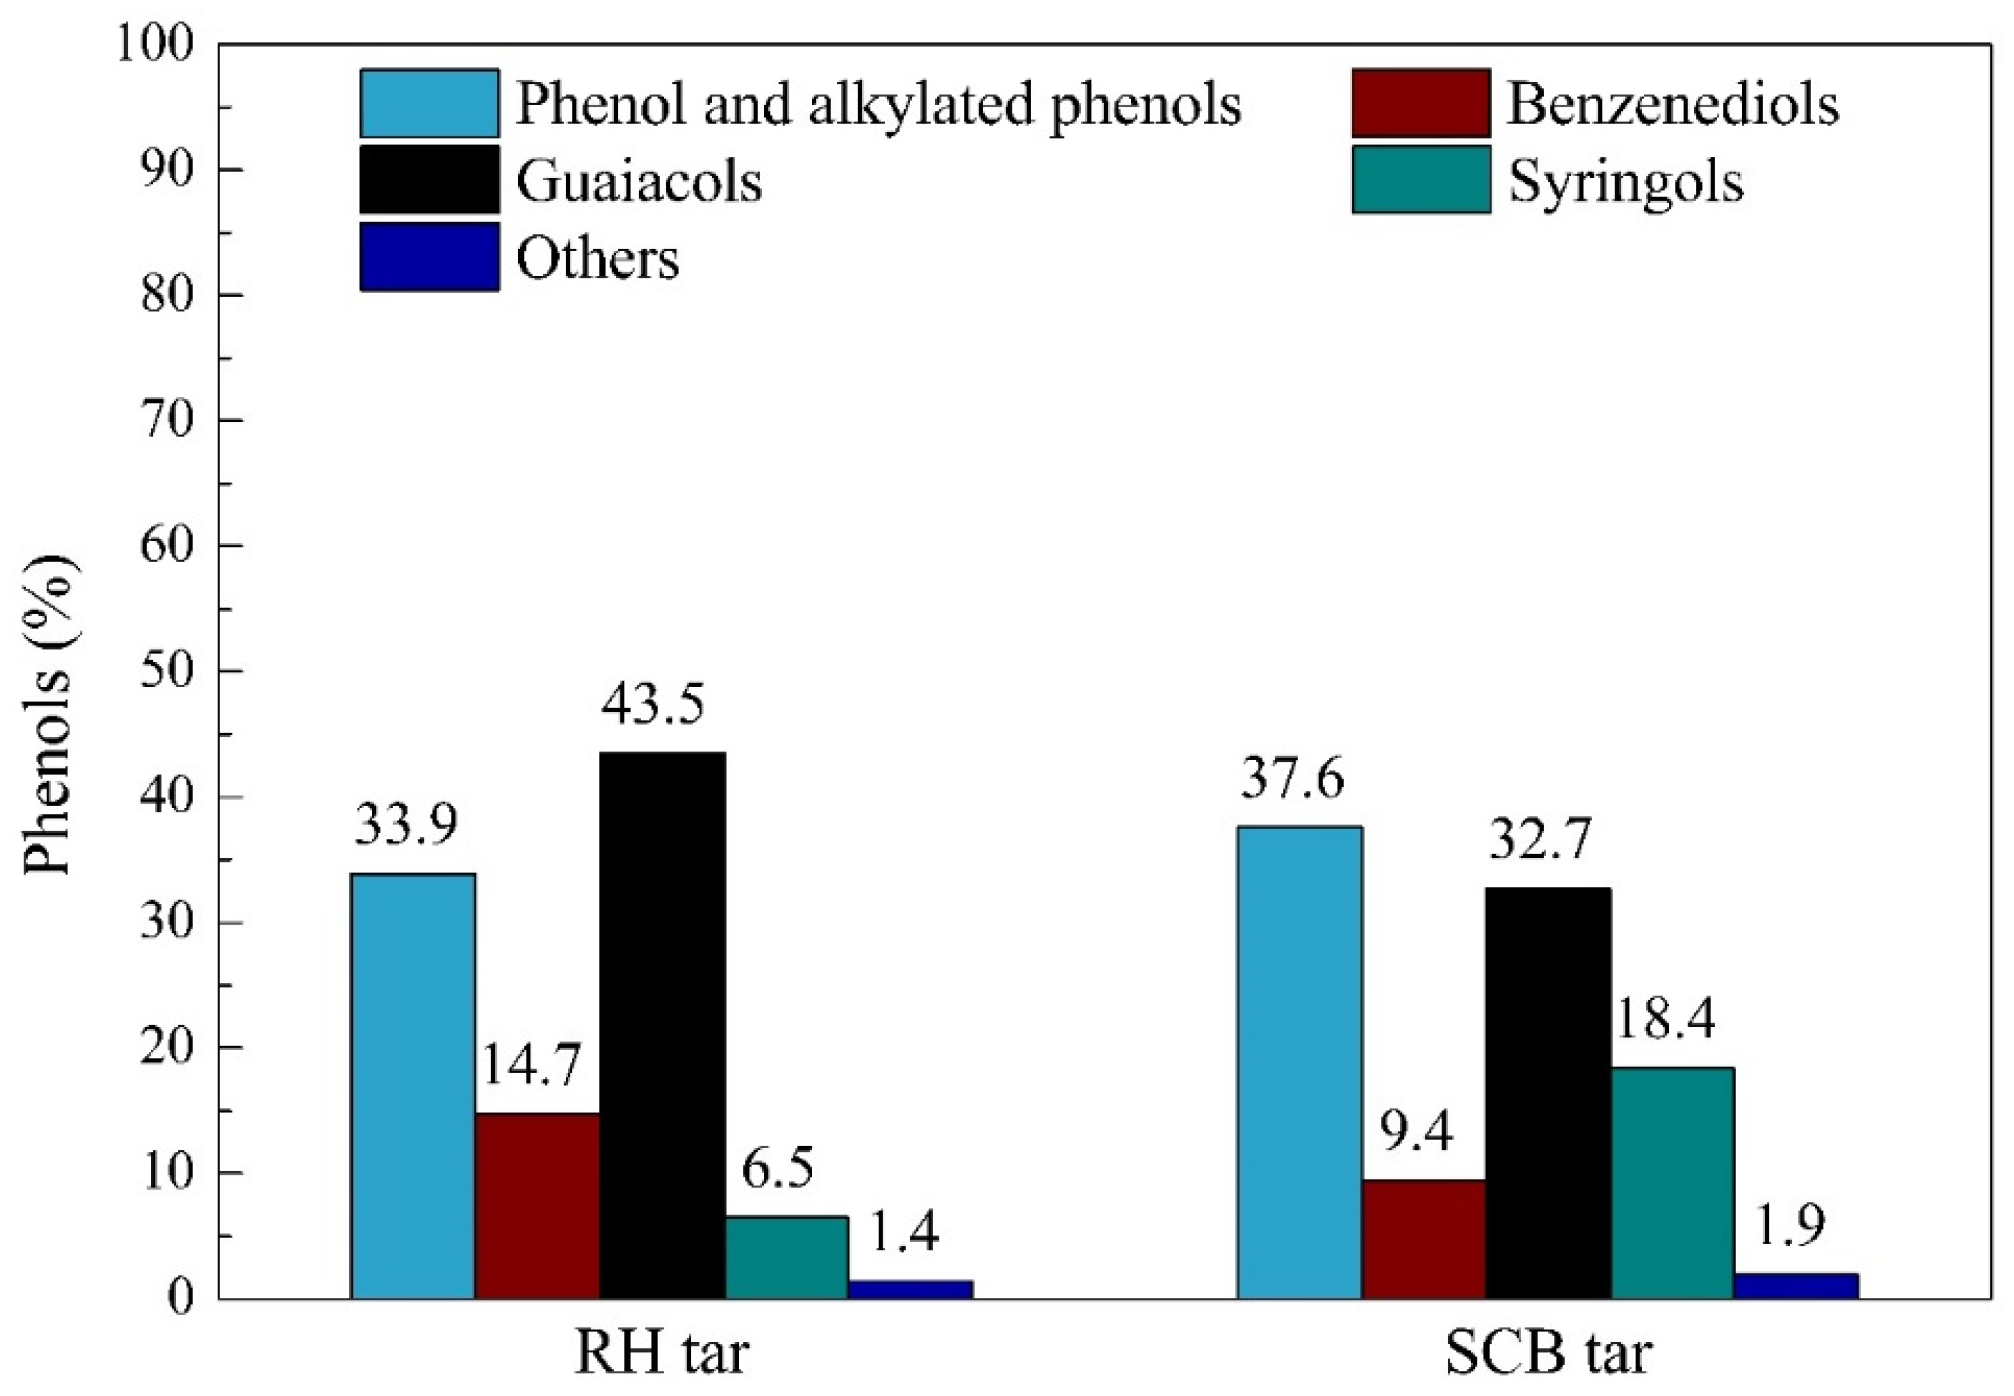
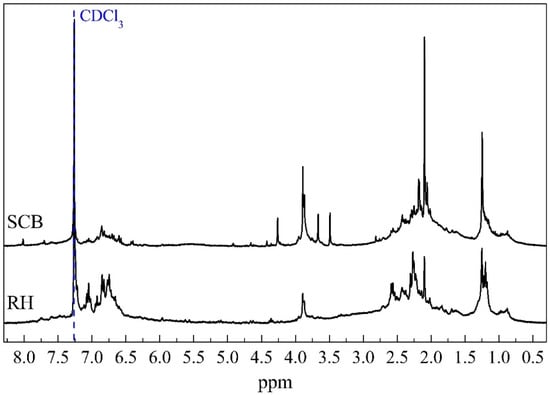
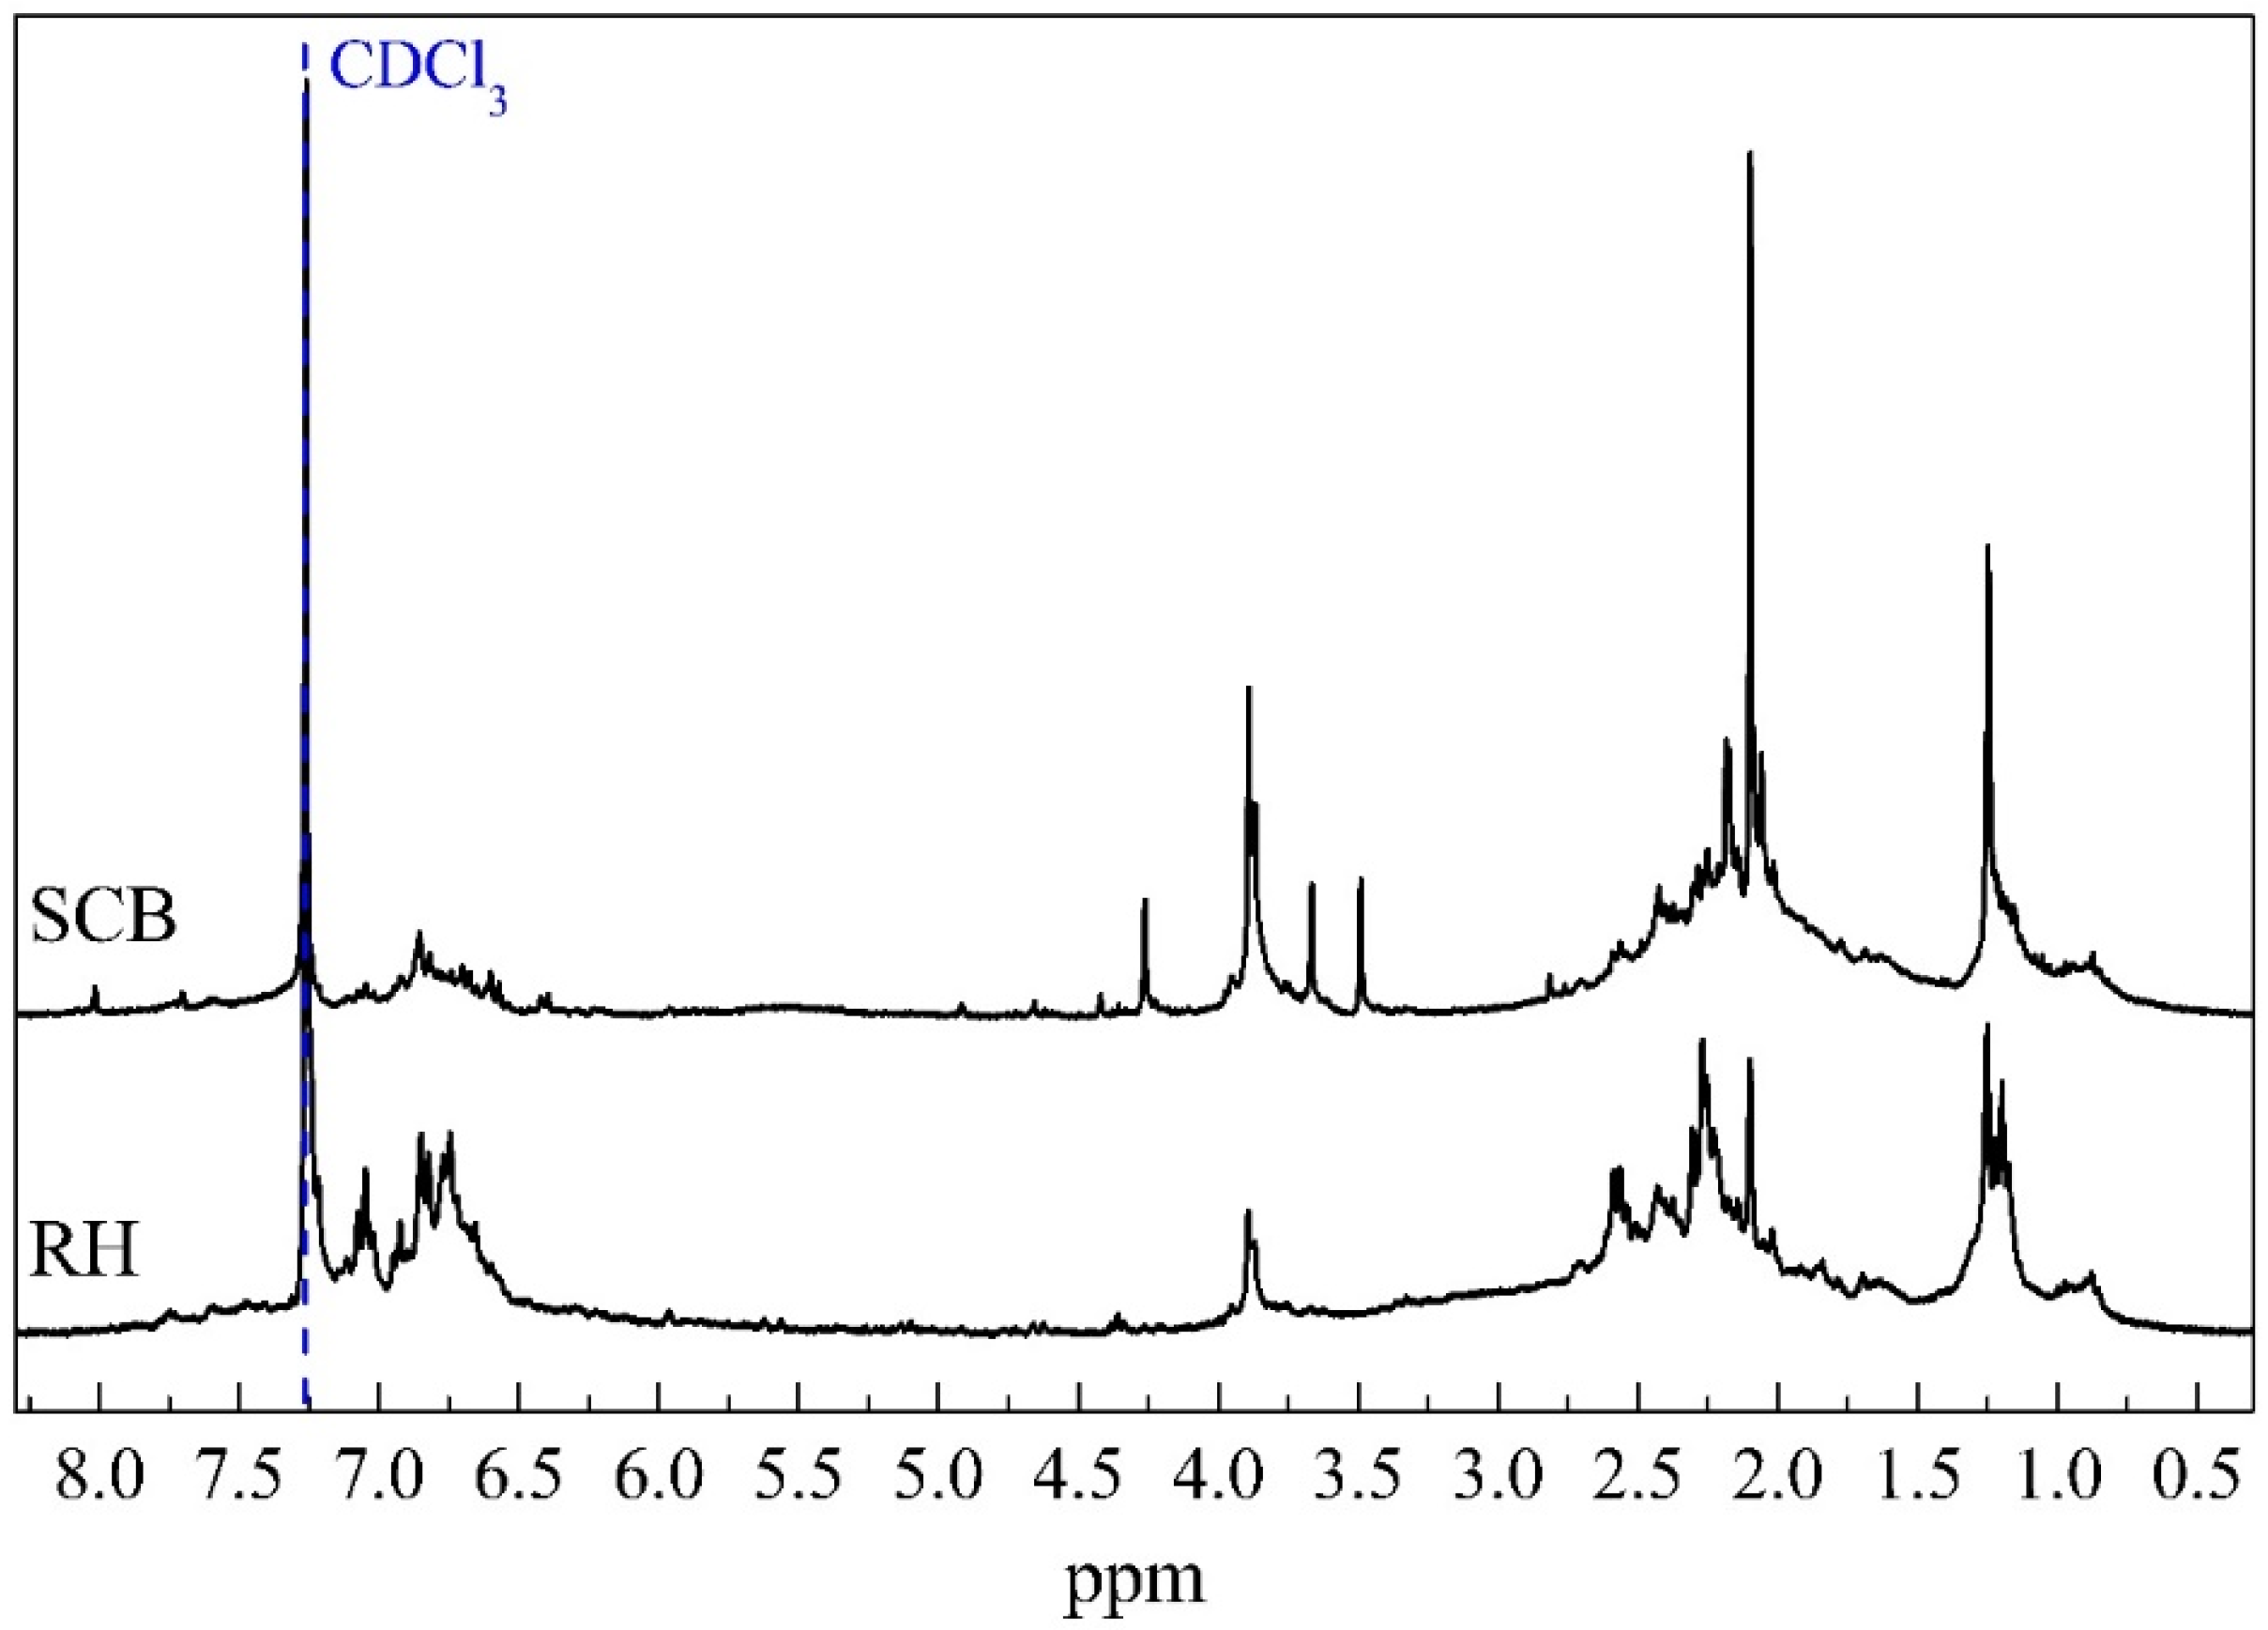
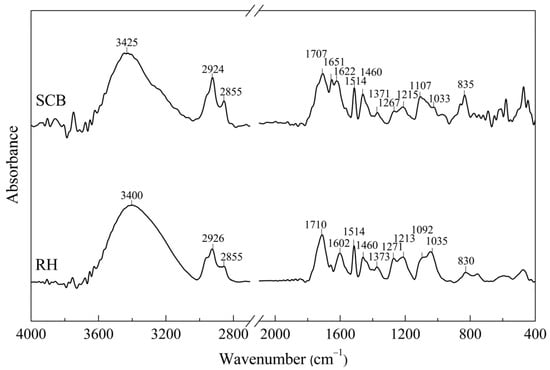
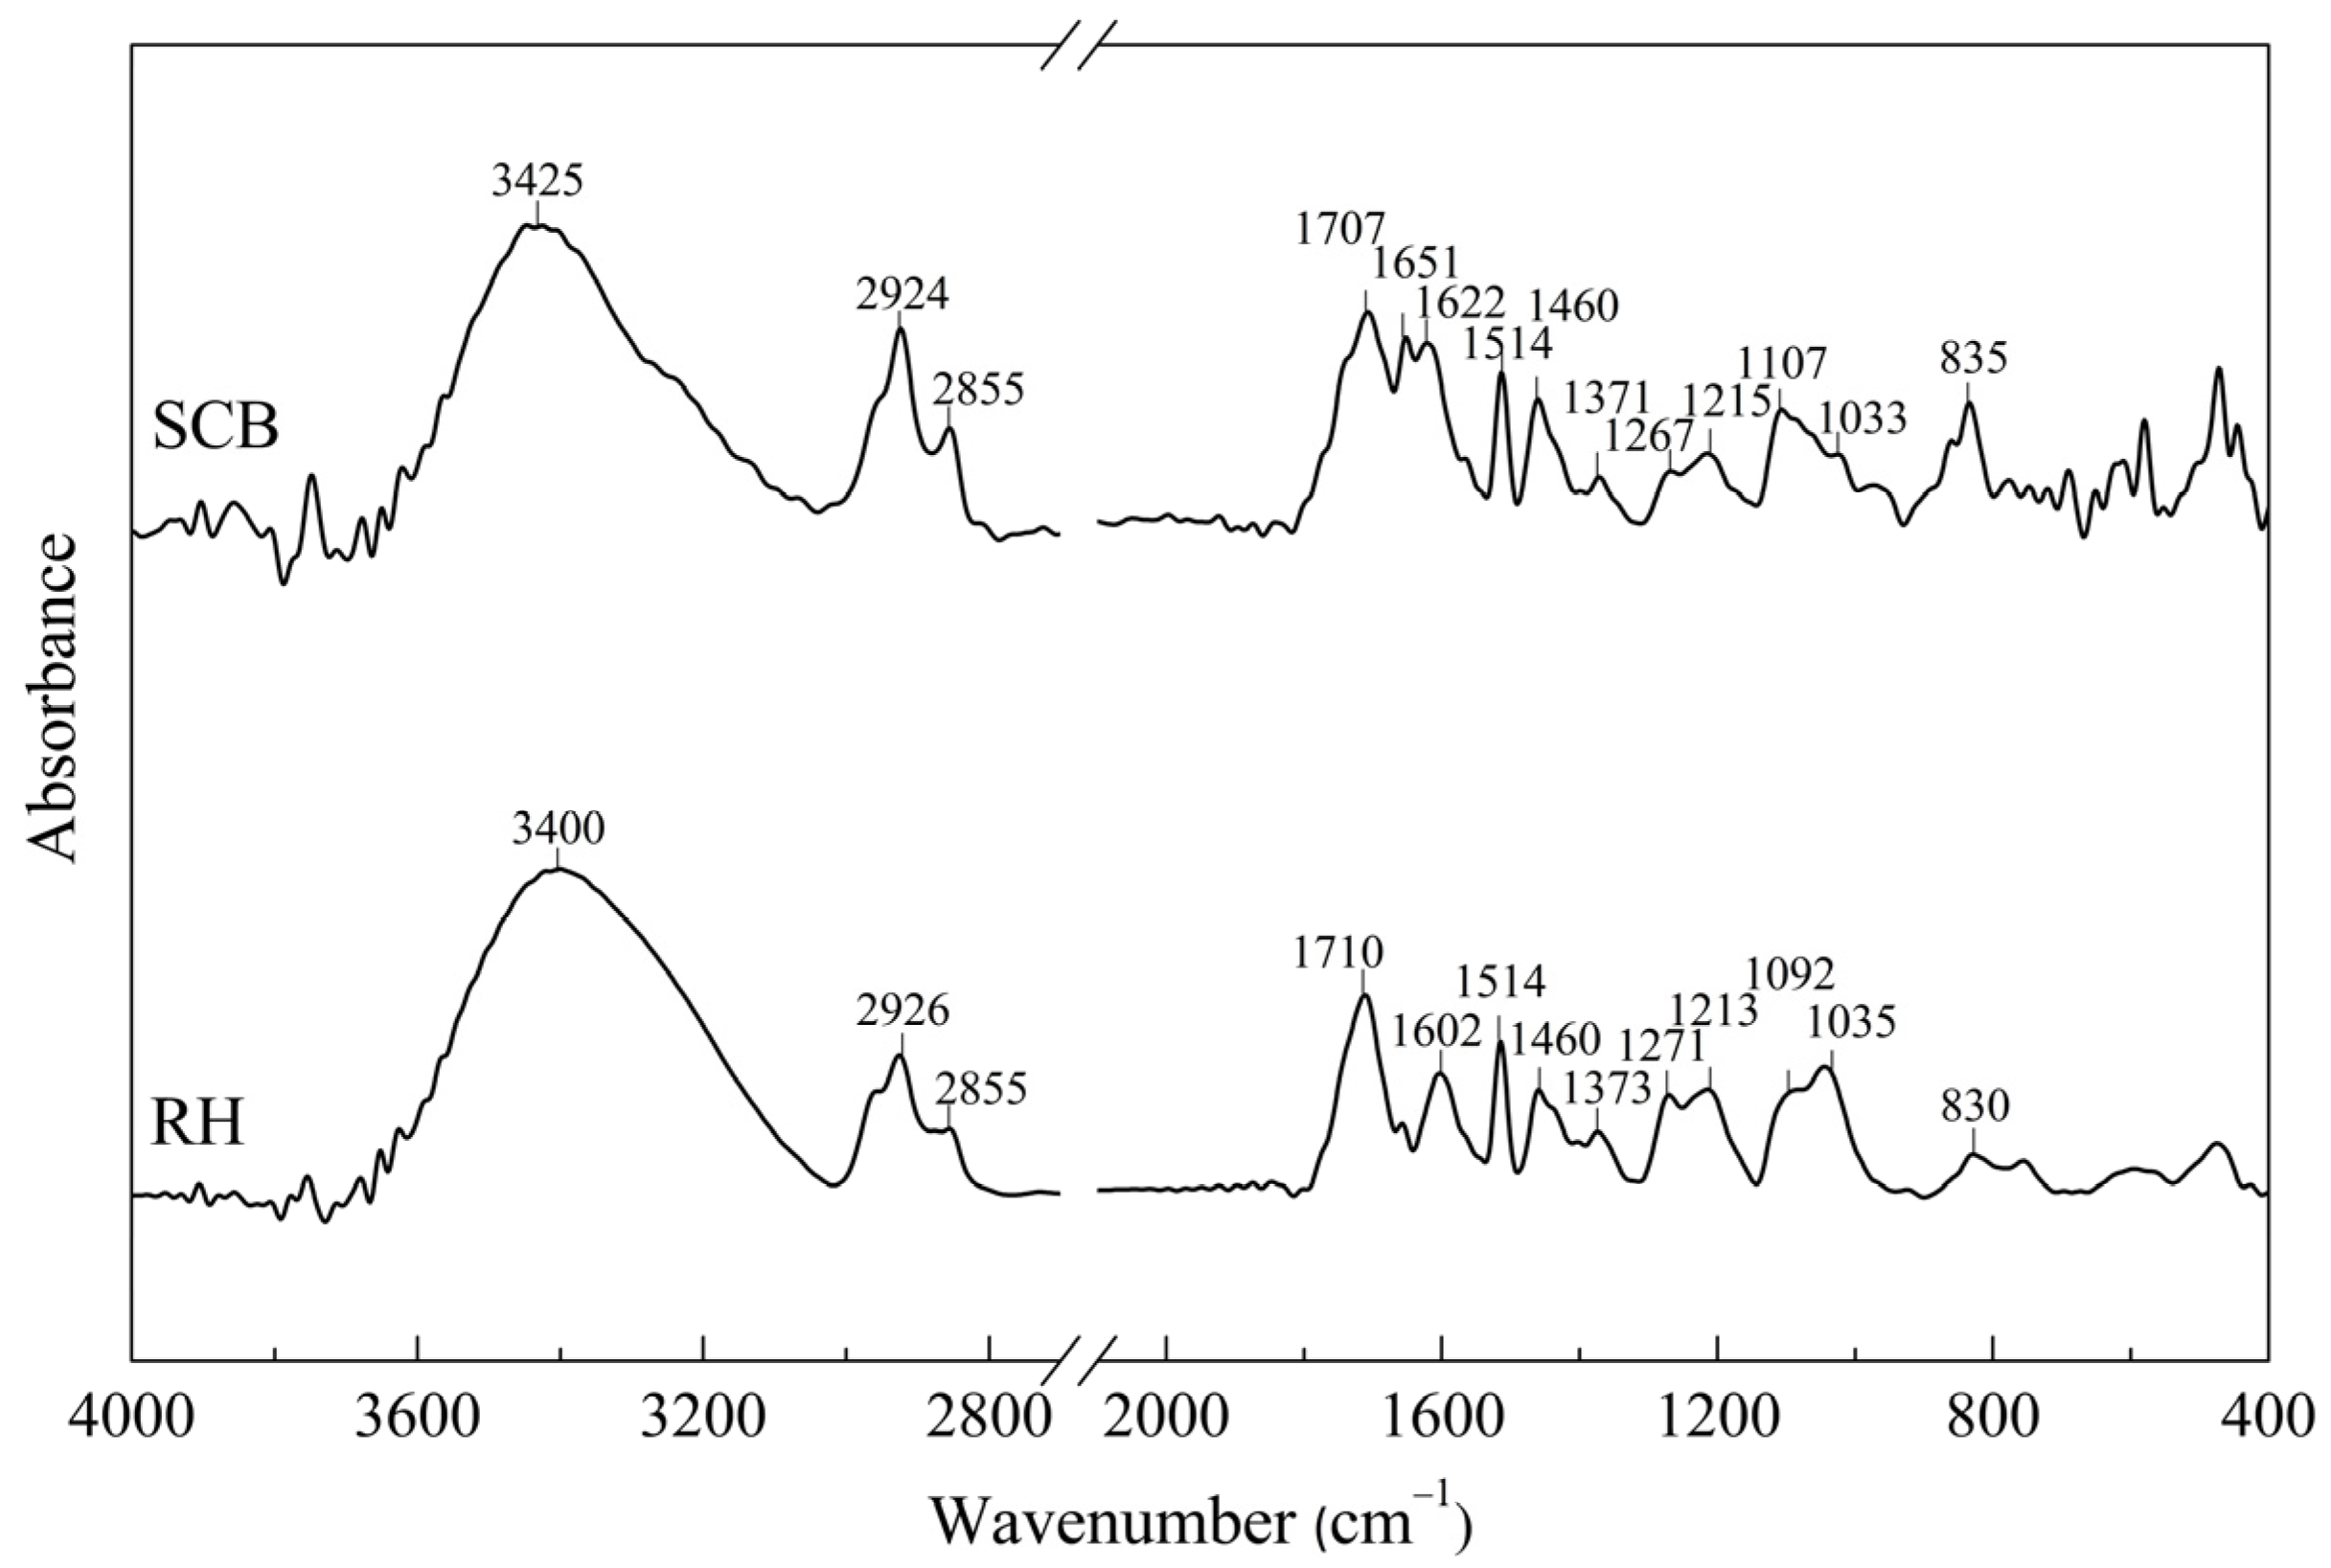
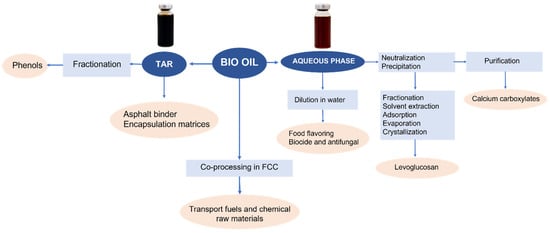
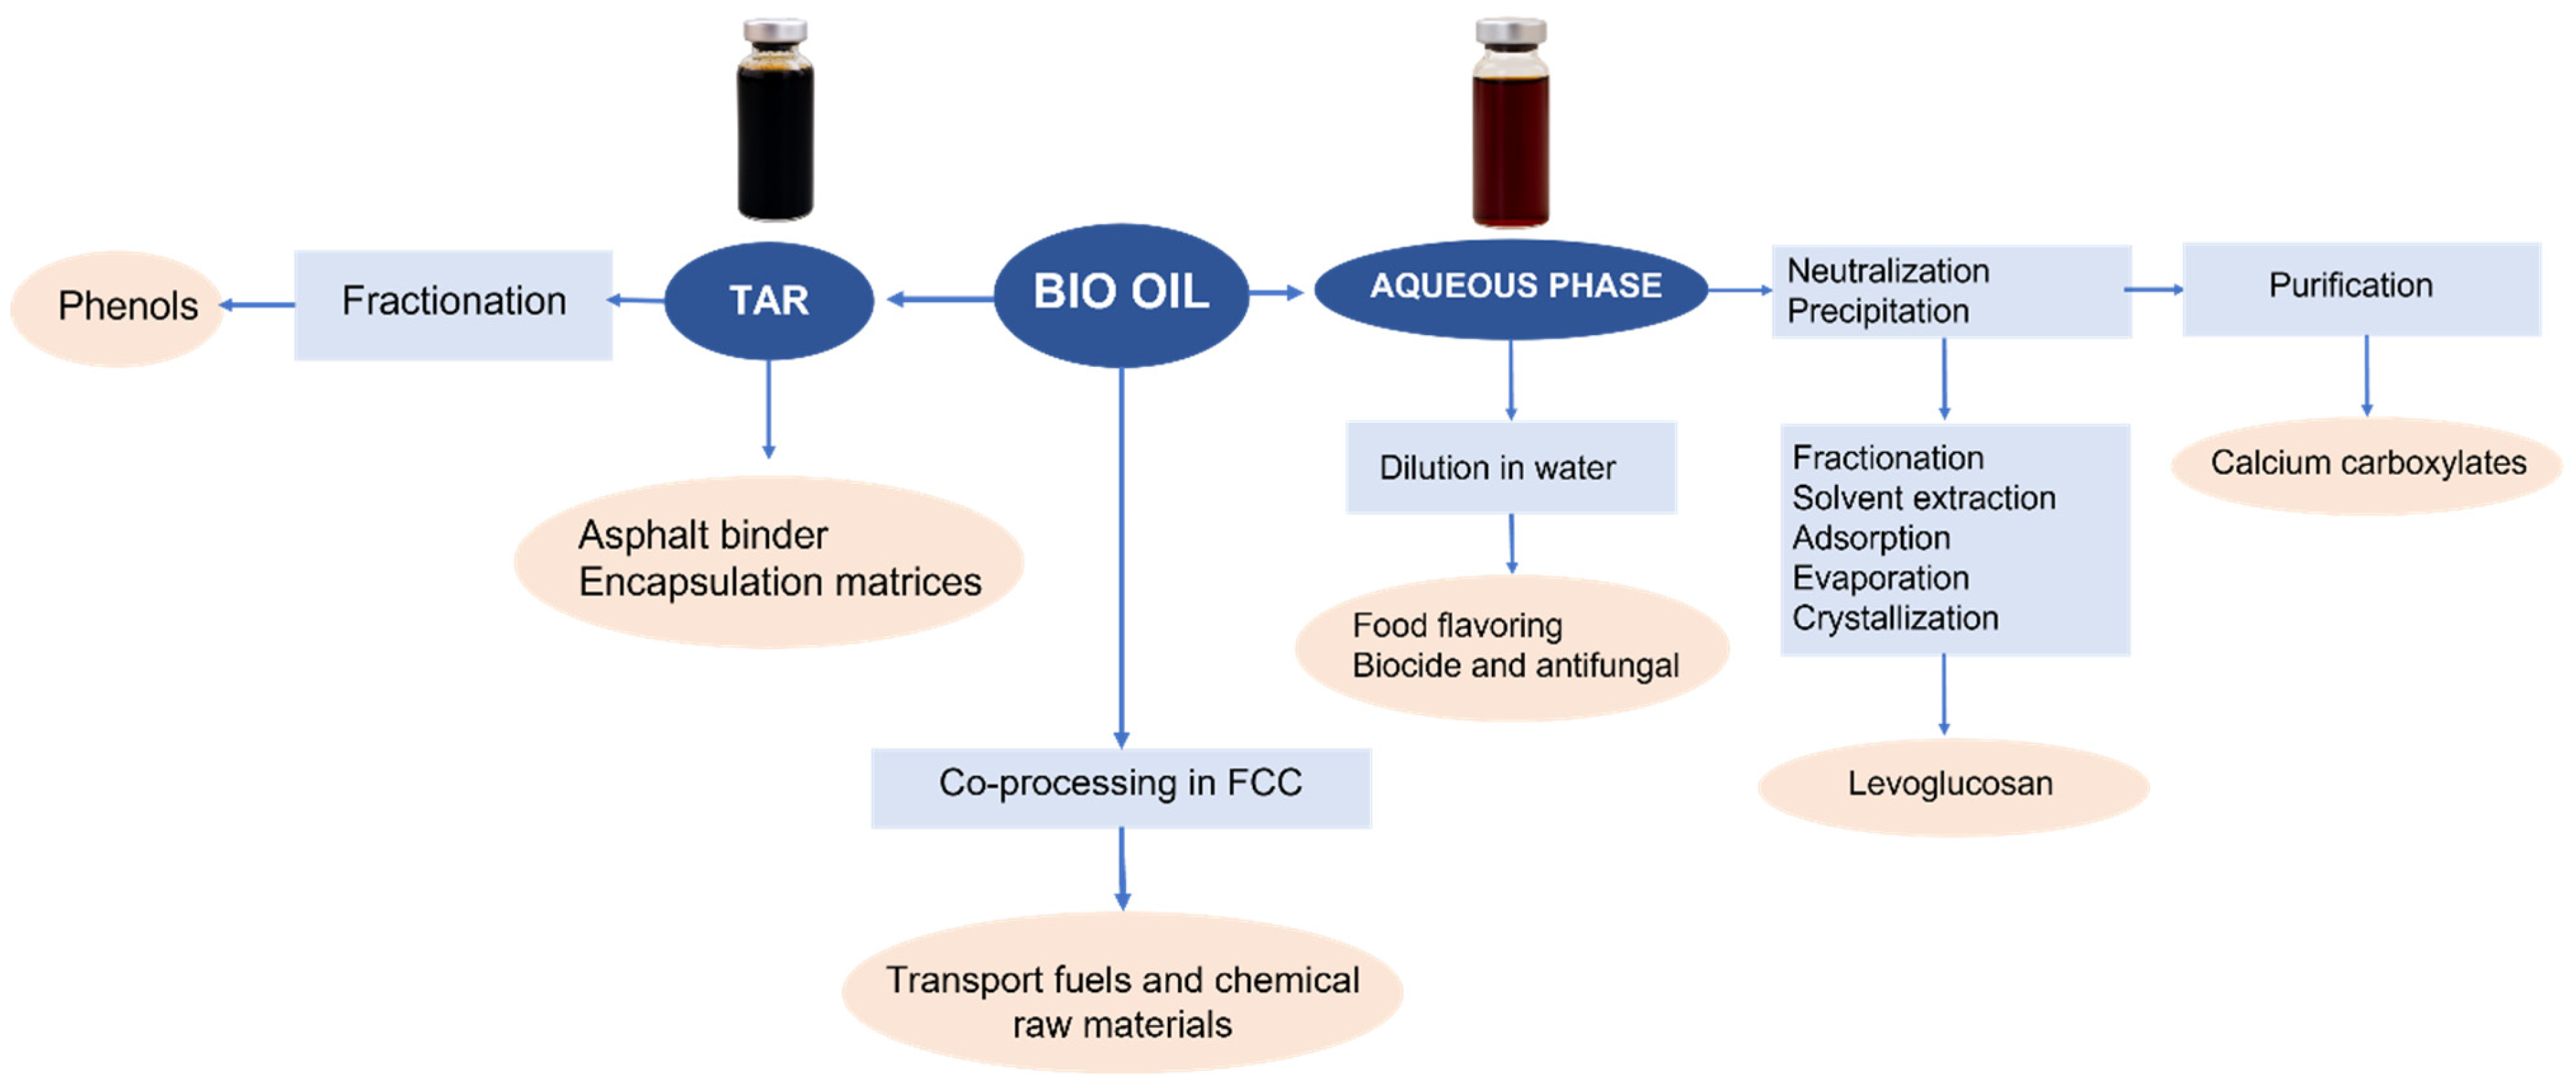
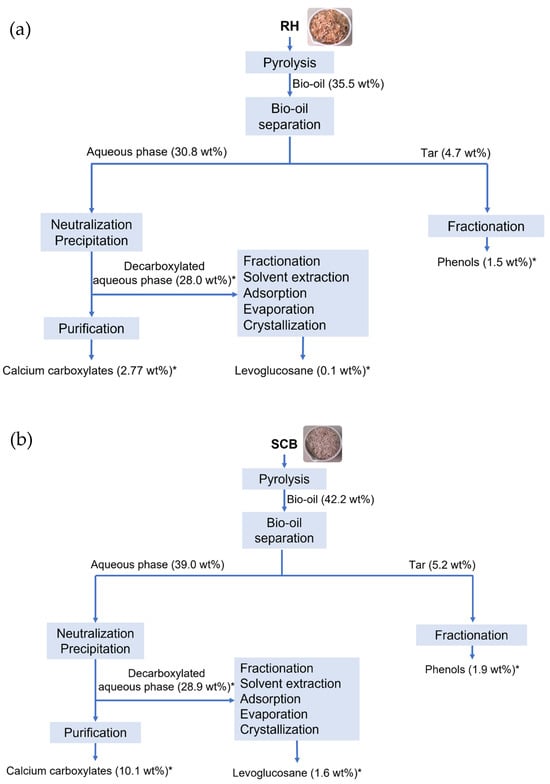
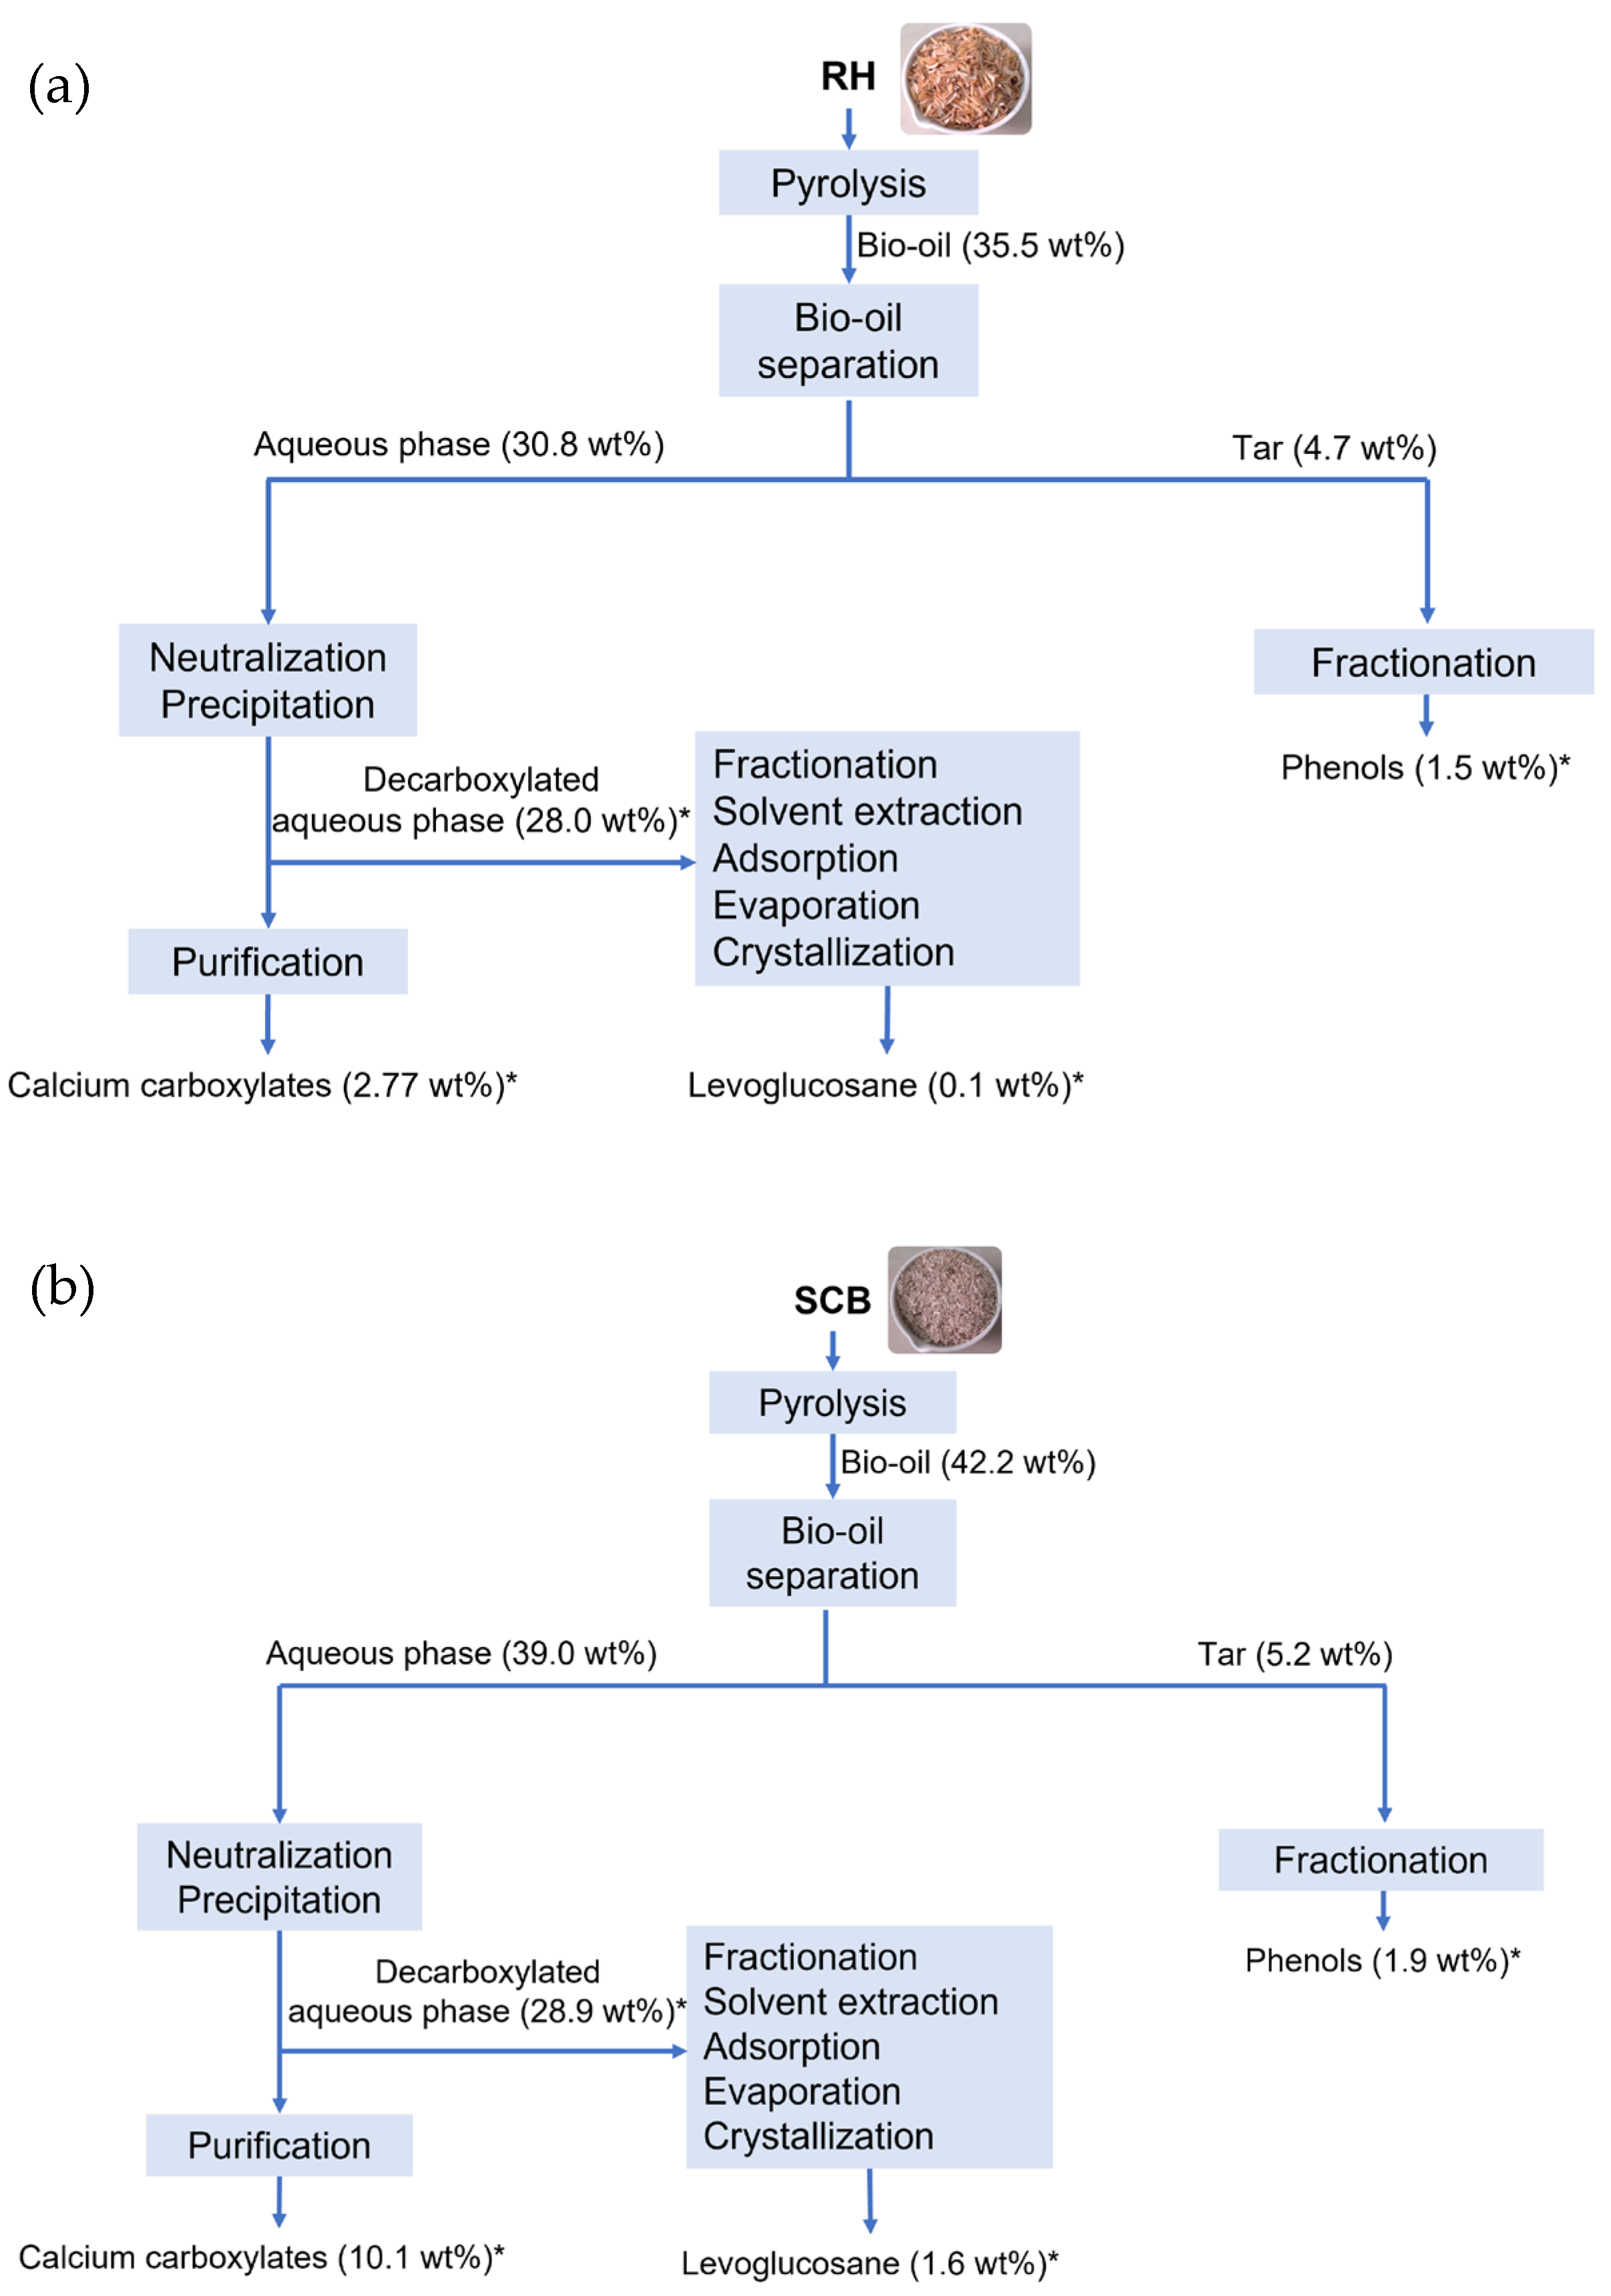

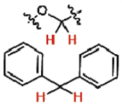
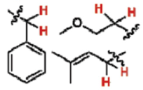
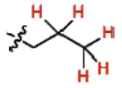
Disclaimer/Publisher’s Note: The statements, opinions and data contained in all publications are solely those of the individual author(s) and contributor(s) and not of MDPI and/or the editor(s). MDPI and/or the editor(s) disclaim responsibility for any injury to people or property resulting from any ideas, methods, instructions or products referred to in the content. |
© 2026 by the authors. Licensee MDPI, Basel, Switzerland. This article is an open access article distributed under the terms and conditions of the Creative Commons Attribution (CC BY) license.