1. Introduction
As the comprehensive spatial carrier where human activities and natural ecosystems are most tightly coupled, the evolutionary laws of the rural territorial system remain a core proposition of intense focus in global geography and human–earth system science. Driven by the rapid advancement of global industrialization and urbanization, rural production factors such as capital, land, and labor have continuously flowed into cities, making “Rural Decline” a severe and common challenge worldwide [
1,
2,
3]. To overcome the dilemma of unbalanced development between urban and rural areas, China formally introduced the “Rural Revitalization Strategy” in 2017, defining the five overarching requirements of “thriving businesses, pleasant living environments, good social civility, effective governance, and prosperity” [
4,
5]. Scholars have subsequently conducted extensive explorations on the indicator measurement and dynamic evolution of China’s rural revitalization [
6,
7]. Rural revitalization is essentially a complex geographic process involving the interactive coupling of multidimensional factors; clarifying its evolutionary patterns and underlying driving logic over a long historical cycle holds significant theoretical and practical importance for responding to the global sustainable development agenda and achieving regional balance [
8].
From an international perspective, western academia’s exploration of rural evolution spans a century of profound accumulation, with continuously broadening theoretical perspectives [
9]. In terms of temporal evolution, it presents a trajectory from single-function production to complex socio-ecological systems. Prior to the mid-20th century, research primarily focused on agricultural modernization and out-migration [
10]. Since the 1970s, the rise of “counter-urbanization” made the consumption and residential attributes of rural spaces prominent [
11,
12]. By the 1990s, “post-productivism” became mainstream, redefining the countryside as a multifunctional space integrating ecological conservation and agriculture [
13,
14,
15,
16]. Recently, in response to climate change and globalization, “rural restructuring” and “rural resilience” have emerged as core issues [
17,
18,
19,
20], alongside growing focuses on digital empowerment and endogenous dynamics [
21,
22,
23]. Methodologically, a comprehensive transition has occurred toward advanced 3S technologies, spatial econometrics, and multidimensional evaluations [
24,
25,
26,
27]. Recent classic empirical studies—such as those addressing European rural regeneration [
28], Scottish Highland resilience [
29], demographic impacts in Italy [
30], and remote European rural recovery [
31]—have effectively utilized these advanced models to quantify spatial heterogeneity and recovery potential, providing vital methodological references for global rural research.
Correspondingly, Chinese rural development research closely tracks the historical evolution of the state’s macro-strategies. From the late 1970s reforms to the 1990s, studies concentrated on rural labor transfer and agricultural productivity improvement [
32]; entering the 21st century, the “Socialist New Countryside” campaign shifted the focus toward infrastructure and public services equalization [
33]. During the “Targeted Poverty Alleviation” era (2013–2020), multidimensional poverty measurement and land consolidation became absolute hotspots [
34,
35]. After the “Rural Revitalization Strategy” was proposed in 2017, research rapidly moved toward systematization, initially measuring overall levels across the five overarching requirements [
36], and recently deconstructing the deep coupling of the human–earth system through ecological and digital empowerment [
37,
38,
39]. Methodologically, models such as the Coupling Coordination Degree and Geodetector have been widely applied to identify driving forces at micro-investigation scales [
40,
41].
A comprehensive comparison reveals significant commonalities in focusing on socio-ecological resilience and spatial restructuring. However, a fundamental distinction exists in their underlying mechanisms: while Western rural evolution is largely driven by bottom-up factors like market mechanisms and counter-urbanization, China’s rural development demonstrates strong characteristics of “policy drive” and “institutional embedding,” representing a grand, top-down spatial governance practice.
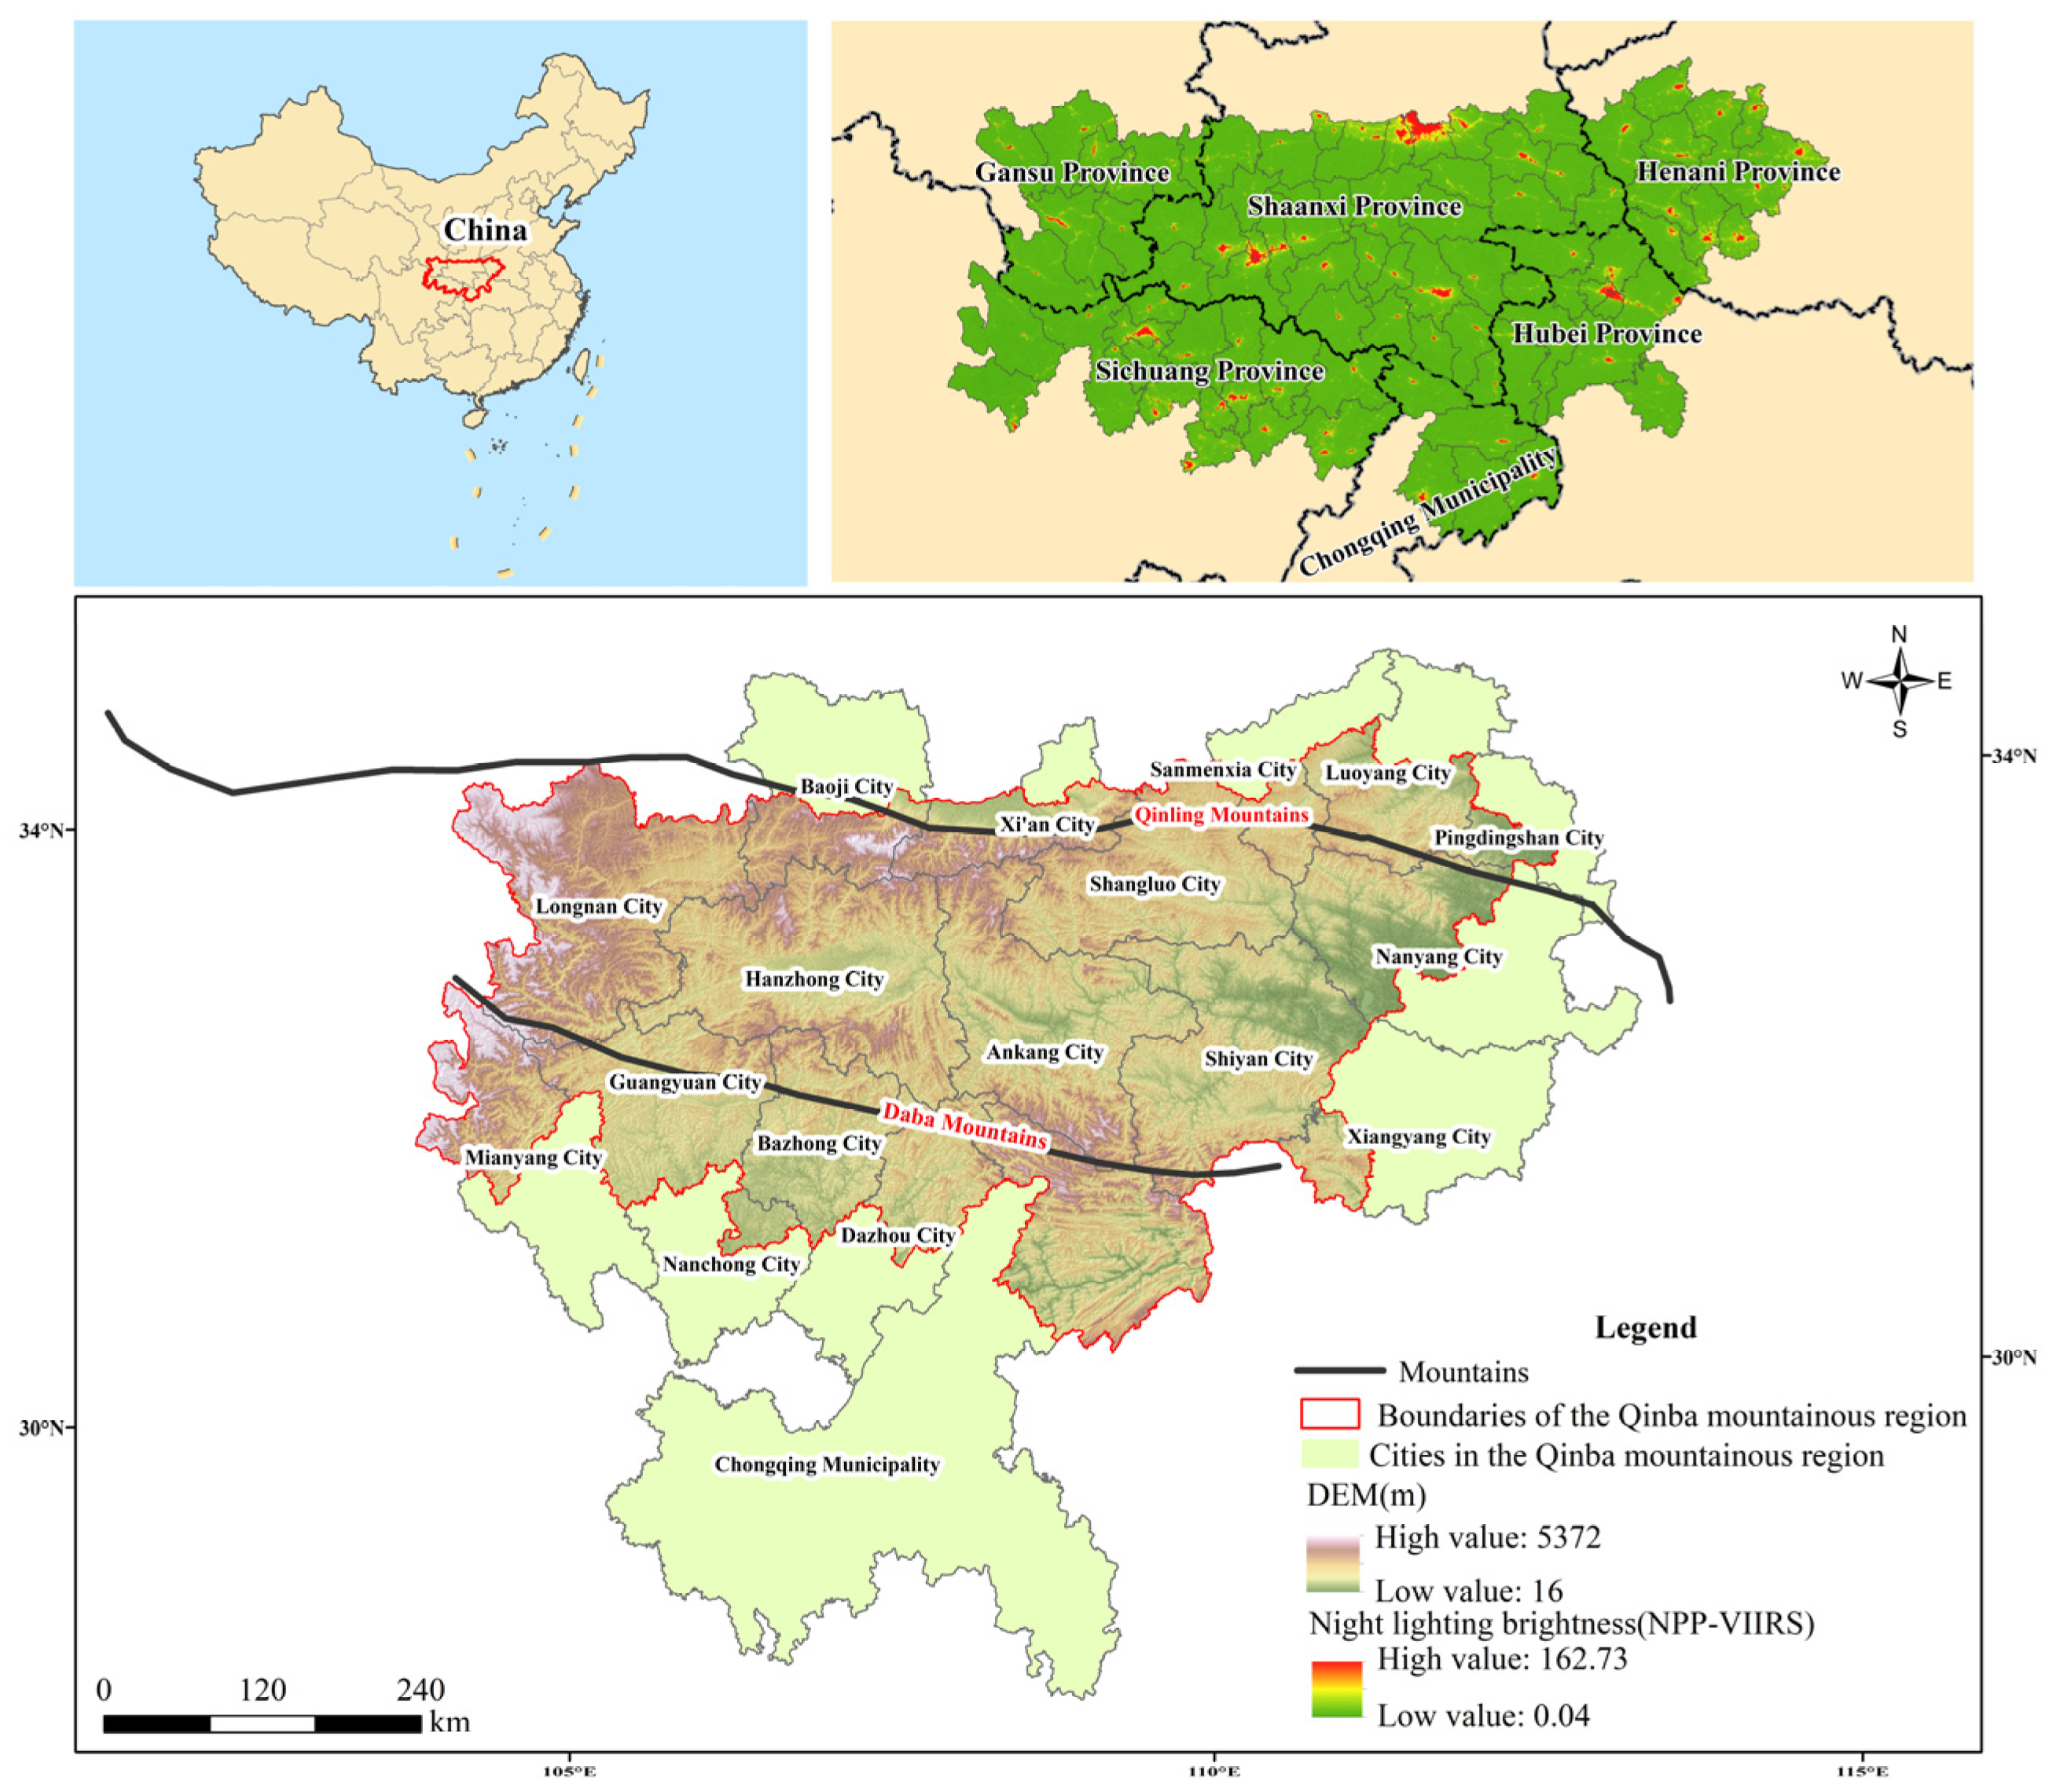
Focusing on the specific region of this study, the Qinba Mountains serve as both a central ecological barrier and one of China’s most complex former contiguous destitute areas. Recent academic explorations have provided a crucial foundation for understanding localized human–earth interactions, primarily focusing on the connection between “Targeted Poverty Alleviation” and rural revitalization [
42,
43], spatial differentiation and tourism transformation at micro-scales [
44,
45], and socio-ecological resilience under demographic and topographical constraints [
46,
47,
48,
49,
50]. However, constrained by enormous administrative barriers spanning six provinces, continuous whole-domain panel data is notoriously difficult to obtain. Consequently, existing research is mostly confined to localized discussions within single provinces (e.g., southern Shaanxi). Facing this large-scale geographical unit with extreme natural constraints, there remains a severe lack of research that treats the Qinba Mountains as a complete cross-provincial macro-system to comprehensively evaluate its multidimensional synergistic evolution during the transition from eliminating absolute poverty to achieving comprehensive revitalization.
Despite varying terminologies—such as “rural restructuring” and “post-productivism” in international discourse versus the “Rural Revitalization Strategy” in China—the fundamental academic pursuit remains universally consistent: to rebuild the resilience of rural spaces and achieve sustainable coordination within the human–earth system. It is crucial to note that China, as the world’s largest developing country with a population of over 1.4 billion, presents a unique and highly significant macro-scale empirical case. The smooth institutional transition from “Targeted Poverty Alleviation” (eliminating absolute poverty) to “Comprehensive Rural Revitalization” in topographically complex and ecologically fragile regions like the Qinba Mountains is not merely a domestic achievement. It serves as a vital template for global poverty reduction and offers profound practical implications for achieving the United Nations Sustainable Development Goals (SDGs). Therefore, placing this localized spatial governance practice within the broader spectrum of global rural restructuring theory provides a robust foundation for our analytical framework.
Reviewing the existing domestic and international literature, although fruitful results have been achieved in multi-scale measurement and single-dimension deepening, there remains room for further exploration regarding the deep evolutionary mechanisms of complex cross-provincial mountainous rural territorial systems in the following three aspects: First, there are limitations in long-term macro-synergistic research concerning complex cross-provincial geomorphological areas. Existing measurements mostly concentrate on large plain provinces or single administrative regions where data is easily accessible [
51]. For an ecologically constrained region crossing multiple provincial administrative boundaries and possessing high spatial heterogeneity like the Qinba Mountains, there is a lack of long-time-series, cross-regional comprehensive comparison and holistic tracking regarding how its macro-system achieves a steady-state transition across over a decade of policy succession (from poverty alleviation and development to rural revitalization). Second, the depiction of spatial dynamic evolutionary trajectories and neighborhood interactive effects is insufficiently profound. Existing spatial pattern analyses mostly rely on static cross-sectional data to describe regional high-low distributions, making it difficult to depict the “evolutionary leap” patterns of development states over a long time span. In fact, the development of mountainous cities is often difficult to sustain in isolation, and their evolutionary pathways are highly susceptible to the constraints of “positive driving” or “negative lock-in” from surrounding cities and counties. These dynamic “path dependence” and spatial “neighborhood constraint” phenomena urgently need to be quantified and revealed by introducing dynamic econometric models. Third, the staged evolution of driving mechanisms and the excavation of “adjustment” laws are inadequate. The evolution of the rural territorial system is highly synchronous with the national macro-policy cycle [
52], but existing attribution analyses mostly conduct static discussions on a single cross-section. With the evolution of regional development strategies, the interactions between natural foundations (such as complex terrain) and socio-economic factors (such as capital, transportation, and markets) are not invariable. The underlying driving logic and the adaptive evolutionary laws of the human–earth system urgently require systematic exploration.
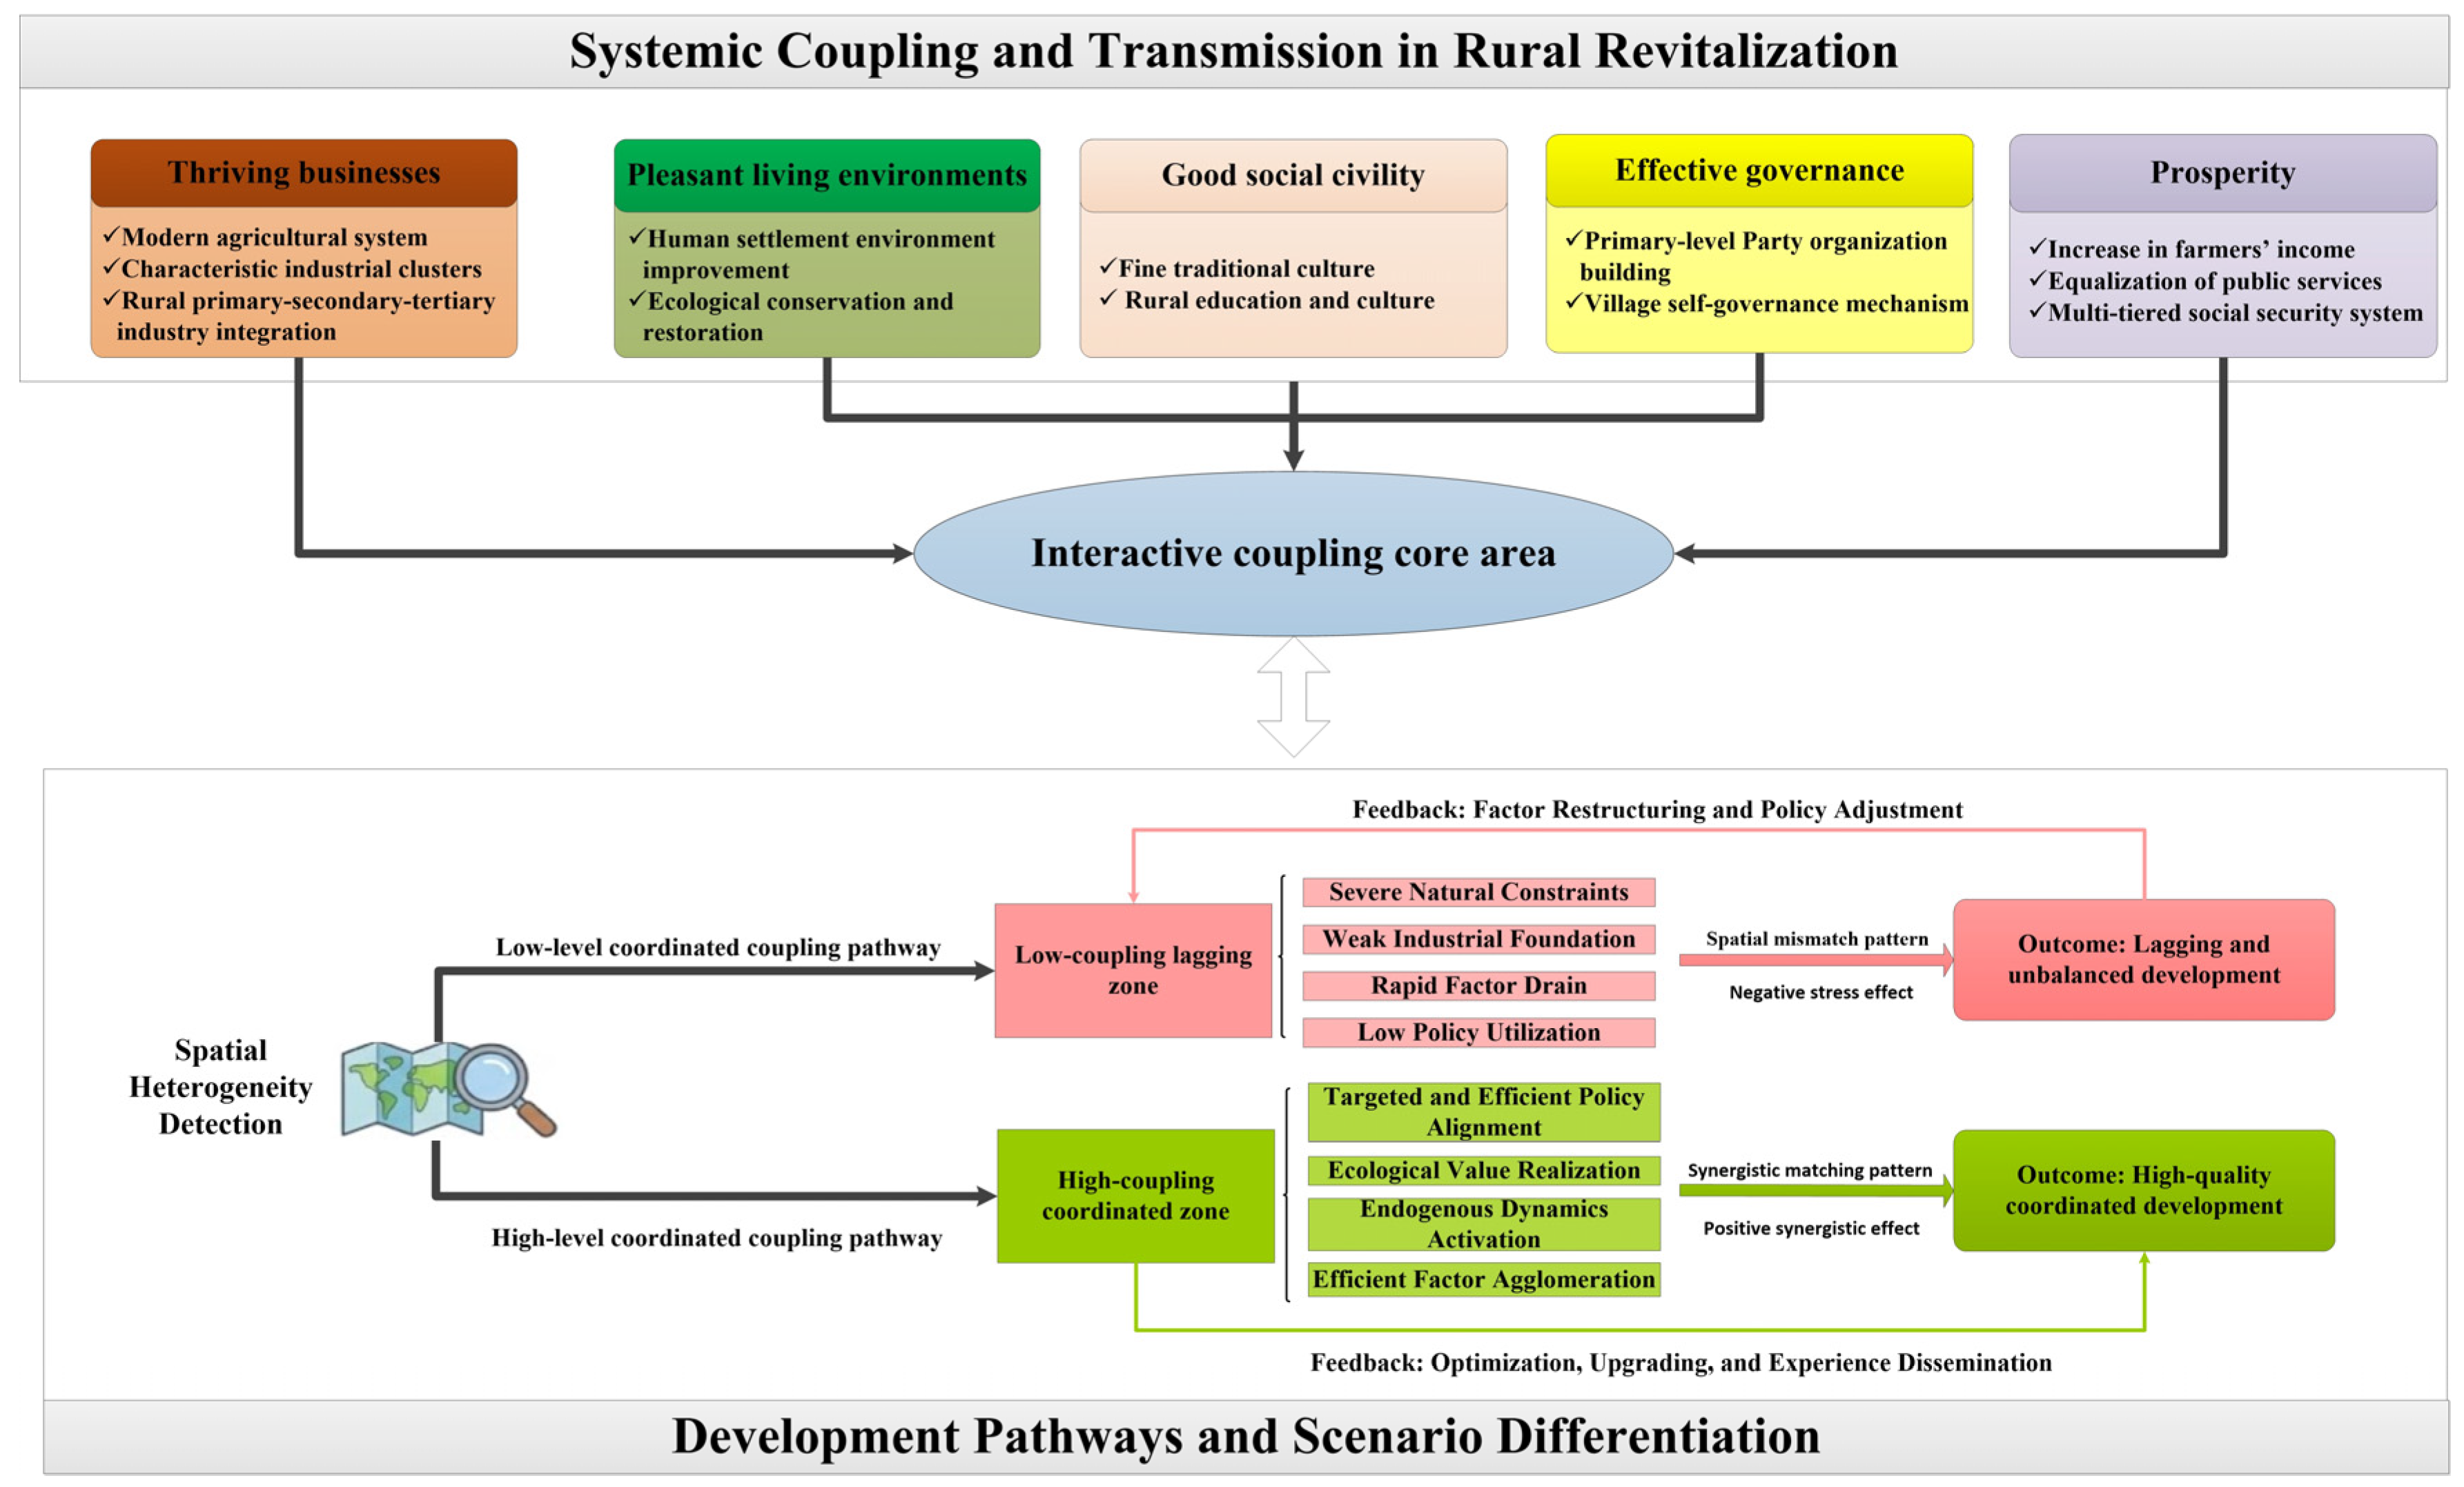
In view of this, to bridge the aforementioned research gaps, this study, guided by the rural territorial system theory, treats the Qinba Mountains as a complex cross-provincial macro-system, focusing on the critical evolutionary period from 2009 to 2023, which covers China’s historical leap from “poverty alleviation and development to comprehensive rural revitalization.” To break through the limitations of traditional static cross-sectional and single-dimension analyses, this study constructs a city-level analytical framework integrating “multidimensional comprehensive measurement—spatiotemporal dynamic tracking—attribution diagnosis.” It aims to systematically quantify the spatiotemporal heterogeneity in rural revitalization synergy across the Qinba Mountains, capturing the spatial state transition laws and neighborhood spillover effects over a long time span. On this basis, it dynamically analyzes the external dominant driving factors and non-linear interactive mechanisms under different policy cycles. This study expects to clearly elucidate the internal logic of “factor drive—pathway differentiation—mechanism response” in complex cross-provincial geomorphological areas, thereby providing scientific quantitative evidence and decision support for breaking the geographical lock-in of deep mountainous areas in western China, optimizing the cross-regional spatial collaborative governance system, and comprehensively promoting high-quality rural revitalization. Ultimately, this research explicitly fills the critical gap in evaluating the multidimensional synergistic evolution and driving mechanism shifts in complex cross-provincial mountainous systems during the historical transition from poverty alleviation to comprehensive rural revitalization. To achieve these objectives, this study first constructs an analytical framework that positions China’s rural revitalization within global rural restructuring (
Section 1). Following the delineation of the multidimensional evaluation system and spatial econometric models (
Section 2), we systematically present the spatiotemporal dynamic evolution and Geodetector-based driving mechanisms of the Qinba Mountains (
Section 3). The theoretical contributions and practical policy implications are further discussed (
Section 4), culminating in concluding remarks and future prospects (
Section 5).
3. Results
3.1. Analysis of the Temporal Evolutionary Characteristics of Rural Revitalization Subsystems in the Qinba Mountains
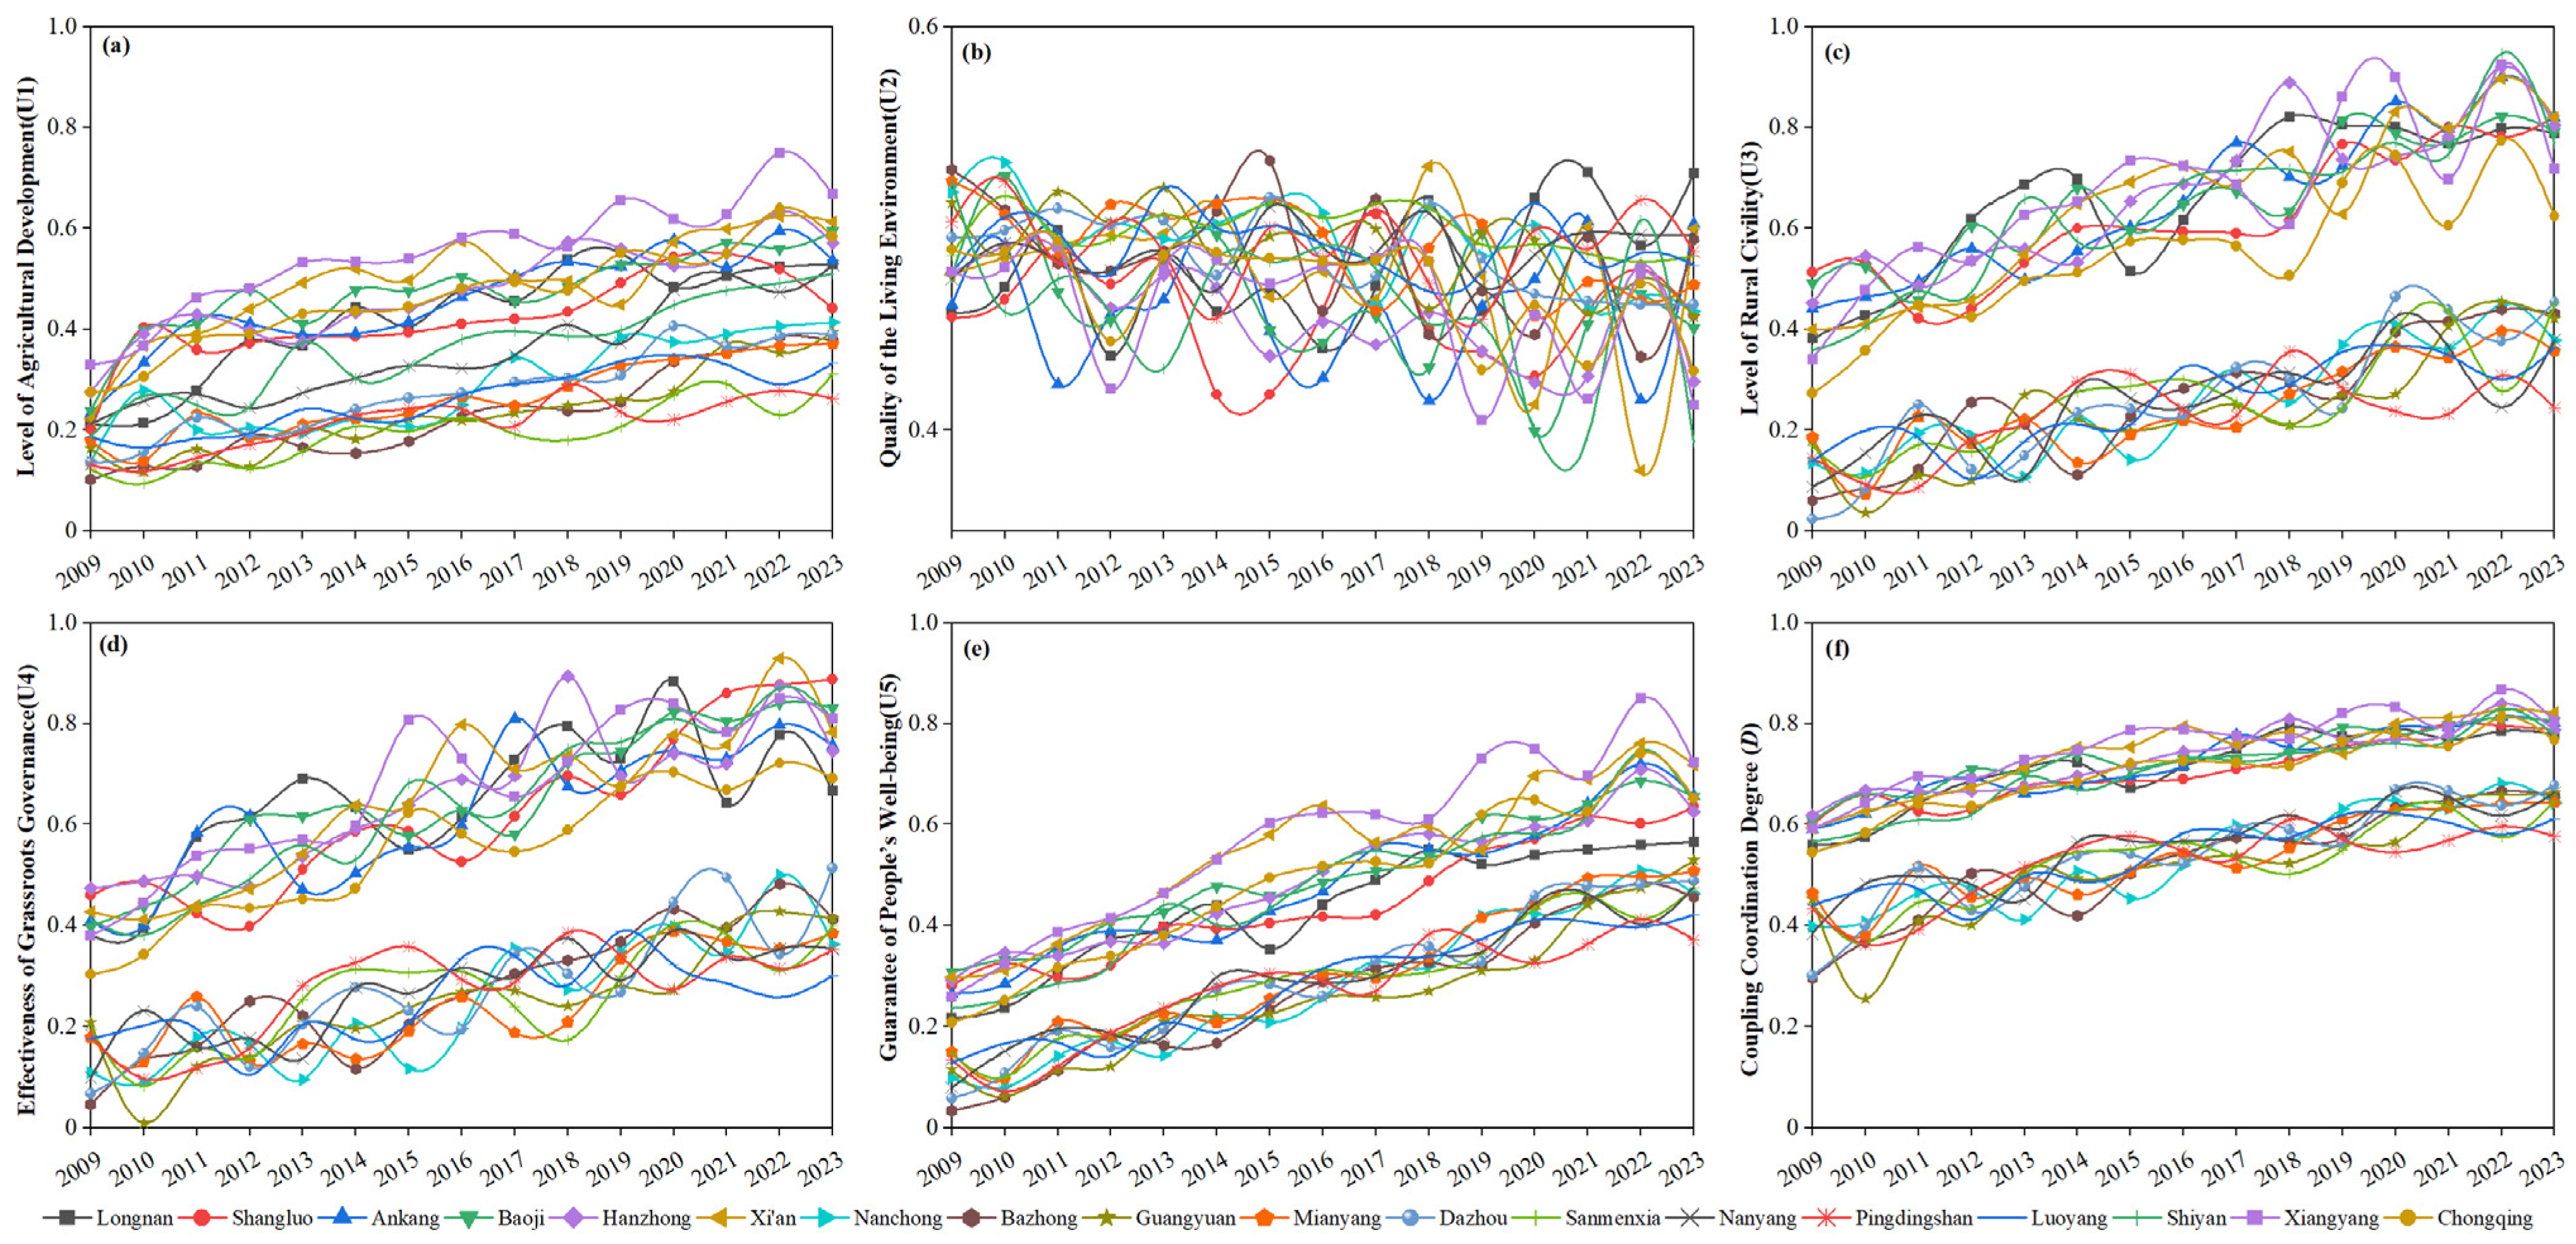
To examine the temporal evolution of rural revitalization in the Qinba Mountains, this study calculated the subsystem evaluation indices (U1–U5) and the overall Coupling Coordination Degree (
D) for the 14 prefecture-level cities from 2009 to 2023.
Figure 3 presents the corresponding temporal trajectories of the five subsystems and the overall Coupling Coordination Degree.
To examine the influence of the weighting scheme on the evaluation results, this study further calculated the values of the five rural revitalization subsystems under three alternative weighting methods, namely AHP weighting, entropy weighting, and combined weighting, and compared their numerical consistency and ranking consistency. The results show that the overall ranking and temporal variation in the subsystem evaluation outcomes differ only slightly across the three weighting methods. Taking the combined weighting results as the benchmark, the Pearson correlation coefficient between the combined weighting results and the AHP-based results is 0.886, while that between the combined weighting results and the entropy-weighted results is 0.852; the corresponding Spearman rank correlation coefficients are 0.871 and 0.843, respectively. This indicates that the main findings of this study are not dependent on any single weighting method and that the evaluation results are robust. The detailed weighting results are presented in
Table 1; due to space limitations, only the final combined weights are reported in the table.
The Level of Industrial Development (U1) showed an overall stable upward trend and exhibited a certain degree of growth-rate differentiation around 2016 (
Figure 3a). The index rose steadily from a generally low level (0.1–0.3) in the early stage, which is consistent with the gradual transition from traditional scattered agriculture to more characteristic and efficient agricultural development in the Qinba Mountains. The relatively gentle upward trajectory also suggests a gradual improvement in the industrial development dimension in mountainous areas. Spatially, cities located in basins and river-valley plains, such as Nanyang, Xiangyang, and Hanzhong, benefited from relatively better resource endowments and agricultural foundations and remained in the leading tier throughout most of the study period, whereas cities in the deep mountainous hinterlands, such as Longnan and Bazhong, showed relatively slower growth under more fragmented terrain conditions.
Unlike the relatively stable upward trajectories observed in most other subsystems, the Quality of Human Settlements (U2) displayed clear oscillatory fluctuations throughout the study period and did not form a stable unidirectional upward path (
Figure 3b). Most city-level trajectories remained concentrated within a relatively narrow range, but year-to-year fluctuations were frequent, indicating a comparatively unstable evolutionary pattern. In particular, a noticeable dip appeared in many cities around 2021, followed by partial recovery in some cases during 2022–2023. Compared with U3, U4, and U5, the spatial differentiation of U2 was less characterized by persistent hierarchical stratification and more by dynamic fluctuation and repeated crossovers among cities. Overall, the temporal and spatial pattern of U2 suggests that the improvement of human settlements in the Qinba Mountains was more volatile and less cumulative than that of the other subsystems during the study period.
Civic Virtues and Cultural Vibrancy (U3) and Rural Governance (U4) exhibited a high degree of similarity in their evolutionary trajectories: both showed a marked rise in overall scores while maintaining persistent spatial stratification (
Figure 3c,d). These two subsystems gradually differentiated into upper and lower tiers during the study period, and the gap between the high-value and low-value ranges did not show clear convergence over time. For U3, the upward trajectory is broadly consistent with improvements in broadband access and cultural service provision; for U4, it is associated with progress in the institutional governance indicators included in this study. Cities with stronger economic and infrastructural foundations, such as Shiyan and Luoyang, reached the higher-value range earlier, whereas cities in the lower group showed a more visible lag in the extension of digital infrastructure and governance-related improvement. As a result, the spatial stratification of U3 and U4 persisted despite the general upward trend.
Livelihood and Well-being Security (U5) was the subsystem with the smoothest growth trajectory and the clearest near-linear upward trend among all dimensions (
Figure 3e). The steady rise in U5 is consistent with the continued improvement in residents’ disposable income and related livelihood indicators over the study period. Its temporal trajectory also broadly resembles that of the Coupling Coordination Degree (
D), suggesting a relatively close relationship between livelihood improvement and the overall coordinated evolution of the system.
Overall, the regional Coupling Coordination Degree (
D) showed a stable improving trend, moving from the “verge of imbalance” in the initial stage to “intermediate coordination” by the end of the study period (
Figure 3f). At the same time, a clear core–periphery spatial structure remained. Cities such as Luoyang and Nanyang maintained relatively balanced development across the five subsystems and remained in the leading group, whereas cities such as Shangluo and Longnan, under stronger natural geographical constraints, showed relatively greater difficulty in achieving further improvement in systemic coupling coordination.
3.2. Spatiotemporal Dynamic Characteristics and Trend Analysis of the D Index in the Qinba Mountains
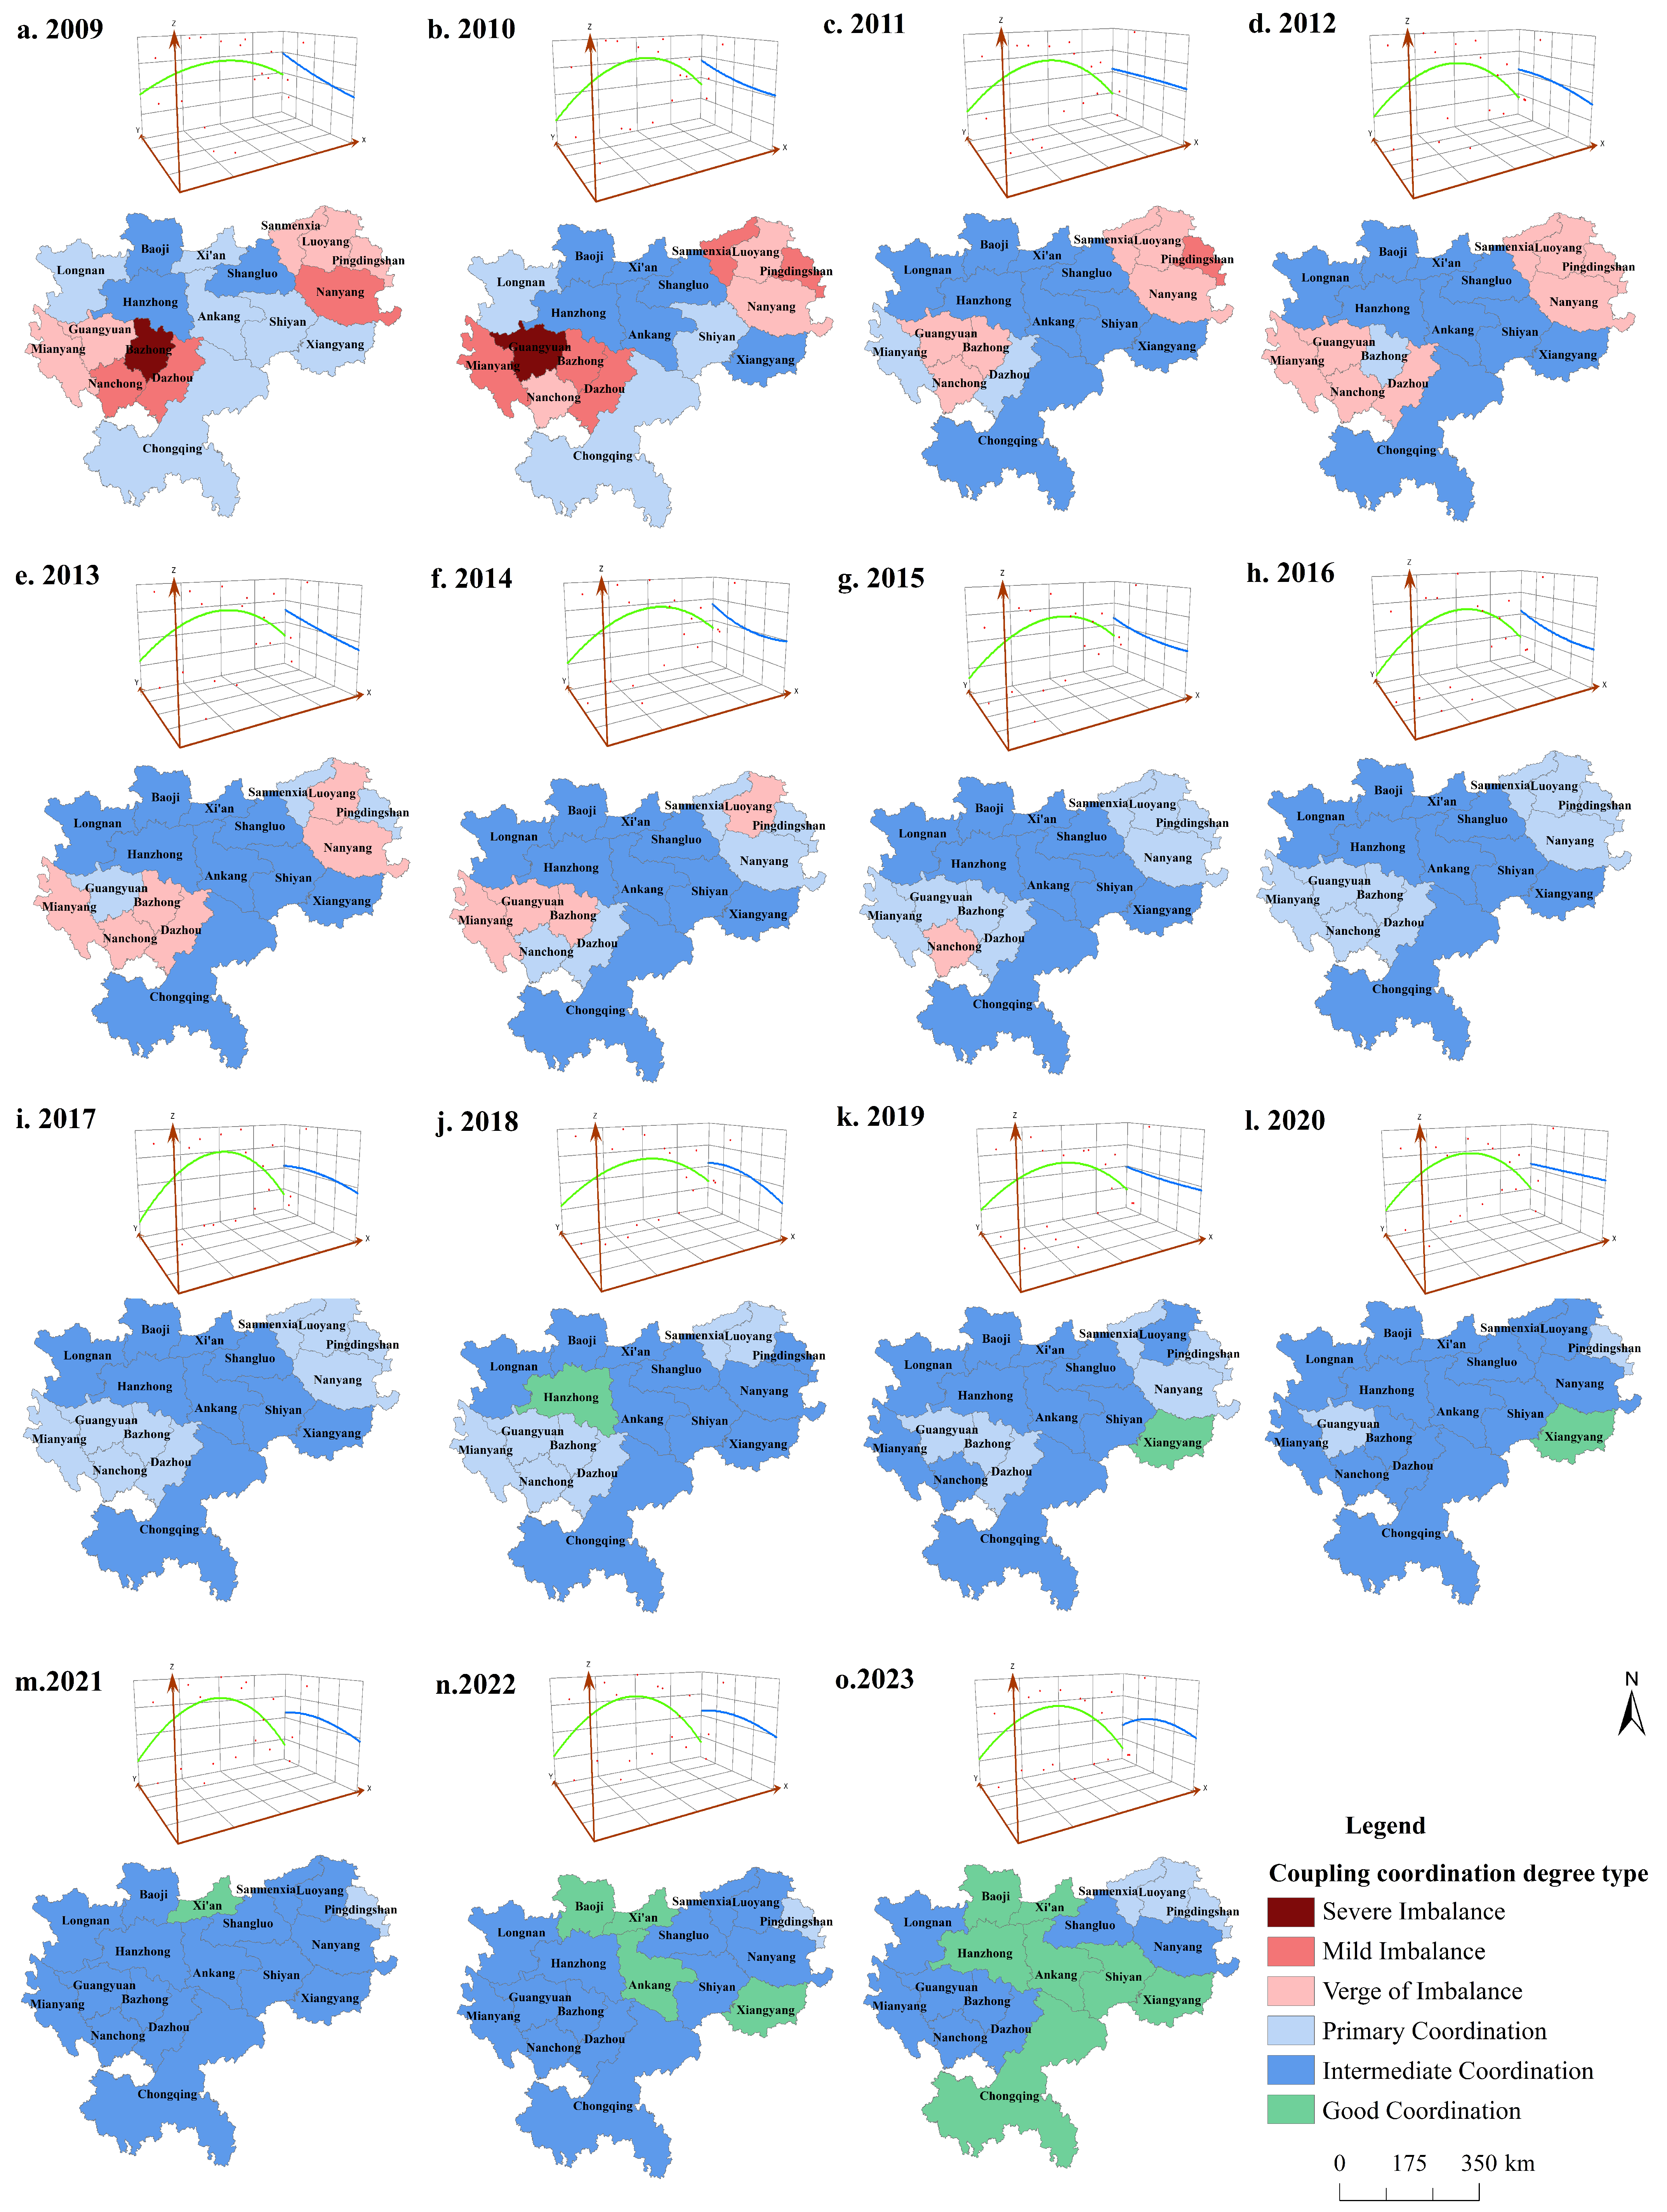
To capture the macro-scale developmental trajectories from 2009 to 2023, spatial trend surface analysis was applied to the
D values along the longitudinal (
X-axis) and latitudinal (
Y-axis) gradients, yielding the corresponding 3D evolutionary maps for the Qinba Mountains (
Figure 4).
Based on the spatiotemporal classification of the D index over the 15-year period, it can be seen that the synergistic level of the rural revitalization system showed an overall step-like leap accompanied by significant spatial pattern reshaping. In the temporal dimension, from 2009 to 2013, the region was in a low-level run-in period of “imbalance to barely coordination.” During this stage, constrained by the deep degree of early poverty and infrastructure deficits in the Qinba Mountains, most patches presented blue or even red (imbalance) representing low values. In particular, deep mountainous areas in the west, such as Longnan, Guangyuan, and Bazhong, due to fragmented terrain leading to difficulties in industrial introduction and high governance costs, were long trapped in the dilemma of being on the “Verge of Imbalance.” Meanwhile, eastern cities like Luoyang, Nanyang, and Xiangyang, relying on the superior natural background of basins and plains, took the lead in forming small-scale coordination highlands, presenting a typical “east superior, west inferior” spatial characteristic. The period from 2014 to 2018 entered a rapid climbing phase. With the full rollout of the targeted poverty alleviation strategy implemented by the Chinese government, especially the release of policy dividends for the Qinba Mountains as a contiguous destitute area, the red imbalance patches rapidly faded, and the entire region generally leaped to the “Primary Coordination “ stage. Central cities such as Hanzhong, Ankang, and Shiyan, benefiting from the rise in eco-tourism and characteristic agriculture, saw a significant lift in their D index (e.g., Hanzhong rose from 0.56 to 0.68), gradually filling the “collapse zone” in the central region and prompting the provincial spatial pattern to evolve from “eastern single-pole leading” to “central-eastern contiguous rise.” The period from 2019 to 2023 entered a stage of steady improvement and high-level differentiation. After the conclusion of the targeted poverty alleviation campaign in 2020 and its seamless connection with the rural revitalization strategy, the shortcomings in infrastructure and public services within the region were basically remedied, and the vast majority of cities entered the “Intermediate Coordination” or even “Good Coordination” range (green patches). Head cities like Luoyang and Nanyang saw their D values break through 0.8, firmly occupying the first tier; while the western city of Longnan, despite some improvement, still had its D value hovering around 0.65 in 2023, significantly lower than the eastern plain cities. This indicates that after the elimination of absolute poverty, the marginal constraint effects of natural geographical conditions (such as terrain slope and distance from market centers) on the high-level synergy of rural revitalization began to prominently emerge, restricting the deep mountainous areas in the west from leaping to higher grades.
The trend surface projection results provide precise directional corroboration for the aforementioned spatial pattern evolution. The east–west direction (XZ plane, green line) maintained a significant “high in the east, low in the west” tilt from 2009 to 2023. In the early stage (2009–2012), the slope of the green line was relatively large, reflecting the huge development gap between the eastern plains and the western mountainous areas; as time progressed, although the overall curve moved upward along the Z-axis (indicating an improvement in the overall level), the “high in the east, low in the west” pattern did not fundamentally reverse, and even in the later stage (2020–2023), it presented a more obvious upward warping characteristic at the eastern end. This profoundly reveals the “Matthew Effect” (i.e., the phenomenon where “the strong get stronger, and the weak get weaker”) in rural revitalization: resource factors tend to agglomerate towards the eastern city clusters (Luoyang and Xiangyang metropolitan areas) with better locational conditions, resulting in the east–west spatial non-equilibrium generating an extremely strong lock-in effect. The north–south direction (YZ plane, blue line) experienced an evolution from an “inverted U-shape” to a “micro-wave shape.” In the early period (2009–2012), the blue line presented an obvious inverted U-shaped structure, that is, the central part (Hanzhong, Ankang, Shiyan) uplifted while the northern and southern sides were relatively low, which was closely related to the high-intensity resource investment the Qinba hinterland received as a key poverty alleviation area at that time; after 2015, the blue line gradually became gentler and tilted slightly to the north, reflecting the accelerated efforts of northern cities (such as Baoji, Luoyang, and southern Xi’an) in rural governance and industrial transformation, which gradually narrowed the north–south gradient difference and made regional spatial development more balanced.
Overall, the spatial grade leaps—characterized by a persistent “high-east, low-west” tilt and a north–south transition from a “central uplift” to “equalization”—demonstrate that the D values across the Qinba Mountains have undergone a qualitative shift from “widespread low-level imbalance” to “medium-high-level coordination”. Nevertheless, constrained by macro-geomorphology, the core–periphery divide of “basin highlands vs. mountainous depressions” retains strong spatial inertia. Future cross-regional governance must urgently cultivate the endogenous dynamics of the western deep mountains to dismantle this geographical lock-in.
3.3. Dynamic Evolutionary Trajectories and Spatial Transition Characteristics of the D Index in the Qinba Mountains
3.3.1. Analysis of Grade Evolutionary Trajectories Based on Sankey Diagram
To deeply reveal the type transition pathways, lock-in effects, and the influence mechanisms of the neighborhood background on the evolution of the
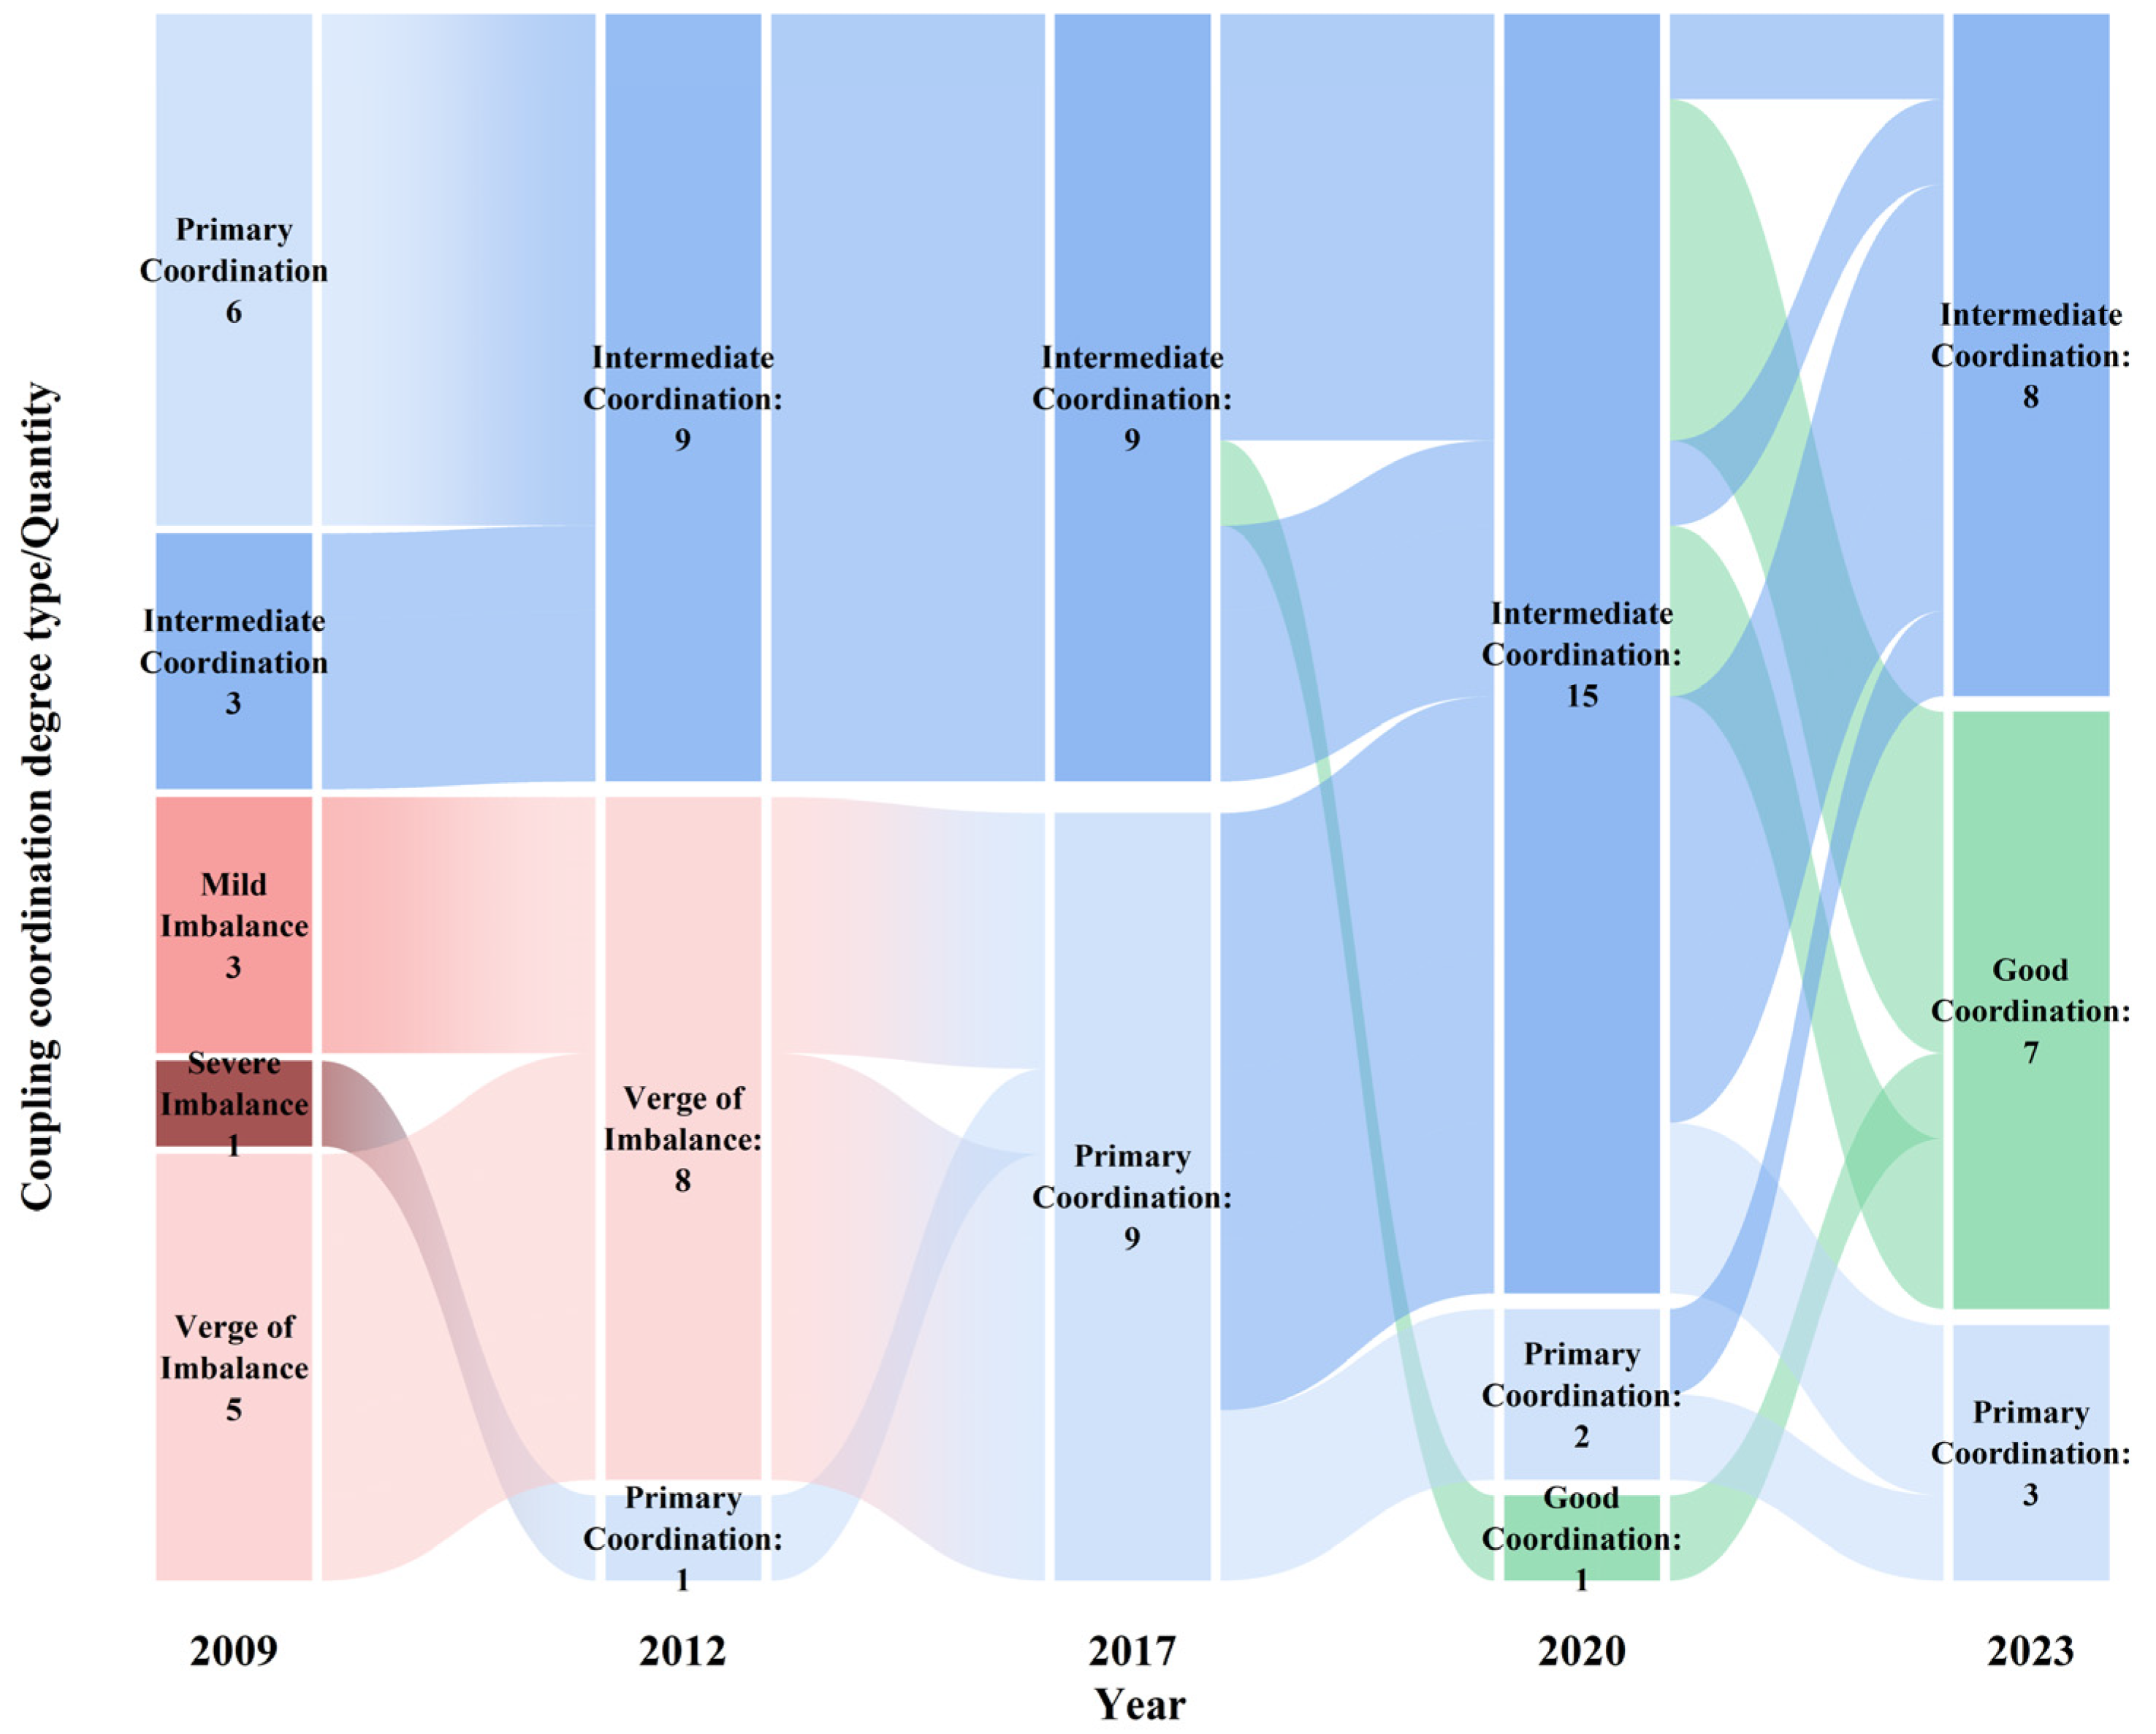
D index in the Qinba Mountains, this study selects 2009 (base period), 2012 (the incubation period of China’s targeted poverty alleviation ideology), 2017 (the proposal period of China’s Rural Revitalization Strategy), 2020 (the concluding period of eliminating absolute poverty), and 2023 (the post-pandemic resilience testing period) as key time nodes. These five nodes not only correspond to the historic transition cycles of the Chinese government’s policy focus on “agriculture, rural areas, and farmers” (hereafter referred to as “San Nong”), but also completely map the institutional change process of the Qinba Mountains leaping from a “contiguous destitute area” to “comprehensive rural revitalization” in chronological order. Based on this, this section employs a Sankey diagram to visualize its evolutionary trajectories and utilizes traditional and Spatial Markov Chain models to quantify its state transition probabilities and spatial spillover effects (
Figure 5).
Figure 5 illustrates the flow paths of the Coupling Coordination Degree grades of various cities in the Qinba Mountains during the study period. Overall, the evolutionary trajectories exhibit significant “Policy-responsive Transition” characteristics, and the transition activities at different stages profoundly reflect the spatial restructuring process under “State Macro-policy Intervention.”
The first stage (2009–2012): The “Low-level Lock-in” period under background constraints. During this period, the grade flow lines mainly fluctuated horizontally between the “Imbalance” and “Verge of Imbalance” ranges, without forming a distinct upward sudden change. This indicates that before The 18th National Congress of the CPC explicitly proposed the goal of “building a moderately prosperous society in all respects” in 2012, the Qinba Mountains, constrained by the dual rigid restrictions of complex terrain barriers and industrial hollowing out, lacked internal self-sustaining capacity, presenting a significant “Poverty Trap Effect.” Cities in the deep western mountainous areas (such as Longnan and Guangyuan) were stranded in the low-level range for a long time, lacking external driving forces to break the endogenous steady state.
The second stage (2012–2017): The “Leapfrog Mutation” period driven by targeted poverty alleviation. The most intensive upward “transition flows” appear in the figure, with a large number of patches directly leaping from the “Verge of Imbalance” to “Primary Coordination.” This drastic change is highly correlated with the high-intensity resource injection of the “Targeted Poverty Alleviation” (TPA) strategy implemented by The Central Government of China. As the main battlefield of the critical battle against poverty, through relocation for poverty alleviation, paired assistance, and infrastructure construction, strong external interventions effectively broke the original low-level path dependence, reflecting the “Institutional advantages in resource allocation” of the system with Chinese characteristics in underdeveloped regions.
The third stage (2017–2020): The “Comprehensive Optimization” period under strategic superimposition. As The 19th National Congress of the CPC formally proposed the “Rural Revitalization Strategy” in 2017, the policy focus shifted from single-dimensional “survival assistance” to comprehensive “development and revitalization.” The system’s flow path was manifested as the overall regression of low and medium grades and the expansion of medium and high grades (“Intermediate Coordination”). In particular, with China announcing the elimination of regional absolute poverty in 2020, the release of this institutional dividend enabled cities in deep mountainous areas, such as Bazhong and Shangluo, to also complete their convergence towards the coordination range.
The fourth stage (2020–2023): The “High-value Inertia” period in the post-poverty alleviation era. The 2023 node shows that the system evolution entered a relatively stable high-level plateau period, with lines tending to be parallel and grade regression phenomena rarely occurring. This stability verifies the effectiveness of the policy of “effectively connecting the consolidation and expansion of targeted poverty alleviation achievements with rural revitalization.” At this time, advantageous eastern cities (such as Luoyang and Xiangyang) showed obvious “high-value lock-in,” while the western region also demonstrated strong resilience, indicating that the Qinba Mountains have preliminarily established an endogenous growth mechanism, gradually getting rid of excessive reliance on external blood transfusions, and entering a new stage of high-quality, stable development driven by endogenous dynamics.
3.3.2. Spatiotemporal Transition Probabilities and Spatial Effects Based on Markov Chains
- (1)
Traditional Markov Matrix Analysis
As shown in
Table 3, the evolution of the
D index in the Qinba Mountains exhibits significant “Path Dependence” and “Self-lock” characteristics. First, the phenomenon of diagonal probability dominance is obvious. The values on the diagonal of the matrix are significantly higher than the off-diagonal values, indicating a very high probability of cities maintaining their original coupling coordination type. Specifically, the maintenance probability of Intermediate Coordination (V) is the highest, reaching 90.5%, demonstrating that the high-level development stage has extremely strong stability and inertia; the maintenance probabilities of Primary Coordination (IV) and Verge of Imbalance (III) are 66.67% and 51.52%, respectively, indicating that although there is a certain upward evolutionary momentum in the low- and medium-level stages, the “solidification effect” still exists. Second, leapfrog development is difficult. The off-diagonal elements show that grade transitions mainly occur between adjacent types (e.g., the probability from Verge of Imbalance to Primary Coordination is 36.36%), while the probability of cross-grade transitions is extremely low (e.g., the probability of jumping directly from Verge of Imbalance to Intermediate Coordination is 0). This reveals that the enhancement of the synergy of the rural revitalization system is a gradual cumulative process. Constrained by the cyclical nature of cultivating factors such as population and industry, it is difficult to achieve discontinuous “leapfrog” upgrading.
- (2)
Spatial Markov Matrix Analysis: Neighborhood Background and Spatial Spillover
After introducing the Spatial Lag term into the matrix, by comparing the transition probabilities under different neighborhood backgrounds (
Table 4), it is found that the evolution of the Coupling Coordination Degree of rural revitalization in the Qinba Mountains is significantly affected by the “Bidirectional Neighborhood Constraint.” That is, the neighborhood environment can act either as a “booster” accelerating upgrading or a “stumbling block” hindering development.
First, there is a significant “Negative Screening Effect” in low-level neighborhoods. The data show that when the neighborhood is at a lower development stage, the resistance for the local area to leap to a higher grade significantly increases, presenting a geographical lock-in characteristic of “one takes the behavior of one’s company” (being negatively influenced by surroundings). In the traditional Markov matrix, the average transition probability from Verge of Imbalance to Primary Coordination is 36.36%. However, when such cities are surrounded by neighbors also at the Verge of Imbalance, their probability of upward transition to Primary Coordination does not rise but drops to 25%. This reveals the spatial formation mechanism of “contiguous destitution” in the western deep mountainous areas: a backward neighborhood environment implies hindered regional factor mobility and market fragmentation, forming a negative spatial screen and causing the local area to easily fall into a “low-value lock-in” dilemma.
Second, medium- and high-level neighborhoods exhibit a strong “Positive Cascading Pull.” As the neighborhood grade improves, the probability of local upward evolution shows a nonlinear leap characteristic, verifying the spatial spillover dividend of “positive influence from good surroundings.” Regarding breakthroughs in low-value areas: when the neighborhood is upgraded to Primary Coordination, the probability of Verge of Imbalance cities transitioning upward to Primary Coordination soars to 53.33%, an increase of about 17 percentage points compared to the traditional probability (36.36%), indicating that a benign external environment can effectively break low-level path dependence. Regarding the strengthening of high-value areas: this driving effect remains significant at high-level stages, manifested as a “high-order synergy” characteristic. When the neighborhood is at Intermediate Coordination, the probability of leaping from Primary Coordination to Intermediate Coordination increases to 29.17% (higher than the average of 25.40%), and the probability of Intermediate Coordination further breaking through to Good Coordination reaches 9.18% (higher than the average of 6.57%).
In summary, the spatial correlation effect of rural revitalization in the Qinba Mountains exhibits significant asymmetric characteristics. High-level neighbors construct a “Positive Field” conducive to local upgrading through industrial chain extension, infrastructure sharing, and technology spillover; while low-level neighbors may form a development depression, exacerbating inter-regional imbalance. This indicates that breaking down administrative barriers and establishing cross-regional synergistic development mechanisms have important policy implications for solving the “neighborhood poverty trap” of peripheral cities.
3.4. Spatial Autocorrelation Analysis of the Coupling Coordination Degree and Its Subsystems in the Qinba Mountains
3.4.1. Global Moran’s I Analysis
Based on the Global Moran’s I, a quantitative diagnosis of the spatial correlation pattern of the Coupling Coordination Degree of rural revitalization in the Qinba Mountains from 2009 to 2023 was conducted.
Table 5 shows that except for 2019, which was significant at the 0.05 level, all other years passed the significance test at the 0.01 level (Z-score > 2.58,
p < 0.01). This result confirms that the level of rural revitalization in the Qinba Mountains is not randomly distributed but exhibits obvious spatial dependence characteristics; that is, high-level areas are adjacent to high-level areas, and low-level areas are adjacent to low-level areas.
From the temporal dimension, the degree of spatial agglomeration generally showed a “fluctuating upward” trend. From 2009 to 2015, the Moran’s I index climbed steadily from 0.331 to 0.469, reflecting that with the intensification of poverty alleviation and development efforts, spatial connections within the region became increasingly close, and the spillover effects of development highlands initially emerged. Although the index briefly declined between 2016 and 2019, this was mostly due to the enhanced spatial heterogeneity caused by the differentiated and independent development of various counties during the critical period of poverty alleviation. After 2020, with the comprehensive implementation of the rural revitalization strategy, the regional synergy mechanism gradually matured, and the Moran’s I index rapidly rebounded, reaching a peak of 0.536 in 2023. This indicates that the spatial pattern of rural revitalization in the Qinba Mountains has gradually evolved from a loose distribution in the early stage to a tight agglomeration pattern dominated by central cities.
3.4.2. Local Moran’s I Analysis
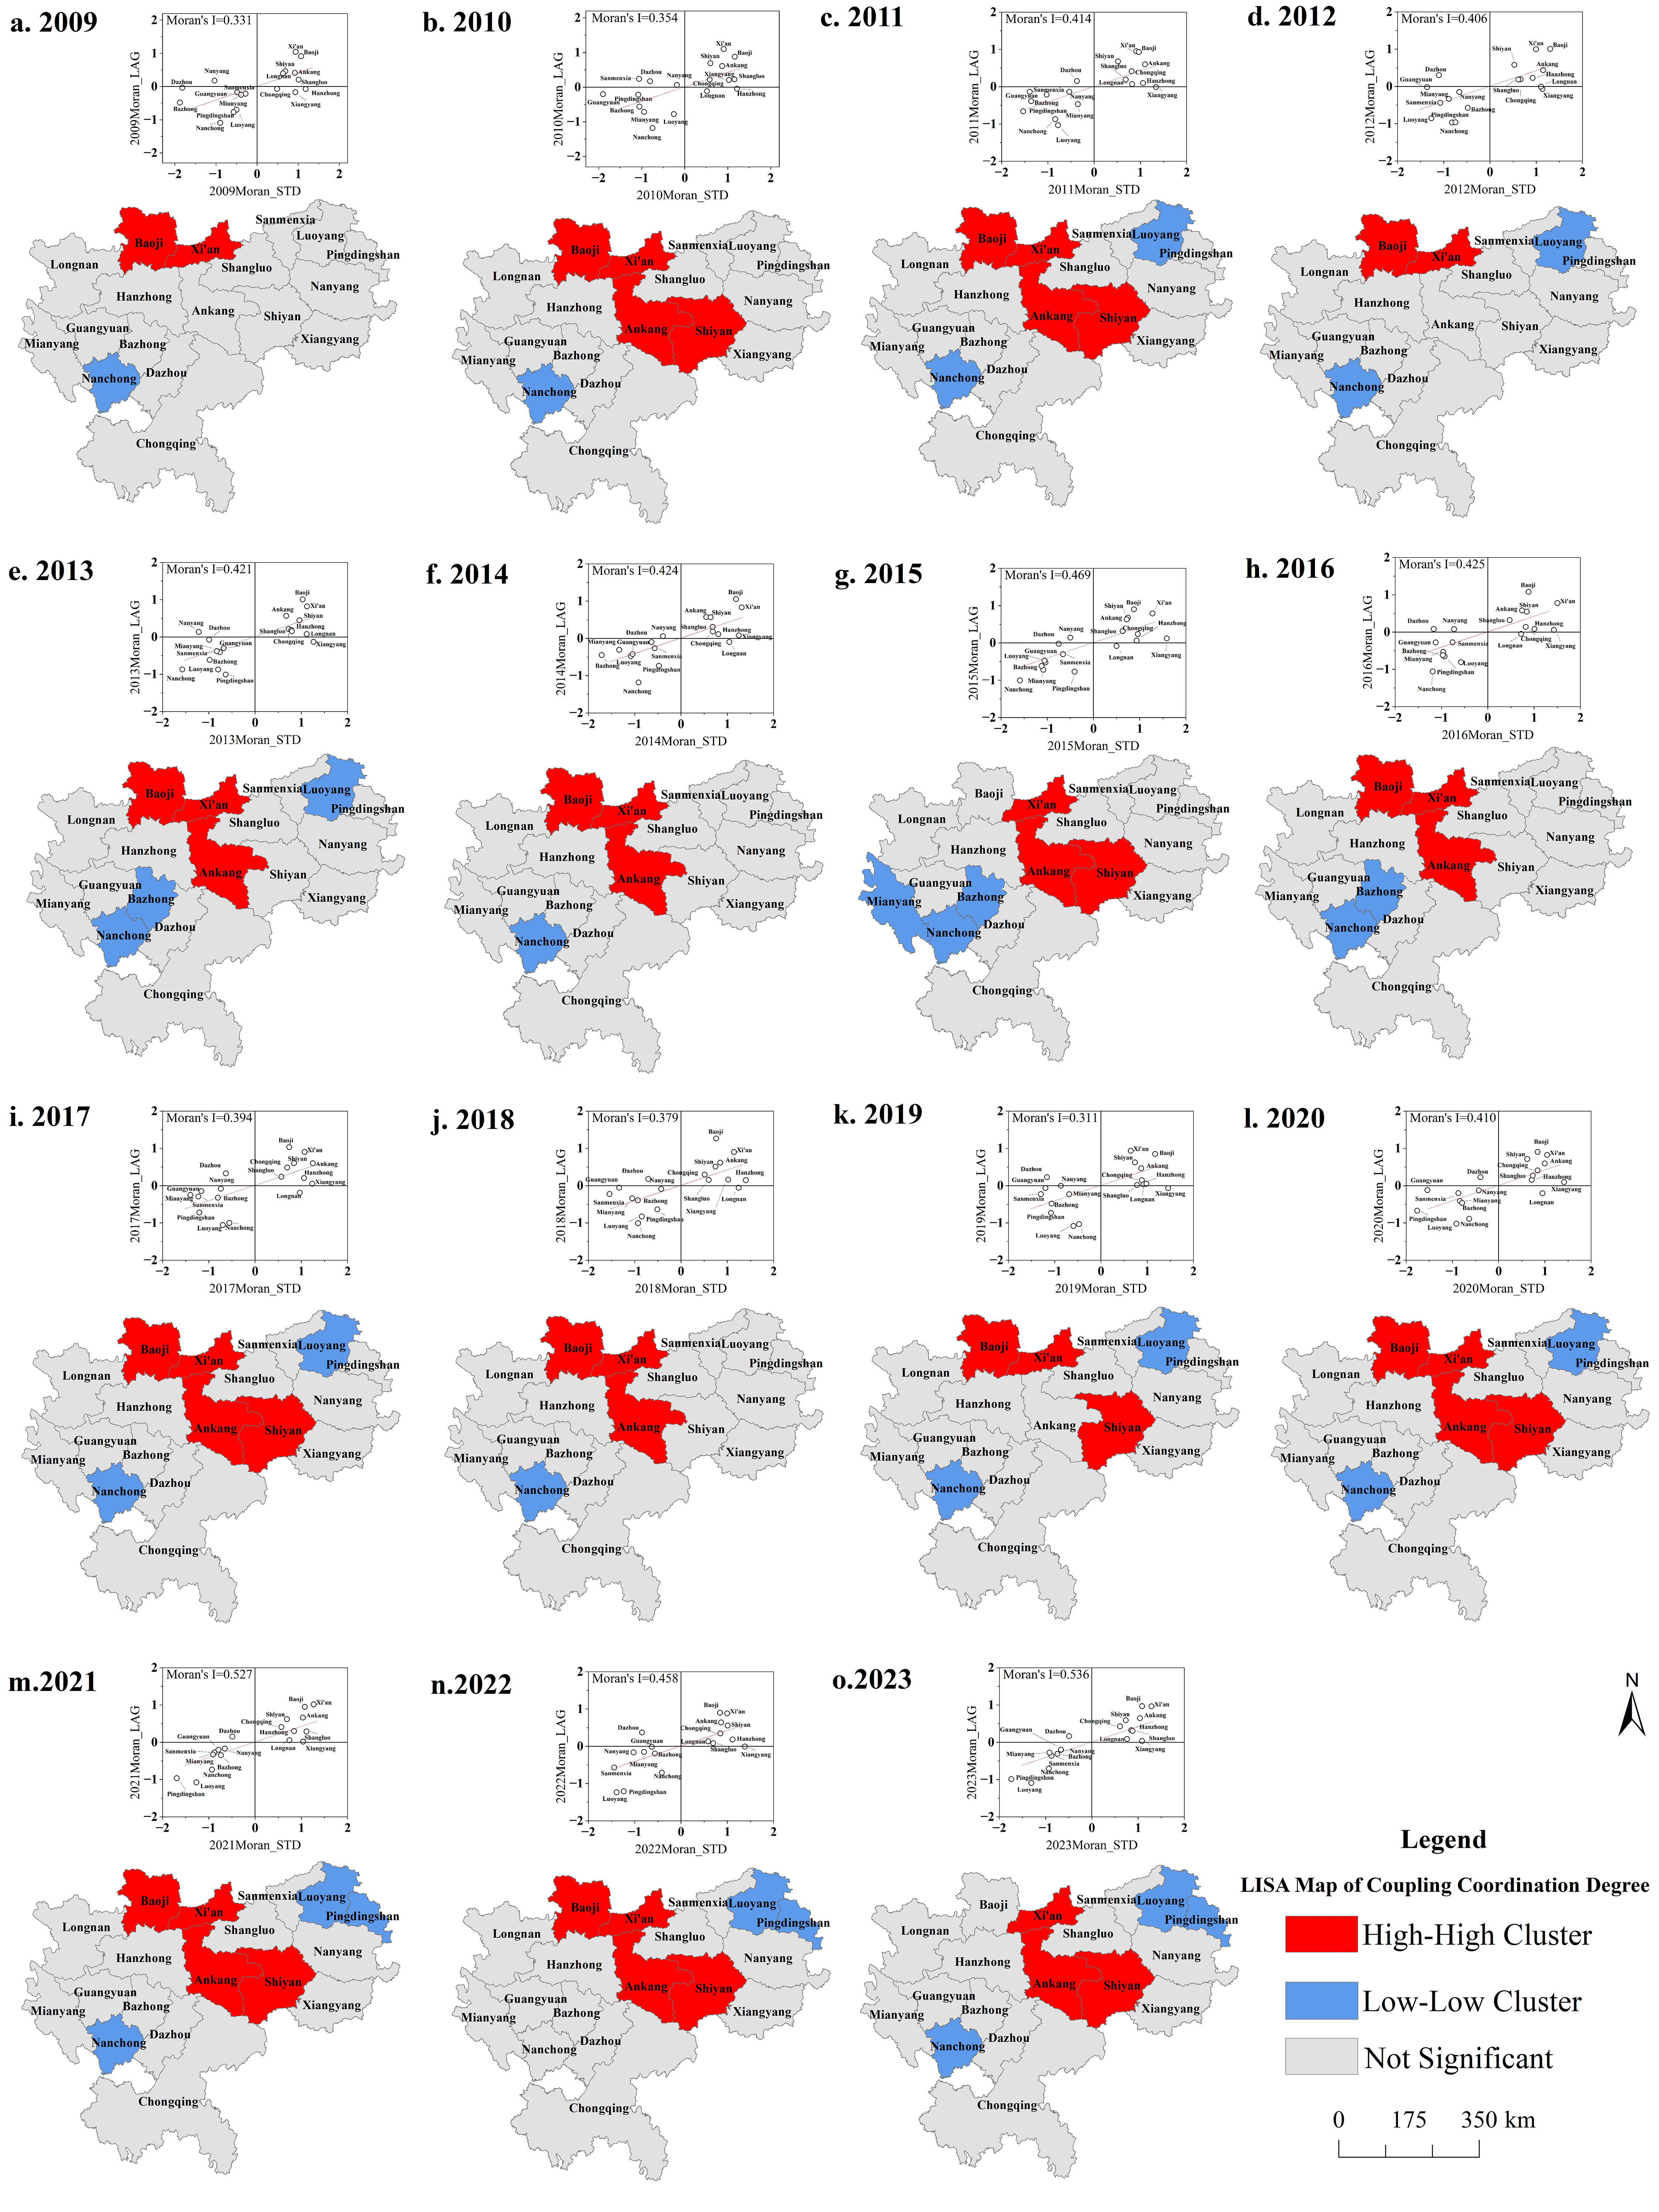
To delve into the micro-level clustering behaviors, the LISA cluster map (
Figure 6) demonstrates that the neighborhood associations of the
D index across the Qinba Mountains exhibit profound imbalances. This generally shapes a geographic divide characterized by “high in the north and low in the south, core agglomeration, and edge collapse.” As shown in
Figure 6, the significant High–High (H-H) agglomeration areas and Low–Low (L-L) agglomeration areas constitute the main body of the regional spatial structure, and both exhibit extremely strong path dependence characteristics in their spatial distribution. The high-value areas are mainly distributed in a belt along the “Guanzhong Plain–Han River Valley” line, demonstrating strong spatial extensibility; while the low-value areas are concentrated and contiguous in the deep mountainous areas of northeastern Sichuan and the inter-provincial border areas of western Henan, presenting obvious plate lock-in characteristics. As for the large-scale gray “Not Significant” areas present in the figure, they indicate that the rural revitalization levels of the remaining counties have not yet formed a strong dependent relationship in space, residing in an intermediate state transitioning from point-like development to area-like synergy.
High–High agglomeration indicates that the Coupling Coordination Degree of a certain place is relatively high and the surrounding areas are also at a high level, reflecting a high degree of synergistic development within the region and the existence of certain spatial spillover effects. During the study period, the high-value agglomeration areas generally presented a spatial pattern with Xi’an as the core, Baoji as an important supporting node, and extending in stages toward Ankang and Shiyan along both the northern and southern sides of the Qinling Mountains. Xi’an consistently acted as a stable High–High agglomeration center almost throughout the entire study period, Baoji formed a continuous high-value neighborhood with it in most years, and Ankang and Shiyan entered the high-value agglomeration sequence multiple times, forming a continuous high-coordination belt across the north and south of the Qinling Mountains in some years. This pattern indicates that the high-coordination areas have obvious spatial stability and path dependence characteristics, meaning that core cities, relying on stronger economic foundations, transportation accessibility, and factor agglomeration capabilities, are more likely to form synergistic development effects during the advancement of rural revitalization, and generate a certain driving effect on surrounding mountainous areas through spatial connections, making the high-value agglomeration present an overall characteristic of “stable core, stage-wise expansion of edges.”
Low–Low agglomeration means that a certain place and its neighborhood are both at a relatively low development level, usually manifested as a weak development foundation and structural constraints mutually reinforcing each other in space. The low-value agglomeration areas are mainly concentrated in parts of northeastern Sichuan and western Henan. Among them, Nanchong continuously acted as a stable Low–Low agglomeration core in most years, and expanded to surrounding mountainous areas in certain stages; meanwhile, Luoyang and Pingdingshan presented synchronous low-value agglomeration in multiple years, forming a relatively stable low-coordination plate. These types of areas generally present spatiotemporal characteristics of strong persistence but stage-wise fluctuations, that is, although low-value agglomeration weakened or turned insignificant in individual years, it still possessed strong inertia overall, reflecting the long-term constraints of factors such as mountainous terrain conditions, a relatively weak industrial foundation, and population mobility on the coupling coordination level of rural revitalization. Overall, the high-value agglomeration areas mainly reflect the driving and spatial spillover effects of core nodes, while the low-value agglomeration areas reflect the spatial lock-in characteristics formed by the similar development conditions of adjacent mountainous areas. The two together constitute the basic spatial structure of the D index in the Qinba Mountains.
It is worth noting that there are large-scale gray Not Significant areas within the study area, mainly distributed in the transition zones between high- and low-value agglomeration areas. This phenomenon has important economic geographical implications in spatial econometric analysis: on the one hand, it indicates that the rural revitalization levels of these areas have not formed strong spatial dependent relationships with adjacent counties and districts, their development models are relatively isolated, and they lack obvious cross-regional synergistic effects. On the other hand, it also reflects that a radiation network covering the entire region has not yet formed in the Qinba Mountains, and the spillover effects of high-value areas have an obvious distance decay threshold, making it difficult to penetrate geographical barriers and diffuse to broader hinterlands. This results in a large number of intermediate areas being in a state of “random distribution due to the lack of strong central driving forces.” These widespread non-significant areas actually reveal the realistic bottlenecks faced by the Qinba Mountains in the transition process from point-like polarization to area-like synergy. Taking Shangluo as an example, its geographical location is extremely unique: it borders the high-level development of Xi’an (H) to the north and the relatively lagging counties of the Qinba hinterland (L) to the south. This “half-urban, half-rural, strong north, weak south” neighborhood environment causes its local spatial autocorrelation statistical value to be neutralized. Shangluo has both undertaken Xi’an’s industrial transfer (such as tailings utilization and building materials industries) and retained typical mountainous agricultural characteristics. Its development level is neither strong enough to drive its southern neighbors into the H-H club nor backward enough to fall into the L-L quadrant, thus manifesting as statistically not significant.
3.5. Analysis of Driving Mechanisms for Rural Revitalization in the Qinba Mountains
3.5.1. Single-Factor Driving Analysis
As shown in
Table 6, the relative influence (
q statistic) of individual determinants exhibited significant spatiotemporal evolution characteristics during the study period from 2009 to 2023, profoundly reflecting the interaction between national strategic orientations and regional factor endowments at different development stages.
Among the natural constraint factors, the explanatory power of Terrain Relief Amplitude (F1) for the D value showed a pattern of initial decline followed by renewed strengthening. In the 2009 base period, the q value of F1 was 0.518, indicating that terrain conditions constituted an important background factor shaping the spatial pattern of regional development. By 2012, with the launch of the targeted poverty alleviation plan for the Qinba Mountains, transportation infrastructure investment increased markedly, partially easing the development constraints associated with geographical barriers, and the q value of this factor declined to 0.390. However, by 2023, following the strategic transition to comprehensively advancing rural revitalization, the q value of F1 rose to 0.772. This rebound indicates that, in the deepening stage of rural revitalization, topographic relief once again became a major source of spatial differentiation as development activities extended further into deep mountainous areas. In other words, the background influence of the natural geographical environment remained significant. However, a high q value here primarily reflects strong explanatory power rather than a uniformly negative effect across all development contexts. Instead, it suggests that terrain continues to shape differentiated regional development pathways and remains a dominant background factor in the spatial evolution of rural revitalization.
The driving roles of infrastructure and Policy Support Factors exhibited obvious stage-wise differentiation. The q value of Road Network Density (F6) in the 2009 base period was as high as 0.639, ranking first among all factors, which reflected the strong explanatory power of early transportation network construction on regional development variations. However, with the improvement of road network coverage, its marginal explanatory power gradually diminished, and by 2023, the q value of this indicator had dropped to 0.287. In contrast, Fiscal Input in Science, Education, Agriculture, and Forestry (F10) showed a stronger continuous impact, with its q value rising from 0.512 in the 2009 base period to 0.617 in 2012, and still maintaining a high level of 0.546 in 2023. This confirms that continuous institutional supply and public resource allocation remain key factors explaining the spatial patterns of regional development across different policy stages.
At the level of economic and social factors, Per capita fixed asset investment (F4) and Per capita retail sales of consumer goods (F7) presented different explanatory trajectories. The q value of Per capita fixed asset investment (F4) was only 0.120 in the 2009 base period, but after the state proposed the rural revitalization strategy in 2017, with the concentrated input of capital factors in various agriculture-related projects, its q value rapidly leaped to 0.403, an increase of 2.36 times compared to the base period. This shows that policy-oriented capital investment has exerted a strong impact on the spatial variation in system coordination. Meanwhile, the q value of Per capita retail sales of consumer goods (F7) remained above 0.5 at all five observation time points. Especially in 2020, the concluding year of China’s poverty alleviation campaign, the q value of this indicator reached a peak of 0.656, significantly higher than the 0.240 of Per capita GDP (F2) during the same period. This difference indicates that, compared to pure economic aggregate growth, the enhancement of regional market activity and residents’ consumption capacity can more effectively explain the spatial heterogeneity of the coupling coordination level of rural revitalization in the Qinba Mountains.
Finally, the driving effect of industrial structure factors generally remained weak. Throughout the five time nodes, the q value of the Share of value-added of secondary and tertiary industries (F3) mainly fluctuated between 0.141 and 0.390, and dropped to its lowest value of 0.141 in 2023. This indicates that despite long-term development, the spatial differences in coupling coordination are less driven by the traditional industrial structure (F3). The specific pathways of industrial upgrading and ecological transformation may exhibit complex local homogeneity or be overshadowed by stronger macro-factors like topography and capital input, resulting in its limited spatial explanatory power.
3.5.2. Interactive Factor Driving Analysis
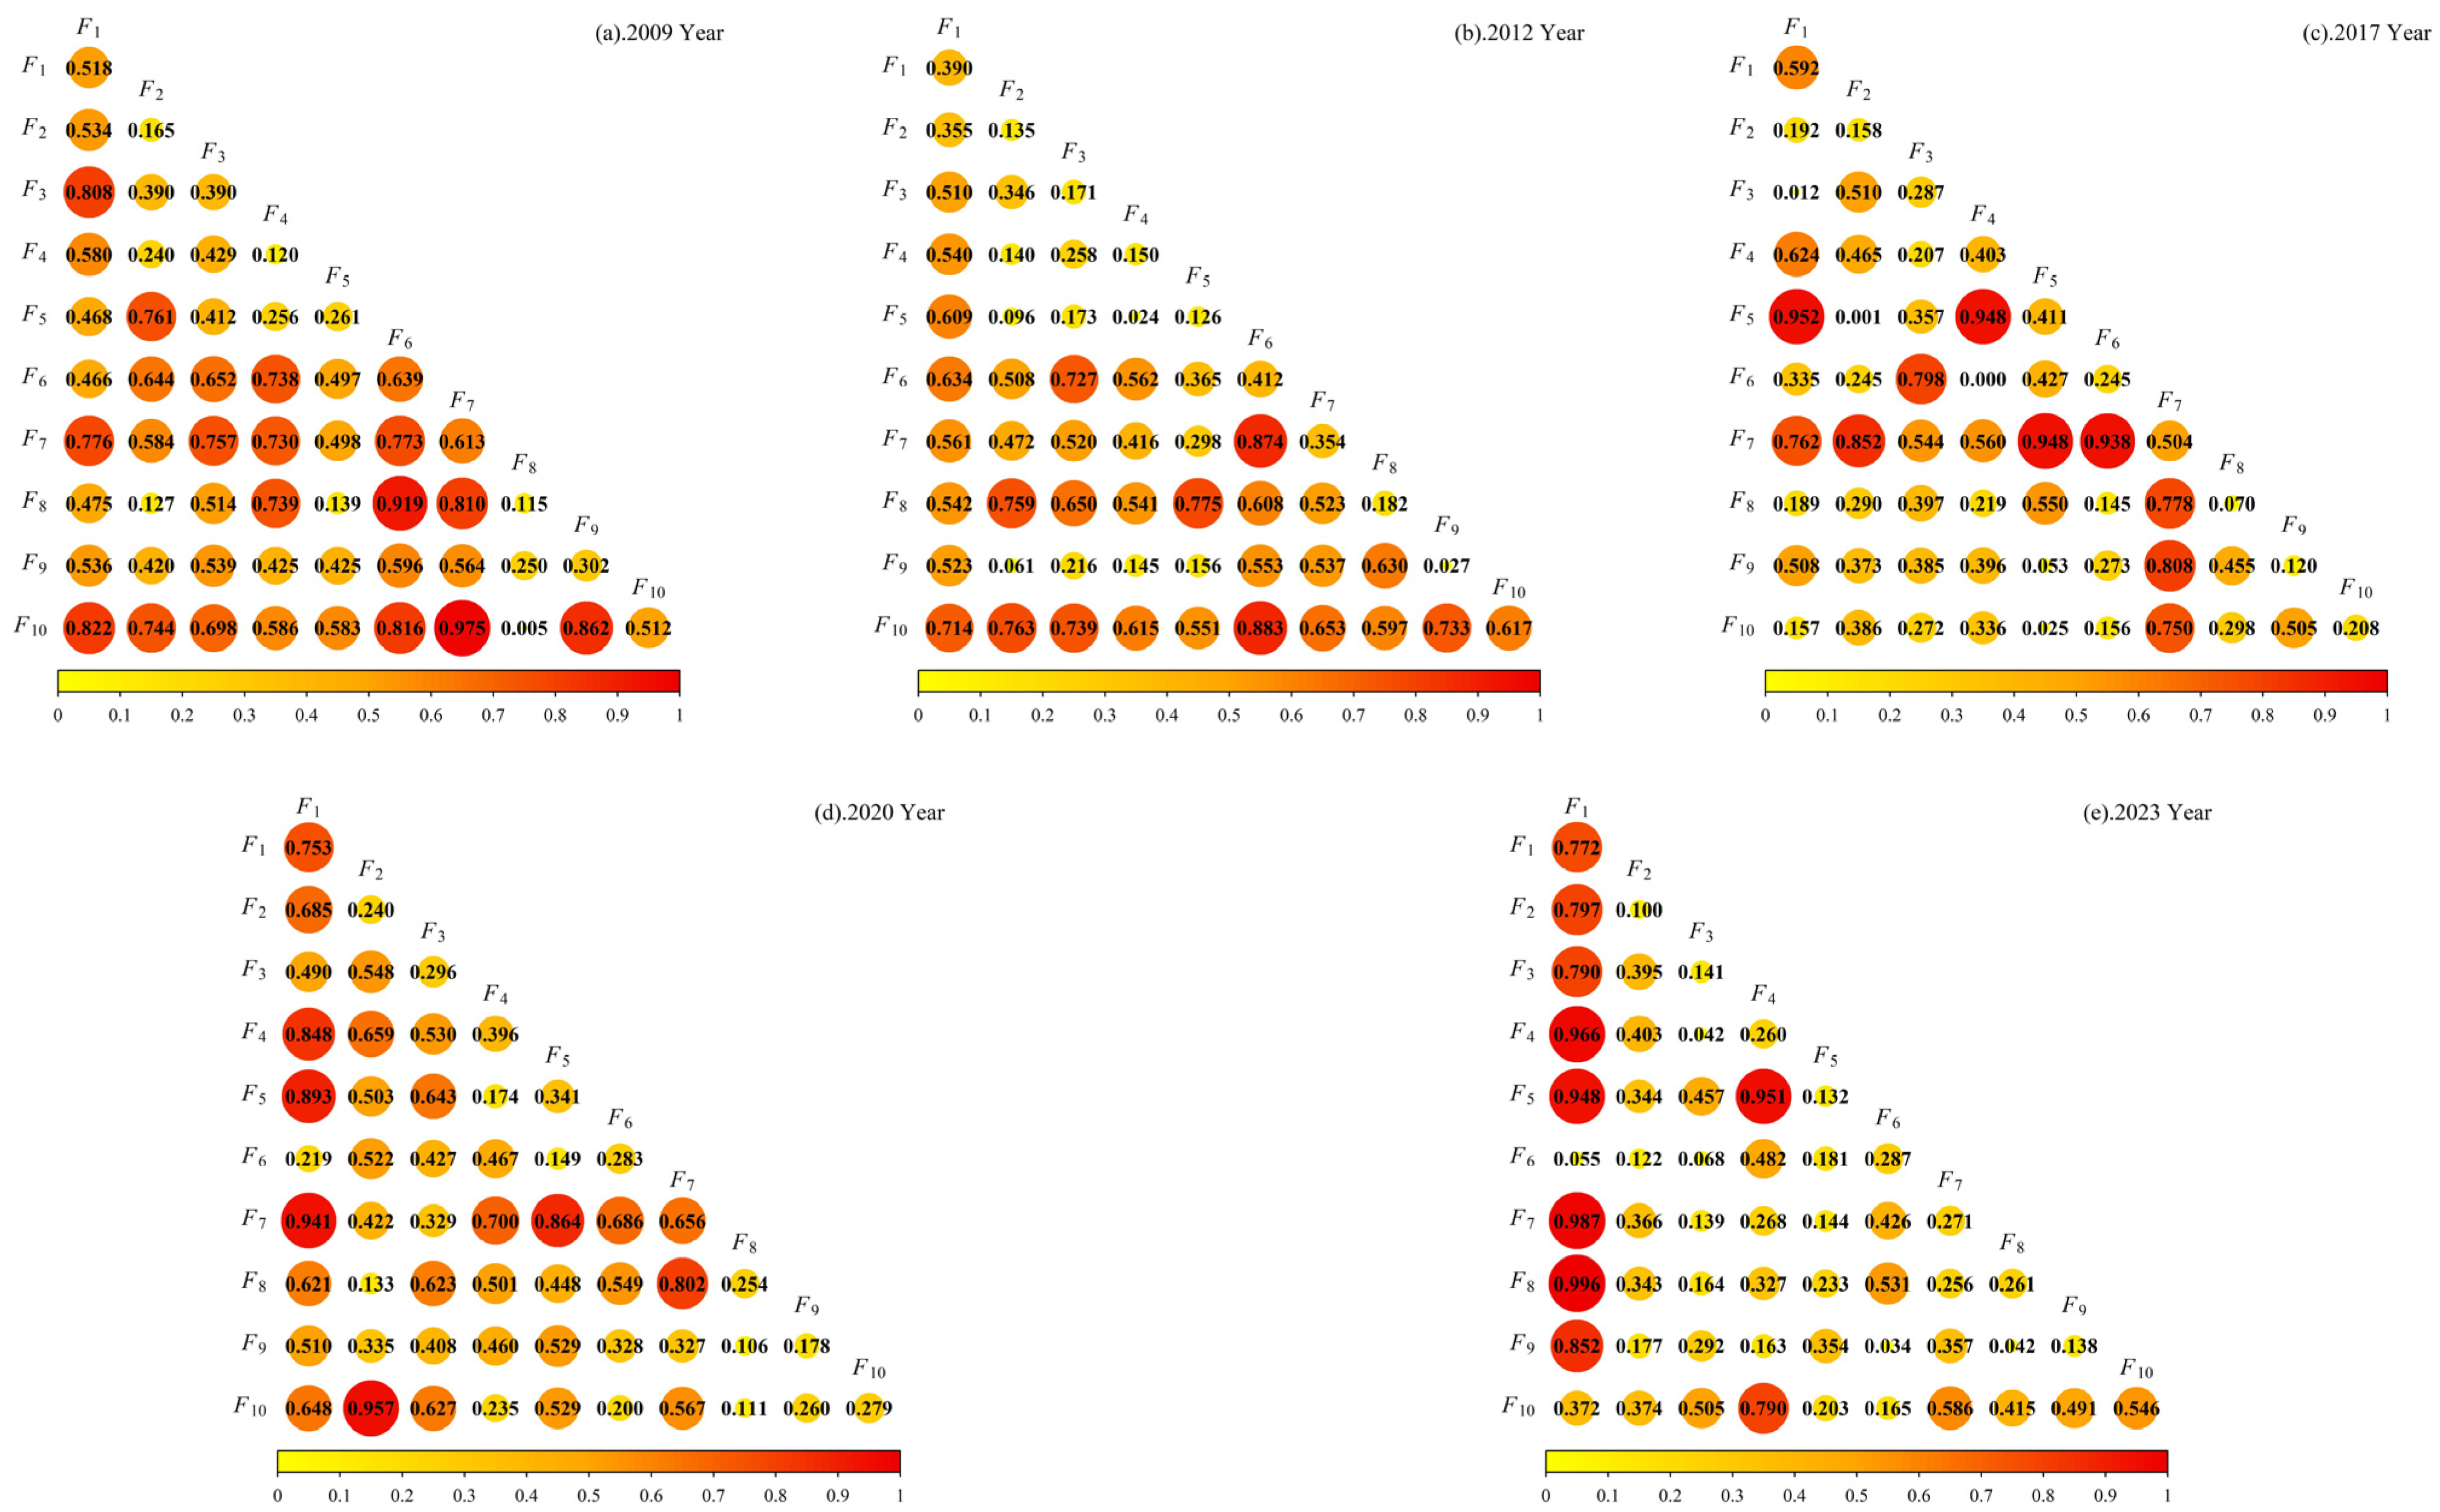
The interaction detection results (
Figure 7a–e) show that complex nonlinear coupling relationships exist among the various driving factors in the Qinba Mountains. Overall, the interaction
q values of the vast majority of factor pairs are higher than their single-factor
q values, and the interaction types are mainly manifested as Bi-factor enhancement and Nonlinear enhancement. This result confirms that a single factor is often insufficient to independently explain the full picture of the spatial heterogeneity of rural revitalization. Regional development is the result of the spatial synergistic action of multi-dimensional factors such as natural background, infrastructure, industrial capital, and policy regulation. From the dimension of spatiotemporal evolution, the combinations of dominant interacting factors and their action intensities exhibited significant stage-wise differences along with adjustments in national strategic orientations:
- (1)
The synergistic start-up period of policy intervention and social foundation (2009–2012). In 2009 (base period), the interaction q value between Fiscal Input in Science, Education, Agriculture, and Forestry (F10) and Per capita retail sales of consumer goods (F7) was as high as 0.975, manifesting as a significant Bi-factor enhancement (0.975 > max(0.512,0.613)). This indicates that early development highly relied on the superimposition effect of “top-down” fiscal transfer payments and “bottom-up” consumer market vitality. By 2012, with the implementation of the Regional Development and Poverty Alleviation Plan for the Qinba Mountains Contiguous Destitute Area, the interaction q value between Fiscal Input (F10) and Road Network Density (F6) reached 0.883. At this time, government fiscal support and transportation infrastructure construction formed a strong complementary mechanism, effectively breaking the spatial enclosed pattern of deep mountainous areas and becoming the core driving force for rural revitalization at this stage.
- (2)
The nonlinear explosion period of capital investment and logistics efficiency (2017). After China proposed the “Rural Revitalization Strategy” in 2017, the efficiency of factor flow became crucial. The detection results show that the interaction between Transportation intensity per unit GDP (F5) and Per capita fixed asset investment (F4) produced a drastic Nonlinear enhancement effect. Calculations indicate that the interaction q value of the two factors was 0.948, notably exceeds the additive sum of the individual variables (q(F5) + q(F4) = 0.411 + 0.403 = 0.814). This “1 + 1 > 2” super-additive effect reveals that when high-intensity capital investment is matched with an efficient logistics and transportation system, it can explosively elevate the synergistic performance of local industrial sectors, verifying the multiplier effect of infrastructure interconnectivity on capital factor allocation.
- (3)
The adjustment period of natural background and emerging factors (2020–2023). Entering the post-poverty alleviation era and the post-pandemic recovery period, Terrain Relief Amplitude (F1) remained a major background factor shaping the Coupling Coordination Degree of rural revitalization in 2023 (single-factor q = 0.772). At the same time, its interaction with modernization-related factors exhibited new adaptive characteristics. The data show that the interaction q value between Terrain Relief Amplitude and Per capita post and telecommunications volume (q(F1 ∩ F8)) reached 0.996, while the interaction q value between Terrain Relief Amplitude and Per capita retail sales of consumer goods (q(F1 ∩ F7)) reached 0.987. Although these interaction effects did not exceed the arithmetic sum of the corresponding single factors, their explanatory power remained extremely high and belonged to strong Bi-factor enhancement. This indicates that, in the stage of high-quality development, informatization (F8) and market circulation capacity (F7) did not remove the background influence of complex terrain, but increasingly reshaped its developmental implications by improving connectivity, expanding market access, and enhancing the potential for ecological and place-based value realization. In this sense, the human–earth relationship in deep mountainous areas has entered a stage of adaptive reconfiguration: terrain still constrains conventional expansion-oriented development, yet under improved information and market conditions, it can also support differentiated development pathways such as mountain tourism, ecological health care, and other place-based industries.
In summary, the driving mechanism of rural revitalization in the Qinba Mountains has evolved from “policy-infrastructure dual-wheel drive” in the early stage to “capital-logistics nonlinear mutual feedback” in the middle stage, and finally shifted to the current “synergistic adaptation of digitalization and marketization under natural constraints.”
3.5.3. Analysis of Driving Mechanisms and Pathways of Dominant Factors
To further reveal the complex nonlinear interaction mechanisms among driving factors, given the complexity of factor combinations, this study follows the principles of “dominance and representativeness.” Comprehensively considering the significance ranking of explanatory power (
q value) in single-factor detection and the typicality of each factor in the system dimensions, five core indicators were finally selected from five major dimensions—physical geography, economic capital, infrastructure, social market, and policy regulation—to construct an interaction matrix (
Table 7). These five indicators are Terrain Relief Amplitude (F1), Per capita fixed asset investment (F4), Road Network Density (F6), Per capita retail sales of consumer goods (F7), and Fiscal Input in Science, Education, Agriculture, and Forestry (F10). They represent the natural background constraints, transportation barrier-breaking capacity, domestic demand market vitality, capital driving intensity, and government institutional supply in the process of rural revitalization in the Qinba Mountains, helping to accurately identify the dominant driving pathways at different development stages from a multi-dimensional perspective.
As shown in
Table 7, there are close coupling mechanisms among the subsystems of rural revitalization, meaning that the shortcomings of a single factor can often be activated by the complementary advantages of other factors. To more systematically explain this complex driving logic, combining
Figure 7 and
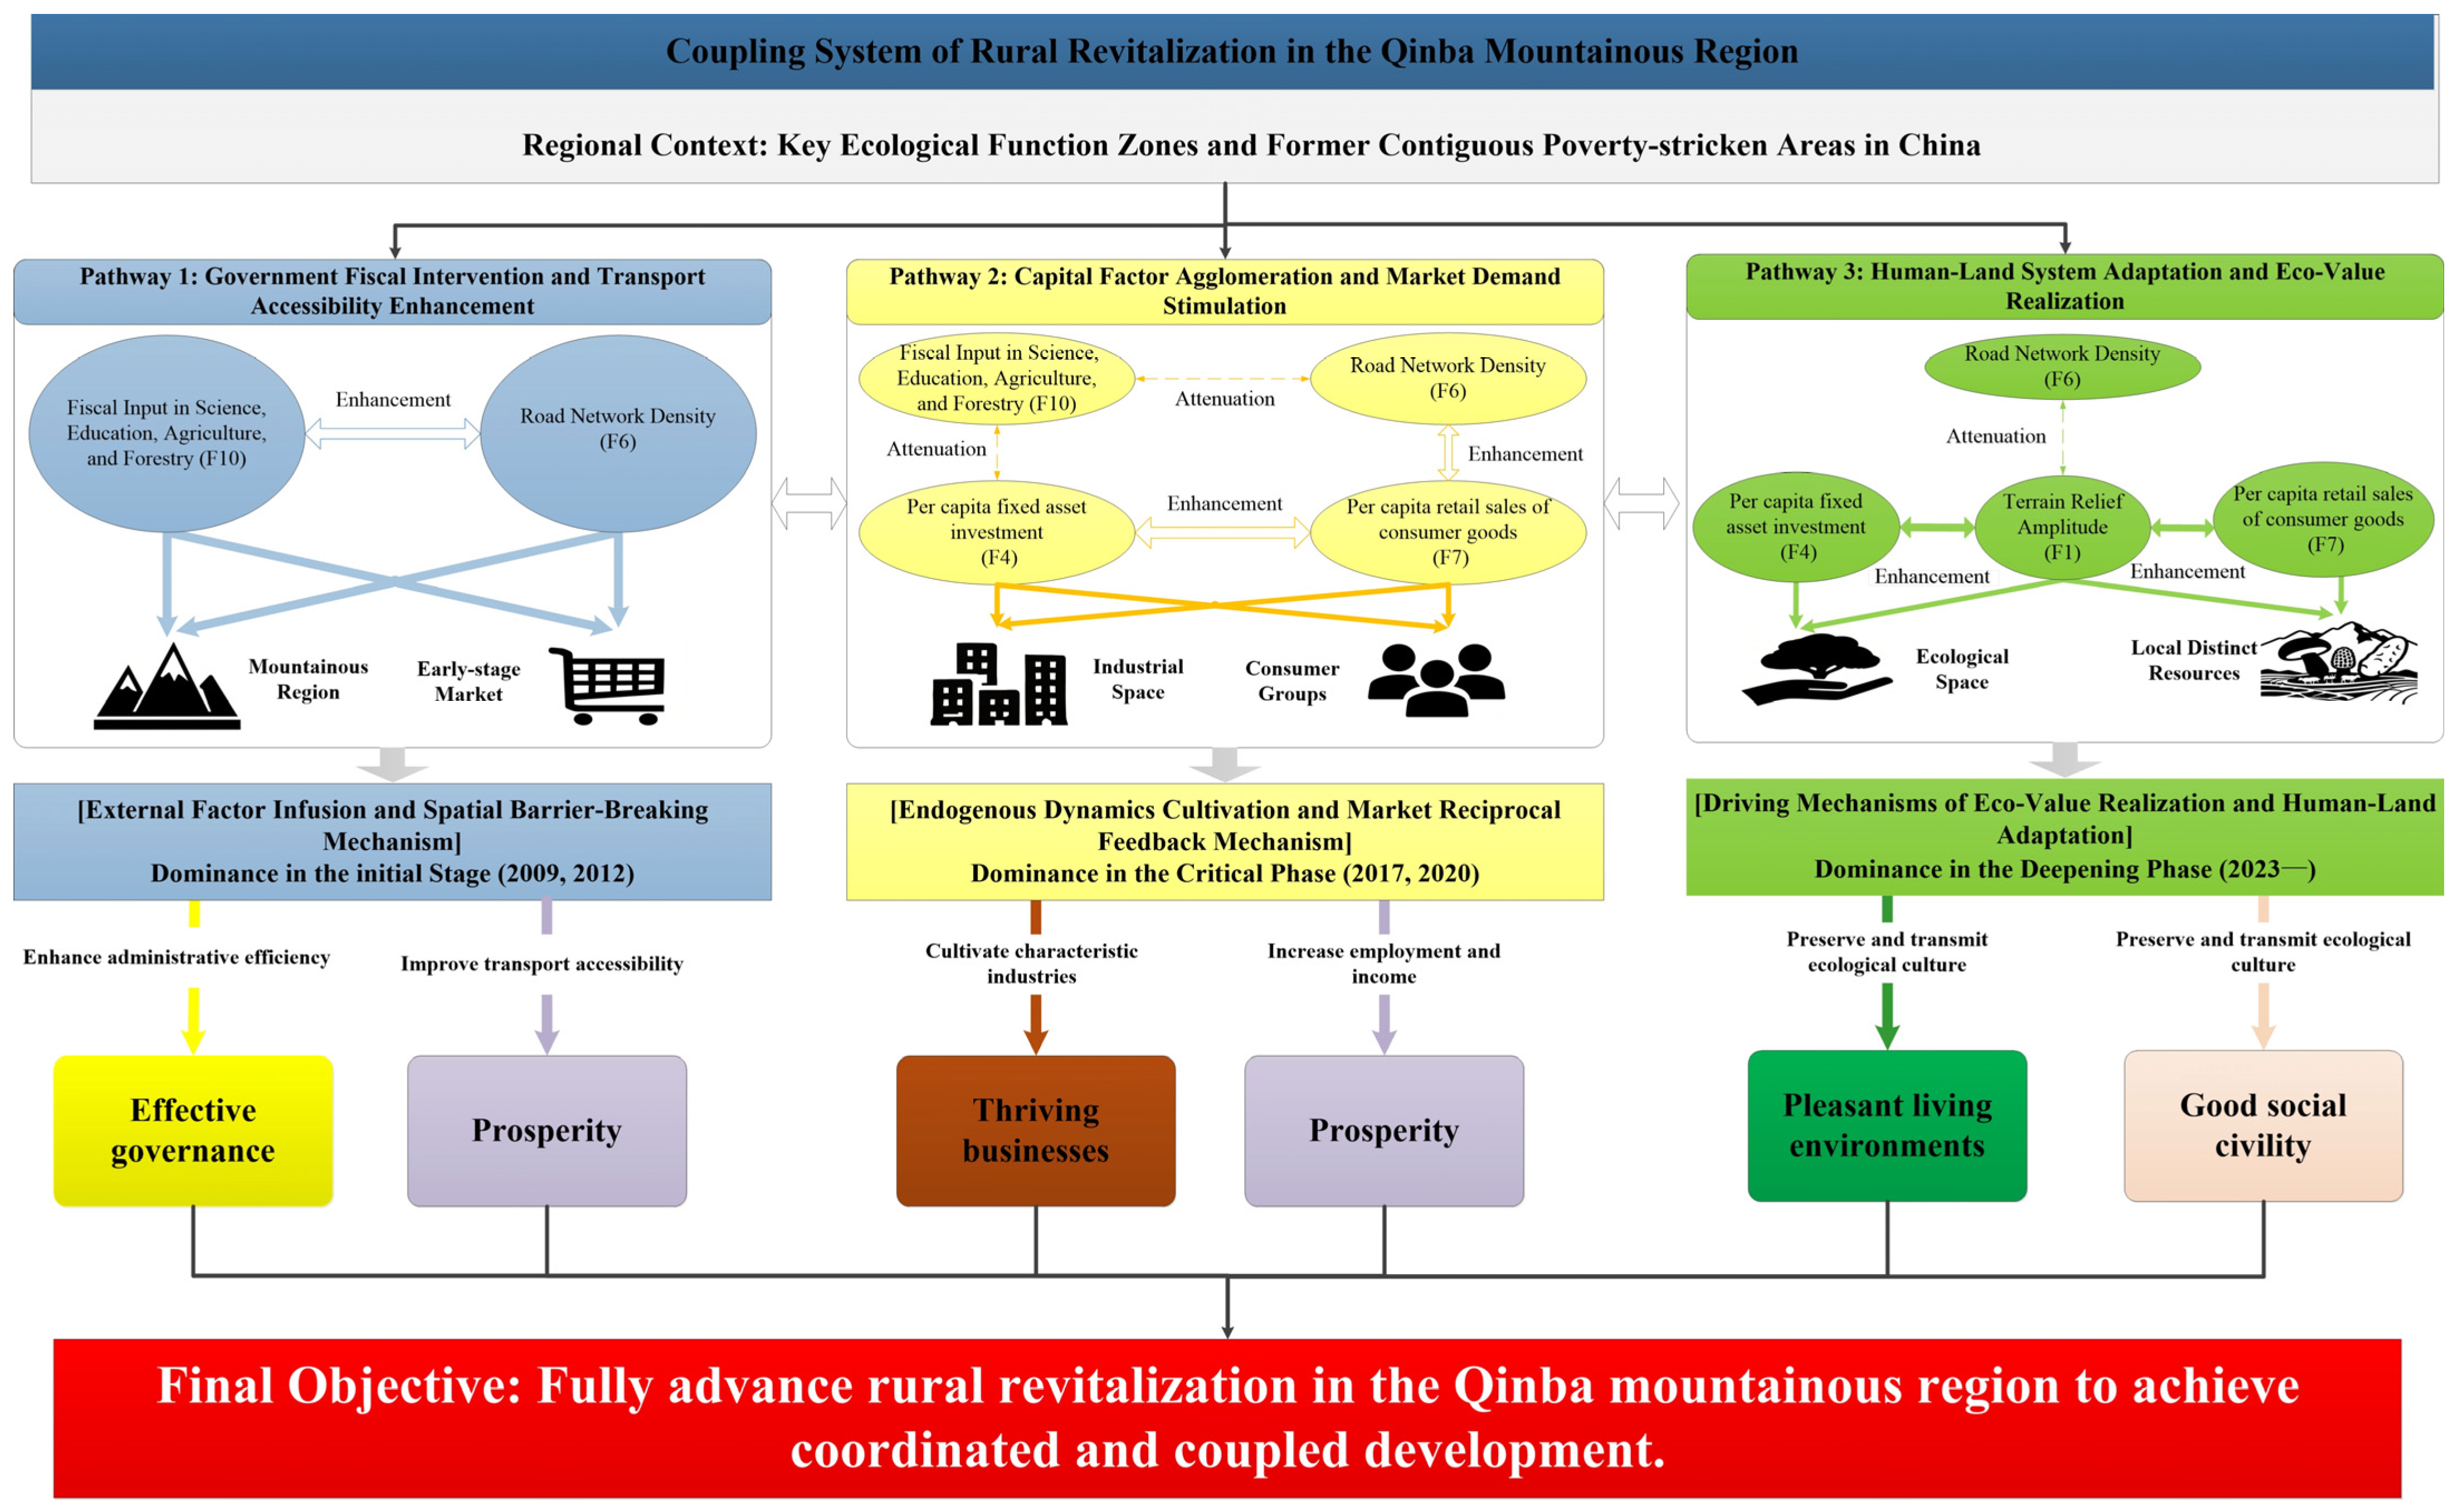
Table 7, the frequently occurring and significantly explanatory interacting factor combinations are regarded as key transmission nodes to sort out the logical chains among factors. These are summarized into three core driving pathways: “technology upgrading and regulation,” “structure optimization and industry-city adaptation,” and “governance expansion and facility construction,” constructing a driving mechanism and pathway diagram for the coupling coordination of rural revitalization (
Figure 8). The specific pathway analysis is as follows:
According to the interaction detection data in
Table 7 and the pathway evolution logic in
Figure 8, significant nonlinear coupling characteristics exist among the subsystems of rural revitalization in the Qinba Mountains. With the evolution of development stages, the interaction mode among core factors transitioned from “Bi-factor enhancement” to “weakening” and then to “adaptive adjustment.” This “strong-weak transition” is not a simple decline in momentum, but a structural mapping of the system’s transition from exogenous dependence to endogenous drive. Combining the spatiotemporal evolution of factor interaction intensity, this study sorts out the following three core driving pathways:
- (1)
Pathway of Government Fiscal Intervention and Transportation Accessibility Improvement (Path 1)
This pathway dominated the initial stage of rural revitalization (2009–2012), with its core mechanism manifested as “external factor injection and spatial barrier-breaking.” The data in
Table 7 show that in 2012, the interaction
q value of Fiscal Input (F10) and Road Network Density (F6) remained at a high level of 0.883, and the interaction between Fiscal Input and consumer sales (F7) reached a peak of 0.975 in the base period. As shown in the blue section of
Figure 8, there is a significant bi-directional enhancement relationship between high-intensity fiscal transfer payments and transportation infrastructure construction. This top-down external factor injection not only directly broke the long-term physical spatial enclosure of deep mountainous areas but also reduced factor circulation costs by improving regional accessibility, rapidly activating the early fragile county markets. This pathway directly enhanced the public service supply capacity and administrative efficacy of primary-level governments, effectively promoting the construction of the “Effective governance” dimension; meanwhile, the fundamental improvement of transportation conditions provided a basic channel for the upward movement of agricultural products, laying the material foundation for “Prosperity.”
- (2)
Pathway of Capital Factor Agglomeration and Market Demand Stimulation (Path 2)
With the deepening of national strategies (2017–2020), the driving focus shifted from infrastructure construction to industrial capital deepening, and its core mechanism transformed into “endogenous dynamic cultivation and market mutual feedback.” Notably,
Table 7 reveals a critical structural transformation: the interaction intensity between Fiscal Input (F10) and Road Network (F6) or Investment (F4) showed significant “Nonlinear weakening” (e.g.,
q(F10 ∩ F6) plummeted from 0.883 to 0.156), which strongly corroborates the reduced reliance of rural development on single administrative directives. This “weakening” is not a policy failure but indicates that the government’s role successfully shifted from “direct drive” to “institutional guarantee,” making room for the functioning of market mechanisms. In contrast, the interaction between logistics efficiency under the release of road network dividends (F6) and the consumer market (F7) soared to 0.938 (Nonlinear enhancement), and Per capita fixed asset investment (F4) and consumption (F7) also formed a strong interaction. As shown in the yellow section of
Figure 8, this “one decrease and one increase” verifies the continuation of endogenous dynamics: the precise agglomeration of social capital and the expansion of consumer demand, supported by an efficient logistics system, formed a benign mutual feedback loop of “investment-output-consumption.” The deepening of industrial capital directly promoted the cultivation of characteristic industrial clusters, achieving “Thriving businesses”; while active market employment and growth in operating income further consolidated the development goal of “Prosperity.”
- (3)
Pathway of Human–Earth System Adaptation and Ecological Value Realization (Path 3)
Entering the high-quality development stage (2023–), the driving mechanism presented a significant “one rise and one fall” characteristic, and its core mechanism evolved into “ecological value realization and human–earth adaptation.” In
Table 7, the interaction value between Terrain Relief Amplitude (F1) and Road Network Density (F6) dropped to an extremely low level (only 0.055), presenting significant Nonlinear weakening. This reverse indicator profoundly reflects the law of diminishing marginal utility of traditional infrastructure in deep mountainous areas; that is, the model of solely relying on engineering measures to overcome terrain constraints has hit the “ceiling,” forcing a transformation of the development model. However, at the same time, the interaction values of Terrain Relief Amplitude (F1) with the consumer market (F7) and investment (F4) contrarily reached as high as 0.987 and 0.966, respectively. This strong contrast confirms the active adaptation of market mechanisms to the natural background: terrain is no longer an absolute obstacle to development but has been transformed into a comparative advantageous resource for eco-tourism and characteristic agriculture. The green section of
Figure 8 clearly illustrates this pathway: by abandoning “hard engineering” that combats nature and shifting to “soft development” that adapts to nature, a deep adjustment of the human–earth relationship and the value realization of ecological products have been achieved. This adaptive development model based on the natural background strongly supports the construction of “Pleasant living environments” and “Good social civility,” pushing the system ultimately towards a fully coordinated high-quality development goal.
In summary, the progressive succession of these three pathways reveals the broader mechanism through which high-quality development can be advanced in complex mountainous regions. It suggests a shift in the rural territorial system from reliance on scale-oriented infrastructure expansion toward greater emphasis on factor efficiency and human–earth adaptation. While fiscal support and engineering investment remain important in the early stage for improving accessibility and reducing geographical isolation, sustained high-quality development increasingly depends on the integration of market vitality, digital connectivity, and ecological resources. By adapting to topographic constraints and converting natural endowments into place-based development opportunities, this mechanism helps support the long-term resilience and spatial coordination of rural revitalization.
4. Discussion
4.1. Comparative Analysis with Existing Studies and Marginal Contributions of This Study
In exploring the spatiotemporal evolution and driving mechanisms of rural revitalization in topographically complex regions, this study contributes to the broader literature in three main respects. First, in terms of research scale, rather than focusing on a single province or a micro-level rural unit, this study treats the Qinba Mountains as a cross-provincial, prefecture-level regional system. This meso-scale perspective complements county- and village-level studies by revealing broader structural differentiation and the macro-level core–periphery pattern of “basin highlands versus mountainous depressions”. Second, analytically, by constructing an integrated framework of “comprehensive measurement–spatiotemporal tracking–mechanism diagnosis”, the study moves beyond static description to capture dynamic transition patterns and staged driving mechanisms across different policy periods. Third, from the perspective of human–earth system interactions, the findings help explain how rural revitalization pathways in mountainous regions gradually evolve from infrastructure-led support toward a more adaptive development model shaped by market activation and ecological value transformation. Taken together, these contributions not only deepen the understanding of rural revitalization in the Qinba Mountains, but also offer broader implications for the study of sustainable development in other topographically complex mountainous regions.
In terms of research scale, this study moves beyond the limitations of a single administrative division and reveals the broader structural differentiation of rural revitalization across the Qinba Mountains. Existing studies on the Qinba Mountains mostly focus on the micro county level or within a single province. For example, Guo et al. [
42] and Wang et al. [
44], in their studies on the spatial differentiation of rural development in the Qinba Mountains, both pointed out the existence of obvious unbalanced phenomena within the region. Using prefecture-level panel data for the entire region, this study confirms this spatial non-equilibrium and further shows that it takes the form of a macro-level core–periphery structure characterized by “basin highlands versus mountainous depressions”. Compared with the study by Li et al. [
51], which analyzed the coupling characteristics of urbanization and rural revitalization at the provincial level, this study utilizes long-term (2009–2023) panel data to find that the agglomeration of resource factors towards eastern cities with better locational conditions (such as Luoyang and Xiangyang) is an important structural reason leading to the relatively lagging development of the western deep mountainous areas. This meso-scale perspective does not replace county- or village-level studies, but rather complements them by revealing broader regional structures and cross-jurisdictional differentiation that are difficult to capture through micro-scale analysis alone.
In terms of spatial effects, this study provides a dynamic empirical complement to existing discussions on the socio-ecological vulnerability of mountainous areas. Exploring the sustainable development of mountainous areas is often inseparable from the consideration of their system resilience and external constraints. Bai et al. [
46] and Li et al. [
47] pointed out that the poverty-alleviated villages in the Qinba Mountains are affected by the dual impacts of ecological fragility and population loss, and the system’s ability to resist external risks is relatively weak. By introducing the Spatial Markov Chain model, this study finds that rural development in deep mountainous areas is constrained not only by weak endogenous dynamics, but also by the “negative screening effect” of surrounding low-level areas. This spatial lock-in phenomenon caused by geographical isolation and the lagging surrounding environment explains why the spatial resilience of traditional villages in complex mountainous areas exhibits significant differentiation characteristics (as pointed out by Li et al. [
48] in their multi-scale remote sensing analysis). This also extends conventional static spatial agglomeration analysis, such as Moran’s I, by adding a dynamic neighborhood perspective.
Regarding the evolution of driving mechanisms, this study captures the stage-wise shifts in the relative roles of natural constraints and economic factors. Previous Geodetector-based studies mostly focused on static attribution at a certain time cross-section [
45,
51], making it difficult to reflect the conversion of driving forces under policy cycle alternations. Through time-series analysis, this study finds that the interaction between Terrain Relief Amplitude (F1) and Road Network Density (F6, representing infrastructure) weakened significantly in the later period, whereas its interaction with Per Capita Retail Sales of Consumer Goods (F7, representing consumer market conditions) strengthened markedly. This changing trend echoes current discussions on the policy orientation of China’s rural revitalization [
52], indicating that the pulling effect of traditional engineering infrastructure in the Qinba Mountains is showing marginal diminishing returns. This suggests that future development should place greater emphasis on adapting to the natural background and improving the conversion of ecological and terrain-related resources into viable consumption and economic value. This aligns with the research by Yuan et al. [
49] on the relationship between ecological services and rural tourism in southern Shaanxi, and the mechanism of “agri-tourism integration driving rural revitalization” discussed by Ma et al. [
50]. Overall, the results indicate that an adaptive development model grounded in the natural background has become an increasingly important pathway for sustainable rural transformation in the Qinba Mountains in the post-poverty alleviation era.
4.2. Diminishing Returns to Infrastructure, Factor Mismatch, and Adaptive Development
In conventional regional development thinking, intensive infrastructure investment and the physical overcoming of terrain barriers are often regarded as major drivers of economic growth in poor mountainous areas. However, the interaction detection results of this study suggest a more complex pattern. In deeply rugged mountainous areas, further increases in road network density appear to generate much weaker developmental returns (e.g., in 2023, q(F1∩F6) was only 0.055); similarly, the combination of fiscal input and infrastructure construction did not necessarily produce a stronger joint effect, and in some cases even showed attenuation (e.g., in 2017, q(F6∩F10) fell to 0.156). Rather than indicating a data anomaly, these results point to structural changes in the development logic of the rural territorial system in the Qinba Mountains after the elimination of absolute poverty:
First, the marginal effect of infrastructure expansion under severe terrain constraints appears to have weakened, and the development returns of engineering-led barrier reduction have declined. The weakened interaction effect between terrain and road network density (F1∩F6) in 2023 is consistent with the diminishing marginal returns of infrastructure investment in mountainous areas. Before 2015, the improvement of major transportation corridors helped the Qinba Mountains establish cross-regional connectivity and generated substantial developmental benefits. By 2023, however, when infrastructure construction increasingly extended into deeply dissected terrain areas, the marginal cost of further road expansion rose markedly. At the same time, population outflow and scattered settlement patterns reduced the ability of additional road expansion to stimulate broader regional development. Under these conditions, a further physical increase in road network density alone is no longer sufficient to drive factor agglomeration effectively. This suggests that relying solely on high-intensity engineering to overcome deep mountainous terrain is approaching the limits of economic efficiency.
Second, the interaction between fiscal input and hard infrastructure points to a stage-specific risk of resource mismatch. The marked decline in the interaction effect between road network density and fiscal input (q(F6 ∩ F10) = 0.156) in 2017 suggests that resource allocation inefficiencies may have emerged during the policy transition period. The year 2017 represented an important transition period between targeted poverty alleviation and rural revitalization. Although some areas received substantial fiscal transfers (F10), if these funds continued to be invested mainly in traditional infrastructure sectors (F6) with already declining marginal returns, rather than in urgently needed industrial support facilities or public service improvement, their conversion into effective development outcomes could be limited. In ecological function zones such as Shiyan (the Danjiangkou Reservoir area) in Hubei, stricter environmental protection constraints also limited the expansion of traditional infrastructure projects, further weakening the developmental conversion efficiency of fiscal funds. This suggests that, in the post-poverty alleviation era, policy support should gradually shift from broad-based infrastructure subsidies toward more targeted industrial support and public service improvement.
Finally, the contrasting changes in interaction effects reflect an adaptive reconfiguration of the human–earth relationship under changing development conditions. It is noteworthy that while the interaction effect between terrain and road network density (F1 ∩ F6) became very weak in 2023, the interaction between terrain and the consumer market (F1 ∩ F7) remained extremely strong (q = 0.987). This contrast suggests that the development logic of the Qinba Mountains is undergoing adjustment: the traditional approach of relying mainly on engineering measures to reduce terrain-related barriers is becoming less effective, while a new path based on adapting to terrain conditions and developing place-based consumption economies is gaining importance. This trend can be observed in places such as Luanchuan in Henan, Liuba in Shaanxi, and Enyang in Sichuan. Rather than relying primarily on terrain-flattening infrastructure expansion or conventional land-intensive industries, these areas have increasingly made use of their distinctive topography and landscapes to develop mountain tourism, ecological health care, and other place-based activities. Under such conditions, terrain-related disadvantages may, in some contexts, be partially converted into differentiated development opportunities that attract urban consumption. More broadly, this suggests that the sustainability of rural revitalization in mountainous areas depends less on continuously intensifying the effort to overcome natural constraints, and more on improving the capacity to realize the economic and ecological value embedded in the natural background.
4.3. Limitations and Future Research
While this study provides a meso-scale perspective on the spatiotemporal differentiation, structural characteristics, and staged driving mechanisms of rural revitalization in the Qinba Mountains, several limitations should still be acknowledged. First, due to the constraints of long-term and cross-provincial statistical data availability, the prefecture-level city was adopted as the basic analytical unit. This scale is well suited to identifying broad regional patterns, cross-jurisdictional differentiation, and long-term evolutionary characteristics, but it cannot fully reflect the heterogeneity that may exist within counties, townships, and villages. In particular, some village-specific revitalization obstacles and localized development traps are more appropriately examined at finer spatial scales. Second, the rural governance subsystem (U4) in this study was constructed mainly with indicators that possess relatively strong continuity, comparability, and statistical accessibility in long-term panel data under the Chinese institutional context. These indicators can reflect the progress of formal and institutionalized governance to a considerable extent, but they do not fully capture softer governance dimensions in mountainous rural areas, such as clans, local notables, and other embedded village-level governance mechanisms. Such dimensions are often more suitable for identification through village-level investigation and micro-scale empirical analysis. Future research could therefore further integrate meso-scale regional analysis with county- and village-level evidence, so as to promote a more complete understanding of rural revitalization mechanisms in topographically complex regions.
5. Conclusions
Viewing the Qinba Mountains as a cross-provincial macro-giant system, based on panel data from 2009 to 2023, this study comprehensively applies a multi-dimensional evaluation system, the Coupling Coordination Degree model, Markov Chain (including traditional and spatial models), spatial autocorrelation, and Geodetector to quantitatively analyze the spatiotemporal evolution rules and driving mechanisms of the synergistic level of rural revitalization in this region. The study objectively reveals the spatial differentiation characteristics, neighborhood interactive effects, and stage-wise changes in external factor acting forces in China’s complex mountainous areas during different policy stages, providing empirical evidence for optimizing cross-regional spatial governance and achieving sustainable development. The main conclusions are as follows:
- (1)
The synergistic level of regional rural revitalization shows a steady upward trend, but the macro spatial non-equilibrium pattern remains solidified. Between 2009 and 2023, the Coupling Coordination Degree of rural revitalization in the Qinba Mountains evolved overall from a low-level run-in stage to a medium–high-level synergistic stage. However, trend surface analysis indicates that, constrained by differences in natural geographical conditions and locational foundations, the interior of the region has long maintained a spatial distribution structure where eastern basin cities lead and western deep mountainous cities relatively lag behind. This indicates that against the backdrop of an overall improvement in the development level, the long-term restrictive role of geographical environmental endowments on regional high-level synergistic development still exists, objectively requiring full respect for and adaptation to this spatial heterogeneity during policy formulation.
- (2)
The dynamic evolution of synergistic states exhibits strong “path dependence” and “bidirectional neighborhood constraints”, which consequently shape a significant spatial agglomeration pattern. Transition probability analysis based on traditional and Spatial Markov chains reveals that the evolution of various cities is not only restricted by the “lock-in” of their own initial states (making cross-grade leaping difficult), but also highly dependent on the development level of surrounding areas. A low-level neighborhood generates a significant “Negative Screening Effect” that suppresses local upward transition, while a high-level neighborhood effectively accelerates regional synergistic development. Driven by such dynamic spillover and lock-in effects in the long term, spatial autocorrelation analysis further confirms that the Qinba Mountains have ultimately formed a high-value agglomeration belt distributed along the “Guanzhong Plain–Han River Valley” line, and a low-value lock-in plate concentrated in the deep mountain border areas. This chain effect from dynamic constraints solidifying into static agglomeration indicates that independent development within a single administrative division makes it difficult to effectively solve the overall synergistic problems of mountainous areas.
- (3)
The core driving mechanism presents a stage-wise transition from infrastructure-dominated to the synergistic dominance of market consumption and natural factors. In the early stage of the study, traditional infrastructure construction such as Road Network Density had a decisive pulling effect on elevating the level of rural revitalization. However, as time progressed, the marginal utility of large-scale engineering construction gradually diminished, and the interactive explanatory power between Terrain Relief Amplitude and Road Network Density decreased significantly in 2023. Meanwhile, an extremely strong synergistic enhancement effect formed between Terrain Relief Amplitude and consumer market vitality. This reflects that the development momentum of the Qinba Mountains has gradually reduced its reliance on traditional engineering infrastructure and shifted towards an adaptive evolutionary stage relying on the natural ecological background and developing green consumption and characteristic industries.
- (4)
Policy intervention in the Qinba Mountains should move beyond broad infrastructure expansion toward more targeted cross-regional coordination, resilience-oriented public investment, and place-based value realization. This shift is necessary in light of three major findings of the study: the diminishing marginal returns of road network expansion, the possible mismatch between fiscal input and hard infrastructure, and the growing importance of the interaction between terrain, market vitality, and informatization in the later stage of rural revitalization.
First, infrastructure policy in deep mountainous areas should place greater emphasis on integrated service efficiency rather than simply increasing physical road density. As the interaction effect between terrain and road network density weakened markedly in the later period, future investment should focus less on extensive road expansion in highly rugged terrain and more on improving transport connectivity, logistics efficiency, digital infrastructure, and the long-term maintenance of existing rural facilities.
Second, the risk of factor mismatch identified in the interaction between fiscal input and infrastructure suggests the need for more coordinated cross-regional development arrangements. In particular, low-value neighboring regions in interprovincial border areas should be supported through stronger institutional coordination, including horizontal ecological protection compensation mechanisms and cross-regional co-construction parks such as enclave industrial parks, so as to promote factor sharing, industrial linkage, and more balanced development across administrative boundaries.
Third, because the interaction between terrain, market circulation, and informatization became much stronger in the later stage, the next phase of rural revitalization in the Qinba Mountains should pay greater attention to ecological product value realization, mountain tourism, digital circulation, and other place-based development activities. Rather than attempting to eliminate terrain constraints through engineering alone, policy should increasingly focus on transforming natural and ecological endowments into sustainable development opportunities under conditions of improved market access and information connectivity.