Article

Towards Sustainable Urban Mobility: An Experimental Study on Vibration and Noise of Elevated Rail Transit at Different Train Speeds


1
MOE Engineering Research Center of Railway Environmental Vibration and Noise, East China Jiaotong University, Nanchang 330013, China
2
State Key Laboratory of Safety and Resilience of Civil Engineering in Mountain Area, East China Jiaotong University, Nanchang 330013, China
3
State Key Laboratory of Bridge Intelligent and Green Construction, Southwest Jiaotong University, Chengdu 611756, China
*
Author to whom correspondence should be addressed.
Sustainability 2026, 18(7), 3296; https://doi.org/10.3390/su18073296
Submission received: 14 February 2026 / Revised: 9 March 2026 / Accepted: 25 March 2026 / Published: 27 March 2026
(This article belongs to the Special Issue Innovative Strategies for Sustainable Urban Rail Transit)

Abstract

Vibration and noise generated by rail transit systems pose significant constraints on their environmental sustainability. Although extensive research has been conducted by scholars on vibration and noise in rail transit, quantitative studies specifically investigating the influence of train speed on the vibration and noise of elevated rail transit are scarce. Therefore, this study selected a typical elevated section of Wuhan Metro Line 21 and systematically performed field tests to measure the vibration and noise induced by trains passing at speeds of 20, 40, 60 and 80 km·h−1. Based on the test results, the vibration characteristics of the rails, track slab, and bridge structure, as well as the radiation characteristics of wheel–rail noise and bridge structure-borne noise under different speeds, were investigated. The study further explored the impact of train speed variation on the vibration and noise of the elevated rail transit system. The results indicate that the vibration acceleration levels of both the outer and inner rails increase significantly with train speed. Each time the speed doubles, the vibration level rises by approximately 11.5 dB for the outer rail and 10.0 dB for the inner rail. The vibration of the track slab and bridge structure is notably lower than that of the rails. Each time the speed doubles, the vibration acceleration level at various measurement points increases by an average of about 8.5–9.0 dB. Wheel–rail noise is primarily concentrated in the frequency bands around 630 Hz and 3150 Hz. Each time the speed doubles, the trackside noise level increases by an average of approximately 7.2–7.6 dB(A). Noise measured under the bridge shows a distinct peak around 100 Hz, which aligns with the vibration frequency of the bottom slab. Due to the shielding effect of shrubs, noise in the 63–100 Hz frequency band is attenuated at measurement points above ground level. Each time the speed doubles, bridge structure-borne noise increases by about 4.5–5.0 dB(A), representing a lower growth rate compared to wheel–rail noise. The findings of this research are expected to contribute to vibration and noise reduction strategies and support the sustainable development of rail transit systems.

1. Introduction

Studies show that urban rail transit is playing an increasingly important role in facilitating public mobility, promoting urban development, and driving the integrated growth of metropolitan areas and city clusters. By the end of 2025, a total of 58 cities in mainland China had put 382 urban rail lines into operation, with a total network length exceeding 13,000 km. Elevated lines, due to their lower construction difficulty, faster implementation speed, and cost at only about one-quarter to one-third of that for underground lines, have been widely adopted in urban rail transit systems. As a cost-effective and efficient transit solution, elevated rail plays a crucial role in enhancing the sustainability of urban transportation networks. However, the vibration and noise generated by trains running on elevated structures have caused various adverse impacts on the surrounding environment and residents’ quality of life.
Traffic-induced vibration and noise not only affect the work and daily life of residents along the lines but also impact passenger comfort. Existing studies have shown that the human body’s response to whole-body vibration exhibits significant frequency dependence. Vibrations in the low-frequency range are associated with reduced comfort, fatigue, and potential health risks; specifically, vertical vibrations around 4–8 Hz are more likely to cause noticeable discomfort or resonant responses [1,2]. Long-term exposure to traffic noise, on the other hand, tends to induce annoyance [3,4,5,6,7].
Regarding research on wheel–rail noise, Thompson et al. [8,9] developed the wheel–rail noise prediction software TWINS and conducted two sets of running tests for its verification. These tests separately investigated the pass-by noise and vibration responses of passenger trains at 50–160 km·h−1 and freight trains at 60 and 100 km·h−1. The results indicated a generally good linear correlation between predicted and measured values across a wide speed range, although accuracy remains limited by uncertainties in wheel–rail roughness and contact position. Subsequently, Li [10] evaluated the feasibility of wheel–rail noise separation and roughness inversion methods based on pass-by noise measurements, noting that identifying the overall sound pressure level is somewhat feasible, but significant errors persist in spectrum and roughness estimations. Thompson et al. [11] further systematically evaluated several wheel–rail noise separation methods through controlled field tests, finding that most methods can estimate the track noise component relatively accurately, but direct identification of the wheel noise component remains unsatisfactory. In the context of urban rail operations, Lázaro et al. [12], based on measurements from the Porto light rail network, found that noise levels increase with operating speed, with the frequency band around 1000 Hz being significant, and that small-radius curves and metallic bridges further elevate noise levels.
Regarding research on bridge structure-borne noise, Gao et al. [13] conducted field measurements on the continuous box girder of Beijing Metro Line 5. Their study primarily focused on the spatial distribution of noise under fixed operating conditions, rather than systematically investigating its variation with speed. Through field measurements and analyses using transfer functions and coherence functions, Ngai and Ng [14] indicated that concrete box girder bridge structure-borne noise shows good correlation with bridge vibration, with a dominant frequency range of 20–157 Hz. Li et al. [15] performed field vibration and noise tests on a 30 m simply supported box girder and further compared the vibration and noise reduction effectiveness of different track structures. Hsu [16] conducted measurements and parametric analysis on both concrete and steel box girders in urban metro systems, noting that the sensitivity to train speed is not consistent across different bridge types and structural components. Gao et al. [17] investigated the influence of track modeling strategies on the prediction of bridge structure-borne noise.
Regarding studies on the influence of train speed, He et al. [18], based on tests conducted on the elevated section of Shanghai Metro Line 3, indicated that the primary noise sources for urban rail elevated lines are wheel–rail noise and bridge structure-borne noise. They further proposed that as train speed increases, the contribution of wheel–rail noise to the overall noise level rises, while the relative contribution of structure-borne noise decreases. Lázaro et al. [12] measured the noise generated by Flexity Swift trains operating at 64, 75, and 82 km·h−1 and by Eurotram trains at 40, 50, and 60 km·h−1. However, their findings only provided a qualitative conclusion that noise increases with speed, lacking a quantitative analysis. In our previous study [19], a numerical model was established to analyze the effect of speed. The model concluded that a doubling of the train speed leads to increases in the overall noise level of 6.32 dB(A) and 5.96 dB(A) at distances of 30 m and 120 m from the track centerline, respectively. Yet, this conclusion lacked experimental validation.
Although scholars have conducted extensive research on vibration and noise in rail transit, quantitative studies on the influence of train speed on vibration and noise in elevated rail transit systems have not yet been reported. Therefore, this paper selects a typical elevated section of Wuhan Metro Line 21 to systematically carry out field tests on vibration and noise generated by trains passing at speeds of 20 km·h−1, 40 km·h−1, 60 km·h−1, and 80 km·h−1. Based on the test results, the amplitude-frequency characteristics of vibration and noise from the elevated rail transit, as well as their variation patterns with train speed, are analyzed. The study is dedicated to providing theoretical support and practical guidance for the prediction analysis and control strategy formulation of vibration and noise in elevated rail transit systems, ultimately contributing to the sustainable development of cities by promoting greener and more socially acceptable rail transportation.

2. Overview of the Test

2.1. Test Section

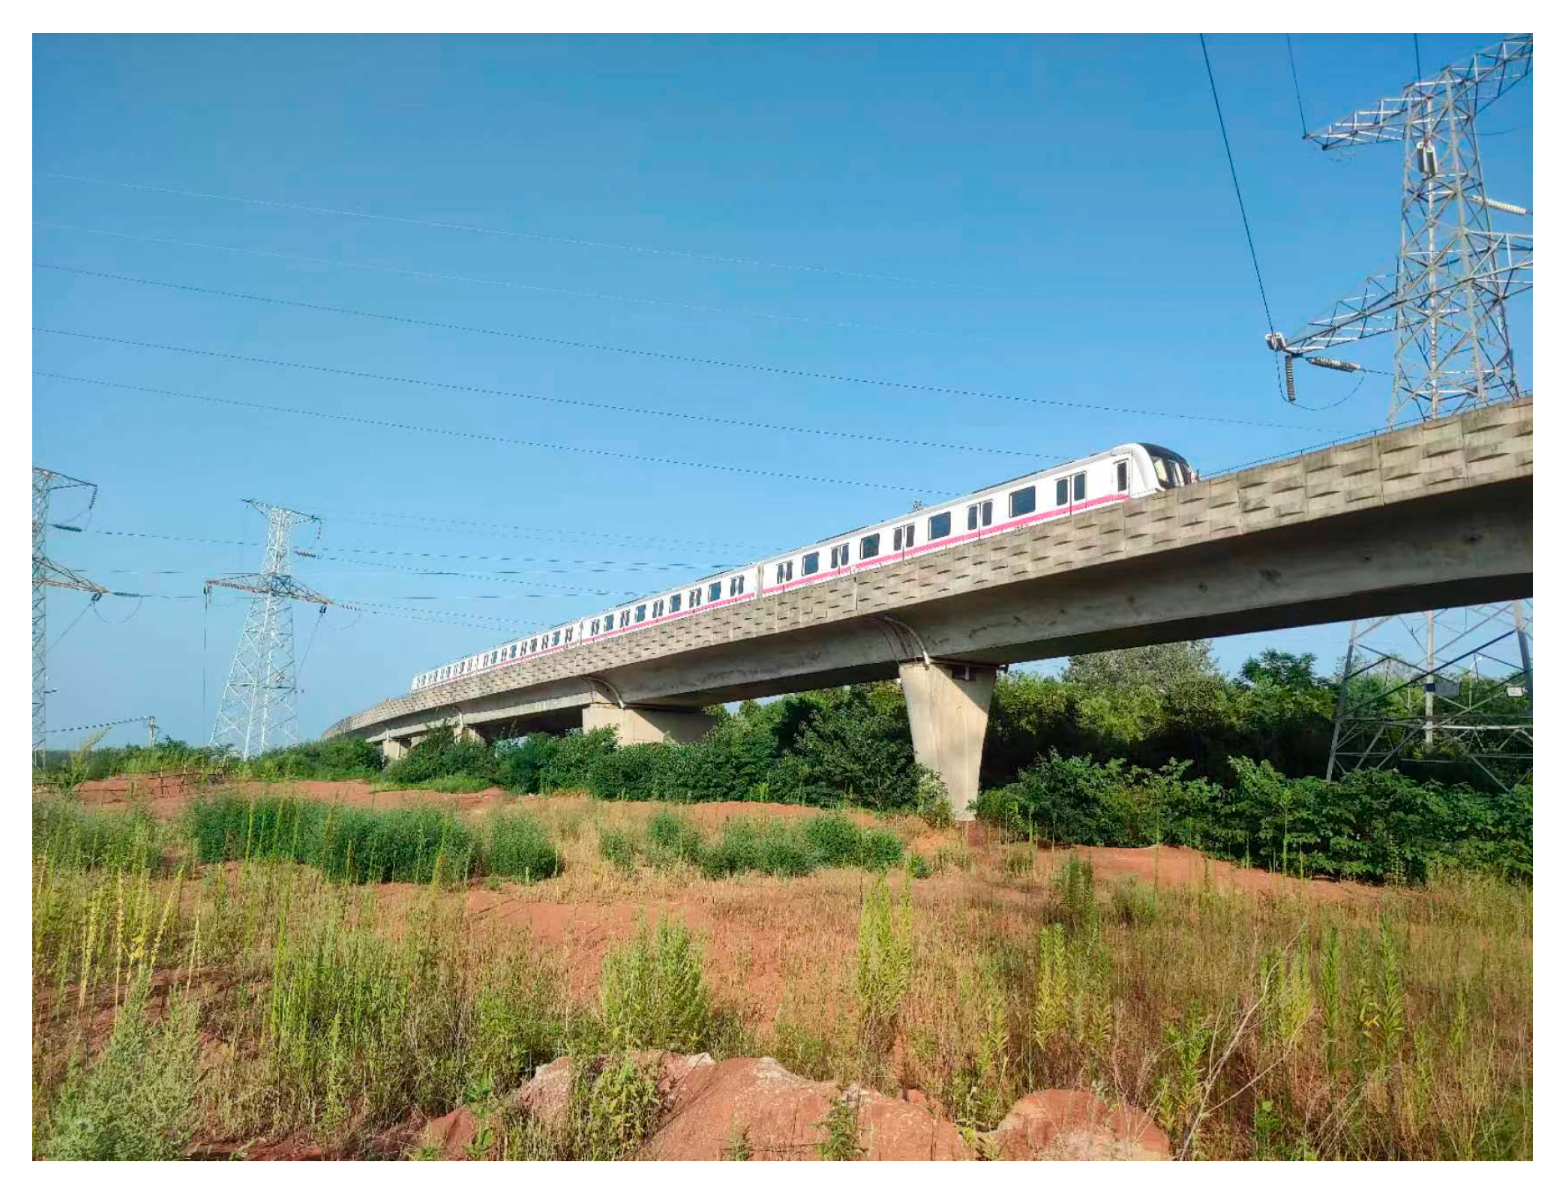
To systematically investigate how train speed influences the vibration and noise of elevated rail transit, an elevated section of Wuhan Metro Line 21 was adopted as the test site. Measurements of vibration and noise were conducted during train passages at speeds of 20, 40, 60, and 80 km·h−1, as illustrated in Figure 1. Wuhan Metro Line 21 is the eighth metro line to commence operation in Wuhan, Hubei Province, China, opening on 26 December 2017. The elevated section of this line features a concrete box girder structure supported by spherical steel bearings. The span of the girder is 30 m, with a width of 9.3 m and a height of 1.8 m. The distance between the two track centerlines is 4.2 m, and the underside of the girder is approximately 4.8 m above the ground. The track structure on the bridge is a monolithic track bed with short sleeper bearing blocks, utilizing CHN60 rails and WJ-2A elastic separated fasteners. The trains on this line consist of 4-car A-type train sets, operating at a maximum speed of up to 100 km·h−1.

2.2. Measurement Points

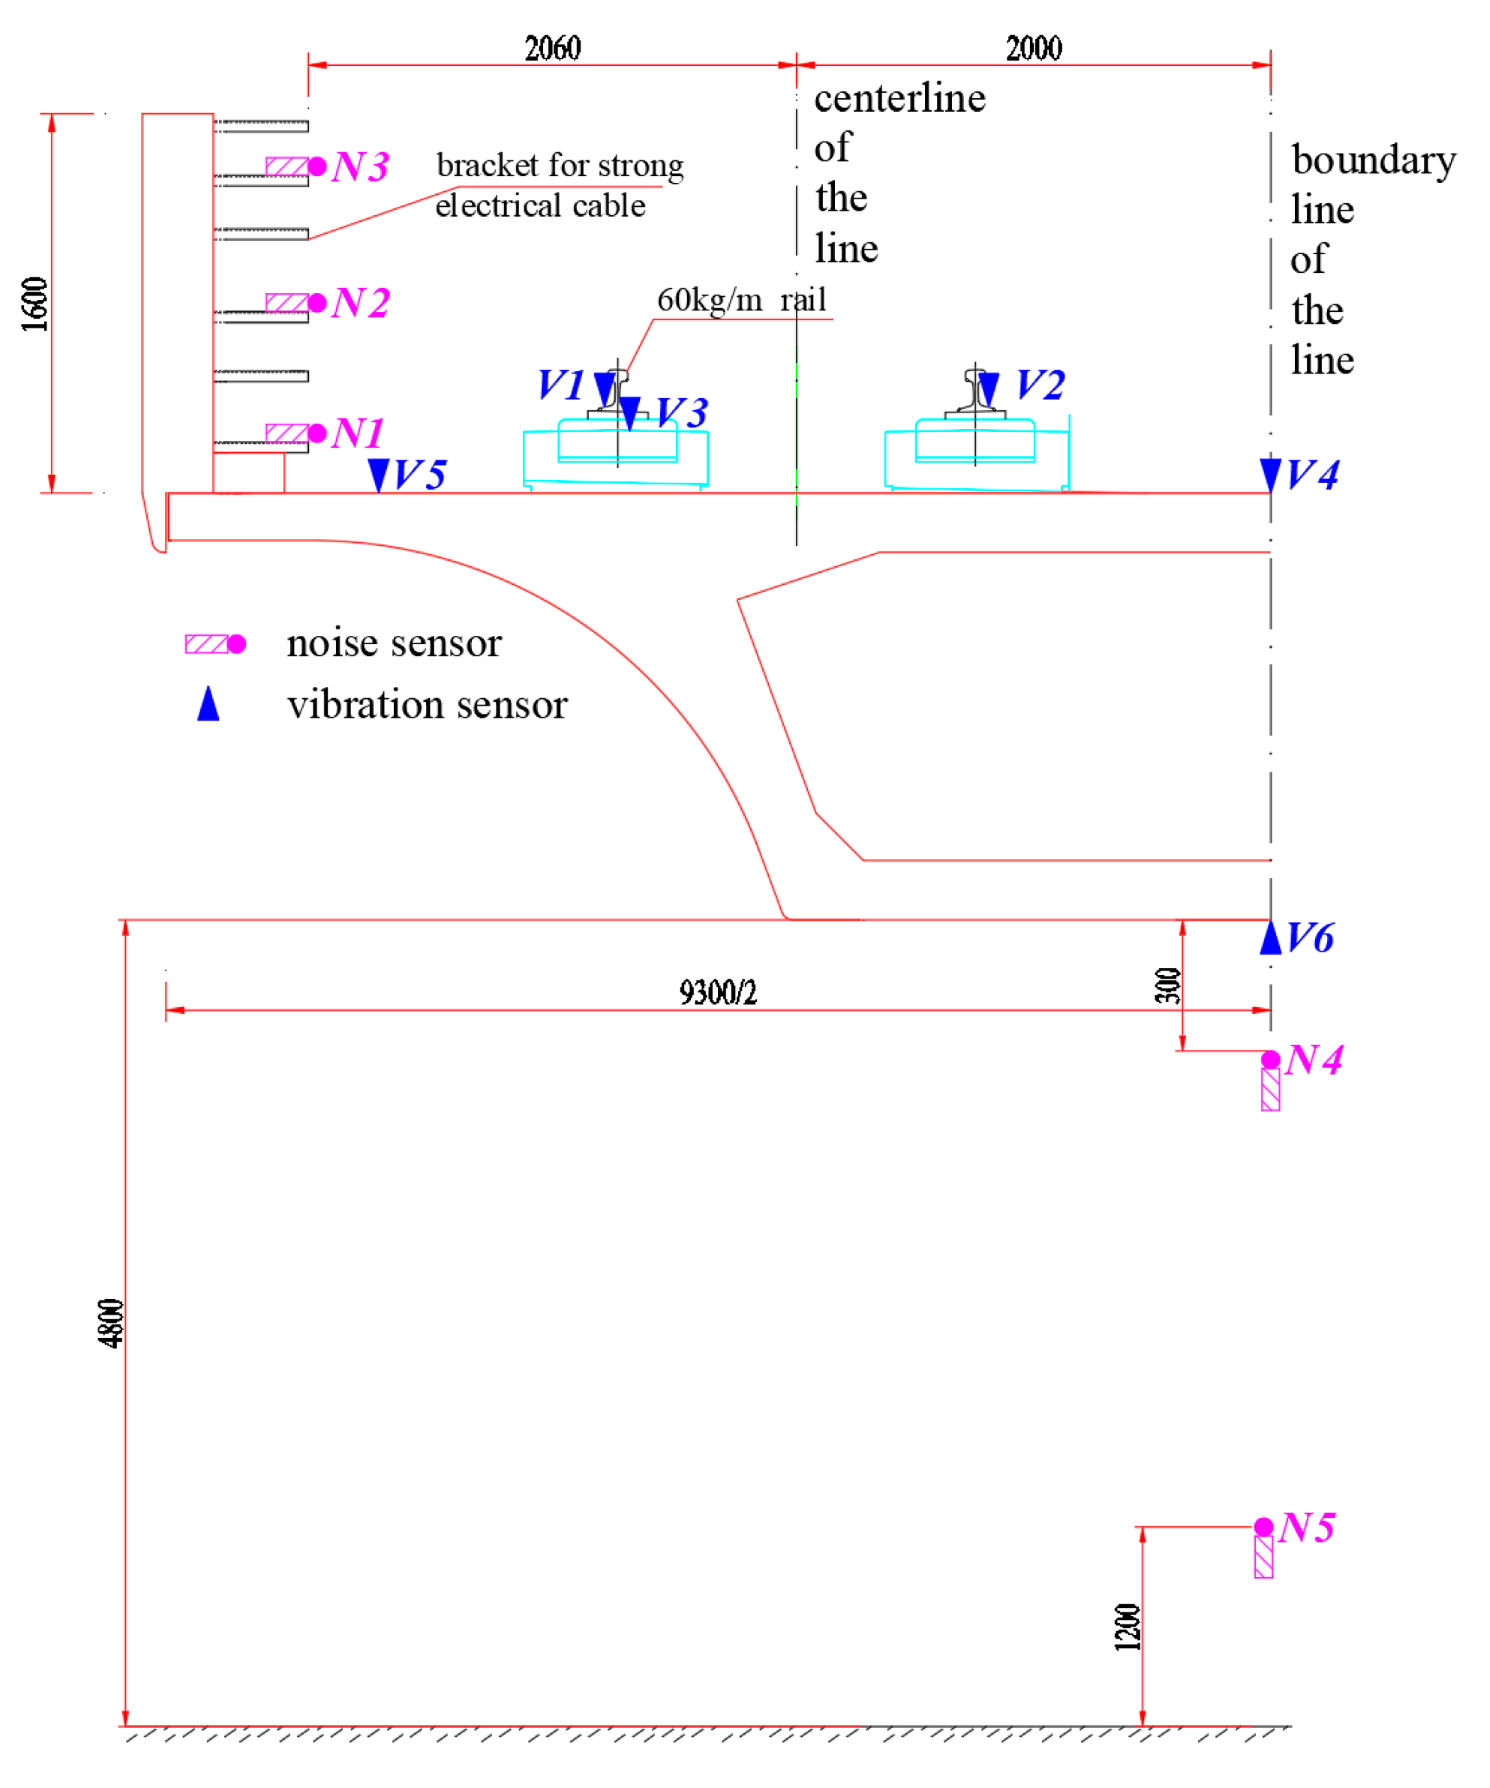
The test section was located at the mid-span cross-section of the elevated bridge. The layout of the vibration and noise measurement points is depicted in Figure 2. Vibration acceleration sensors (V1 to V6) were installed at six locations: beneath the outer rail, beneath the inner rail, on the track slab, at the center of the top slab, on the flange slab, and at the center of the bottom slab. These sensors recorded the vibration of the track and box girder as trains passed. Acoustic sensors (N1 to N3) were mounted at different heights on the cable bracket of the box girder’s flange to record rail-wheel noise during train passages. Additionally, acoustic sensors N4 and N5 were positioned directly below the girder—specifically, 0.3 m from the bottom slab and 1.2 m above the ground, respectively—to measure the structure-borne noise emitted from the bridge.

2.3. Testing Equipment

Rail vibration was measured using PCB 352C04 accelerometers (USA), which have a sensitivity of approximately 10 mV/g, a measuring range of ±500 g, and a frequency response range of 0.5 to 10,000 Hz. The vibration of the track slab and bridge structure was measured using PCB 353B04 accelerometers (USA), which have a sensitivity of approximately 1000 mV/g, a frequency response range of 0.06 to 450 Hz, and a measuring range of ±5 g. Noise measurements were conducted with GRAS 46AG free-field microphones (Denmark). These microphones have a sensitivity of about 12 mV/Pa, a frequency response range of 3.15 Hz to 20 kHz, and a measuring range of 25 dB(A) to 164 dB. All sensors were calibrated prior to testing.

2.4. Test Conditions

The test conditions are summarized in Table 1. Trains passed through the test section at speeds of 20, 40, 60, and 80 km·h−1 to investigate the impact of vehicle speed on the vibration and noise of the continuous girder elevated segment in urban rail transit. To guarantee the validity of the test data, data collection was performed at night when ambient noise was negligible. Five runs were performed for each speed condition, all using the same empty 4-car A-type metro train. The train speed was controlled by the driver and verified using optical pulse triggers installed at the test section and 30 m away. The speed, determined by the time difference between the activation of the two optical signals, was controlled with an accuracy of within ±2 km·h−1. During the test, the temperature was 25 °C, humidity was 63%, wind speed was less than 5 m/s, and there was no rainfall. Each test case is designated by a combination of speed and run number (e.g., v60-3 denotes the third run at a speed of 60 km·h−1).

2.5. Data Validation

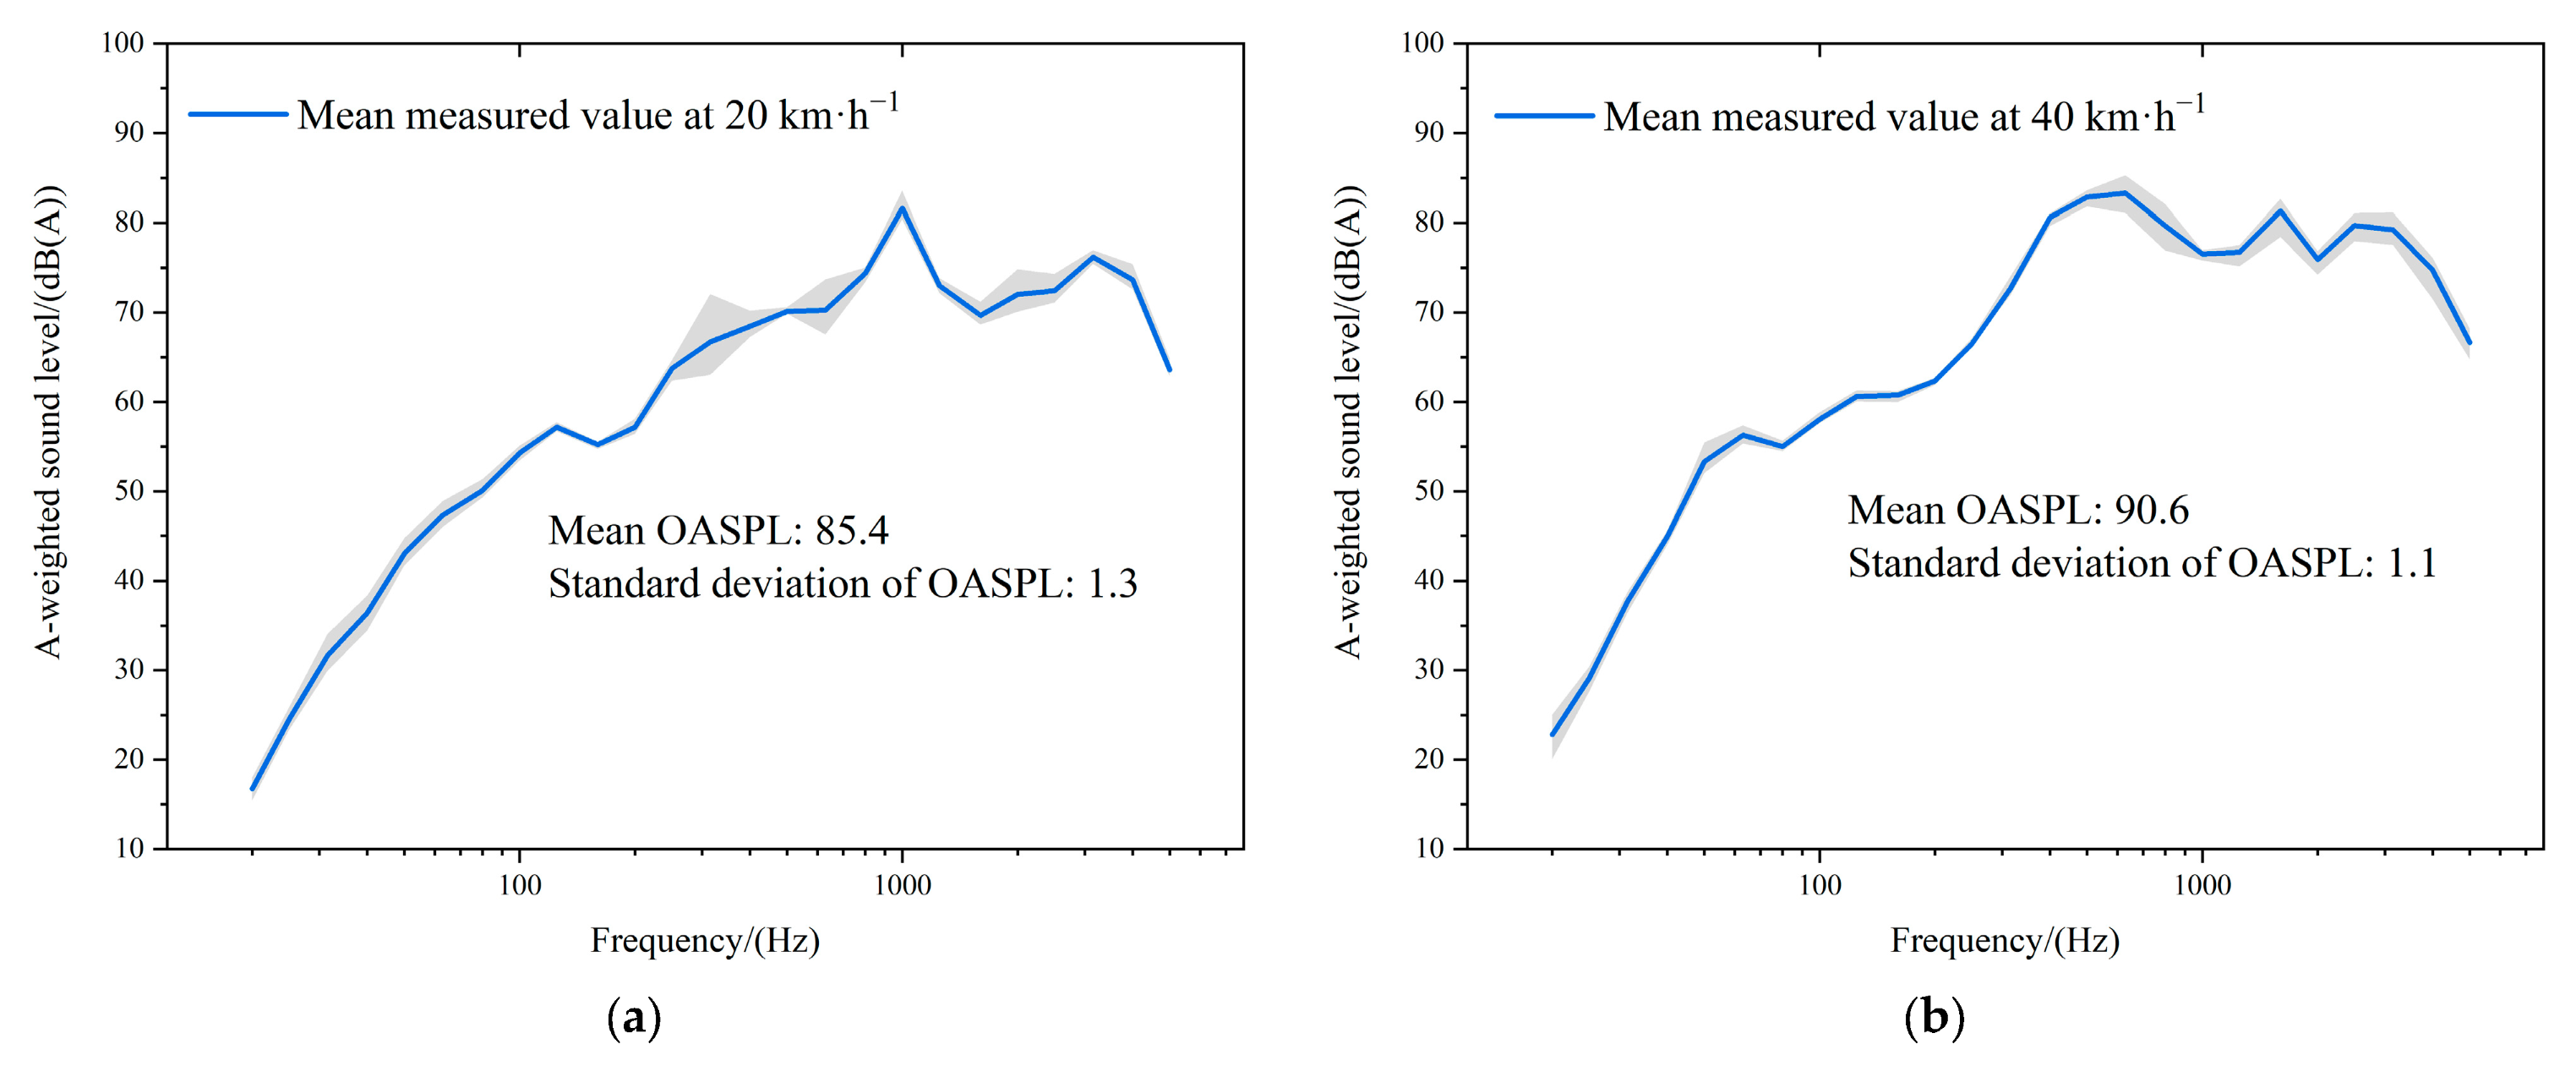
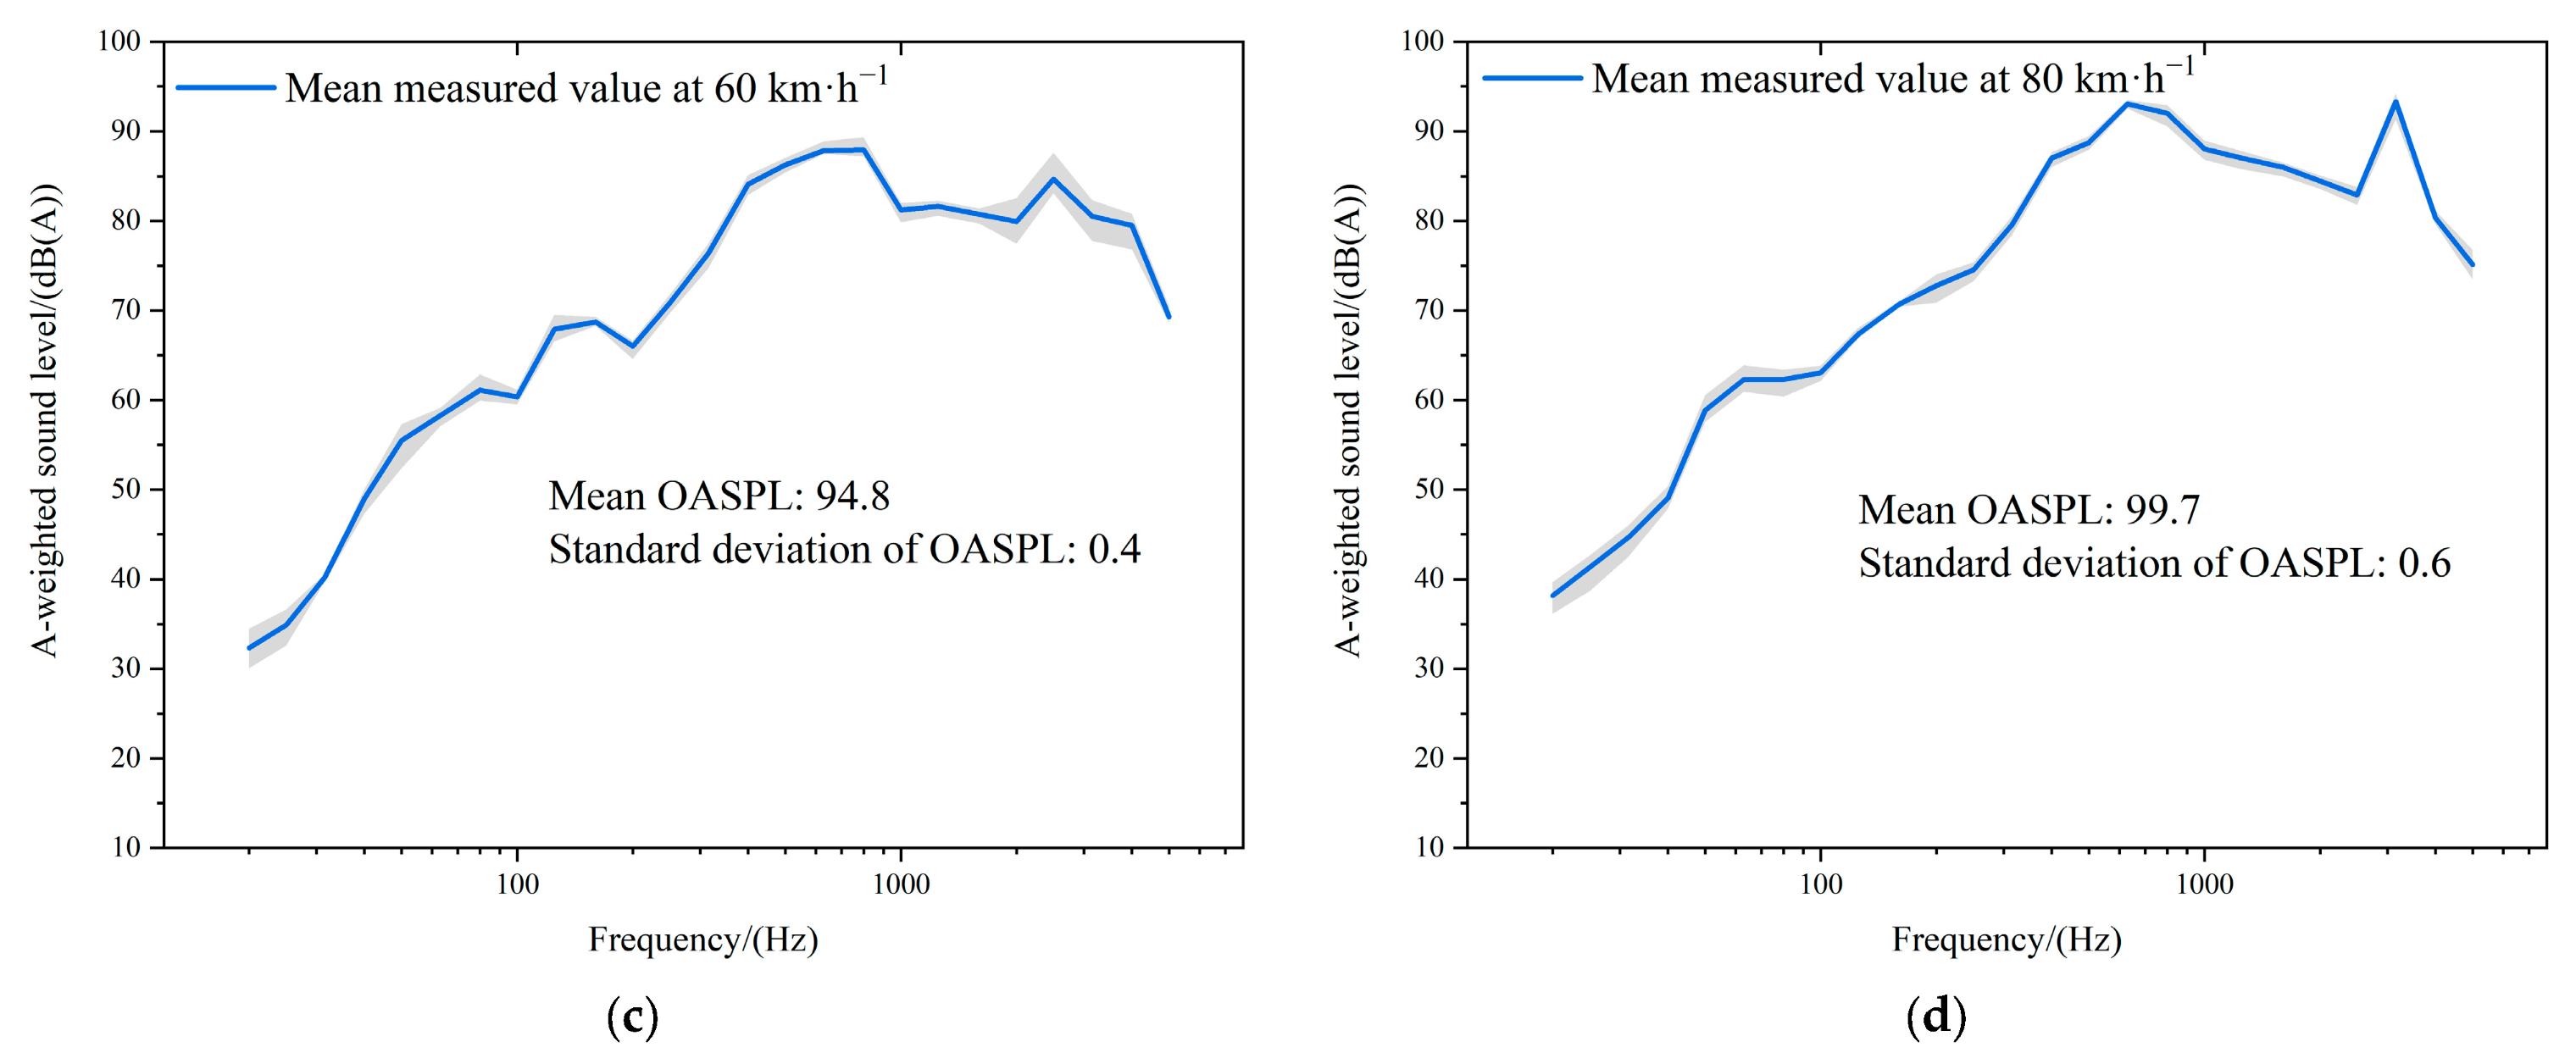
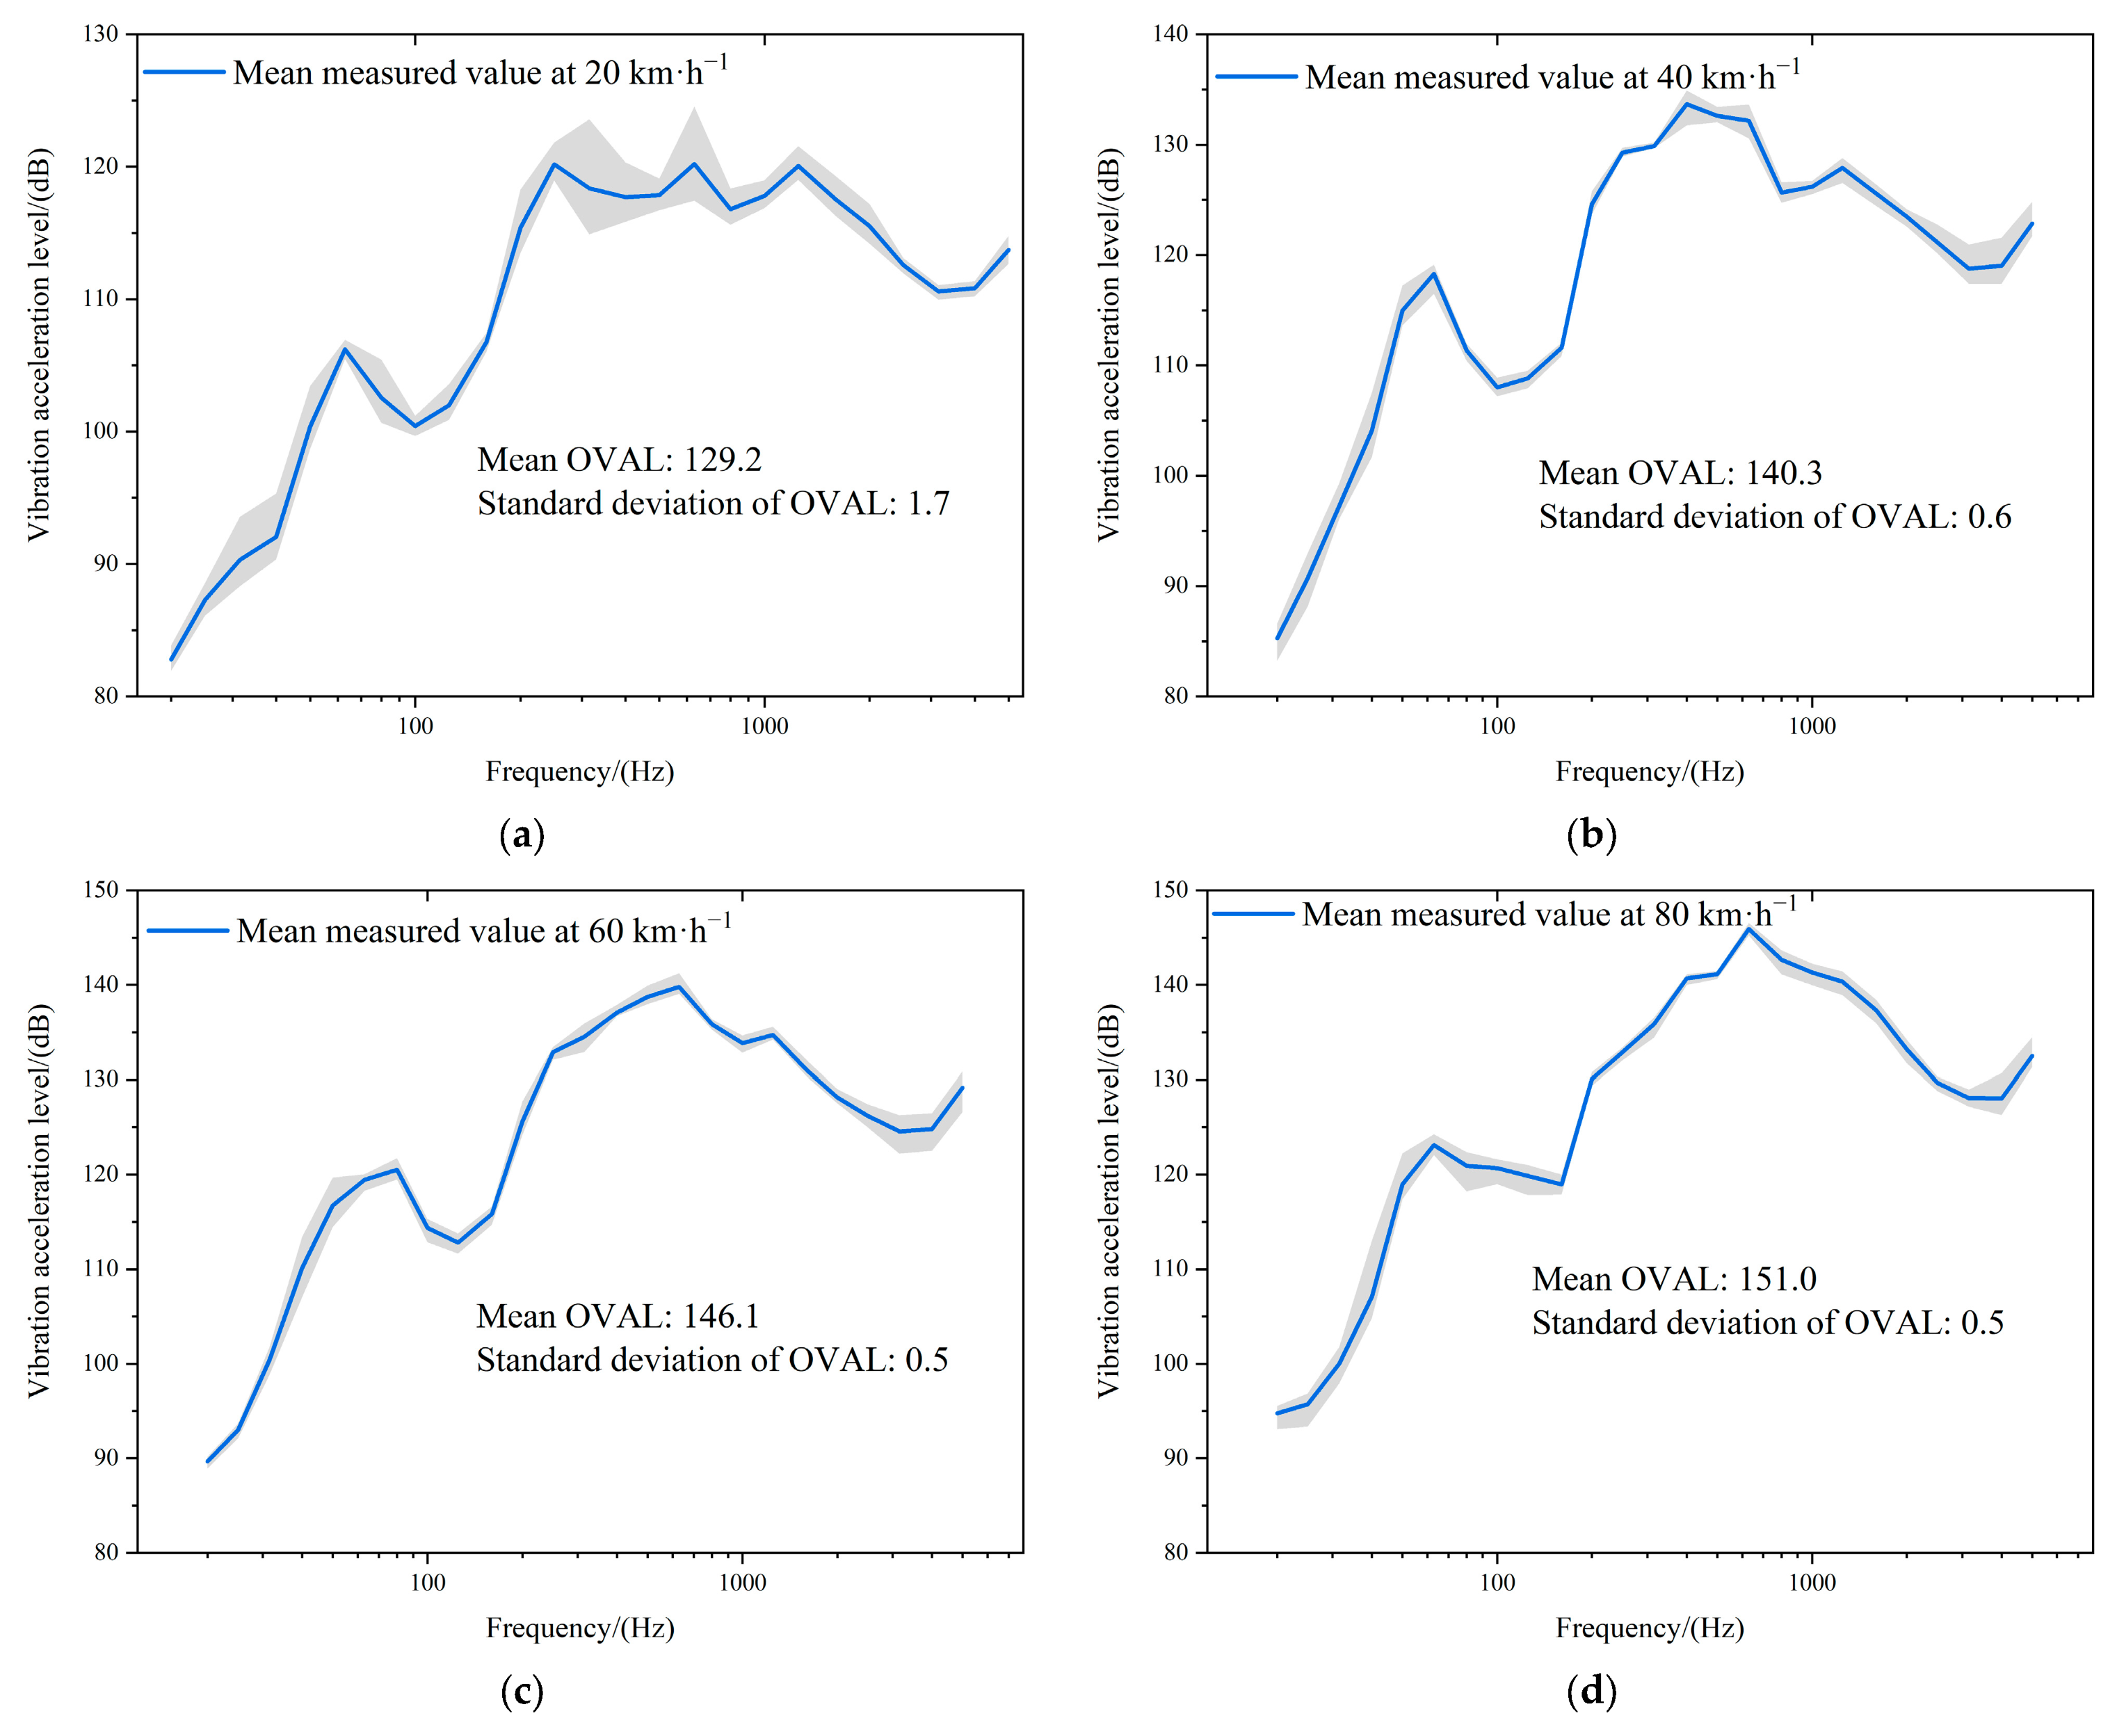
To validate the effectiveness of the test data, the measurement results from vibration measurement point V1 and noise measurement point N2 under different train speeds are presented in Figure 3 and Figure 4, respectively. In the figures, the shaded area represents the envelope of the results from the five test runs at each corresponding speed, while the solid line denotes the average of those five runs. It can be observed that the results from the five runs at the same speed exhibit only minor fluctuations, which demonstrates the validity of the test data.

3. Analysis of Test Results

3.1. Rail Vibration

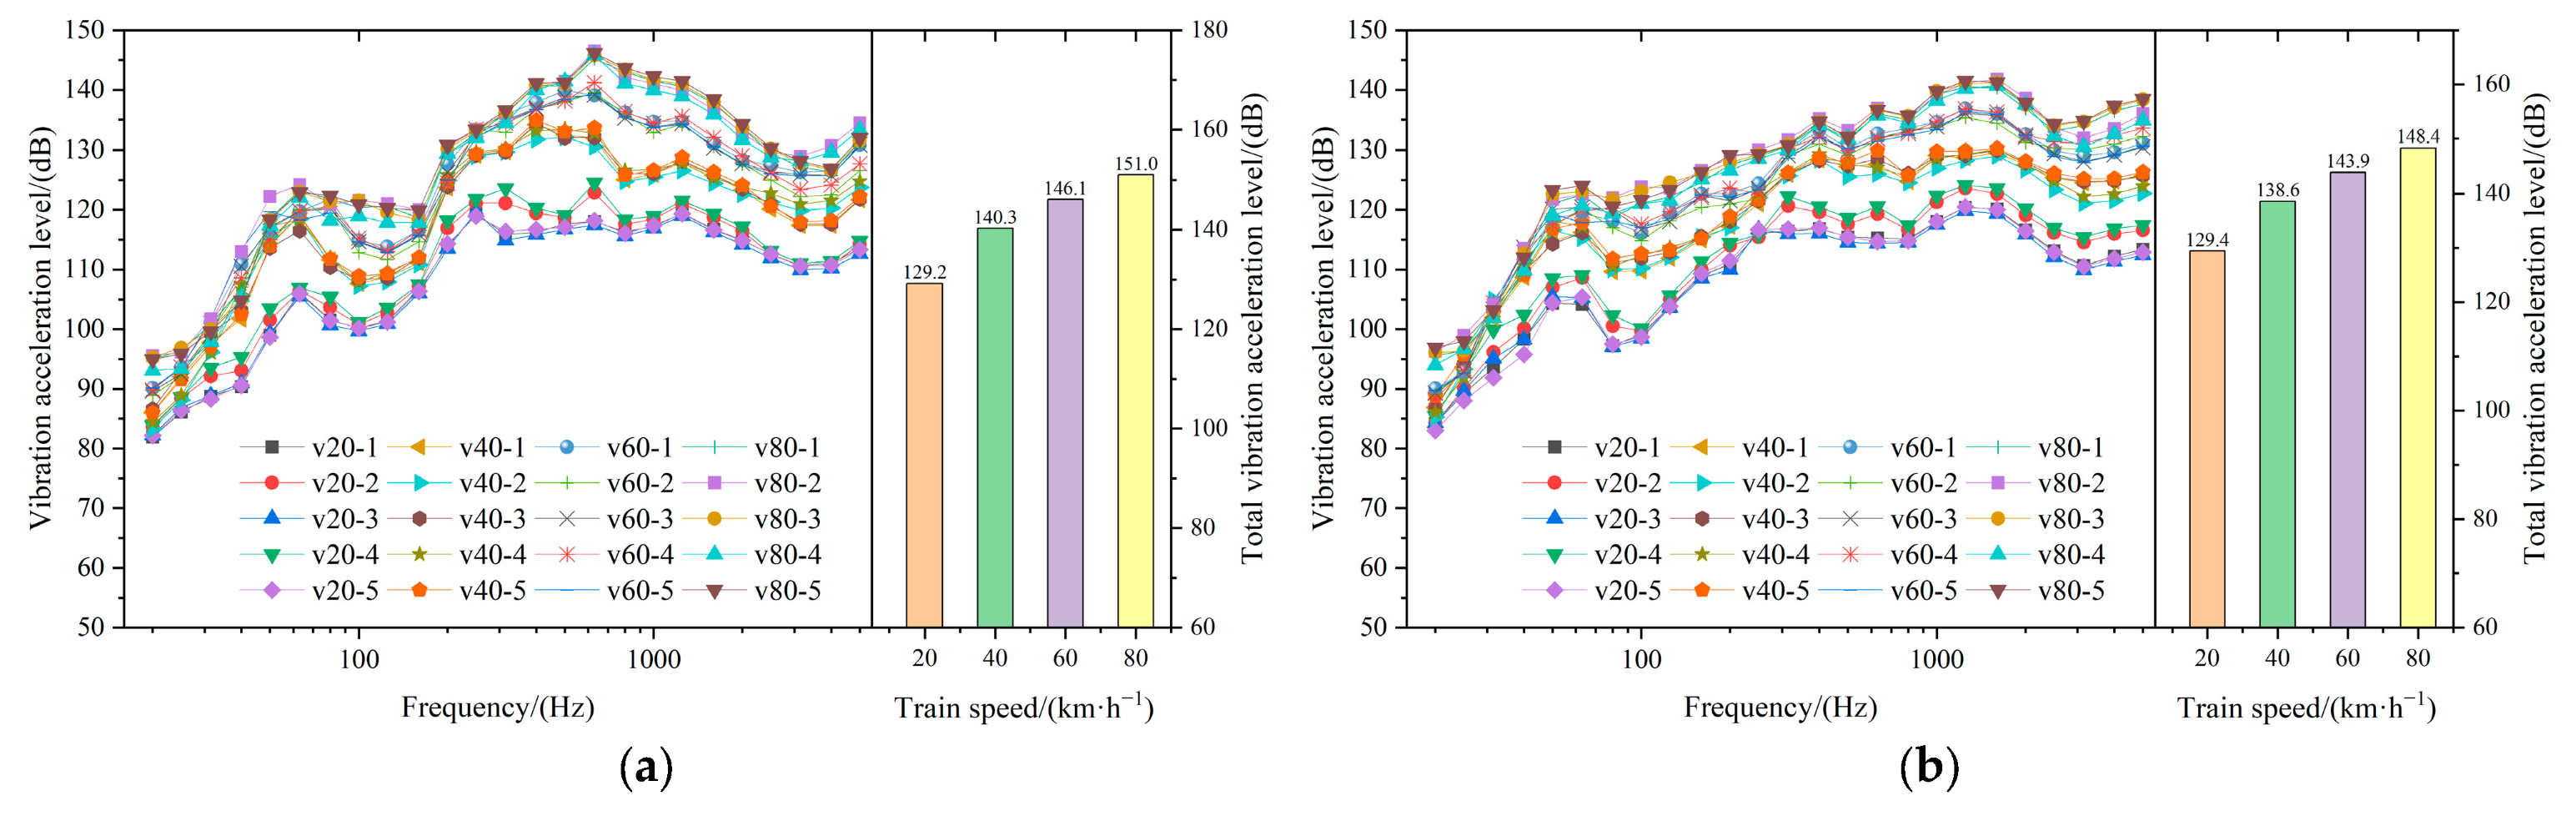
Figure 5 presents the spectra and bar charts of the measured vibration acceleration level at the outer rail measurement point V1 and inner rail measurement point V2 as trains pass through the test section at different speeds. It should be noted that the overall vibration acceleration level in the bar charts represents the average value obtained from five tests under each speed condition. It can be observed that at the same train speed, the overall vibration acceleration levels at the outer rail (V1) and inner rail (V2) are quite similar; the peak vibration acceleration level at point V1 occurs around 630 Hz, while at point V2 it occurs around 1250 to 1600 Hz; with the increase in train speed, the vibration acceleration levels at both the inner and outer rails also increase.
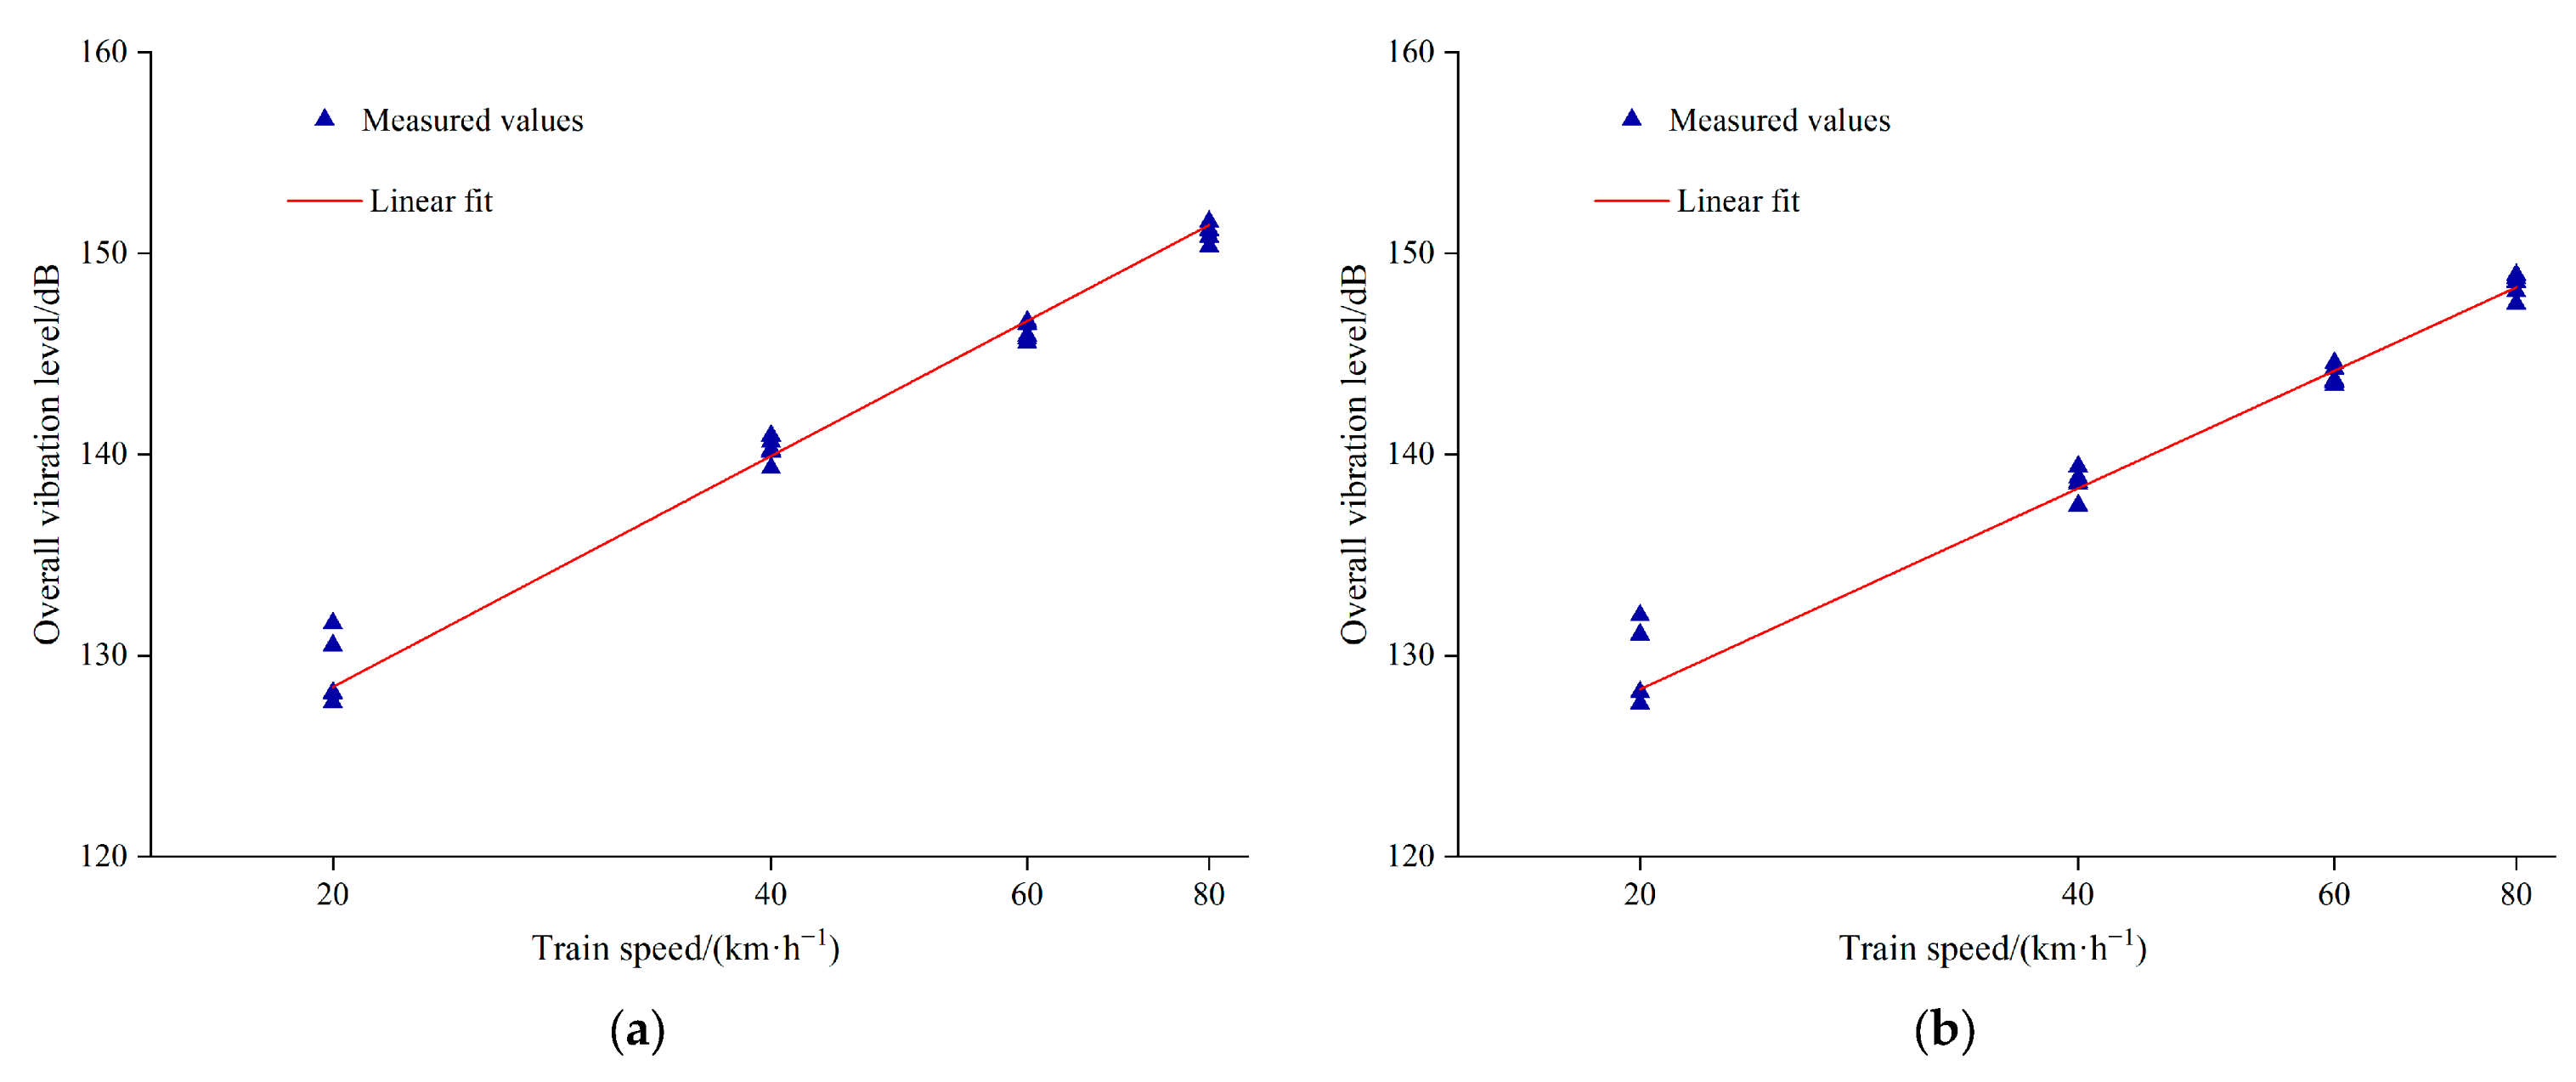
To further analyze the influence of train speed on rail vibration, Figure 6 illustrates the variation in the overall vibration acceleration level at the outer rail (V1) and inner rail (V2) measurement points with train speed as trains pass through the test section at different speeds. It can be observed that the vibration data obtained from five tests at the identical speed show little variation, which also verifies the reliability of the test data; as the train speed changes within the range of 20 to 80 km·h−1, a strong correlation exists between the overall vibration acceleration level with respect to train speed at both monitoring points V1 and V2. Each time the train speed doubles, the overall vibration acceleration level at points V1 and V2 increases by approximately 11.5 dB and 10.0 dB, respectively.

3.2. Vibration of Track Slab and Bridge Structure

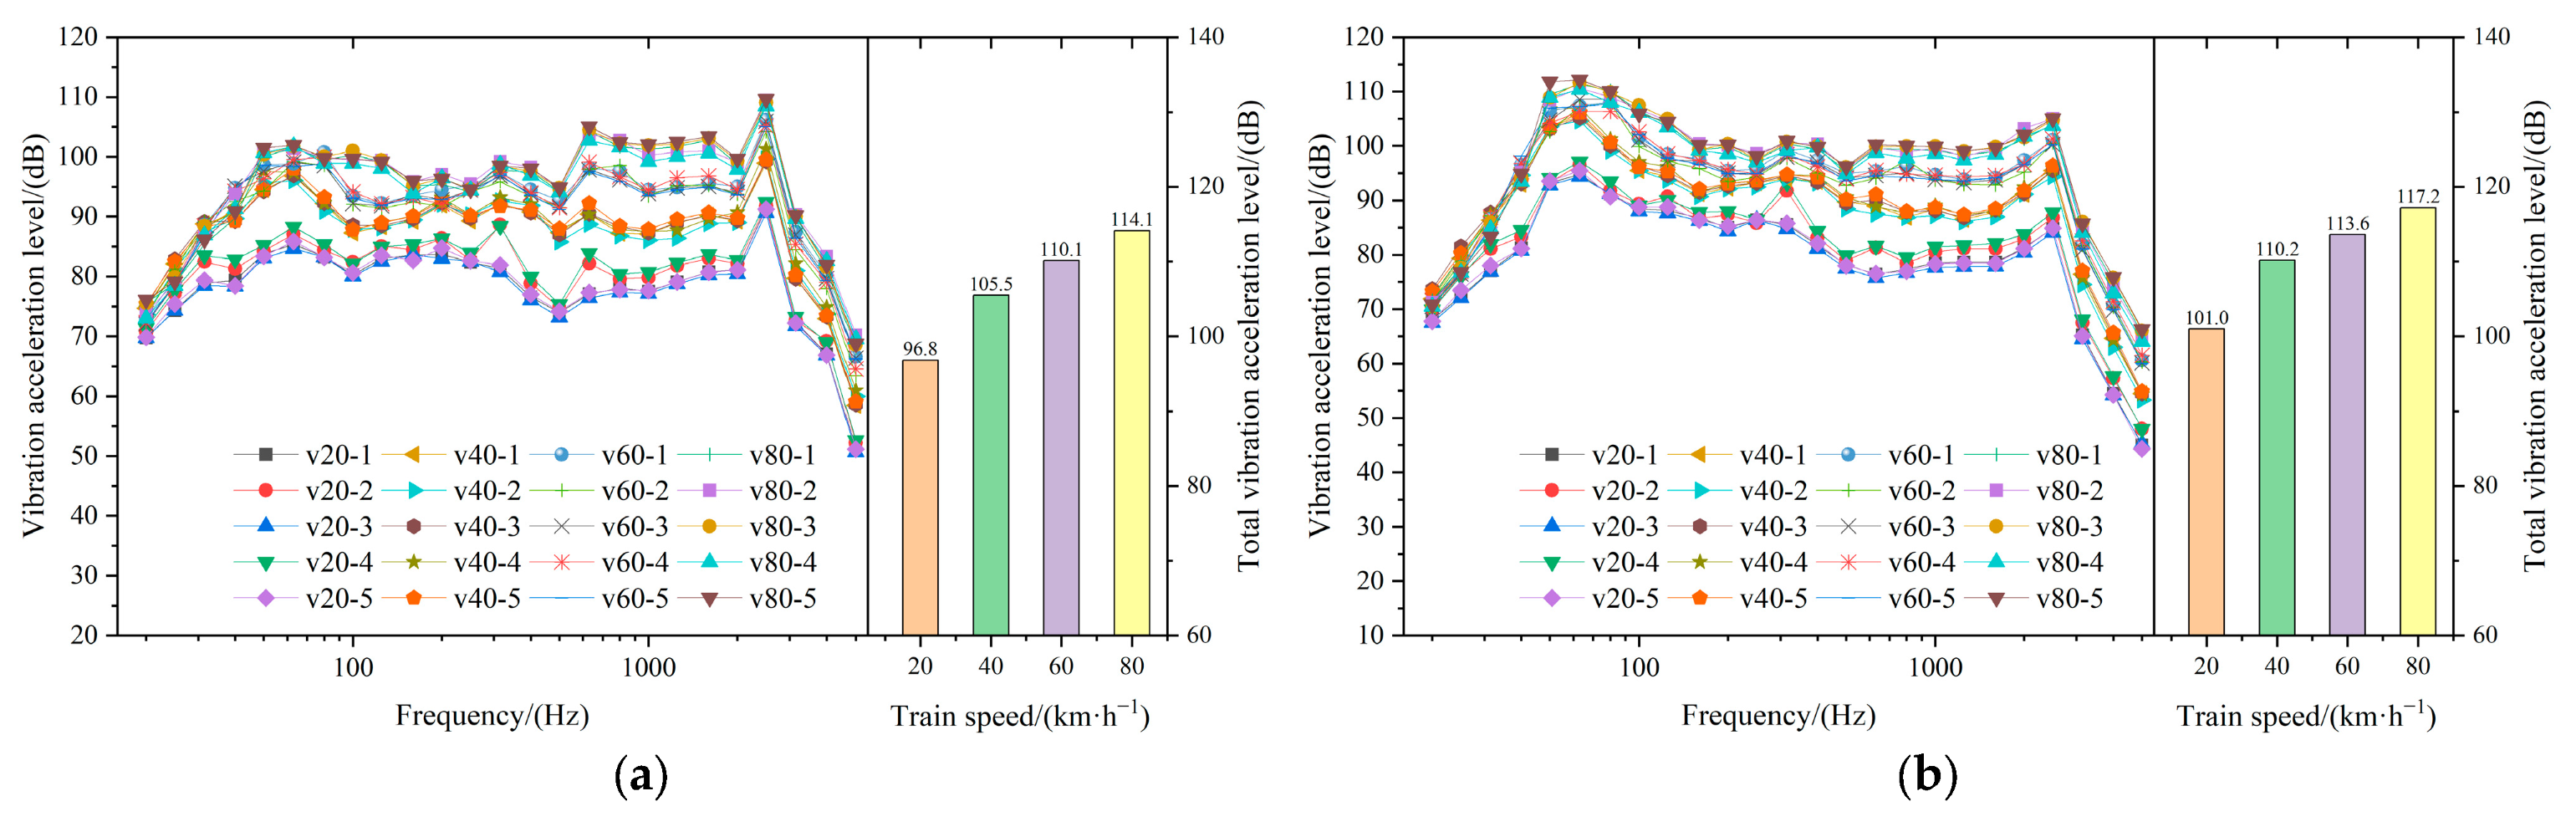
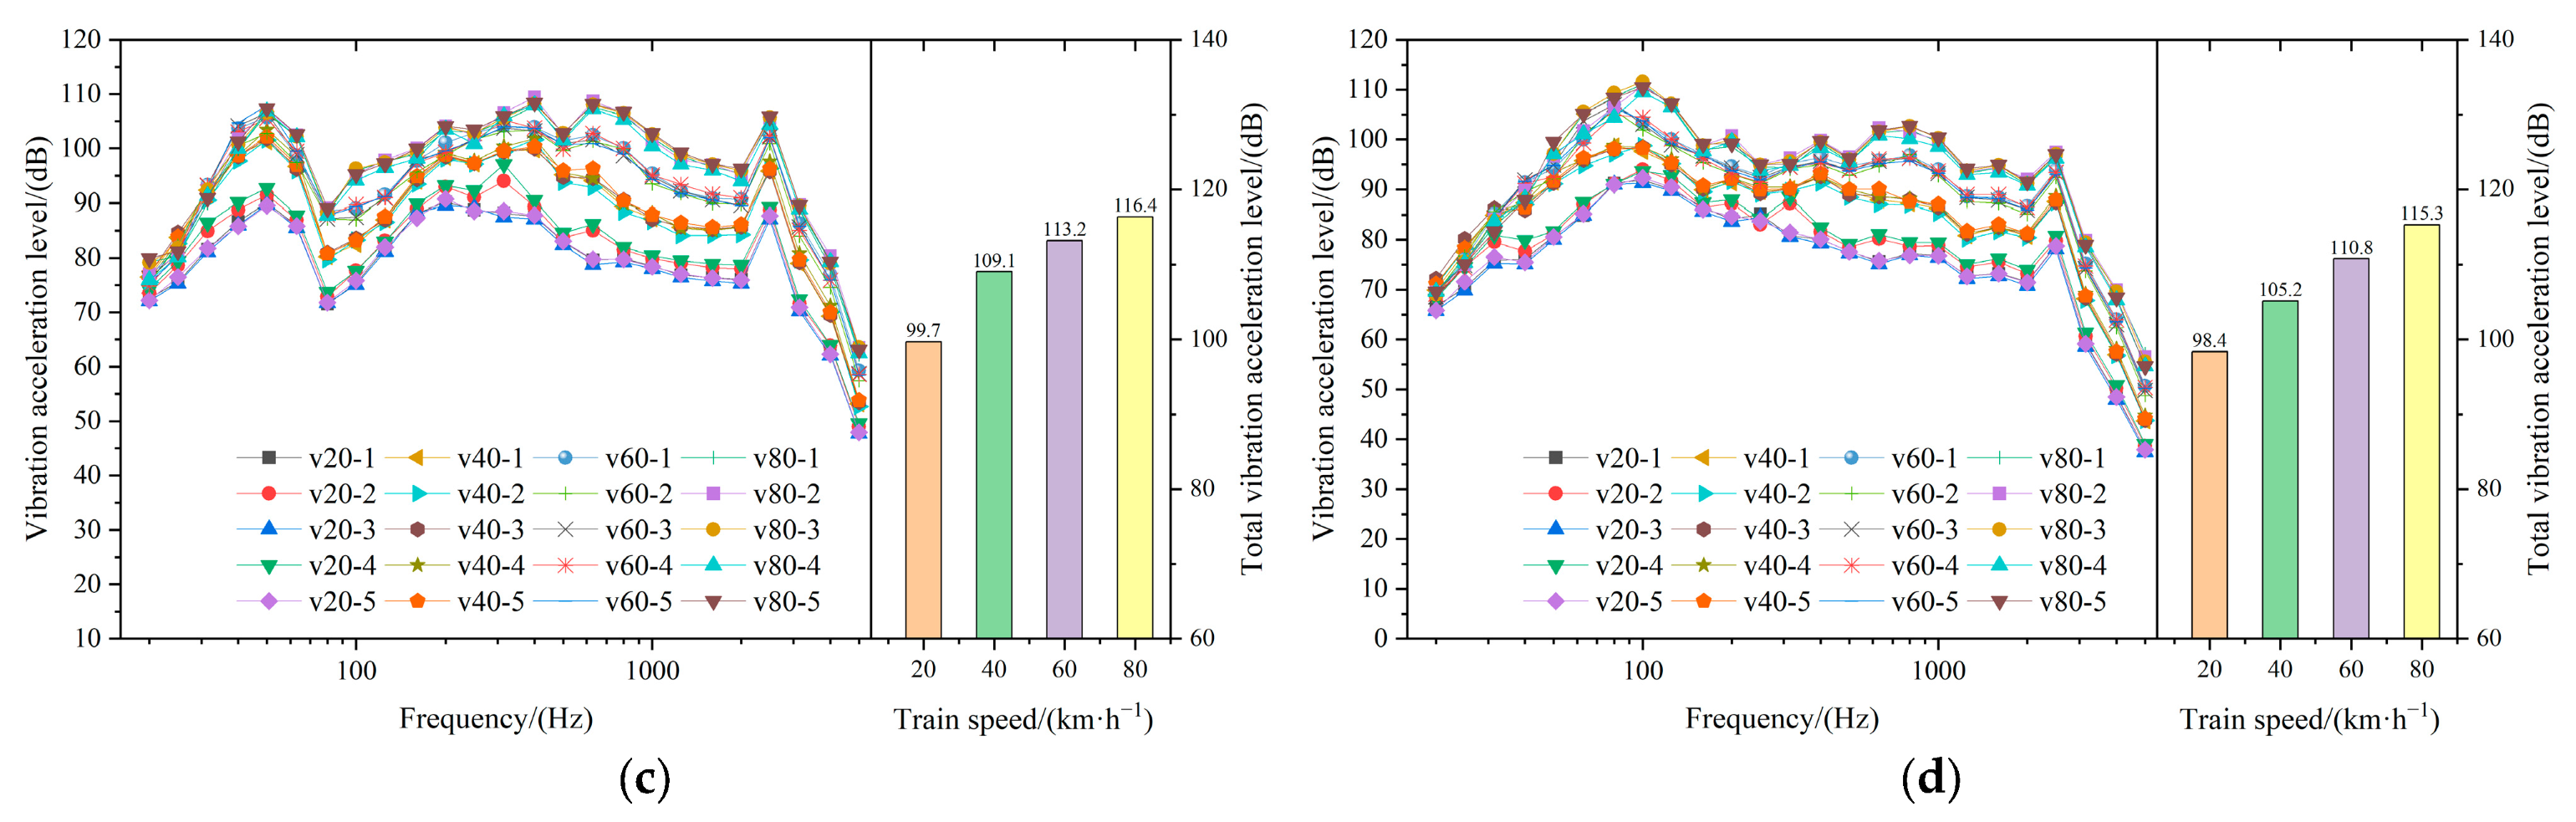
Figure 7 presents the spectra and bar charts of the measured vibration acceleration level at the track slab measurement point V3, top slab measurement point V4, flange slab measurement point V5, and bottom slab measurement point V6 as trains pass through the test section at different speeds. It can be observed that compared to rail vibration, the vibration of the track slab and bridge structure is significantly reduced; the vibration acceleration levels of the track slab, top slab, flange slab, and bottom slab are relatively similar; as the train speed increases, the vibration acceleration levels of the track slab and bridge structure also increase.
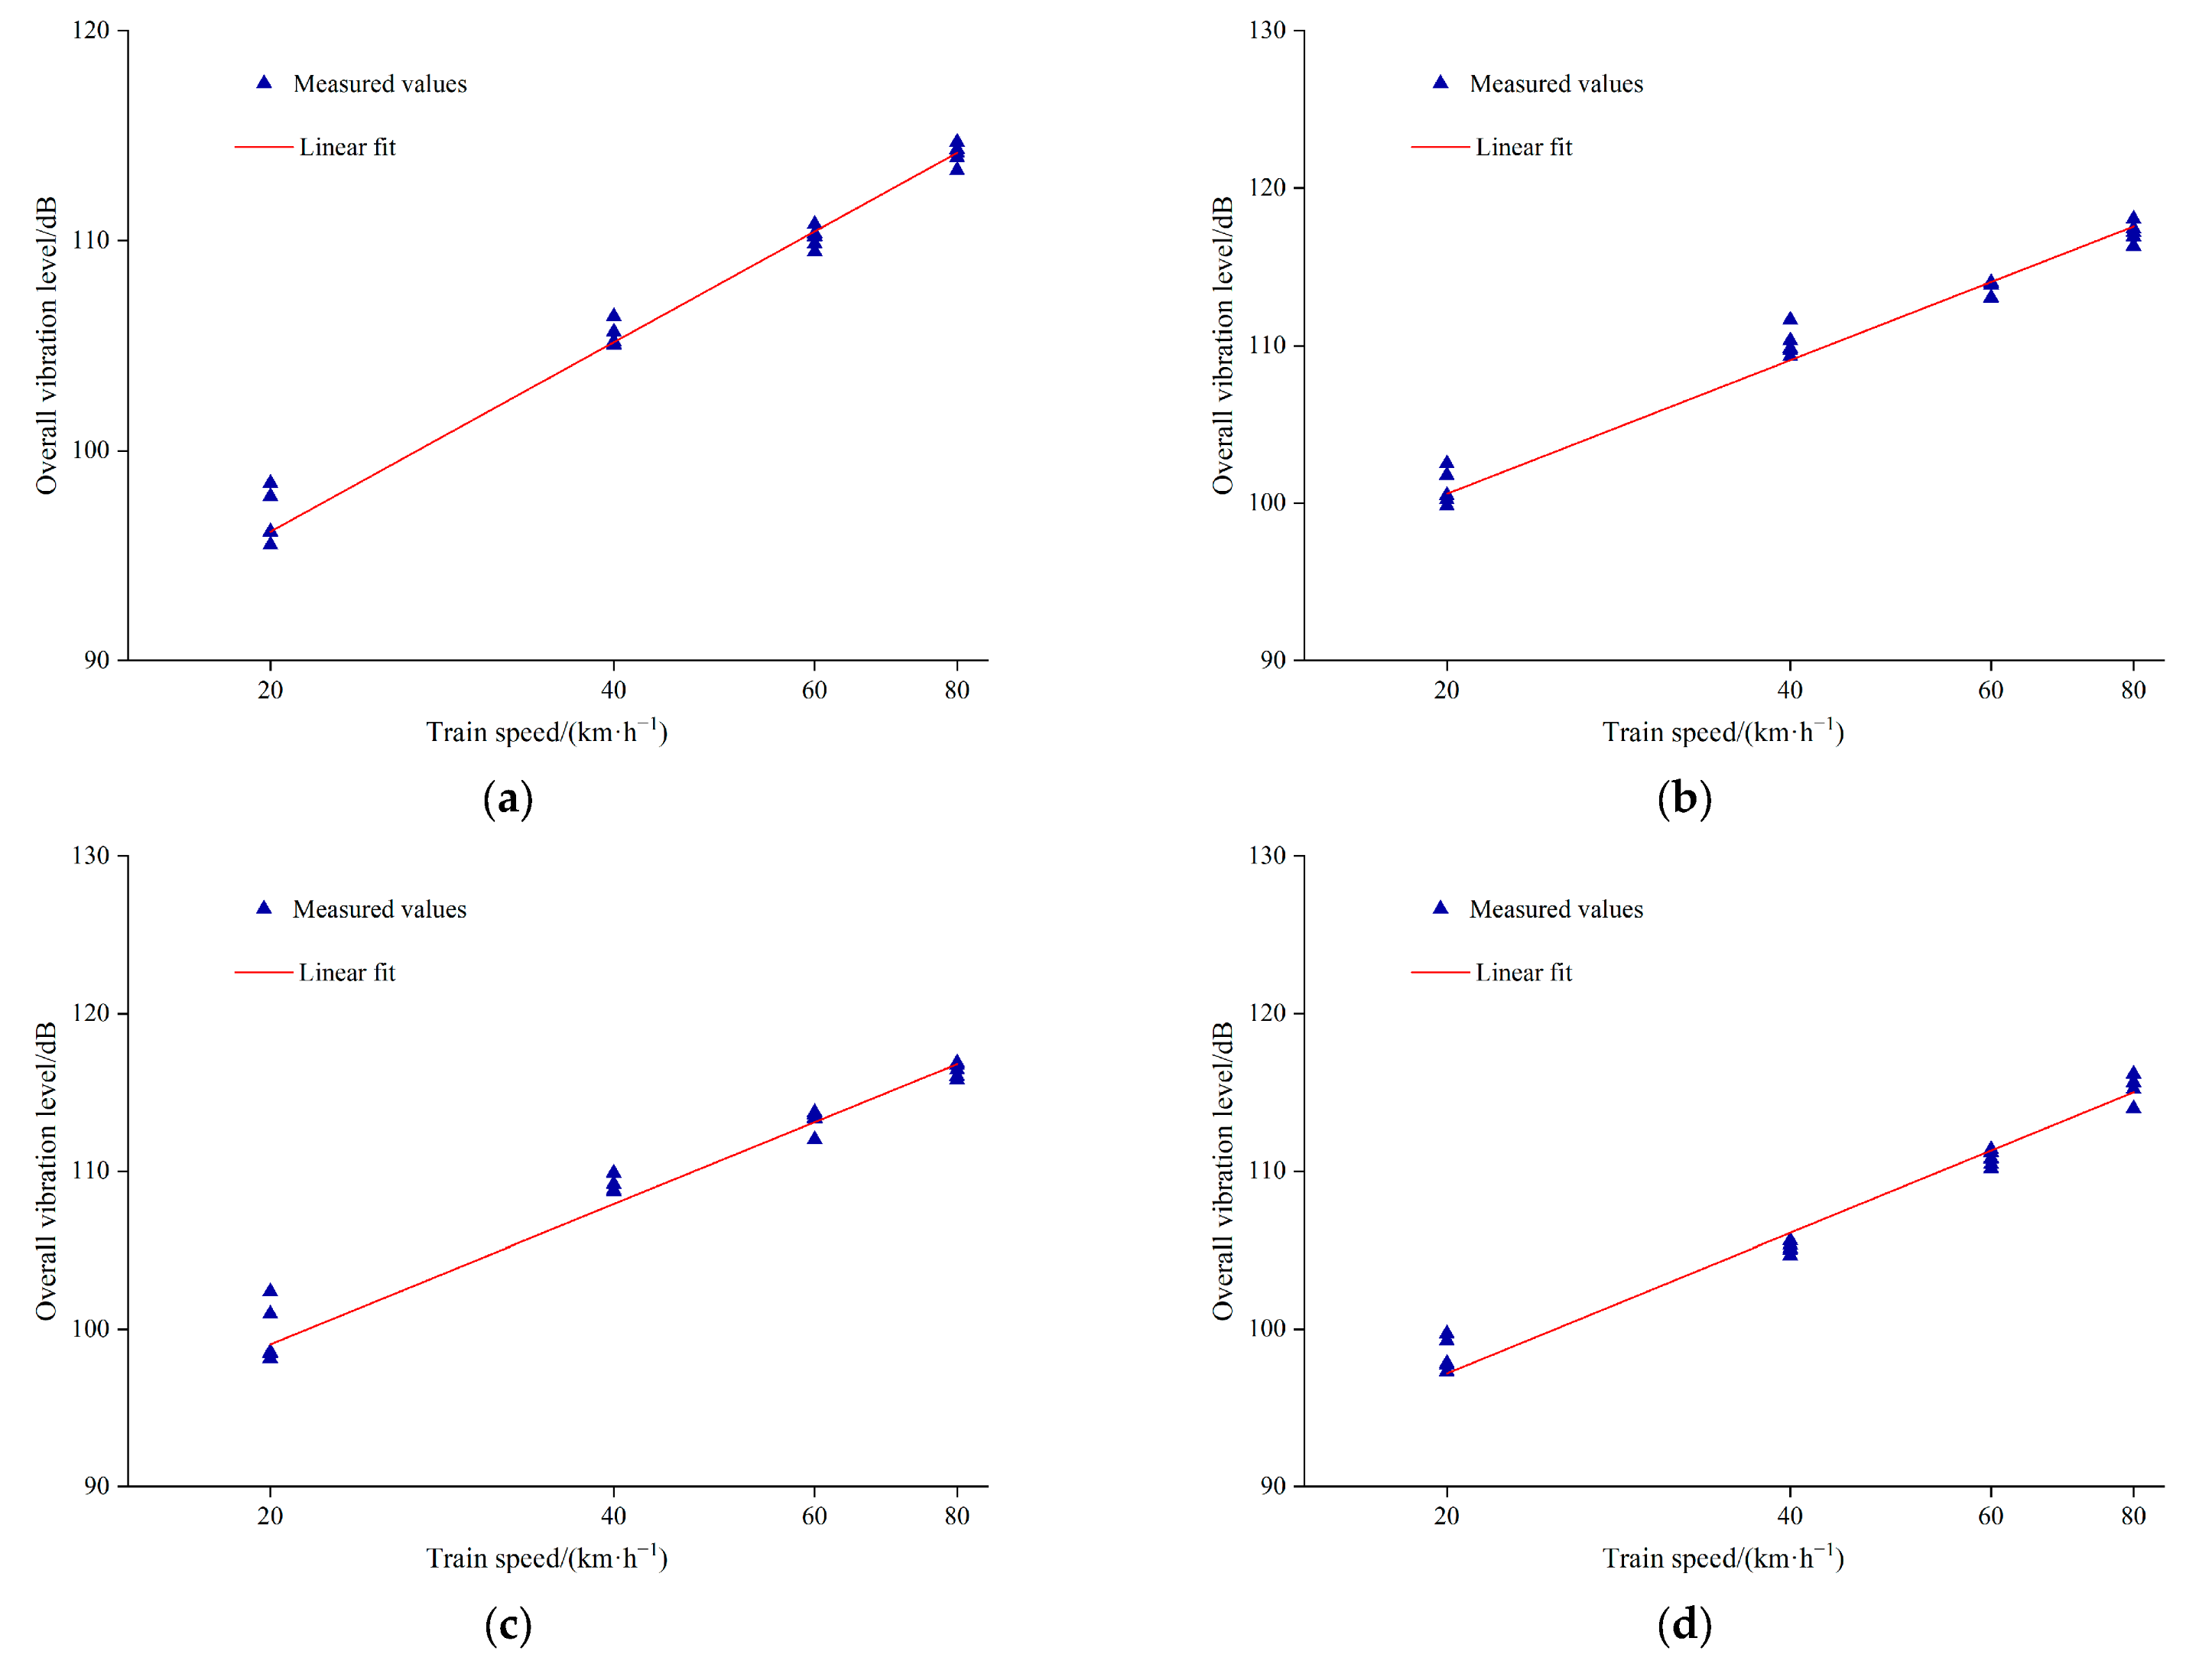
For a further analysis of how train speed affects the vibration of the track slab and bridge structure, Figure 8 illustrates the variation in the overall vibration acceleration level at measurement points V3 (track slab), V4 (top slab), V5 (flange slab), and V6 (bottom slab) with train speed as trains pass through the test section at different speeds. It can be seen that when the train speed varies within the range of 20 to 80 km·h−1, a significant correlation is observed between the overall vibration acceleration level of the track slab and bridge structure and the train speed. Each time the train speed doubles, the overall vibration acceleration level at points V3, V4, V5, and V6 rises by roughly 9.0 dB, 8.5 dB, 8.9 dB, and 8.9 dB, respectively.

3.3. Wheel–Rail Noise

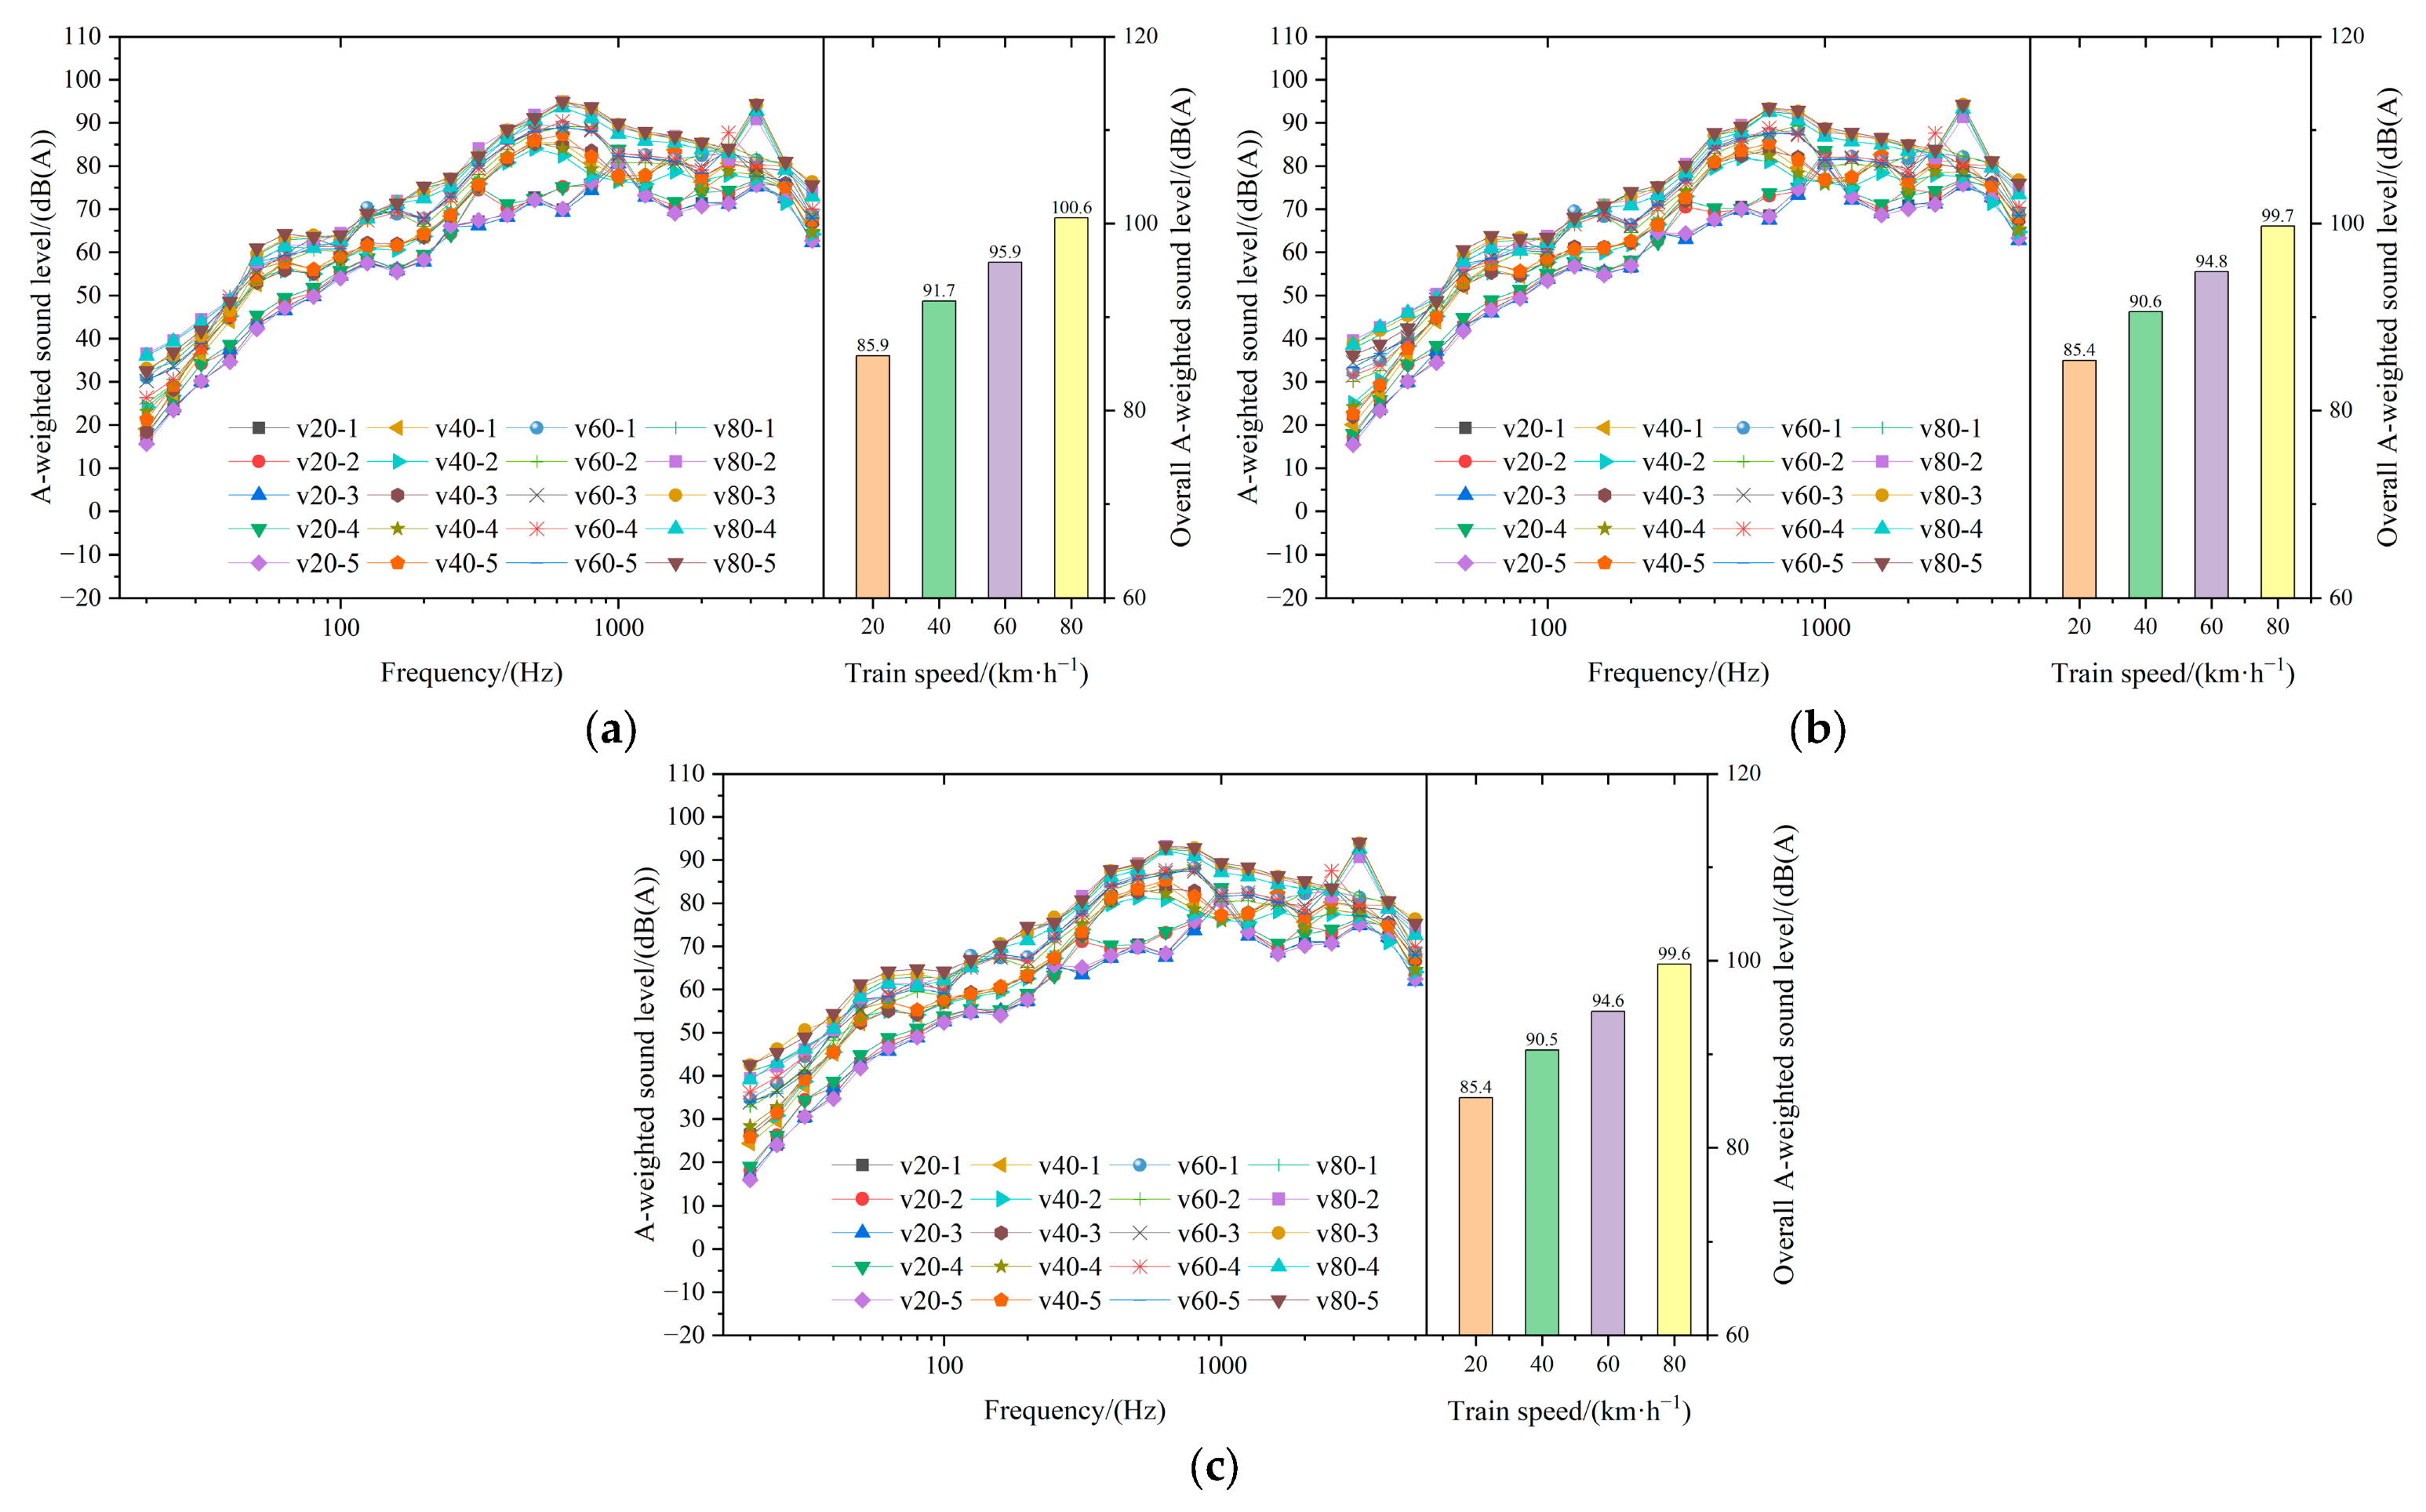
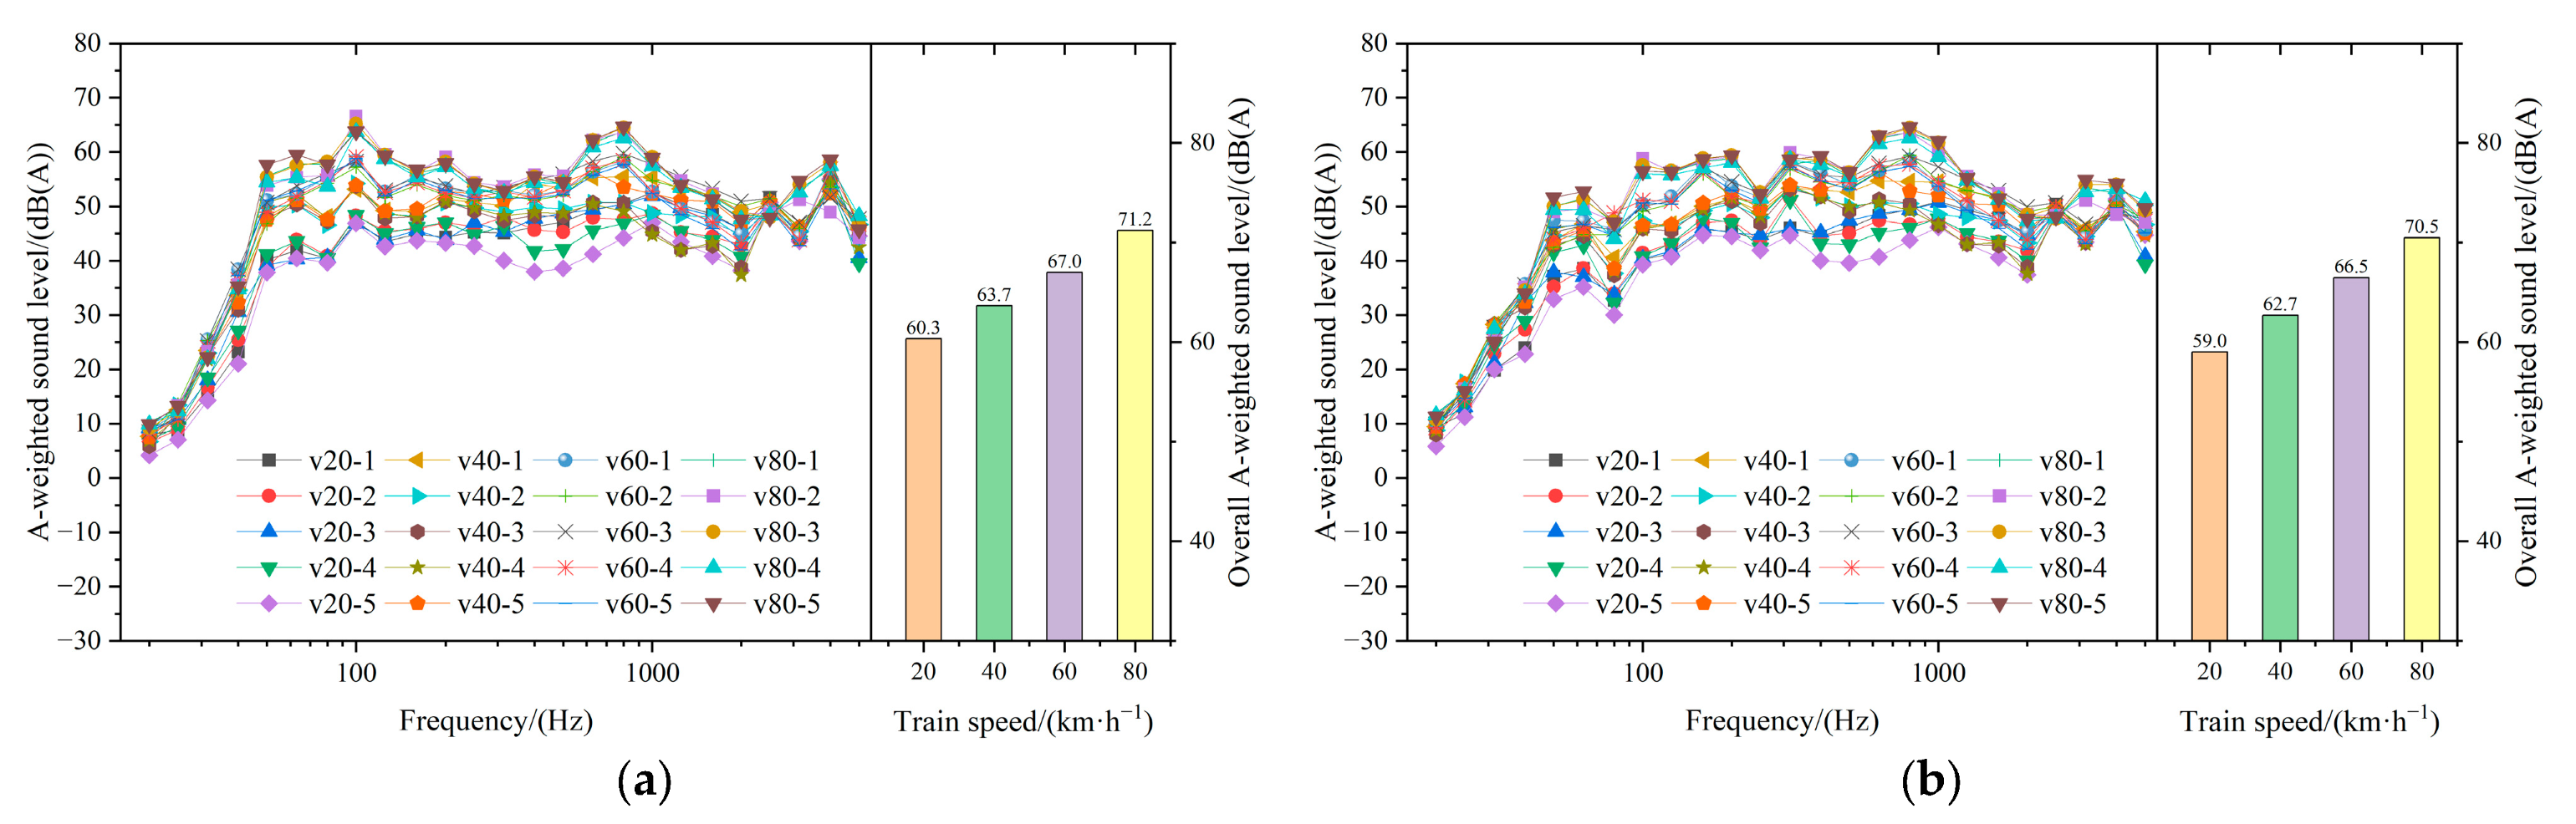
To investigate the wheel–rail noise radiation characteristics as trains pass through the test section at different speeds, the sound pressure time history from the moment the lead car arrived at the test section until the tail car left was extracted. The sound pressure spectrum was obtained via Fourier transform and then converted into one-third octave band spectra of A-weighted sound pressure level. Figure 9 presents the spectra and bar charts of the measured A-weighted sound pressure level at the trackside measurement points N1, N2, and N3 at various train speeds. It is worth noting that the overall sound pressure level in the bar charts represents the average value obtained from five tests under each speed condition. It can be observed that in general, the noise at each monitoring point rises with increasing train speed; at an identical train speed, the A-weighted sound levels at the three trackside measurement points are quite similar; the peaks of wheel–rail noise appear around 630 Hz and 3150 Hz. Among these, the noise peak around 630 Hz is likely caused by noise radiated from rail vibration (see Figure 5a).
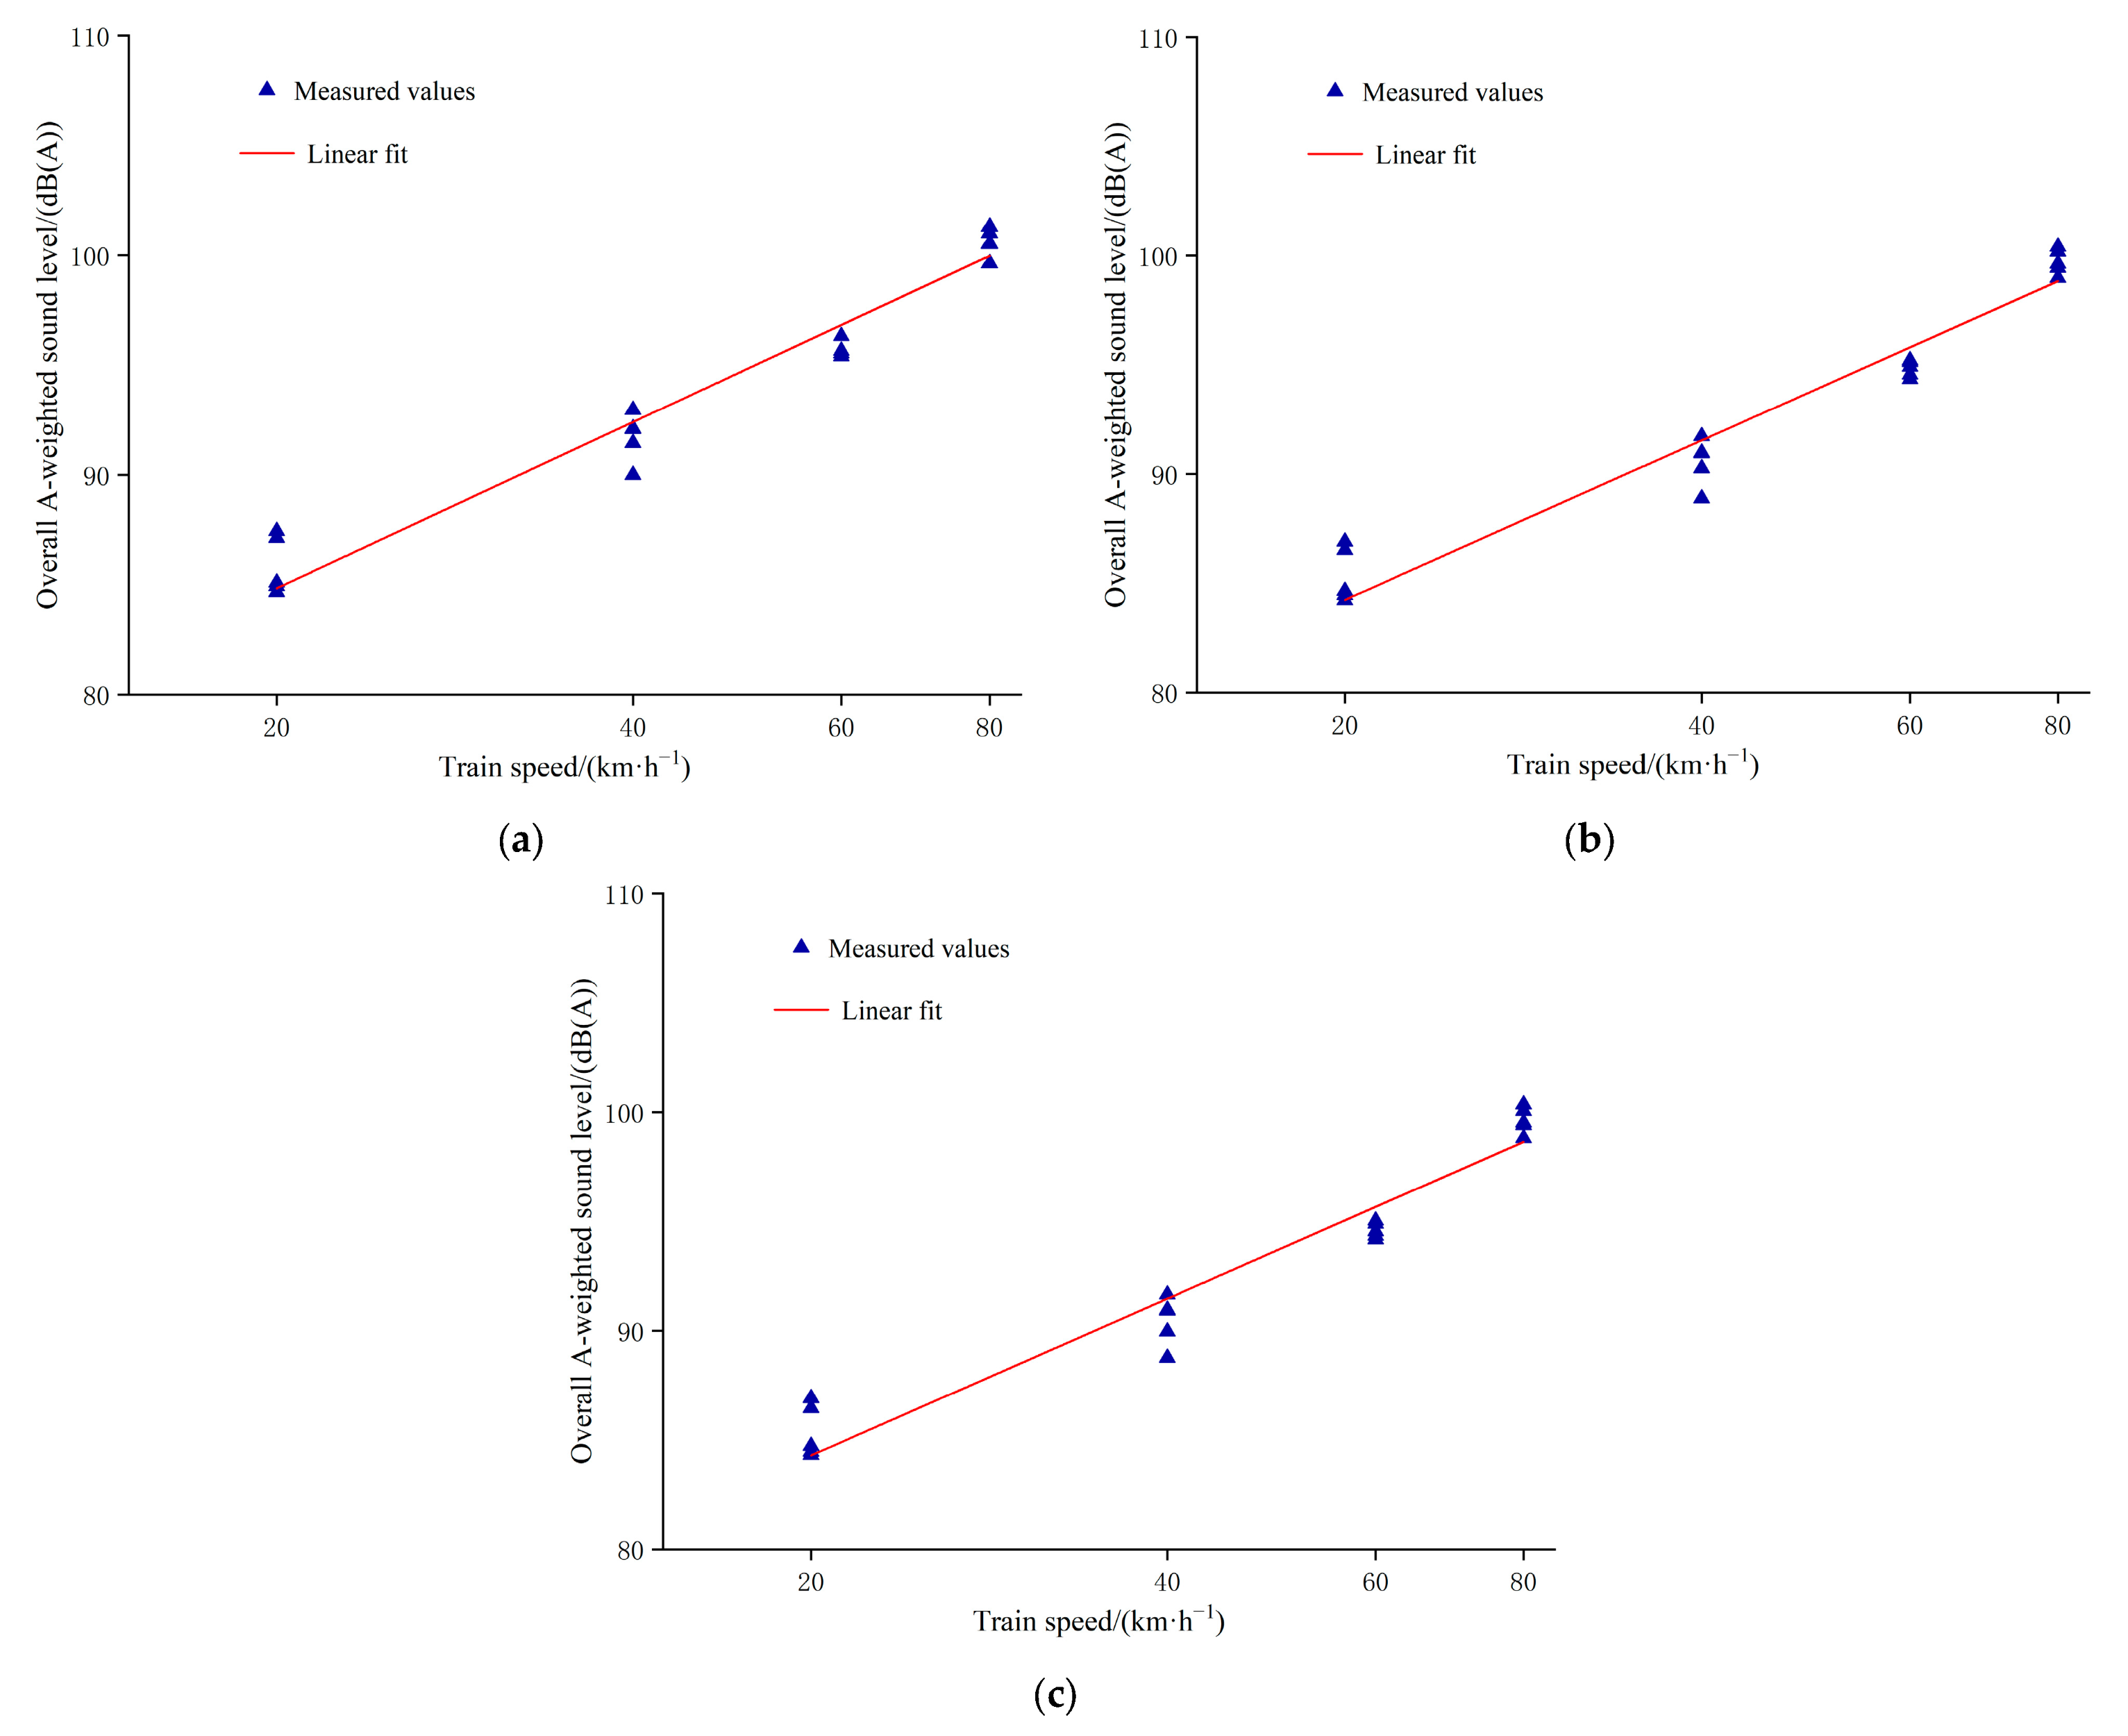
To further investigate the impact of train speed on wheel–rail noise, Figure 10 presents the variation in the overall sound pressure level with train speed at trackside measurement points N1, N2, and N3. It can be seen that as train speed varies from 20 to 80 km·h−1, a strong correlation exists between the overall sound pressure level and train speed at these three measurement points. Each time the train speed doubles, the overall sound pressure level at points N1, N2, and N3 rises by roughly 7.6 dB(A), 7.3 dB(A), and 7.2 dB(A), respectively.

3.4. Bridge Structure-Borne Noise

To investigate the bridge structure-borne noise radiation characteristics as trains pass through the test section at different speeds, the sound pressure time history from the moment the lead car arrived until the tail car left the test section was extracted. The sound pressure spectrum was obtained via Fourier transform and then converted into one-third octave band spectra of the A-weighted sound pressure level. Figure 11 presents the spectra and bar charts of the measured A-weighted sound pressure level at measurement points N4 and N5 under the bridge at different train speeds. It can be observed that in general, the noise at measurement points under the bridge increases with train speed; under different speeds, the noise peak at point N4 (0.3 m below the bottom slab) consistently occurs around 100 Hz, corresponding to the peak vibration frequency at measurement point V6 on the bottom slab; compared to point N4, the noise in the 63–100 Hz frequency band is significantly reduced at point N5 (1.2 m above the ground), which may be attributed to the noise reduction effect provided by the shrubbery under the bridge (see Figure 1).
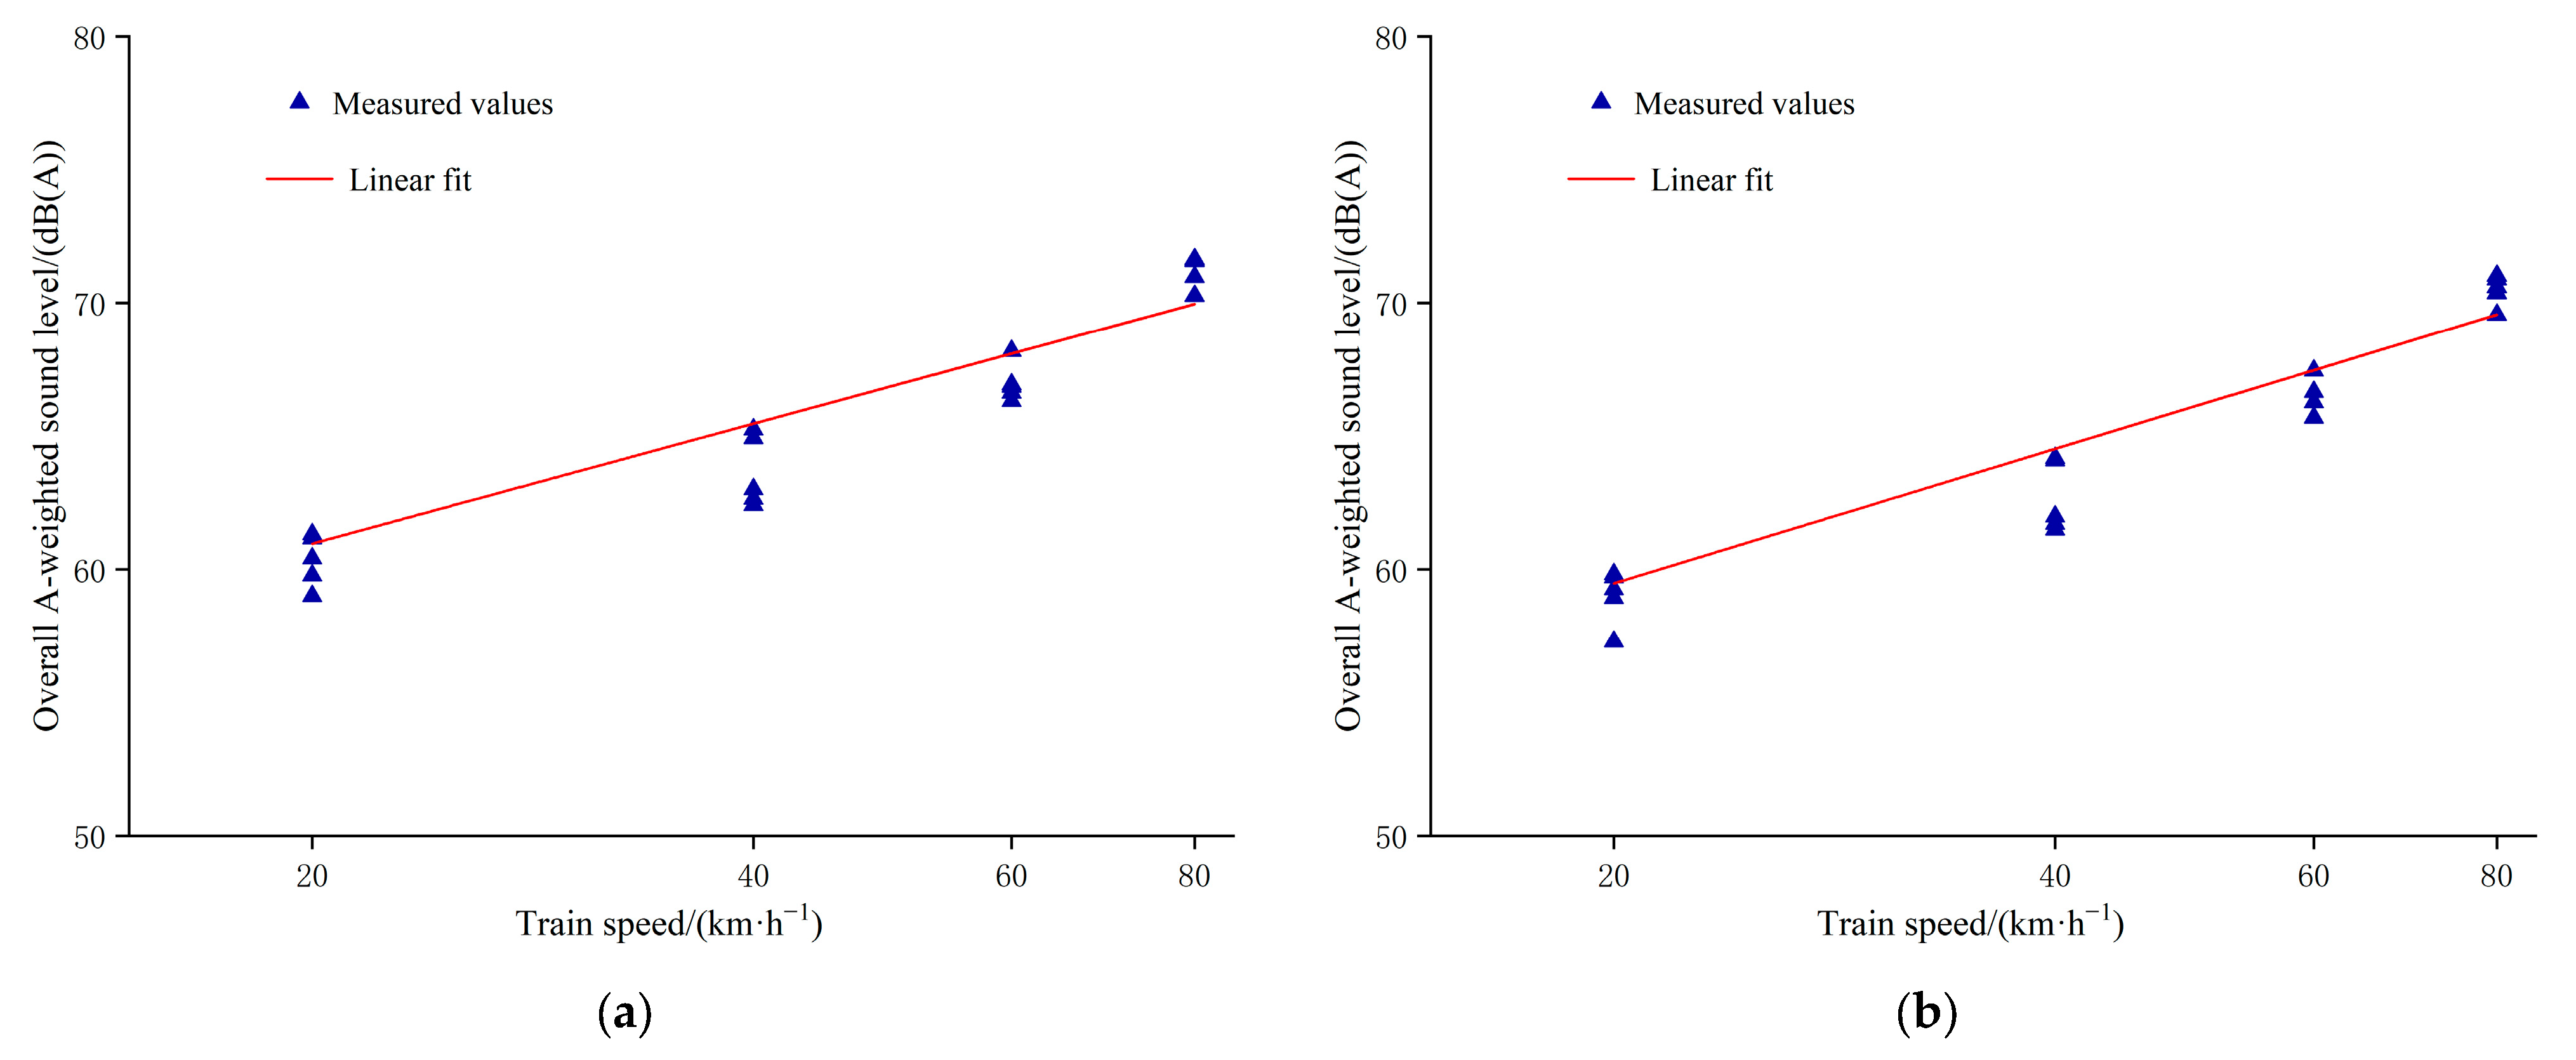
To further investigate the impact of train speed on bridge structure-borne noise, Figure 12 illustrates the variation in the overall sound pressure level with train speed at measurement points N4 and N5 beneath the bridge. It is evident that as the train speed varies within the range of 20 to 80 km·h−1, the overall sound pressure level at points N4 and N5 exhibits a certain correlation with train speed. Each time the train speed doubles, the overall sound pressure level at points N4 and N5 increases by approximately 4.5 dB(A) and 5.0 dB(A), respectively. Comparatively, the rate of increase in wheel–rail noise with speed is faster than that of bridge structure-borne noise.

4. Discussion

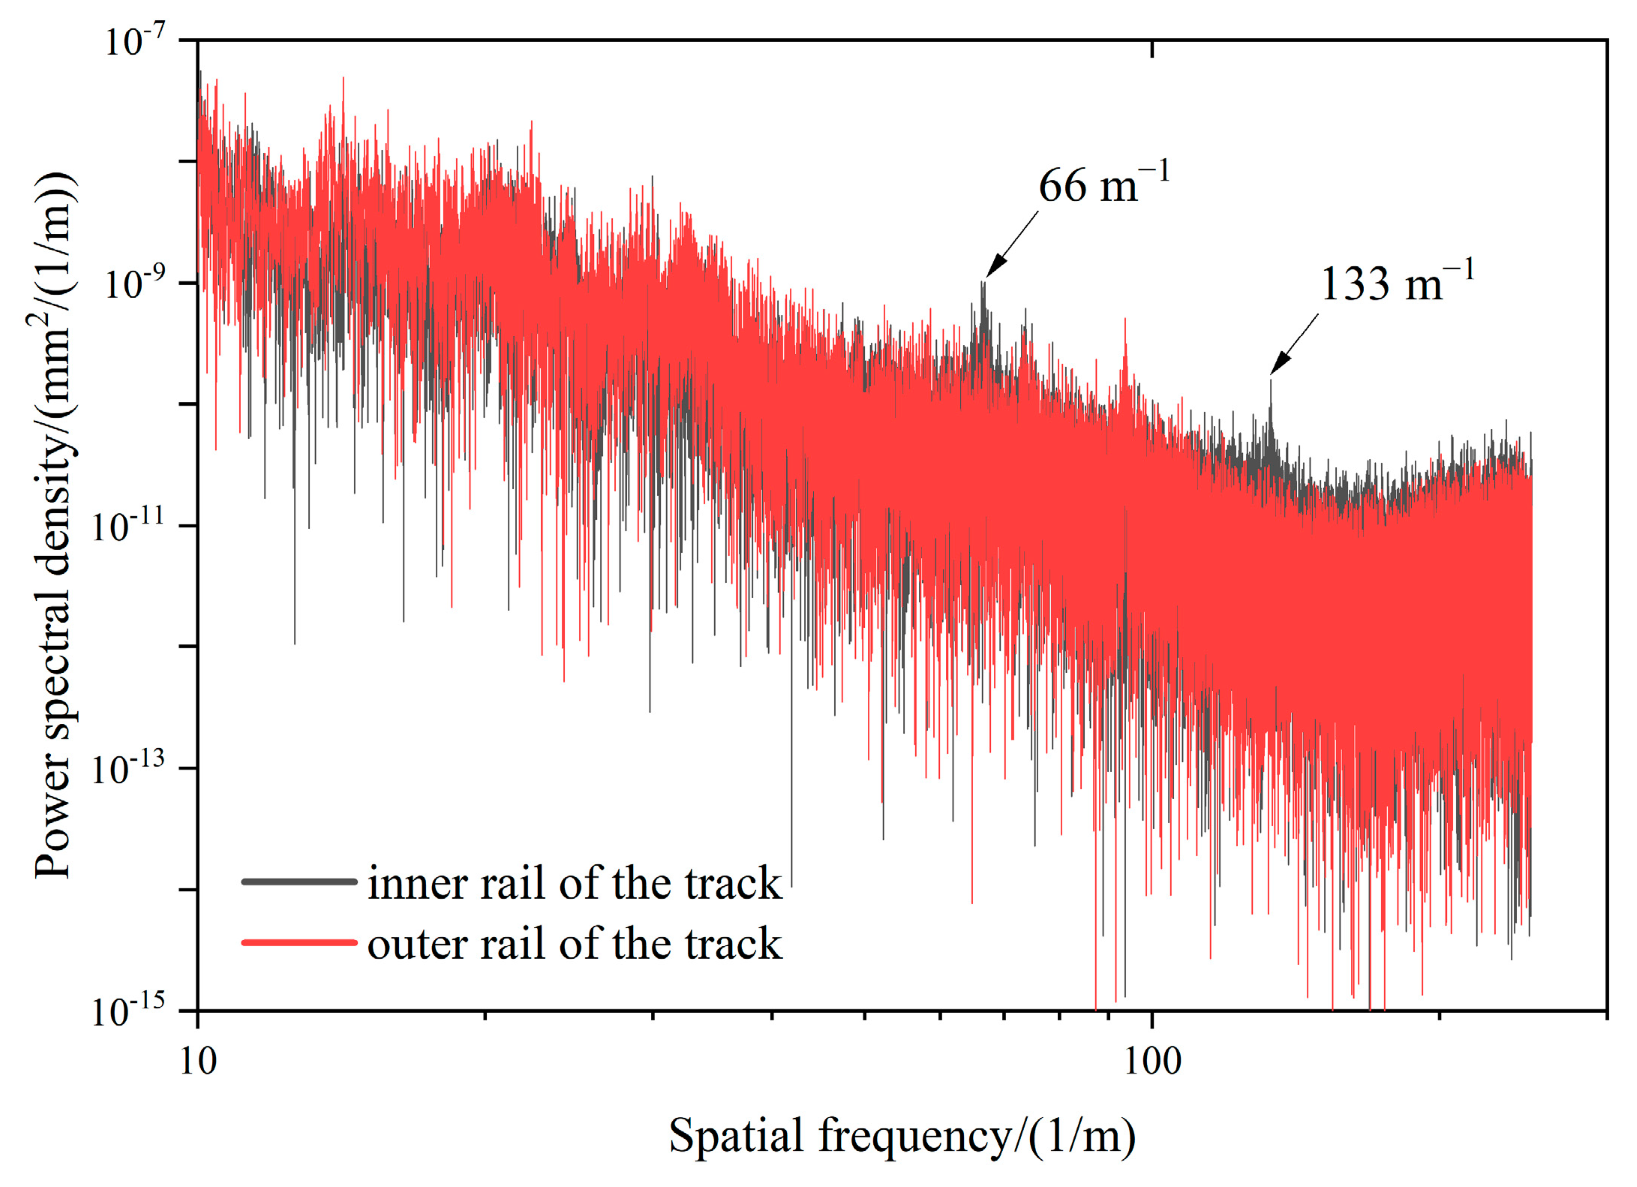
To further investigate the causes of the observed vibration and noise peaks, measurements of the rail roughness at the test section were performed. Figure 13 presents the measured power spectral densities of the rail roughness for both the inner and outer rails. The figure shows that for spatial frequencies below 60 m−1, the roughness of the outer rail is greater than that of the inner rail. Conversely, for spatial frequencies above 60 m−1, the roughness of the inner rail is greater. This difference helps explain why the dominant peak vibration frequency of the inner rail occurs at a higher frequency than that of the outer rail. Furthermore, notable peaks in the inner rail roughness are observable at spatial frequencies of 66 m−1 and 133 m−1. Based on the relationship between train speed v, frequency f, and spatial wavenumber k (f = kv), the vibration peak frequencies excited by these inner rail roughness peaks under various speed conditions can be determined. For instance, at a speed of 80 km·h−1, these specific roughness peaks would induce vibration peaks at approximately 1467 Hz and 2956 Hz. This may account for the occurrence of the outer rail vibration peak within the 1250–1600 Hz band and the wheel–rail noise peak around the 3150 Hz band.
The greater sensitivity of outer rail vibration to train speed changes compared to inner rail vibration may also be related to the difference in rail roughness between the inner and outer rails. The low-frequency excitation from the outer rail is more likely to excite global structural modes that are sensitive to speed variations, whereas the high-frequency excitation from the inner rail may be constrained by localized, highly damped vibration patterns. This could explain why the vibration of the outer rail increases more rapidly.
The reason why wheel-–rail noise is more sensitive to changes in train speed than bridge structure-borne noise lies in their distinct generation mechanisms. Wheel–rail noise is principally caused by excitation from wheel–rail surface roughness, and its radiated sound power is proportional to the square of the vibration velocity, making it highly sensitive to speed variations. In contrast, bridge structure-borne noise originates from the radiation of structural vibration. The dynamic characteristics of the structure (such as its modes) are influenced by speed changes in a more indirect manner, and the structure itself provides greater damping and attenuation of vibrations. Therefore, the growth rate of bridge structure-borne noise is lower than that of noise generated directly at the wheel–rail interface.
In our previous numerical simulation [19], a doubling of the train speed led to noise increases of 6.32 dB(A) and 5.96 dB(A) at distances of 30 m and 120 m from the track centerline, respectively. The present experimental study shows that a doubling of the speed increases wheel–rail noise by approximately 7.2–7.6 dB(A) and bridge structure-borne noise by about 4.5–5.0 dB(A). The noise at the side of the bridge is a composite of wheel–rail noise and bridge structure-borne noise. Therefore, its rate of change with train speed should logically fall between the respective rates of change for bridge structure-borne noise and wheel–rail noise. This indicates that the conclusions drawn from our previous numerical simulations are fundamentally reasonable.

5. Conclusions

To quantitatively investigate the influence of train speed on the vibration and noise of elevated rail transit, this study selected a typical elevated section of Wuhan Metro Line 21. Systematic field tests were conducted to measure the vibration and noise induced by trains passing at speeds of 20, 40, 60, and 80 km·h−1. The vibration characteristics of the rails, track slab, and bridge structure, as well as the radiation characteristics of wheel–rail noise and bridge structure-borne noise under different speeds, were studied. The influence of train speed on vibration and noise was also analyzed. The main conclusions are as follows:
(1)
The vibration acceleration levels of both the inner and outer rails increase significantly with train speed. Each time the speed doubles, the vibration level rises by approximately 11.5 dB for the outer rail and 10.0 dB for the inner rail. This difference may be related to variations in the rail surface roughness between the inner and outer rails.
(2)
The vibration of the track slab and bridge structure is notably lower than that of the rails and exhibits an approximately linear increase with speed. Each time the speed doubles, the vibration acceleration level at various measurement points increases by an average of about 8.5–9.0 dB.
(3)
Wheel–rail noise is primarily concentrated in the frequency bands around 630 Hz and 3150 Hz, which may be related to the condition of wheel–rail surface roughness. The noise level increases with train speed, with an average increase of approximately 7.2–7.6 dB(A) each time the speed doubles.
(4)
Noise under the bridge shows a distinct peak around 100 Hz, which aligns with the vibration frequency of the bottom slab. Due to the shielding effect of shrubs, noise in the 63–100 Hz frequency band is attenuated at measurement points above ground level. Each time the train speed doubles, bridge structure-borne noise increases by about 4.5–5.0 dB(A), a lower growth rate compared to wheel–rail noise.
The findings of this study can provide references and a basis for the control of vibration and noise in elevated rail transit systems. For instance, when planning elevated lines that pass through vibration- and noise-sensitive areas such as hospitals, schools, or residential zones, the allowable train passing speed can be determined in accordance with current environmental impact assessment (EIA) regulations. Alternatively, by taking into account the vibration reduction effectiveness of vibration-damping tracks or the noise attenuation performance of noise barriers, suitable types of track structures or noise barrier configurations can be selected.

Author Contributions

Conceptualization, L.S. and Q.L.; methodology, L.S.; software, W.W.; formal analysis, W.W. and X.X.; investigation, W.W. and R.B.; data curation, W.W. and X.X.; writing—original draft, L.S. and W.W.; writing—review and editing, Q.L.; project administration, L.S. and Q.L.; funding acquisition, L.S. and Q.L. All authors have read and agreed to the published version of the manuscript.

Funding

This research study was funded by the National Natural Science Foundation of China, grant numbers 52378450 and 52372328; the China Postdoctoral Science Foundation, grant numbers 2023T160214 and 2023M731077; the Natural Science Foundation of Jiangxi Province, grant numbers 20232BAB204087, and Independent Research Projects of the State Key Laboratory of Safety and Resilience of Civil Engineering in Mountain Area, grant Number SQQZ2025211.

Institutional Review Board Statement

Not applicable.

Informed Consent Statement

Not applicable.

Data Availability Statement

The data presented in this study are available on request from the corresponding author due to restrictions imposed by the metro operator.

Conflicts of Interest

The authors declare no conflicts of interest.

References

  1. Karpenko, M.; Prentkovskis, O.; Skačkauskas, P. Analysing the Impact of Electric Kick-Scooters on Drivers: Vibration and Frequency Transmission during the Ride on Different Types of Urban Pavements. Eksp. Niezawodn. 2025, 27, 199893. [Google Scholar] [CrossRef]
  2. Silva, P.; Ribeiro, D.; Mendes, J.; Montenegro, P.; Correia, A.; Calçada, R. Railways Passengers Comfort Evaluation through Motion Parameters: A Systematic Review. Machines 2023, 11, 465. [Google Scholar] [CrossRef]
  3. Sandrock, S.; Griefahn, B.; Kaczmarek, T.; Hafke, H.; Preis, A.; Gjestland, T. Experimental studies on annoyance caused by noises from trams and buses. J. Sound Vib. 2008, 313, 908–919. [Google Scholar] [CrossRef]
  4. Gidlöf-Gunnarsson, A.; Ögren, M.; Jerson, T.; Öhrström, E. Railway noise annoyance and the importance of number of trains, ground vibration, and building situational factors. Noise Health 2012, 14, 190–201. [Google Scholar] [CrossRef] [PubMed]
  5. Licitra, G.; Fredianelli, L.; Petri, D.; Vigotti, M.A. Annoyance evaluation due to overall railway noise and vibration in Pisa urban areas. Sci. Total Environ. 2016, 568, 1315–1325. [Google Scholar] [CrossRef] [PubMed]
  6. Klein, A.; Marquis-Favre, C.; Champelovier, P. Assessment of annoyance due to urban road traffic noise combined with tramway noise. J. Acoust. Soc. Am. 2017, 141, 231–242. [Google Scholar] [CrossRef] [PubMed]
  7. Maigrot, P.; Parizet, E.; Marquis-Favre, C. Annoyance due to combined railway noise and vibration: Comparison and testing of results from the literature. Appl. Acoust. 2020, 165, 107324. [Google Scholar] [CrossRef]
  8. Thompson, D.J.; Hemsworth, B.; Vincent, N. Experimental Validation of the TWINS Prediction Program for Rolling Noise, Part 1: Description of the Model and Method. J. Sound Vib. 1996, 193, 123–135. [Google Scholar] [CrossRef]
  9. Thompson, D.J.; Fodiman, P.; Mahé, H. Experimental Validation of the TWINS Prediction Program for Rolling Noise, Part 2: Results. J. Sound Vib. 1996, 193, 137–147. [Google Scholar] [CrossRef]
  10. Li, W. Railway Rolling Noise Separation and Wheel and Rail Roughness Estimation from Pass by Measurement: Field Tests and Theoretical Modelling. Ph.D. Thesis, University of Wollongong, Wollongong, Australia, 2014. [Google Scholar]
  11. Thompson, D.; Squicciarini, G.; Zhang, J.; Dittrich, M.; Zhang, X.; Squicciarini, H. Assessment of Measurement-Based Methods for Separating Wheel and Track Contributions to Railway Rolling Noise. Appl. Acoust. 2018, 140, 48–62. [Google Scholar] [CrossRef]
  12. Lázaro, J.; Costa, P.A.; Godinho, L. Experimental Light Rail Traffic Noise Assessment in a Metropolitan Area. Appl. Sci. 2024, 14, 969. [Google Scholar] [CrossRef]
  13. Gao, F.; Xia, H.; An, N. Analysis and Experimental Study on the Radiation Noise of the Elevated Structures of Beijing Metro Line 5. China Railw. Sci. 2010, 31, 134–139. [Google Scholar]
  14. Ngai, K.W.; Ng, C.F. Structure-Borne Noise and Vibration of Concrete Box Structure and Rail Viaduct. J. Sound Vib. 2002, 255, 281–297. [Google Scholar] [CrossRef]
  15. Li, X.; Liang, L.; Wang, D. Vibration and Noise Characteristics of an Elevated Box Girder Paved with Different Track Structures. J. Sound Vib. 2018, 425, 21–40. [Google Scholar] [CrossRef]
  16. Hsu, W.L. Structure-Borne Noise of Steel and Concrete Box Girders in an Urban Metro System: A Hybrid Evaluation and Parametric Study. J. Low Freq. Noise Vib. Act. Control 2023, 42, 1560–1577. [Google Scholar] [CrossRef]
  17. Gao, K.; Liu, Q.; Yan, Z.; Song, L.; Yang, H. Influence of Modelling Method for Ballastless Track on the Structure-Borne Noise of an Aerial Rail Transit. Eng. Anal. Bound. Elem. 2026, 186, 106710. [Google Scholar] [CrossRef]
  18. He, J.L.; Wan, Q.; Jiang, W.K. Analysis of the Elevated Urban Rail Transit Noise. Urban Mass Transit 2007, 8, 57–60. [Google Scholar]
  19. Song, L.; Zhang, J.; Liu, Q.; Zhang, L.; Wu, X. Characteristics of Noise Caused by Trains Passing on Urban Rail Transit Viaducts. Sustainability 2025, 17, 94. [Google Scholar] [CrossRef]
Figure 1. On-site Test Photo of Wuhan Metro Line 21.
Sustainability 18 03296 g001
Figure 2. Layout of Measurement Points.
Sustainability 18 03296 g002
Figure 3. Test results of vibration measurement point V1 under different train speeds: (a) 20 km·h−1; (b) 40 km·h−1; (c) 60 km·h−1; (d) 80 km·h−1.
Sustainability 18 03296 g003
Figure 4. Test results of noise measurement point N2 under different train speeds: (a) 20 km·h−1; (b) 40 km·h−1; (c) 60 km·h−1; (d) 80 km·h−1.
Sustainability 18 03296 g004aSustainability 18 03296 g004b
Figure 5. Spectra and bar charts of rail vibration acceleration level at different train speeds: (a) V1; (b) V2.
Sustainability 18 03296 g005
Figure 6. Fitting curves illustrating the relationship between the overall vibration acceleration level of the rails vs. train speed: (a) V1; (b) V2.
Sustainability 18 03296 g006
Figure 7. Vibration acceleration level spectra and bar charts of the track slab and bridge structure at different train speeds: (a) V3; (b) V4; (c) V5; (d) V6.
Sustainability 18 03296 g007aSustainability 18 03296 g007b
Figure 8. Fitting curves illustrating the relationship between the overall vibration acceleration level of the track slab and bridge structure vs. train speed: (a) V3; (b) V4; (c) V5; (d) V6.
Sustainability 18 03296 g008
Figure 9. Measured A-weighted sound level spectra and bar charts of the trackside at different train speeds: (a) N1; (b) N2; (c) N3.
Sustainability 18 03296 g009
Figure 10. Fitting curves illustrating the relationship between the overall A-weighted sound level at the trackside vs. train speed: (a) N1; (b) N2; (c) N3.
Sustainability 18 03296 g010
Figure 11. Measured A-weighted sound level spectra and bar charts under the bridge at different train speeds: (a) N4; (b) N5.
Sustainability 18 03296 g011
Figure 12. Fitting curves illustrating the relationship between the overall A-weighted sound level under the bridge vs. train speed: (a) N4; (b) N5.
Sustainability 18 03296 g012
Figure 13. Measured power spectral densities of rail roughness for the inner and outer rails.
Sustainability 18 03296 g013
Table 1. Test Conditions.
No.Condition NameSpeed/(km·h−1)
1v20-1–v20-520
2V40-1–v40-540
3V60-1–v60-560
4V80-1–v80-580
Disclaimer/Publisher’s Note: The statements, opinions and data contained in all publications are solely those of the individual author(s) and contributor(s) and not of MDPI and/or the editor(s). MDPI and/or the editor(s) disclaim responsibility for any injury to people or property resulting from any ideas, methods, instructions or products referred to in the content.