


Abstract
A multi-dimensional quantitative assessment of high-quality development (HQD) in China’s livestock industry and the identification of its main constraints are essential to understanding its current stage and future direction. Guided by global sustainability targets and the United Nations’ Sustainable Development Goals (SDGs), an evaluation system was constructed by this study. This system integrates five key aspects: product safety, output efficiency, resource conservation, environmental friendliness, and regulatory effectiveness. Using provincial panel data from China for 2013–2022, this research applies the entropy-weighted TOPSIS method, kernel density estimation (KDE), and an obstacle degree model for analysis, the goal is to support food security and foster environmentally sustainable growth. The findings indicate the following: (1) Notable inter-provincial disparities exist in the HQD of China’s livestock industry, revealing a spatial pattern of “leading in the east, stable in the center, and lagging in the west.” (2) The nationwide evolution exhibits a “convergence followed by divergence” pattern: from 2013 to 2017, the primary peak of the KDE rose and its width narrowed; from 2018 to 2022, the primary peak declined and its width widened, indicating that inter-provincial disparities first narrowed and then expanded. At the regional level, the development pattern is characterized by eastern polarization, central stability, and western lock-in. (3) Obstacle factor analysis identifies product safety and environmental friendliness as the principal constraints on HQD in the livestock industry. Addressing these bottlenecks is crucial for ensuring the supply of livestock products (SDG 2: Zero Hunger), promoting resource conservation and green production (SDG 12: Responsible Consumption and Production), and alleviating the ecological and environmental pressures of the livestock industry (SDG 15: Protection of Terrestrial Ecosystems). The challenges related to resources, the environment, and quality safety confronting China’s livestock industry are common among developing countries. Consequently, the evaluation framework established in this study can offer methodological references for relevant nations.
1. Introduction
The livestock industry plays a significant global role by providing essential animal products for billions of people and generating substantial employment for hundreds of millions living in poverty. In a report by the Food and Agriculture Organization, trace elements in livestock products are essential for human health, highlighting the importance of product safety in livestock development [1]. In recent years, the growing global population and rising demand for livestock products have led to an expanding market that faces challenges, including inadequate infrastructure, severe ecological pollution, and difficulties in disease prevention and control [2,3]. Therefore, achieving high-quality and sustainable growth in the livestock sector through industrial transformation and upgrading is critically important.
In this context, China’s pursuit of HQD offers important insights as a representative case. The year 2017 witnessed the official proposal of the HQD paradigm. During the 19th National Congress of the Communist Party of China, it was emphasized that the country’s economy has moved into a new stage, transitioning from a focus on growth speed to an emphasis on quality [4]. In 2020, the General Office of the State Council issued the Opinions on Promoting HQD of the Livestock Industry, outlining a vision for a safe, efficient, resource-conserving, environmental friendliness, and well-regulated industry. This policy reflects the government’s increased strategic focus on the sector’s sustainable development [5,6,7]. In 2025, China’s Central Document No. 1 further emphasized stabilizing the livestock sector’s production capacity and enhancing its disease prevention and control systems [8]. These objectives align with several United Nations Sustainable Development Goals (SDGs), such as food security (SDG 2), sustainable production (SDG 12), and ecosystem protection (SDG 15) [9,10,11]. Furthermore, a wide range of economic theories offer strong theoretical underpinnings for the core ideas of HQD. Development economics explicitly articulates the dialectical unity between the quantity and quality of economic growth. Therefore, the evaluation of livestock industry development must not proceed solely from the perspective of output scale but should instead be analyzed using a multi-dimensional comprehensive framework [12]. New economic growth theory posits that technological innovation and enhanced efficiency are the primary drivers of economic growth, thus directly corresponding to the “efficient output” dimension discussed in this paper: only by enhancing labor productivity and slaughter rates through technological innovation can true quality-oriented growth be achieved [13,14]. Complementing this is sustainable development theory, which clearly demonstrates that economic growth must be coordinated with ecological and environmental protection. This provides the theoretical basis for the “environmentally friendly” and “resource-conserving” dimensions: the development of the livestock industry should not come at the expense of environmental damage but should instead pursue the intensive use of resources [15]. Circular economy theory further reinforces this by meticulously elaborating on the relationship between resource recycling and sustainable development, thereby significantly strengthening the theoretical foundation for the “resource-conserving” dimension [16]. Consequently, “HQD” has evolved from a policy slogan into a multi-dimensional objective supported by a robust theoretical framework. Based on this logic, this paper systematically and rigorously constructs an evaluation system for the HQD of China’s livestock industry across five dimensions: product safety, efficient output, resource conservation, environmental friendliness, and regulatory effectiveness. However, more importantly and deserving greater attention, the various challenges encountered in China’s pursuit of these multi-dimensional objectives are by no means unique. A substantial body of literature indicates that developing countries generally face issues such as resource constraints, environmental pressures, and quality and safety concerns during the transformation of their livestock industries. With the distinction of being the world’s largest livestock producer, China’s development journey has also been profoundly influenced by these factors, rendering the Chinese case a valuable methodological reference for other similar countries.
Currently, the definition, measurement, and evaluation of HQD have been extensively discussed in academic circles, providing an important theoretical and methodological foundation for this paper. In terms of research methods, quantitative tools such as the entropy method [17,18,19], entropy-weighted TOPSIS [20,21,22,23,24], principal component analysis [25], coupling coordination degree models [26,27,28], and obstacle degree models [29] have been extensively adopted in the evaluation of HQD across various fields. The Five Development Concepts (innovation, coordination, green development, openness, and sharing) [30,31,32,33,34] have guided the construction of indicator systems in industries like marine fisheries [30] and construction [31]. The logical framework employed by these studies in processing multi-dimensional indicators offers a valuable reference for evaluating the livestock industry. Furthermore, research in regional economics and urban science [35] has introduced spatiotemporal analysis methods to examine the dynamic progression and spatial agglomeration characteristics of HQD. These methodological explorations provide crucial insights for conducting spatial dimension analysis on China’s livestock sector in this study. Within the livestock sector, Yu et al. [36] have elucidated the connotation and realization pathways of HQD in the livestock industry from a theoretical perspective, offering significant theoretical support for this research. Although existing studies have laid a solid foundation, systematic evaluations specifically targeting the HQD of the livestock industry remain insufficient. First, comprehensive evaluation studies specifically oriented towards livestock production systems are still relatively scarce. Second, current indicator systems are largely derived from policy interpretations, requiring deeper integration with international sustainable development theoretical frameworks. Third, the research perspective predominantly emphasizes macro-level time series analysis, paying inadequate attention to the spatial clustering traits and regional heterogeneity of HQD in the livestock sector. Therefore, this paper adopts the entropy-weighted TOPSIS method, which is extensively used in multi-attribute decision analysis, to develop an evaluation indicator framework that integrates the Five Development Concepts with specific practices of the livestock sector, such as green recycling and planting-breeding integration. By incorporating spatial dimension analysis, this work seeks to uncover the spatial distribution of HQD in China’s livestock industry, thereby offering methodological supplementation and practical reference for research on high-quality development in this field. To address the identified gaps in the literature, this study analyzes the spatial linkages and heterogeneous characteristics of China’s livestock industry within a complex spatiotemporal framework, investigates its dynamic evolutionary patterns, and identifies the key factors impeding its transition to a more advanced development stage. The findings offer a scientific foundation for transforming China’s livestock industry and provide valuable insights for other countries and regions undergoing similar transitions toward sustainable development.
This work offers several contributions. First, it develops an evaluation framework for the HQD of the livestock industry that is well-integrated with the international sustainable development framework. By naturally and appropriately transforming “HQD” from a policy discourse into a theoretically supported and measurable concept, it addresses a significant gap in the existing literature, which lacks systematic theoretical integration. Second, it designs an analytical framework that incorporates spatial autocorrelation analysis and KDE. This effectively clarifies the spatial correlation patterns and evolutionary characteristics of livestock industry development. More importantly, it systematically investigates spatial dependence and dynamic evolution—dimensions long neglected in previous research. Third, it formally and robustly introduces obstacle degree analysis into livestock industry research as a methodological tool for identifying key constraining factors. Consequently, it provides a transferable and referential diagnostic framework for other developing countries facing similar transformation challenges.
2. Materials and Methods
2.1. Construction of the Evaluation Indicator System
To guarantee scientific rigor and systematic design in the evaluation framework, this study establishes the indicator system through the following steps. First, the dimension division is determined theoretically, grounded in development economics and sustainable development theory, and integrated with the five goals—“output efficiency, product safety, resource conservation, environmentally friendly, and effective regulation”—proposed in the “Opinions on Promoting HQD of the Livestock Industry.” This establishes the five dimensions of the evaluation system. Second, a literature review is conducted to build an initial indicator pool. This involves a systematic examination of domestic and international research on HQD evaluation, combined with existing indicator systems in the livestock and agricultural sectors, to summarize high-frequency and representative indicators. Considering the characteristics of livestock production and data availability, candidate indicators are preliminarily screened. Finally, the final indicators are rigorously established in accordance with the criteria of scientific soundness, systematicity, and representativeness. The specific screening criteria are as follows: the indicator’s connotation must align closely with the selected dimension; provincial-level data must be continuously available (2013–2022); indicators should not be highly correlated with one another; and they must accurately reflect regional differences. Through multiple rounds of rigorous screening and reasonable adjustments, a comprehensive evaluation system comprising 5 secondary indicators and 18 tertiary indicators is ultimately formed (see Table 1). This construction process ensures that the indicator system possesses both theoretical support and practical applicability, laying the foundation for subsequent quantitative analysis.
Table 1.
Indicator Framework for Assessing HQD in China’s Livestock Sector industry.
2.2. Research Methods
2.2.1. Entropy-Weighted TOPSIS Method
To ensure the objectivity and reliability of the evaluation results, this paper applies the Entropy Weight TOPSIS method for measurement. Specifically, the entropy weight method objectively assigns weights based on the dispersion degree of the data, thus effectively avoiding subjective biases in expert scoring and the secondary uncertainty associated with combination weighting methods. This makes it highly suitable for inter-provincial panel data. Complementing this perfectly, the TOPSIS method uses the relative distance to the ideal solution as the basis for ranking, offering clear logic and intuitive results. Consequently, the combined method possesses objectivity, robustness, and comparability. It is well-suited to meet the analytical needs of this study and has been extensively validated within this research field [37,38]. The detailed steps are outlined below:
Step One: Data normalization. To remove the effects of varying units and magnitudes, the indicators are normalized.
Positive indicators
Negative indicators
where Xij′ is the normalized score of indicator j for unit i, Xij is the raw score of indicator j for unit i (i = 1, 2, …, n; j = 1,2, …, m), max (X1j, X2j, Xnj) denotes the maximum of indicator j, and min (X1j, X2j, Xnj) represents its minimum.
Step Two: Computing the share of unit i in indicator j.
Step Three: Computing the information entropy of indicator j.
Step Four: Computing the utility weight of indicator j.
Step Five: Determining the Weight Values.
Step Six: Construction of the Indicator Weighting Matrix Y.
Step Seven: The positive ideal value and its negative counterpart are identified for each indicator.
Step Eight: Computing the distance of each solution to the positive ideal (dz) and its negative counterpart (dr).
Step Nine: The relative proximity I between various scenarios and the ideal scenario is evaluated.
A larger I value indicates that the evaluation unit is closer to the optimum, reflecting a higher degree of high-quality development in the regional livestock sector.
2.2.2. Analysis of Spatial Autocorrelation
The spatial dependency, correlation, and variation in HQD across China’s livestock industry are examined using Moran’s I index in this study. The global and local Moran’s I indices are used to assess whether a specific attribute demonstrates spatial clustering within a given region. The global Moran’s I statistic lies in the range [−1, 1]. The sign of the value indicates the nature of spatial autocorrelation: positive for positive autocorrelation, and negative for negative autocorrelation. Values near zero imply a random spatial distribution of the attribute. The calculation formula is presented below:
Let n be the total number of provinces, xi and xj the observed HQD values for provinces i and j, x′ the mean HQD value across all provinces, and Wij the spatial weight matrix. The formula for the local Moran’s I is:
2.2.3. Estimation via Kernel Density
To analyze the spatiotemporal evolution of HQD in the livestock industry, this study utilizes KDE. The nonparametric technique of KDE was originally introduced by Rosenblatt [39] and Parzen [40]. It does not assume a predetermined distribution for the variables but estimates the probability density directly from the data using kernel functions. The method operates by centering a kernel function at each sample point, smoothing it with a bandwidth parameter, and then summing these smoothed functions to generate a continuous probability density curve or surface [37,41,42]. The KDE expression is:
where n denotes the total number of observations, K(·) represents the kernel density function, i indexes the province, xi refers to the observed value of the independently and identically distributed HQD index for the livestock sector, is the mean of these values, and h is the bandwidth. The bandwidth h plays a critical role in KDE, governing the smoothness of the density curve and the precision of estimation. Excessively large bandwidths produce overly smooth curves that may obscure underlying structures, whereas excessively small bandwidths generate jagged curves that amplify noise. To achieve an optimal estimate, this study adopts Silverman’s “rule of thumb” [43] to select the bandwidth and employs the widely used Gaussian kernel function, expressed as follows:
2.2.4. Obstacle Degree Model
A scientific assessment of the livestock industry’s HQD level is essential not only to evaluate its current status objectively but also to identify the key factors that constrain further progress. Such an assessment provides precise guidance for policy formulation. Therefore, following an assessment of China’s livestock industry HQD level, an obstacle degree model is applied in this study to accurately pinpoint the barriers to its high-quality transition. The model takes the following form:
In this model, Fj denotes the factor contribution, I represents the indicator deviation, is the standardized specific value, and Yj indicates the indicator’s degree of hindrance to HQD in the livestock industry.
2.3. Data Sources
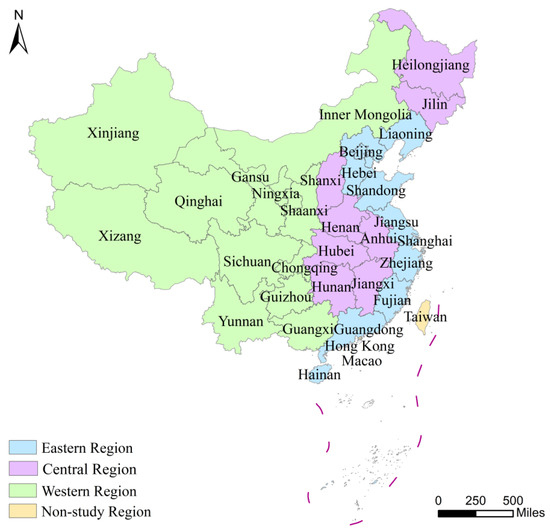
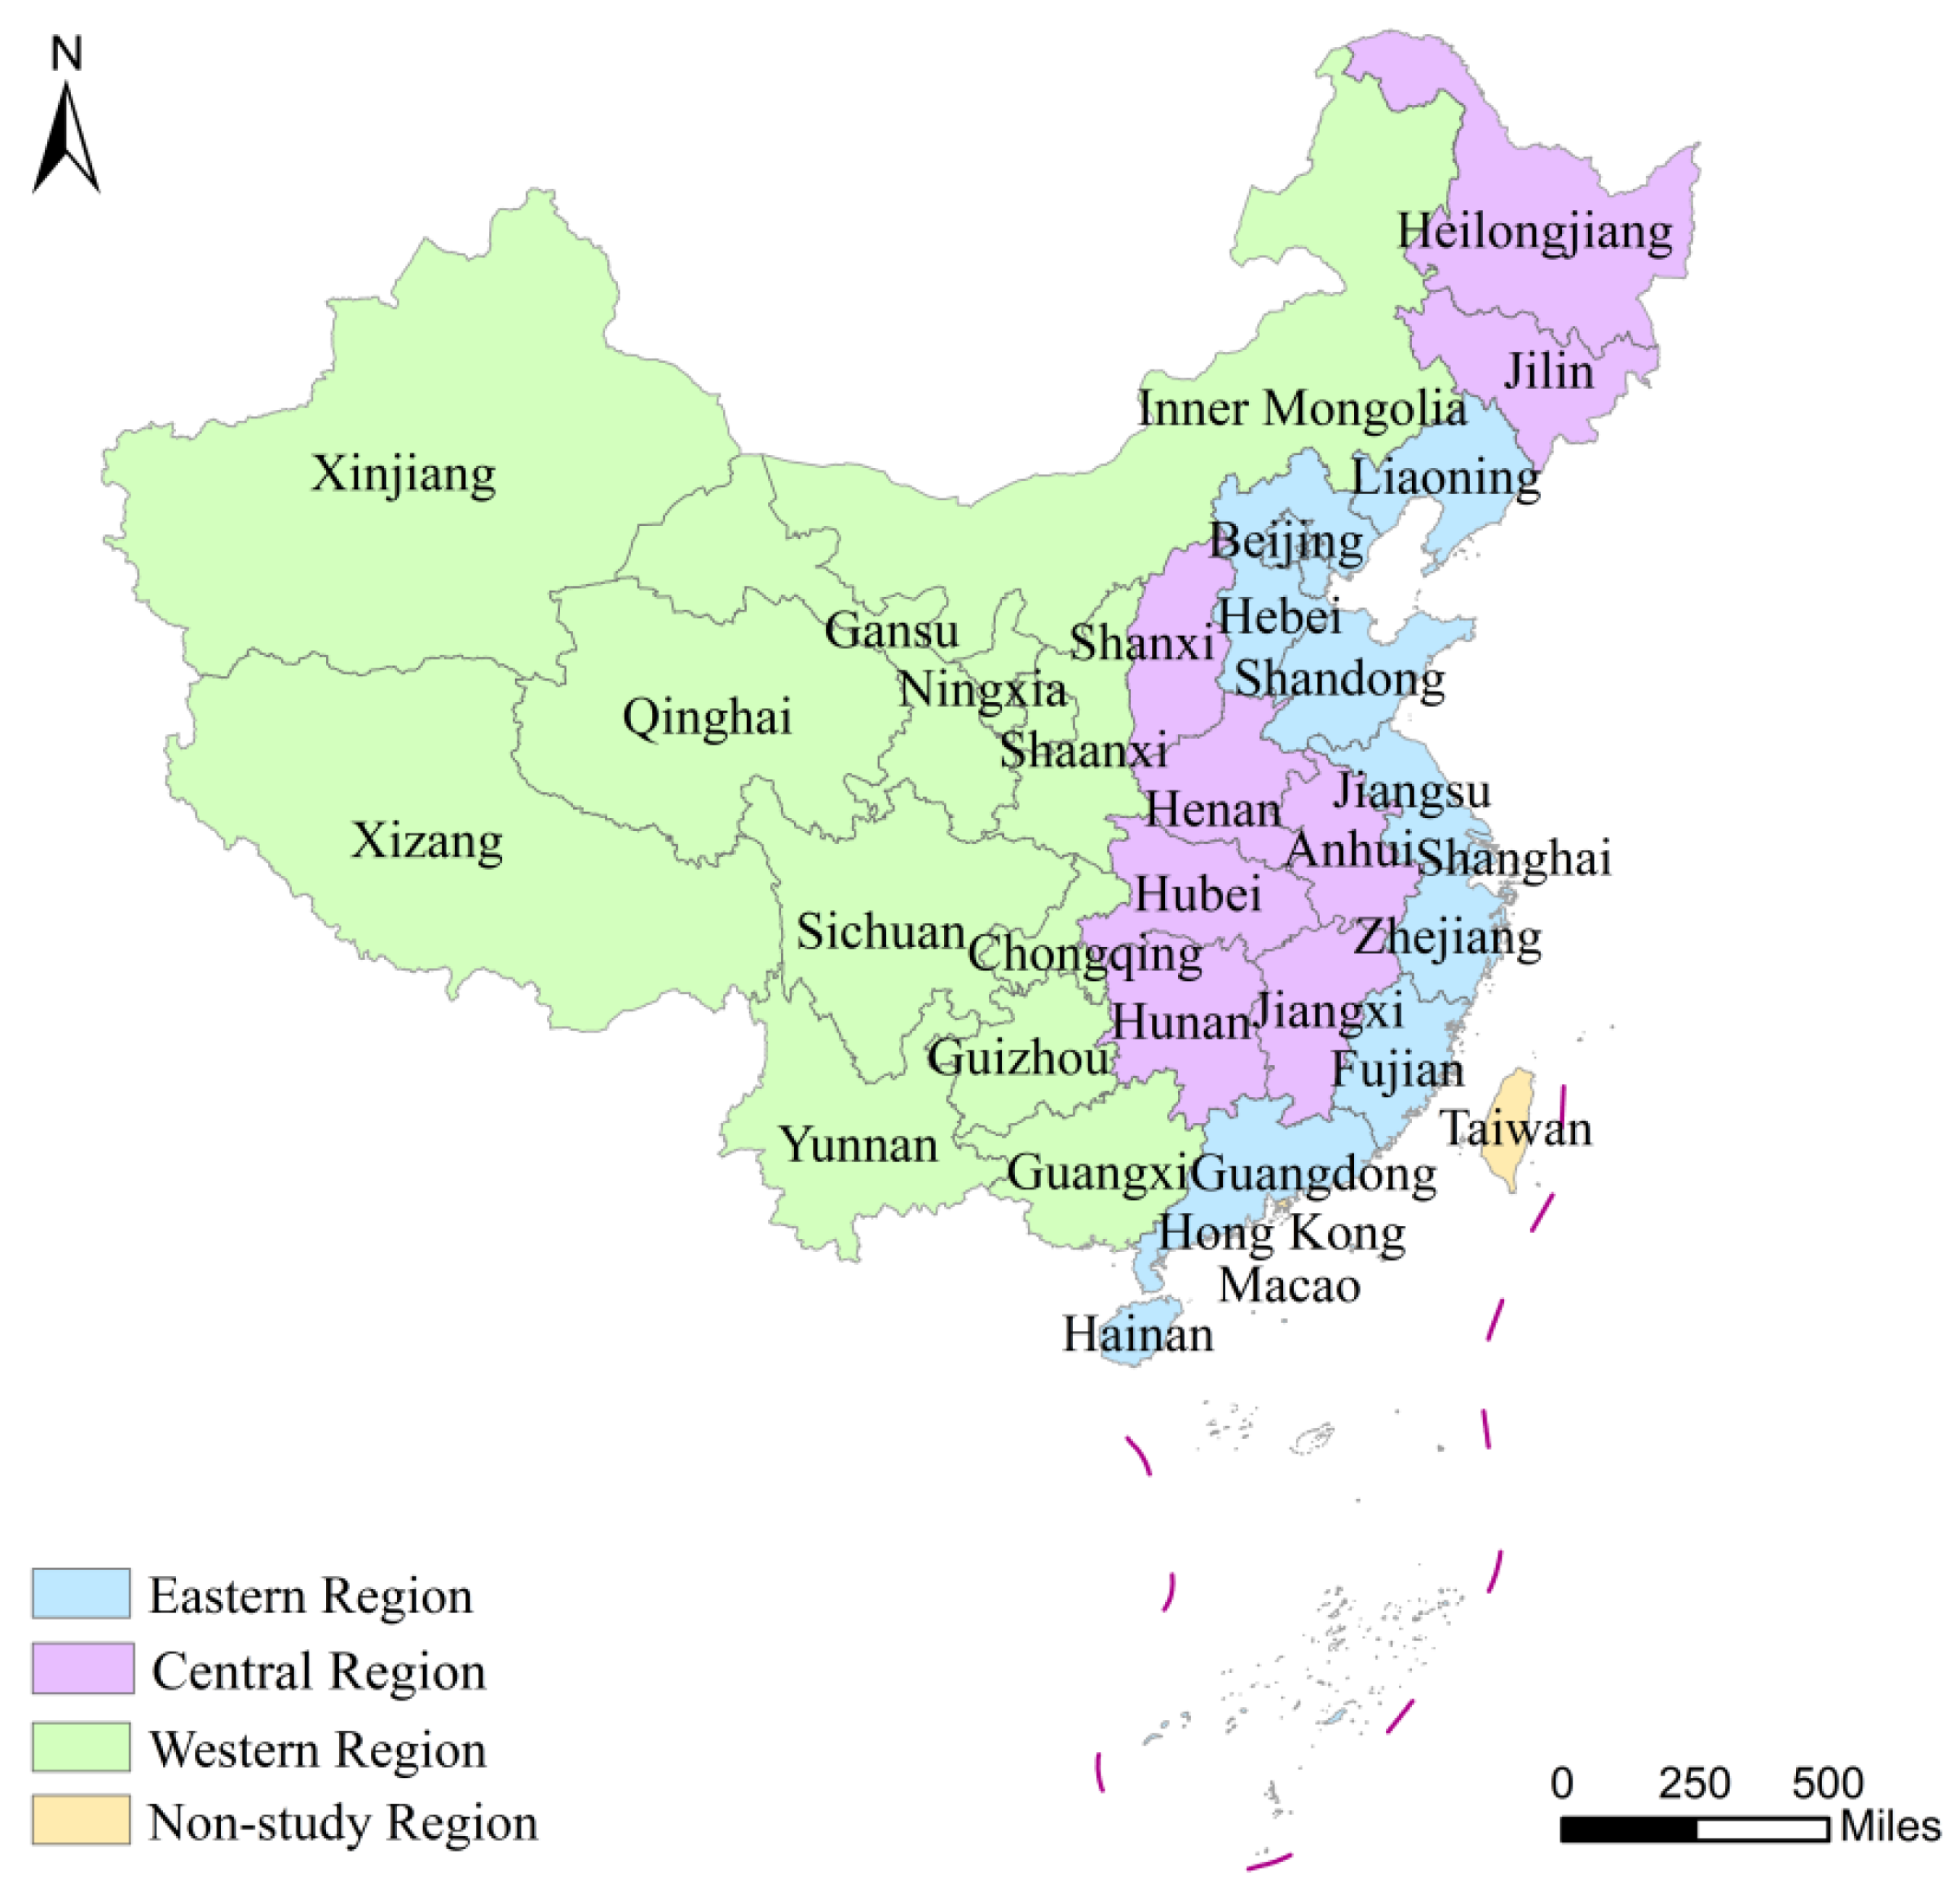
The analysis in this study draws on data spanning 2013–2022 from 31 provincial-level administrative divisions in China (including provinces, municipalities, and autonomous regions, with Hong Kong, Macao, and Taiwan excluded). The data are primarily sourced from the China Statistical Yearbook, China Environmental Statistical Yearbook, China Animal Husbandry and Veterinary Yearbook, and the China Green Food website. Total carbon emissions are estimated following the methodological framework of the IPCC Guidelines for National Greenhouse Gas Inventories, using localized emission coefficients derived by Huang Xiuquan et al. [44] from China’s actual livestock production conditions. According to the regional division criteria established by China’s National Bureau of Statistics, the 31 provincial-level administrative units in mainland China are grouped into three broad regions—eastern, central, and western—as illustrated in Figure 1. The Eastern region includes Beijing, Tianjin, Hebei, Liaoning, Shanghai, Jiangsu, Zhejiang, Fujian, Shandong, Guangdong, and Hainan. The Central region comprises Shanxi, Jilin, Heilongjiang, Anhui, Jiangxi, Henan, Hubei, and Hunan. The Western region consists of Inner Mongolia, Guangxi, Chongqing, Sichuan, Guizhou, Yunnan, Tibet, Shaanxi, Gansu, Qinghai, Ningxia, and Xinjiang.
Figure 1.
Administrative Divisions Map of China.
3. Results and Analysis
3.1. Regional Evaluation of HQD in the Livestock Industry
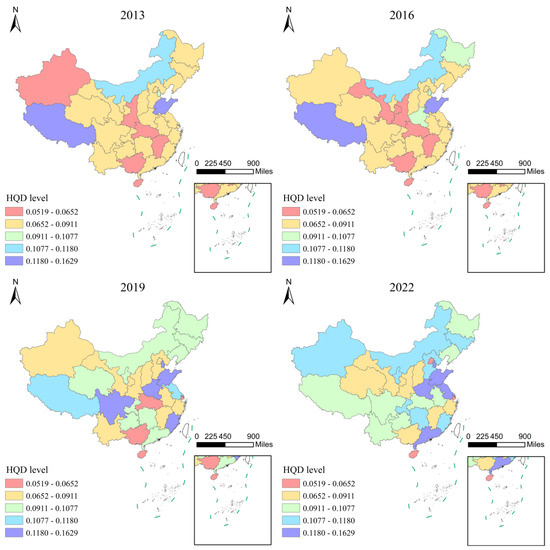
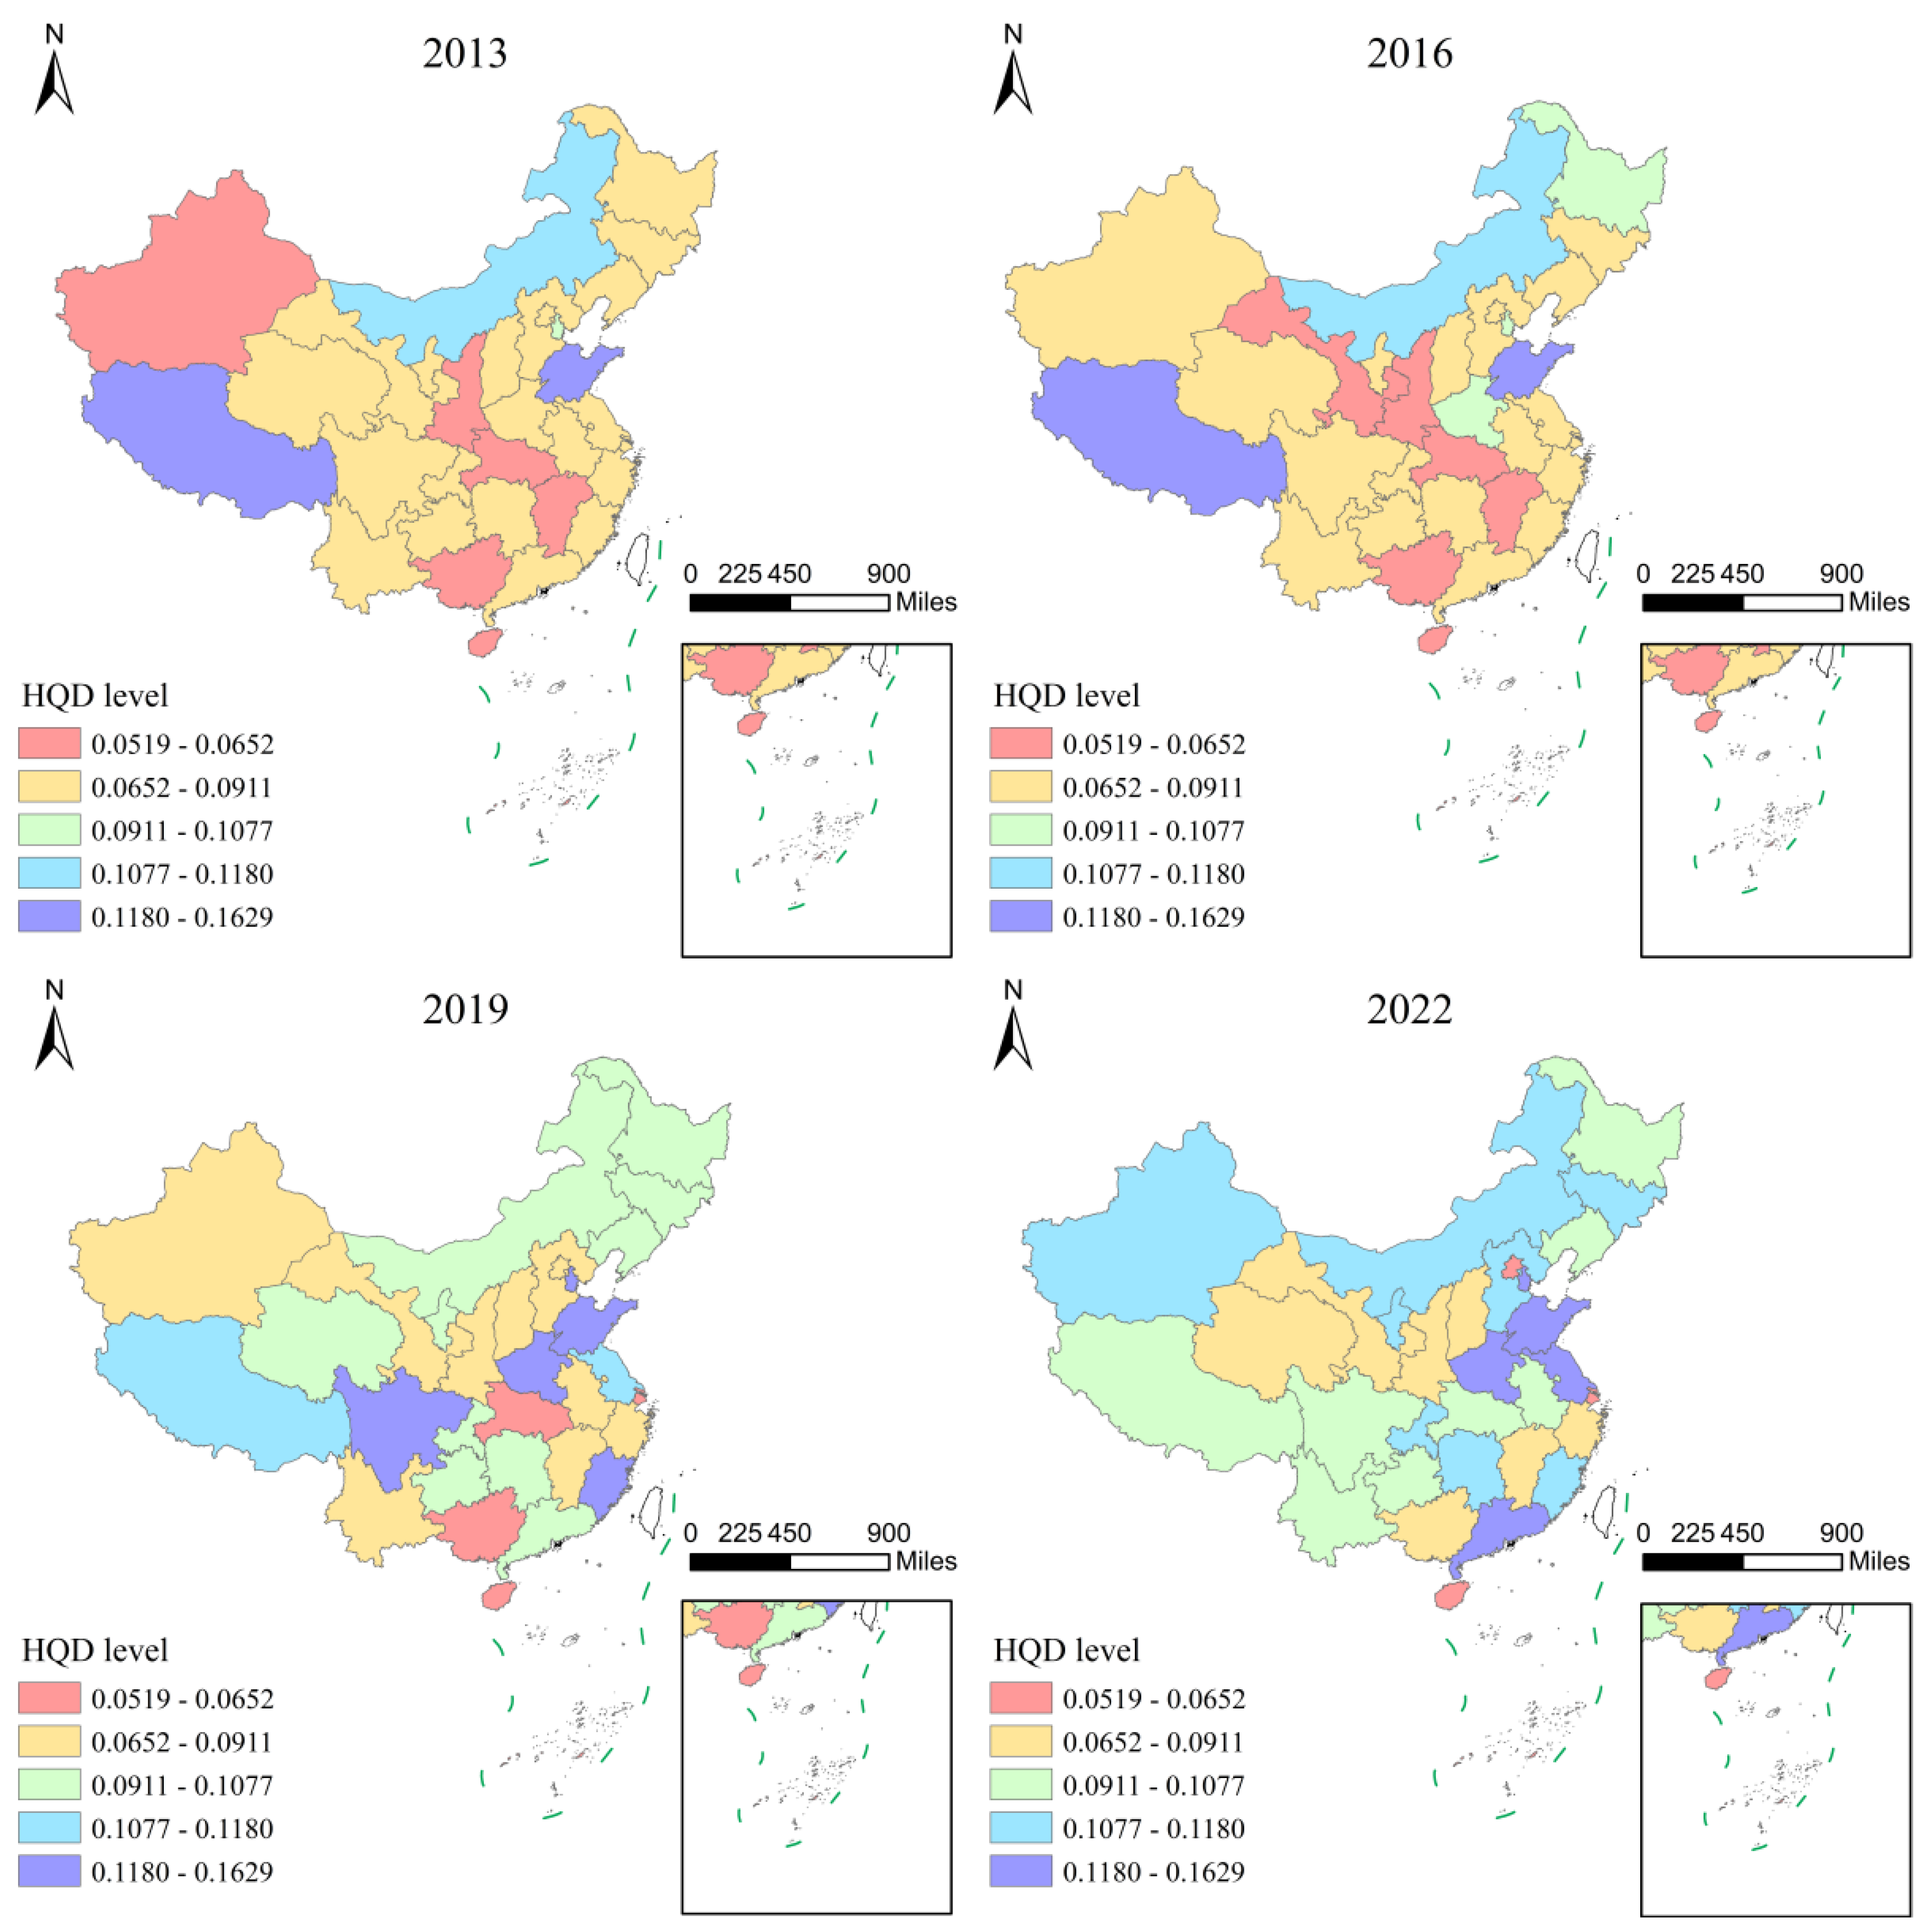
To visually illustrate the spatial variation characteristics of China’s high-quality livestock industry development level from 2013 to 2022, this paper selects data from four time points–2013, 2016, 2019, and 2022–as representative years. Using ArcMap 10.8 software, a visual analysis of the spatial distribution differences and evolutionary trends in development levels is conducted. The results are shown in Figure 1.
Figure 2 reveals that the livestock industry development level in the eastern region is relatively high and shows a significant upward trend. Most high-level provinces are concentrated in the east, with the number of high-level provinces increasing from one (Shandong) in 2013 to four (Shandong, Jiangsu, Tianjin, Guangdong) in 2022. Furthermore, the number of provinces at a relatively high level grew to two (Hebei, Fujian). In contrast, the development level in the central region is relatively stable, with provinces like Shanxi, Hubei, Jiangxi, and Anhui showing minor changes in their high-quality livestock industry development levels. Among these, Henan stands out as the most typical “growth potential stock” in the central region, leaping from a low level in 2013 to a high level in 2022, making it the only province in the central region with a continuously rising high-quality livestock industry development level. The overall development level in the western region is low and exhibits considerable volatility. Although the livestock industry development level in some western provinces has improved in recent years, the majority of provinces (Qinghai, Gansu, Guangxi, Ningxia) remain at a low level of HQD. Notably, the Tibet Autonomous Region shows a significant decline, falling from an initial high level to a medium level by 2022. This decline closely coincides with the introduction of the term “HQD” around 2017, a period when stricter environmental regulations were implemented, compounded by a pandemic, market fluctuations, and exposed local weaknesses such as inadequate infrastructure and insufficient technical support, further constraining its development.
Figure 2.
Spatial distribution of HQD level of the livestock industry in China. Note: Values shown are the average comprehensive scores of HQD level for each province over 2013–2022. The scores range from 0 to 1, with higher scores indicating higher levels of HQD.
As shown in Table 2, the national average of HQD in the livestock industry from 2013 to 2022 was 0.088. Provincial averages ranged from 0.048 to 0.163, reflecting a 3.4-fold difference. These significant inter-provincial variations highlight a degree of regional imbalance in China’s livestock industry. Shandong Province had the highest average value nationwide (0.141). This may be associated with its cluster-based development across the entire industry chain, advanced agricultural technologies, and effective epidemic prevention and regulatory systems. Hainan Province showed the lowest average value (0.053). This result likely stems from its geographical vulnerability to natural disasters and high dependence on imported feed raw materials, which increases its susceptibility to market fluctuations. Consequently, Hainan’s livestock industry has considerable room for improvement (Figure 2).
Table 2.
Ranking of HQD Levels in the Livestock Industry across Chinese Provinces, 2013–2022.
3.2. Spatial Autocorrelation Analysis of HQD in China’s Livestock Industry
3.2.1. Global Autocorrelation Analysis
Based on ArcGIS software and the HQD evaluation outcomes, a spatial autocorrelation analysis was conducted on China’s livestock sector over the 2013–2022 period. Table 3 reports a consistently negative global Moran’s I index for the entire 2013–2022 timeframe. Moreover, all p-values were below 0.05, and the absolute values of the Z-scores exceeded 1.65. These results point to a consistently significant negative spatial correlation in HQD within China’s livestock industry over the 2013–2022 period. Specifically, provinces with high development levels were mainly surrounded by those with low levels, whereas low-level provinces were often adjacent to high-level ones, forming an alternating “high-low” distribution pattern across regions. Regarding temporal trends, the magnitude of Moran’s I exhibited a slight decline between 2020 and 2022, accompanied by a marginal weakening of the negative spatial dependence. However, the overall “high-low alternating” spatial pattern remained largely unchanged.
Table 3.
Global Moran’s Index.
3.2.2. Local Autocorrelation Analysis
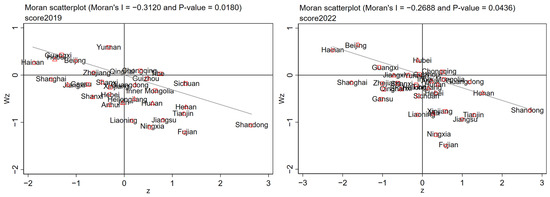
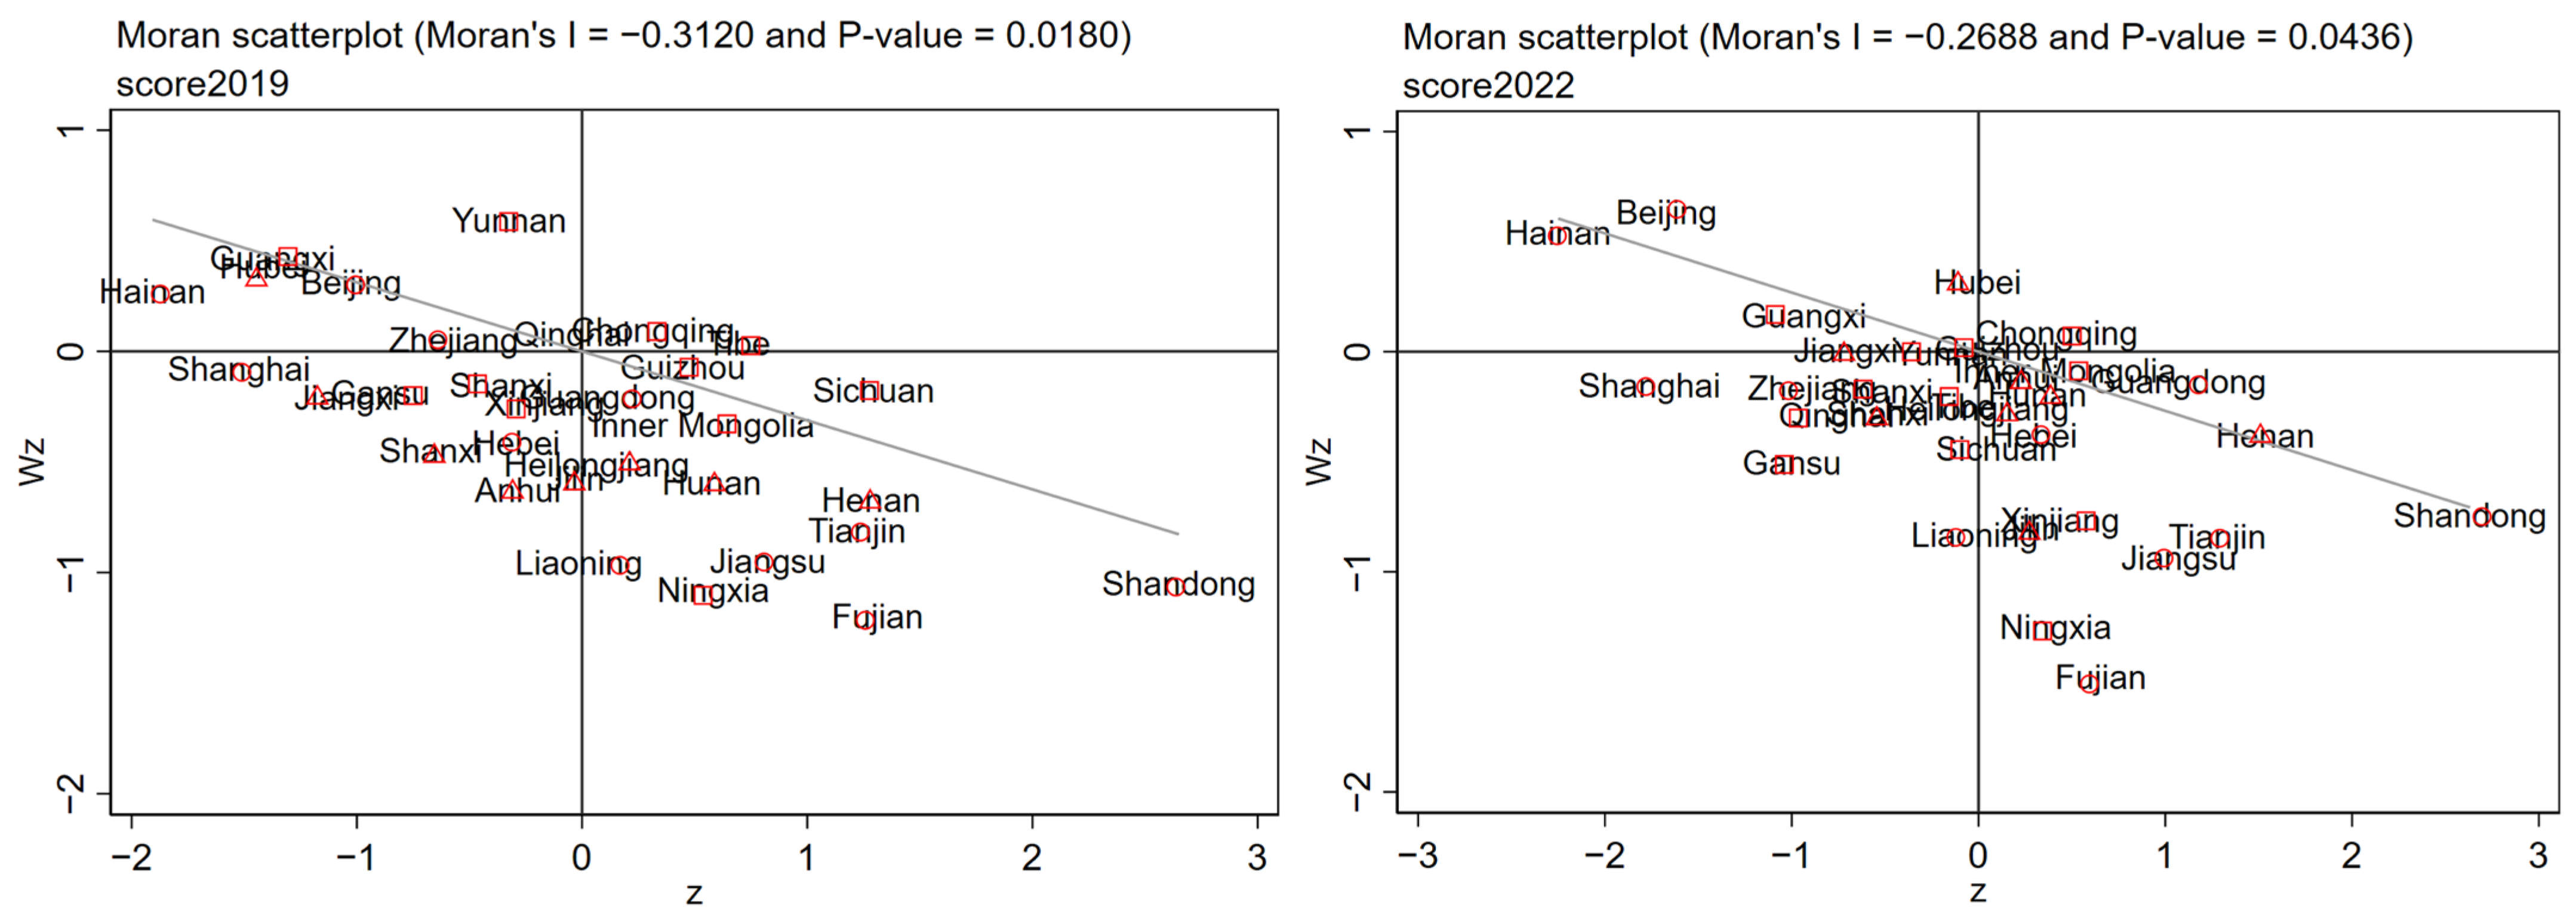
To further examine the spatial clustering of HQD in China’s livestock industry at the sub-regional level, this study constructed Moran’s I scatter plots for 2019 and 2022.
As shown in Figure 3, in the local Moran’s I scatter plots for 2019 and 2022, most provinces are located in the second quadrant (high-low) and the fourth quadrant (low-high), consistent with the global autocorrelation results. This distribution indicates a significant negative spatial correlation in the HQD of China’s livestock industry across provinces. Provinces in the fourth quadrant are numerous and densely distributed, whereas those in the second quadrant are fewer and more scattered. Together, these patterns reflect an alternating spatial arrangement of high- and low-level development in the livestock industry. Although a few provinces appear in the first and third quadrants, they are rare and spatially dispersed, failing to form contiguous high-high or low-low clusters. Comparing 2019 and 2022, provinces in the fourth quadrant became more densely clustered in 2022, expanding areas characterized by “low readings encircled by high ones.” However, no distinct high-high or low-low clusters emerged overall, indicating that the significant negative spatial correlation persisted and that same-level spatial clustering did not form. The significant negative spatial correlation remained consistent across regions throughout the study period.
Figure 3.
Spatial Clustering Dynamics of HQD in China’s Livestock Sector. Note: Circle = Eastern Region; Triangle = Central Region; Square = Western Region.
3.3. Dynamic Evolution of HQD in China’s Livestock Industry
3.3.1. Analysis of Overall Evolutionary Trends
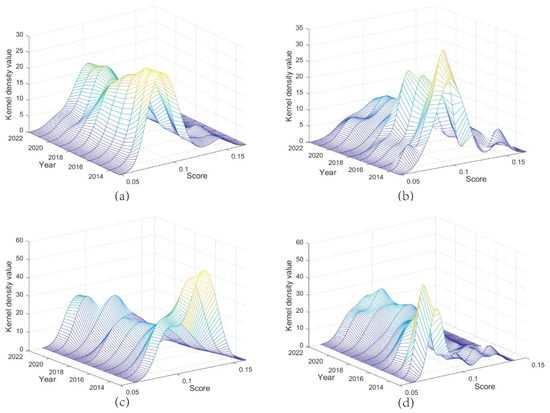
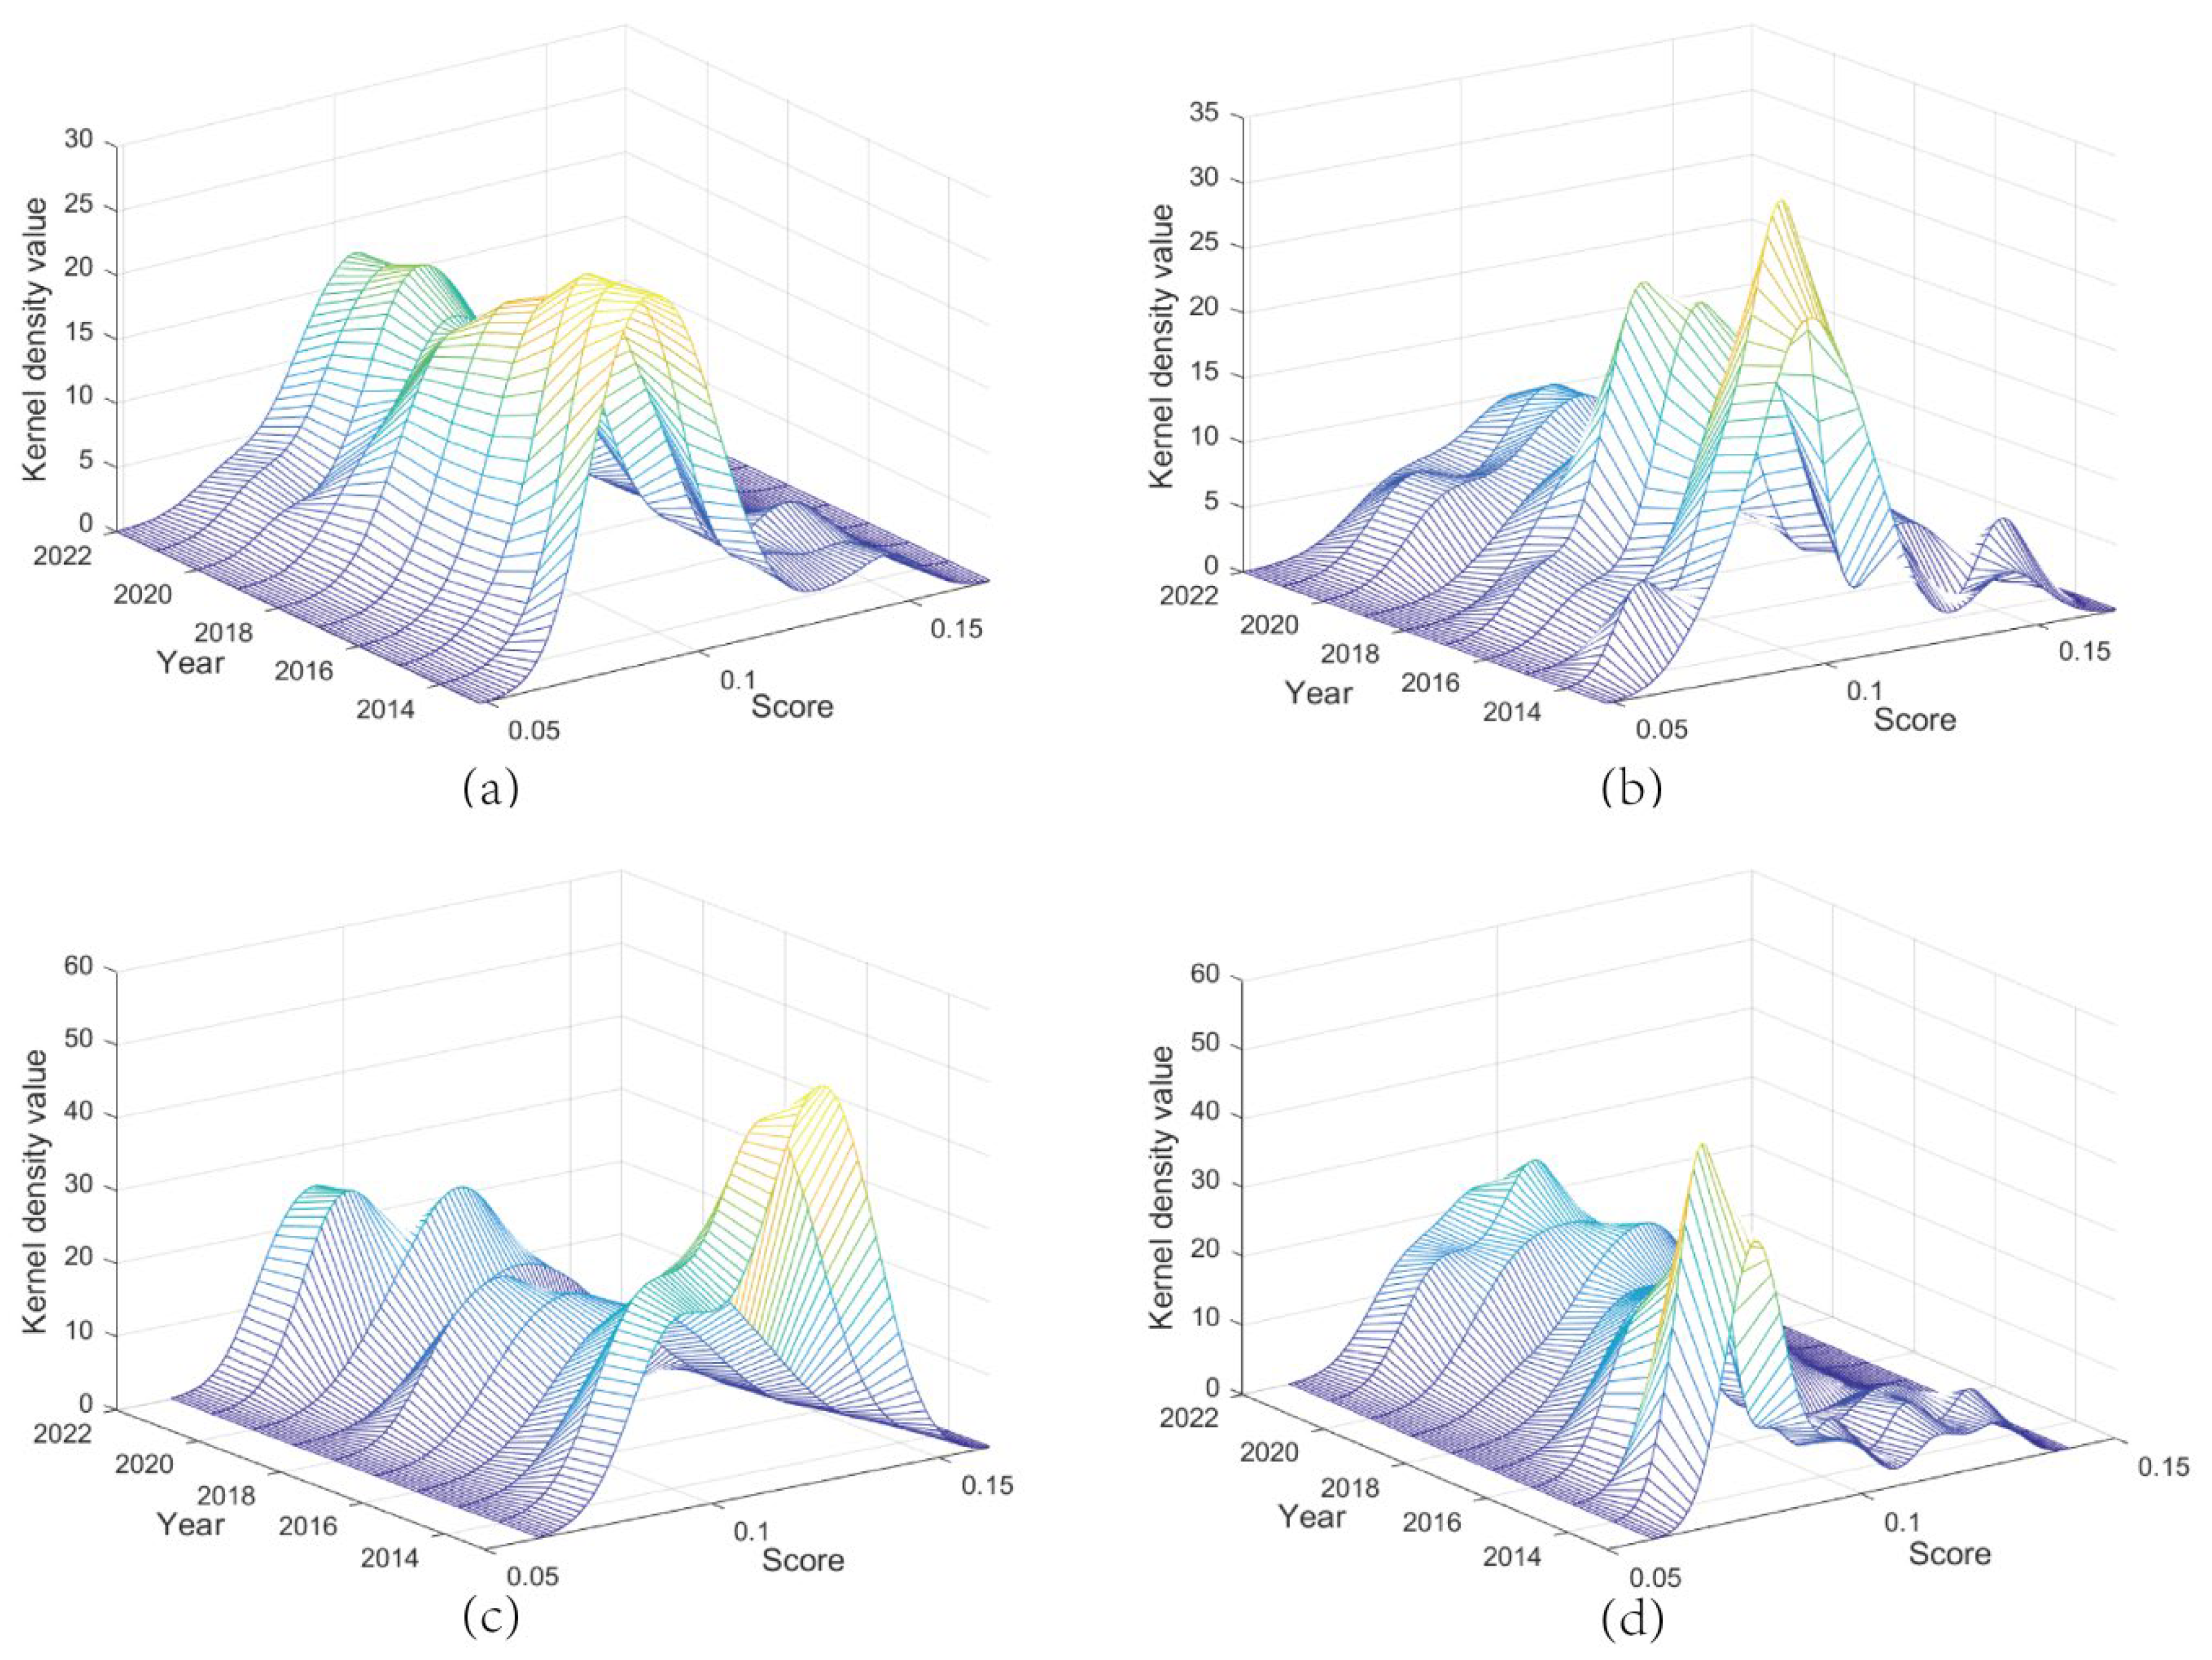
According to Figure 4a, the national kernel density curve shows a rightward shift in its center, indicating a steady improvement in the HQD level of the livestock industry. Furthermore, the distribution pattern shows a “rise-then-fall” trend in peak height and a “narrow-then-widen” trend in width. Inter-provincial development disparities followed a U-shaped trajectory, narrowing initially and then widening. The “rise-then-narrow” pattern reflects increased concentration of development and reduced inter-provincial gaps, while the “decrease-then-widen” pattern indicates greater dispersion and widening gaps. Regarding tail characteristics, the curve shows a pronounced right-tailing trend with a gradually widening tail. This indicates persistent development imbalances between high- and low-level provinces and suggests a potential for “club convergence,” where disparities between high- and low-level provinces may solidify during polarization. In terms of polarization, the curve exhibited a brief lateral peak (i.e., a multi-peak structure) between 2014 and 2018, followed by a trend toward monotonic smoothness. This suggests that regional differentiation in high-quality livestock development has eased somewhat compared to earlier periods, and overall continuity at this level has improved.
Figure 4.
Dynamic Evolution Trends of HQD in the Livestock Industry across Eastern, Central, and Western China. Note: (a) China; (b) Eastern Region; (c) Central Region; (d) Western Region. The color gradient represents the kernel density value; yellow indicates higher density (more provinces concentrated at that development level), and blue-purple indicates lower density.
3.3.2. Analysis of Dynamic Evolution Trends in Subregions
As shown in the KDE results for the eastern region in Figure 4b, the distribution center shifted continuously rightward from 2013 to 2022, with the shift accelerating significantly after 2018. This reflects a steady increase in the HQD level of the livestock sector within the eastern region. Regarding distribution patterns, the primary peak decreased and narrowed from 2013 to 2017, indicating convergence in regional disparities. From 2018 to 2022, the primary peak further decreased and broadened, reflecting widening inter-provincial gaps and exhibiting a temporal pattern of “initial convergence followed by divergence.” The distribution tail consistently exhibited a right-tailing feature that expanded annually, reflecting the sustained strengthening of leading advantages in high-level provinces. Regarding polarization characteristics, the curve consistently exhibits a unimodal shape without multimodal features, aligning with the diffusion pattern of core regions described in the “growth pole theory.” This indicates that high-performing provinces continuously strengthen their lead without forming independent secondary growth clusters, resulting in a development pattern characterized by “significant gradient differences but structural continuity.”
According to the KDE results for the central region in Figure 4c, the distribution center shifted leftward from 2013 to 2022, indicating a gradual decline in the overall HQD level of the region. In terms of distribution morphology, the main peak height decreased while its width narrowed, suggesting low concentration in the HQD of the livestock industry. Regarding the distribution tail, the curve exhibits a short right tail with limited extension, revealing that development in the central region remains without substantial breakthroughs. The advantages of high-level development are not pronounced, and development within the region remains relatively balanced. In terms of polarization, the curve consistently maintains a unimodal shape without multimodal or lateral peaks, suggesting that the central region lacks distinct development tiers or secondary clusters and exhibits a pattern of “moderate differentiation.”
From the KDE results for the western region in Figure 4d, the distribution center showed slight fluctuations during the study period without a pronounced overall rightward shift. This indicates that the improvement in the HQD level of the western livestock industry has been slow, suggesting challenges in achieving sustainability across economic, environmental, and social dimensions, presenting a relatively sluggish trend. The distribution profile is characterized by low peak height and wide width, reflecting generally low and dispersed development levels among provinces and persistent inter-provincial disparities. Regarding tail characteristics, the right tail is long and distinctly extended, while the low-scoring left tail narrows. This indicates that while some western provinces have achieved relatively high development levels, a significant number remain in the low-level range. A growing disparity between high and low levels is emerging, becoming a core bottleneck for coordinated high-quality regional development. In terms of polarization, the curve exhibits a “low and flat” single-peak shape without forming growth poles. This paper characterizes this phenomenon as a “low-level lock-in” state. Its operational definition is: during the study period, the center of the development level distribution shows no significant rightward shift, the primary peak remains concentrated in the low-value range for an extended period, and no clear trend of transition to a higher level is observed. This “low-level equilibrium” essentially represents a “locked-in” state within a low-development trap, closely linked to factors such as regional resource constraints and slow technology diffusion.
3.4. Analysis of Obstacles to HQD in China’s Livestock Industry
3.4.1. Analysis of Obstacles at the Secondary Indicator Level
Table 4 presents the results of an obstacle degree analysis conducted on China’s livestock industry for the period 2013–2022. The obstacle levels are ranked as follows: product safety (55.05%) > environmental friendliness (19.76%) > output efficiency (17.96%) > resource conservation (4.69%) > regulatory effectiveness (2.54%). Product safety constitutes the greatest obstacle, with its average barrier level consistently above 54.43% and reaching 55.05% over the decade. This indicates that product safety is the primary barrier to HQD in China’s livestock industry, suggesting that addressing bottlenecks in this area is crucial for advancing the sector. environmental friendliness and output efficiency also significantly constrain HQD, with ten-year average obstacle levels of 19.76% and 17.96%, respectively. This suggests that China must continuously enhance environmental sustainability and output efficiency to advance HQD within its livestock sector. Resource conservation and regulatory effectiveness pose relatively minor obstacles, with the average obstacle level for regulatory effectiveness being only 2.54%. This suggests that under the current development model, constraints on HQD from resource utilization and regulatory management in the livestock industry are relatively minor, indicating a relatively well-adapted developmental foundation.
Table 4.
Barrier Levels of Secondary Indicators, 2013–2022.
3.4.2. Analysis of Obstacles at the Tertiary Indicator Level
The results for each tertiary indicator from 2013 to 2022 are presented in Table 5. The top ten limiting factors primarily belong to the categories of product safety and output efficiency. The product safety category comprises the annual count of green food certifications (C21), the share of large-scale pig farms (C22), R&D funding intensity (C23), and veterinary technician specialization levels (C24). Output efficiency indicators include per capita meat, egg, and milk production (C11), livestock’s share of total agricultural output (C12), and labor productivity (C13). By indicator ranking, the share of large-scale pig farms (C22) and annual green food certifications (C21) consistently ranked as the top two obstacles. This indicates that C22 and C21 represent persistent “hard constraints” on livestock development, as current mitigation measures have shown limited effectiveness, requiring urgent resolution. Environmental fiscal support (C43) increased from 17.58% to 18.46%. Although the increase is modest, it shows an upward trend, indicating that its constraining effect is gradually strengthening. Labor productivity (C13) decreased from 9.82% to 9.40%, suggesting that its constraining effect is weakening. In summary, achieving HQD in the livestock industry requires targeted efforts and breakthroughs through reforms and technological upgrades focused on these key obstacles.
Table 5.
Ranking of the Top Ten Obstacle Factors to HQD in China’s Livestock Industry, 2013–2022.
4. Discussion
This study measures and analyzes the HQD of China’s livestock industry, revealing significant disparities at both the provincial and regional levels. These disparities stem from the varying constraints imposed by different factors on the industry’s development.
- (1)
- The measurement results indicate that China’s livestock industry exhibits significant regional disparities in HQD levels, showing a decreasing gradient from east to west. This finding aligns with Shi et al. [45]. This pattern stems from the spatially uneven allocation of core subsystems, including technology, institutions, and ecology. The eastern region shows a much higher level of HQD than the central and western regions, primarily due to differences in economic foundations, technological capabilities, and ecological conditions. The eastern region, having developed earlier economically, possesses a more mature livestock industry chain and comprehensive supporting resources (e.g., scientific research capabilities and infrastructure), which provide sustained support for its development. In contrast, the central and western regions face obstacles to development due to factors such as weaker innovation capacity and severe ecological constraints. Kazanski et al. emphasize that understanding livestock systems requires considering contextual factors such as economic, environmental, and socio-cultural conditions, and that the goals pursued vary significantly across regions [46]. The regional differentiation observed across eastern, central, and western China represents an adaptive choice made by each region under its respective resource endowment constraints—the eastern region, leveraging its first-mover advantages, can pursue a capital- and technology-intensive upgrading path, whereas the western region, constrained by ecological fragility, must explore an “ecology-first” development model centered on ecological conservation. This differentiation in development pathways, which aligns sustainable development goals with local realities, resonates with the “pragmatic sustainability” perspective—namely, that sustainable development pathways should be grounded in regional contexts and constraints rather than rigidly adhering to standardized universal models [47]. It also echoes the “sustainable community” concept, which emphasizes the coordinated development of production, living, and ecology at the local level as the fundamental unit [48]. Therefore, this context-specific, regionally differentiated governance approach offers important methodological insights for building resilient and sustainable livestock communities and facilitating coordinated transformation in developing countries with significant internal disparities.
- (2)
- Spatially, the HQD level of China’s livestock industry shows a negative correlation pattern characterized by alternating high and low levels. This pattern may stem from the industry’s inherent resource dependency and biosecurity constraints: development is heavily constrained by local resources (e.g., forage, water, soil), while livestock movement is restricted by disease prevention requirements. These factors offset the technological spillover effects of geographical proximity, exacerbating inadequate industrial coordination and barriers to factor mobility, which in turn lead to significant regional development disparities. Furthermore, the inefficient cross-regional flow of high-end factors (e.g., superior breeds and technologies), fragmented product markets due to differing disease zoning and environmental policies, and the lack of cooperation between eastern and western regions further hinder industrial efficiency. This spatial fragmentation, driven by resource dependency and biosecurity barriers, suggests that when formulating regional coordination policies, other countries should prioritize addressing both physical and institutional barriers to factor mobility.
- (3)
- KDE reveals the spatiotemporal path dependence of HQD in China’s livestock industry. At the national level, a pattern of “initial convergence followed by divergence” emerges, indicating that inter-provincial disparities widened in later stages and regional development momentum diverged. Regionally, the eastern region exhibits a “growth pole” pattern, with its distribution center shifting continuously rightward without forming secondary peaks. This indicates that despite its relatively strong development, the eastern region still shows weak cohesion and limited spillover effects. The central region’s “steady but slow development” reflects insufficient momentum, whereas the western region remains in a state of “low-level lock-in.” This reveals that China’s regional coordination mechanism remains underdeveloped, as the eastern region’s first-mover advantage has yet to drive coordinated development in the central and western regions. Accelerating intra-regional and cross-regional factor mobility and enhancing knowledge sharing across regions are essential to establish a multi-centered, networked development model. China’s sequential pattern of “convergence followed by divergence,” along with the “polarization” and “lock-in” effects between regions, offers empirical observations consistent with development economics theories related to “growth diffusion” and the “poverty trap.”
- (4)
- Based on the analysis of obstacle severity, product safety and environmental friendliness are currently the two major barriers constraining HQD. The relatively low obstacle degree in the effective regulation dimension indicates that, within the current policy framework, government regulation has played a significant role in promoting the HQD of the livestock industry. This may be attributed to China’s sustained policy support for the livestock industry in recent years, such as financial subsidies, price stabilization mechanisms, and industrial planning guidance. These measures have contributed to a relatively mature regulatory mechanism, which acts as a “stabilizer” rather than a “bottleneck” in the industry’s transformation. It is noteworthy that while the low obstacle degree confirms policy effectiveness, caution is also warranted regarding the potential diminishing marginal returns of regulatory policies or the risk of excessive intervention, in order to seek an optimal balance between the government and the market. For product safety, efforts should focus on strengthening regulatory systems, implementing full-process control, and providing standardized training for livestock farmers. For environmental friendliness, policy support should be enhanced to guide the livestock industry toward environmentally friendly development models, promoting water-saving practices and integrated crop-livestock systems within circular agriculture. The sequence of identified barriers (product safety > environmental friendliness > output efficiency) empirically confirms that within the global sustainable livestock agenda, “safety” and “green” represent more fundamental and urgent transformation thresholds than mere “efficiency gains.”
5. Conclusions
5.1. Research Findings
This study constructs an evaluation system for the HQD of the livestock industry that aligns with the international sustainable development framework, based on five dimensions: product safety, output efficiency, resource conservation, environmental friendliness, and effective regulation. It employs an integrated approach utilizing the entropy-weighted TOPSIS method, spatial autocorrelation analysis, KDE, and an obstacle degree model for analysis. This evaluation framework can serve as a methodological reference for quantitative research in the livestock industry and related fields.
- (1)
- The HQD of China’s livestock industry exhibits a significant pattern of regional differentiation. The eastern region, leveraging its first-mover advantages, has accumulated innovative elements such as capital and talent, thereby forming a high-level developmental potential energy and holding a leading position in the national regional landscape. The central region’s transformation momentum is still insufficient, while the western region remains at a low level due to ecological constraints and lagging technology diffusion. This pattern indicates that the transformation of the livestock industry is by no means a synchronized linear process but is shaped by the interplay of regional initial endowments and developmental pathways.
- (2)
- Spatial analysis reveals a negative correlation characteristic of “high-low alternation,” and no spatial clustering at the same level formed during the study period. This finding confirms the unique development logic of the livestock industry: because the industry is highly dependent on local resources and subject to circulation restrictions due to disease prevention and control factors, geographical proximity has not yet translated into actual technological spillovers. Regional coordinated development is constrained by the practical barriers posed by both resource dependence and biosecurity.
- (3)
- The HQD of the livestock industry follows an evolutionary trajectory of “convergence first, divergence later,” forming a differentiation pattern at the regional level characterized by “polarization in the east, stability in the central region, and locking-in in the west.” This evolutionary path suggests that regional development disparities have a self-reinforcing tendency, the radiative effect of growth poles is limited, and low-level regions are prone to falling into development traps. This finding provides empirical observation at the industrial level for the theories of “growth diffusion” and “poverty traps” in development economics.
- (4)
- Obstacle degree analysis indicates that product safety and environmental friendliness are the core bottlenecks restricting HQD, with their cumulative obstacle degree approaching 75%. This obstacle sequence reveals that in the phased priorities of livestock industry transformation, “safety” and “greenness” are more fundamental and urgent threshold conditions than “efficiency enhancement.” The relatively low obstacle degree in the effective regulation dimension confirms the relative maturity of the livestock industry support policy system in recent years. By quantifying these specific bottlenecks, this paper provides a clear diagnostic basis for policies promoting food security (SDG 2) and ecosystem protection (SDG 15).
It should be noted that this evaluation framework is proposed based on the actual conditions of China’s livestock industry. Therefore, when extending it to other countries, adjustments must be made in light of specific contexts: In developed countries that have completed their industrial transformation, the primary contradictions have shifted towards environmental carrying capacity or animal welfare. Consequently, the indicator weights should be adjusted accordingly. In clear contrast, for developing countries primarily engaged in traditional grazing, directly using certain indicators (such as the proportion of large-scale farming) may have limitations due to data availability and the stage of industrial development. Such indicators should be simplified or replaced based on local conditions. The core value of this framework lies in providing an adaptable methodological approach, allowing countries to localize the indicators according to their own development stage.
5.2. Limitations and Future Research Directions
This study has the following limitations, which also represent avenues for future research: First, although the construction of the evaluation indicator system strives for comprehensiveness, constrained by data availability, certain important dimensions of resource conservation—such as nutrient use efficiency (the recycling of nitrogen and phosphorus) and land occupation—have not yet been formally incorporated into the evaluation framework. Therefore, this indicator should be added in the future when data conditions permit. Second, the connotation of HQD in the livestock industry is rich. While this paper measures it across five dimensions, subsequent research could conduct more detailed explorations in the dimension of division and indicator selection. Third, while spatial autocorrelation analysis reveals the spatial correlation characteristics of HQD levels, the underlying mechanisms and driving factors behind this phenomenon still warrant systematic investigation. Fourth, although the obstacle degree model identifies key constraining factors, to guide policy design, it is also necessary to understand how these factors are intervened upon in actual policies and what the practical effects of such interventions are. Therefore, future policy design should prioritize the two major bottleneck areas of product safety and environmental friendliness.
Author Contributions
Data curation: J.L.; Investigation: J.L. and J.Y.; Writing—original draft: H.Z.; Writing—review and editing: H.Z. and J.Y.; Supervision: C.W.; Validation: J.Y.; Visualization: J.L. All authors have read and agreed to the published version of the manuscript.
Funding
This work was supported by the Jie Bang Gua Shuai Science and Technology Research Project (Grant No. 2023ZXJ02B03) and the Double First-Class Characteristic Discipline Platform Project of Heilongjiang Province (Grant No. HLJ2022TSXK).
Institutional Review Board Statement
Not applicable.
Informed Consent Statement
Not applicable.
Data Availability Statement
The data that support the findings of this study are available from the corresponding author upon reasonable request.
Acknowledgments
We also extend our sincere thanks to the tutors and all the students in the lab for their valuable inputs, contributions, and engaging discussions during the group meetings.
Conflicts of Interest
The authors declare no conflicts of interest.
References
- Rueda García, A.M.; Fracassi, P.; Scherf, B.D.; Hamon, M.; Iannotti, L. Unveiling the nutritional quality of terrestrial animal source foods by species and characteristics of livestock systems. Nutrients 2024, 16, 3346. [Google Scholar] [CrossRef] [Scilit]
- Zhou, K.; Zhou, F.; Chen, L.; Li, H.; Wang, H.; Li, J. Alleviating environmental pressure from livestock production: A “livestock-resource environmental carrying capacity” perspective in China. Ecol. Indic. 2024, 160, 111800. [Google Scholar] [CrossRef] [Scilit]
- Zeng, Y.; Gulzar, M.A.; Wang, Z.; Zhao, X. The effect of expected financial performance on corporate environmental responsibility disclosure: Evidence from China. Environ. Sci. Pollut. Res. 2020, 27, 37946–37962. [Google Scholar] [CrossRef] [Scilit]
- Li, M.; Huang, K.; Xie, X.; Chen, Y. Dynamic evolution, regional differences and influencing factors of HQD of China’s logistics industry. Ecol. Indic. 2024, 159, 111728. [Google Scholar] [CrossRef] [Scilit]
- Zhang, L.; Wang, Y.; Dunya, R. How does environmental regulation affect the development of China’s pig industry. Sustainability 2023, 15, 8258. [Google Scholar] [CrossRef] [Scilit]
- Su, T.; Li, C. Spatial-temporal characteristics and influence factors of HQD of livestock industry industry in China. PLoS ONE 2025, 20, e0313906. [Google Scholar] [CrossRef] [Scilit]
- Luo, G.; Cui, J. Exploring high quality development of animal husbandry in Qinghai province from the perspective of the Tibetan sheep industry. Sci. Rep. 2024, 14, 21500. [Google Scholar] [CrossRef] [Scilit]
- Central Committee of the Communist Party of China & State Council. Guidelines on deepening rural reform and advancing rural revitalization. Policy document. Shanghai Rural. Econ. 2025, 2, 4–8. [Google Scholar]
- Hefferon, K.L.; Downs, S.; Oliu, G.O.; De Steur, H. Editorial: Sustainable Development Goals (SDGs): Impact on Nutrition. Front. Nutr. 2021, 8, 676080. [Google Scholar] [CrossRef] [Scilit] [PubMed]
- Miranda, J.J.; Zavaleta-Cortijo, C. The food crisis in the context of climate change and sustainable development goals. Rev. Peru. Med. Exp. Salud Publica 2023, 40, 392–394. [Google Scholar] [CrossRef] [Scilit]
- Si, L.; Wang, P.; Cao, D. Towards sustainable development goals: Assessment of wind and solar potential in northwest China. Environ. Res. 2024, 252, 118660. [Google Scholar] [CrossRef] [Scilit] [PubMed]
- Hosseini, H. Why development is more complex than growth: Clarifying some confusions. Rev. Soc. Econ. 2003, 61, 91–110. [Google Scholar] [CrossRef] [Scilit]
- Lupien John, R. Dietary assessment issues of concern to policymakers: Statement from the Food and Agriculture Organization of the United Nations. Am. J. Clin. Nutr. 1994, 59, 269S–270S. [Google Scholar] [CrossRef] [Scilit]
- Cheng, C.; Ren, X.; Dong, K.; Dong, X.; Wang, Z. How does technological innovation mitigate CO2 emissions in OECD countries? Heterogeneous analysis using panel quantile regression. J. Environ. Manag. 2021, 280, 111818. [Google Scholar] [CrossRef] [Scilit]
- Ji, C.; Cao, W.; Chen, Y.; Yang, H. Carbon balance and contribution of harvested wood products in China based on the production approach of the intergovernmental panel on climate change. Int. J. Environ. Res. Public Health 2016, 13, 1132. [Google Scholar] [CrossRef] [Scilit]
- Ruggerio, C.A. Sustainability and sustainable development: A review of principles and definitions. Sci. Total Environ. 2021, 786, 147481. [Google Scholar] [CrossRef] [Scilit]
- Sun, X.; Fang, S.; Zhang, S. High-Quality Economic Development in Huaihe Economic Zone Level Measurement Evaluation. J. Math. 2021, 2021, 6615884. [Google Scholar] [CrossRef] [Scilit]
- Li, X.; Lu, Y.; Huang, R. Whether foreign direct investment can promote high-quality economic development under environmental regulation: Evidence from the Yangtze River Economic Belt, China. Environ. Sci. Pollut. Res. Int. 2021, 28, 21674–21683. [Google Scholar] [CrossRef] [Scilit]
- Wang, K.; Zhang, B.; Jiang, S.; Ding, R. Urban Ecological Economic Resilience in China: Spatio-Temporal Evolution, Influencing Factors, and Trend Prediction. Systems 2021, 12, 525. [Google Scholar] [CrossRef] [Scilit]
- Liu, J.; Lin, C.; Wang, X.; Liu, X. Spatiotemporal differentiation and analysis of factors influencing HQD of resource-based cities: An empirical study based in China. PLoS ONE 2024, 19, e0304460. [Google Scholar] [CrossRef] [Scilit]
- Yang, Y.; Ren, L.; Du, Z.; Tong, G. Measurement and spatiotemporal analysis of HQD of China’s industry. PLoS ONE 2021, 16, e0259845. [Google Scholar] [CrossRef] [Scilit] [PubMed]
- Li, J.; Wang, X. Towards HQD: The complex role of environmental regulation. PLoS ONE 2025, 20, e0312816. [Google Scholar] [CrossRef] [Scilit]
- Guo, Y.; Jiang, X.; Zhu, Y.; Zhang, H. Measurement and spatial correlation analysis of HQD Level: A case study of the Yangtze River Delta urban agglomeration in China. Heliyon 2024, 10, e29209. [Google Scholar] [CrossRef] [Scilit]
- Chen, L.; Huo, C. The measurement and influencing factors of high-quality economic development in China. Sustainability 2022, 14, 9293. [Google Scholar] [CrossRef] [Scilit]
- Feng, N.; Yan, M.; Yan, M. Spatiotemporal Evolution and Influencing Factors of New-Quality Productivity. Sustainability 2024, 16, 10852. [Google Scholar] [CrossRef] [Scilit]
- Xu, H.; Ren, H.; Zhou, T.; Xu, X. Coupling and Coordination Characteristics of Agricultural Water Resources and Economic Development in the Qilian Mountains Region. Agriculture 2025, 15, 2551. [Google Scholar] [CrossRef] [Scilit]
- Wang, Y.; Jia, X.; Wang, Z.; Wang, J.; Qiu, S.; Guo, Z.; Du, J. Coupling and Coordination Analysis of Land Use Function and Ecological Quality in Yellow River Basin, Henan Province, China. Sustainability 2024, 16, 10699. [Google Scholar] [CrossRef] [Scilit]
- Fan, M.; Wang, Y.; Ye, S.; Wei, C.; Xue, Z. The Spatial Network Characteristics of the Coupling Coordination Degree Between Pollution and Carbon Reduction and HQD in the Yangtze River Economic Belt. Land 2024, 13, 2102. [Google Scholar] [CrossRef] [Scilit]
- Ding, M.; Cai, J.; Xu, J.; Yang, Q.; Chen, F.; Wu, Y. Spatio-Temporal Evolution and Synergistic Development of Urban Road Infrastructure and Urbanization: Evidence from 101 Chinese Cities. Systems 2025, 13, 885. [Google Scholar] [CrossRef] [Scilit]
- Li, B.; Liu, Z. Measurement and evolution of HQD level of marine fishery in China. Chin. Geogr. Sci. 2022, 32, 251–267. [Google Scholar] [CrossRef] [Scilit] [PubMed]
- Wang, D.; Cheng, X. Study on the path of HQD of the construction industry and its applicability. Sci. Rep. 2024, 14, 14727. [Google Scholar] [CrossRef] [Scilit]
- He, Y.; Zhou, G.; Tang, C.; Fan, S.; Guo, X. The spatial organization pattern of urban-rural integration in urban agglomerations in China: An agglomeration-diffusion analysis of the population and firms. Habitat Int. 2019, 87, 54–65. [Google Scholar] [CrossRef] [Scilit]
- Liu, B. An analysis of energy efficiency of the Pearl River Delta of China based on super-efficiency SBM model and Malmquist index. Environ. Sci. Pollut. Res. 2023, 30, 18998–19011. [Google Scholar] [CrossRef] [Scilit]
- Chen, Y.; Zhu, M.; Lu, J.; Zhou, Q.; Ma, W. Evaluation of ecological city and analysis of obstacle factors under the background of HQD: Taking cities in the Yellow River Basin as examples. Ecol. Indic. 2020, 118, 106771. [Google Scholar] [CrossRef] [Scilit]
- Hu, J.; Liang, J.; Tian, L.; Wang, S. Measurement and coupling coordination of HQD in Guangdong province of China: A spatiotemporal analysis. Int. J. Environ. Res. Public Health 2023, 20, 4305. [Google Scholar] [CrossRef] [Scilit]
- Yu, F.W.; Huang, X.; Wang, G.L. HQD of animal husbandry: Theoretical interpretation and realization path. Chin. Rural. Econ. 2021, 4, 85–99. [Google Scholar]
- Zhu, H.; Xiong, B.; Tang, M. Spatio-temporal evolution and distribution characteristics of the HQD of China’s insurance industry. PLoS ONE 2025, 20, e0311568. [Google Scholar] [CrossRef] [Scilit]
- Qin, S.; Han, Z.; Chen, H.; Wang, H.; Guo, C. HQD of Chinese Agriculture under Factor Misallocation. Int. J. Environ. Res. Public Health 2022, 19, 9804. [Google Scholar] [CrossRef] [Scilit]
- Rosenblatt, M. Remarks on some nonparametric estimates of a density function. Ann. Math. Stat. 1956, 27, 832–837. [Google Scholar] [CrossRef] [Scilit]
- Parzen, E. On estimation of a probability density function and mode. Ann. Math. Stat. 1956, 33, 1065–1076. [Google Scholar] [CrossRef] [Scilit]
- Hao, D.; Wang, R.; Gao, C.; Song, X.; Liu, W.; Hu, G. Spatial-Temporal Characteristics and Influence Factors of Carbon Emission from Livestock Industry in China. Int. J. Environ. Res. Public Health 2022, 19, 14837. [Google Scholar] [CrossRef] [Scilit] [PubMed]
- Zhao, X.; Li, T.; Duan, X. Spatial and temporal evolution of urban carbon emission efficiency in China. Environ. Sci. Pollut. Res. Int. 2023, 30, 114471–114483. [Google Scholar] [CrossRef] [Scilit]
- Silverman, B.W. Density estimation for statistics and data analysis. In Monographs on Statistics and Applied Probability; Chapman and Hall: London, UK, 1986; Available online: https://ned.ipac.caltech.edu/level5/March02/Silverman/paper.pdf (accessed on 18 March 2026).
- Huang, X.; Xu, X.; Wang, Q.; Zhang, L.; Gao, X.; Chen, L. Assessment of Agricultural Carbon Emissions and Their Spatiotemporal Changes in China, 1997–2016. Int. J. Environ. Res. Public Health 2019, 16, 3105. [Google Scholar] [CrossRef] [Scilit]
- Shi, S.; Guo, Y.; Liu, C.; Zang, F. Evaluation of the Regional Livestock High Quality Development in China Based on Spatial–Temporal Heterogeneity. Sustainability 2025, 17, 1290. [Google Scholar] [CrossRef] [Scilit]
- Kazanski, C.E.; Balehegn, M.; Jones, K.; Bartlett, H.; Calle, A.; Garcia, E.; Hawkins, H.J.; Mayberry, D.; McDonald-Madden, E.; Odadi, W.O.; et al. Context is key to understand and improve livestock production systems. Glob. Food Secur. 2025, 45, 100840. [Google Scholar] [CrossRef] [Scilit]
- D’Adamo, I.; Gastaldi, M.; Nallapaneni, M.K. Europe Moves toward Pragmatic Sustainability: A More Human and Fraternal Approach. Sustainability 2024, 16, 6161. [Google Scholar] [CrossRef] [Scilit]
- de la Mora, G.D.; Sánchez-Nupan, L.O.; Castro-Torres, B.; Galicia, L. Sustainable Community Forest Management in Mexico: An Integrated Model of Three Socio-ecological Frameworks. Environ. Manag. 2021, 68, 900–913. [Google Scholar] [CrossRef] [Scilit]

Disclaimer/Publisher’s Note: The statements, opinions and data contained in all publications are solely those of the individual author(s) and contributor(s) and not of MDPI and/or the editor(s). MDPI and/or the editor(s) disclaim responsibility for any injury to people or property resulting from any ideas, methods, instructions or products referred to in the content. |
© 2026 by the authors. Licensee MDPI, Basel, Switzerland. This article is an open access article distributed under the terms and conditions of the Creative Commons Attribution (CC BY) license.