


Abstract
The energy system is transforming in clean, low-carbon, safe, and efficient directions. As a key carrier of energy consumption, the operation optimization of the integrated energy system (IES) in industrial parks has become an important lever for facilitating energy transformation. This paper focuses on the modeling of the operation optimization of the IES, pays attention to the impact of electricity–carbon–green certificate coordination, and studies the operation optimization of the IES considering hydrogen energy utilization. Firstly, the topological structure of IES is analyzed, and a model of the integrated energy system in industrial parks covering multiple energy links, such as electricity, heat, and gas, is constructed. Hydrogen energy conversion units such as electrolyzers, fuel cells, and methane reactors are introduced. Secondly, the impact of electricity, carbon, and green certificate markets on the operation of IES is analyzed, and a green certificate-carbon trading integration mechanism is designed, along with the establishment of a corresponding market trading model. Then, with the system’s energy purchase and sale costs, electricity curtailment costs, carbon market transaction costs, green certificate transaction revenues, and equipment operation and maintenance costs as the core, an IES daily optimization scheduling model is constructed to minimize the overall cost. Finally, the feasibility of the model constructed in this paper is verified through a case study in the industrial park in the north of Dezhou, Shandong Province, and the result shows that the cost of IES is 15,013.7 yuan under the optimal operation schedule. The utilization rate of new power energy reaches 89.6%, and the 2.135 green certificates are converted into the carbon market. Meanwhile, comparative analysis across multiple scenarios and sensitivity analysis of single factors are conducted to discuss the necessity and effectiveness of the factors considered in this paper, providing a decision-making basis and inspiration for managers to carry out IES operation scheduling.
1. Introduction
1.1. Background and Motivation
Against the backdrop of the serious issues in energy and environment, promoting the low-carbon transition of the energy sector and advancing the development of renewable energy have become effective countermeasures [1]. As a representative of low-carbon electricity, the integrated energy system (IES) achieves multi-energy complementarity through the production, conversion, storage, and utilization of multiple energy streams, contributing to the improvement of energy efficiency and reduction in emissions [2,3]. However, traditional IES primarily relies on combined heat and power (CHP) for energy supply, leaving room for optimization in terms of energy efficiency and emission reduction [4]. Hydrogen energy serves a crucial role in driving deep decarbonization in the power sector, with its clean and flexible characteristics [5,6]. Therefore, introducing hydrogen into IES has emerged as a potential breakthrough for optimizing traditional IES structures and enhancing their performance [7]. Additionally, to promote carbon emission reduction and renewable energy consumption, China has signed the mechanism of carbon trading and renewable energy quota [8]: the former targets entities that generate carbon emissions, treating carbon emission rights as a tradable commodity, while the latter targets renewable energy producers and consumers, treating green certificates as a tradable commodity. Both mechanisms are designed to facilitate emission reduction goals and optimize resource allocation through well-structured market mechanisms [9]. For IES, which generates carbon emissions and uses renewable energy [10], taking the impacts from electricity–carbon–green certificate trading would be an effective way to optimize system operation.
Therefore, IES, hydrogen energy, electricity trading, carbon trading and green certificate trading can intersect. However, research that collectively addresses these aspects and develops corresponding mathematical models remains limited at this stage. On the one hand, hydrogen energy can serve as a medium for Power-to-X in IES, leveraging energy conversion to enhance energy utilization efficiency. Yet, the mechanisms involved in the conversion process and how to model and integrate them require further explanation. On the other hand, the coupling effects among electricity, carbon, and green certificate markets could receive more attention, and the complex interrelationships among them need to be clarified and mathematically characterized.
This paper aims to explore the potential positive impacts on IES of the coupling of electricity, carbon, and green certificate markets alongside hydrogen utilization. To this end, an optimization model for IES operation has been constructed, with the consideration of hydrogen utilization under the coupling of different markets. The objective of the model is to identify the optimal operational strategy for the system under multi-market coupling, with the aim of minimizing economic costs. Multi-scenario analysis is employed to summarize management measures and recommendations for IES, thereby providing managerial insights and guidance for relevant decision-makers.
1.2. Problems and Solutions
This study investigates the optimization of IES operation concerning hydrogen utilization in the context of electricity, carbon, and green certificate markets. Proposing an extension to traditional IES optimization, which integrates the influences of novel market mechanisms and system structures. The primary challenges encountered by the research subject of this paper can be outlined as follows: (1) how can the interrelationships among the electricity, carbon, and green certificate markets be reflected in the IES, and how do differences in the number of coupled markets and trading mechanisms affect the operation of the IES; (2) how to model the conversion forms of hydrogen utilization within the IES and assess the impact of considering hydrogen utilization on the IES; (3) how to appropriate optimization goals and boundary conditions can be formulated.
In response to the multiple points mentioned above, the following solutions are proposed for the derivation of system optimization operation schemes: (1) an analysis of the rules governing the electricity, energy market, carbon trading market, and green certificate trading market will be conducted. Thereafter, a linkage mechanism equivalent to that of a carbon-green certificate will be designed, and the carbon trading and green certificate trading model will be put forward. The impacts of different single markets and the combinations will be considered sequentially to conduct comparative studies; (2) the theoretical framework will be expanded to encompass electrolytic water hydrogen production, hydrogen-to-methane conversion, hydrogen fuel cells, and hydrogen energy storage equipment within the IES, showing the characterization of the production, utilization, and storage of hydrogen within the system. A comparative analysis will be conducted with and without hydrogen utilization to verify its impact on the IES; (3) establish the model with optimization goal in energy purchase/sale costs, penalties for wind and solar curtailment, green certificate trading, carbon quota trading, and operational maintenance costs, and the solver is employed to solute the operation model to find the proper daily scheduling strategy.
1.3. Contributions and Innovations
By studying the optimization of IES operation, which considers hydrogen utilization under the coupling of electricity, carbon, and green certificate markets, the contributions of this paper can be summarized as follows:
- (1)
- Clarifying the interrelationships among electricity, carbon, and green certificate trading within the IES, promoting the integrated development of various markets, and enhancing the economic and low-carbon development of the system;
- (2)
- Providing a theoretical modeling framework for the IES that incorporates hydrogen utilization, offering references for related scholars to study and develop system topological structures;
- (3)
- Obtaining a 24 h operation strategy for the energy park based on the proposed optimization model through simulation, and conducting comparative and sensitivity analyses under different scenarios, thereby providing decision-making support for managers in practical park dispatching.
The innovations of this paper can be summarized as:
- (1)
- Simultaneously incorporating hydrogen utilization and multi-market coupling into the operation optimization modeling of IES, quantitatively characterizing the sub-module features of complex system operations, enriching the system topological structure and clarifying the system optimization logic;
- (2)
- Establishing a conversion relationship between green certificates and carbon emissions based on market trading prices, breaking through the traditional parallel relationship between carbon markets and green certificate markets in IES research, and refining the actual quantities of carbon emissions and green certificates in IES under the fusion of carbon and green certificate markets;
- (3)
- Constructing an operation optimization model for an IES to minimize total costs. Sub-objectives such as “energy purchase/sale costs, penalties for wind and solar curtailment, green certificate trading, carbon trading, and operational maintenance costs” are used to represent the economic performance of system operations, thereby obtaining the optimal economic operation strategy for the system.
The rest of the structure of the paper is arranged as follows: Section 2 presents the literature review; Section 3 explains the coupling among markets and models the system structure; Section 4 validates the proposed operation optimization model through simulation examples and conducts discussions; Section 5 summarizes the work of the paper and provides an outlook.
2. Literature Review
2.1. Research About the IES Operation Optimization
An IES is characterized by the coupling and complementarity of multiple energy subsystems, including electricity, heat, and gas. It integrates various energy resources on the supply side and achieves coordinated optimization across energy processes—including production, distribution, conversion, consumption, and storage—during planning, operation, and trading. This forms an integrated energy production, supply, and marketing system. Compared with the shortcomings of traditional energy systems, which exhibit low coupling density among energy types and high independence of energy networks, the IES provides an effective pathway to improve energy utilization efficiency and promote low-carbon energy transition [11]. In 2003, Switzerland first launched the “Vision of Future Energy Networks” project, marking the beginning of research on IES. Subsequently, countries such as the United States, Germany, and Japan have advanced IES research and practice at different levels, and the Chinese government has also focused on and accelerated the development of IES during the 13th and 14th Five-Year Plan periods.
The structure of an IES is complex and can be broadly summarized into three parts: the energy supply side, the energy conversion side, and the load side [12]. constructed the structure of a distributed integrated energy system into four parts included: (1) Energy Supply Side: power grid, heating network, natural gas network, and distributed power sources; (2) Energy Conversion Side: combined cooling, heating, and power systems, heat pumps, and electric refrigeration equipment; (3) Energy Storage Side: battery energy storage and thermal storage tanks; (4) Energy Consumption Side: electricity, heating, and cooling loads. Dong, Zhang [13] established an IES architecture that includes the external power grid, natural gas network, wind power generation, photovoltaic systems, combined heat and power units, electric heating boilers, gas-fired boilers, electrical energy storage, and thermal energy storage. Zhou, Tan [14] constructed an integrated energy system composed of a gas turbine, a photovoltaic panel, a solar thermal collector, a ground source heat pump, and an absorption unit to achieve energy generation and conversion. It is also configured with a battery and a water storage tank to supplement or store energy to maintain the system’s energy supply and load balance.
In these studies, the focus of power-to-gas has primarily been on natural gas, while the role of hydrogen has been neglected. However, as a secondary energy source with high calorific value and low pollution, hydrogen holds broad application prospects in IES. Its power-to-hydrogen conversion reaches 80% efficiency, compared to 55% for power-to-natural gas [15]. This is particularly relevant in the context of promoting clean energy. Wang, Xian [16] modeled the power-to-gas process in an IES, which is divided into two stages: power-to-hydrogen and methanation. The produced hydrogen is mixed with natural gas, which can effectively realize low carbon emissions and improve the operating economy. Zhang and Liu [17] incorporated hydrogen utilization and conducted refined modeling, providing mathematical expressions for three key components: electrolytic hydrogen production, hydrogen methanation, and hydrogen fuel cells. Zhou, Li [18] thought that hydrogen can strengthen the interaction between renewable energy and various energy sources and realize the time–space conversion and utilization of renewable energy. From the perspective of energy system structure, historical research on IES has evolved from neglecting hydrogen energy to actively incorporating it. Hydrogen energy has been demonstrated to contribute to reducing carbon emissions in IES and facilitating low-carbon operations. Therefore, considering hydrogen energy utilization in the study of IES operation optimization is both necessary and significant.
The objective of IES operation optimization is to achieve the best overall benefits by coordinating the operations of relevant equipment in the system while meeting relevant constraints (such as energy supply and demand, emission targets, etc.). Therefore, the optimization objectives for integrated energy system operations are inherently complex. Yang and Liu [19] integrated the environmental and economic objectives into IES configuration optimization by assigning weights to each objective. Ren, Li [20] developed a robust optimization model for IES dispatch aimed at maximizing energy conversion efficiency and minimizing operational costs and emissions. Further, an improved intelligent algorithm was employed to solve the model. Ruiming [21] investigated the optimal operation of an IES with hydrogen storage, constructing a multi-objective power dispatch model with objective functions of operational and environmental costs, then an improved NSGA-II algorithm was employed to solve the model. Gao, Meng [22] proposed an optimization objective composed of energy purchase costs, carbon trading costs, and energy curtailment costs. The model is solved using the CPLEX solver with the assistance of the YALMIP toolbox. Zhou, Wu [23] proposed an objective function centered on economic performance and environmental performance, and the model is solved using the YALMIP toolbox. Huang, Liang [24] focused on the operation optimization of an IES that incorporates electricity, heat, and cooling. To reduce computational complexity, linearization methods are applied to the nonlinear polynomials in the objective function, and the problem is ultimately solved through the GUROBI solver.
Previous research has developed diverse topological structures for IES, with system optimization objective functions covering various dimensions such as economic, environmental, and efficiency aspects. Scholars have constructed mathematical models by defining optimization boundaries and objectives, and they have derived optimal operational strategies for IES using improved algorithms or commercial solvers. For this study, it is feasible to integrate impacts from multiple dimensions by leveraging economic performance as a comprehensive measure that encapsulates environmental costs, efficiency costs, and other related factors.
2.2. Research About the Market of Electricity, Carbon Trade, and Green Certificate
As countries worldwide successively propose carbon neutrality goals, emission reduction targets have become increasingly urgent. The green transformation of the energy and power systems is imperative. Developing carbon trading and green certificate trading is crucial for promoting emission reductions in key industries and increasing the consumption of renewable energy [25]. The power market, carbon market, and green certificate market can effectively form a synergistic force. Utilizing multi-market coupling and linkage to promote the development of a low-carbon economy has become a significant research direction at present [26,27]. Gao, Meng [22] asserted that the role of carbon trading in optimization dispatch problems is to incorporate carbon trading costs into the objective function of the model, thereby driving the system’s operational outcomes toward greater economic efficiency and lower carbon emissions. Wu and Li [28] incorporated the carbon trading mechanism into the optimal dispatch of the IES and analyzed the economic costs and carbon emissions of the IES under electricity-carbon coupling. The results indicated that considering carbon trading can enable the system to achieve a low-carbon electricity supply and absorption. Zeng, Du [29] integrated the carbon trading and green certificate trading mechanisms by incorporating the costs associated with IES participation in carbon emission rights trading and green certificate trading into the operation optimization objective. The results demonstrate that reasonable carbon trading and green certificate trading prices can drive down the costs of the IES. Luo, Qin [30] established a market framework for integrated carbon-green certificate trading with the supply, demand, and trading of quotas as the linkage, and incorporated this framework into the operation optimization model of the IES. This approach enhances the integration of renewable energy in the IES while simultaneously reducing overall system carbon emissions. Suo, Li [31] established a day-ahead optimal dispatch model that considers joint carbon-green certificate trading for an IES but did not account for the issue of double-counting of renewable energy environmental attributes. From existing research, it can be observed that carbon trading and green certificate trading can effectively reduce carbon emissions and enhance renewable energy integration. In IES studies, scholars have already investigated their impacts. However, at the current stage, most research independently discusses the role of carbon trading mechanisms in emission reduction or the promotion of renewable energy integration by green certificate systems. It remains difficult to adequately explain and model the coupling relationships among electricity, carbon, and green certificates within IES, as these markets remain in a relatively independent state.
2.3. The Findings from the Literature Review
The literature review reveals that IES is a current research focus in the energy field. The topological structure of IES is complex, and its modeling must clearly define the energy supply side, conversion side, and consumption side based on research needs. Furthermore, IES serves as a crucial tool for promoting the low-carbon transition of the energy sector and enhancing renewable energy integration. Driven by carbon trading and green certificate trading mechanisms, IES may demonstrate better comprehensive benefits. However, the impact of multi-market coupling on IES has not yet been thoroughly explored, as most existing studies examine the influence of individual markets on IES from relatively independent perspectives. So, the gaps between historical study and this paper can be summarized as follows:
- (1)
- Hydrogen-integrated IES has become a hot topic, but there is no unified conclusion on the specific impacts of hydrogen energy on IES. Moreover, the operation optimization objectives of IES are diverse, and selecting appropriate objective functions and optimization boundaries remains a widely debated issue.
- (2)
- Although some studies have considered the influence of carbon markets or green certificate markets in IES operations, these markets remain relatively segmented and operate in parallel. Delving into the logical connections between markets and incorporating them into IES operations can enrich research content and provide references for exploring the impact of multiple markets on IES.
- (3)
- Considering carbon trading, green certificates, and hydrogen utilization represents a key entry point for enhancing the low-carbon performance and economic efficiency of IES. This paper will mathematically model these key elements to develop an operation optimization model for IES, and conduct multi-scenario analyses to explore the impacts of different factors on IES, aiming to provide guidance in decision-making and management for IES managers.
3. Establishment of the IES Operation Optimization Model in the Paper
In summary, the overall technical route and research framework of this paper can be illustrated as shown in Figure 1. The first step involves analyzing the structure of the IES and determining specific subsystems; the second step involves analyzing the impacts of electricity, carbon, and green certificate markets, and conducting model research; the third step involves establishing an operation optimization model for IES, including subsystem modeling, construction of objective functions, and constraint boundaries; the fourth step involves determining the solution method or strategy for the model; the fifth step involves verifying the feasibility of the model through simulation examples and conducting discussions. Specifically, the objective orientation of this optimization model is the economic cost of IES operation. The decision variables mainly include the output of different energy equipment in IES, the purchase of energy from the higher-level energy network, and the sale of energy to the external demand side. The boundary of constraints mainly includes physical constraints on equipment operation, satisfaction constraints on demand side energy consumption, and so on.
Figure 1.
The overall technical route and research framework of this paper.
3.1. The Basic Structure of IES in the Article
IES integrates the production, conversion, storage, and consumption of multiple energy forms. It emphasizes mutual support and complementarity among various energy sources to promote efficient energy production and utilization. Meanwhile, hydrogen is incorporated into IES operations to reduce energy losses during cascade conversion and addresses limitations in spatiotemporal storage and transportation, contributing to the system’s economic efficiency and low-carbon performance. Furthermore, considering the park’s electricity load, heating load, and gas demand, this paper designs the hydrogen-integrated IES topology shown in Figure 2. It is worthy that the IES in the paper is concerned about the park-level, and the operation schedule of the energy system is managed by the park management committee, whose purpose is to meet the electricity, heat, and gas needs of users in the park, and achieve the goals of minimizing system operating costs, maximizing energy utilization efficiency, and being environmentally friendly. Thus, the operator is the main decision-maker for optimizing the operation of IES, responsible for scheduling and controlling energy producers, converters, storage providers, consumers, and external interfaces in IES. On the one hand, energy source, grid, load and storage forms the energy flow architecture in IES from the perspective of physics. On the other hand, the operator would collect the data of these specific participant devices and send scheduling instructions to achieve the optimal energy scheduling of IES in the park from the perspective of information.
Figure 2.
The topology of IES built in this paper.
On the supply side, the system can generate power from photovoltaic (PV) and wind turbines (WT). Meanwhile, it allows the purchase of energy from the upstream power grid and gas network if it is more economical. On the demand side, the IES primarily consists of electrical, gas, and thermal loads. They are met either through the operation of internal components or by purchasing energy externally. It is noted that the electricity supplied by the upstream grid is assumed to originate from thermal power generation, and both the CHP units and HFC generate heat alongside electricity.
Regarding the energy conversion components, they mainly include heat pumps (HP), gas boilers (GB), CHP, electrolyzers (EL), methanation reactors (MR), hydrogen fuel cells (HFC), as well as four types of energy storage (ES) devices for electricity, gas, heat, and hydrogen. Detailed modeling of these components will be provided in subsequent research, and the relevant production capacity and energy consumption are expressed with the unit of kW to ease the complexity of calculation. Furthermore, the IES can sell excess electricity and natural gas externally if the load demands are met. Additionally, the IES incorporates renewable energy generation and carbon dioxide emission facilities, which are subject to the regulations of both the carbon market and the green certificate market. Consequently, its operations involve simultaneous participation in the electricity energy market, the carbon market, and the green certificate market. In order to have a clearer understanding of the significance of the variables involved in the construction process of the IES operation optimization model, an explanation is provided, as shown in Table 1.
Table 1.
Illustration of the key variables in IES optimization model.
3.2. Qualitative Analysis of the Electricity–Carbon–Green Certificate Market on IES
The IES could participate in the carbon market due to the carbon emission attributes in GB and CHP, and it could also participate in the green certificate market due to the green power generation from wind and solar plants. At the same time, IES could form an interactive relationship with the power grid for purchasing and selling electricity, so that the IES participates in the electricity market. On the basis of participating in the previous market, IES will adjust its operational strategy according to the economic impact of different markets, thus reflecting the role of the three markets in IES operation, outlined as follows:
From the topology of the IES, it can be observed that the system includes GB and CHP, which emit carbon dioxide. Therefore, as an entity with carbon emission attributes, it would receive carbon emission allowances determined by public authorities. The IES will participate in the carbon market: when the system’s actual emissions exceed the allocated allowances, it must either pay penalties or purchase the deficit emission rights in the carbon market; when the actual emissions are lower than the allowances, it can sell the surplus allowances in the carbon market.
In addition, the IES incorporates wind and solar power generation, which can produce green electricity and generate corresponding green certificates. Thus, the IES can also participate in the green certificate market. Green certificate trading serves as a supplementary policy tool for the renewable portfolio standard, which requires electricity producers to generate a certain quantity or proportion of renewable energy, and green electricity can be quantified proportionally into green certificates. When a producer generates more green certificates than the required quota, it can sell the excess certificates for profit. Otherwise, it must purchase the deficit certificates in the green certificate market.
Furthermore, the IES is permitted to buy and sell electricity. It indicates that IES will decide whether to purchase or sell electricity based on market prices to obtain returns. Thereby, through economic cost expenditures or revenue generation, the IES operates according to the transaction rules of the electricity, carbon, and green certificate markets, to achieve optimal comprehensive benefits with minimal input.
In simpler terms, these trading activities influence the IES through price linkages or supply–demand relationships, creating interconnections among them. The market mechanism significantly impacts the decision-making of the IES, which must develop operational strategies to meet constraints and optimize benefits based on commodity quantities and prices.
3.2.1. Modeling of Carbon Emission Trading
Carbon trading involves carbon emission units obtaining a certain amount of legal emission rights through verification by administrations, with these rights treated as a commodity for trading in the carbon market. Firstly, administrative departments allocate emission quotas through paid or free methods (China mainly adopts free allocation). When the actual emissions of a carbon emission source exceed the allocated quota, it must either purchase the deficit emission rights in the carbon market or pay penalties. Conversely, surplus carbon quotas can be sold. Therefore, the modeling of IES participation in the carbon market can be divided into three aspects: carbon emission rights quotas, actual carbon emissions, and carbon trading costs. In the IES of the park studied in this paper, the main sources of carbon emissions come from three parts: electricity purchased from the upstream grid (assumed to be from thermal power generation), CHP, and GB. In the process of optimization, the model requires the output of each equipment component to meet the target constraints while emitting as little carbon dioxide as possible, avoiding the cost of purchasing quotas caused by excessive carbon emissions. The initial carbon quota model is as follows [32]:
where represents the initial carbon quota of the system; and are the carbon quota coefficients per unit of electricity supply and heat output; denotes the purchased electricity power from the external grid at time t, kW; , represent the heat output power and electricity output power of the CHP unit at time t, kW; is the coefficient for converting the electricity generation of the CHP unit into equivalent heat output; denotes the heat output power of the GB at time t, kW.
Since the MR in the IES consumes CO2 in the system to produce CH4, the carbon emission of this device is negative. Therefore, the actual carbon emission model of the system is as follows [32]:
where represents the actual carbon emissions of the system; is the carbon emission factor of the power grid; denotes the carbon emission coefficient of natural gas; stands for the CO2 absorption coefficient of the MR; indicates the hydrogen power input of the MR at time t, kW.
3.2.2. Modeling of Green Certificate Trading
The green certificate trading mechanism serves as an auxiliary policy tool for the RPS to promote the integration of green electricity. The government provides indirect subsidy support to power generation enterprises in the form of green certificates based on their renewable energy power generation. Enterprises are required to achieve a certain amount of renewable energy power generation, and green electricity can be proportionally quantified into green certificates. When the number of green certificates produced exceeds the quota target, the excess certificates can be sold for profit; otherwise, green certificates must be purchased to meet the compliance requirements. The green certificate trading mechanism consists of three components: the number of green certificates obtained, the renewable energy quota, and the revenue from green certificate trading. In the process of optimization, the orientation of the model is to maximize the acquisition of green certificate benefits, and the optimization variables are mainly the output of wind and solar power generation. The number of green certificates obtained by the system is positively correlated with the amount of renewable energy power generation utilized, and the quantity of green certificates acquired is expressed as follows:
where represents the quantity of green certificates obtained by the system; is the power generation output of the device at time , kW; denotes the total number of renewable energy power generation devices.
The renewable energy quota is determined based on the proportion of renewable energy power generation in the total power generation. The expression is defined as follows:
where represents the quota for renewable energy power generation stipulated for system power producers, kWh; denotes the renewable energy generation quota coefficient; indicates the total power generation of the system power producer at time t.
where represents the quantity of green certificates equivalent to the renewable energy quota.
3.2.3. Demonstration of Market Coupling
Though there is a foundation for electricity trading, carbon trading, and green certificate trading in IES research, the historical studies tend to emphasize the impact of individual market operations. The coupling modeling and analysis of multiple markets requires further in-depth exploration.
Firstly, the IES participates in the electricity market through the buying and selling of electrical energy. Secondly, it engages in the carbon market based on its compliance with carbon emission allowances. Finally, it takes part in the green certificate market through green certificate trading. It should be noticed that the three markets interact with each other centered around the IES; the relationship between carbon and green certificates is particularly profound. Green certificates contain comprehensive information about grid-connected renewable energy, and the emission reduction achieved by replacing fossil fuels with an equivalent amount of renewable energy can be calculated. This demonstrates that green certificates inherently serve as proof of carbon reduction contributions and can offset carbon emissions in the form of China Certified Emission Reduction (CCER).
This paper utilizes the baseline trading prices of green certificates and carbon allowances to represent the conversion relationship between them. Driven by the pursuit of benefits, scenarios may arise where CCER offsets carbon emissions, thereby adjusting the actual quantities of carbon allowances and green certificates involved in the respective markets and allowing for re-participation in market trading. Based on the equivalence between carbon emission trading and green certificate trading, a conversion coefficient between carbon allowances and green certificates is established. If the marginal revenue in the carbon market exceeds that in the green certificate market, a certain amount of green electricity may participate in direct carbon emission offsetting in the form of CCER. Consequently, the green certificates generated from this portion of green electricity can no longer be traded in the green certificate market. At the same time, the carbon reduction benefits resulting from the replacement of fossil fuels with renewable energy should also be incorporated into the carbon emission trading framework.
Therefore, assuming the quantity of green certificates involved in the conversion is , the final quantities of green certificates and carbon allowances for the system can be calculated as follows:
where represents the carbon emission reduction coefficient corresponding to renewable energy green certificates.
3.3. Modeling of Subsystems in IES
A heat pump (HP) operates on the principle of the reverse Carnot cycle, consuming electrical energy to generate heat. The relevant model is shown as follows [32]:
where is the thermal power output of the HP at time t, kW; represents the heating efficiency per unit of electrical energy input of the HP; denotes the electrical power consumed by the HP at time t, kW; and are the lower and upper ramping limits of the HP’s electrical power; indicates the maximum electrical power of the HP, kW.
A combined heat and power (CHP) system consists of a gas turbine and a waste heat boiler. The gas turbine utilizes gas to generate electricity, and the heat produced during this process is captured by the waste heat boiler and supplied to meet the thermal load. The relevant model is shown as follows [32]:
where represents the gas input power of the CHP at time t, kW; denotes the electrical power output of the CHP at time t, kW; indicates the thermal power output of the CHP at time t, kW; stands for the electrical efficiency per unit of gas input of the CHP; is the upper limit of the gas input power of the CHP, kW; and are the lower and upper ramping limits of the gas consumption power of the CHP; and represent the lower and upper limits of the power-to-heat ratio of the CHP.
A gas boiler (GB) is a traditional thermal load supply device that utilizes gas to generate heat. The relevant model is shown as follows [32]:
where represents the heating power output of the GB at time t, kW; denotes the gas consumption power of the GB at time t, kW; indicates the heating efficiency of the GB; and represent the lower and upper ramping limits of the GB; and denote the lower and upper limits of the gas consumption power of the GB, kW.
Energy storage (ES), the paper includes four types of energy storage devices: electrical storage, thermal storage, gas storage, and hydrogen storage. Considering the operational constraints of energy storage devices, such as charge/discharge limits, storage capacity constraints, and mutual exclusion constraints, a modeling approach is adopted for energy storage devices as follows [32].
where represents the type of energy, including electrical energy (e), thermal energy (h), gas (g), and hydrogen energy (H2); and denote the charging/discharging power of ES device during time period t, kW; and are the upper limits of the charging/discharging power of ES device, kW; represents the final output power of the energy storage device during period t, kW; indicates the stored energy level of the energy storage device during time period t; and represent the charging/discharging efficiency of the energy storage device; is the self-discharge rate of the energy storage device; and indicates the charging/discharging state of the energy storage; and denote the upper and lower capacity limits of the energy storage device, kW.
Hydrogen energy exhibits diversity in both its production and utilization, such as hydrogen production through water electrolysis, heat and power generation via HFC, and its conversion into natural gas. Hydrogen energy breaks down the isolated barriers among traditional heating, power, and gas networks, thereby enhancing the flexible interconnection and coupling of different energy forms. Therefore, for the hydrogen utilization aspects considered in this paper, the focus is primarily on three key components: electrolyzers, hydrogen fuel cells, and methanation reactors.
- (i)
- Electrolyzer (EL) is the core equipment for hydrogen production from electricity, consuming electrical energy to generate hydrogen. It can utilize technologies such as proton exchange membrane electrolyzers, alkaline electrolyzers, and solid oxide electrolyzers to produce hydrogen through water electrolysis. The relevant model is shown as follows [32].where represents the hydrogen power output of the electrolyzer at time t, kW; denotes the hydrogen production efficiency per unit of electricity consumption of the electrolyzer; indicates the electrical power consumption of the electrolyzer during period t, kW; and are the lower and upper ramping limits of the electrical power consumption; and represent the lower and upper limits of the electrical power consumption.
It is worth noting that there is a nonlinear relationship between the load rate and hydrogen production efficiency in the practical engineering application of EL. That is to say, there is a certain coupling relationship between the conversion efficiency of electrical energy and hydrogen energy and the input power of the EL. This power efficiency dynamic characteristic will affect the actual hydrogen energy generated by the electrolytic cell in IES. Therefore, fine modeling of the electrolytic cell can more objectively characterize its role in the operation of IES, while it will increase the complexity and difficulty of solving the model. Given that the proton exchange membrane electrolyzers (PEMs) have a high efficiency and strong adaptability to fluctuating power, the article determines the PEM as the core technology of EL and then carries out a fine modeling of EL [33,34].
where , and are the input power, operating voltage, and operating current of a single PEM electrolytic cell; is the number of PEM electrolysis cells that make up the hydrogen production system electrolysis cell array; is the power of EL system.
where and mean the reversible voltage and irreversible voltage; and are the current density of the electrolytic cell and the area of the PEM membrane.
where is the enthalpy change of hydrogen production by electrolysis of water; is the operating temperature of EL; is the reaction entropy change for hydrogen production through electrolysis of water; is the number of transferred electrons per mole of hydrogen; is the Faraday’s constant; , and are the activation overvoltage, ohmic overvoltage, and concentration overvoltage of EL.
where , and are the empirical coefficients.
Therefore, the hydrogen production efficiency of EL depends on the product of Faraday efficiency and voltage efficiency , as follows:
where are the empirical coefficients; is the thermal neutral potential.
Based on the refined modeling expression mentioned above and the parameter information in [34], a nonlinear relationship diagram between hydrogen production efficiency and input power of EL can be visualized as shown in Figure 3.
Figure 3.
Curve relationship between efficiency and power of EL.
- (ii)
- Hydrogen fuel cell (HFC) is a device that utilizes hydrogen energy to generate electricity and heat, offering the advantage of zero emissions. It is modeled as follows [32]:where and represent the electrical and thermal output power of the HFC at time t, kW; and denote the electrical and thermal conversion efficiency per unit of hydrogen energy; indicates the hydrogen energy consumed by the HFC during period t, kW; and are the lower and upper limits of hydrogen energy consumption by the HFC, kW; and represent the lower and upper ramping limits of hydrogen energy consumption by the HFC; and correspond to the lower and upper limits of the power-to-heat ratio of the HFC.
- (iii)
- Methane reactor (MR), which achieves the methanation of hydrogen, utilizes the reaction between hydrogen and carbon dioxide to produce CH4. This equipment serves the dual functions of carbon capture and utilization, contributing to the reduction of carbon dioxide emissions and enhancing the utilization rate of energy. It is modeled as follows:where represents the methane output power of the MR at time t; denotes the methane production efficiency per unit of hydrogen input of the MR; indicates the hydrogen energy consumed by the MR at time t, kW; and are the lower and upper ramping limits of the hydrogen consumption by the MR; and represent the lower and upper limits of the hydrogen consumption by the MR.
3.4. Establishment of the IES Operation Optimization Model
3.4.1. Objective Function of IES Operation Optimization Model
This paper studies the operation optimization of a park-level IES. The system internally obtains energy through wind and solar power generation and by purchasing energy from external sources. It meets energy demands and achieves optimal economic benefits through internal component coupling, energy flow conversion, and external energy sales. Simultaneously, the system participates in the electricity energy market, carbon market, and green certificate market. To minimize the overall operational economic cost, the objective function includes energy purchase and sale costs, penalty for curtailment, green certificate trading costs, carbon market trading costs, and equipment operation and maintenance costs. The relevant model is shown as follows:
- (1)
- represents the costs of energy purchase and sale, which consist of purchasing electricity from the upstream grid, purchasing gas from the upstream gas network, selling surplus electricity, and selling surplus natural gas. The optimization orientation of this sub-model in IES operation is the minimum of cost, and the decision variables are the purchasing/selling power of the system at different times. The relevant model is shown as follows:where and represent the power of electricity purchased and sold by the system at time t, yuan/kW; and denote the prices of electricity purchased and sold at time t, yuan/kW; and indicate the power of natural gas purchased and sold by the system at time t, yuan/kW; and represent the prices of natural gas purchased and sold at time t, yuan/kW.
- (2)
- represents the penalty for wind and solar curtailment in the system. The optimization direction of this sub-model in IES is the minimum of cost, and the decision variables are the output power of wind and photovoltaic units at different times. This metric reflects the level of renewable energy integration, as shown in following:where and represent the maximum output of wind and photovoltaic power, kW; and denote the actual output of wind and photovoltaic power, kW; is the penalty coefficient per unit of curtailed electricity, yuan/kW.
- (3)
- represents the transaction cost of the system participating in the green certificate market. The optimization orientation of this sub-model in IES is cost minimization, with the decision variable being the output of IES energy equipment directly related to the green certificate.where is the green certificate quota that the system must fulfill; represents the quantity of green certificates generated by the system; denotes the trading price per unit of green certificate, the unit of measurement is yuan.
- (4)
- represents the transaction cost of the system participating in the carbon market. The optimization orientation of this sub model in IES is cost minimization, with the decision variable being the output level of IES energy equipment directly related to carbon emissions.where represents the carbon emissions of the IES; denotes the carbon quota allocated to the IES; indicates the trading price per unit of carbon emission, the unit of measurement is yuan/kg.
It should be noted that in order to increase the enthusiasm of market entities to participate in carbon reduction, an incentive effect can be formed by changing the cost of marginal carbon quotas. Therefore, based on formula (20a), a carbon trading cost model with tiered pricing is constructed, as shown in formula (20b) [15,35].
where is the price growth rate of carbon trading, is length of the range of values for different carbon emissions.
- (5)
- represents the operation and maintenance (O&M) costs of the system devices, the optimization direction of this sub-model is the minimum of cost, and the decision variable is the output of energy equipment in IES. The details are as follows:
- (i)
- O&M cost of wind and solar powerwhere and represent the photovoltaic and wind power O&M costs at time t; and denote the O&M costs per unit power for the photovoltaic and wind power generation, yuan/kW.
- (ii)
- O&M cost of system energy conversion equipmentwhere represents the O&M cost of equipment at time t; denotes the O&M cost per unit power of equipment , yuan/kW.
- (iii)
- O&M cost of energy storage equipmentwhere represents the O&M cost of ES facility at time t; denotes the per-unit charge/discharge O&M cost of ES facility , yuan/kW.
3.4.2. Constraints
- (1)
- Energy balance constraints
- (i)
- Electrical power balance
- (ii)
- Thermal power balance
- (iii)
- Gas balance
- (iv)
- Hydrogen energy balance
- (2)
- Operation constraints
These include constraints for energy conversion equipment and energy storage devices, which have been provided in the modeling of each device in the previous section.
- (3)
- Other constraints
- (i)
- Maximum quantity of green certificate conversion
- (iii)
- Output constraints of wind power and photovoltaic power
3.5. Model Solving
The operation optimization model for the IES considering hydrogen utilization under electricity–carbon–green certificate coupling established in this paper is a mixed-integer linear programming model. Therefore, YALMIP in MATLAB R2018a and the commercial solver CPLEX are called for model solving.
4. Model Validation and Discussion Based on Case Study
4.1. Basic Information of Case Study and Model Application
After completing the theoretical work on mathematical modeling, the model’s feasibility and practicality are verified through a case study. Meanwhile, scenario analysis and sensitivity analysis are conducted to explain the changes brought to IES operations and the corresponding reasons after absorbing multiple factors. Through field research on a small industrial park in Dezhou, Shandong Province, we have obtained preliminary data for verifying the operation optimization model of IES. The park is located in the industrial park in the north of Dezhou city (see Figure 4) and is mainly dominated by manufacturing and chemical industries. The park has modern service and research and development institutions, and is equipped with a complete distribution, heating and gas supply network. In order to achieve the green and low-carbon transformation of the park, hydrogen energy utilization and other technologies are actively being adopted for decarbonization and energy substitution. Considering the involvement of trade secrets in the data, the commercial information is processed for confidentiality, and finally, the data for example analysis was obtained after verification and adjustment according to the relevant literature [15,36,37,38,39].
Figure 4.
Location of IES in the case study.
Considering that the difficulty of the solution process would increase with the complexity of the model and parameters, the setting of the basic model in the case study is mainly to assume that the efficiency and carbon trading price in the model are constant (dynamic efficiency will be verified and calculated in the comparative analysis section), the more relevant parameters rely on information in Appendix A. After testing the feasibility of the model, the article will conduct more in-depth multi-scenario comparative analysis and sensitivity analysis. Based on the data from the case study, the existing IES in the park requires daily operation and scheduling. The goal of system operation optimization is to minimize the total cost while meeting various load demands. The total cost includes the energy purchase and sales costs, equipment O&M costs, as well as the costs from participating in the electricity–carbon–green certificate markets. By substituting the relevant basic data into the model constructed in this paper and solving it, the operation optimization results shown in Figure 5 can be obtained.
Figure 5.
The operation strategy of IES under the baseline scenario.
It can be observed that under the optimal operating strategy, the maximum production capacity or energy consumption power of key equipment including WT, PV, HP, CHP, GB, EL, HFC, MR in IES within 24 h are 894.7, 915, 248.8, 600, 0, 340.9, 250, 93, respectively. At the same time, the maximum charging and discharging power of electricity storage, heat storage, gas storage, and hydrogen storage equipment are 152.5/225, 231.4/250, 0/75, 91.1/100, respectively. The system achieves an optimal operating cost of 15,013.7 to meet the energy demands of various loads, with the following breakdown: energy purchase and sales costs amount to 8913.18, penalties for wind and solar curtailment are 305.96, revenue from the green certificate market is 610.03, revenue from the carbon market is 2227.5, and operation and maintenance costs are 8742.12. Under the considered coupling scenario, 2.135 green certificates are utilized for conversion, the system’s carbon dioxide emissions amount to 3059.74, and the effective utilization rate of wind and solar power reaches 89.6%.
4.2. Comparative Analysis and Discussion
Furthermore, to explore the impact of market coupling mechanisms, hydrogen utilization, and the introduction of carbon and green certificate markets on the IES, four scenarios are established for multi-scenario comparison and analysis. Specifically: (1) Considering electricity, carbon, and green certificate markets along with hydrogen utilization, but without setting up market coupling; (2) Considering electricity–carbon–green certificate coupling without hydrogen utilization; (3) Considering the carbon market and hydrogen utilization without the green certificate market; (4) Considering the green certificate market and hydrogen utilization without the carbon market; (5) Setting the different electricity and gas price at different times; (6) Introducing the tiered carbon trading pricing mechanism; (7) Considering the refined modeling of EL in hydrogen energy utilization. Based on the above scenario designs (see Table 2), adjustments are made to the model constructed in the paper, and the case study is applied into the model for result calculation.
Table 2.
The settings of comparative analysis scenario.
Firstly, the operation strategy for Scenario (1) is shown in Figure 6. Under the optimal operating strategy, the maximum production capacity or energy consumption power of key equipment including WT, PV, HP, CHP, GB, EL, HFC, MR in IES within 24 h are 894.7, 915, 248.8, 600, 0, 340.9, 250, 93, respectively. At the same time, the maximum charging and discharging power of electricity storage, heat storage, gas storage, and hydrogen storage equipment are 191/225, 250/250, 0/75, 76/100, respectively. The calculations reveal that when green certificates are not used to offset carbon emissions, the system’s operation strategy undergoes adjustments, but the overall operation cost increases by only 1 compared to the baseline scenario (with green certificate trading revenue at 717.68, carbon market revenue at 2229.39, and other objectives remaining consistent). It indicates that market coupling can influence the system’s operation strategy and benefits, but its effectiveness is not yet pronounced. This is primarily due to the unequal marginal benefits between green certificates and carbon allowances. In the future, it is necessary to further identify the equilibrium point of market coupling to further optimize the system’s operational benefits. This result aligns with the current consensus in related research on the complexity of market coupling, and the equilibrium of market returns is a crucial factor in achieving integration [9,40]. Furthermore, compared to existing research on IES in the carbon and green certificate markets, the article has clarified that considering market integration can further solidify the ideal assumptions of market independence from theoretical research into reality, and that market coupling can indeed bring about incremental operational benefits.
Figure 6.
The operation strategy of IES under Scenario (1).
The management insights can be summarized from the above: (1) IES managers should not pursue the physical connection among different markets due to the unequal marginal benefits between different markets. It is necessary to determine the balance point between market returns and performance costs, and the managers need to actively explore market arbitrage and find the best market trading combination point; (2) Managers should consider the market price fluctuations and the offsetting rule as key elements, the golden combinations among the elements can be explored through multi-scenario analysis; (3) Managers should actively communicate with policy makers or coordinate transaction strategies within the enterprise. By promoting coordination and connection at the institutional level, transforming the theoretical advantages of market coupling into financial benefits in reality.
Secondly, the operation strategy for Scenario (2) is shown in Figure 7. Under the optimal operating strategy, the maximum production capacity or energy consumption power of key equipment including WT, PV, HP, CHP, GB, etc., in IES within 24 h are 850.4, 267.3, 480, 600, 640, respectively. At the same time, the maximum charging and discharging power of electricity storage, heat storage, and gas storage equipment are 225/0, 0/0, 75/67.8, respectively. The calculations reveal that the operation cost of the system without hydrogen utility is 31,293.79. The system tends to purchase energy from external sources to meet load demands, and the park’s new energy utilization rate drops to 26.21%. The economic efficiency of the system declines, and carbon dioxide emissions in this scenario rise to 25,161.63, which is significantly higher than the levels observed in scenarios involving hydrogen utilization. Existing research has highlighted the benefits of hydrogen energy in optimizing energy efficiency and system operating costs [21,41], which is consistent with the results of this study. Furthermore, the paper incorporates hydrogen energy utilization into the study of IES, providing a mathematical model for integrating hydrogen energy utilization into IES operation from a broader perspective.
Figure 7.
The operation strategy of IES under Scenario (2).
Based on the above text, several management insights can be summarized: (1) Managers should abandon the traditional concept of treating hydrogen energy as a long-term high-cost technology. Hydrogen is a key regulatory resource to solve the bottleneck of a high proportion of new energy consumption, and it could be regarded as an effective guarantee to ensure the safe and stable operation of the system; (2) Faced with the high threshold for hydrogen energy investment, managers can adopt a step-by-step strategy. In the initial stage, there is no need to pursue the comprehensive application of hydrogen energy, but rather to focus on the most concentrated and difficult to reduce carbon emissions in the system. This can not only verify the carbon reduction effect of hydrogen energy technology at a lower cost, but also improve the performance of the system, accumulating experience and data support for subsequent expansion of applications.
Thirdly, the operation strategy for Scenario (3) is shown in Figure 8. Under the optimal operating strategy, the maximum production capacity or energy consumption power of key equipment including WT, PV, HP, CHP, GB, EL, HFC, MR in IES within 24 h are 894.7, 915, 240, 600, 0, 340.9, 250, 93, respectively. At the same time, the maximum charging and discharging power of electricity storage, heat storage, gas storage, and hydrogen storage equipment are 209.9/225, 250/250, 0/75, 92.7/100, respectively. The calculations show that when the green certificate market is not considered, the system’s operational cost is 15,729.1. Specifically, the energy purchase and sale costs amount to 8898.56, the electricity curtailment penalty is 319.48, the revenue from the carbon market is 2224.16, and the operation and maintenance costs are 8735.22. The new energy utilization rate is 89.15%, and the total operational cost remains higher than that of the baseline scenario. Without considering the influence of the green certificate market, although the system’s emissions decrease, it fails to achieve additional emission reduction contributions through market coupling, leading to reduced benefits in the carbon market. The combined effect of reduced revenue from the carbon market and the absence of benefits from the green certificate market is the main reason for the increased cost. Consistent with existing research [42], green certificates currently exhibit low trading activity, and their market incentive effect has not been fully realized as they transition from subsidy-dependent to grid parity. As a crucial means of addressing green electricity consumption, strengthening integration with the carbon market is a potential way to improve efficiency [43].
Figure 8.
The operation strategy of IES under Scenario (3).
The following management insights can be summarized based on the above results: (1) In the face of rigid constraints in the carbon market, it is necessary to explore the hedging value of green certificates. The manager can strategically hold or trade green certificates to cope with the risk of possible tightening of carbon quotas or soaring carbon prices; (2) Managers should not passively wait for policy improvement, but actively seek to participate in projects for green certificate-carbon market deduction and mutual recognition, and lay out in advance to seize the opportunity of institutional linkage.
Fourthly, the operation strategy for Scenario (4) is shown in Figure 9. Under the optimal operating strategy, the maximum production capacity or energy consumption power of key equipment including WT, PV, HP, CHP, GB, EL, HFC, MR in IES within 24 h are 894.7, 915, 268.5, 600, 0, 340.9, 250, 50, respectively. At the same time, the maximum charging and discharging power of electricity storage, heat storage, gas storage, and hydrogen storage equipment are 189.9/225, 176.7/250, 0/75, 88/100, respectively. Calculations reveal that when the carbon market is not considered, the system’s operational cost is 17,233.64 (specifically, energy purchase and sale costs are 8874.35, the electricity curtailment penalty is 314.79, green certificate market revenue is 714.28, and operation and maintenance costs are 8758.78). Carbon emissions amount to 3045.18, and the new energy utilization rate is 89.31%. From an economic perspective, if only one market is chosen between the carbon market and the green certificate market, the former results in a lower operational cost. This result is consistent with existing research on the coupling of carbon markets and IES [44]. Carbon quotas have a more direct market mandate, imposing hard costs on emission-controlled enterprises, and typically exhibit higher marginal returns and price stability, especially when carbon prices rise. When IES have emission attributes, their marginal returns in the carbon market are more substantial than in the green certificate market. However, when closely integrated with quota offset mechanisms, multi-market coupling can better drive new energy investment and consumption [45], resulting in higher marginal returns.
Figure 9.
The operation strategy of IES under Scenario (4).
Based on the above text, the following management insights can be summarized: (1) The carbon market is the core and effective economic leverage for its cost pressure, and the transformation strategy would face the risk of insufficient incentives and declining momentum if there lacks consideration for carbon market; (2) It is necessary to utilize combination strategies to break through the efficiency ceiling of a single market. When carbon compliance costs are low, invest more new energy electricity into the green certificate market for profit; When carbon prices are high, the green certificates held are used to offset quotas and reduce compliance costs.
Fifthly, the operation strategy for Scenario (5) is shown in Figure 10. Under the optimal operating strategy, the maximum production capacity or energy consumption power of key equipment including WT, PV, HP, CHP, GB, EL, HFC, MR in IES within 24 h are 894.7, 915, 268.5, 600, 109.2, 340.9, 250, 93, respectively. At the same time, the maximum charging and discharging power of electricity storage, heat storage, gas storage, and hydrogen storage equipment are 225/225, 170/250, 75/75, 100/100, respectively. The result shows that the total operation cost of IES is 14,964.19 when considering the phased price of electricity and gas at different times (specifically, energy purchase and sale costs are 8912.65, the electricity curtailment penalty is 309.01, the green certificate market revenue is 609.03, the revenue from the carbon market is 2348.6, and operation and maintenance costs are 8700.21). And the new energy utilization rate of the energy system is 89.5%. Actually, the trading prices in the market are not completely fixed, and the time of use price will affect the operation and scheduling strategy of IES. The managers can dig the profit for arbitrage operations by using the peak and valley of market prices, but they also need to ensure basic energy demand.
Figure 10.
The operation strategy of IES under Scenario (5).
According to the above text, managers can pay attention to the following insights: (1) Further construction of intraday rolling optimization scheduling models can be carried out to track the peak and valley changes in time-sharing prices in real time, and active arbitrage based on price signals can be used to convert volatility into a source of profit; (2) When using market price peak valley arbitrage, it is necessary to ensure basic energy demand. When price arbitrage signals conflict with system security boundaries, secure energy supply must take priority over economic arbitrage to avoid the risk of insufficient energy supply during peak hours due to excessive pursuit of low-priced energy purchases.
Sixthly, the operation strategy for Scenario (6) is shown in Figure 11. Under the optimal operating strategy, the maximum production capacity or energy consumption power of key equipment including WT, PV, HP, CHP, GB, EL, HFC, MR in IES within 24 h are 854, 229.4, 600, 600, 800, 340.9, 250, 50, respectively. At the same time, the maximum charging and discharging power of electricity storage, heat storage, gas storage, and hydrogen storage equipment are 0/0, 0/244, 0/0, 0/56, respectively. It can be found that the IES operation price would increase to 40,616.21 when the carbon trading price is tiered (specifically, energy purchase and sale costs are 32,468.64, the electricity curtailment penalty is 2171.92, the cost from the carbon market is 1345.28, and operation and maintenance costs are 4630.37). The tiered price forms a constraint effect on IES with the increasing marginal cost in carbon trading. For managers, the following management insights can be summarized: (1) Utilizing the tiered price mechanism reasonably and strengthening the management of carbon asset; (2) Constructing the monitoring and early warning system for carbon emissions, and tracking how much margin there is for cumulative emissions to reach the emission limitation in real-time; (3) To layout and develop the low-carbon technologies in advance to address the cost pressure when the carbon trading price become the high.
Figure 11.
The operation strategy of IES under Scenario (6).
Seventhly, the operation strategy for Scenario (7) is shown in Figure 12. Under the optimal operating strategy, the maximum production capacity or energy consumption power of key equipment including WT, PV, HP, CHP, GB, EL, HFC, MR in IES within 24 h are 894.7, 915, 205.5, 600, 216.4, 500, 250, 100, respectively. At the same time, the maximum charging and discharging power of electricity storage, heat storage, gas storage, and hydrogen storage equipment are 155.2/225, 176.7/250, 0/75, 60/100, respectively. The operation cost of IES, when considering the refined model of EL, is reaching 15,945.16 (specifically, energy purchase and sale costs are 9685.33, the electricity curtailment penalty is 123.76, the green certificate market revenue is 669.59, the revenue from the carbon market is 2398.4, and operation and maintenance costs are 9204.07). As well, the utilization rate of new energy is 95.8%. The dynamic efficiency of refined modeling has higher new energy consumption than constant efficiency, but it also comes with slightly higher system operating costs. For managers, the following insights can be paid attention to: (1) Drawing the characteristic curve of the EL and clarifying its optimal economic operating range; (2) Embedding dynamic efficiency models into scheduling algorithms to achieve deep integration of device characteristics and system optimization.
Figure 12.
The operation strategy of IES under Scenario (7).
In summary, through multi-scenario comparative analysis, it can be seen that incorporating factors such as hydrogen utilization, the carbon market, and the green certificate market into the optimization of the IES, the optimal operation strategy demonstrates a cost advantage, while the utilization rate of renewable energy also ranks among the highest. Simultaneously, the interconnection between the carbon market and the green certificate market can impact the operation of the IES. The study not only broadens the boundaries of research and modeling but also provides a valuable reference for analyzing market coupling. It can guide IES managers in making optimal equipment dispatch decisions and assist policymakers in uncovering intrinsic market couplings to design more incentive-compatible top-level frameworks to enhance overall comprehensive benefits. Overall, the several inspirations can be given: (1) Managers need to shift their association with the operation of IES from passive operation to active game, and identify the equilibrium point of market coupling and the optimal operating range of equipment through mathematical model construction; (2) An arbitrage mechanism could be concerned to convert price fluctuations in multiple markets into profit, as well taking safe energy supply as the bottom line to avoid sacrificing system reliability due to excessive pursuit of economic benefits; (3) Policy makers concerns the design of deduction channel between green certificates and carbon quotas, and institutional linkage should be used to guide market entities to spontaneously seek solutions with the best comprehensive benefits.
4.3. Sensitivity Analysis and Discussion
To explore the impact of changes in key parameters, a sensitivity analysis is developed. Based on the basic operation optimization model, sensitivity analysis is conducted on parameter numerical fluctuations, including carbon trading prices, green certificate trading prices, green certificate quota mutual recognition conversion amounts, WT and PV maximum output fluctuations caused by weather, gas purchase prices, and gas tank operating costs. The specific scenario settings include: (1) The trading price in the carbon market is adjusted by ± 50% to observe its impact on IES operation benefits; (2) The trading price in the green certificate market is adjusted by ±50% to observe its impact on IES operation benefits; (3) The quantity of green certificates used to offset carbon emissions is floated from 5% to 25% to observe changes in IES operations and costs; (4) The renewable energy output fluctuates by ±10% to observe the impact of weather conditions on the optimization of IES operation; (5) The price of gas energy purchase fluctuates by ±10%, and its impact on the efficiency of IES operation system considering hydrogen energy utilization is observed; (6) Observe the impact of a ±10% fluctuation in the unit operating price of gas tanks on energy system costs. To reduce computational and analytical redundancy, these sensitivity analyses are conducted as single-factor variations. Based on the sensitivity analysis of parameter changes mentioned above, the changes in operating costs of the IES under various scenarios are shown in Figure 13.
Figure 13.
The results of sensitive analysis.
It can be observed that the marginal impact of changes in different parameters on the operating cost of IES varies. This also provides a reference for managers to identify key influencing factors and develop effective optimization strategies. The main management points that can be summarized are: (1) Within the 50% fluctuation range of carbon quota prices, the cost shows a decreasing trend, with a range of −2227.47, and every 1% increase will result in a cost reduction of 22.27; (2) Within the 50% fluctuation range of green certificate trading prices, the cost shows a decreasing trend, with a range of −717.5, and every 1% increase will result in a cost reduction of 7.18; (3) Under the condition of a 25% carbon quota offset ratio, the operating cost of the IES shows an increasing trend, with a range of 0.11, and every 1% increase will bring a cost change of 0.0054; (4) Within the 10% maximum output fluctuation range of wind power, the operating cost of the system shows a decreasing trend, with a range of −196.43, and every 1% increase will result in a cost reduction of 9.82; (5) Within the 10% maximum output fluctuation range of photovoltaics, the operating cost of the system shows a decreasing trend, with a range of −54.99, and every 1% increase will result in a cost reduction of 2.75; (6) Within a 10% fluctuation range of gas purchase prices, the operating costs of the system show an increasing trend, with a range of 1759.87, and every 1% increase will result in a cost reduction of 87.99%; (7) Within a 10% fluctuation range of gas tank prices, the operating costs of the system show a slight increase trend, with a range of 0.45, and every 1% increase will result in a cost reduction of 0.023.
In all, the inspirations from sensitivity analysis can be summarized as: (1) The price of gas and carbon quota has a significant marginal impact on IES operation cost, thereby, the gas supply can be determined by long-term stable contracts and carbon asset trading positions should be established for the competitive advantages in terms of performance costs; (2) The marginal impact of quota offset ratio between carbon and green certificate market is weak, thereby, the design of the linkage mechanism between the two markets has not yet formed sufficient economic incentives. It should be noted that once the policy tightens the deduction ratio or increases the deduction value, the strategic position of green certificates will rapidly rise. Suggest dynamically tracking policy trends and reserving green certificate resources in advance to cope with changes in deduction rules; (3) The constraints and price fluctuations of different energy equipment affect the operating costs of IES. When making investment decisions, attention should be paid to the technical performance and operational flexibility of the equipment in order to achieve optimal investment and management benefits.
5. Conclusions and Outlooks
An IES is a system that integrates multiple energy forms, aiming to enhance energy utilization efficiency and promote sustainable development through the coordination and optimization of energy production, transmission, storage, and consumption. This paper focuses on the operation optimization of the IES, incorporating factors such as hydrogen utilization, carbon markets, and green certificate markets. An IES operation optimization model is established to minimize system operational costs, under various constraints in equipment limitations and energy demand requirements. The model seeks to identify daily dispatch strategies to guide optimal system operation. The research conclusions are summarized as follows:
- (1)
- The IES operation optimization model is logically sound and practically feasible. It provides corresponding mathematical expressions for each subsystem of IES operation, and its operability is verified through a simulation case study. The equipment dispatch results derived from the model enable the IES to meet energy consumption demands while achieving optimal comprehensive economic costs, including energy purchase/sale costs, curtailment penalties, carbon market costs, green certificate market costs, and O&M costs. This optimization model can provide dispatch decision support for IES managers in determining the daily operation of various devices.
- (2)
- Considering hydrogen utilization can bring benefits to IES operation in terms of cost optimization, emission reduction, and enhanced integration of renewable energy. On one hand, through hydrogen-based conversion, the interconnection and integration of various energy forms within the IES are improved, and the efficiency of multi-energy utilization is enhanced with the assistance of energy storage. On the other hand, the methanation reactor exhibits a negative carbon effect, reducing the overall carbon emissions of the IES and optimizing its operation cleanliness.
- (3)
- The electricity–carbon–green certificate markets can collectively influence the IES, and the carbon market and green certificate market can achieve mutual recognition and interconnected conversion. Given the potential emission reduction benefits of green certificates, this paper proposes a price-based method for converting green certificates to carbon allowances. However, the simulation analysis of the IES also reveals that the depth of market coupling is influenced by the marginal revenues and costs of each market. The quantity of green certificates allocated to support carbon emission reduction is affected by unit trading prices. Simultaneously, the simulation indicates that market coupling could reduce system operation costs, demonstrating that the research idea of this paper holds both a certain theoretical and practical value.
In summary, this paper constructs an IES operation optimization model that considers hydrogen utilization under the markets of electricity, carbon, and green certificates. It defines the modeling of various equipment within the system, elaborates on the relationship between the electricity–carbon–green certificate markets and IES operation, and explores the mutual recognition mechanism between carbon and green certificate markets. The established model can provide certain decision-making support in engineering practice. However, it should also be noted that modeling in systems engineering research could be highly detailed. In future research, the system’s component equipment can be further enriched and refined, and more flexible market trading price mechanisms can be proposed to incentivize the IES to achieve better operational strategies and enhance overall benefits.
Author Contributions
Conceptualization, Y.T.; Software, F.L.; Resources, Y.L.; Data curation, F.L. and D.L.; Writing—original draft, C.L. and Y.T.; Visualization, Y. L.; Supervision, X.X. All authors have read and agreed to the published version of the manuscript.
Funding
This research received no external funding.
Institutional Review Board Statement
Not applicable.
Informed Consent Statement
Not applicable.
Data Availability Statement
The original contributions presented in this study are included in the article. Further inquiries can be directed to the corresponding author.
Conflicts of Interest
Authors Chenguang Li, Feng Liang, Dawei and Liu Yang were employed by the State Grid Inner Mongolia Eastern Power Co., Ltd. Author Xiufeng Xie was employed by the Beijing Fibrlink Communications Co., Ltd. The remaining authors declare that the research was conducted in the absence of any commercial or financial relationships that could be construed as a potential conflict of interest.
Appendix A
- (1)
- The data on different loads and energy prices are seen in Table A1.
Table A1.
Data and information of loads and energy prices in case study.
- (2)
- The data on key parameter values are seen in Table A2.
Table A2.
Data and information of key parameters in operation optimization model.
- (3)
- The simulation data on upper/lower limitation values are seen in Table A3.
Table A3.
Simulation information of upper/lower limitation values in model.
References
- Chen, S.; Liu, P.; Li, Z. Low carbon transition pathway of power sector with high penetration of renewable energy. Renew. Sustain. Energy Rev. 2020, 130, 109985. [Google Scholar] [CrossRef] [Scilit]
- Zhou, Y.; Wang, J.; Xu, H.; Yang, M.; Liu, W. Improving full-chain process synergy of multi-energy complementary distributed energy system in cascade storage and initiative management strategies. Energy Convers. Manag. 2024, 322, 119120. [Google Scholar] [CrossRef] [Scilit]
- Moslehi, S.; Reddy, T.A. A new quantitative life cycle sustainability assessment framework: Application to integrated energy systems. Appl. Energy 2019, 239, 482–493. [Google Scholar] [CrossRef] [Scilit]
- Liu, A.; Zhao, P.; Sun, J.; Xu, W.; Ma, N.; Wang, J. Performance analysis of an electric-heat integrated energy system based on a CHP unit and a multi-level CCES system for better wind power penetration and load satisfaction. Appl. Therm. Eng. 2025, 258, 124644. [Google Scholar] [CrossRef] [Scilit]
- Dragoon, K.; Iliceto, A.; Korpås, M.; Markussen, P.; Pivovar, B.; Ruth, M.; Westlake, B.; Endler, E. Hydrogen as part of a 100% clean energy system: Exploring its decarbonization roles. IEEE Power Energy Mag. 2022, 20, 85–95. [Google Scholar] [CrossRef] [Scilit]
- Parra, D.; Valverde, L.; Pino, F.J.; Patel, M.K. A review on the role, cost and value of hydrogen energy systems for deep decarbonisation. Renew. Sustain. Energy Rev. 2019, 101, 279–294. [Google Scholar] [CrossRef] [Scilit]
- Xu, X.; Wang, B.; Shi, M.; Li, G.; Zhang, Y.; Wang, Q.; Liu, D. Research on hydrogen storage system configuration and optimization in regional integrated energy systems considering electric-gas-heat-hydrogen integrated demand response. Int. J. Hydrogen Energy 2025, 135, 86–103. [Google Scholar] [CrossRef] [Scilit]
- Haowei, C. Synergy effects of the energy quota trading system and carbon emissions trading system: A case study of China. Energy Sustain. Dev. 2025, 87, 101733. [Google Scholar] [CrossRef] [Scilit]
- Tian, J.; Huang, B.; Wang, Q.; Du, P.; Zhang, Y.; He, B. A multi-agent integrated energy trading strategy based on carbon emission/green certificate equivalence interaction. Sustainability 2023, 15, 15766. [Google Scholar] [CrossRef] [Scilit]
- Berjawi, A.; Walker, S.; Patsios, C.; Hosseini, S. An evaluation framework for future integrated energy systems: A whole energy systems approach. Renew. Sustain. Energy Rev. 2021, 145, 111163. [Google Scholar] [CrossRef] [Scilit]
- Wu, D.; Guo, J. Optimal design method and benefits research for a regional integrated energy system. Renew. Sustain. Energy Rev. 2023, 186, 113671. [Google Scholar] [CrossRef] [Scilit]
- Wang, Y.; Liu, Z.; Wang, J.; Du, B.; Qin, Y.; Liu, X.; Liu, L. A Stackelberg game-based approach to transaction optimization for distributed integrated energy system. Energy 2023, 283, 128475. [Google Scholar] [CrossRef] [Scilit]
- Dong, Y.; Zhang, H.; Ma, P.; Wang, C.; Zhou, X. A hybrid robust-interval optimization approach for integrated energy systems planning under uncertainties. Energy 2023, 274, 127267. [Google Scholar] [CrossRef] [Scilit]
- Zhou, X.; Tan, W.; Sun, Y.; Huang, T.; Yang, C. Multi-objective optimization and decision making for integrated energy system using STA and fuzzy TOPSIS. Expert Syst. Appl. 2024, 240, 122539. [Google Scholar] [CrossRef] [Scilit]
- Hou, J.; Li, Z.; Meng, Y.; Cai, J.; Yu, W.; Xu, Z. Low-carbon optimal scheduling of integrated energy system considering hydrogen use and demand response. J. Nanjing Univ. Inf. Sci. Technol. 2024, 16, 587–598. [Google Scholar]
- Wang, L.; Xian, R.; Jiao, P.; Liu, X.; Xing, Y.; Wang, W. Cooperative operation of industrial/commercial/residential integrated energy system with hydrogen energy based on Nash bargaining theory. Energy 2024, 288, 129868. [Google Scholar] [CrossRef] [Scilit]
- Zhang, J.; Liu, Z. Low carbon economic scheduling model for a park integrated energy system considering integrated demand response, ladder-type carbon trading and fine utilization of hydrogen. Energy 2024, 290, 130311. [Google Scholar] [CrossRef] [Scilit]
- Zhou, J.; Li, S.; Zhou, X.; Li, C.; Xiong, Z.; Zhao, Y.; Liang, G. Operation optimization for gas-electric integrated energy system with hydrogen storage module. Int. J. Hydrogen Energy 2022, 47, 36622–36639. [Google Scholar] [CrossRef] [Scilit]
- Yang, M.; Liu, Y. A two-stage robust configuration optimization framework for integrated energy system considering multiple uncertainties. Sustain. Cities Soc. 2024, 101, 105120. [Google Scholar] [CrossRef] [Scilit]
- Ren, T.; Li, R.; Li, X. Bi-level multi-objective robust optimization for performance improvements in integrated energy system with solar fuel production. Renew. Energy 2023, 219, 119499. [Google Scholar] [CrossRef] [Scilit]
- Ruiming, F. Multi-objective optimized operation of integrated energy system with hydrogen storage. Int. J. Hydrogen Energy 2019, 44, 29409–29417. [Google Scholar] [CrossRef] [Scilit]
- Gao, J.; Meng, Q.; Liu, J.; Wang, Z. Thermoelectric optimization of integrated energy system considering wind-photovoltaic uncertainty, two-stage power-to-gas and ladder-type carbon trading. Renew. Energy 2024, 221, 119806. [Google Scholar] [CrossRef] [Scilit]
- Zhou, J.; Wu, Y.; Zhong, Z.; Xu, C.; Ke, Y.; Gao, J. Modeling and configuration optimization of the natural gas-wind-photovoltaic-hydrogen integrated energy system: A novel deviation satisfaction strategy. Energy Convers. Manag. 2021, 243, 114340. [Google Scholar] [CrossRef] [Scilit]
- Huang, H.; Liang, R.; Lv, C.; Lu, M.; Gong, D.; Yin, S. Two-stage robust stochastic scheduling for energy recovery in coal mine integrated energy system. Appl. Energy 2021, 290, 116759. [Google Scholar] [CrossRef] [Scilit]
- Hong, Q.; Cui, L.; Hong, P. The impact of carbon emissions trading on energy efficiency: Evidence from quasi-experiment in China’s carbon emissions trading pilot. Energy Econ. 2022, 110, 106025. [Google Scholar] [CrossRef] [Scilit]
- Feng, T.-T.; Li, R.; Zhang, H.-M.; Gong, X.-L.; Yang, Y.-S. Induction mechanism and optimization of tradable green certificates and carbon emission trading acting on electricity market in China. Resour. Conserv. Recycl. 2021, 169, 105487. [Google Scholar] [CrossRef] [Scilit]
- Jiang, Y.; Chen, W. Review and Prospect of Coupled Electricity-Carbon-Renewable Portfolios Trading. Electr. Power Constr. 2023, 44, 1–13. [Google Scholar]
- Wu, Q.; Li, C. Modeling and operation optimization of hydrogen-based integrated energy system with refined power-to-gas and carbon-capture-storage technologies under carbon trading. Energy 2023, 270, 126832. [Google Scholar]
- Zeng, H.; Du, Y.; LI, T.; Xue, Y.; Sun, K.; Xia, T.; Sun, H. Low-carbon planning of a park-level integrated electric and heating system considering carbon trading and green certificate trading. Integr. Intell. Energy 2023, 45, 22–29. [Google Scholar]
- Luo, Z.; Qin, J.; Liang, J.; Shen, F.; Liu, H.; Zhao, M.; Wang, J. Day-ahead optimal scheduling of integrated energy system with carbon-green certificate coordinated trading mechanism. Electr. Power Autom. Equip. 2021, 41, 248–255. [Google Scholar]
- Suo, C.; Li, Y.; Jin, S.; Liu, J.; Li, Y.; Feng, R. Identifying optimal clean-production pattern for energy systems under uncertainty through introducing carbon emission trading and green certificate schemes. J. Clean. Prod. 2017, 161, 299–316. [Google Scholar] [CrossRef] [Scilit]
- An, J.; Liu, W.; Lin, Y.; Zhang, Q.; Wang, X.; Kang, Y. Optimization Scheduling of Hydrogen-Containing Integrated Energy System Under Green Certificate-Carbon Trading Integration Mechanism. Acta Energiae Sol. Sin. 2024, 45, 104–114. [Google Scholar]
- Dong, H.; Shan, Z.; Zhou, J.; Xu, C.; Chen, W. Refined modeling and co-optimization of electric-hydrogen-thermal-gas integrated energy system with hybrid energy storage. Appl. Energy 2023, 351, 121834. [Google Scholar] [CrossRef] [Scilit]
- Li, Z.; Zhao, Y.; Wu, P.; Chang, Y.; Zhao, S. Low-carbon Dispatching Strategy of Integrated Energy System with Coordination of Green Hydrogen and Blue Hydrogen Based on Fine Modeling of Hydrogen Production Equipment. Power Syst. Technol. 2024, 48, 2317–2326. [Google Scholar]
- Zhang, H.; Zhou, Y.; Tu, L.; Qin, Y.; Li, X. Multi-timescale Optimal Scheduling of Integrated Energy System with Consideration of Green Certificate-Carbon Trading and Hydrogen Energy. Proc. CSU-EPSA 2023, 35, 95–106. [Google Scholar]
- Li, J.; Zhang, Z.; Liang, C.; Zeng, F. Multi-Objective Robustness of Integrated Energy System Considering Source-Load Uncertainty. J. Shanghai Jiaotong Univ. 2025, 59, 175–185. [Google Scholar]
- Chen, J.; Hu, Z.; Chen, Y.; Chen, J.; Chen, W.; Gao, M.; Lin, M.; Du, Y. Thermoelectric optimization of integrated energy system considering ladder-type carbon trading mechanism and electric hydrogen production. Electr. Power Autom. Equip. 2021, 41, 48–55. [Google Scholar]
- Luo, Q.; Li, P.; Zhang, S. Low-carbon and economic scheduling of virtual power plant considering demand response and stepwise carbon trading. Zhejiang Electr. Power 2023, 42, 51–59. [Google Scholar]
- Yuan, S.; Pan, P.; Wei, Y.; Xu, H.; Huo, M. Study on Low-Carbon Economic Optimal Scheduling Model of Community Integrated Energy System. Acta Energiae Sol. Sin. 2024, 45, 347–356. [Google Scholar]
- Liu, D.; Luo, Z.; Qin, J.; Wang, H.; Wang, G.; Li, Z.; Zhao, W.; Shen, X. Low-carbon dispatch of multi-district integrated energy systems considering carbon emission trading and green certificate trading. Renew. Energy 2023, 218, 119312. [Google Scholar] [CrossRef] [Scilit]
- Li, F.; Wang, D.; Guo, H.; Liu, Z.; Zhang, J.; Lin, Z. Two-stage Distributionally robust optimization for hydrogen-IES participation in energy-carbon trading-frequency regulation ancillary services market. Energy 2025, 328, 136404. [Google Scholar] [CrossRef] [Scilit]
- Gao, J.; Shao, Z.; Chen, F.; Lak, M. Multi-energy trading strategies for integrated energy systems based on low-carbon and green certificate. Electr. Power Syst. Res. 2025, 238, 111120. [Google Scholar] [CrossRef] [Scilit]
- Zhang, S.; Xu, Z.; Li, Y.; Zhang, J.; Hu, J. System dynamics simulation model of price transmission in collaboration market of electricity, carbon, and green certificate driven by multiple policies. Energy 2025, 323, 135852. [Google Scholar] [CrossRef] [Scilit]
- Gao, C.; Lu, H.; Chen, M.; Chang, X.; Zheng, C. A low-carbon optimization of integrated energy system dispatch under multi-system coupling of electricity-heat-gas-hydrogen based on stepwise carbon trading. Int. J. Hydrogen Energy 2025, 97, 362–376. [Google Scholar] [CrossRef] [Scilit]
- Huang, X.; Zhong, J.; Xiao, M.; Zhu, Y.; Zheng, H.; Zheng, B. Optimal and Sustainable Scheduling of Integrated Energy System Coupled with CCS-P2G and Waste-to-Energy Under the “Green-Carbon” Offset Mechanism. Sustainability 2025, 17, 4873. [Google Scholar] [CrossRef] [Scilit]
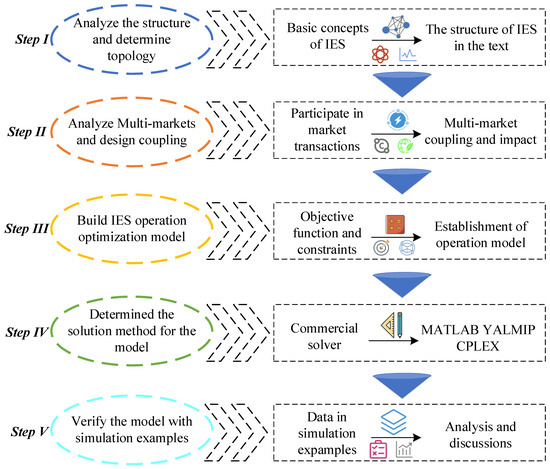
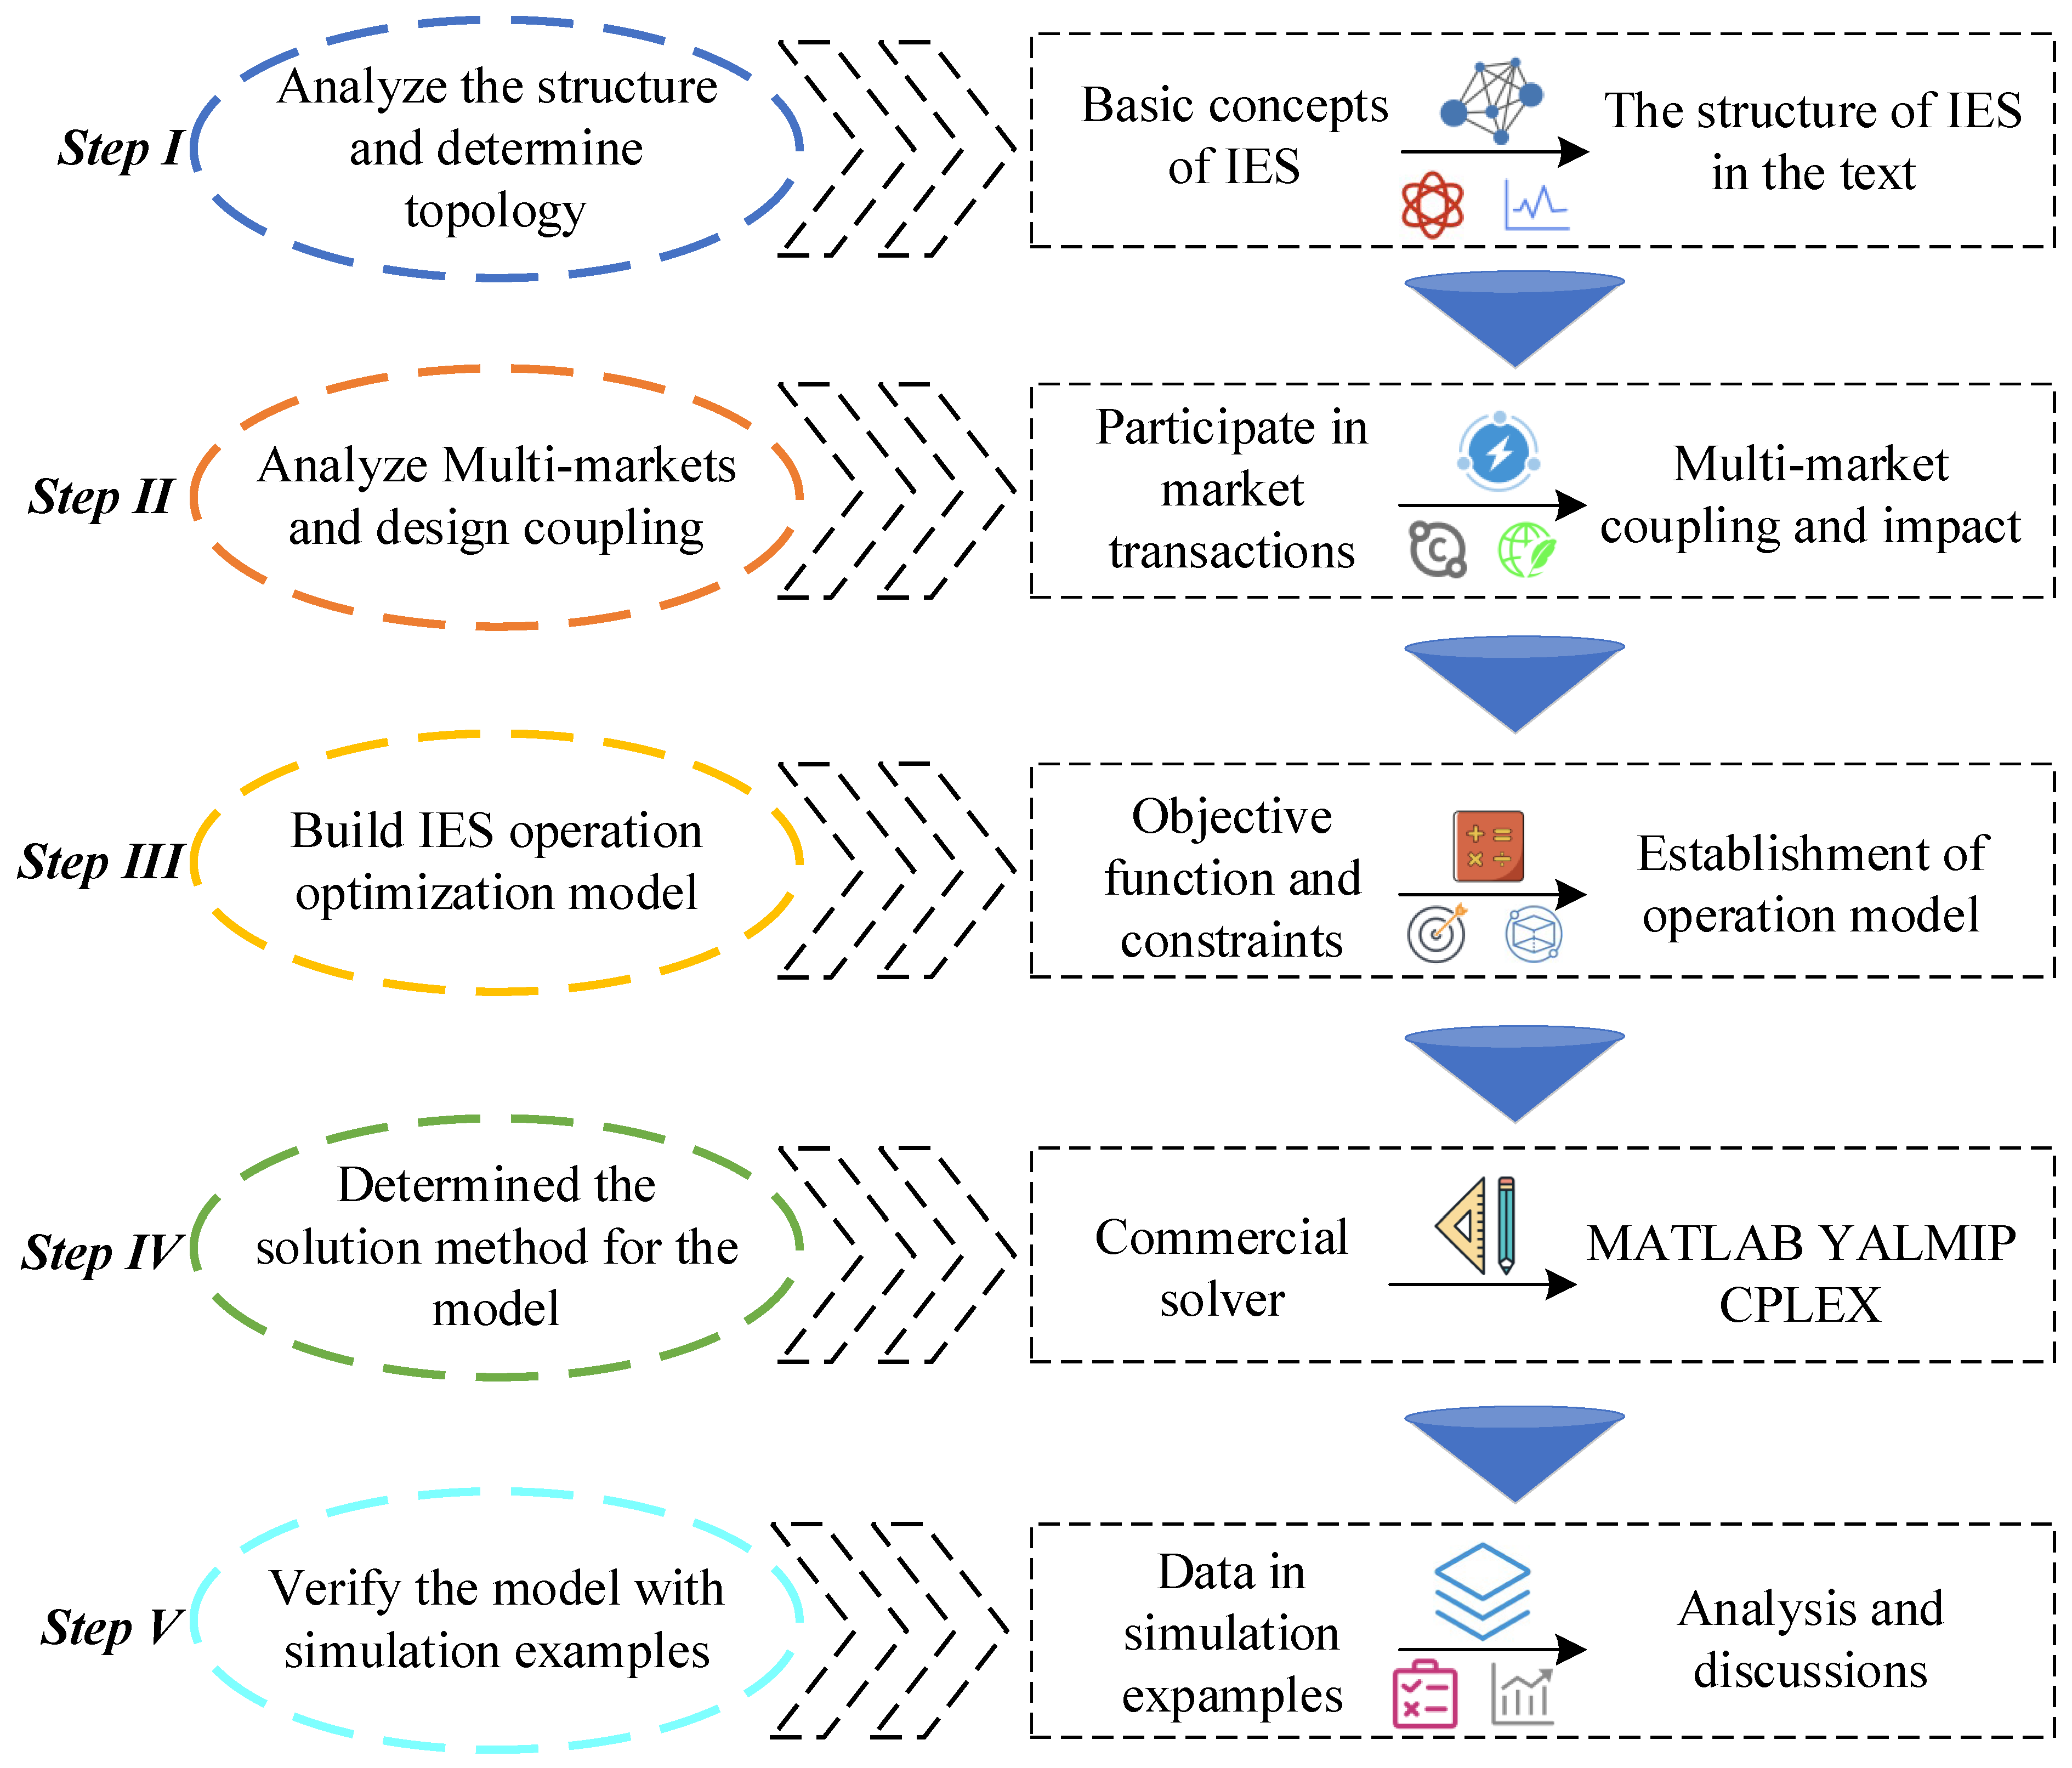
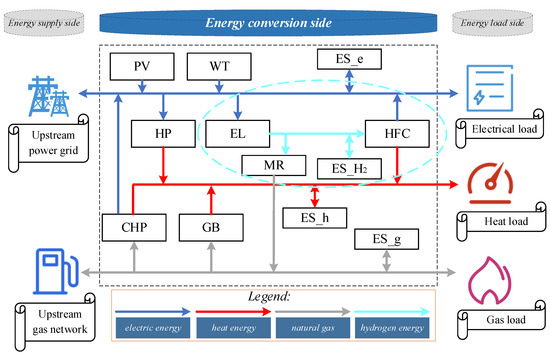
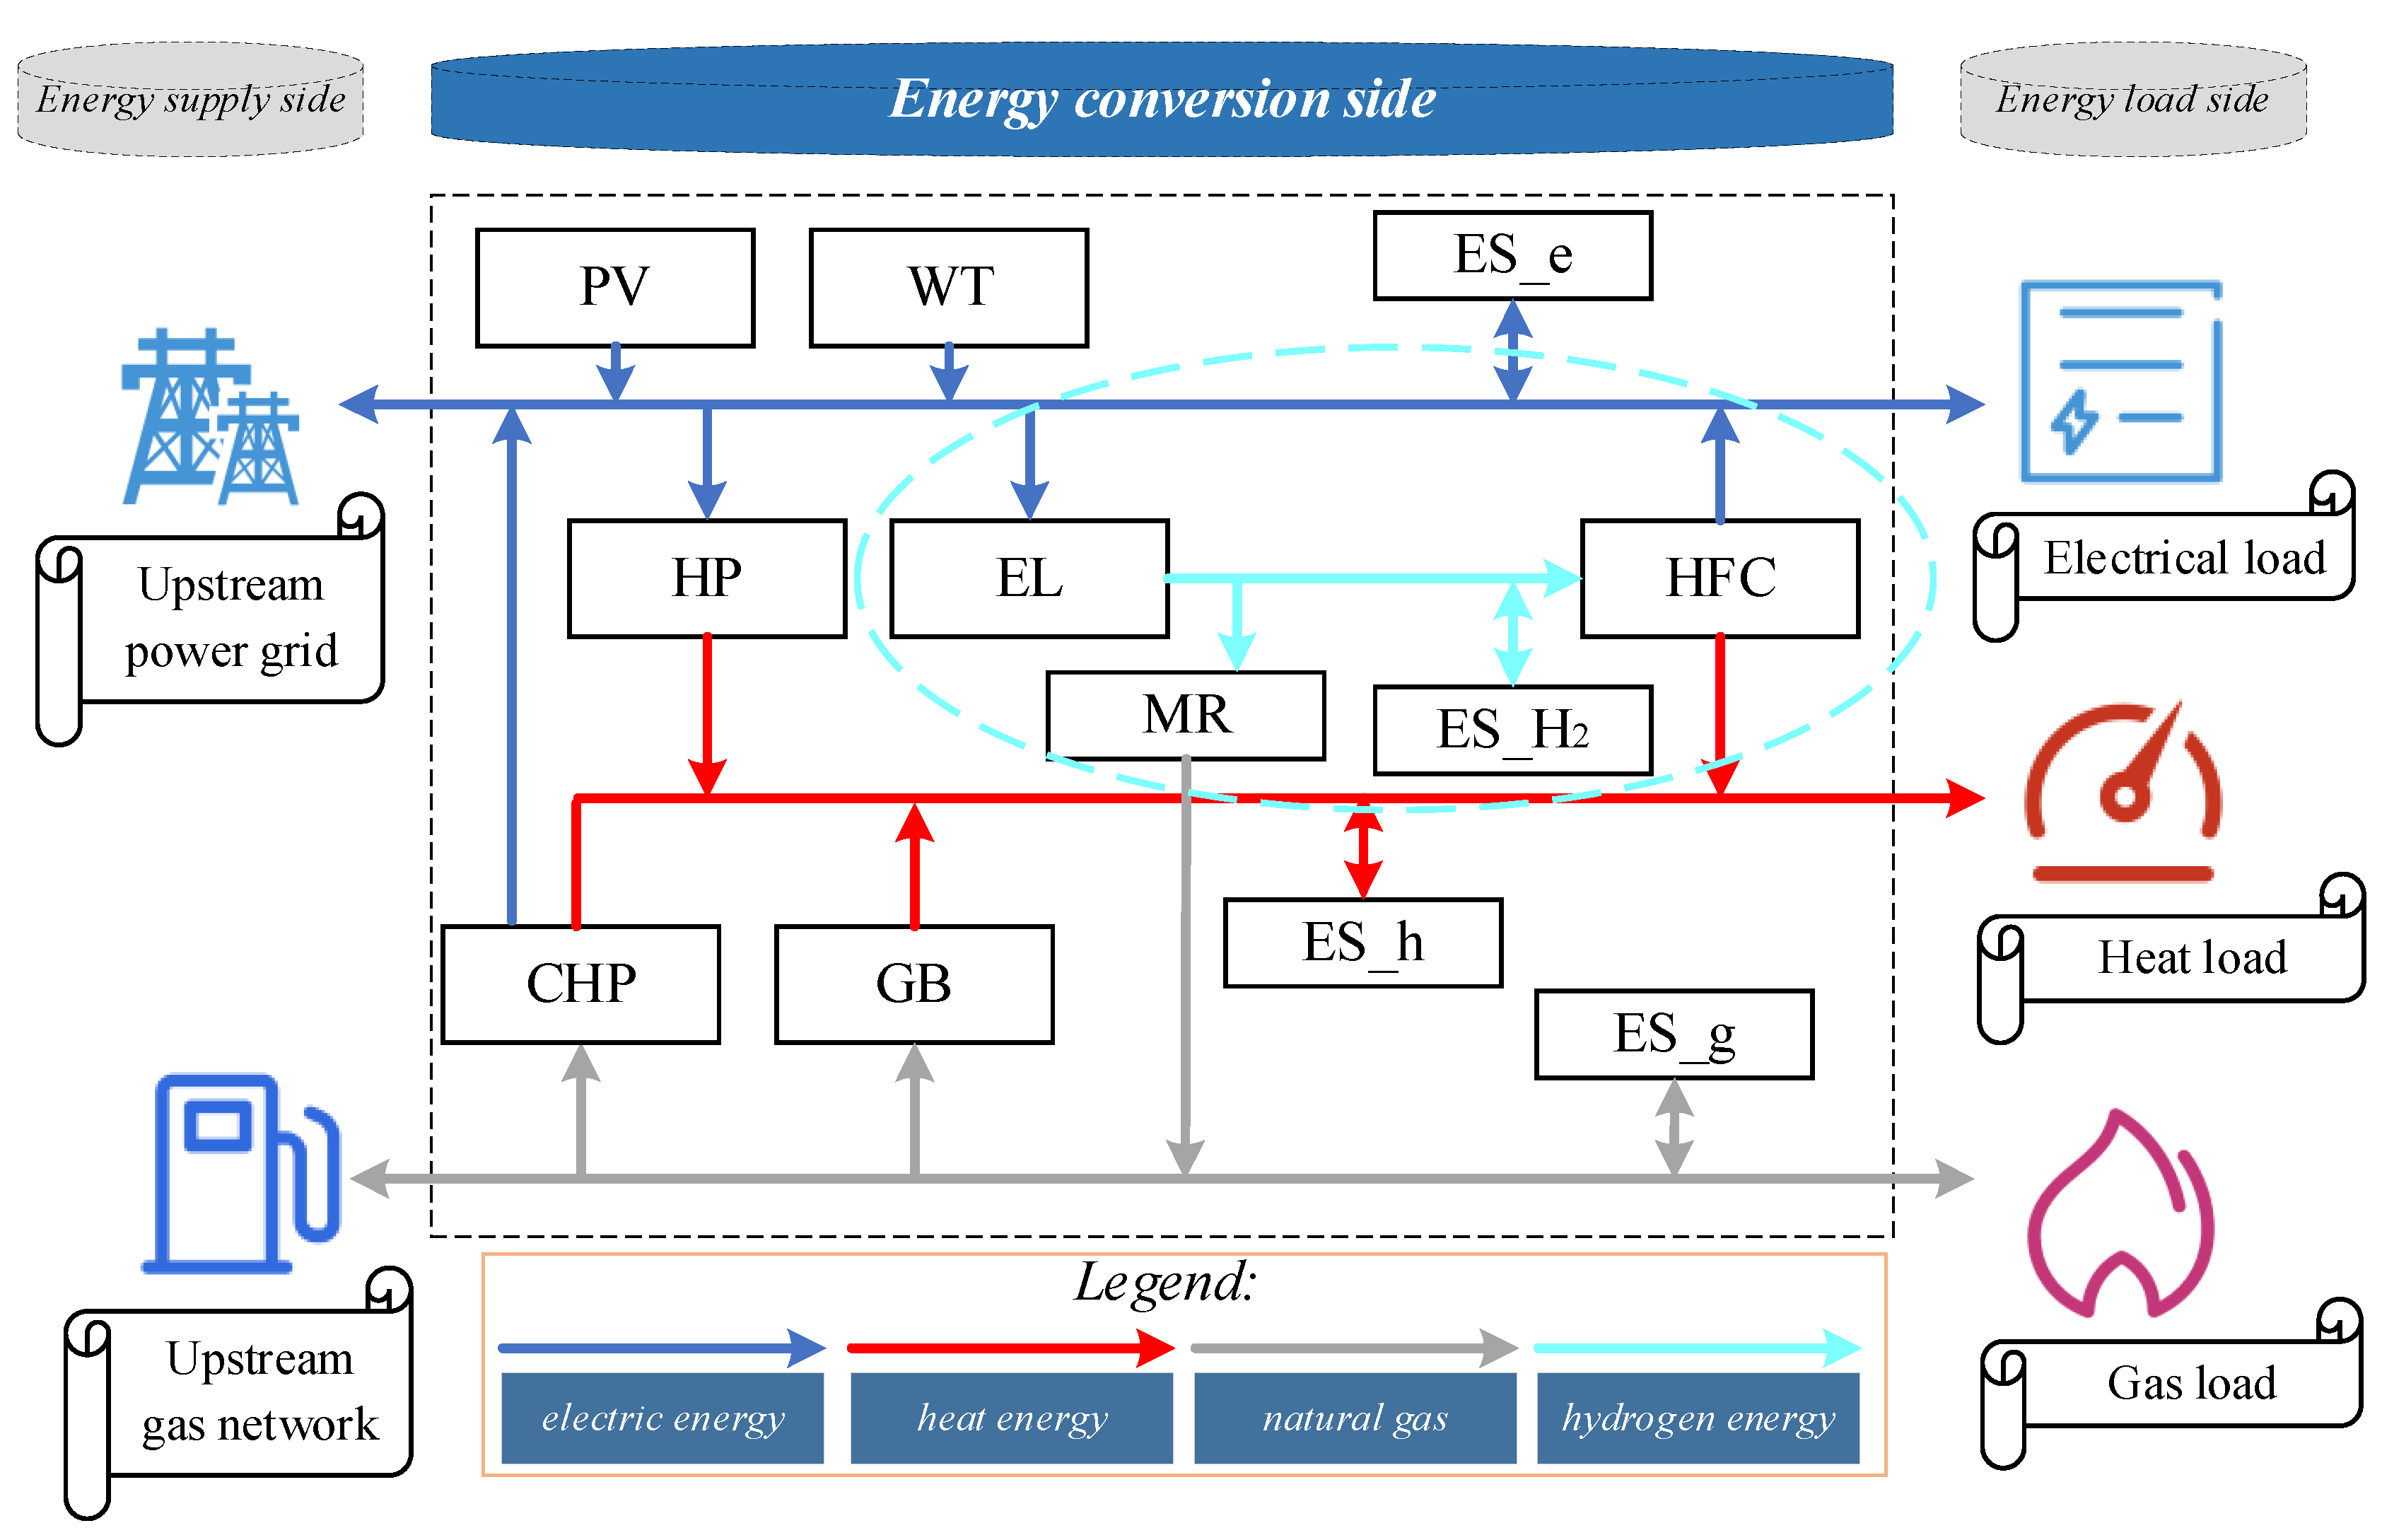
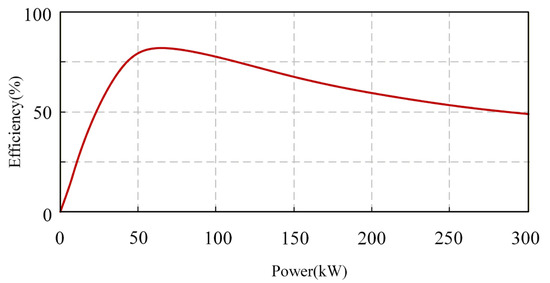
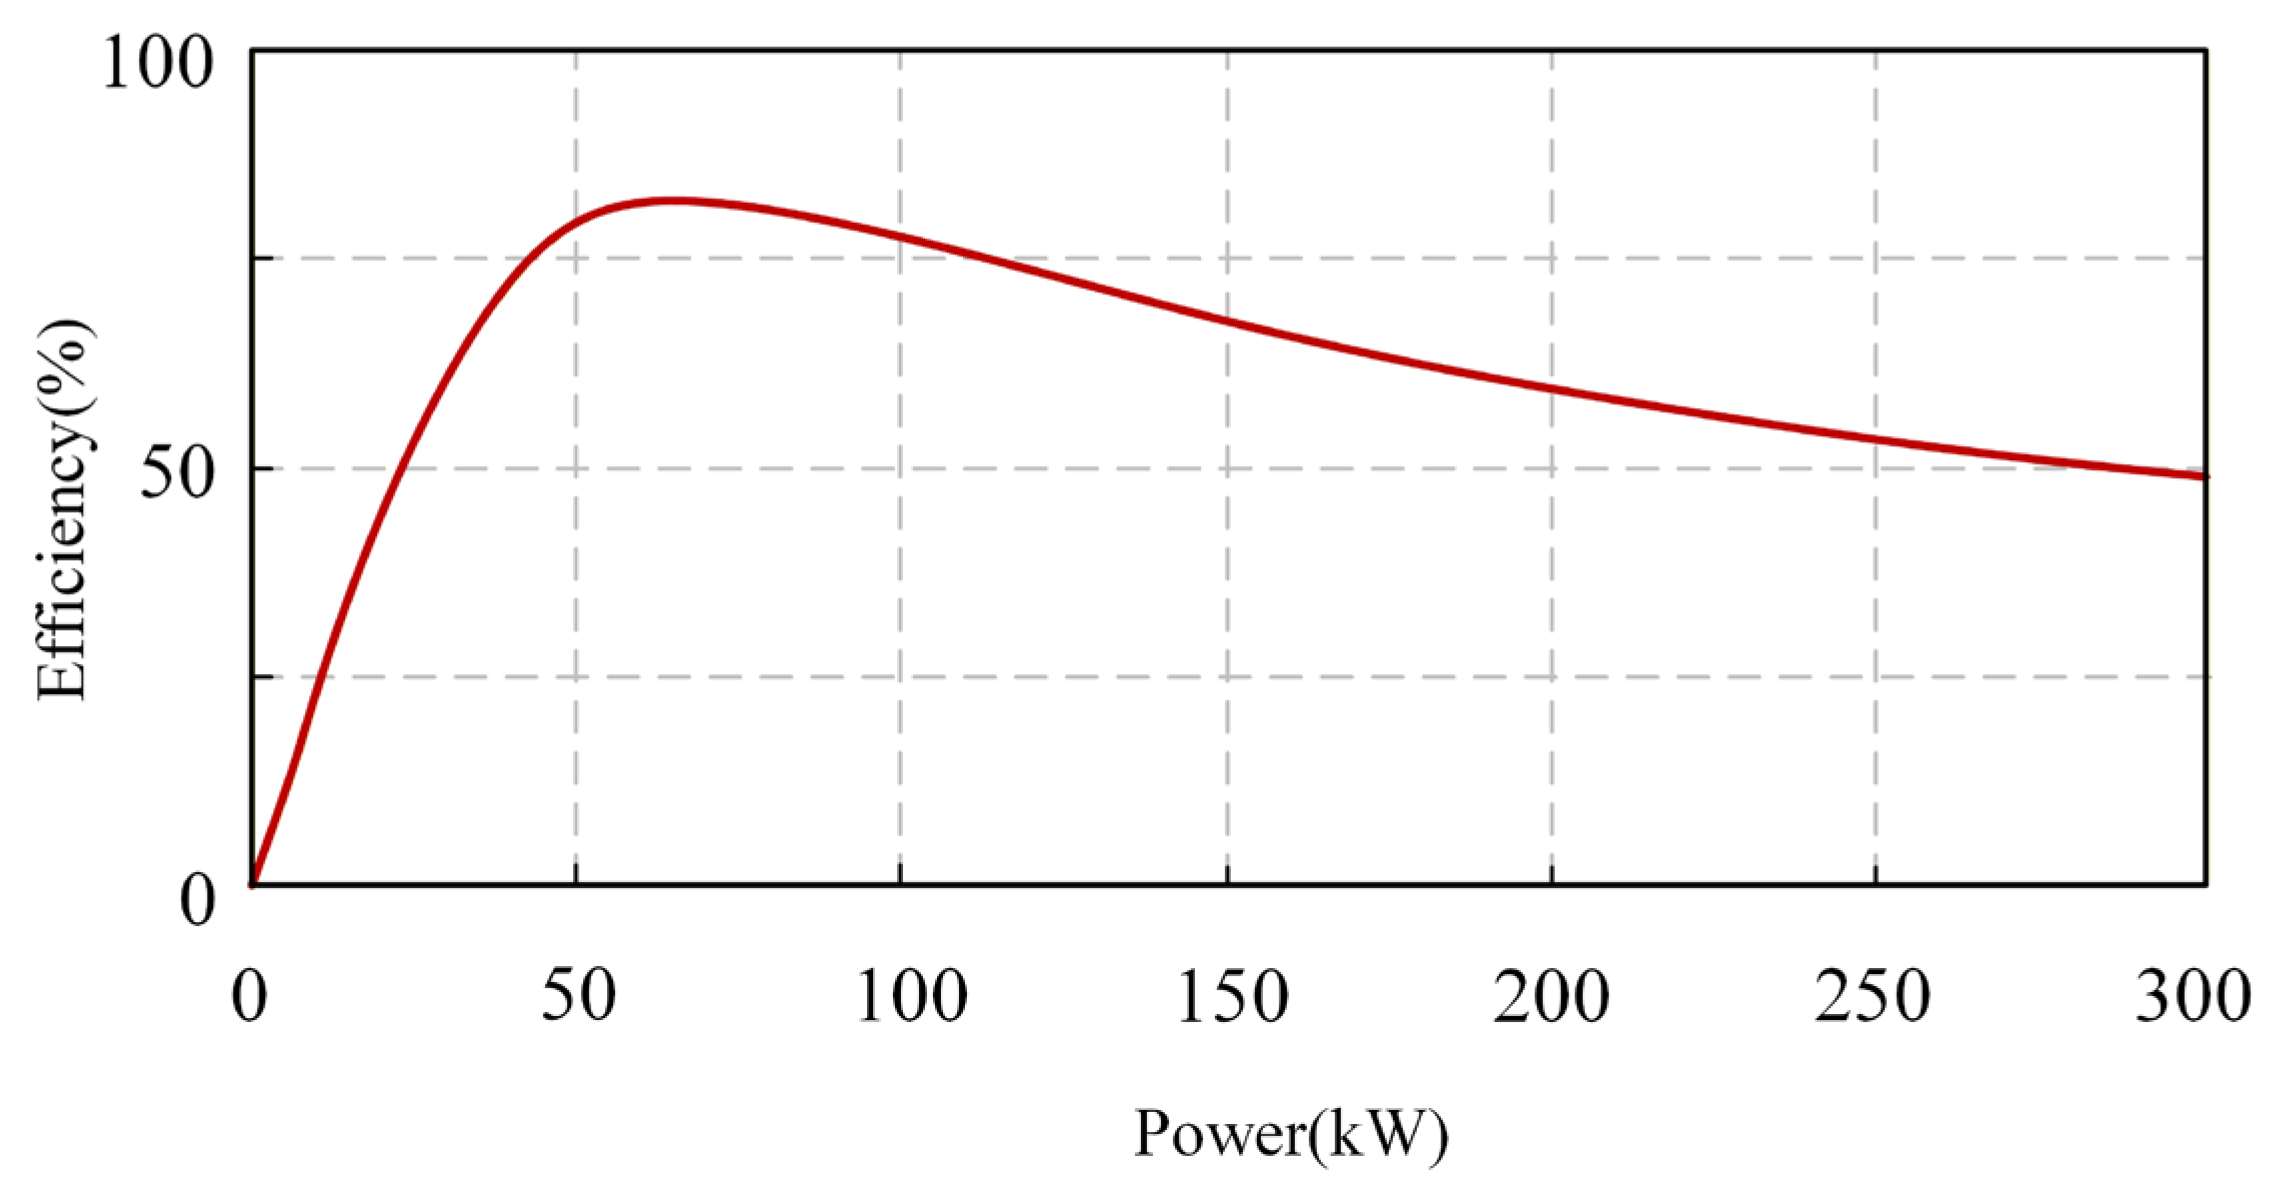
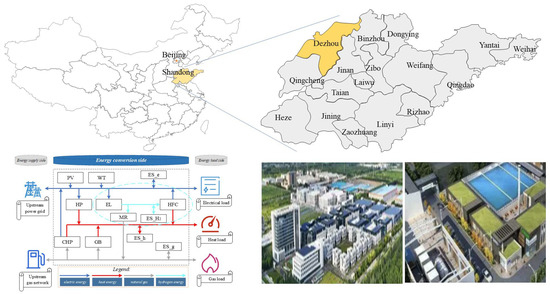
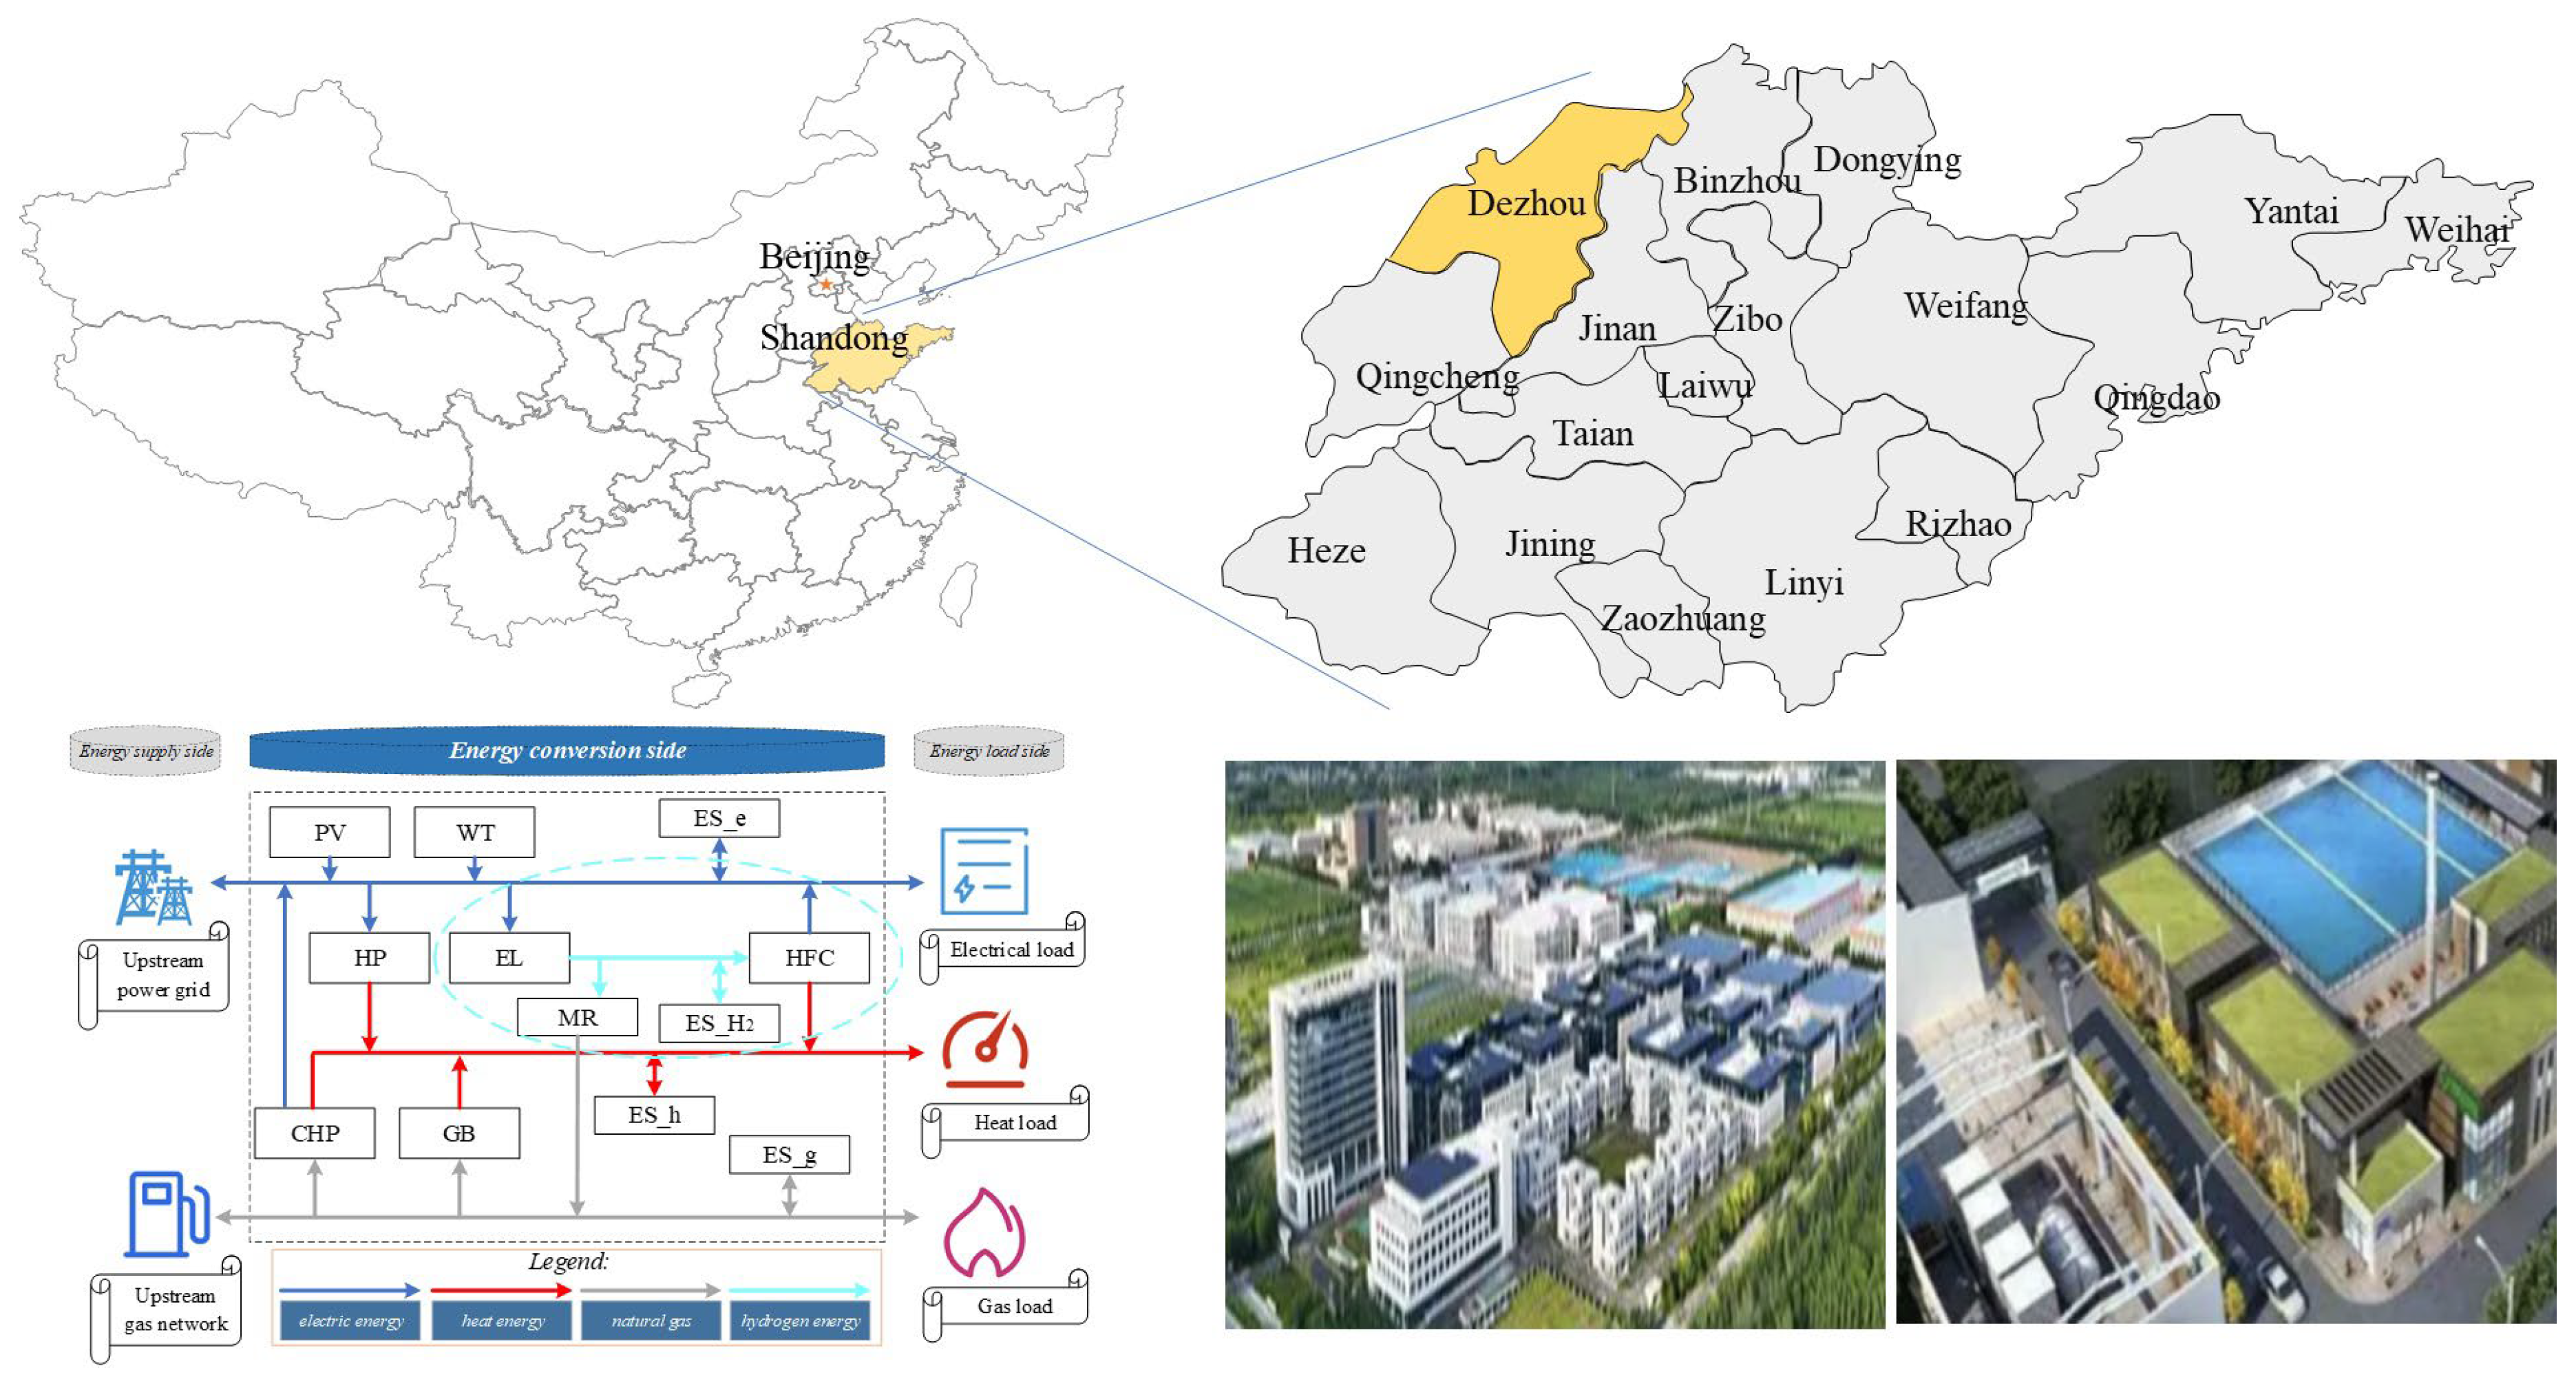
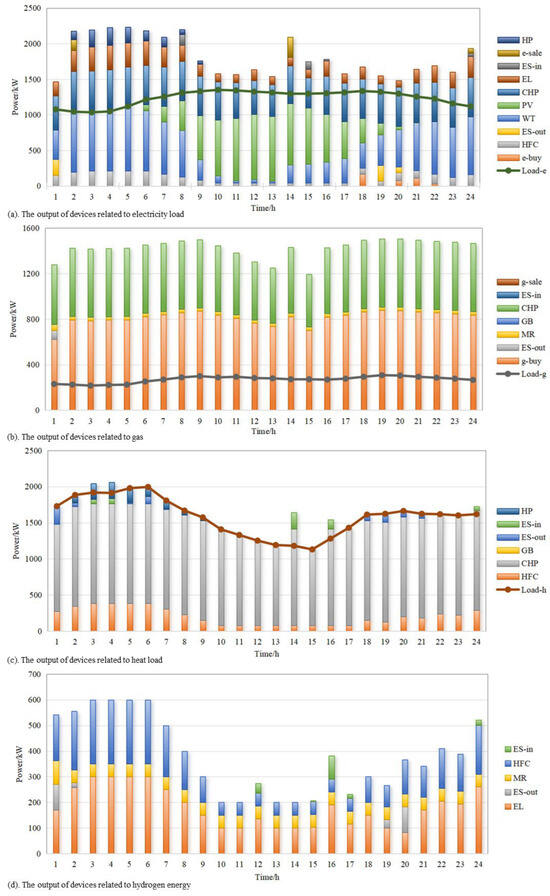
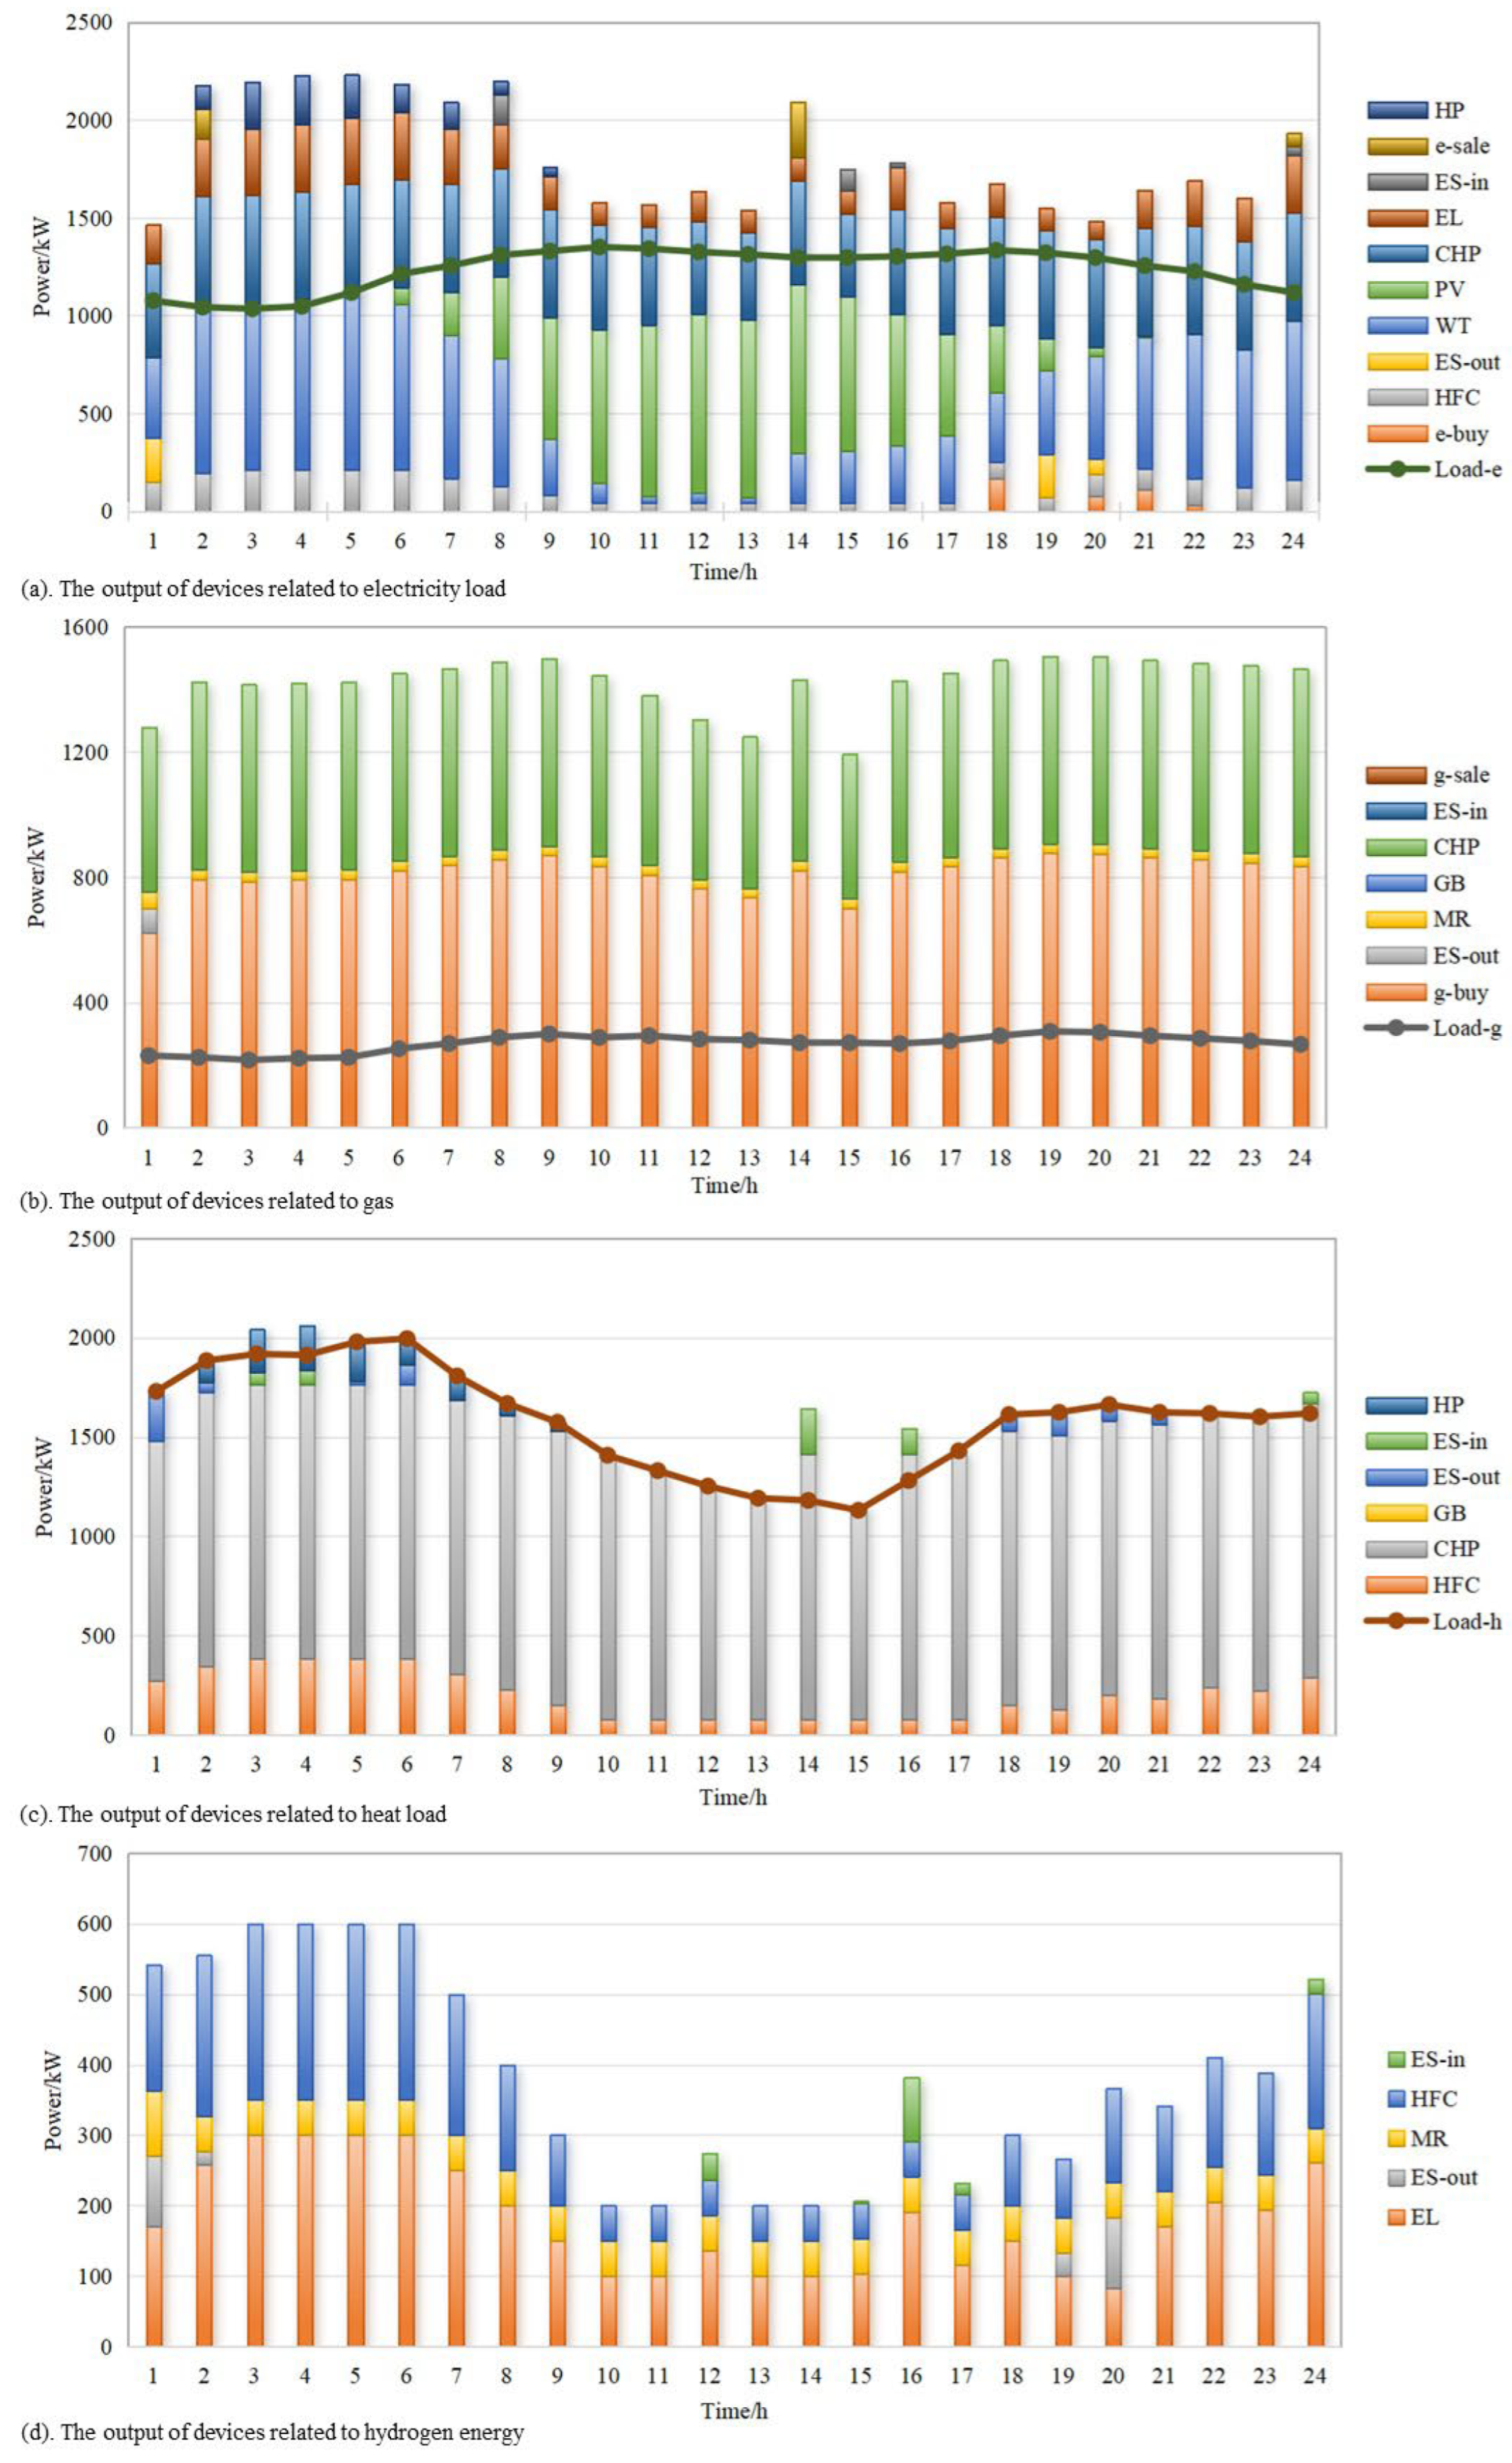
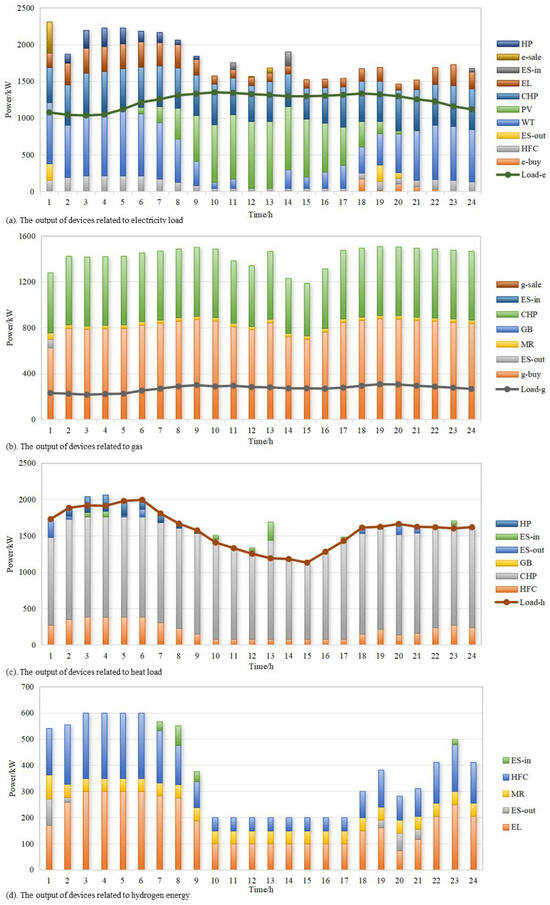
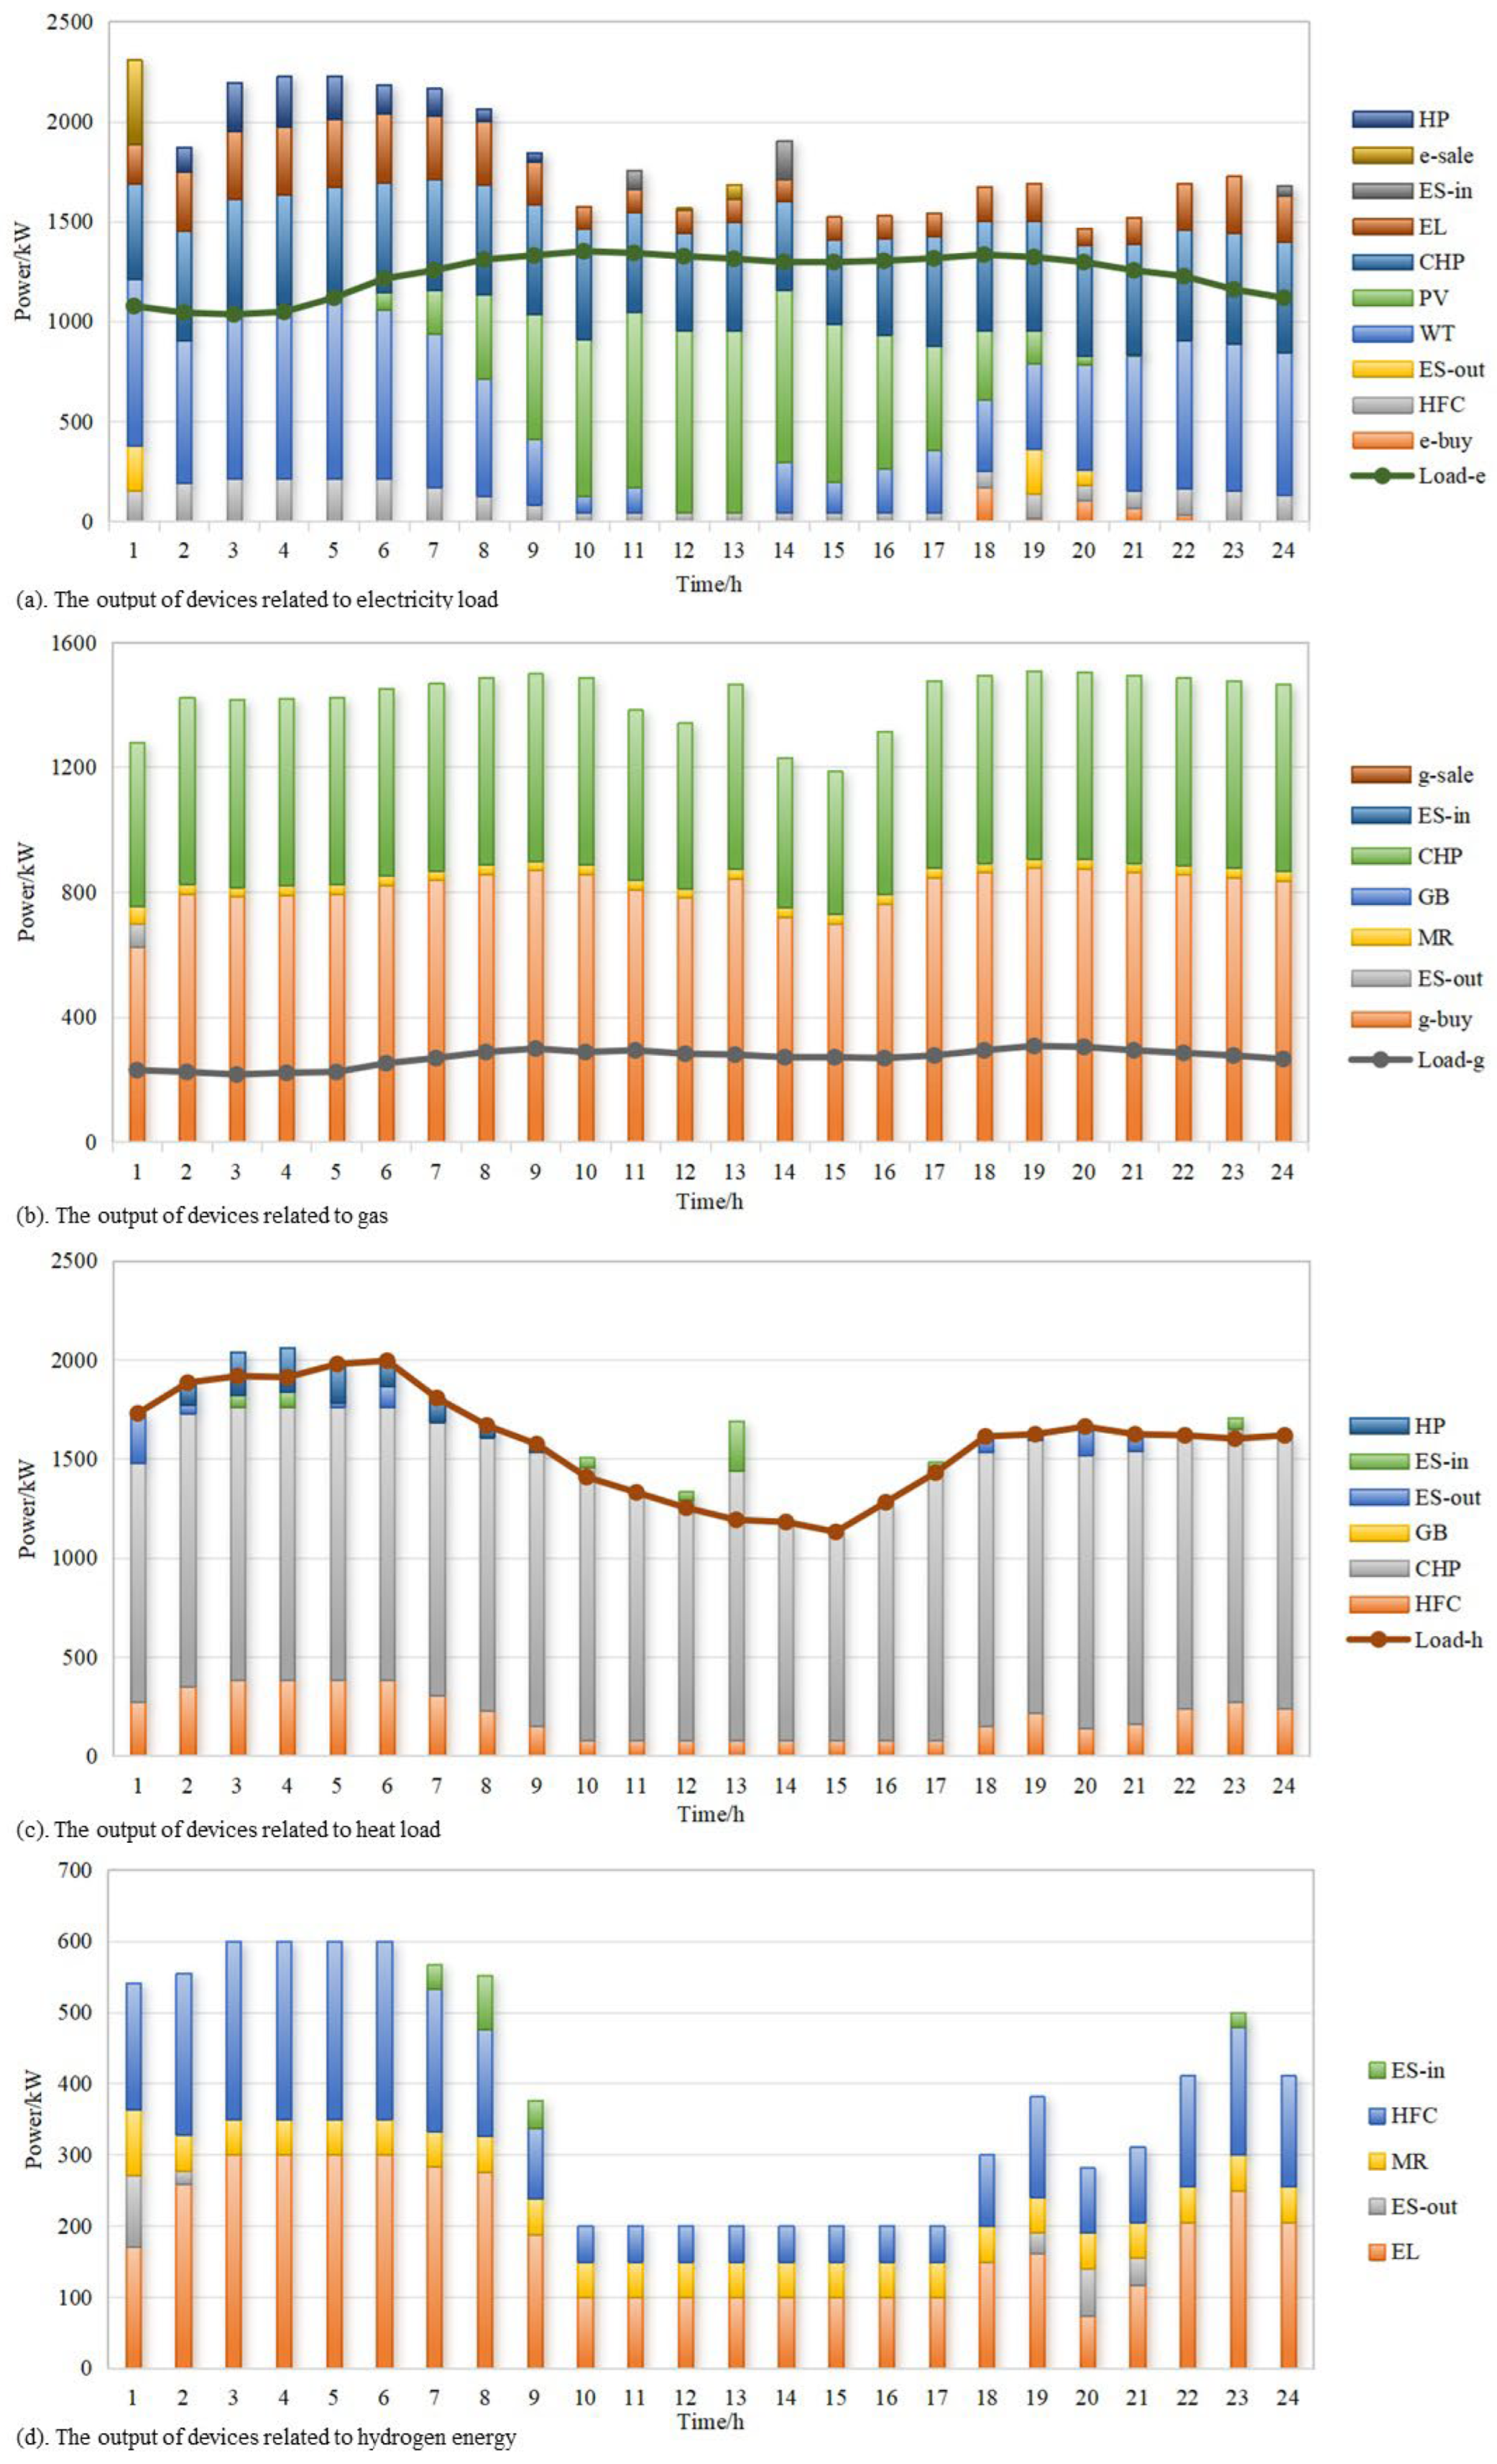
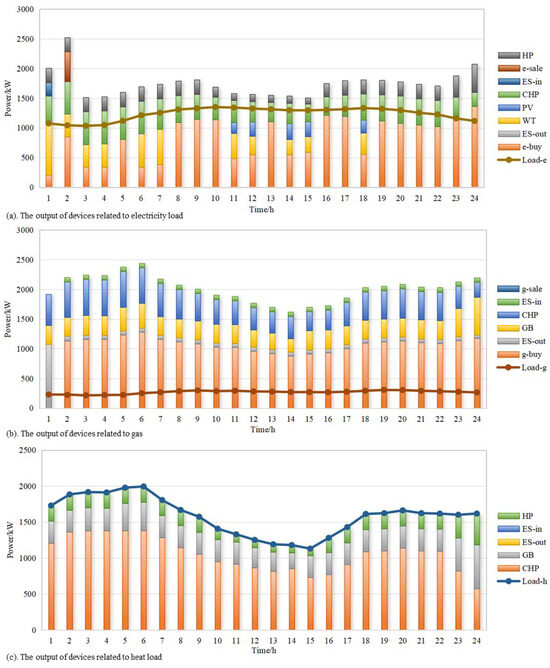
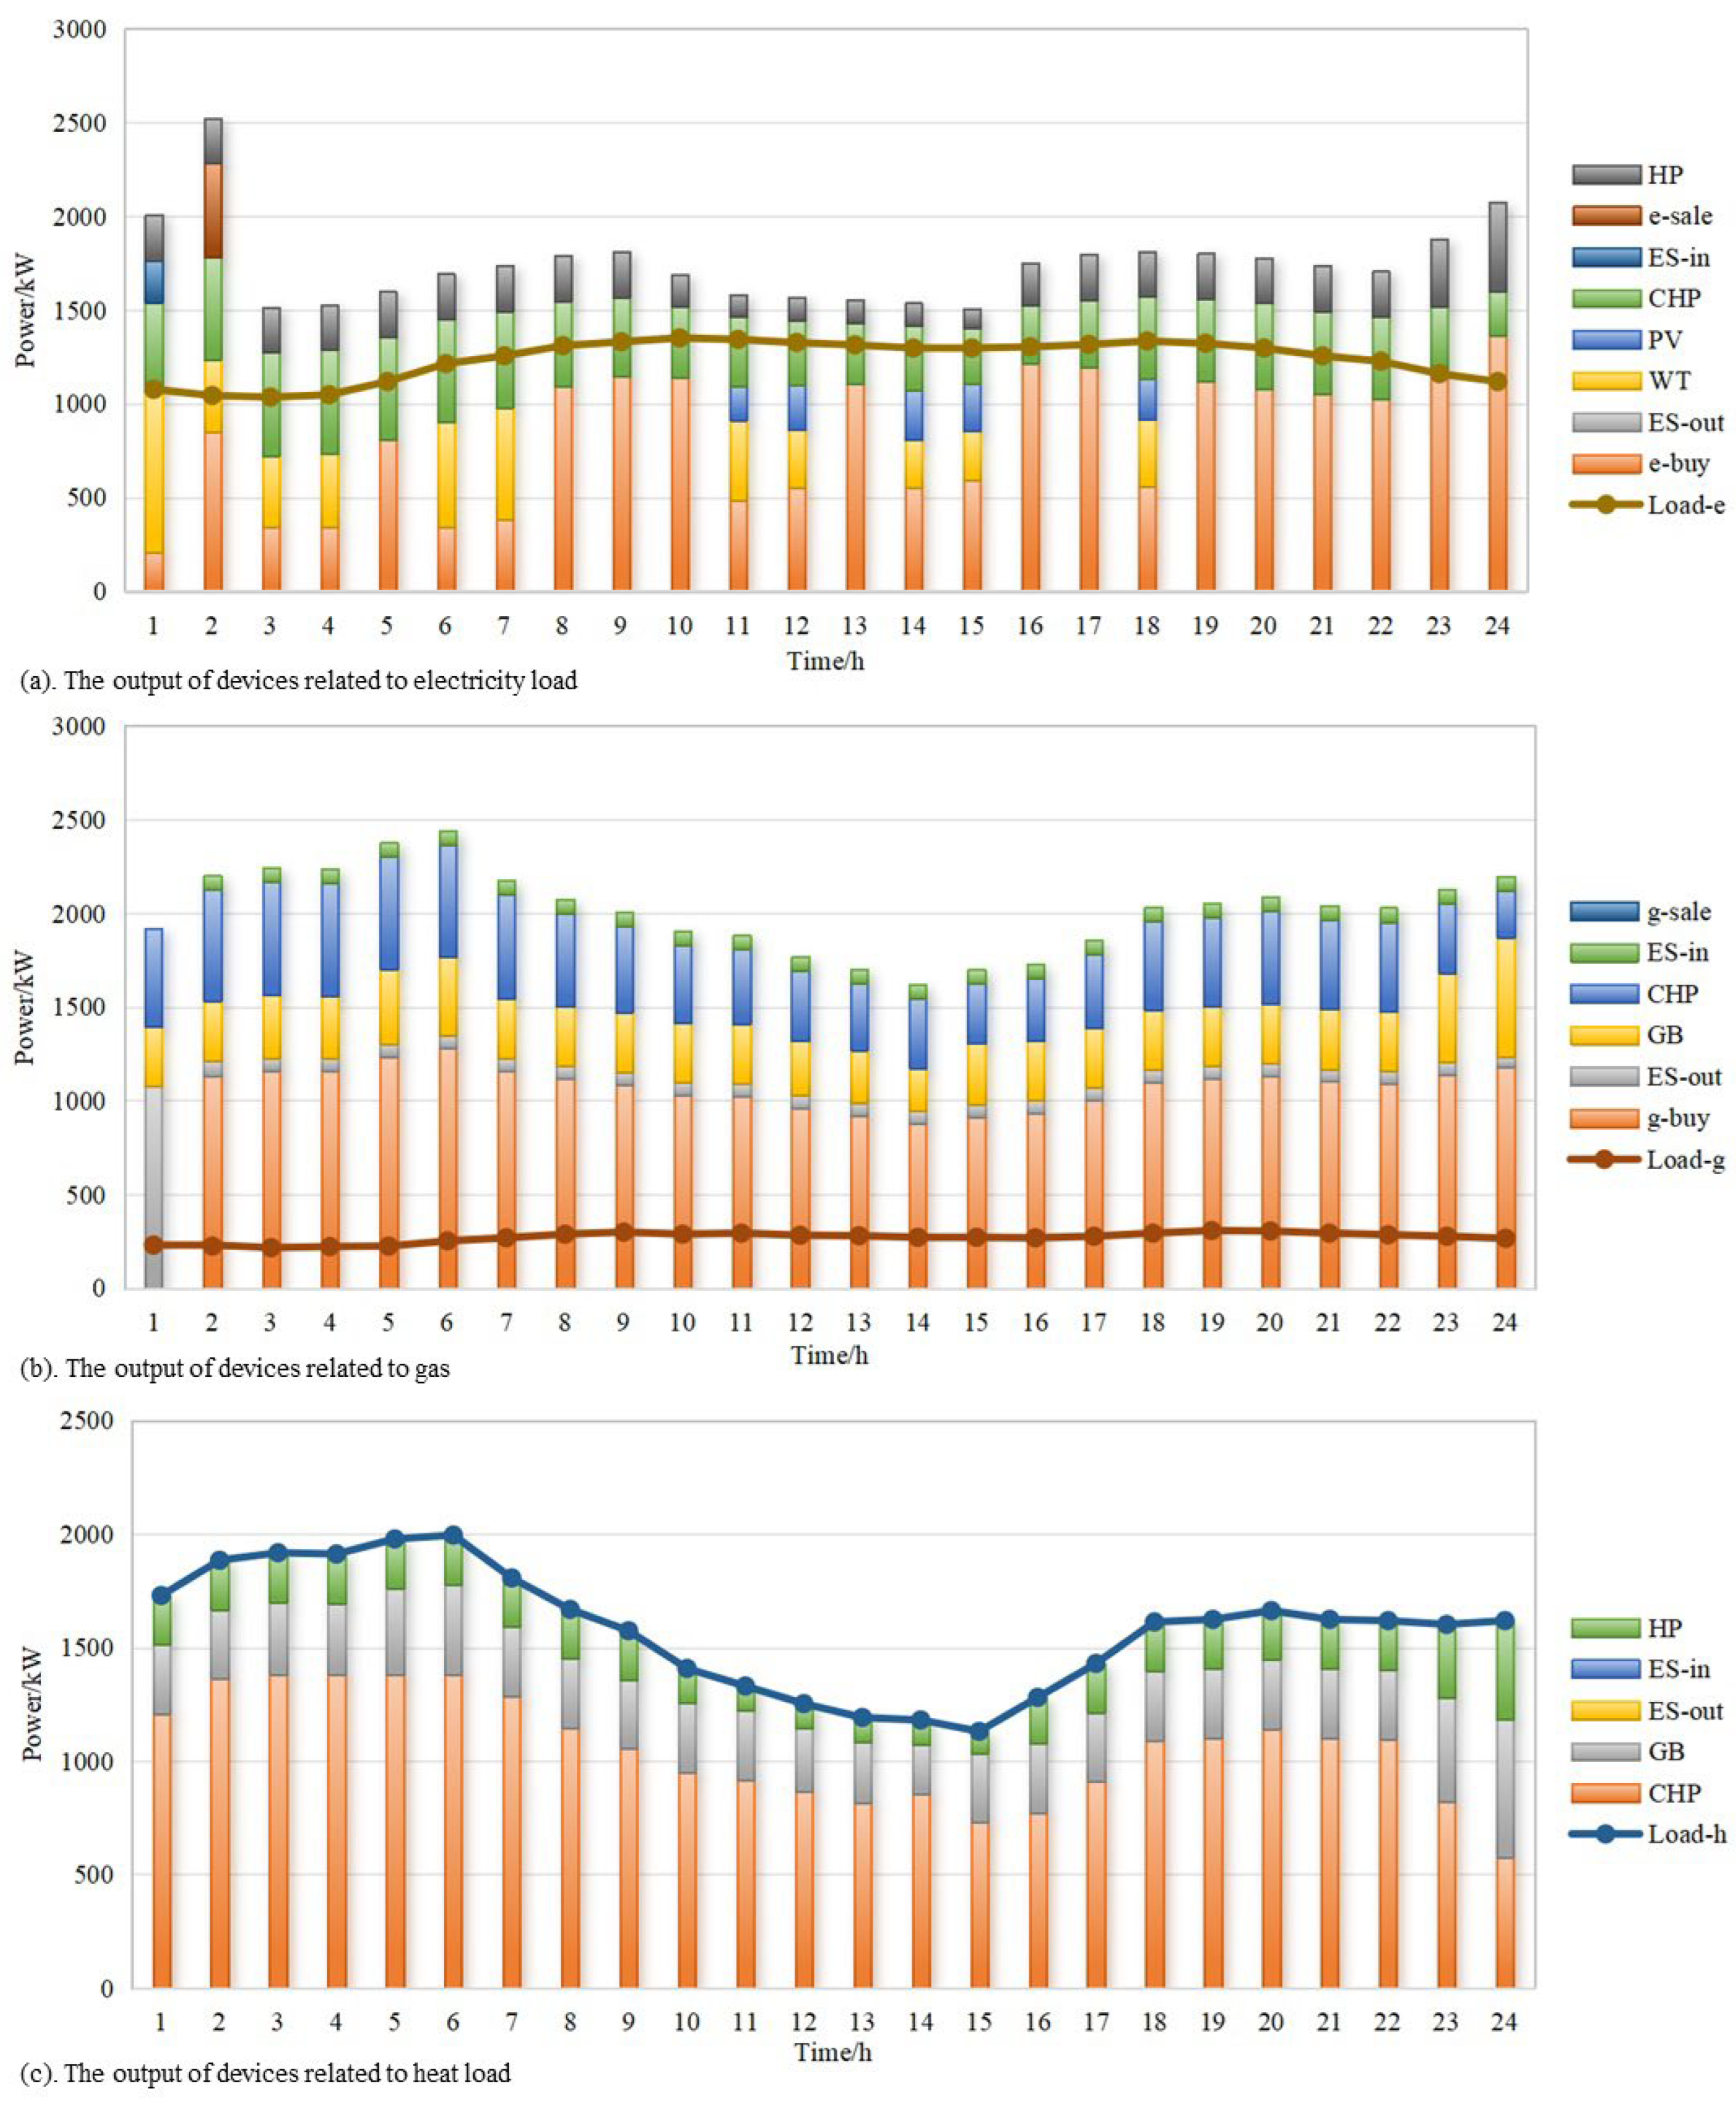
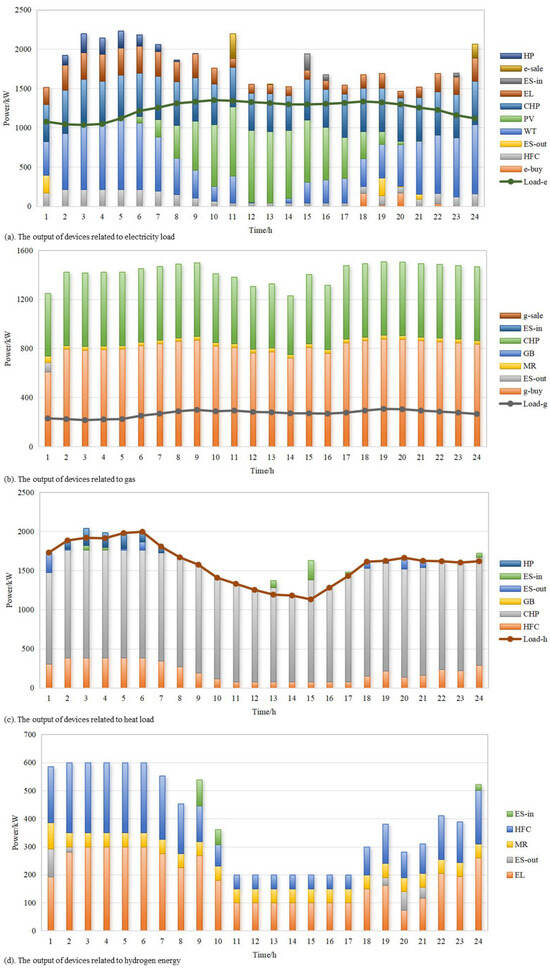
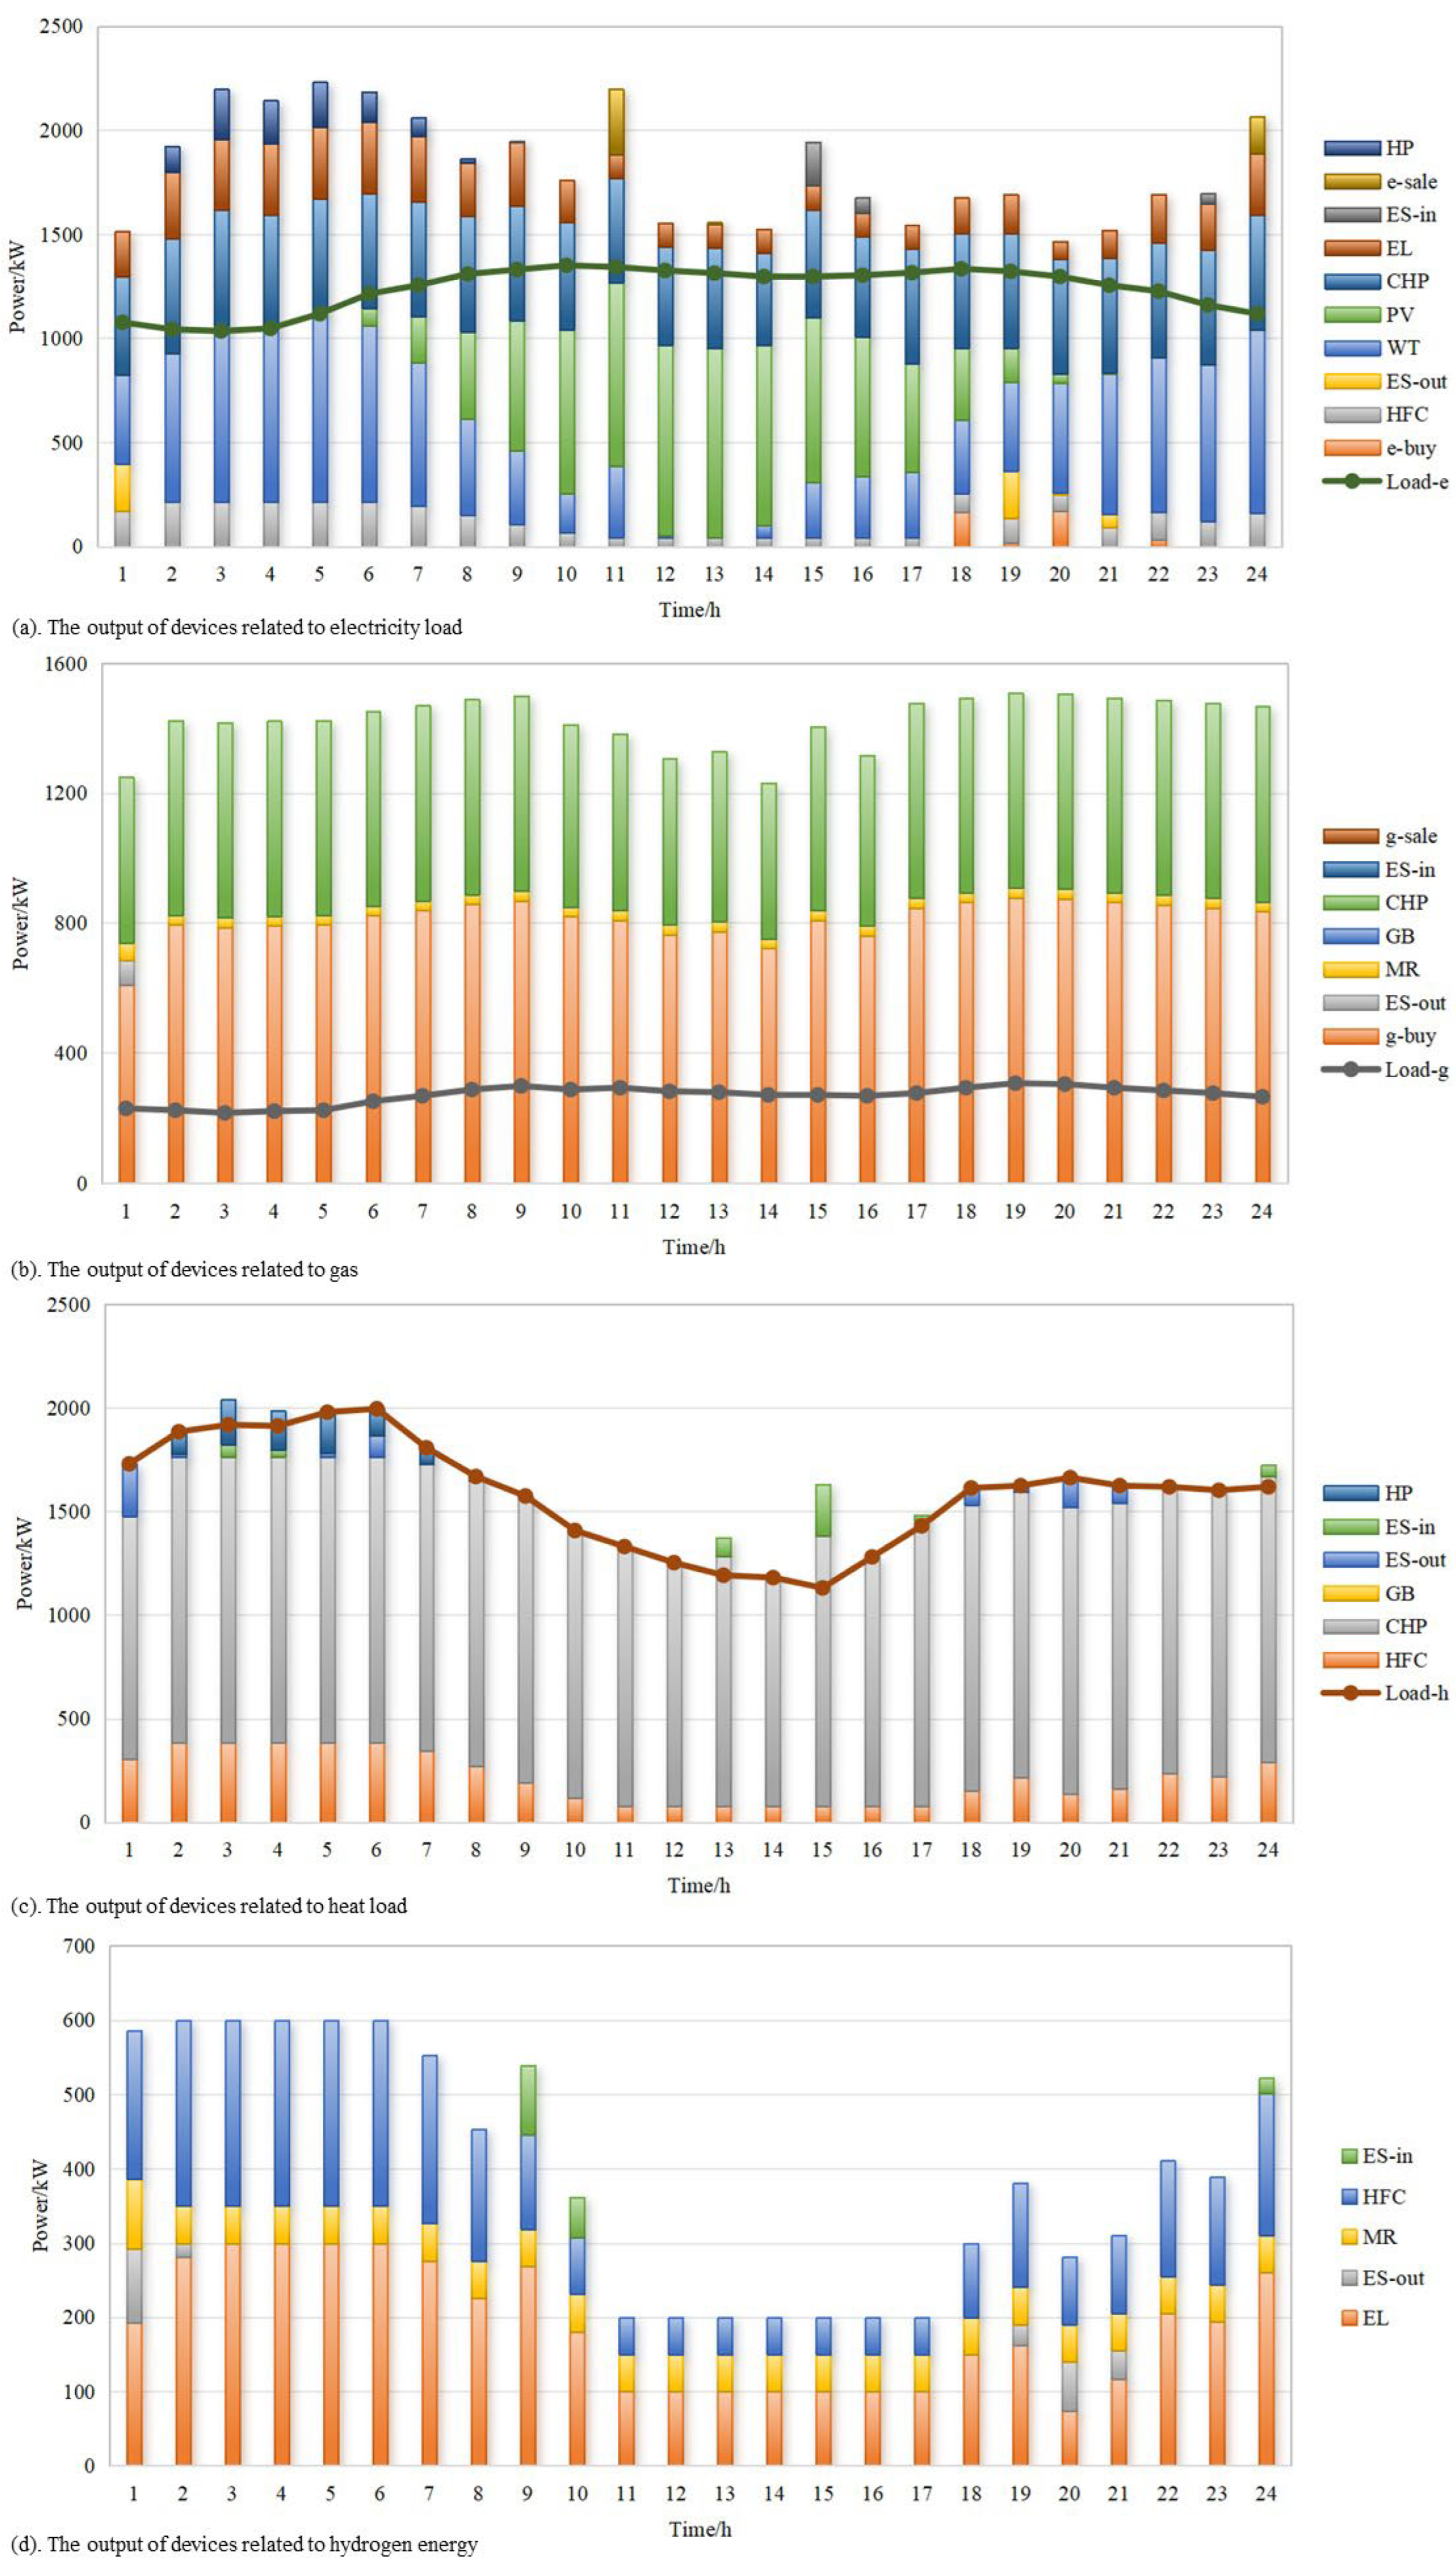
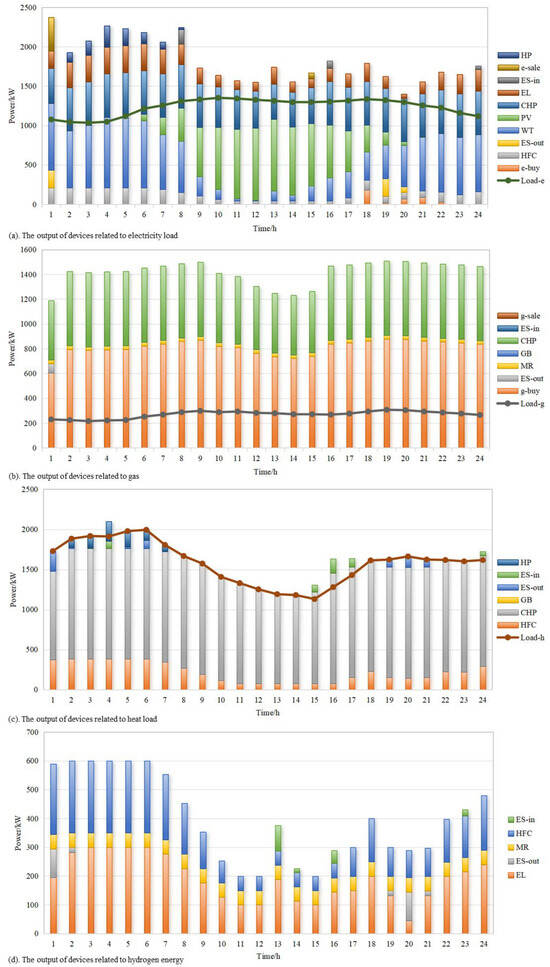
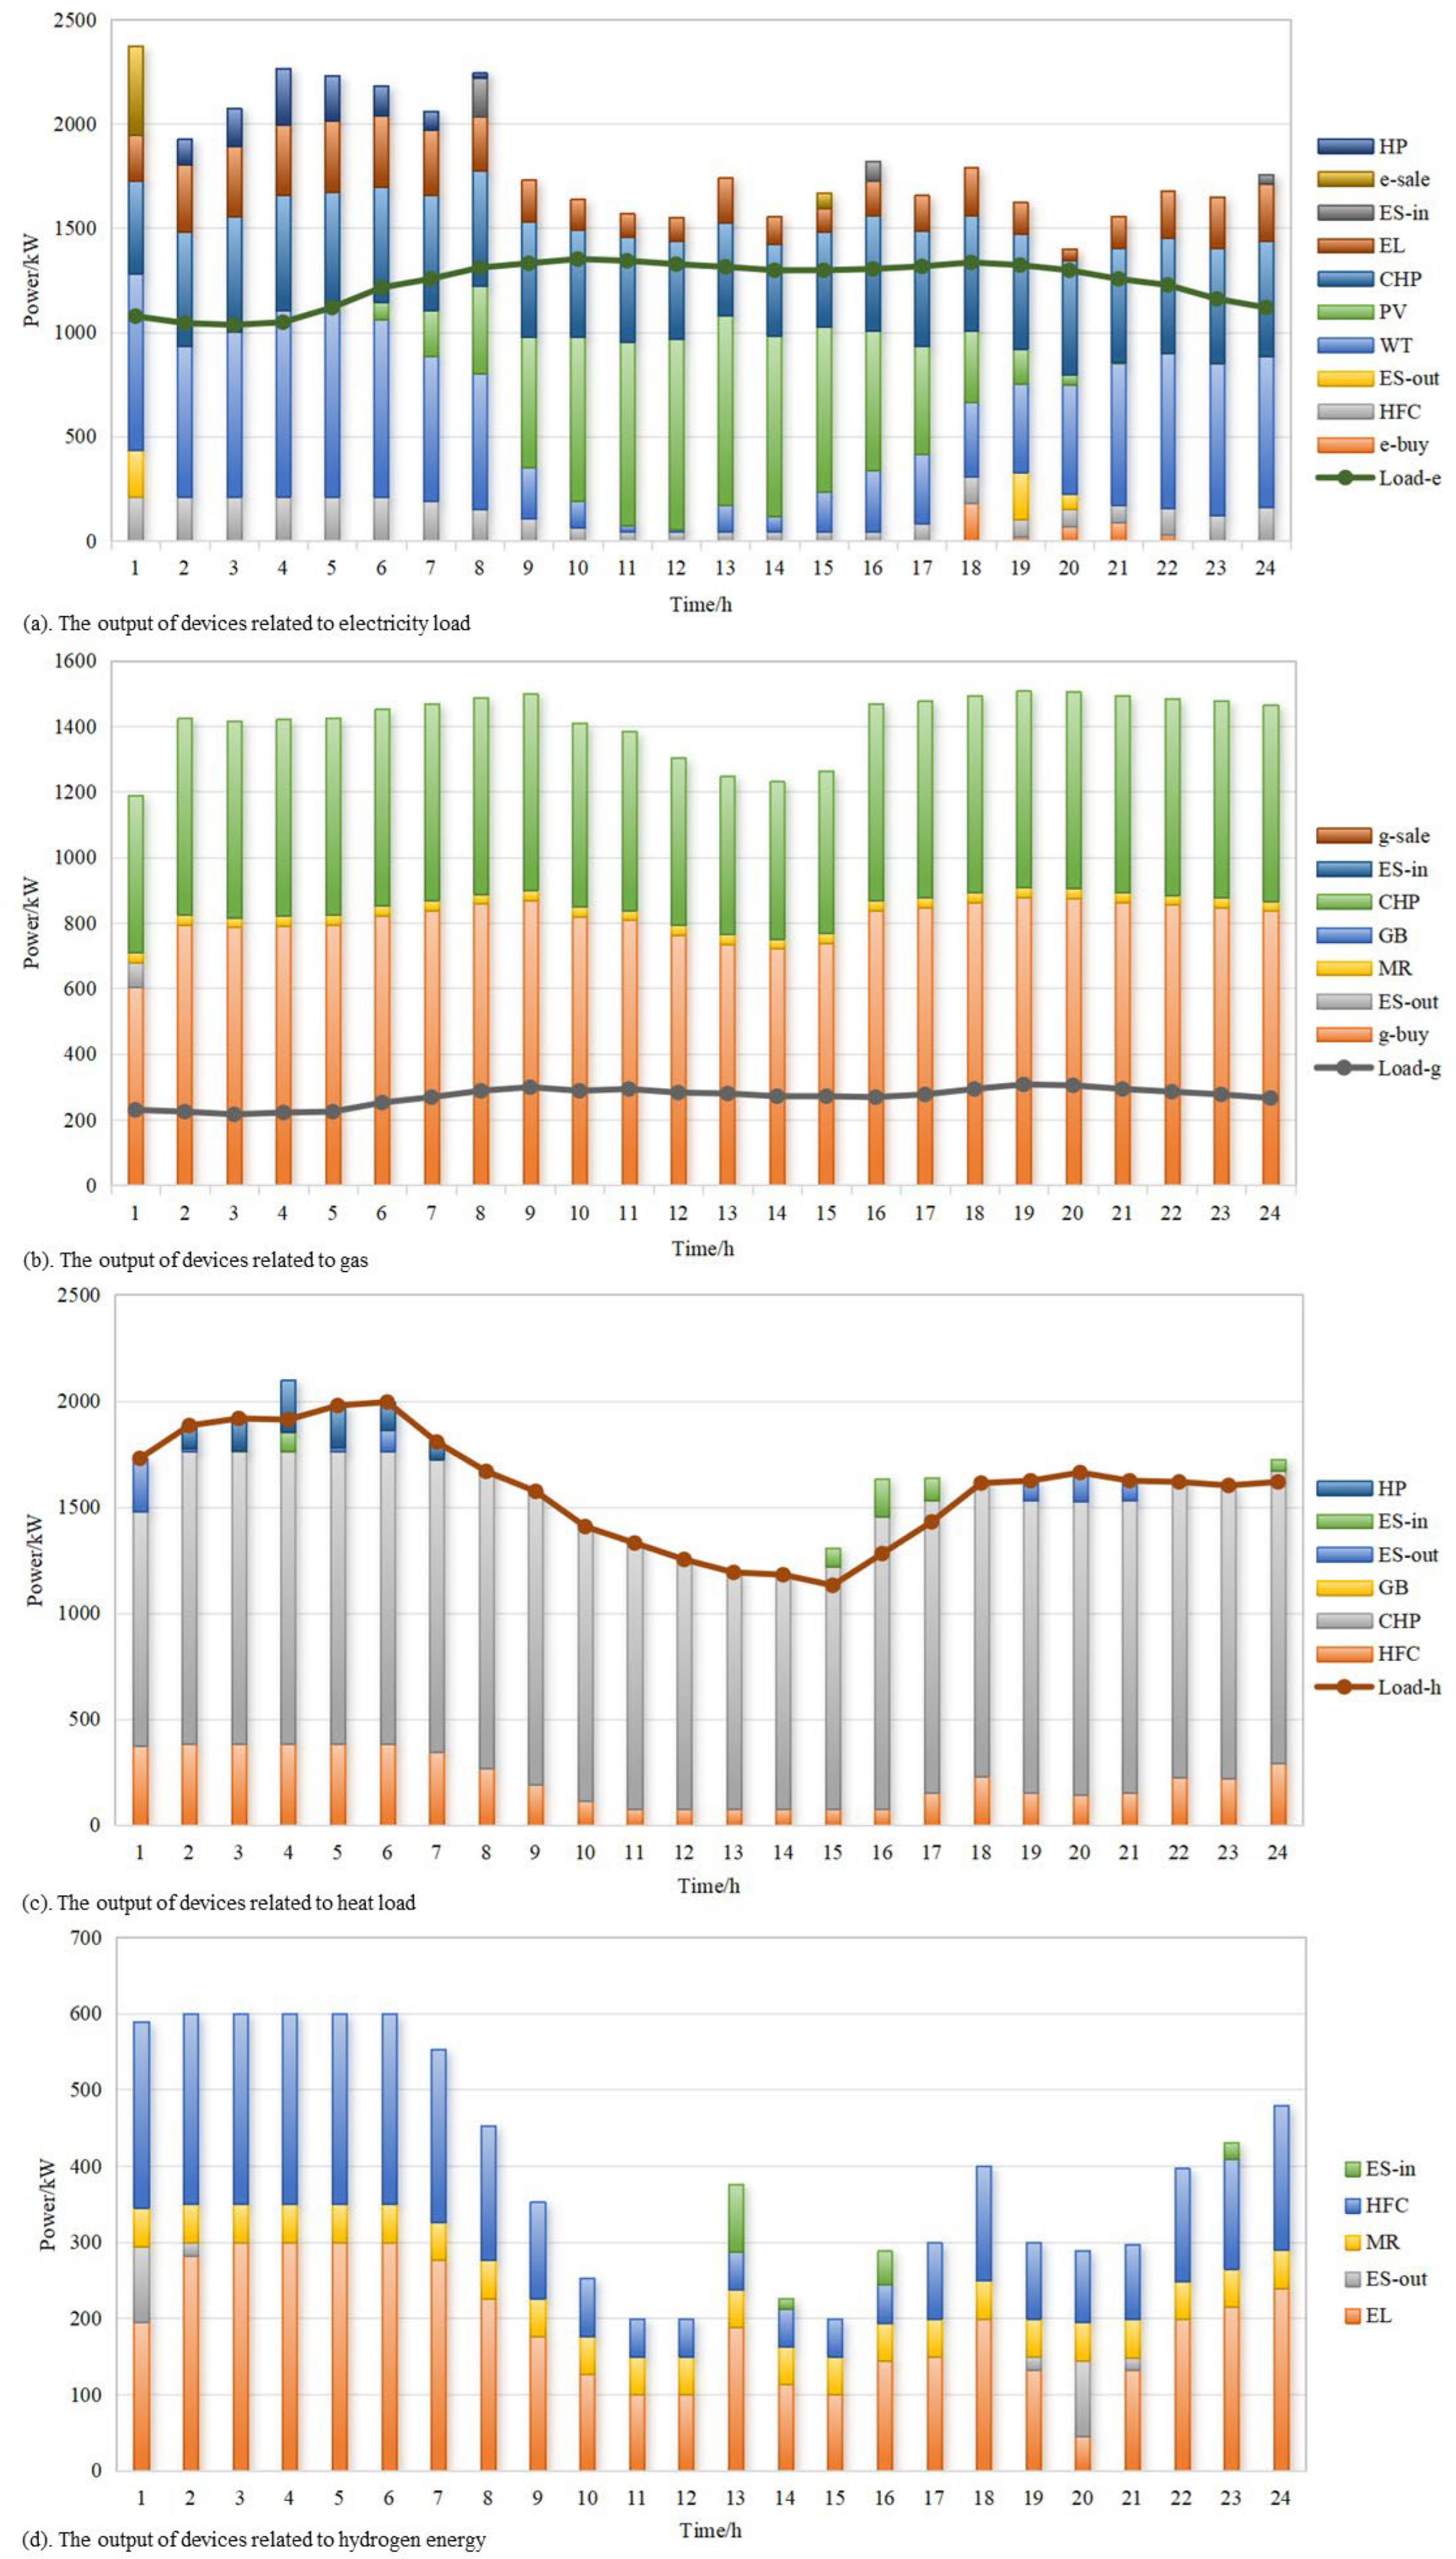
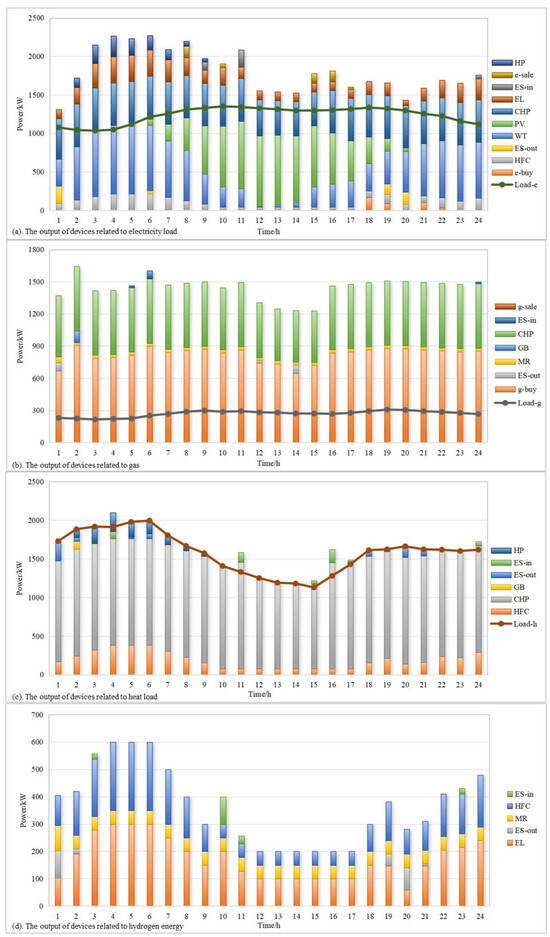
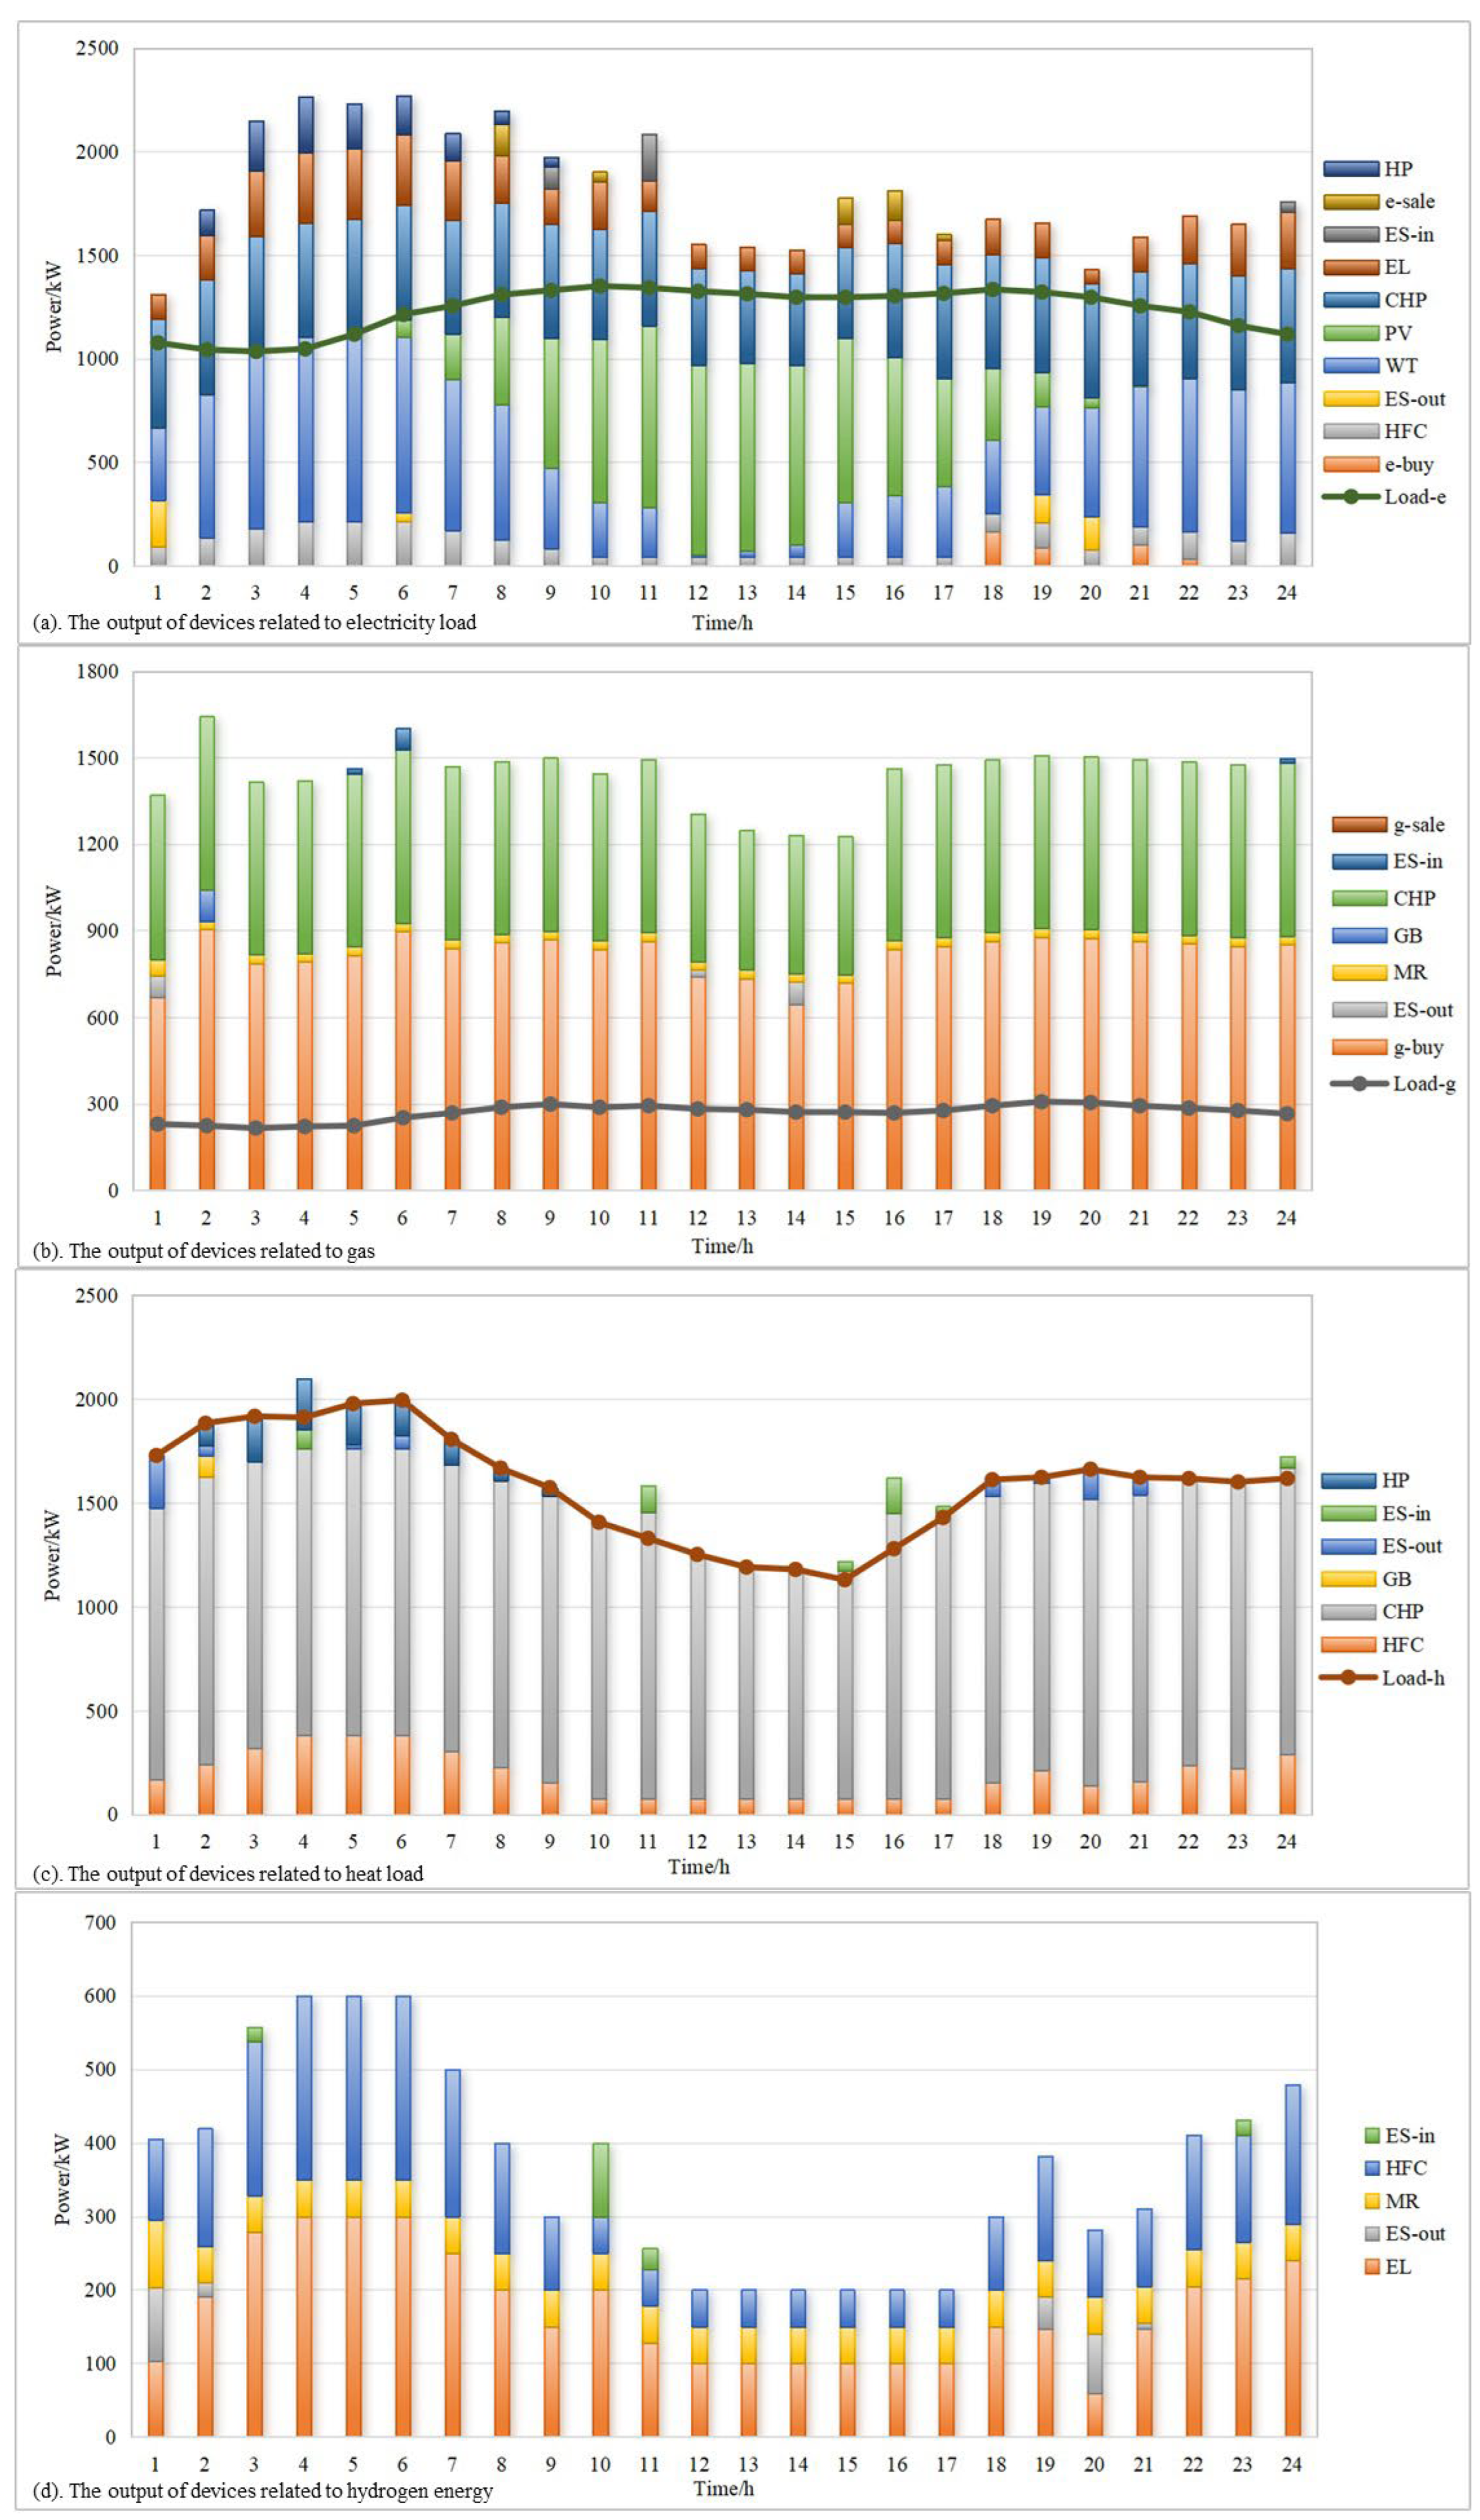
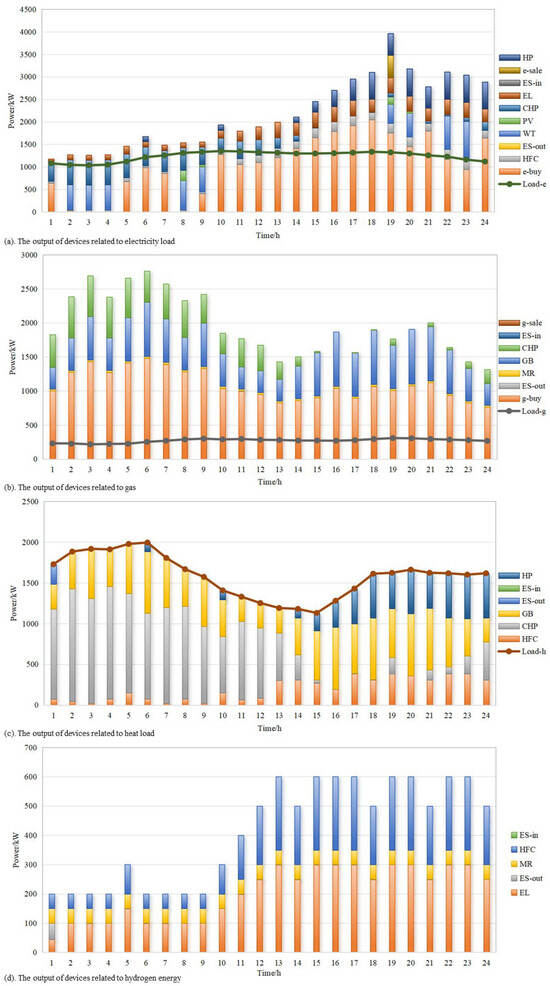
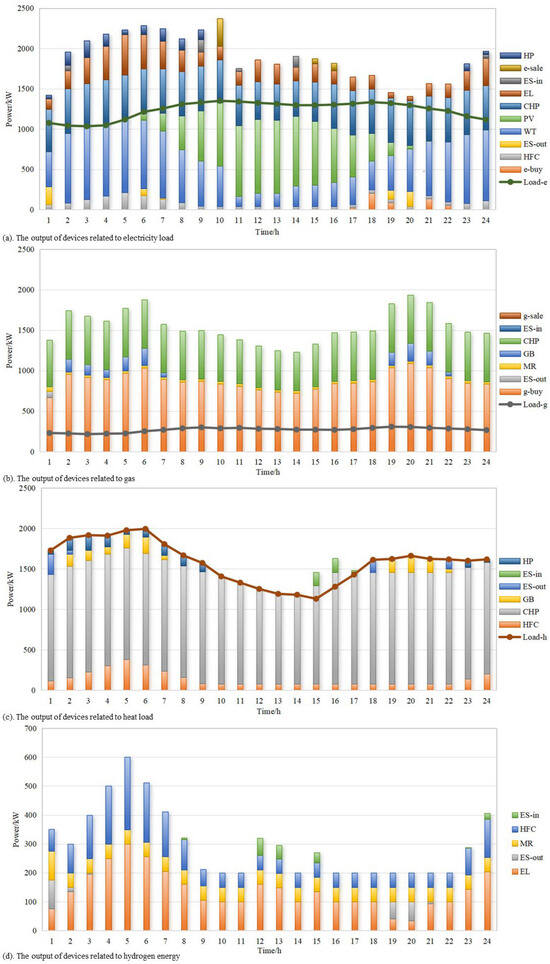
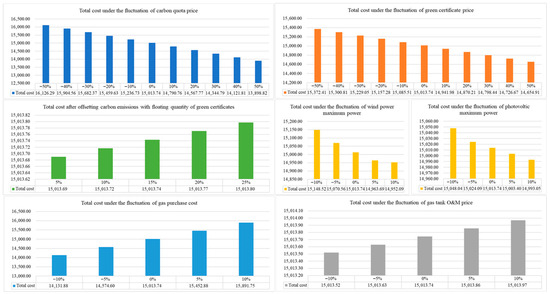
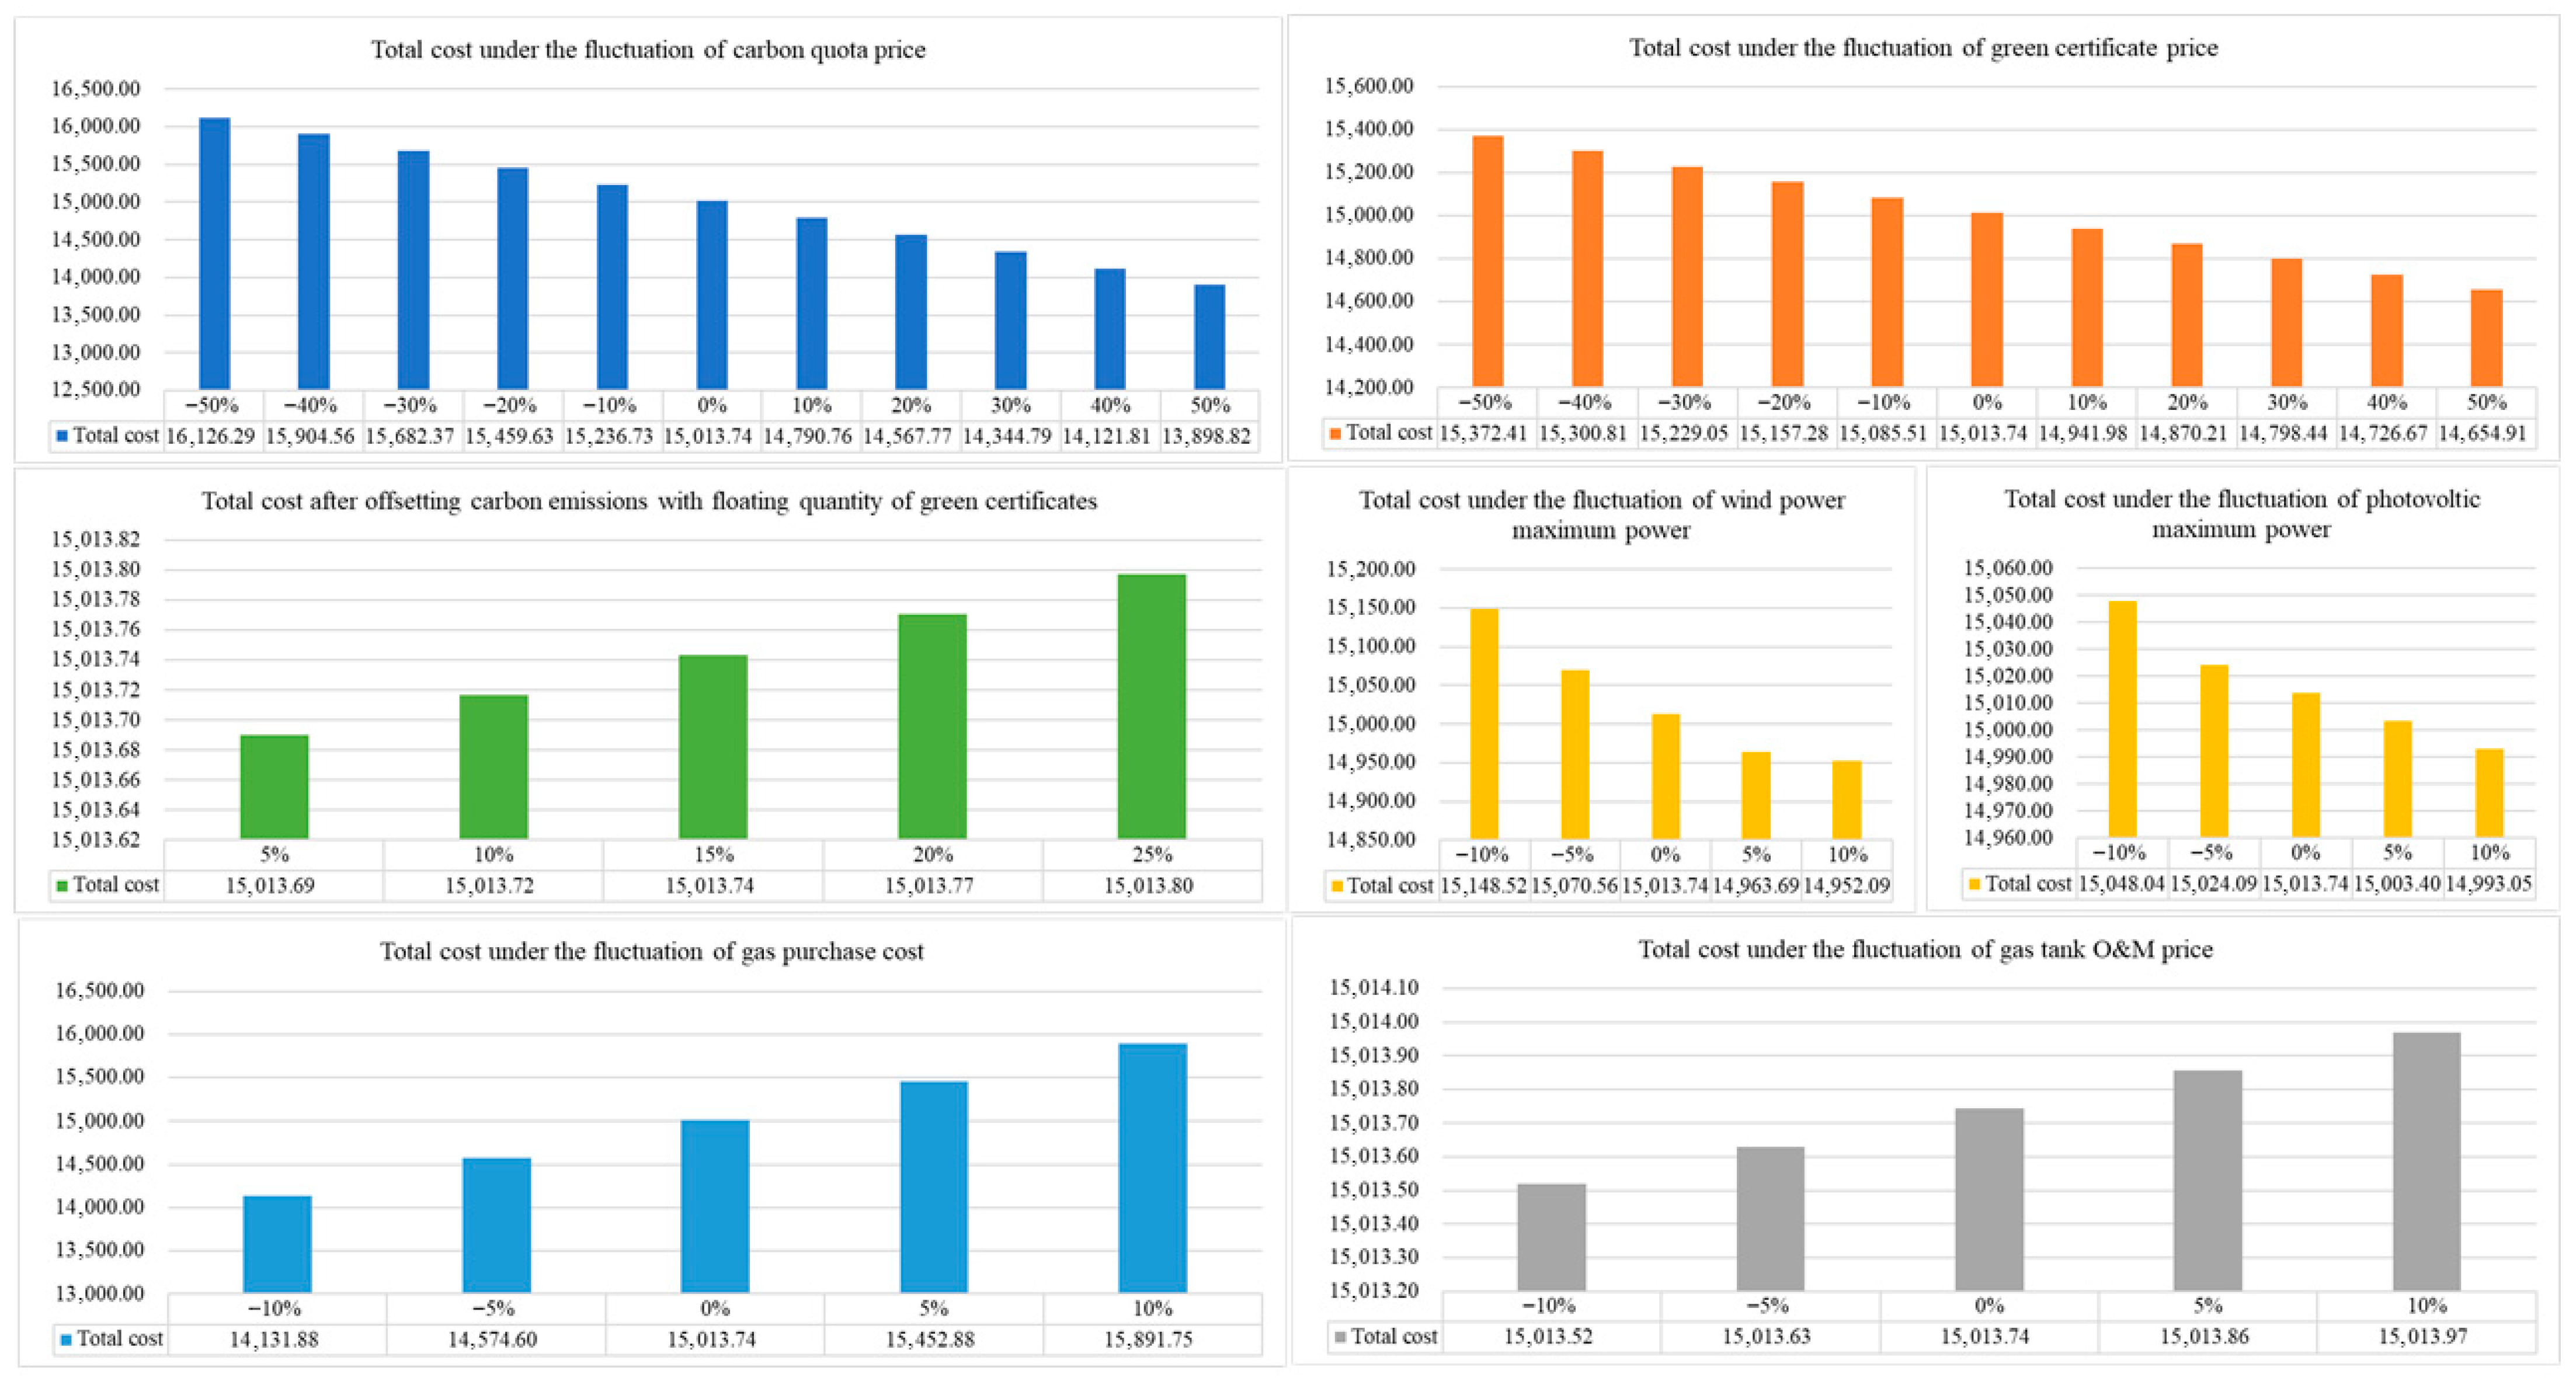

Disclaimer/Publisher’s Note: The statements, opinions and data contained in all publications are solely those of the individual author(s) and contributor(s) and not of MDPI and/or the editor(s). MDPI and/or the editor(s) disclaim responsibility for any injury to people or property resulting from any ideas, methods, instructions or products referred to in the content. |
© 2026 by the authors. Licensee MDPI, Basel, Switzerland. This article is an open access article distributed under the terms and conditions of the Creative Commons Attribution (CC BY) license.