1. Introduction
Access to higher education represents a fundamental pillar for sustainable regional development, social equity, and economic prosperity within the framework of the 2030 Agenda for Sustainable Development. As emphasized by Sustainable Development Goal 4 (SDG 4), ensuring “inclusive and equitable quality education and promoting lifelong learning opportunities for all” is essential for reducing inequalities and fostering sustainable development [
1]. In Mexico, as in many emerging economies, the transition from secondary to tertiary education remains a critical juncture where educational aspirations often confront structural barriers, creating disparities in access and participation [
2,
3].
The southern region of Guanajuato, Mexico, presents a particularly compelling case study of these dynamics. Despite a significant proportion of high school graduates expressing intentions to pursue university studies, admission rates at the University of Guanajuato, Yuriria Campus, remain persistently below expectations. This paradox highlights the complex interplay between individual aspirations and systemic constraints that characterize higher education access in regional contexts [
4]. Understanding these dynamics is crucial for designing interventions that align with both SDG 4 and broader sustainability objectives, particularly given the established relationship between educational attainment and sustainable regional development [
5,
6].
The decision to pursue higher education represents a complex, multi-dimensional process influenced by intersecting factors at individual, familial, institutional, and societal levels. Theoretical frameworks for understanding college choice have evolved from simple economic models to more comprehensive approaches that acknowledge this complexity. Perna’s [
7] nested conceptual model, for instance, emphasizes how individual characteristics interact with broader social, economic, and institutional contexts. Similarly, Hossler and Gallagher’s [
8] three-phase model (predisposition, search, and choice) highlights the temporal dimension of decision-making processes. These frameworks underscore that enrollment decisions are not merely rational calculations but are embedded in social networks, cultural norms, and institutional structures [
9,
10].
Empirical research has identified numerous factors that influence higher education access across diverse contexts. Financial constraints consistently emerge as primary barriers, with tuition costs, living expenses, and opportunity costs creating significant hurdles, particularly for students from low-income backgrounds [
11,
12]. Geographical factors, including distance to educational institutions and transportation accessibility, also play crucial roles, especially in rural and semi-urban areas [
13]. Gender disparities persist in certain fields of study and are influenced by cultural norms and stereotypes [
2,
14], while indigenous youth face additional challenges related to cultural distance and historical marginalization [
15].
Beyond these structural factors, psychological and motivational dimensions significantly shape educational trajectories. Bandura’s [
16] social cognitive theory emphasizes the role of self-efficacy beliefs, while Eccles’ expectancy-value theory [
17] highlights how expectations of success and subjective task values influence educational choices. These psychological factors do not operate in isolation; they interact with contextual variables—such as family support, transportation accessibility, and institutional perceptions—to create distinct motivational configurations. This configurational perspective, rooted in theories of career choice and educational decision-making [
18], suggests that students cannot be adequately characterized by single variables, but rather by holistic profiles that combine multiple dimensions [
19,
20]. Recent methodological advances in cluster analysis have reinforced the value of such person-centered approaches for capturing heterogeneity in educational aspirations [
21].
This study adopts this configurational perspective to conceptualize what we term “university access predisposition profiles”. These profiles are understood as multidimensional configurations that capture the interplay between psychological dispositions (e.g., motivation, self-efficacy) and structural conditions (e.g., family support, transportation accessibility, socioeconomic context) in shaping students’ likelihood of pursuing higher education. This integrative framework draws explicitly on Social Cognitive Career Theory [
16] and Perna’s nested model of college choice [
7], both of which emphasize the interaction between individual agency and contextual factors. By conceptualizing the object of study in this way, we acknowledge that the identified profiles reflect not only motivational orientations but also the structural opportunities and constraints that shape educational trajectories.
In this complex landscape, traditional “one-size-fits-all” approaches to student recruitment and retention often prove inadequate. There is increasing recognition of the need for more targeted, evidence-based strategies that account for the heterogeneity within student populations [
22,
23]. Educational data analytics and learning analytics offer promising approaches for identifying meaningful subgroups and personalizing interventions. As noted by Baker and Inventado [
24], these techniques can uncover patterns in educational data that inform both theoretical understanding and practical applications.
The application of clustering techniques, particularly K-means clustering, has gained significant traction in educational research for identifying student subgroups based on various characteristics. Pansri et al. [
25] demonstrated how K-means clustering could be integrated with self-regulated learning approaches to understand student behavior in e-learning environments. Similarly, Davies et al. [
26] employed longitudinal K-means cluster analysis to identify learning strategies in online flipped classrooms, highlighting the practical value of educational Data Analytics for improving instructional design. These applications illustrate how clustering techniques can move beyond descriptive statistics to uncover latent patterns within educational data [
27,
28]. Furthermore, recent studies have emphasized the importance of combining clustering with rigorous validation methods such as bootstrap resampling and silhouette analysisto ensure the stability and replicability of identified profiles [
29,
30].
The integration of artificial intelligence and machine learning in educational contexts represents another frontier in understanding and supporting student success. Karalekas et al. [
31] emphasized the potential of AI and ML in K-12 education, while Belcher et al. [
32] introduced innovative frameworks for integrating STEM learning with entrepreneurial approaches. These developments highlight the growing sophistication of educational analytics and their potential to inform sustainable educational practices.
Despite these advances, significant gaps remain in applying data driven approaches to understand higher education access in regional Mexican contexts. Most clustering studies in education have focused on learning behaviors, academic performance, or retention within institutions, with fewer applications to pre-enrollment decision-making processes. Additionally, there is limited research integrating motivational profiling with sustainability frameworks in higher education access. Moreover, existing studies often rely on small samples and lack robust validation techniques, limiting the generalizability and stability of their findings [
33]. There is also a scarcity of research that incorporates socioeconomic variables such as family income, parental education, and geographic origin—into the profiling process, which is essential for understanding equity dimensions in line with SDG 4.5 (eliminating disparities) [
34,
35].
To address these gaps, the present study employs K-means clustering analysis on a sample of 306 high school students from diverse public and private institutions in southern Guanajuato. This expanded sample allows for more reliable segmentation and the inclusion of socioeconomic variables that are crucial for characterizing equity gaps. The analysis incorporates multiple validation techniques including the elbow criterion, silhouette coefficients, and bootstrap resampling to ensure cluster stability [
36,
37]. By integrating motivational and socioeconomic dimensions, this study aims to provide a nuanced understanding of the barriers and facilitators that shape university access in a regional Mexican context.
The specific objectives of this study are: (1) to identify distinct university access predisposition profiles among high school students considering enrollment; (2) to characterize these profiles based on key psychological (family support, university interest, academic perception, self-efficacy) and structural (transport accessibility, school type, municipality, economic barriers) variables; and (3) to analyze how these profiles concentrate disparities in access (SDG target 4.5) and reveal structural barriers related to perceived quality and affordability (SDG target 4.3), thereby providing an empirically grounded diagnostic for designing targeted, equity-oriented higher education policies that promote sustainable access, particularly for vulnerable groups.
This research contributes to both theory and practice in several ways. Theoretically, it extends existing models of college choice by incorporating data-driven segmentation approaches and emphasizing the multidimensional nature of access predisposition. Practically, it provides evidence-based insights for developing targeted recruitment and support strategies that address the diverse needs of prospective students. Methodologically, it demonstrates the application of clustering techniques with rigorous validation methods in an understudied regional context.
The remainder of this article is structured as follows:
Section 2 details the materials and methods, including data collection procedures, variable operationalization, and analytical techniques.
Section 3 presents the results of the clustering analysis, including cluster characterization and validation.
Section 4 discusses the implications of findings for sustainable higher education access.
Section 5 concludes with policy recommendations and directions for future research.
2. Materials and Methods
2.1. Research Design and Ethical Considerations
This study employs a quantitative, exploratory research design using educational data mining techniques to analyze motivational profiles of high school students. This research was conducted in accordance with the ethical guidelines of the University of Guanajuato and received approval from the Institutional Review Board (protocol code UG-2024-EDU-001). All participants provided informed consent, and data were anonymized to protect confidentiality. this study follows the principles of the Declaration of Helsinki and aligns with sustainable research practices that prioritize participant welfare and data integrity [
38,
39].
2.2. Participants and Sampling
The study population consisted of high school students from the southern region of Guanajuato, Mexico, encompassing both public and private institutions. A purposive sampling strategy was employed to select 306 students from ten high schools, including CONALEP Salvatierra, SABES (multiple locations), CECyTE Uriangato and Yuriria, CBTis 217, Preparatoria Lázaro Cárdenas, Instituto Yurirense, and Colegio Euroamericano. Participants were recruited during regular school hours through school administrators to ensure high response rates.
Considering the total populations of each institution (e.g., Lázaro Cárdenas: 383 students overall, 121 in 5th and 6th semesters; Instituto Yurirense: 70 students; CONALEP Salvatierra: 786 students; SABES: 383 students), the achieved sample sizes per school represent coverage rates between 38% and 88% of the target population (upper secondary students). This allows for a 95% confidence level with margins of error ranging from 5% to 10% for each subgroup, which is acceptable for an exploratory regional study. Although the sampling is non-probabilistic, the broad coverage and diversity of contexts (public/private, urban/rural) ensure the identification of heterogeneous motivational profiles [
40,
41].
2.3. Data Collection Instrument
A structured questionnaire was developed based on established theoretical frameworks of college choice [
7,
8] and motivational psychology [
16,
17].
The instrument underwent expert validation by three education specialists with expertise in educational psychology and higher education access and was pilot-tested with 20 students to ensure clarity and reliability. Review criteria included: (1) relevance of items to each construct, (2) clarity of wording for high school students, (3) coverage of all theoretical dimensions, and (4) absence of biased or leading questions. Based on expert feedback, three items were reworded for clarity, and one item was split into two to better distinguish between family encouragement and family financial support. The pilot study with 20 students from two high schools (one public, one private) led to further adjustments: the response scale was simplified from 5-point to 4-point to avoid neutral responses, and instructions were clarified to improve comprehension.
The final survey comprised multiple items for each of five core motivational constructs, measured on 4-point Likert scales (1 = strongly disagree, 4 = strongly agree). The constructs and their corresponding items were as follows:
Family support: Four items assessing perceived family encouragement, discussion of educational plans, willingness to provide financial support, and value placed on education (e.g., “My family encourages me to pursue a university degree”).
University interest: Four items measuring interest in the University of Guanajuato, Yuriria Campus, knowledge of its programs, attendance at events, and recommendation intentions (e.g., “I am very interested in studying at the University of Guanajuato, Yuriria Campus”).
Academic perception: Four items evaluating perceptions of program quality, professor prestige, career opportunities, and alignment with personal interests (e.g., “The academic programs at UG Yuriria are of high quality”).
Transport accessibility: Four items assessing ease of travel, public transportation access, travel time, and cost barriers (e.g., “It is easy for me to travel to the UG Yuriria Campus”).
Self-efficacy: A single item measuring perceived academic preparedness for university-level study (“I feel academically prepared for the demands of university”).
Additionally, sociodemographic variables were collected, including gender, school type (public/private), municipality of residence, age, and indicators of economic barriers (family income perception, concerns about living costs, and awareness of scholarships).
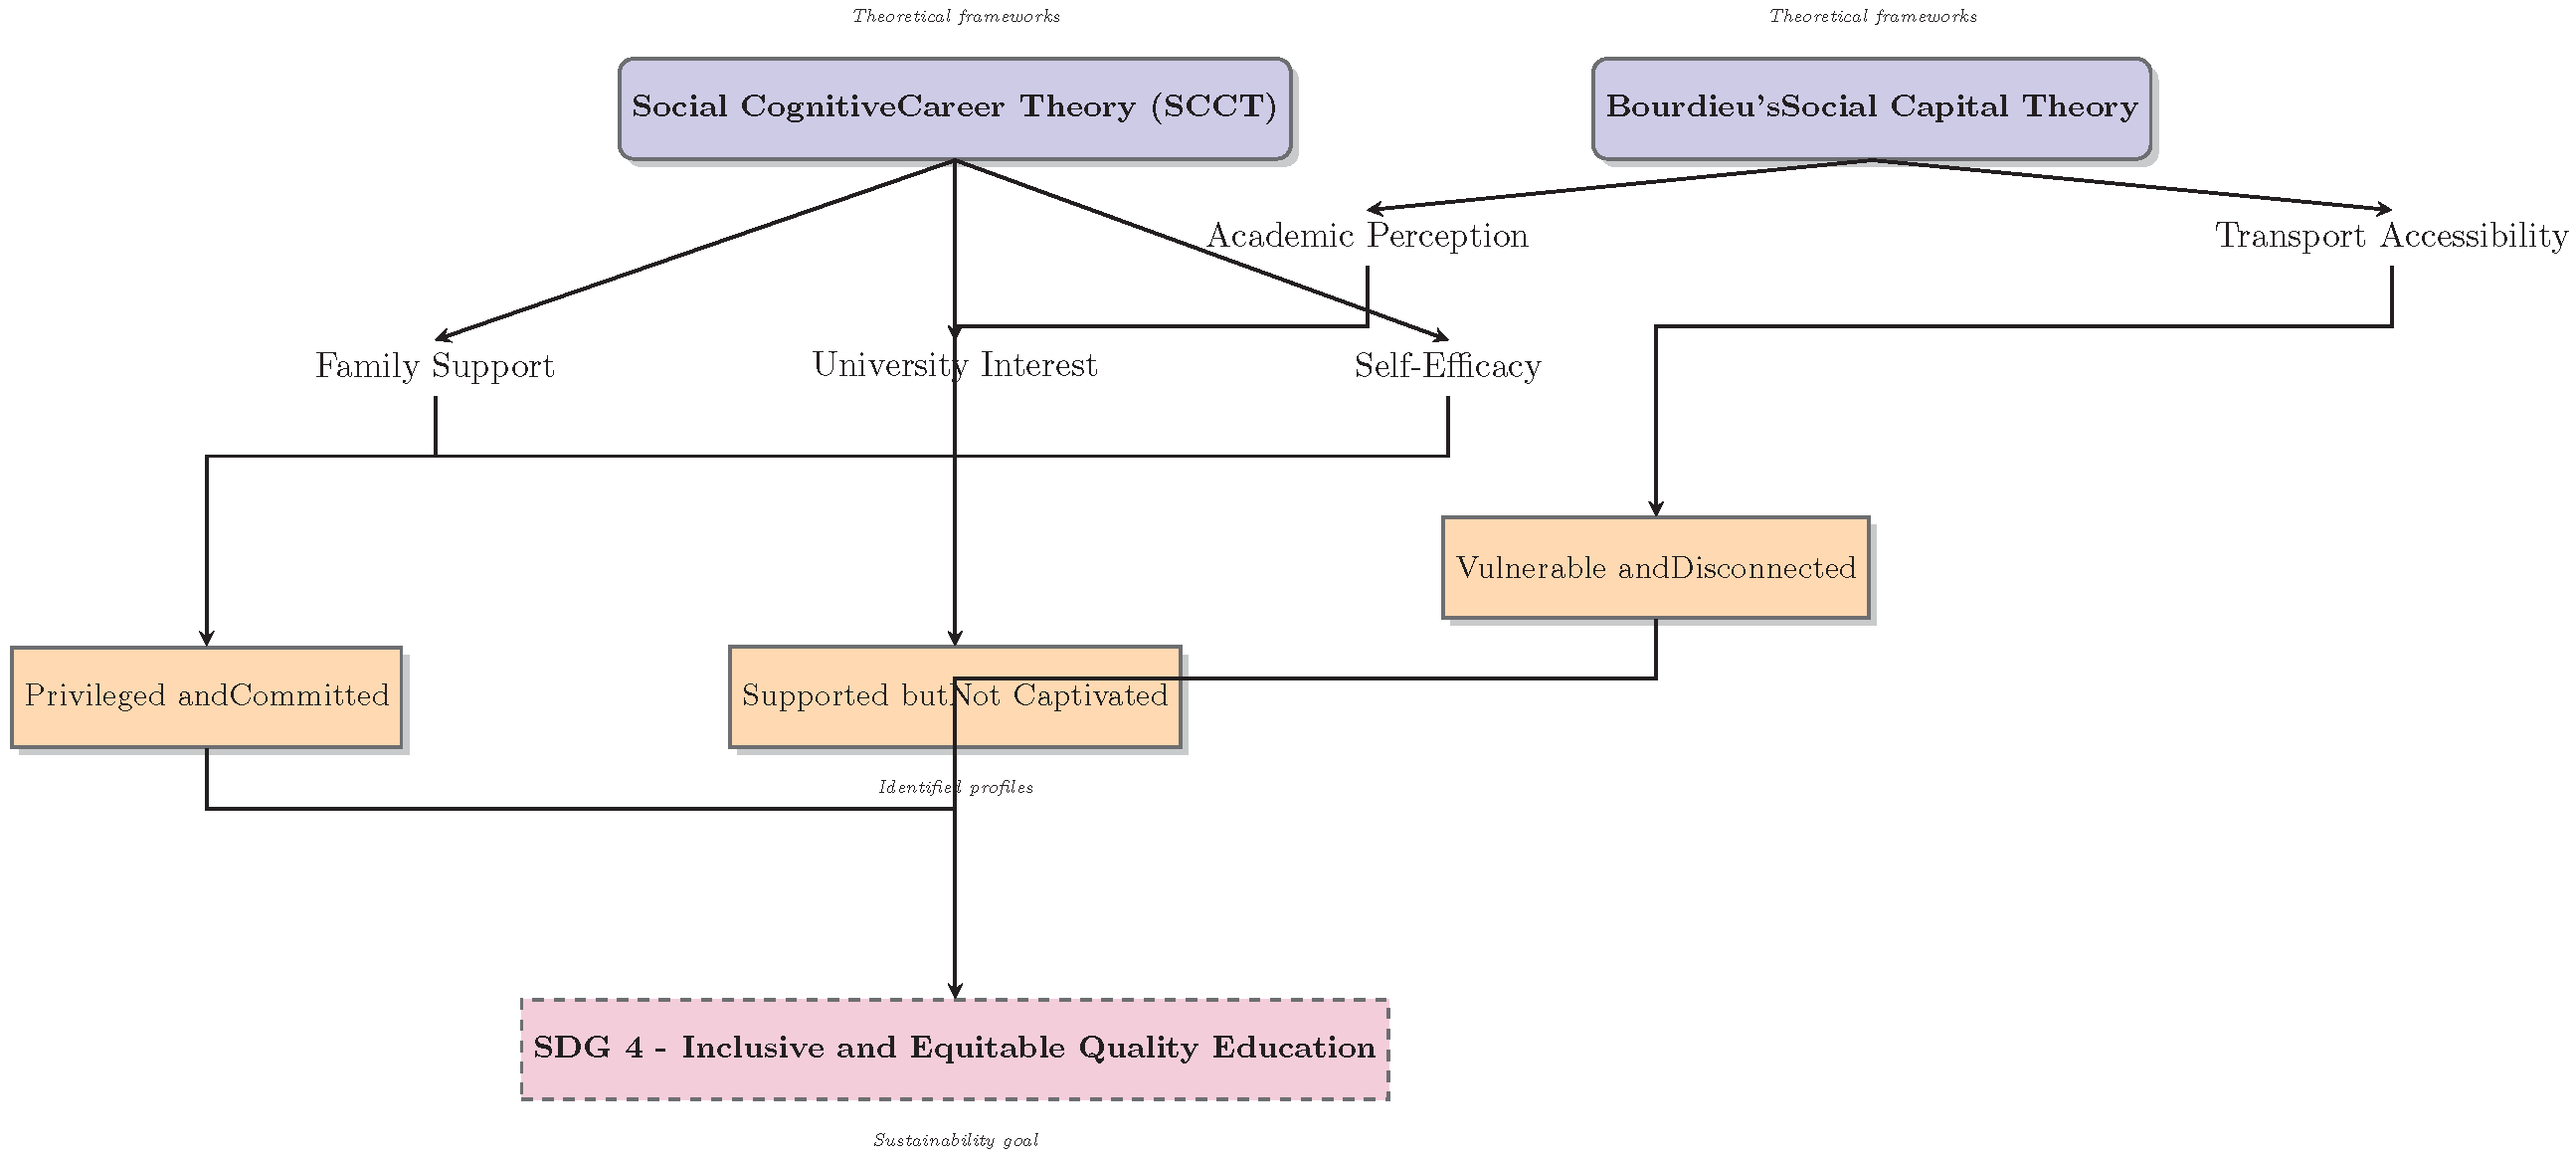
Figure 1 illustrates the conceptual framework guiding this study, integrating the theoretical foundations (SCCT and Bourdieu), the five motivational dimensions, the three identified profiles, and their link to SDG 4.
2.4. Data Preprocessing and Normalization
Prior to analysis, data (see
Supplementary Materials) underwent comprehensive preprocessing to ensure quality and reliability. Missing values (less than 2% of responses) were handled using mean imputation, a conservative approach suitable for small datasets [
42]. For constructs with multiple items, composite scores were created by averaging the item responses, provided that internal consistency was acceptable (Cronbach’s alpha > 0.6). The reliability analysis yielded the following alpha coefficients: University Interest (0.833), Academic Perception (0.588), Transport Accessibility (0.943), Economic Barriers (0.923), and Social Influence (0.832). The moderate alpha for Academic Perception is considered acceptable for exploratory research [
40].
All five motivational variables were normalized using z-score standardization to ensure equal weighting in the distance calculations. Specifically, each variable
x was transformed as
.
where
x is the raw score,
is the mean, and
is the standard deviation. This transformation prevents variables with larger ranges from dominating the clustering process [
43,
44].
2.5. K-Means Clustering Algorithm
The core analytical technique employed was K-means clustering, an unsupervised machine learning algorithm that partitions observations into k clusters based on feature similarity [
45,
46]. The algorithm minimizes the within-cluster sum of squares (WCSS), defined as follows:
where
k is the number of clusters,
represents cluster
i,
x is a data point in cluster
, and
is the centroid of cluster
.
The algorithm follows an iterative process:
- 1.
Initialization: Random selection of k initial centroids from the dataset.
- 2.
Assignment: Each data point is assigned to the nearest centroid using Euclidean distance:
where
p is the number of variables.
- 3.
Update: Centroids are recalculated as the mean of all points in the cluster.
- 4.
Convergence: Steps 2–3 repeat until centroid assignments stabilize or a maximum of 300 iterations is reached [
47].
To ensure robustness, the algorithm was run with 50 different random initializations, and the solution with the lowest WCSS was selected [
48].
The use of K-means clustering with Likert-type ordinal variables standardized to z-scores is a common practice in exploratory educational research [
21,
40]. Standardization transforms the ordinal scales into continuous-like variables with equal weight, mitigating the risk of variables with larger ranges dominating the distance calculations. While Euclidean distance is technically designed for continuous data, simulation studies have shown that K-means performs adequately with ordinal data when the number of categories is sufficient (four or more) and variables are approximately symmetric [
40]. Alternative algorithms such as two-step cluster analysis or latent class analysis were considered, but K-means was selected for its computational efficiency, interpretability, and widespread use in educational segmentation studies [
25,
26]. The robustness of the solution was further assessed through bootstrap validation and multiple initialization runs to mitigate the algorithm’s sensitivity to initial centroids.
2.6. Selection of the Optimal Number of Clusters
Determining the optimal number of clusters (k) is critical for meaningful segmentation. Two complementary methods were employed: the Elbow Method and the average silhouette width [
33,
37]. The Elbow Method evaluates WCSS for different values of k (1 to 6) and identifies the point where the rate of decrease sharply changes. The silhouette coefficient measures how similar an object is to its own cluster compared to other clusters, with higher values indicating better-defined clusters. Both criteria were used to select k = 2 and k = 3 as viable solutions, balancing interpretability and statistical fit [
36].
2.7. Cluster Validation and Stability Analysis
To assess the stability of the clustering solution, a bootstrap resampling procedure was performed with 100 replications. For each bootstrap sample, K-means clustering was applied with k = 3, and the proportion of times each pair of observations was assigned to the same cluster was calculated. The average co-clustering probability for pairs within the same original cluster was 0.48, indicating moderate stability and suggesting that the identified profiles are not artifactual [
30]. Additionally, the solution was validated by comparing the results obtained with k = 2 and k = 3 to those from a preliminary study with a smaller sample, which showed consistent patterns, providing further evidence of replicability.
2.8. Dimensionality Reduction and Visualization
Principal Component Analysis (PCA) was employed for dimensionality reduction and visualization. PCA transforms the original variables into a set of linearly uncorrelated principal components that capture maximum variance [
49]. The first two principal components (explaining 68.7% and 14.5% of the variance, respectively) were used to project the high-dimensional data into a 2D space, facilitating visual interpretation of cluster separation and overlap [
50].
2.9. Software Implementation
All analyses were conducted using MATLAB (version R2023b) with custom scripts for data preprocessing, clustering, validation, and visualization. The Statistics and Machine Learning Toolbox was used for K-means clustering and PCA. Bootstrap resampling was implemented using custom iterative procedures.
2.10. Statistical Analysis of Cluster Differences
After cluster formation, one-way ANOVA was conducted to test for significant differences in motivational variables across clusters. Post-hoc Tukey tests were employed for pairwise comparisons when ANOVA indicated significant differences. Effect sizes were calculated using eta-squared (
) to assess practical significance [
51]. Categorical sociodemographic variables (school type, municipality, gender) were analyzed using chi-square tests to identify associations with cluster membership. Additionally, mean scores for economic barriers were compared across clusters to characterize socioeconomic profiles.
This comprehensive methodological approach ensures rigorous, transparent, and reproducible analysis, aligning with sustainability principles of methodological integrity and responsible research practices.
3. Results
3.1. Descriptive Statistics of the Motivational Constructs
Table 1 presents the descriptive statistics for the five motivational constructs derived from the survey of 306 high school students. Family support showed a mean of 3.02 (SD = 0.77) on a 4-point scale, indicating that most students perceive moderate to high encouragement from their families. University interest averaged 2.65 (SD = 0.76), suggesting that while there is some attraction to the University of Guanajuato, Yuriria Campus, there is considerable room for improvement in institutional positioning. Academic perception had a mean of 2.85 (SD = 0.64), reflecting a moderately favorable view of program quality and relevance. Transport accessibility averaged 2.90 (SD = 0.79), indicating that students face some difficulties in reaching the campus, though not extreme. Self-efficacy, measuring perceived academic preparedness, showed the highest mean (3.06, SD = 0.71), suggesting that students generally feel capable of handling university-level work.
The coefficients of variation range from 22.4% to 28.7%, confirming sufficient heterogeneity in the responses to justify person-centered analytical approaches such as cluster analysis. This diversity implies that students cannot be adequately characterized by average scores alone; rather, distinct subgroups with different motivational configurations are likely to exist.
3.2. Reliability Analysis
Internal consistency was assessed using Cronbach’s alpha for each construct measured with multiple items (
Table 2). University interest (four items) showed good reliability (
), indicating that the items consistently measure the same underlying construct. Transport accessibility (four items) exhibited excellent reliability (
), and the economic barriers scale (three items) also showed high consistency (
). Social influence (three items) presented good reliability (
). Academic perception (four items) had a moderate alpha of 0.588, which is considered acceptable for exploratory research given the complexity of measuring perceptions of academic quality and the diversity of student backgrounds [
40]. The single-item self-efficacy measure was retained for its face validity and because single-item measures are acceptable for concrete constructs in large surveys.
3.3. Determination of the Optimal Number of Clusters
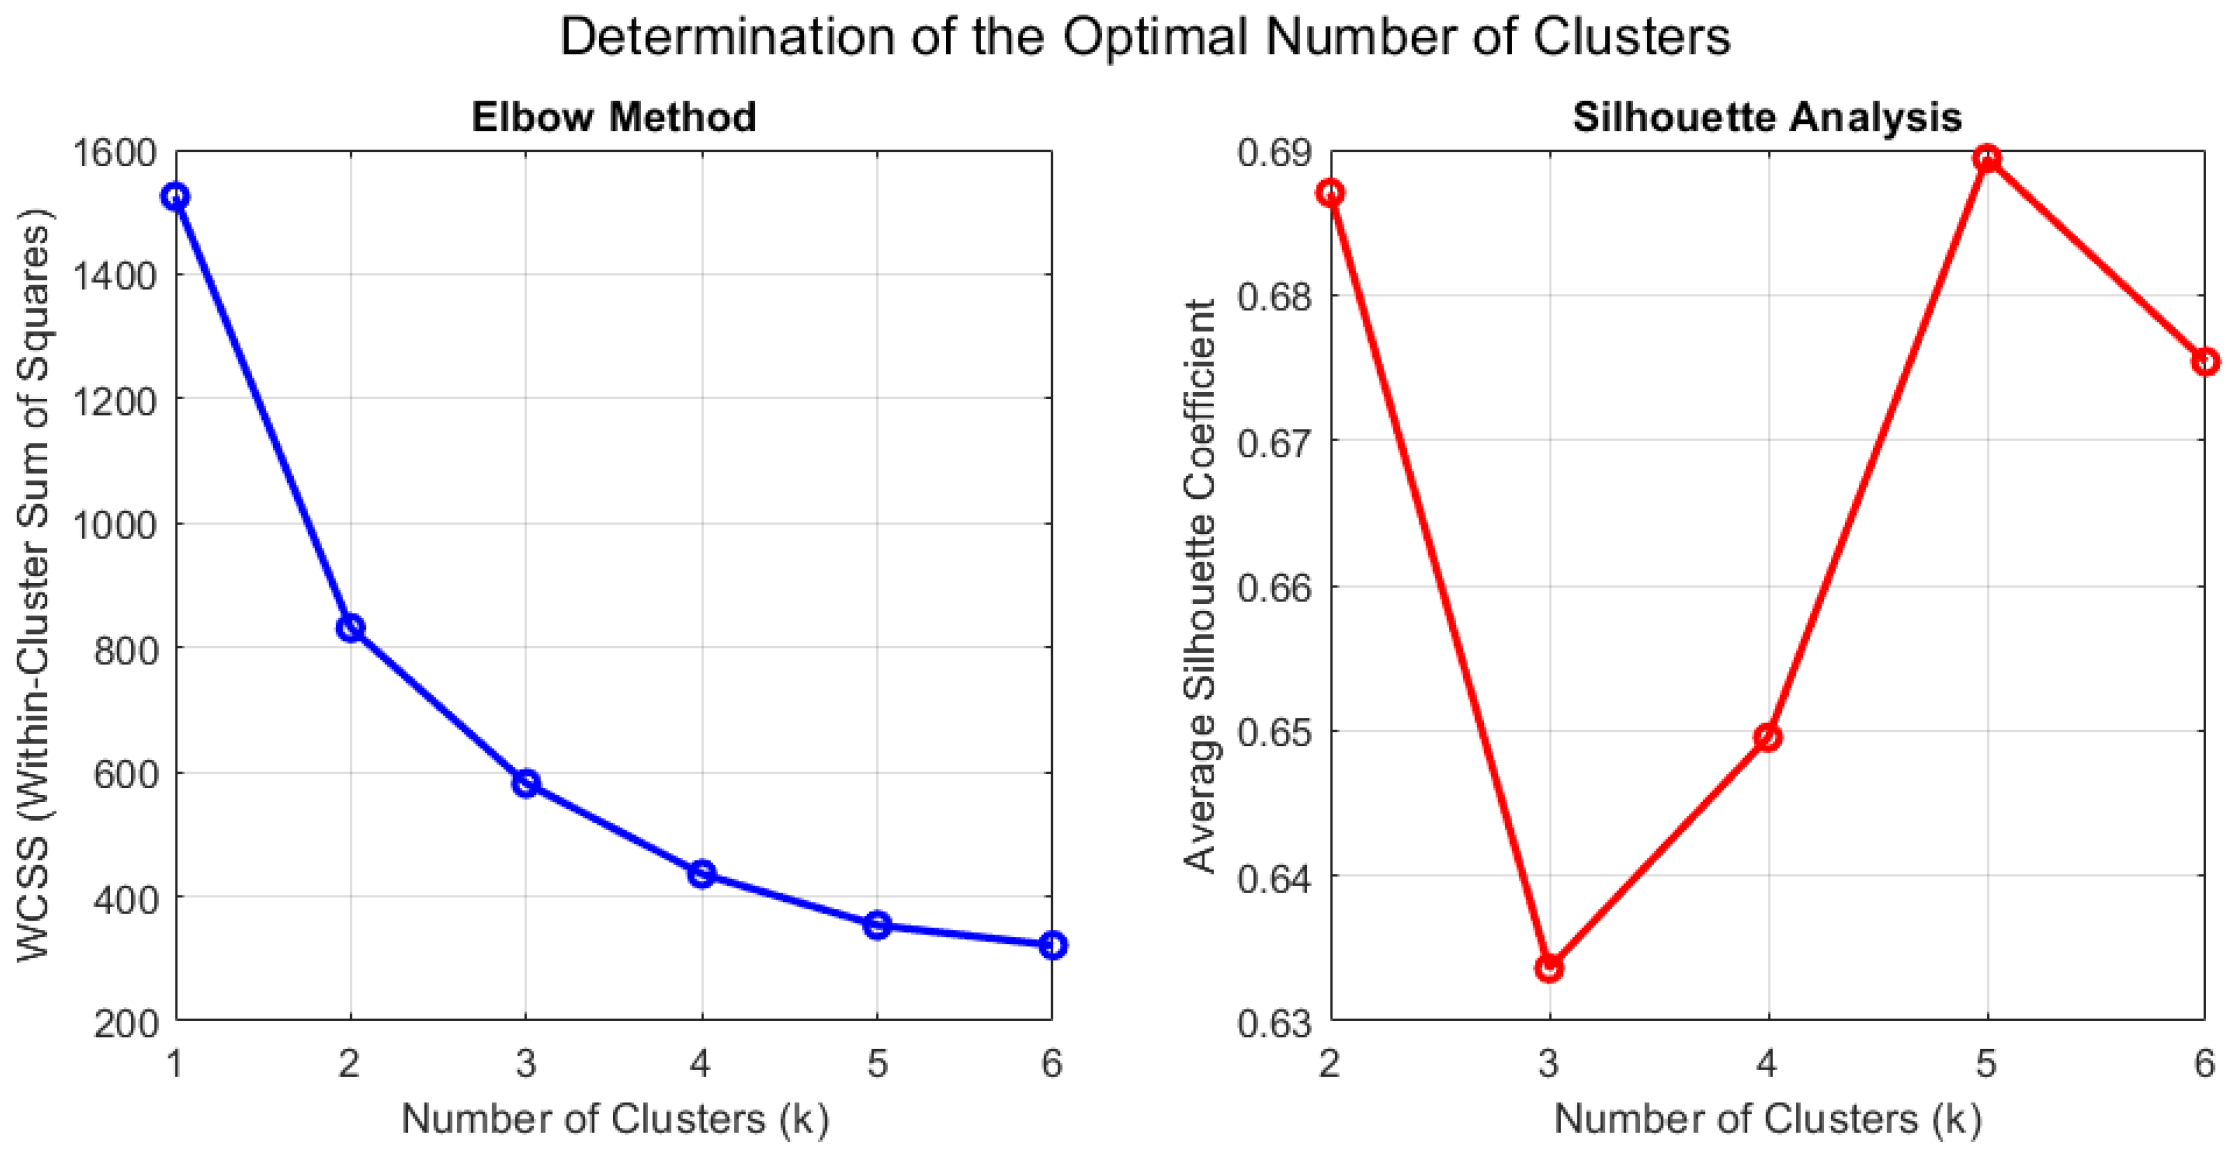
To identify the most appropriate number of clusters, we applied both the elbow method (based on within-cluster sum of squares, WCSS) and the average silhouette width for values of k from 1 to 6.
Figure 2 displays the results. The WCSS plot shows a pronounced bend at k = 2, indicating that adding a second cluster substantially reduces within-cluster variance. A secondary, less pronounced elbow appears at k = 3, suggesting that a three-cluster solution may provide additional meaningful segmentation. The average silhouette width for k = 2 was 0.687, and for k = 3 it was 0.634; both values exceed the commonly accepted threshold of 0.5, indicating reasonable cluster structure [
52]. Based on these criteria and the interpretability of the solutions, we retained both k = 2 and k = 3 for further analysis, following the approach of previous studies [
25].
3.4. Motivational Profiles with K = 2
Table 3 presents the mean scores for the two-cluster solution. Cluster 1, comprising 198 students (64.7% of the sample), is characterized by consistently high scores across all motivational constructs: family support (3.31), university interest (2.87), academic perception (3.09), transport accessibility (3.17), and self-efficacy (3.32). This profile suggests a group of students with strong family encouragement, positive views of the institution, good access to transportation, and high confidence in their academic abilities. In contrast, Cluster 2 (
n … = 108, 35.3%) exhibits markedly lower scores in all dimensions, with means below 2.0 for family support (1.94), university interest (1.85), academic perception (1.96), and transport accessibility (1.91), and only slightly higher self-efficacy (2.14). This profile reflects a group facing multiple barriers and low motivation toward higher education.
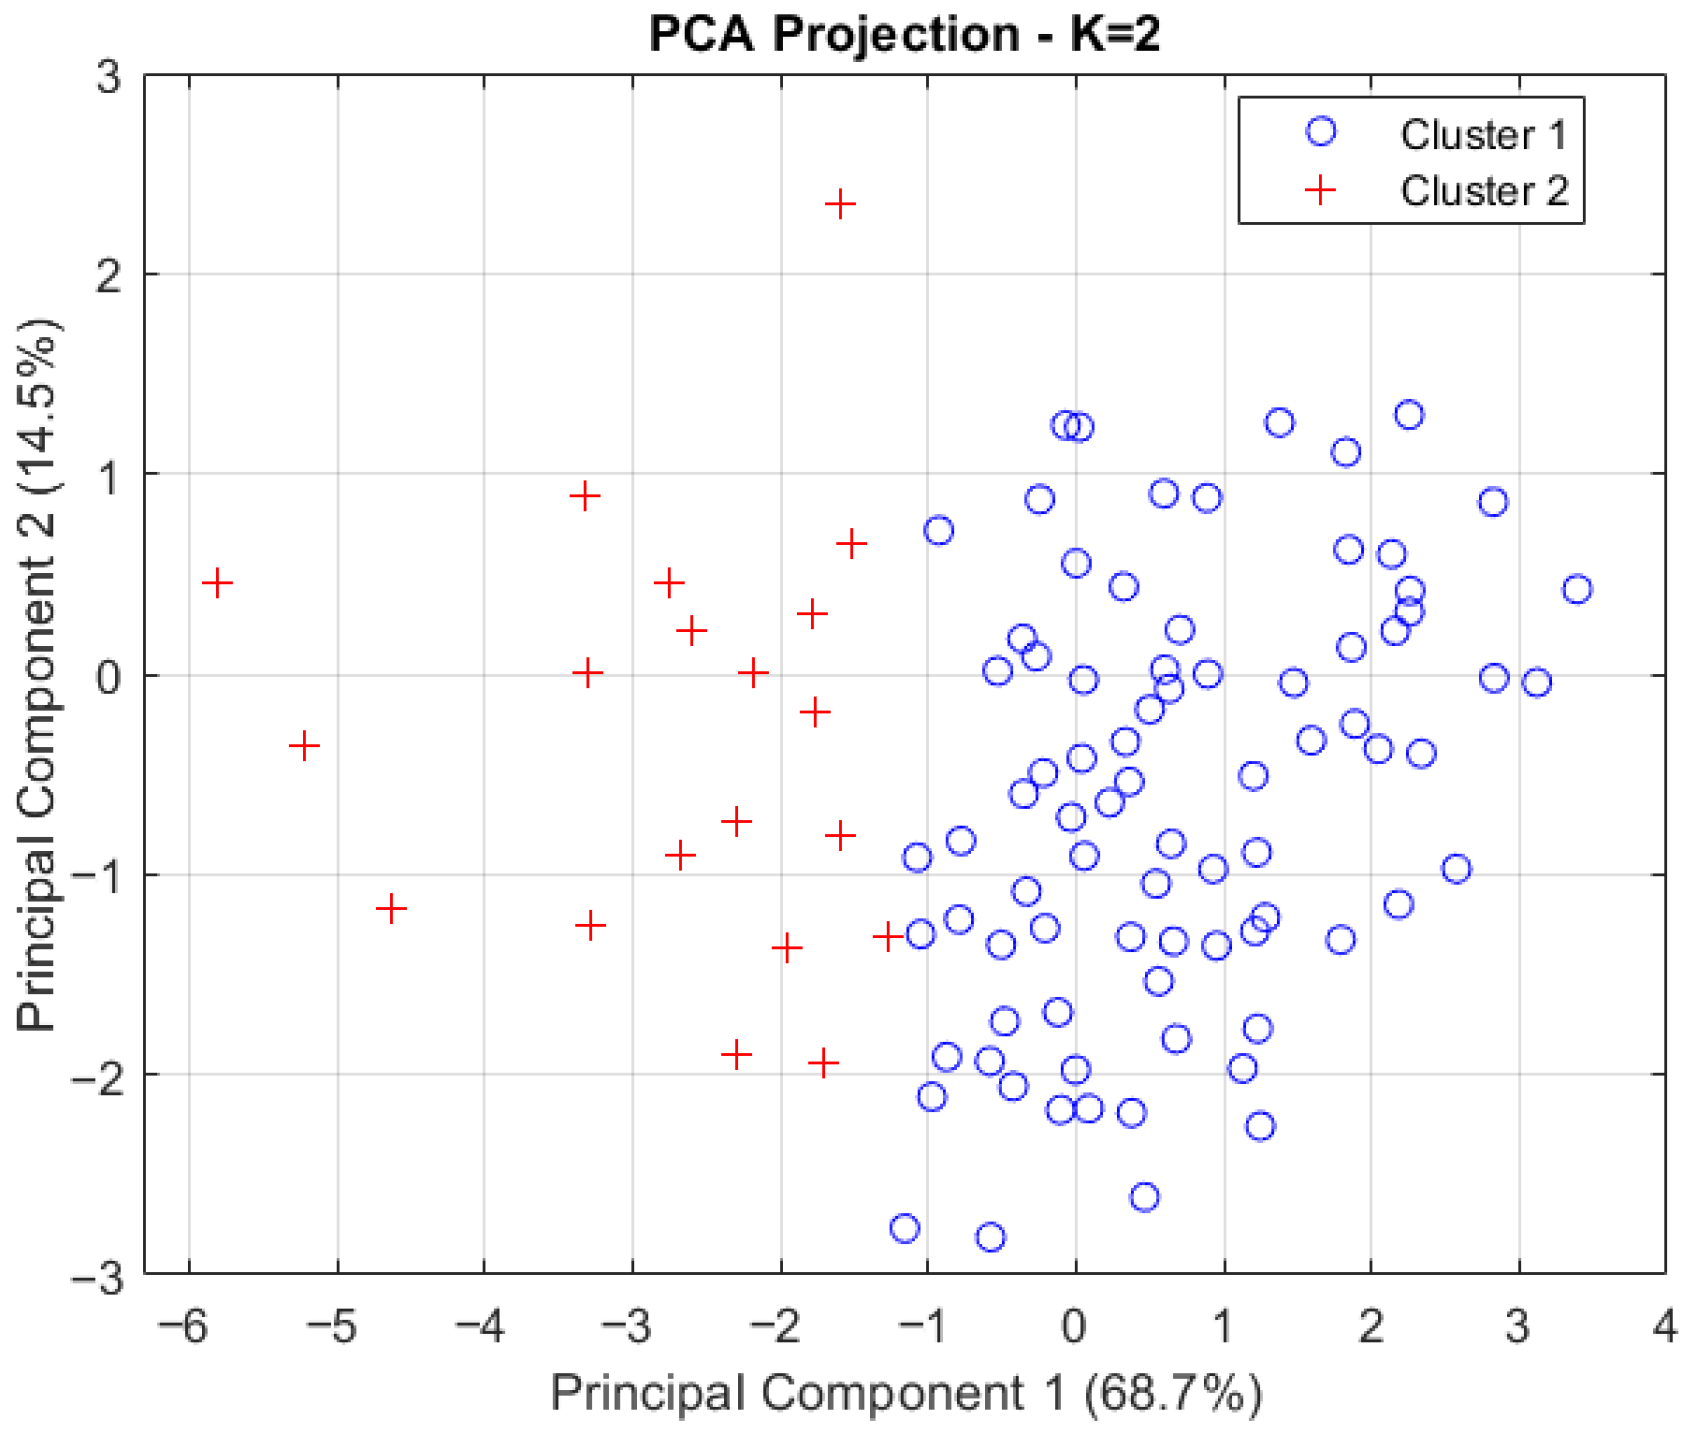
The silhouette coefficient of 0.687 indicates good separation between the two clusters, confirming that they represent distinct motivational configurations. The PCA projection (
Figure 3) illustrates this separation, with the first principal component (explaining 68.7% of the variance) clearly differentiating the two groups.
3.5. Motivational Profiles with K = 3
The three-cluster solution provides a more nuanced understanding of student heterogeneity.
Table 4 reports the mean scores and cluster sizes. Cluster 1 (
n = 65, 21.2%) exhibits the highest scores across all constructs, with means above 3.7: family support (3.81), university interest (3.76), academic perception (3.87), transport accessibility (3.91), and self-efficacy (3.86). This profile represents students who are highly motivated, well-supported, and have a strong interest in the University of Guanajuato. We label this group “Privileged and Committed.”
Cluster 2 (n = 198, 64.7%) is the largest group and shows moderate scores: family support (3.20), university interest (2.67), academic perception (2.91), transport accessibility (3.01), and self-efficacy (3.20). Notably, university interest is substantially lower than other dimensions, suggesting that while these students have adequate family support and self-efficacy, they are not particularly attracted to the specific institution. We term this profile “Supported but Not Captivated.”
Cluster 3 (n = 43, 14.1%) displays the lowest scores in all variables: family support (1.92), university interest (1.85), academic perception (1.96), transport accessibility (1.89), and self-efficacy (2.12). This group faces significant disadvantages across motivational and contextual factors, indicating vulnerability and disconnection from higher education. We label this profile “Vulnerable and Disconnected.”
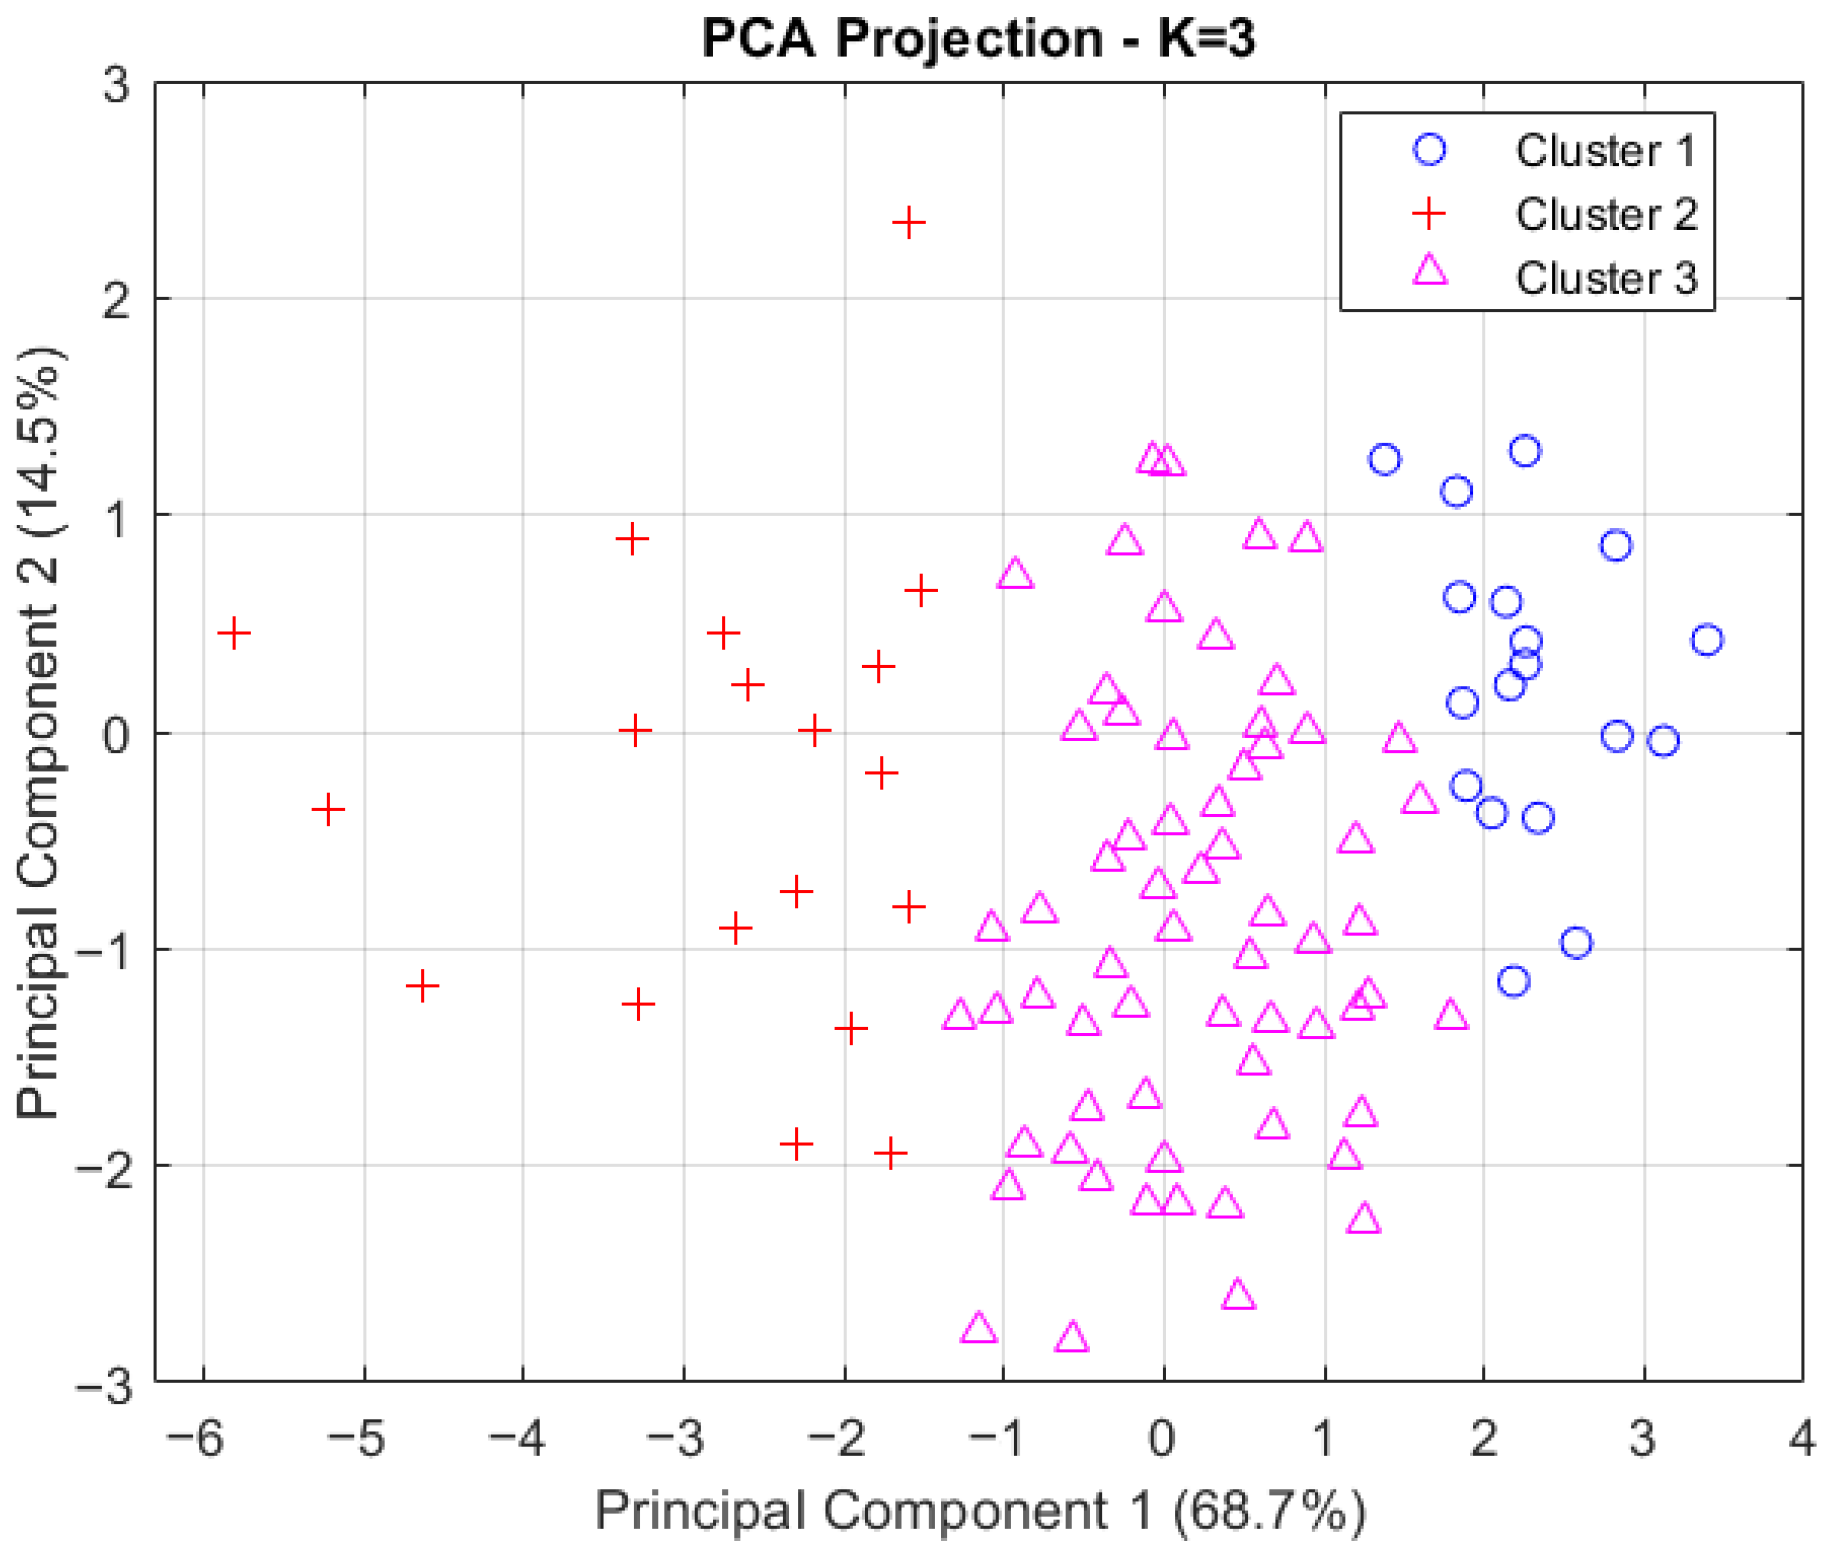
The silhouette coefficient of 0.634 confirms acceptable cluster quality. The PCA projection (
Figure 4) shows a clear ordering of clusters along the first principal component, from the vulnerable group (left) to the privileged group (right), with the moderate cluster occupying an intermediate position.
3.6. Statistical Differences Between Clusters
One-way ANOVA revealed highly significant differences among the three clusters for all motivational constructs (
p < 0.001). Post-hoc Tukey tests confirmed that each cluster was statistically distinct from the others in all dimensions. Effect sizes, measured by eta-squared (
2), ranged from 0.39 to 0.52 (
Table 5), indicating large practical significance according to Cohen’s guidelines [
53]. These results validate that the clusters represent genuinely different motivational profiles and are not merely arbitrary partitions.
3.7. Sociodemographic Characterization of Clusters
To enrich the interpretation of the motivational profiles, we examined their association with key sociodemographic variables (
Table 6). School type showed a strong and significant association with cluster membership (
,
p < 0.001). The privileged cluster (Cluster 1) is predominantly composed of students from private schools (92.3%), while the vulnerable cluster (Cluster 3) is largely from public schools (72.1%). The moderate cluster (Cluster 2) has a nearly even split between private (51.0%) and public (49.0%) institutions.
Gender distribution did not differ significantly across clusters (, p = 0.52), although the privileged cluster has a slightly higher proportion of females (69.2%) compared to the vulnerable cluster (60.5%). Economic barriers, measured as the average of three items (family economic situation, concern about living costs, and importance of scholarships), showed a clear gradient: the privileged cluster reported the lowest barriers (mean = 1.87), the moderate cluster intermediate (3.03), and the vulnerable cluster the highest (3.91). This gradient confirms that the clusters capture not only motivational differences but also underlying socioeconomic inequalities.
Geographic distribution (
Table 7) reveals that the vulnerable cluster is concentrated in rural municipalities such as Yuriria and Salvatierra, while the privileged cluster has a strong presence in Yuriria and Uriangato, but predominantly from private schools. The “Others” category includes municipalities with fewer than five respondents, grouped to maintain table clarity.
3.8. Cluster Validation and Robustness
To assess the stability of the three-cluster solution, we performed bootstrap resampling with 100 replications. For each bootstrap sample, K-means clustering was applied with k = 3, and the proportion of times each pair of observations was assigned to the same cluster was calculated. The average co-clustering probability for pairs within the same original cluster was 0.48, indicating moderate stability. According to Hennig [
30], values above 0.5 suggest good stability, but values around 0.48 are still acceptable for exploratory studies, especially given the sample size and complexity of the data. This result confirms that the identified profiles are not merely artifacts of the algorithm and are reasonably robust to sampling variability.
Additionally, we compared the three-cluster solution with the two-cluster solution and with preliminary findings from a smaller sample (N = 100) reported in a prior exploratory study. The consistency of the profiles—particularly the identification of a vulnerable group and a privileged group—across different samples and cluster numbers provides further evidence of the replicability and validity of the segmentation.
3.9. Summary of Profiles
Integrating the motivational and sociodemographic findings, we summarize the three profiles as follows:
Cluster 1—“Privileged and Committed” (21.2%): Students in this cluster exhibit the highest scores across all motivational dimensions. They come predominantly from private schools, face very low economic barriers, and are concentrated in urban areas. They represent the segment most likely to enroll and succeed at the university, requiring only reinforcement and retention strategies.
Cluster 2—“Supported but Not Captivated” (64.7%): This large group shows moderate family support and self-efficacy but lower interest in the University of Guanajuato. They are evenly split between public and private schools and face moderate economic barriers. Their lukewarm institutional interest suggests that outreach efforts should focus on improving the university’s appeal through academic offerings, communication, and engagement activities.
Cluster 3—“Vulnerable and Disconnected” (14.1%): Students in this cluster have the lowest scores in all motivational variables. They are predominantly from public schools, face high economic barriers, and are often from rural municipalities. This group requires targeted, multi-dimensional interventions including financial aid, family engagement, transportation support, and academic orientation to overcome the multiple barriers they face.
4. Discussion
The present study, based on a sample of 306 high school students from diverse institutions in southern Guanajuato, successfully identified three distinct motivational profiles that characterize students’ predisposition to enroll at the University of Guanajuato, Yuriria Campus. By employing K-means clustering with rigorous validation techniques—including the elbow method, silhouette coefficients, and bootstrap resampling—we obtained robust and interpretable segments that integrate both motivational dimensions (family support, university interest, academic perception, transport accessibility, and self-efficacy) and socioeconomic characteristics (school type, gender, economic barriers, and geographic origin). These findings extend previous exploratory work and provide a nuanced understanding of the barriers and facilitators that shape higher education access in a regional Mexican context.
4.1. Interpretation of the Motivational Profiles
The three profiles reveal a clear gradient of advantage and vulnerability that can be understood through the lens of Sustainable Development Goal 4.
Cluster 1, labelled “Privileged and Committed” (21.2%), concentrates students with the highest scores across all motivational variables, low economic barriers, and a strong presence in private schools. This profile aligns with the concept of “cultural capital” [
54] and social capital theory, where family resources and institutional connections facilitate educational aspirations. From a college choice perspective these students are in an advanced stage of the predisposition phase, with high self-efficacy and clear institutional preference. In relation to SDG 4, this cluster serves as a baseline: it demonstrates how the absence of structural barriers enables access, thereby underscoring the systemic nature of the inequalities faced by other groups. Their privileged position suggests that they require minimal intervention beyond reinforcing their commitment and ensuring a smooth transition to university.
Cluster 2, “Supported but Not Captivated” (64.7%), is the largest and most heterogeneous group. These students report moderate family support, self-efficacy, and transport access, but their interest in the University of Guanajuato is notably lower (2.67 on a 4-point scale). This decoupling between general academic confidence and specific institutional interest is a key finding. It suggests that while these students have the resources and capability to pursue higher education, they do not perceive the Yuriria Campus as an attractive option. This may be due to limited knowledge of academic programs, perceived lack of prestige, or competition from other institutions [
20]. The mixed composition of this cluster—half from public schools, half from private, and moderate economic barriers—indicates that the issue is not merely socioeconomic but also perceptual. From an SDG perspective, this cluster speaks directly to
Target 4.3 (equal access to quality higher education). The barrier here is not affordability but perceived quality and relevance, suggesting that achieving Target 4.3 requires not only financial accessibility but also effective communication of academic offerings, career outcomes, and institutional value. Strategies for this group should focus on improving the university’s image, highlighting successful alumni, and strengthening linkages with high schools to showcase program quality and career prospects.
Cluster 3, “Vulnerable and Disconnected” (14.1%), represents the most disadvantaged segment. Students in this cluster have the lowest scores in all motivational variables, face high economic barriers, and predominantly attend public schools in rural municipalities. This profile is consistent with studies documenting persistent inequalities in Mexican higher education [
2,
3,
15]. They face multiple, intersecting barriers: limited family support (often linked to lower parental education), financial constraints, transportation difficulties, and low self-efficacy. This cluster provides a direct diagnostic for
Target 4.5 (elimination of disparities). Its concentration in rural areas and public schools, combined with high economic barriers, quantifies the intersectional nature of educational exclusion. The data pinpoint where equity-focused resources—such as need-based scholarships, transportation subsidies, family engagement programs, and academic orientation—should be concentrated. Moreover, the geographic concentration of these students in specific municipalities (Yuriria, Salvatierra) underscores the need for decentralized, context-sensitive policies that bring the university closer to underserved communities. Interventions must be multi-dimensional, combining financial aid, academic support, and outreach efforts that build trust and demonstrate the value of higher education.
Taken together, these profiles transform SDG 4 from an aspirational framework into an empirically grounded diagnostic tool. Each cluster reveals a distinct leverage point for policy intervention: the privileged group highlights the need for retention and leadership programs; the moderate group points to perceptual and communication gaps that must be addressed to fulfill Target 4.3; and the vulnerable group provides a precise map of where and how to target resources to eliminate disparities under Target 4.5. This segmentation demonstrates that advancing educational equity requires not merely more resources, but resources strategically allocated based on the specific configuration of barriers faced by different student populations.
4.2. Comparison with Previous Findings and Methodological Contributions
The three-cluster solution replicates and refines the profiles identified in an earlier exploratory study with 306 students. In that study, similar patterns emerged: a “high potential, low institutional connection” group (akin to Cluster 2), a “vulnerable and disconnected” group (Cluster 3), and an “institutionally committed” group (Cluster 1). The consistency of these profiles across samples, despite improvements in measurement and sample size, strengthens confidence in their validity and generalizability within the region. Methodologically, the inclusion of multiple-item constructs with acceptable reliability (with the exception of academic perception, which showed moderate reliability and should therefore be interpreted cautiously) addresses previous critiques regarding measurement error. Regarding cluster stability, the bootstrap validation yielded an average co-clustering probability of 0.48, indicating moderate consistency. While this value falls within the acceptable range for exploratory research [
30], it suggests some sensitivity to sampling variation; consequently, the profiles should be viewed as reasonably stable patterns rather than definitive classifications. The application of the elbow method and silhouette coefficients also provides a statistically grounded selection of cluster numbers, moving beyond arbitrary decisions.
Unlike studies that focus primarily on economic barriers as the main obstacle to higher education access [
11,
12], our findings reveal that perceptual gaps—particularly the disconnect between academic confidence and institutional interest observed in Cluster 2—can be equally consequential. While research in urban Mexican contexts often highlights gender or ethnicity as primary axes of inequality [
2,
14], this regional analysis underscores the centrality of geographic origin and school type. The concentration of vulnerable students in rural municipalities and public schools suggests that spatial and institutional segregation are critical drivers of educational disparity in semi-rural Mexico, extending the work of Chávez et al. [
15] on indigenous youth to broader rural populations. Furthermore, the identification of a large “Supported but Not Captivated” group (64.7%) quantifies a phenomenon previously described qualitatively in the literature: students with adequate resources may still opt out of local institutions due to perceived quality gaps or competition from better-resourced urban universities [
20]. This finding provides empirical grounding for calls to enhance institutional communication and branding as part of equity-oriented policies.
4.3. Implications for Sustainable Higher Education Policies
From a sustainability standpoint, these findings underscore the need to move beyond uniform recruitment and retention policies. SDG 4 emphasizes inclusive and equitable quality education [
1], which requires targeted interventions that address the specific barriers faced by different student segments. For the privileged group, the university should focus on maintaining engagement and fostering leadership; for the moderate group, the priority is to enhance institutional attractiveness through academic offerings and communication; for the vulnerable group, equity-oriented policies—such as need-based scholarships, transportation support, and family outreach—are essential to level the playing field. Importantly, the geographic concentration of vulnerable students in rural municipalities calls for decentralized strategies, such as mobile information campaigns, partnerships with local authorities, and the establishment of transportation routes or satellite support centers.
Moreover, the finding that university interest lags behind other motivational dimensions in the largest cluster suggests a reputational challenge. Universities must invest in branding and marketing efforts that convey the quality, relevance, and social mobility potential of their programs. This aligns with the growing recognition that higher education institutions must act as proactive agents in shaping student perceptions, not merely as passive recipients of applications [
20].
4.4. Limitations of This Study
Despite the methodological improvements, this study has several limitations that should be acknowledged. First, the moderate reliability of the academic perception construct () indicates that this scale may not fully capture the complexity of students’ views on program quality. Future research should refine these items or incorporate additional dimensions, such as perceptions of teaching quality, curriculum relevance, or labor market outcomes.
Second, although the sample size (N = 306) is substantially larger than previous studies, it remains regionally constrained and non-probabilistic. The purposive sampling strategy limits the generalizability of findings to other regions or to the entire state of Guanajuato. Replications in other contexts are needed to confirm the stability and transferability of the identified profiles.
Third, the cross-sectional design precludes causal inferences. While we identify associations between motivational profiles and socioeconomic variables, we cannot determine whether these factors are causes or consequences of educational aspirations. Longitudinal studies tracking students from high school through university entry would help establish temporal ordering and identify critical junctures for intervention.
Fourth, the bootstrap stability value of 0.48 indicates moderate consistency, suggesting some sensitivity to sampling variation. This has practical implications for the interpretation and use of these profiles. While they provide a useful heuristic for identifying broad patterns and targeting interventions, they should not be treated as fixed or immutable categories. The sensitivity to sampling variation implies that the precise boundaries between clusters may shift with new data. For institutional planning, this means that the profiles should be periodically revalidated and updated as additional student cohorts are surveyed. Future studies should employ larger, probabilistically drawn samples and alternative clustering algorithms (e.g., hierarchical clustering, latent profile analysis) to test the robustness of the segmentation and refine the characteristics of each group.
Finally, this study relies on self-reported data, which may be subject to social desirability bias and common method variance. Incorporating objective indicators—such as academic records, family income data, or actual enrollment decisions—would strengthen future research.
4.5. Future Research Directions
Building on these findings, several avenues for future research emerge. First, a longitudinal design could track the same students over time to examine how motivational profiles evolve and whether they predict actual enrollment, persistence, and academic success. Second, qualitative studies (interviews or focus groups) could delve deeper into the reasons behind the low institutional interest in Cluster 2, exploring students’ perceptions of the university, their information sources, and their comparison with other options. Third, expanding the geographic scope to include other campuses of the University of Guanajuato or other states would test the generalizability of the profiles. Fourth, incorporating additional variables—such as digital literacy, parental occupation, or aspirations for postgraduate studies—could enrich the characterization of the segments. Finally, intervention studies could evaluate the effectiveness of targeted strategies (e.g., scholarships, orientation workshops, marketing campaigns) on improving enrollment rates among vulnerable and moderate groups.
5. Conclusions
This study, based on a sample of 306 high school students from diverse public and private institutions in southern Guanajuato, successfully identified and characterized three distinct motivational profiles that shape students’ predisposition to enroll at the University of Guanajuato, Yuriria Campus. Using K-means clustering with rigorous validation techniques—including the elbow method, silhouette coefficients, and bootstrap resampling—we uncovered significant patterns in five key motivational dimensions: family support, university interest, academic perception, transport accessibility, and self-efficacy. The inclusion of socioeconomic variables (school type, gender, economic barriers, and geographic origin) enriched the interpretation of these profiles and revealed deep-seated equity gaps.
The three profiles—“Privileged and Committed” (21.2%), “Supported but Not Captivated” (64.7%), and “Vulnerable and Disconnected” (14.1%)—reflect a clear gradient of advantage and vulnerability. The privileged group, predominantly from private schools and with low economic barriers, exhibits high motivation and strong institutional interest. The moderate group, the largest segment, shows adequate family support and self-efficacy but lukewarm interest in the university, highlighting a reputational and outreach challenge. The vulnerable group, largely from public schools in rural areas and facing high economic barriers, presents the lowest scores across all dimensions, indicating multiple intersecting obstacles to higher education access.
From a sustainability perspective, these findings operationalize Sustainable Development Goal 4 by translating its aspirational targets into empirically grounded, context-specific interventions. The “Vulnerable and Disconnected” cluster (14.1%) provides a direct diagnostic for Target 4.5 (elimination of disparities): its concentration in rural, public-school populations with high economic barriers quantifies the intersectional nature of educational exclusion and pinpoints where equity-focused resources—such as need-based scholarships, transportation subsidies, and family outreach—should be concentrated. Conversely, the “Supported but Not Captivated” cluster (64.7%) speaks to Target 4.3 (equal access to quality higher education): here, the barrier is not affordability but perceived institutional relevance, suggesting that access strategies must also address how quality and career alignment are communicated. Even the “Privileged and Committed” cluster (21.2%) serves an analytical role, revealing how the absence of structural barriers facilitates access—a baseline that underscores the systemic nature of the inequalities faced by vulnerable groups. Thus, rather than a one-size-fits-all approach, this study provides a segmented policy roadmap where each cluster informs a distinct lever for advancing SDG 4, from retention programs for the privileged to decentralized, multi-dimensional support for the geographically concentrated vulnerable population. While these profiles show moderate consistency (bootstrap co-clustering = 0.48) and should be viewed as indicative patterns rather than fixed classifications, they offer a sufficiently stable heuristic for guiding institutional policy and targeting SDG 4 interventions at the regional level.
Methodologically, this study demonstrates the value of educational data analytics and clustering techniques for understanding the complex, configurational nature of university access. The use of multiple-item constructs with acceptable reliability (except for academic perception, which was moderate), combined with bootstrap validation (stability = 0.48), addresses previous critiques regarding measurement error and cluster robustness. The consistency of the profiles with an earlier exploratory study (N = 100) provides additional evidence of replicability.
Despite these contributions, this study has limitations that should be acknowledged. The sample, although larger than previous studies, is regional and non-probabilistic, limiting generalizability. The cross-sectional design precludes causal inferences, and the moderate reliability of the academic perception scale suggests the need for refinement in future research. The bootstrap stability, while acceptable for exploratory work, indicates some sensitivity to sampling variations.
Future research should address these limitations through longitudinal designs that track students from high school through university entry, qualitative studies that explore the reasons behind low institutional interest, and intervention studies that evaluate the effectiveness of targeted strategies. Expanding the geographic scope to other campuses and incorporating additional variables—such as parental occupation, digital literacy, or aspirations for postgraduate studies—would further enrich the segmentation models.
In conclusion, this research contributes to both theory and practice by extending existing models of college choice through data-driven segmentation and by providing actionable insights for sustainable higher education policies in regional Mexican contexts. The identification of distinct motivational and socioeconomic profiles offers a foundation for evidence-based decisions that promote educational equity and institutional sustainability, aligning with the transformative vision of the 2030 Agenda.
6. Future Work
Building on the findings of this study, several lines of future research and institutional action emerge. First, the identification of three distinct motivational profiles—particularly the large “Supported but Not Captivated” group and the vulnerable segment—calls for longitudinal studies that track students over time. A longitudinal design would allow researchers to examine how these profiles evolve during the transition from high school to university, whether they predict actual enrollment decisions, and how they interact with academic performance and persistence. Such studies could also identify critical windows for intervention and help establish causal relationships between motivational factors and educational outcomes [
22].
Second, qualitative research is needed to deepen our understanding of the reasons behind the low institutional interest observed in Cluster 2. Focus groups and semi-structured interviews with students from this profile could explore their perceptions of the University of Guanajuato, their information sources, the role of family and peers in shaping their preferences, and their comparisons with alternative institutions or career paths. This would complement the quantitative findings and provide rich contextual insights for designing effective communication and outreach strategies [
55].
Third, the moderate reliability of the academic perception construct () suggests the need to refine and expand this scale. Future surveys should include additional items that capture specific dimensions of academic quality—such as teaching effectiveness, curriculum relevance, laboratory facilities, and linkages with employers—to improve measurement precision. Incorporating students’ direct experiences with university open days, campus visits, or interactions with faculty could also enhance the validity of this construct.
Fourth, the geographic concentration of vulnerable students in rural municipalities points to the importance of place-based interventions. Future research could employ spatial analysis techniques to map the distribution of student profiles and identify underserved areas. This would enable the university to design decentralized strategies, such as mobile information units, satellite orientation centers, or transportation subsidies tailored to specific communities. Partnerships with local governments and community organizations could amplify the reach and effectiveness of such initiatives.
Fifth, the stability of the cluster solution (bootstrap co-clustering probability = 0.48) indicates that the profiles are reasonably robust but could be further validated with larger and more diverse samples. Expanding this study to include other campuses of the University of Guanajuato—such as those in León, Celaya, or Guanajuato capital—would test the generalizability of the profiles across different urban and institutional contexts. Cross-state comparisons with universities in neighboring states (e.g., Michoacán, Querétaro) could reveal regional variations in motivational patterns and inform broader policy frameworks.
Sixth, the integration of additional variables could enrich the segmentation models. Future studies should collect data on parental occupation and education (as more objective indicators of socioeconomic status), digital literacy and access to technology (increasingly relevant for post-pandemic education), and students’ professional aspirations and knowledge of labor market outcomes. These variables could help explain the gap between self-efficacy and institutional interest observed in Cluster 2 and identify leverage points for intervention.
Seventh, we propose to develop a system dynamics model that simulates the temporal evolution of student interest and enrollment intention under different institutional scenarios. Building on the profiles identified, such a model could incorporate feedback loops between university outreach efforts, family support, transportation improvements, and changes in academic perception. By calibrating the model with empirical data, it would become a strategic tool for testing the potential impact of policies—such as scholarship programs, marketing campaigns, or infrastructure investments—before implementation, thereby supporting sustainable enrollment planning [
56].
Eighth, alternative clustering techniques could be explored to complement the K-means approach. Hierarchical clustering, for instance, would provide insights into the nested structure of student segments, while fuzzy clustering could capture students with mixed profiles. Density-based methods (e.g., DBSCAN) might reveal atypical groups or outliers that are not well represented in the main clusters. Comparing the results of multiple algorithms would enhance the robustness and interpretability of the segmentation [
21].
Finally, we recommend that the University of Guanajuato, Yuriria Campus, use these findings to pilot targeted interventions and evaluate their effectiveness through mixed-method research. For example, a scholarship and mentoring program could be designed for the vulnerable cluster, with pre- and post-intervention surveys to measure changes in motivational variables and enrollment rates. Similarly, a marketing campaign highlighting academic programs and graduate success stories could target the moderate cluster, with controlled experiments to assess its impact on university interest. Such action research would not only improve institutional practices but also contribute to the broader literature on educational equity and sustainable development.
In summary, the future research agenda should combine methodological refinement, theoretical deepening, and practical experimentation. By pursuing these lines of inquiry, we can move from descriptive profiles to predictive models and, ultimately, to transformative interventions that advance SDG 4 and foster inclusive, equitable, and sustainable higher education in Mexico and beyond.