


Abstract
Accurate and continuous monitoring of flood dynamics is fundamental to understanding wetland hydrological processes and their ecological implications, yet it remains challenging due to the inherent trade-off between spatial and temporal resolution in remote sensing observations. This study advances flood monitoring methodology by developing and validating a spatiotemporal fusion framework specifically designed for multi-source Synthetic Aperture Radar (SAR) data—an approach that has remained underdeveloped despite its critical importance for all-weather wetland observation. We propose the Fusion SAR Operational Monitoring (FSOM) framework, which integrates three established components—the Flexible Spatiotemporal Data Fusion (FSDAF) model, the Sentinel-1 Dual-Polarized Water Index (SDWI), and automated thresholding classification—into a coherent processing chain that generates consistent high-resolution flood extent time series from multi-sensor SAR data (Sentinel-1 and GF-3). The FSOM was applied to the Chen Lake Wetland from 2020 to 2024, producing a monthly flood map dataset at 5 m spatial resolution. Quantitative validation demonstrated the superiority of the FSOM-derived products. Compared to water classifications using original Sentinel-1 data, the FSOM results achieved a significantly higher overall accuracy (exceeding 90%) and Kappa coefficient (>0.90) than the Sentinel-1 results, which had overall accuracy (exceeding 86%) and Kappa coefficient (>0.75). Critically, the producer’s accuracy for water bodies consistently surpassed 91%, indicating a substantial reduction in omission errors and markedly improved detection of small water bodies. These results confirm the effectiveness of the proposed FSOM framework in mitigating the spatiotemporal resolution trade-off, thereby providing a reliable high-fidelity data foundation to support precise wetland conservation and flood disaster emergency response. The framework thus offers a practical tool for scientists and water resource managers seeking to enhance monitoring capabilities in the world’s most dynamic and ecologically significant wetland ecosystems.
1. Introduction
Wetlands, broadly defined as transitional ecosystems where the land is periodically or permanently saturated with water, represent critical interfaces between terrestrial and aquatic environments [1,2]. They can provide vital ecosystem services, such as water quality improvement, shoreline protection, groundwater recharge, and mitigation of flood and drought severity, while also offering unique habitats for flora and fauna [3,4]. The sustainable management of wetland ecosystems is therefore crucial for maintaining biodiversity, supporting livelihoods, and enhancing resilience to climate change.
For floodplain wetlands, seasonal flooding is a defining hydrological process, and flood disturbance is a primary factor controlling their structure and function [5,6,7,8]. Flood disturbances exert both positive and negative effects: they increase the aquatic habitat availability for waterbirds and other species during high-water periods, but extreme events can disrupt ecological balance and threaten dependent species [9,10]. Understanding and monitoring these flood dynamics is therefore essential for maintaining the ecological integrity and sustainable functioning of wetland systems.
However, dramatic alterations in wetland area, ecology, and biodiversity have occurred globally over the past decades, threatening their capacity to deliver sustainable ecosystem services [11,12,13,14]. Effective wetland conservation and management depend on precise understanding and continuous monitoring of flood dynamics. Tracking fluctuations in flood extent represents a fundamental approach for assessing hydrological disturbances in wetlands, and remote sensing has become an indispensable tool for this purpose [15,16,17].
Optical satellite data, such as from the MODIS (Moderate Resolution Imaging Spectroradiometer), Landsat series, and IKONOS, have been widely used for monitoring land cover and surface water [5,18,19]. However, their utility for flood monitoring is constrained by inherent limitations: susceptibility to cloud cover interference, spectral confusion between wetland and upland vegetation, and the limited sensitivity for detecting sub-canopy or seasonal water bodies [20,21]. Although spatiotemporal fusion techniques (e.g., STARFM (Spatial and Temporal Adaptive Reflectance Fusion Models) and FSDAF (Flexible Spatiotemporal Data Fusion method)) can enhance spatial and temporal resolution of optical data, they cannot overcome these fundamental sensor limitations, rendering optical data suboptimal for robust continuous flood monitoring.
Synthetic Aperture Radar (SAR) sensors offer a compelling alternative. Operating at longer wavelengths, SAR penetrates cloud cover and, to a limited extent, vegetation canopies, enabling all-weather day-and-night data acquisition [22,23]. This all-weather capability ensures continuous data acquisition regardless of atmospheric conditions, which is critical for monitoring flood events that often occur under persistent cloud cover. Owing to this all-weather capability and their sensitivity to dielectric properties of water, SAR data (e.g., the Sentinel-1 satellite of the European Space Agency, China’s GF-3 satellite, Germany’s Terras SAR-X satellite and Japan’s ALOS-2 (Advanced Land Observing Satellite-2)) are particularly more suitable for wetland flood detection [24,25,26]. Their effectiveness in identifying the flood extent, depth, and dynamic changes has made SAR indispensable for accurately mapping flooded areas and monitoring wetland ecosystems [27,28]. However, a fundamental trade-off between spatial coverage and revisit frequency constrains the temporal resolution of most SAR systems, limiting their capacity to capture rapid inundation dynamics essential for understanding wetland sustainability under changing environmental conditions.
Spatiotemporal fusion offers a viable strategy for generating synthetic data with both fine spatial and temporal resolution by blending multi-sensor observations [29,30]. While various spatiotemporal fusion methods have been successfully applied to optical imagery to enhance its spatiotemporal resolutions, delicate spatiotemporal fusion framework for generating dense time series from multiple SAR data remains notably lacking. To address this gap and enable the high-frequency monitoring of wetland flood dynamics, this study aims to adapt and refine an existing spatiotemporal fusion method, originally designed for optical data, for the specific application to multi-source SAR imagery.
Based on the existing research, current spatiotemporal fusion models can be categorized into two types: models not based on land cover change and models based on land cover change. This category is determined by whether the spatiotemporal fusion model actively extracts and utilizes dynamic information from land cover change to optimize the fusion results. A predominant category primarily relies on the spatiotemporal consistency hypothesis where no abrupt land cover change occurs. This overarching theoretical foundation incorporates two key assumptions: the spectral similarity assumption, which presumes that pixels representing the same land cover type maintain consistent spectral characteristics across different images and the assumption that land surface changes are linear and gradual over short timeframes. Representative models in this category, such as STARFM and its enhanced version (ESTARFM), effectively predict seasonal variations or gradual changes by identifying spectrally similar pixels and applying linear weighting [31,32,33]. However, these assumptions are frequently violated in wetlands, where flood events drive rapid, non-linear, and abrupt land cover transformations such as sudden inundation or swift water recession [34,35,36,37]. Consequently, spatiotemporal fusion models that lack an explicit mechanism to account for these abrupt land cover changes are inherently limited for monitoring wetland flood.
To overcome the limitations of models that assume gradual change, another category of fusion methods explicitly incorporates land cover change information. This category includes data-driven deep learning approaches (e.g., CNN (convolutional neural networks), GAN (generative adversarial networks), Transformers) and physically constrained models [38,39,40,41]. Deep learning methods can automatically learn complex non-linear feature mappings through data-driven end-to-end training, thereby optimizing the fusion process [42,43]. However, they generally lack explicit modeling of the physical processes involved in land cover change, resulting in limited interpretability. This black-box nature is a significant drawback for wetland flood monitoring, where the mechanistic understanding of inundation processes is often crucial. Furthermore, their performances are heavily dependent on large-scale and accurately annotated training datasets. Acquiring such data is particularly challenging for transient flood events that often occur under cloud cover. Consequently, when applied to scenarios with limited samples or conditions significantly different from the training dataset, these models frequently exhibit weak generalization capabilities, potentially leading to overfitting or unstable performance. Given these constraints related to interpretability, data requirements, and generalization, purely data-driven deep learning fusion methods are considered suboptimal for the specific challenges of operational wetland flood monitoring.
The second category incorporates physical or mechanistic constrains to guide the fusion process, which offers a more balanced and suitable solution for our application. The Flexible Spatiotemporal Data Fusion (FSDAF) model, proposed by Zhu et al., explicitly addresses abrupt land cover changes by combining spectral unmixing analysis with a thin plate spline interpolator [44]. It first uses spectral unmixing techniques to estimate the fractional cover of land cover classes and then uses the interpolator to model the spatial distribution and temporal change of these fractions at fine resolution. This explicit physical modeling enables FSDAF to handle rapid heterogeneous land surface changes characteristic of wetland flooding while maintaining interpretability and requiring less training data than deep learning approaches. Therefore, based on its ability to mechanistically model abrupt changes and its practicality in data-scarce scenarios, we select and adapt the FSDAF as the basis for fusing multi-source SAR data to monitor flood dynamics for wetland.
With the increasing availability of openly accessible SAR satellite data from missions like Sentinel-1 and GF-3, water extraction techniques based on SAR data have been extensively studied and applied [45,46,47]. To establish an efficient and automated workflow for monitoring dynamic flood patterns over a multi-year period, we focused on evaluating prevailing water extraction methods for SAR data. Current water extraction methods using radar-based remote sensing data primarily include threshold-based methods and supervised/unsupervised classification approaches [48,49,50]. While supervised or unsupervised classification methods are powerful for general multi-class land cover maps, they are often computationally intensive and less straightforward to automate consistently across a large temporal image stack for binary water segmentation. In this study, the threshold method was selected for water extraction primarily due to its high computational efficiency and ease of operation, which making it particularly suitable for long-term time series analysis [50]. The Sentinel-1 Dual-Polarized Water Index (SDWI) effectively amplifies backscatter contrast between water and non-water surfaces [49,50,51], providing optimized input for threshold segmentation [51]. Given the large volume of SAR imagery involved in long-term flood dynamic monitoring, the threshold method offers a favorable balance between processing speed and result reliability, making it a pragmatic and effective choice for this research.
As a representative freshwater floodplain wetland in the middle and lower reaches of the Yangtze River in China, the Chen Lake Wetland is not only a critical stopover site along the East Asian–Australasian Flyway for migratory birds but also serves a vital function in regional flood regulation and runoff mitigation. Its hydrological regime is characterized by pronounced seasonal and inter-annual fluctuations, which drive dynamic inundation patterns that profoundly influence ecological processes, habitat availability, and biodiversity. Given the high sensitivity of this ecosystem to flooding dynamics and its clear ecological response to inundation changes, the Chen Lake Wetland presents itself as an ideal and representative study area for examining flood disturbances in floodplain wetlands.
To address the inherent trade-off between spatial coverage and temporal revisit frequency in SAR data, this study proposes an improved SAR-based water area extraction framework named FSOM (Fusion SAR Operational Monitoring), which adapts and extends the core mechanism of the FSDAF model for SAR data fusion. The FSOM was developed to address a methodological gap recognized across multiple international science initiatives—the absence of a spatiotemporal fusion framework for multi-source SAR data. Our framework integrates GF-3 (high spatial resolution) and Sentinel-1 (high temporal resolution) observation to generate continuous high-resolution flood extent time series.
The specific research objectives of this study include the following:
First, to develop and validate a spatiotemporal fusion framework (FSOM) that integrates GF-3 (high spatial resolution) and Sentinel-1 (high temporal resolution) SAR data for generating continuous high-resolution flood extent time series.
Second, by integrating SDWI index calculation with automated Otsu threshold segmentation within the FSOM framework, water body extraction performance is optimized.
Third, to apply the FSOM framework to monitor monthly flood extent dynamics in the Chen Lake Wetland from 2020 to 2024, demonstrating its capability for capturing both seasonal and inter-annual hydrological variability.
Finally, to evaluate the FSOM framework’s performance and limitations, providing guidance for its operational application in wetland flood monitoring.
By enabling more detailed and frequent monitoring of flood dynamics, this can contribute to sustainability goals related to understanding and managing wetland ecosystems under increasing climate variability and anthropogenic pressure. The resulting high-resolution time series offers valuable data for assessing hydrological connectivity, habitat availability, and ecosystem service delivery—information that can support evidence-based wetland conservation and adaptive management strategies.
2. Materials and Methods
2.1. Study Area and Data Description
2.1.1. Study Area
This study focuses on the Chen Lake Wetland Nature Reserve, a typical and representative floodplain wetland in the Jianghan Plain of China (Figure 1). Located in the Caidian District of Wuhan City, Hubei Province (30°15′10″ N to 30°24′44″ N, 113°44′07″ E to 113°55′39″ E), the nature reserve covers an approximately area of 116 km2. The landscape is characterized by a network of interconnected shallow lakes (Chen, Zhangjiada, and Wangjiashe lakes) and surrounding marshes. Situated within the floodplain influenced by the Yangtze and Han Rivers, the Chen Lake Wetland exhibits pronounced seasonal and interannual fluctuations driven by the hydrological dynamics of the Yangtze River. These dynamic inundation patterns constitute the primary target for the high-frequency monitoring proposed in this study.
Figure 1.
Overview of the study area. Spatial location and extent of the study area of Chen Lake Wetland, Hubei Province.
Ecologically, the Chen Lake Wetland is designated as a protected area for inland wetland and aquatic ecosystems. Its distinctive landscape and diverse habitats, situated within a mid-subtropical humid monsoon climate, make it a critical node along the East Asian–Australasian Flyway, providing essential wintering grounds for several threatened waterbird species, such as the Oriental Stork (Ciconia boyciana) and Black Stork (Ciconia nigra). The high sensitivity of these ecological assets to inundation dynamics further underscores the necessity for precise and continuous flood monitoring, solidifying the study area’s representativeness for our research objective.
The hydrological regime of the wetland is primarily regulated by the interplay of the Yangtze and Han Rivers, further modulated by the regional mid-subtropical humid monsoon climate. This results in a characteristic seasonal flood pulse, with water levels typically rising during the summer flood season and receding in the winter dry period. This pronounced seasonal inundation dynamic directly governs key ecological functions by modulating the water depth, habitat availability, and the abundance of food resources for resident and migratory species. Many studies indicate that flooding increases the coverage and availability of aquatic environments within the floodplain and, thus, the availability of habitats to wetland waterbirds. Waterbirds and other species associated with wetlands may become more abundant in floodplains during periods of high water. However, significant uncertainties persist in quantitatively understanding these eco-hydrological linkages, partly due to the insufficient high-frequency and high-resolution monitoring of flood extent and duration. Therefore, accurately monitoring the flood dynamics in Chen Lake Wetland is imperative. The outcomes can contribute to the long-term monitoring needed for adaptive water level management, informed flood control and disaster mitigation, and biodiversity conservation within this wetland ecosystem of international importance.
2.1.2. GF-3 Data
All GF-3 data were obtained from the China Centre for Resources Satellite Data and Application (https://data.cresda.cn/, accessed on 17 September 2025). We used all GF-3 Fine Stripmap I SLC imagery meeting our quality criteria from 2020 to 2024 (Table 1). These images feature a spatial resolution of 5 m, a swath width of 50 km, and dual-polarization (HH+HV, where HH and HV denote the co-polarization and cross-polarization channels of the GF-3 image data, respectively).
Table 1.
Summary of the data used in the study.
After screening for quality (e.g., low noise, full coverage, absence of significant artifacts), a total of eight usable scenes were acquired. Due to constraints in data availability, these eight images represent the complete set of usable GF-3 scenes accessible from the official data platform for the study area and time period. All eight scenes passed the initial quality screening and were retained for subsequent analysis.
Processing was first multi-looked (specify azimuth and range looks ratio = 1:2) to reduce speckle noise. The Refined Lee filter was selected with a window size of 7 × 7. Radiometric calibration was conducted to convert digital numbers to sigma nought using the GF-3 sensor (China Academy of Space Technology, Beijing, China) calibration parameters. Finally, the images were terrain-corrected and geocoded to the WGS84 UTM coordinate system using the SRTM 30 m DEM to correct for geometric distortions. As all of the data originated from the GF-3 series of SAR satellites, which directly measure the physical properties of the earth’s surface, and no atmospheric correction was required.
2.1.3. Sentinel-1 Data
The primary source of high-temporal-resolution data used in this study was the Sentinel-1 constellation (Sentinel-1A/B) from the European Space Agency’s Copernicus Program. All available Interferometric Wide Swath Mode Ground Range Detected products with dual polarization (VV+VH) covering the study area from 2020 to 2024 were downloaded the Alaska Satellite Facility (https://search.asf.alaska.edu/, accessed on 17 September 2025). These products feature a resolution of 10 m and a swath width of 250 km. To maintain consistency with the temporal resolution of the GF-3 imagery and align with the objectives of monthly flood dynamics monitoring, all Sentinel-1 scenes underwent a standardized preprocessing chain, the same as GF-3.
2.2. Framework of FSOM
2.2.1. Overview
This study proposes an improved SAR-based water area extraction framework, named the Fusion SAR Operational Monitoring (FSOM) framework. FSOM adapts the FSDAF spatiotemporal fusion model for SAR imagery and integrates it with a spectral-index-enhanced thresholding technique to generate high-frequency detailed flood maps. The resulting high-resolution time series offers valuable data for assessing hydrological connectivity, habitat availability, and ecosystem service delivery—information that can support evidence-based wetland conservation and adaptive management strategies. The overall workflow is depicted in Figure 2.
Figure 2.
Flowchart of research methodology, including three major parts: data preprocessing, spatiotemporal fusion for SDWI, and long-term monitoring of Chen Lake Wetland.
First, all SAR data (GF-3 and Sentinel-1) underwent standardized preprocessing, including multi-looking, speckle filtering, radiometric calibration, and geometric correction (detailed in Section 2.1).
Second, the preprocessed data were fed into the core FSOM pipeline. The FSDAF model was used to fuse the high-spatial-resolution GF-3 data with the high-temporal-resolution Sentinel-1 data, generating a continuous synthetic time series of high-resolution backscatter imagery. The SDWI was calculated from the fused imagery to amplify the contrast between open water and land surfaces. An automatic thresholding algorithm (e.g., Otsu’s method) was applied to each SDWI image to produce binary water/non-water masks.
Third, the accuracy of the extracted water bodies was validated against independent reference data using metrics (detailed in Section 2.3).
Finally, the validated monthly water masks were analyzed to quantify the spatiotemporal dynamics of flood extent in the Chen Lake Wetland from 2020 to 2024.
2.2.2. FSDAF
The first and foundational step of the FSOM framework is spatiotemporal data fusion, for which we adapted the Flexible Spatiotemporal Data Fusion (FSDAF) model. The FSDAF model was selected because its core mechanism—spectral unmixing coupled with residual optimization—enables it to handle heterogeneous landscapes and abrupt land cover changes, characteristics inherent to flood inundation dynamics in wetlands. In its standard form, FSDAF operates on optical reflectance data, which are typically expressed as linear values in the [0, 1] range. To adapt it for SAR backscatter coefficients (σ0), a critical preprocessing step was required to reconcile the fundamental differences between optical and SAR data representations. SAR data are typically stored and distributed in the logarithmic decibel (dB) scale (), which compresses the dynamic range and transforms multiplicative speckle noise into additive noise. However, FSDAF’s underlying algorithms—including spectral unmixing, residual calculation, and thin plate spline interpolation—are based on linear algebra assumptions that expect input data to be in a linear additive space. Operating on dB-scaled data would violate these assumptions, because the logarithmic transformation is non-linear and alters the statistical properties of the data distribution.
To address this, we applied a two-step transformation based on the power conversion theorem. First, the calibrated σ0 values were converted from the logarithmic dB scale to linear power scale using: . This conversion restores the physical linear relationship between backscatter intensity and surface scattering properties, ensuring that subsequent mathematical operations (e.g., differencing, averaging, unmixing) are physically meaningful. Second, we applied min–max normalization to scale the linear σ0 values to the [0, 1] interval. This normalization serves two purposes: (1) it matches the input data range expected by FSDAF’s algorithms, which were originally optimized for optical reflectance data, and (2) it ensures numerical stability in the unmixing and optimization procedures by bounding all inputs to a consistent scale. The min and max values were computed on a per-scene basis to account for variations in backscatter range across different acquisition conditions and seasons.
A fundamental consideration in adapting FSDAF to SAR data is the presence of speckle—a granular multiplicative noise inherent to coherent imaging systems like SAR. Speckle arises from the constructive and destructive interference of radar waves scattered from multiple elementary scatterers within a resolution cell, and it manifests as random pixel-to-pixel intensity variations that are not related to actual surface properties [22,23]. If not properly addressed, speckle can propagate through the fusion process, introducing artifacts and reducing the accuracy of the reconstructed time series.
In the FSOM framework, speckle is addressed at multiple stages. First, prior to fusion, all Sentinel-1 and GF-3 images were subjected to multi-looking to reduce speckle while preserving the spatial resolution to the extent possible. This processing step increases the equivalent number of looks (ENL) and improves the radiometric accuracy of the input data [24]. Second, the linearization and normalization steps described above transform multiplicative speckle into additive noise, which is more compatible with FSDAF’s error modeling assumptions. Third, FSDAF’s unmixing-based approach provides inherent robustness to speckle because it operates on ensemble statistics of similar pixels rather than individual pixel values. The spectral unmixing component estimates the fractional cover of land cover classes from multiple pixels, effectively averaging out some speckle-induced variability. The thin plate spline interpolation further smooths residual errors by enforcing spatial continuity in the predicted change fields. Despite these measures, residual speckle effects may persist in the fused products, particularly in areas with low backscatter contrast (e.g., smooth water surfaces) or high heterogeneity.
The adapted FSDAF model operates as follows. It requires three input images: a pair of high-spatial-resolution GF-3 image and a low-spatial-resolution Sentinel-1 image at time t0, along with another low-spatial-resolution Sentinel-1 image at the prediction time t1. The process begins by applying unsupervised classification on the low-spatial-resolution pair to identify pixels that may have undergone land cover change between t0 and t1. Temporal residuals are then calculated from the low-resolution data. To spatially distribute these changes at the high-resolution scale, a Thin Plate Spline interpolation is used, informed by the spatial structure of the high-spatial-resolution image. Finally, the predicted high-spatial-resolution image at time t1 is determined by incorporating the initial high-resolution image at t0 with the disaggregated temporal changes, weighted by the similarity of neighboring pixels. This prediction is mathematically represented by Equation (1):
where denotes the final predicted backscatter coefficient at location and time t1; represents the coordinates of the j-th relatively higher-resolution GF-3 pixel within the i-th relatively lower-resolution Sentinel-1 pixel; is the backscatter coefficient at time t0 from the relatively higher-resolution GF-3 image; refers to the weight of the candidate pixel; indicates the temporal change in backscatter between time t0 and t1.
We acknowledge that the ±5-day temporal mismatch between GF-3 and Sentinel-1 acquisitions represents an inherent constraint of this multi-sensor fusion approach. In a dynamic floodplain wetland, where the water extent can change rapidly in response to precipitation or managed releases, such temporal offsets may introduce uncertainties in the fused products. While our validation against GF-3 reference data (Section 3.1) demonstrates strong overall agreement (R2 = 0.90), this self-consistency validation does not fully account for errors arising from asynchronous acquisition. Quantifying the precise impact of temporal misalignment would require concurrent high-temporal-resolution observations (e.g., gauge records or dense time series from a single sensor), which were not available for this study. Future work should prioritize integrating in situ hydrological measurements or exploiting SAR sensor with shorter revisit intervals to better constrain this uncertainty.
2.2.3. Water Extraction by SDWI and Otsu’s Thresholding Method
The proposed FSOM framework integrates the FSDAF model for the spatiotemporal fusion of GF-3 and Sentinel-1 SAR data, generating a synthetic high-resolution backscatter imagery. These fused data serve as the basis for calculating the SDWI, which amplifies the contrast between water and non-water areas in the complex wetland environments. Water bodies are then delineated by applying an automatic thresholding algorithm to the SDWI imagery. The accuracy of the extracted water masks was rigorously evaluated against independent reference data derived from contemporaneous higher-resolution optical Google Earth imagery through confusion matrix-derived metrics. Ultimately, this process yielded validated monthly time series of dynamic flood extent maps at a 5 m nominal spatial resolution for the Chen Lake Wetland from 2020 to 2024, which forms the foundational dataset for the spatiotemporal analysis of flood dynamics.
Wetlands often contain mixed pixels comprising open water, flooded vegetation, and wet soil, which traditional single-polarization thresholding methods may fail to detect. With inspiration from the normalized difference vegetation index (NDVI) and normalized difference water index (NDWI) and according to water body characteristics from the microwave image, Du et al. proposed an index method for water body information extraction based on Sentinel-1 dual polarized data and the Sentinel-1 dual-polarized water index (SDWI) [51].
To enhance the separability between water and non-water features for subsequent thresholding, the second stage of the FSOM framework involves calculating the Sentinel-1 dual-polarized water index (SDWI). This index adapts the optical index concept for dual-polarization SAR data through a formulation that is physically grounded in the scattering mechanisms of microwave interactions with surface features. SAR raw data are typically stored on a decibel (dB) scale, reflecting the logarithmic power values of ground object backscatter intensity. On a logarithmic scale, the contrast between water bodies and land surfaces may be compressed. The core idea of Equation (2) is to expand the difference between water bodies and other surface features (background) by amplifying 10 times the product co-polarized and cross-polarized images and then using natural logarithm as the functional formula. This enhanced contrast provides an optimized input for the subsequent automatic thresholding step. For dual-polarized (e.g., HH) and cross-polarized (e.g., HV) channels, the SDWI formula is defined as Equation (2):
where represents the water index. For GF-3 data, the and correspond to the HH and HV polarization channels, respectively, while for Sentinel-1 data, VV and VH channels were used. The index was calculated in a way that maintained polarization-specific consistency, by processing co-polarized (HH/VV) and cross-polarized (HV/VH) data streams separately during fusion. This strategy ensures that the physical scattering mechanisms represented in the index remain consistent, despite the different sensor characteristics.
The formulation of Equation (2) requires physical justification for two key components: the multiplication by a factor of 10 and the natural logarithm transformation. The factor of 10 serves to amplify the product of the two polarization channels prior to logarithmic transformation. This scaling factor is not arbitrary; it is motivated by the need to align the dynamic range of the resulting index with the expectations of subsequent thresholding algorithms. In SAR data, backscatter coefficients (σ0) expressed in linear power typically span several orders of magnitude—for instance, from 10−4 to 100 for open water and from 10−2 to 101 for vegetated surfaces. The product can therefore span an even wider range. Without amplification, taking the logarithm of very small values (approaching zero) would yield large negative numbers, potentially compressing the separability between water and land in the index space. The factor of 10 ensures that for typical water backscatter values, the resulting logarithm falls within a range that, after subsequent normalization, can be effectively mapped to the interval [−1, 1]. This scaling choice was empirically validated by Du et al. to optimize the separation between water and non-water classes across diverse wetland environments [51].
The use of the natural logarithm transformation in the SDWI is motivated by three physical considerations. First, SAR data are affected by multiplicative speckle noise, in which the signal variance scales with the mean intensity. The logarithmic transformation converts this multiplicative noise into an additive form, which is more compatible with subsequent processing algorithms and helps stabilize the variance across the dynamic range. Second, the transformation compresses the wide dynamic range of SAR backscatter—often spanning several orders of magnitude—into a more manageable scale. This enhances the separability between water and land, as relative differences in backscatter intensity become absolute differences in the logarithmic domain. Third, the logarithmic transformation is consistent with the physical basis of radar backscatter measurement. Although SAR data are commonly stored and analyzed in the decibel scale, the use of the natural logarithm in the SDWI creates an index that behaves similarly to optical indices such as NDVI and NDWI, while preserving statistical properties that improve water–land discrimination. The natural logarithm was chosen over base-10 logarithm, because it yields a slightly wider spread for low-backscatter targets such as water, further enhancing class separability.
To ensure radiometric consistency across the multi-temporal image stack—a prerequisite for applying a consistent threshold—a critical preprocessing step was applied before index calculation. The backscatter values (σ0) for each polarization channel from all dates were subjected to histogram matching against a reference scene, followed by min–max normalization to a common numerical range (e.g., [0, 1]). This process minimizes temporal radiometric biases caused by varying acquisition conditions.
After this normalization, the calculated SDWI values typically range from −1 to 1. Values closer to 1 indicate a stronger water signal, characterized by a high backscatter ratio typical of open water surfaces in the dual-polarization SAR data. Conversely, values approaching −1 represent a stronger non-water signal, corresponding to land cover types such as vegetation or bare soil. This enhanced contrast provides an optimized input for the subsequent automatic thresholding step.
The third and final step of the FSOM framework is the binary segmentation of the SDWI images into water and non-water classes using an automatic thresholding algorithm. We selected Otsu’s thresholding method for this purpose due to its computational efficiency, objectivity, and widespread successful application [52]. Otsu’s method is a non-parametric global thresholding technique that assumes the image histogram can be bimodally modeled. It determines the optimal threshold by exhaustively searching for the intensity value that maximizes the between-class variance (separability) of the two resultant classes (water and non-water) [53]. This property makes it particularly suitable for our pre-processed SDWI images, in which the water and land pixels are expected to form two distinct peaks in the histogram. The Otsu threshold was calculated independently for each monthly SDWI image in the time series to account for potential seasonal variations in backscatter characteristics. After determining the optimal threshold, information on the water distribution range can be obtained quickly and accurately by the threshold segmentation approach. The segmentation is then defined as follows. Let represent the grayscale value of the pixel at location in the image. The threshold segmentation method can be expressed as Equation (3):
where M represents the generated segmentation mask. If the intensity value of a pixel is higher than the threshold t, the pixel is classified as water and M is assigned 1. Otherwise, it is classified as non-water and M is assigned 0.
2.3. Accuracy Assessment
The accuracy of the methodology was assessed in two stages: the spatiotemporal fusion process and the final water classification results. First, the precision of the image fusion was quantitatively evaluated by comparing the predicted images with the corresponding original GF-3 observations. Three standard metrics were employed including the root mean square error (RMSE), the average absolute difference (AAD), and the correlation coefficient (CC). The RMSE and AAD quantify the overall magnitude of prediction errors, with the RMSE being more sensitive to larger deviations. The CC measures the strength of the linear agreement between the predicted and observed images. Additionally, the mean bias (MB) was calculated to assess systematic over- or under-estimation, where a positive value indicates a tendency to overestimate, and a negative value indicates underestimation. The coefficient of determination (R2) was also computed to indicate the proportion of variation explained by the fusion model. Note that the AAD is equivalent to the mean absolute error (MAE), which provides the average magnitude of absolute differences.
Subsequently, the accuracy of the extracted water bodies was assessed against the reference data. High-spatial-resolution Google Earth imagery, acquired close to the Sentinel-1 and GF-3 observation dates, was visually interpreted to generate reliable reference water masks. A confusion matrix analysis was then employed to derive standard classification accuracy metrics: overall accuracy (OA), Kappa coefficient, producer’s accuracy (PA), and user’s accuracy (UA). PA and UA effectively reflect omission and commission errors, respectively. This two-tiered assessment provides a comprehensive validation of both the data preprocessing and the classification outcome.
To assess the accuracy of the extracted water bodies, we employed a two-tiered validation strategy that accounts for the inherent limitations of available reference data.
First, to evaluate the spatiotemporal fusion performance, we utilized a leave-one-out approach, wherein the available GF-3 scenes served a dual purpose: they were used as both the high-spatial-resolution input for fusion and as the reference benchmark for validation. We acknowledge that this constitutes a self-consistency check rather than an independent validation, as no contemporaneous higher-resolution SAR data were available for the study area. Nevertheless, this approach provides a quantitative measure of the fusion algorithm’s ability to reconstruct spatial details consistent with the GF-3 observations.
Second, to supplement this with an independent assessment, we collected high-spatial-resolution optical imagery from Google Earth. Images with minimal cloud cover were selected based on their acquisition dates being as close as possible to the corresponding SAR observations. Specifically, the selected Google Earth imagery was acquired on 3 October 2020 (corresponding to SAR observation on 5 October 2020, time difference = 2 days), 12 December 2021 (corresponding to 11 December 2021, difference = 1 day), 7 April 2022 (corresponding to 10 April 2022, difference = 3 days), 18 August 2023 (corresponding to 15 August 2023, difference = 3 days), and 15 September 2024 (corresponding to 14 September 2024, difference = 1 day). These optical images were visually interpreted to generate reference water masks for qualitative comparison and limited quantitative assessment. Due to the inherent temporal mismatches and potential phenological differences between optical and SAR acquisitions, the Google Earth comparison primarily serves as a complementary visual validation rather than a rigorous quantitative benchmark.
Despite these constraints, the consistency observed between the fused products and both validation sources provides confidence in the reliability of the FSOM-derived flood extent maps. Future validation efforts would benefit from coordinated field campaigns or dedicated high-resolution SAR acquisitions coincident with satellite overpasses.
3. Results
3.1. Comparison of Fused SAR Images with Reference Images
To quantitatively evaluate the performance of the FSOM framework in reconstructing high-resolution spatiotemporal details, a rigorous validation strategy was conducted. It should be noted that the self-consistency validation strategy was necessitated by the absence of an independent higher-resolution reference dataset, as such external data were not available for the study area and period. This limitation inherently restricts the ability to assess absolute geometric or radiometric errors that may be present in the GF-3 data. For each of the eight available GF-3 acquisition dates, the original GF-3 imagery was temporarily excluded from the fusion process and treated as simulated ground truth. The FSOM was then applied using only the temporal context provided by the remaining GF-3 images and the full Sentinel-1 time series to generate a fused image for that specific timestamp. The accuracy of the fusion process was subsequently assessed by comparing this model-output fused image against the withheld original GF-3 scene using the metrics described in Section 2.3. This experiment directly tests the FSOM’s ability to accurately synthesize high-resolution information at dates when it is presumed unavailable. Following this validation and confirmation of the FSOM’s efficacy, the FSOM was applied in its operational mode for long-term dynamic monitoring. To construct a consistent high-resolution time series spanning the entire study period (2020–2024), fused imagery was generated for all Sentinel-1 acquisition dates by integrating the temporal information from the complete GF-3 image set. The final monthly flood extent maps were derived exclusively from this continuous series of fused imagery, ensuring temporal consistency and enhanced spatial detail throughout the monitoring period.
To demonstrate the effectiveness of the FSOM framework, a representative case for 5 October 2020 is presented as an exemplar in detail. Figure 3 visually compares the high-resolution SDWI image generated by fusing GF-3 and Sentinel-1 data using FSOM against the SDWI derived from the original GF-3 and Sentinel-1 images. All three images exhibit consistent spatial patterns in major water bodies and the overall spatial structure of SDWI values, providing initial qualitative evidence of successful fusion. A quantitative assessment of the fusion accuracy is provided, which compares both the fused product and original Sentinel-1 SDWI against GF-3 SDWI as the reference benchmark. The fused image achieved a significantly higher coefficient of determination (R2 = 0.90) with the GF-3 benchmark compared to the original Sentinel-1 image (R2 = 0.85), indicating that the fused data captured 90% of the variance in the high-resolution reference and demonstrated superior agreement. This 5-percentage point improvement in explanatory power represents a meaningful gain in the ability to reconstruct fine-scale spatial patterns from coarser-resolution inputs. To comprehensively evaluate the accuracy of the fused image, we calculated multiple error metrics, including the root mean square error (RMSE), mean absolute error (MAE), and mean bias (MB), using the GF-3 SDWI as the reference benchmark. The fused image exhibited a slightly higher RMSE (1.5) compared to the original Sentinel-1 data (1.45). However, the MAE of the fused image was 0.83, notably lower than its RMSE, indicating that the error distribution contained some larger deviations—likely occurring at sharp transitions between water and land—that disproportionately influenced the RMSE. The MB was −0.78, revealing a systematic tendency for the fused image to underestimate SDWI values relative to the GF-3 reference.
Figure 3.
Visual inspection of spatial details on 5 October 2020: (a) GF-3 Synthetic Aperture Radar Wetland Detection Index (SDWI); (b) fused SDWI from the Flexible Spatiotemporal Data Fusion model; and (c) Sentinel-1 SDWI. Note: the top row of photos shows an enlarged portion of each of the lower photos as indicated by red lines.
This underestimation can be attributed to the inherent spatial resolution difference between the input sensors (Sentinel-1 10 m vs. GF-3 5 m). During the fusion process, fine-scale water features present in the GF-3 reference may be partially smoothed or averaged when reconstructed from coarser Sentinel-1 inputs, leading to lower SDWI values in some areas. Second, the ±5-day temporal mismatch between GF-3 and Sentinel-1 acquisitions introduces genuine hydrological changes (e.g., flood recession or expansion) that contribute to the observed discrepancies, even under ideal fusion conditions. The self-consistency validation framework, while useful for assessing spatial reconstruction fidelity, cannot fully isolate these temporal uncertainties from algorithmic errors. Consequently, the reported bias and MAE should be interpreted as upper-bound estimates of the fusion error under the constraint of asynchronous observations.
Despite these limitations, the fused image achieves a substantially higher coefficient of determination (R2 = 0.90) compared to Sentinel-1 alone (R2 = 0.85), demonstrating superior explanatory power and stronger agreement with the reference in terms of spatial pattern reconstruction. The combination of a modest systematic bias and a low MAE suggests that the fusion process preserves overall radiometric consistency while effectively enhancing the spatial detail. For flood extent monitoring, where the accurate delineation of water bodies is prioritized over pixel-level precision, the trade-off between a slight increase in RMSE and a significant gain in explained variance is considered acceptable. These results collectively confirm that the FSOM framework successfully synthesizes spatiotemporal information from multi-resolution SAR sensors, producing a fused product that better approximates the spatial detail of high-resolution GF-3 imagery while maintaining temporal consistency.
The accuracy of the water classification time series generated from the fused imagery was assessed against independent reference data. Reference binary water masks were created through manual delineation of water bodies on high-resolution Google Earth imagery, which was carefully selected to correspond temporally with the SAR acquisitions.
To evaluate performance under dynamic and challenging conditions, we focused on the year 2020, which featured a notable flood event. This event created complex mixed-water landscapes ideal for testing the advantage of enhanced spatial resolution. A detailed monthly comparison for 2020, encompassing 12 available scenes (Figure 4), was conducted between the classification results from the original Sentinel-1 data and those from the FSOM-fused data.
Figure 4.
Change trends for 2020 flood area based on Sentinel-1 and spatiotemporal fusion images (covering 12 dates). The black and red lines display the monthly variation trend of water area extracted from Sentinel-1 data in 2020 and the trend derived from spatiotemporal fusion data, respectively.
While both datasets captured the broad seasonal rise and fall of water levels, the classification based on the fused results provided a quantitatively superior representation during the key flood months (May–July hydrological dynamics) compared to the Sentinel-1-based results. This improvement is directly attributable to the enhanced spatial resolution, which enabled the reliable detection of numerous small water bodies and fragmented flooded zones that were omitted or merged with land in the coarser Sentinel-1 data (see exemplars in Figure 4). Furthermore, the finer resolution improved the delineation of water boundaries in areas affected by seasonal vegetation, reducing commission errors. This analysis confirms that the FSOM framework not only maintains temporal consistency but also translates spatial enhancement into significantly more accurate and detailed monthly water classification maps, particularly during critical flood periods.
In summary, this study demonstrates that the FSOM-based spatiotemporal fusion framework successfully generates a consistent high-spatial-resolution SAR data series suitable for detailed monthly flood monitoring. The fused products retain the superior spatial detail of the GF-3 image, enabling precise delineation of small water bodies and complex wetland boundaries (Figure 3), while simultaneously preserving the frequent temporal sampling of Sentinel-1 to accurately track dynamic flood processes (Figure 4). This synergistic integration effectively bridges the gap between spatial detail and temporal coverage, two common constraints in satellite-based wetland observation.
3.2. Result of SDWI Images
The preprocessed GF-3 and Sentinel-1 datasets were integrated using the FSOM framework to generate a continuous monthly temporal frequency of synthetic SDWI images for the period 2020–2024. For each target date in the monthly series, the fusion process utilized the temporally closest available pair of GF-3 and Sentinel-1 images (typically within a ±5-day window) as input. This procedure produced a consistent data product with a spatial resolution of 5 m (inherited from GF-3) and a nominal monthly revisit frequency, resulting in a total of 60 successfully fused scenes over the five-year period.
To validate the accuracy of the fusion process, a self-consistency validation approach was employed. For each of the eight dates where concurrent GF-3 and Sentinel-1 acquisitions were available, the corresponding GF-3 image was treated as the reference truth. A fused image for that date was generated using the FSOM framework with the remaining temporal data and then compared against this withheld GF-3 reference. The pixel-level agreement between each fused image and its corresponding GF-3 reference was quantified using three standard quantitative metrics—the CC, the AAD, and the RMSE. These metrics collectively assess the strength of linear relationship and the magnitude of prediction errors. The performance of the FSOM framework across all eight validation dates is summarized in Figure 5.
Figure 5.
Comparison of fusion accuracy for eight scenarios observed with GF-3 during the research period. All three metrics including (a) the correlation coefficient (CC), (b) average absolute difference (AAD) and (c) root mean square error (RMSE) represent the upper boundary of prediction biases, because these eight predictions were produced using a prior or posterior GF-Sentinel pair that is the farthest temporal neighbor to the targeted date.
The performance of the FSDAF model, employed here as a baseline for comparison, exhibited considerable variation across the eight validation dates. Specifically, the CC ranged from 0.55 to 0.89, with an average of 0.767, indicating a moderate-to-strong pixel-value agreement but inconsistent performance temporally. The error metrics showed a similar spread, with an AAD from 0.99 to 1.99 with an average of 1.52 and an RMSE from 1.56 to 2.83 with an average of 2.17. The consistent elevation of the average RMSE above the average AAD suggests a non-Gaussian error distribution, confirming the presence of a limited number of outliers with relatively large errors.
These results correlate the fused results and the actual imagery, demonstrating that the model successfully reconstructed most spatial textures and details. We acknowledge that the sparse availability of GF-3 data—only eight usable scenes over the five-year study period—represents an inherent constraint of this work, as these images constitute the complete set of high-resolution SAR data accessible from the official platform for the study area and time period. This data limitation precludes a systematic statistical analysis of how fusion accuracy varies as a function of temporal distance to the nearest GF-3 acquisition, which would require a denser reference time series. Consequently, the observed variability in metrics likely reflects a combination of factors. For instance, the fusion model’s limitations in tracking abrupt surface changes, combined with the complex backscattering behavior of SAR data under varying hydrological conditions, likely contributed to these errors. Additional sources could include variations in input data quality and the varying temporal gaps between fusion target dates and available GF-3 references. This analysis highlights the need for the proposed FSOM framework, which is designed to better handle temporal non-linearity.
3.3. Accuracy of Water Maps
To evaluate the improvement in flood monitoring achieved by the FSOM framework, a comparative analysis of classification accuracy was conducted between water masks derived from the original Sentinel-1 SDWI and those from the fused SDWI time series. The validation dataset was based on high-confidence reference data generated through manual interpretation of corresponding Google Earth imagery, resulting in binary water/non-water masks for multiple dates across the study period.
As presented in Table 2, the classification using the original Sentinel-1 imagery from 2020 to 2024 served as the baseline. It yielded an OA exceeding 86.30% and a Kappa coefficient higher than 0.73, indicating a good agreement with the reference. The key limitation was a consistently low PA for water (above 73.18%), revealing significant omission errors. This is primarily attributed to the Sentinel-1 sensor’s coarser spatial resolution, which fails to adequately resolve small and fragmented water bodies within the wetland complex. The omission errors in detecting small or fragmented water bodies, such as seasonal ponds, may lead to an overestimation of habitat fragmentation and an incomplete understanding of hydrological connectivity, thereby affecting the validity of ecological conclusions derived from the data.
Table 2.
Sentinel-1 imagery used for assessing the classification accuracy of wetland coverage across five sample years, 2020 to 2024.
In contrast, the classification based on the FSOM-fused SDWI data demonstrated a marked improvement (Table 3). The OA increased to 90.23%, and the Kappa coefficients rose to 0.91. Most importantly, the PA of water was significantly increased to 90.03%, directly addressing the omission error problem of the baseline. Additionally, both producer’s and user’s accuracy for water bodies showed notable increases, reaching no lower than 90.03% and 91.71%, respectively, ensuring good reliability of the mapped water pixels. This improvement confirms that the enhanced spatial detail in the fused data enables more complete detection of small water features, leading to more accurate monthly flood extent maps.
Table 3.
Classification accuracy evaluation of wetland coverage in five sample years, 2020 to 2024, after spatiotemporal fusion.
4. Discussion
4.1. Spatiotemporal Changes of the Chen Lake Wetland
Analysis of the monthly water area time series derived from the FSOM framework revealed pronounced interannual variability and complex seasonal dynamics in the Chen Lake Wetland from 2020 to 2024 (Figure 6). The five-year monthly time series generated for Chen Lake Wetland provides insights relevant to an international understanding of wetland hydrology under combined climatic and anthropogenic pressure. The observed patterns—pronounced seasonality, substantial interannual variability, and detectable human modification—reflect dynamics documented in floodplain wetlands worldwide [5,7].
Figure 6.
Change in water area (km2) in the Chen Lake Wetland from 2020 to 2024.
At the interannual scale, substantial fluctuations in total annual water area were observed. The mean annual water area was highest in 2023 (617.03 km2) and lowest in 2022 (449.30 km2). The greatest within-year range (peak minus trough), indicating the most extreme seasonal fluctuation, was also recorded in 2023, with a range of 43.92 km2 between the monthly maximum (73.74 km2 in March) and minimum (30.63 km2 in October). A linear regression analysis of the annual total water area from 2020 to 2024 revealed a slight increasing trend of approximately 6.91 km2 per year; however, this trend was not statistically significant (p = 0.77, two-tailed t-test with n = 5; temporal autocorrelation was not considered due to the limited sample size). The exceptional hydrological fluctuations in 2023 (highest annual mean: 617.03 km2; greatest within-year range: 43.92 km2) coincided with a strong El Niño event, consistent with the established understanding of El Niño impacts on the Yangtze Basin precipitation [54,55]. This observation contributes to a growing body of literature documenting teleconnections between large-scale climate models and wetland hydrology across diverse geographic settings. However, given the limited temporal span of this study (2020–2024), any inferences regarding long-term climatic trends or climatological patterns should be interpreted with appropriate caution. The five-year record is sufficient to characterize interannual variability and detect the influence of specific climate events (e.g., the 2023 El Niño), but it is not of sufficient duration to establish climatic trends or disentangle multi-decadal climate signals from shorter-term variability.
Examining year-to-year changes in the monthly mean water area revealed distinct shifts in hydrological regimes. The mean monthly water area increased by 13.98 km2 from 2022 (37.44 km2) to 2023 (51.41 km2), representing a 37.3% increase. This substantial rise was followed by a decrease of 9.20 km2 from 2023 to 2024 (to 42.21 km2), an 18.0% reduction. These pronounced fluctuations suggest that the 2022–2024 period experienced the most extreme hydrological variations, potentially associated with unusual climate patterns (e.g., El Niño effects) and water management interventions (e.g., Three Gorges Reservoir operations).
The monthly surface water area of the Chen Lake Wetland from 2020 to 2024 exhibited dynamic variability across multiple temporal scales, as visualized in the complete time series (Figure 6). A significant seasonal cycle was consistently observed throughout the study period. The water area typically reached its annual minimum during the dry winter months (December–February). A gradual recovery began in spring (March–May), followed by a rapid expansion leading to the peak, which most frequently occurred in July–September. This peak lagged behind the peak of the rainy season (June–August) by approximately 1–2 months, a pattern evident in Figure 6. Notable deviations from this pattern, such as abrupt declines in October–November of certain years, were also recorded.
The high-resolution monthly flood time series (2020–2024) revealed pronounced interannual variability in the surface water area of Chen Lake Wetland. While a modest increasing trend (6.91 km2 per year) was observed over the five-year period, it was substantially overshadowed by year-to-year fluctuations (Figure 6). We posit that these dynamics arise from the complex interplay between regional climate forcing and anthropogenic water management, as the observed patterns cannot be explained by climate alone, given that the wetland is embedded within a managed hydrological system.
The monthly water area data illuminate the seasonal patterns underlying these interannual changes (Figure 6). In 2020, the water area peaked in August (70.93 km2) following heavy summer rainfall in the Han River Basin, with a secondary peak in October (61.20 km2), demonstrating the wetland’s rapid response to precipitation events. Substantial water storage carried over into 2021, as evidenced by elevated areas in January (59.94 km2) and June (51.31 km2), followed by a sharp decline in November (27.12 km2)—a pattern that reflects the wetland’s retention capacity despite uneven rainfall distribution.
The year 2022 exhibited relatively subdued seasonal variation, with most monthly values ranging between 30 and 45 km2, reflecting regionally dry conditions. Notably, this relative stability during a drought year may be attributable to compensatory releases from upstream reservoirs, such as the Three Gorges Reservoir, highlighting the role of anthropogenic buffering against climatic extremes.
In stark contrast, 2023 displayed an anomalous seasonal pattern, with exceptionally high water levels persisting from January through March (peaking at 73.74 km2 in March), followed by a progressive decline through summer and autumn. This unusual early-year high-water period coincided with a strong El Niño event, which is known to alter precipitation patterns in the Yangtze River Basin [54,55]. The exceptional high water levels and dramatic intra-annual range in 2023 likely resulted from a combination of climatic anomalies and managed releases, including potential carryover storage from late 2022. This coupled signal illustrates a challenge increasingly recognized in international wetland research: disentangling climatic and anthropogenic drivers requires sustained high-resolution monitoring coupled with ancillary data on water management operations. However, these ancillary data were not available for the Chen Lake Wetland during the study period.
The 2024 seasonal pattern showed a recovery toward more typical conditions, with a summer peak in September (50.30 km2) and elevated levels in December (54.33 km2), potentially reflecting reservoir refilling operations. Reported artificial rainfall enhancement and targeted reservoir operations during this period likely played a role in moderating the impacts of the recorded drought conditions, underscoring the active human role in the system’s water budget.
This synergy highlights the challenge of disentangling natural and anthropogenic drivers but also underscores the value of continuous monitoring. For the international wetland science community, our results demonstrate that even with a relatively short monitoring record, valuable insights can be gained about system behavior, sensitivity to climate drivers, and the magnitude of human modification. However, we emphasize that the five-year timeframe of this study, while sufficient for method validation and characterization of interannual variability, is not adequate for drawing definitive conclusions about the long-term climatological influences on wetland hydrology. Extended time series spanning decades are necessary to separate cyclic climate variability from secular trends associated with climate change. The value of this study lies in demonstrating a monitoring capability that, if sustained over longer periods, can contribute to such long-term analyses. Our monthly fused SAR-derived series provides a detailed empirical record against which future climate projections and management scenarios can be evaluated, offering an important tool for sustainable wetland management under increasing climate variability.
4.2. Advantages of Spatiotemporal Fusion
Spatiotemporal fusion technology offers a viable solution to integrate complementary observations from multiple satellite sensors, thereby mitigating the inherent trade-off between temporal and spatial resolution. Although this technique has been extensively developed and applied in optical remote sensing, its adaptation to Synthetic Aperture Radar (SAR) data—particularly for dynamic wetland flood monitoring—remains limited. To address this gap, this study proposes an improved SAR-based water area extraction framework named FSOM. This FSOM framework incorporates key optimizations tailored for SAR-based flood monitoring: First, it enhances the FSDAF model to fuse multi-source SAR data (such as GF-3 and Sentinel-1 satellite data), synthesizing a continuous time-series image sequence with enhanced spatiotemporal resolution. Second, from the fused imagery, a robust SDWI is computed to maximize the separability between water and non-water targets under varying environmental conditions. Third, an adaptive OTSU thresholding algorithm is applied to the SDWI imagery to ensure consistent and accurate binary water classification across the entire time series. Finally, the FSOM was applied to monitor the monthly flood extent changes in the Chen Lake Wetland from 2020 to 2024, demonstrating its capability for long-term operational monitoring.
The primary contribution of this study lies in its development and validation of the FSOM framework, which effectively bridges the spatiotemporal resolution gap for SAR-based wetland flood monitoring. While the fusion of Sentinel-1 and GF-3 data is conceptually straightforward, the key innovation lies in the adaptation and optimization of the FSDAF model to handle SAR-specific challenges, such as speckle noise and non-linear backscatter changes during flood events. This enables the generation of a consistent high-resolution (5 m) monthly time series that preserves temporal fidelity. Compared to relying solely on either infrequent high-resolution (GF-3) or frequent coarse-resolution (Sentinel-1) observations—approaches fundamentally limited for capturing rapid fine-scale flood dynamics—the FSOM product synthesizes their complementary advantages. More importantly, the FSOM-derived water maps achieved a significant improvement in producer’s accuracy for water bodies compared to classifications from the original Sentinel-1 data, directly translating the spatial enhancement into more reliable flood extent monitoring. Thus, the study’s contribution extends beyond fusion itself to deliver a validated operationalizable data product that enables more detailed tracking of monthly wetland hydrological changes than was previously possible with individual data sources. The outcomes can contribute to the long-term monitoring needed for adaptive water level management, informed flood control and disaster mitigation, and biodiversity conservation within this wetland ecosystem of international importance.
In summary, this study demonstrates that strategic integration of multi-source SAR data through the FSOM framework helps mitigate the spatiotemporal resolution trade-off that has long constrained wetland flood monitoring. The key advancement lies not in the development of an entirely new algorithm but in the establishment of a coherent validated processing chain that adapts existing methods—originally designed for optical data—to the specific characteristics and challenges of multi-sensor SAR imagery. This contribution addresses a recognized gap in the recent literature: while spatiotemporal fusion has been extensively explored for optical remote sensing, its application to SAR data for wetland monitoring remains notably underdeveloped [22,56].
The FSOM framework demonstrated a high performance level in extracting water bodies from the fused SAR time series. As summarized in Table 3, the classification using FSOM-derived data achieved an overall accuracy (OA) higher than 90.23% and a Kappa coefficient above 0.91 across the validation period. Critically, the PA for the water class consistently exceeded 90.03%, representing an improvement over the baseline classification using original Sentinel-1 data alone. This significant increase in PA directly indicates a major reduction in omission errors, meaning far fewer actual water pixels were missed. More importantly, both producer’s and user’s accuracy for water bodies showed notable increases, reaching no lower than 90.03% and 91.71%, respectively, ensuring good reliability of the mapped water pixels. This marked enhancement in classification accuracy, particularly for the water class, can be attributed to the dual advantages of the FSOM data product: its enhanced spatial resolution enabled the detection and precise delineation of small and fragmented water bodies that were sub-pixel or mixed in the native Sentinel-1 imagery, while its maintained temporal consistency ensured that the index-based water classifier performed robustly across different seasons. Thus, the FSOM framework translates its spatiotemporal enhancements into quantitatively superior and more reliable flood extent maps.
More importantly, the FSOM framework demonstrates distinct advantages in monitoring small water bodies compared to using Sentinel-1 data alone. For a quantitative evaluation of this improvement, we conducted a focused analysis on a small heterogeneous region in the southwestern Chen Lake Wetland on 5 October 2020 (Figure 7). While all three data sources (original GF-3, Sentinel-1, and fused SDWI) show consistent spatial patterns for major water features, their performance diverges markedly in classifying small water bodies. Classification based on Sentinel-1 data yielded limited capability in classifying small water bodies (OA = 70.51%, Kappa = 0.41), with substantial omission and commission errors (the producer’s accuracy for water was 70.92% and user’s accuracy was 66.98%). This performance limitation primarily stems from the resolution constraints, which causes mixed pixels containing both water and land, confounding accurate classification. In contrast, classification using the FSOM-fused data achieved significantly higher accuracy (OA = 84.30%, Kappa = 0.69) (Table 4). Crucially, the producer’s accuracy for water surged to 91.39% (a ~20.5 percentage point increase), representing a dramatic reduction in omission errors. This enhancement directly stems from the improved spatial resolution, which mitigates the mixed-pixel problem and enables the reliable detection of small water bodies.
Figure 7.
Spatial details of small water bodies in the southwest part of Chen Lake Wetland on 5 October 2020: (a) GF-3 Synthetic Aperture Radar Wetland Detection Index (SDWI); (b) fused SDWI from the Flexible Spatiotemporal Data Fusion model; and (c) Sentinel-1 SDWI.
Table 4.
Classification accuracy assessment of small water bodies in the southwest region of Chen Lake Wetland.
Quantitative correlation analysis further corroborates these findings. The fused data exhibited a strong pixel-value correlation with the GF-3 reference (R2 = 0.80), substantially outperforming the Sentinel-1 data (R2 = 0.57). The fused image exhibited a higher RMSE (2.21) compared to the original Sentinel-1 data (1.95). The MAE of the fused image was 1.86, slightly lower than its RMSE, indicating that the error distribution contains some larger deviations—likely occurring at sharp transitions between water and land—that disproportionately influence the RMSE. The MB was −1.82, revealing a systematic tendency for the fused image to underestimate the SDWI values relative to the GF-3 reference.
This underestimation can be attributed to two interrelated factors. First, the inherent spatial resolution difference between the input sensors (Sentinel-1 10 m vs. GF-3 5 m) means that fine-scale water features present in the GF-3 reference may be partially smoothed or averaged during the fusion process, leading to lower SDWI values in some areas, particularly along water–land boundaries. Second, the ±5-day interval between GF-3 and Sentinel-1 acquisitions introduces inherent discrepancies. Flood events are dynamic, and subtle changes in water level, surface roughness, or inundation extent within this window create unavoidable differences between the high-resolution reference (GF-3) and frequent input data (Sentinel-1), contributing to the observed bias and MAE. The self-consistency validation framework, while useful for assessing spatial reconstruction fidelity, cannot fully isolate these temporal uncertainties from algorithmic errors. Consequently, the reported bias and MAE should be interpreted as upper-bound estimates of the fusion error under the constraint of asynchronous observations.
Despite these limitations, the fused product achieves a substantially higher coefficient of determination (R2 = 0.80) compared to Sentinel-1 alone (R2 = 0.57), demonstrating superior explanatory power and stronger agreement with the reference in terms of spatial pattern reconstruction. The combination of a systematic bias and a moderate MAE suggests that while the fusion process introduces some radiometric distortion, it effectively enhances the spatial detail. For flood extent monitoring, where the accurate delineation of water bodies is prioritized over pixel-level precision, the trade-off between an increase in RMSE and a significant gain in explained variance is considered acceptable. These results collectively confirm that the FSOM framework successfully synthesizes spatiotemporal information from multi-resolution SAR sensors, producing a fused product that better approximates the spatial detail of high-resolution GF-3 imagery while maintaining temporal consistency.
These findings align with previous studies of spatiotemporal fusion performance in dynamic environments. Zhu et al. noted that FSDAF, while effective for handling land cover changes, can introduce artifacts at class boundaries due to its reliance on endmember spectra and thin plate spline interpolation [44]. Our results extend this understanding to SAR applications, demonstrating similar boundary effects but also confirming that the ecological utility of the resulting products—particularly for water body detection—remains robust despite these limitations.
The five-year monthly time series generated for the Chen Lake Wetland reveals hydrological complexity that would be unattainable from either sensor alone. The data captured both predictable seasonal patterns (summer peaks following monsoon rainfall, winter recessions) and substantial interannual variability that reflects the interplay of climatic drivers and anthropogenic interventions. The exceptional fluctuations observed in 2023—the highest annual mean water area (617.03 km2) and highest within-year range (43.92 km2)—coincided with a strong El Niño event, consistent with the established understanding of ENSO impacts on Yangtze Basin precipitation [54,55]. However, the prolonged high-water period extending from January through March 2023 cannot be explained by climate alone; it likely reflects carryover storage from late 2022 combined with managed reservoir releases, highlighting the coupled nature of hydrological controls in this system.
This empirical record provides several insights relevant to the international wetland science community. First, it demonstrates that, even in heavily managed systems, climate signals remain detectable in hydrological records when monitoring is sufficiently detailed and sustained. Second, the study quantifies the scale of human modification: between 2023 and 2024, the wetland’s mean monthly water area decreased by 9.20 km2. This change occurred against a backdrop of ongoing climate variability, indicating reservoir management can independently regulate wetland water levels beyond natural drivers. Third, the improved detection of small water bodies reveals landscape heterogeneity that is critical for understanding habitat availability but is typically lost in lower-resolution assessments. These findings contribute to broader discussions about the resilience of wetland ecosystems under combined climatic and anthropogenic pressure [7,8].
4.3. Limitations and Future Research
This study demonstrates the successful adaptation of the FSOM framework to fuse multi-resolution SAR datasets for wetland flood monitoring. The key innovation lies not in fundamental algorithm modification but in establishing a complete processing workflow that effectively addresses the persistent spatiotemporal resolution trade-off in SAR-based flood extent monitoring. Specifically, the FSOM framework consists of three steps: spatiotemporal fusion (FSDAF), water index calculation (SDWI), and automated classification (binary raster by automatic threshold). The FSOM framework was applied to generate a monthly flood extent dataset with a resolution of 5 m in the Chen Lake Wetland from 2020 to 2024. By leveraging FSDAF’s capacity to integrate temporal information from dense Sentinel-1 observations with spatial details from occasional GF-3 acquisitions, the FSOM framework generates synthetic imagery that simultaneously maintains high temporal frequency and fine spatial resolution. The generated flood extent maps demonstrate higher accuracy compared to traditional methods. This enhanced monitoring capability enables more precise quantification of wetland hydrological dynamics, particularly wetland flood extent. These datasets can support informed decision-making for sustainable water management, including flood control, biodiversity conservation, and climate adaptation strategies in wetland ecosystems.
Despite its demonstrated utility for monitoring the Chen Lake Wetland, the FSOM framework is subject to several inherent limitations that point to valuable directions for future work.
First, the fusion core relies on the FSDAF model, which was originally designed for the linear blending of optical reflectance. While effective in this application, its adaptation to SAR backscatter—which involves more complex non-linear interactions with surface properties—remains an area for methodological refinement. Future fusion algorithms could be developed from first principles to explicitly account for SAR physics, potentially improving fidelity during rapid backscatter changes associated with flooding or vegetation growth. Exploring data-driven deep learning methods that can directly learn spatiotemporal relationships from multi-sensor SAR stacks may also offer a promising alternative to overcome some limitations of traditional model-based fusion.
Second, the quality of the fused product is ultimately constrained by the information content of the input data. Sentinel-1’s spatial resolution (~10 m) sets a fundamental limit on the detectable size of water features; sub-pixel water bodies cannot be fully resolved, regardless of the fusion algorithm’s sophistication. Integrating data from future SAR missions with higher spatial and temporal resolution (e.g., NASA-ISRO NISAR) will naturally enhance such frameworks.
Third, the ±5-day temporal mismatch between GF-3 and Sentinel-1 acquisitions represents an inherent constraint of this multi-sensor fusion approach. In a dynamic floodplain wetland where the water extent can change rapidly in response to precipitation, evapotranspiration, or managed water releases, such temporal offsets may introduce uncertainties into the fused products. Further, the self-consistency validation framework, while useful for assessing spatial reconstruction fidelity, cannot fully isolate this temporal uncertainty from algorithmic errors. Resolving these effects would require either perfectly coincident multi-sensor acquisitions or independent high-temporal-resolution validation data (e.g., daily water level records or gauge station measurements), which were not available for the Chen Lake Wetland during the study period. Future research should prioritize the integration of such in situ hydrological measurements or leverage emerging SAR with shorter revisit intervals to better constrain this uncertainty and further validate the robustness of the FSOM framework across diverse wetland conditions.
Fourth, the sparse availability of GF-3 data (only eight scenes over five years) represents an inherent constraint of this study. While we validated fusion performance at these acquisition dates, we cannot systematically characterize how the accuracy degrades with the temporal distance to the reference imagery. The observed CC range of 0.55–0.89 likely reflects, in part, the varying temporal gaps between the target dates and available GF-3 references, but the limited sample size precludes robust statistical analysis of this relationship. Future studies with access to denser high-resolution SAR time series should investigate this temporal dependency to establish quantitative guidelines for operational implementation.
Finally, a persistent challenge in multi-sensor SAR fusion is the difference in polarization configurations between Sentinel-1 (VV/VH) and GF-3 (HH/HV). Although radiometric normalization harmonizes the data scales, it cannot fully reconcile the distinct scattering mechanisms captured by co- and cross-polarized signals. This introduces uncertainty in heterogeneous vegetation-influenced areas. Future research should investigate advanced polarization normalization or translation models to improve the physical consistency of cross-polarization fused datasets.
5. Conclusions
This study effectively mitigates the critical spatiotemporal resolution trade-off in synthetic aperture radar (SAR)-based wetland flood monitoring by developing, applying, and validating the Fusion Synthetic Aperture Radar (FSOM) framework. FSOM integrates spatiotemporal fusion (FSDAF), Sentinel-1 Dual-Polarized Water Index (SDWI), and automated classification techniques into a seamless workflow. This enables the generation of consistent high-resolution flood extent time series from multi-sensor SAR data (Sentinel-1 and GF-3), advancing both theoretical and practical developments in wetland flood monitoring.
The primary scientific contributions of this study are threefold: demonstrating the feasibility of applying spatiotemporal fusion concepts from the optical domain to multi-source SAR data; quantifying the performance gains achievable through such integrated techniques; and comprehensively and empirically elucidating the capabilities and limitations of the FSOM framework within dynamic wetland environments.
The FSOM framework enables several key advancements in flood monitoring processes: First, by integrating frequent Sentinel-1 observations with high-resolution GF-3 acquisitions, the method generates monthly flood extent time series at 5 m resolution—a data product unattainable from either sensor alone. This capability fundamentally enhances our ability to observe and understand flood dynamics across multiple temporal scales.
Second, the quantitative validation provides critical insights into the performance characteristics of SAR-based spatiotemporal fusion. The fused data showed a stronger agreement with high-resolution GF-3 benchmarks (R2 = 0.90) than original Sentinel-1 data (R2 = 0.85). This demonstrates that the FSOM framework can recover approximately 90% of the spatial variance present in high-resolution reference imagery, establishing an empirical benchmark for fusion performance expectations. Across the entire Chen Lake wetland area, classification based on FSOM data achieved an overall accuracy exceeding 90.23% (Kappa greater than 0.91), significantly outperforming classification using Sentinel-1 data (86.30% OA, Kappa greater than 0.73). Crucially, the producer’s accuracy for water improved from 73.18% to 90.03%, demonstrating a substantial enhancement in water body classification precision. This indicates a significant reduction in omission errors, enabling the reliable detection of small and fragmented water bodies crucial for wetland studies.
Third, and most significantly for ecological applications, the FSOM framework demonstrates marked superiority in detecting small and fragmented water bodies—features critically important for habitat assessment but typically obscured in coarser-resolution data. In a representative heterogeneous wetland area, classification using FSOM-derived data achieved 84.30% overall accuracy (Kappa = 0.69), substantially outperforming Sentinel-1-based classification (70.51% OA, Kappa = 0.41). Critically, the producer’s accuracy for water bodies increased from 70.92% to 91.39%, representing a 20.47 percentage point reduction in omission errors. This dramatic improvement directly addresses a fundamental limitation of moderate-resolution SAR monitoring: the inability to resolve small water bodies due to mixed-pixel effects. By mitigating this constraint, FSOM enables more accurate characterization of habitat availability, hydrological connectivity, and landscape heterogeneity—advancing our understanding of how flood patterns influence wetland ecological functions.
Fourth, the five-year monthly time series generated for the Chen Lake wetland (2020–2024) reveals complex hydrological dynamics, a level of high-resolution long-term monitoring previously difficult to achieve. The data indicate pronounced seasonal patterns (e.g., summer peaks following monsoon rainfall, winter recessions), considerable interannual variability (with 2023 exhibiting the most pronounced fluctuations), and potential responses to both climatic drivers (e.g., El Niño impacts) and anthropogenic interventions (e.g., reservoir operations). This empirical record offers enhanced insight into the coupled natural–human influences on wetland hydrology, contributing to a better understanding of wetland ecosystem responses to environmental change through sustained high-resolution monitoring.
In conclusion, the FSOM framework offers a practical and transferable approach toward operational high-resolution SAR flood monitoring in wetlands. This framework systematically mitigates the trade-off between spatial and temporal resolution, achieving notable improvements in detecting small water bodies. It provides scientists and resource managers with a powerful method to obtain detailed inundation data necessary for sustainable ecosystem management, flood risk assessment, and evaluating climate change impacts on these vital landscapes.
Beyond its methodological contributions, the FSOM framework and its application to the Chen Lake Wetland yield insights with relevance for the international wetland science community, global monitoring efforts, and environmental policy frameworks. By enabling consistent high-resolution flood mapping across diverse SAR data sources, FSOM addresses a recognized gap in spatiotemporal fusion for SAR-based remote sensing. This capability is particularly pertinent to global initiatives such as the Ramsar Convention on Wetlands, the Kunming-Montreal Global Biodiversity Framework, and the UN Sustainable Development Goals (SDGs). The ability to generate long-term high-fidelity flood records in data-sparse regions can support evidence-based decision-making for wetland conservation, climate adaptation planning, and transboundary water resource management. In doing so, FSOM contributes—at a modest but meaningful scale—to addressing pressing global challenges at the intersection of water security, biodiversity loss, and climate change.
Author Contributions
Conceptualization, C.G. and S.J.; Methodology, C.G. and Y.W.; Software, C.G. and Y.Z.; Validation, C.G.; Formal analysis, C.G.; Investigation, C.G.; Resources, C.G. and N.C.; Data curation, C.G. and Y.D.; Writing—original draft, C.G. and C.S.; Writing—review & editing, C.G. and C.S.; Visualization, C.G.; Supervision, C.G. and C.Z.; Project administration, C.G.; Funding acquisition, C.G. All authors have read and agreed to the published version of the manuscript.
Funding
This work was funded in part by several sources including the Natural Science Foundation of Hubei Province grant 2022CFB689, the Hubei Key Laboratory of Complex Shale Oil and Gas Geology and Development in Southern China grant CGD-202407, the Hubei Key Laboratory of Waterlogging Disaster and Agricultural Use of Wetland grant KFG202408, the Qinghai Province Basic Research Program Project grant 2024-ZJ-904, and the Science and Technology Program of Tibet Autonomous Region under grant XZ202402ZD0001.
Institutional Review Board Statement
Not applicable.
Informed Consent Statement
Not applicable.
Data Availability Statement
Restrictions apply to the availability of these data. Data were obtained from the China Centre for Resources Satellite Data and Application and are available at https://data.cresda.cn/, accessed on 17 September 2025, with the permission of the China Centre for Resources Satellite Data and Application.
Acknowledgments
We thank the China Centre for Resources Satellite Data and Application for providing the GaoFen-3 (GF-3) satellite data for this study.
Conflicts of Interest
The authors declare no conflict of interest.
References
- Kovács, G.M.; Horion, S.; Fensholt, R. Characterizing ecosystem change in wetlands using dense earth observation time series. Remote Sens. Environ. 2022, 281, 113267. [Google Scholar] [CrossRef] [Scilit]
- Mitsch, W.J.; Bernal, B.; Nahlik, A.M.; Mander, Ü.; Zhang, L.; Anderson, C.J.; Jørgensen, S.E.; Brix, H. Wetlands, carbon, and climate change. Landsc. Ecol. 2013, 28, 583–597. [Google Scholar] [CrossRef] [Scilit]
- Wang, M.; Mao, D.; Wang, Y.; Xiao, X.; Xiang, H.; Feng, K.; Luo, L.; Jia, M.; Song, K.; Wang, Z. Wetland mapping in East Asia by two-stage object-based Random Forest and hierarchical decision tree algorithms on Sentinel-1/2 images. Remote Sens. Environ. 2023, 297, 113793. [Google Scholar] [CrossRef] [Scilit]
- Quesnelle, P.E.; Fahrig, L.; Lindsay, K.E. Effects of habitat loss, habitat configuration and matrix composition on declining wetland species. Biol. Conserv. 2013, 160, 200–208. [Google Scholar] [CrossRef] [Scilit]
- Mohammadi, A.; Costelloe, J.F.; Ryu, D. Application of time series of remotely sensed normalized difference water, vegetation and moisture indices in characterizing flood dynamics of large-scale arid zone floodplains. Remote Sens. Environ. 2017, 190, 70–82. [Google Scholar] [CrossRef] [Scilit]
- Alonso, A.; Muñoz-Carpena, R.; Kaplan, D. Coupling high-resolution field monitoring and MODIS for reconstructing wetland historical hydroperiod at a high temporal frequency. Remote Sens. Environ. 2020, 247, 111807. [Google Scholar] [CrossRef] [Scilit]
- Jia, M.; Mao, D.; Wang, Z.; Ren, C.; Zhu, Q.; Li, X.; Zhang, Y. Tracking long-term floodplain wetland changes: A case study in the China side of the Amur River Basin. Int. J. Appl. Earth Obs. Geoinf. 2020, 92, 102185. [Google Scholar] [CrossRef] [Scilit]
- Terrado, M.; Acuña, V.; Ennaanay, D.; Tallis, H.; Sabater, S. Impact of climate extremes on hydrological ecosystem services in a heavily humanized Mediterranean basin. Ecol. Indic. 2014, 37, 199–209. [Google Scholar] [CrossRef] [Scilit]
- Londe, D.W.; Davis, C.A.; Loss, S.R.; Robertson, E.P.; Haukos, D.A.; Hovick, T.J. Climate change causes declines and greater extremes in wetland inundation in a region important for wetland birds. Ecol. Appl. 2024, 34, e2930. [Google Scholar] [CrossRef] [Scilit] [PubMed]
- Chen, Y.; Zhang, J.; Zhang, Y.; Deng, X.; Ao, P.; Gu, D.; Zhang, B.; Damba, I.; Navaandorj, I.; Zhao, Q.; et al. Spatiotemporal diversity patterns and homogenization signs: Ecological responses and conservation strategies for waterbird communities in the Yangtze River floodplain. Biol. Conserv. 2025, 308, 111244. [Google Scholar] [CrossRef] [Scilit]
- Zhang, Z.; Xu, N.; Li, Y.; Li, Y. Sub-continental-scale mapping of tidal wetland composition for East Asia: A novel algorithm integrating satellite tide-level and phenological features. Remote Sens. Environ. 2022, 269, 112799. [Google Scholar] [CrossRef] [Scilit]
- Fluet-Chouinard, E.; Stocker, B.D.; Zhang, Z.; Malhotra, A.; Melton, J.R.; Poulter, B.; Kaplan, J.O.; Goldewijk, K.K.; Siebert, S.; Minayeva, T. Extensive global wetland loss over the past three centuries. Nature 2023, 614, 281–286. [Google Scholar] [CrossRef] [Scilit]
- Díaz-Reviriego, I.; Turnhout, E.; Beck, S. Participation and inclusiveness in the intergovernmental science–policy platform on biodiversity and ecosystem services. Nat. Sustain. 2019, 2, 457–464. [Google Scholar] [CrossRef] [Scilit]
- Ludwig, C.; Walli, A.; Schleicher, C.; Weichselbaum, J.; Riffler, M. A highly automated algorithm for wetland detection using multi-temporal optical satellite data. Remote Sens. Environ. 2019, 224, 333–351. [Google Scholar] [CrossRef] [Scilit]
- Poff, N.L. Beyond the natural flow regime? Broadening the hydro-ecological foundation to meet environmental flows challenges in a non-stationary world. Freshw. Biol. 2018, 63, 1011–1021. [Google Scholar] [CrossRef] [Scilit]
- Schaffer-Smith, D.; Swenson, J.J.; Barbaree, B.; Reiter, M.E. Three decades of Landsat-derived spring surface water dynamics in an agricultural wetland mosaic; Implications for migratory shorebirds. Remote Sens. Environ. 2017, 193, 180–192. [Google Scholar] [CrossRef] [Scilit]
- Huang, A.; Liu, X.; Peng, W.; Dong, F.; Han, Z.; Du, F.; Ma, B.; Wang, W. Spatiotemporal heterogeneity of inundation pattern of floodplain lake wetlands and impact on wetland vegetation. Sci. Total Environ. 2023, 905, 167831. [Google Scholar] [CrossRef] [Scilit]
- Tong, X.; Luo, X.; Liu, S.; Xie, H.; Chao, W.; Liu, S.; Liu, S.; Makhinov, A.; Makhinova, A.; Jiang, Y. An approach for flood monitoring by the combined use of Landsat 8 optical imagery and COSMO-SkyMed radar imagery. ISPRS J. Photogramm. Remote Sens. 2018, 136, 144–153. [Google Scholar]
- Laba, M.; Blair, B.; Downs, R.; Monger, B.; Philpot, W.; Smith, S.; Sullivan, P.; Baveye, P.C. Use of textural measurements to map invasive wetland plants in the Hudson River National Estuarine Research Reserve with IKONOS satellite imagery. Remote Sens. Environ. 2010, 114, 876–886. [Google Scholar] [CrossRef] [Scilit]
- Huang, C.; Chen, Y.; Zhang, S.; Wu, J. Detecting, extracting, and monitoring surface water from space using optical sensors: A review. Rev. Geophys. 2018, 56, 333–360. [Google Scholar] [CrossRef] [Scilit]
- Li, X.; Ling, F.; Cai, X.; Ge, Y.; Li, X.; Yin, Z.; Shang, C.; Jia, X.; Du, Y. Mapping water bodies under cloud cover using remotely sensed optical images and a spatiotemporal dependence model. Int. J. Appl. Earth Obs. Geoinf. 2021, 103, 102470. [Google Scholar] [CrossRef] [Scilit]
- Zhao, B.; Sui, H.; Liu, J.; Shi, W.; Wang, W.; Xu, C.; Wang, J. Flood inundation monitoring using multi-source satellite imagery: A knowledge transfer strategy for heterogeneous image change detection. Remote Sens. Environ. 2024, 314, 114373. [Google Scholar] [CrossRef] [Scilit]
- Martinis, S.; Groth, S.; Wieland, M.; Knopp, L.; Rättich, M. Towards a global seasonal and permanent reference water product from Sentinel-1/2 data for improved flood mapping. Remote Sens. Environ. 2022, 278, 113077. [Google Scholar] [CrossRef] [Scilit]
- Zhang, H.; Lin, H.; Wang, Y. A new scheme for urban impervious surface classification from SAR images. ISPRS J. Photogramm. Remote Sens. 2018, 139, 103–118. [Google Scholar] [CrossRef] [Scilit]
- Zhang, Y.; Liu, P.; Chen, L.; Xu, M.; Guo, X.; Zhao, L. A new multi-source remote sensing image sample dataset with high resolution for flood area extraction: GF-FloodNet. Int. J. Digit. Earth 2023, 16, 2522–2554. [Google Scholar] [CrossRef] [Scilit]
- Martinis, S.; Kersten, J.; Twele, A. A fully automated TerraSAR-X based flood service. ISPRS J. Photogramm. Remote Sens. 2015, 104, 203–212. [Google Scholar] [CrossRef] [Scilit]
- Zeng, J.; Long, D.; Zhang, Y.; Ryu, D.; Wigneron, J.-P.; Huang, Q. Emerging remote sensing techniques for hydrological applications. Remote Sens. Environ. 2026, 332, 115060. [Google Scholar] [CrossRef] [Scilit]
- Chen, F.; Zhang, M.; Zhao, H.; Guan, W.; Yang, A. Pakistan’s 2022 floods: Spatial distribution, causes and future trends from Sentinel-1 SAR observations. Remote Sens. Environ. 2024, 304, 114055. [Google Scholar] [CrossRef] [Scilit]
- Zhou, J.; Chen, J.; Chen, X.; Zhu, X.; Qiu, Y.; Song, H.; Rao, Y.; Zhang, C.; Cao, X.; Cui, X. Sensitivity of six typical spatiotemporal fusion methods to different influential factors: A comparative study for a normalized difference vegetation index time series reconstruction. Remote Sens. Environ. 2021, 252, 112130. [Google Scholar] [CrossRef] [Scilit]
- Xu, C.; Du, X.; Yan, Z.; Zhu, J.; Xu, S.; Fan, X. VSDF: A variation-based spatiotemporal data fusion method. Remote Sens. Environ. 2022, 283, 113309. [Google Scholar] [CrossRef] [Scilit]
- Michishita, R.; Chen, L.; Chen, J.; Zhu, X.; Xu, B. Spatiotemporal reflectance blending in a wetland environment. Int. J. Digit. Earth 2015, 8, 364–382. [Google Scholar] [CrossRef] [Scilit]
- Zhao, Y.; Huang, B.; Song, H. A robust adaptive spatial and temporal image fusion model for complex land surface changes. Remote Sens. Environ. 2018, 208, 42–62. [Google Scholar] [CrossRef] [Scilit]
- Chen, B.; Chen, L.; Huang, B.; Michishita, R.; Xu, B. Dynamic monitoring of the Poyang Lake wetland by integrating Landsat and MODIS observations. ISPRS J. Photogramm. Remote Sens. 2018, 139, 75–87. [Google Scholar] [CrossRef] [Scilit]
- Ma, Y.; Wei, J.; Tang, W.; Tang, R. Explicit and stepwise models for spatiotemporal fusion of remote sensing images with deep neural networks. Int. J. Appl. Earth Obs. Geoinf. 2021, 105, 102611. [Google Scholar] [CrossRef] [Scilit]
- Wang, S.; Wang, C.; Zhang, C.; Xue, J.; Wang, P.; Wang, X.; Wang, W.; Zhang, X.; Li, W.; Huang, G.; et al. A classification-based spatiotemporal adaptive fusion model for the evaluation of remotely sensed evapotranspiration in heterogeneous irrigated agricultural area. Remote Sens. Environ. 2022, 273, 112962. [Google Scholar] [CrossRef] [Scilit]
- Pulvirenti, L.; Squicciarino, G.; Cenci, L.; Ferraris, L.; Virelli, M.; Candela, L.; Puca, S. Continuous flood monitoring using on-demand SAR data acquired with different geometries: Methodology and test on COSMO-SkyMed images. ISPRS J. Photogramm. Remote Sens. 2025, 225, 382–401. [Google Scholar] [CrossRef] [Scilit]
- Weng, Q.; Fu, P.; Gao, F. Generating daily land surface temperature at Landsat resolution by fusing Landsat and MODIS data. Remote Sens. Environ. 2014, 145, 55–67. [Google Scholar] [CrossRef] [Scilit]
- Mahdianpari, M.; Rezaee, M.; Zhang, Y.; Salehi, B. Wetland classification using deep convolutional neural network. In Proceedings of the IGARSS 2018-2018 IEEE International Geoscience and Remote Sensing Symposium, Valencia, Spain, 22–27 July 2018; IEEE: New York, NY, USA, 2018; pp. 9249–9252. [Google Scholar]
- Liu, Q.; Meng, X.; Shao, F.; Li, S. PSTAF-GAN: Progressive spatio-temporal attention fusion method based on generative adversarial network. IEEE Trans. Geosci. Remote Sens. 2022, 60, 5408513. [Google Scholar] [CrossRef] [Scilit]
- Song, H.; Liu, Q.; Wang, G.; Hang, R.; Huang, B. Spatiotemporal satellite image fusion using deep convolutional neural networks. IEEE J. Sel. Top. Appl. Earth Obs. Remote Sens. 2018, 11, 821–829. [Google Scholar] [CrossRef] [Scilit]
- Shang, C.; Li, X.; Yin, Z.; Li, X.; Wang, L.; Zhang, Y.; Du, Y.; Ling, F. Spatiotemporal reflectance fusion using a generative adversarial network. IEEE Trans. Geosci. Remote Sens. 2021, 60, 5400915. [Google Scholar] [CrossRef] [Scilit]
- Shang, C.; Li, X.; Foody, G.M.; Du, Y.; Ling, F. Superresolution land cover mapping using a generative adversarial network. IEEE Geosci. Remote Sens. Lett. 2020, 19, 6000105. [Google Scholar] [CrossRef] [Scilit]
- Zhao, J.; Xiao, P.; Dong, Y.; Geiß, C.; Zhong, Y.; Taubenböck, H. Large-scale mapping of water bodies across sensors using unsupervised deep learning. Remote Sens. Environ. 2025, 328, 114877. [Google Scholar] [CrossRef] [Scilit]
- Zhu, X.; Helmer, E.H.; Gao, F.; Liu, D.; Chen, J.; Lefsky, M.A. A flexible spatiotemporal method for fusing satellite images with different resolutions. Remote Sens. Environ. 2016, 172, 165–177. [Google Scholar] [CrossRef] [Scilit]
- Chini, M.; Hostache, R.; Giustarini, L.; Matgen, P. A hierarchical split-based approach for parametric thresholding of SAR images: Flood inundation as a test case. IEEE Trans. Geosci. Remote Sens. 2017, 55, 6975–6988. [Google Scholar] [CrossRef] [Scilit]
- Zheng, H.; Li, X.; Wan, J.; Xu, M.; Liu, S.; Yasir, M. Automatic coastline extraction based on the improved instantaneous waterline extraction method and correction criteria using SAR imagery. Sustainability 2023, 15, 7199. [Google Scholar] [CrossRef] [Scilit]
- Wu, R.; Liu, G.; Bao, X.; Lv, J.; Shama, A.; Zhang, B.; Mao, W.; Chen, J.; Yang, Z.; Zhang, R. Eliminating geometric distortion with dual-orbit Sentinel-1 SAR fusion for accurate glacial lake extraction in Southeast Tibet Plateau. Int. J. Appl. Earth Obs. Geoinf. 2025, 136, 104329. [Google Scholar] [CrossRef] [Scilit]
- Yadav, R.; Nascetti, A.; Azizpour, H.; Ban, Y. Unsupervised flood detection on SAR time series using variational autoencoder. Int. J. Appl. Earth Obs. Geoinf. 2024, 126, 103635. [Google Scholar] [CrossRef] [Scilit]
- Zhou, S.; Kan, P.; Silbernagel, J.; Jin, J. Application of image segmentation in surface water extraction of freshwater lakes using radar data. ISPRS Int. J. Geo-Inf. 2020, 9, 424. [Google Scholar] [CrossRef] [Scilit]
- Liang, J.; Liu, D. A local thresholding approach to flood water delineation using Sentinel-1 SAR imagery. ISPRS J. Photogramm. Remote Sens. 2020, 159, 53–62. [Google Scholar] [CrossRef] [Scilit]
- Du, Q.; Li, G.; Chen, D.; Qi, S.; Zhou, Y.; Wang, F.; Cao, Y. Extracting water body data based on SDWI and threshold segmentation: A case study in permafrost area surrounding Salt Lake in Hoh Xil, Qinghai-Tibet Plateau, China. Res. Cold Arid Reg. 2023, 15, 202–209. [Google Scholar] [CrossRef] [Scilit]
- Zhao, B.; Wu, J.; Han, X.; Tian, F.; Liu, M.; Chen, M.; Lin, J. An improved surface water extraction method by integrating multi-type priori information from remote sensing. Int. J. Appl. Earth Obs. Geoinf. 2023, 124, 103529. [Google Scholar] [CrossRef] [Scilit]
- Günen, M.A.; Atasever, U.H. Remote sensing and monitoring of water resources: A comparative study of different indices and thresholding methods. Sci. Total Environ. 2024, 926, 172117. [Google Scholar] [CrossRef] [Scilit]
- Xu, G.; Wu, Y.; Liu, S.; Cheng, S.; Zhang, Y.; Pan, Y.; Wang, L.; Dokuchits, E.Y.; Nkwazema, O.C. How 2022 extreme drought influences the spatiotemporal variations of terrestrial water storage in the Yangtze River Catchment: Insights from GRACE-based drought severity index and in-situ measurements. J. Hydrol. 2023, 626, 130245. [Google Scholar] [CrossRef] [Scilit]
- He, N.; Guo, W.; Lan, J.; Yu, Z.; Wang, H. The impact of human activities and climate change on the eco-hydrological processes in the Yangtze River basin. J. Hydrol. Reg. Stud. 2024, 53, 101753. [Google Scholar] [CrossRef] [Scilit]
- Gao, D.; Wang, W.; Yin, J.; Yu, D.; Lu, Y.; Yuan, X.; Li, M.; Yang, Y. Validation of flood inundation modelling using multi-source SAR imagery. Water Res. 2026, 296, 125590. [Google Scholar] [CrossRef] [Scilit] [PubMed]
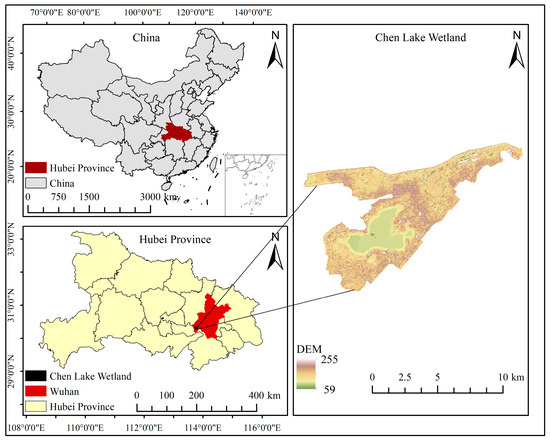
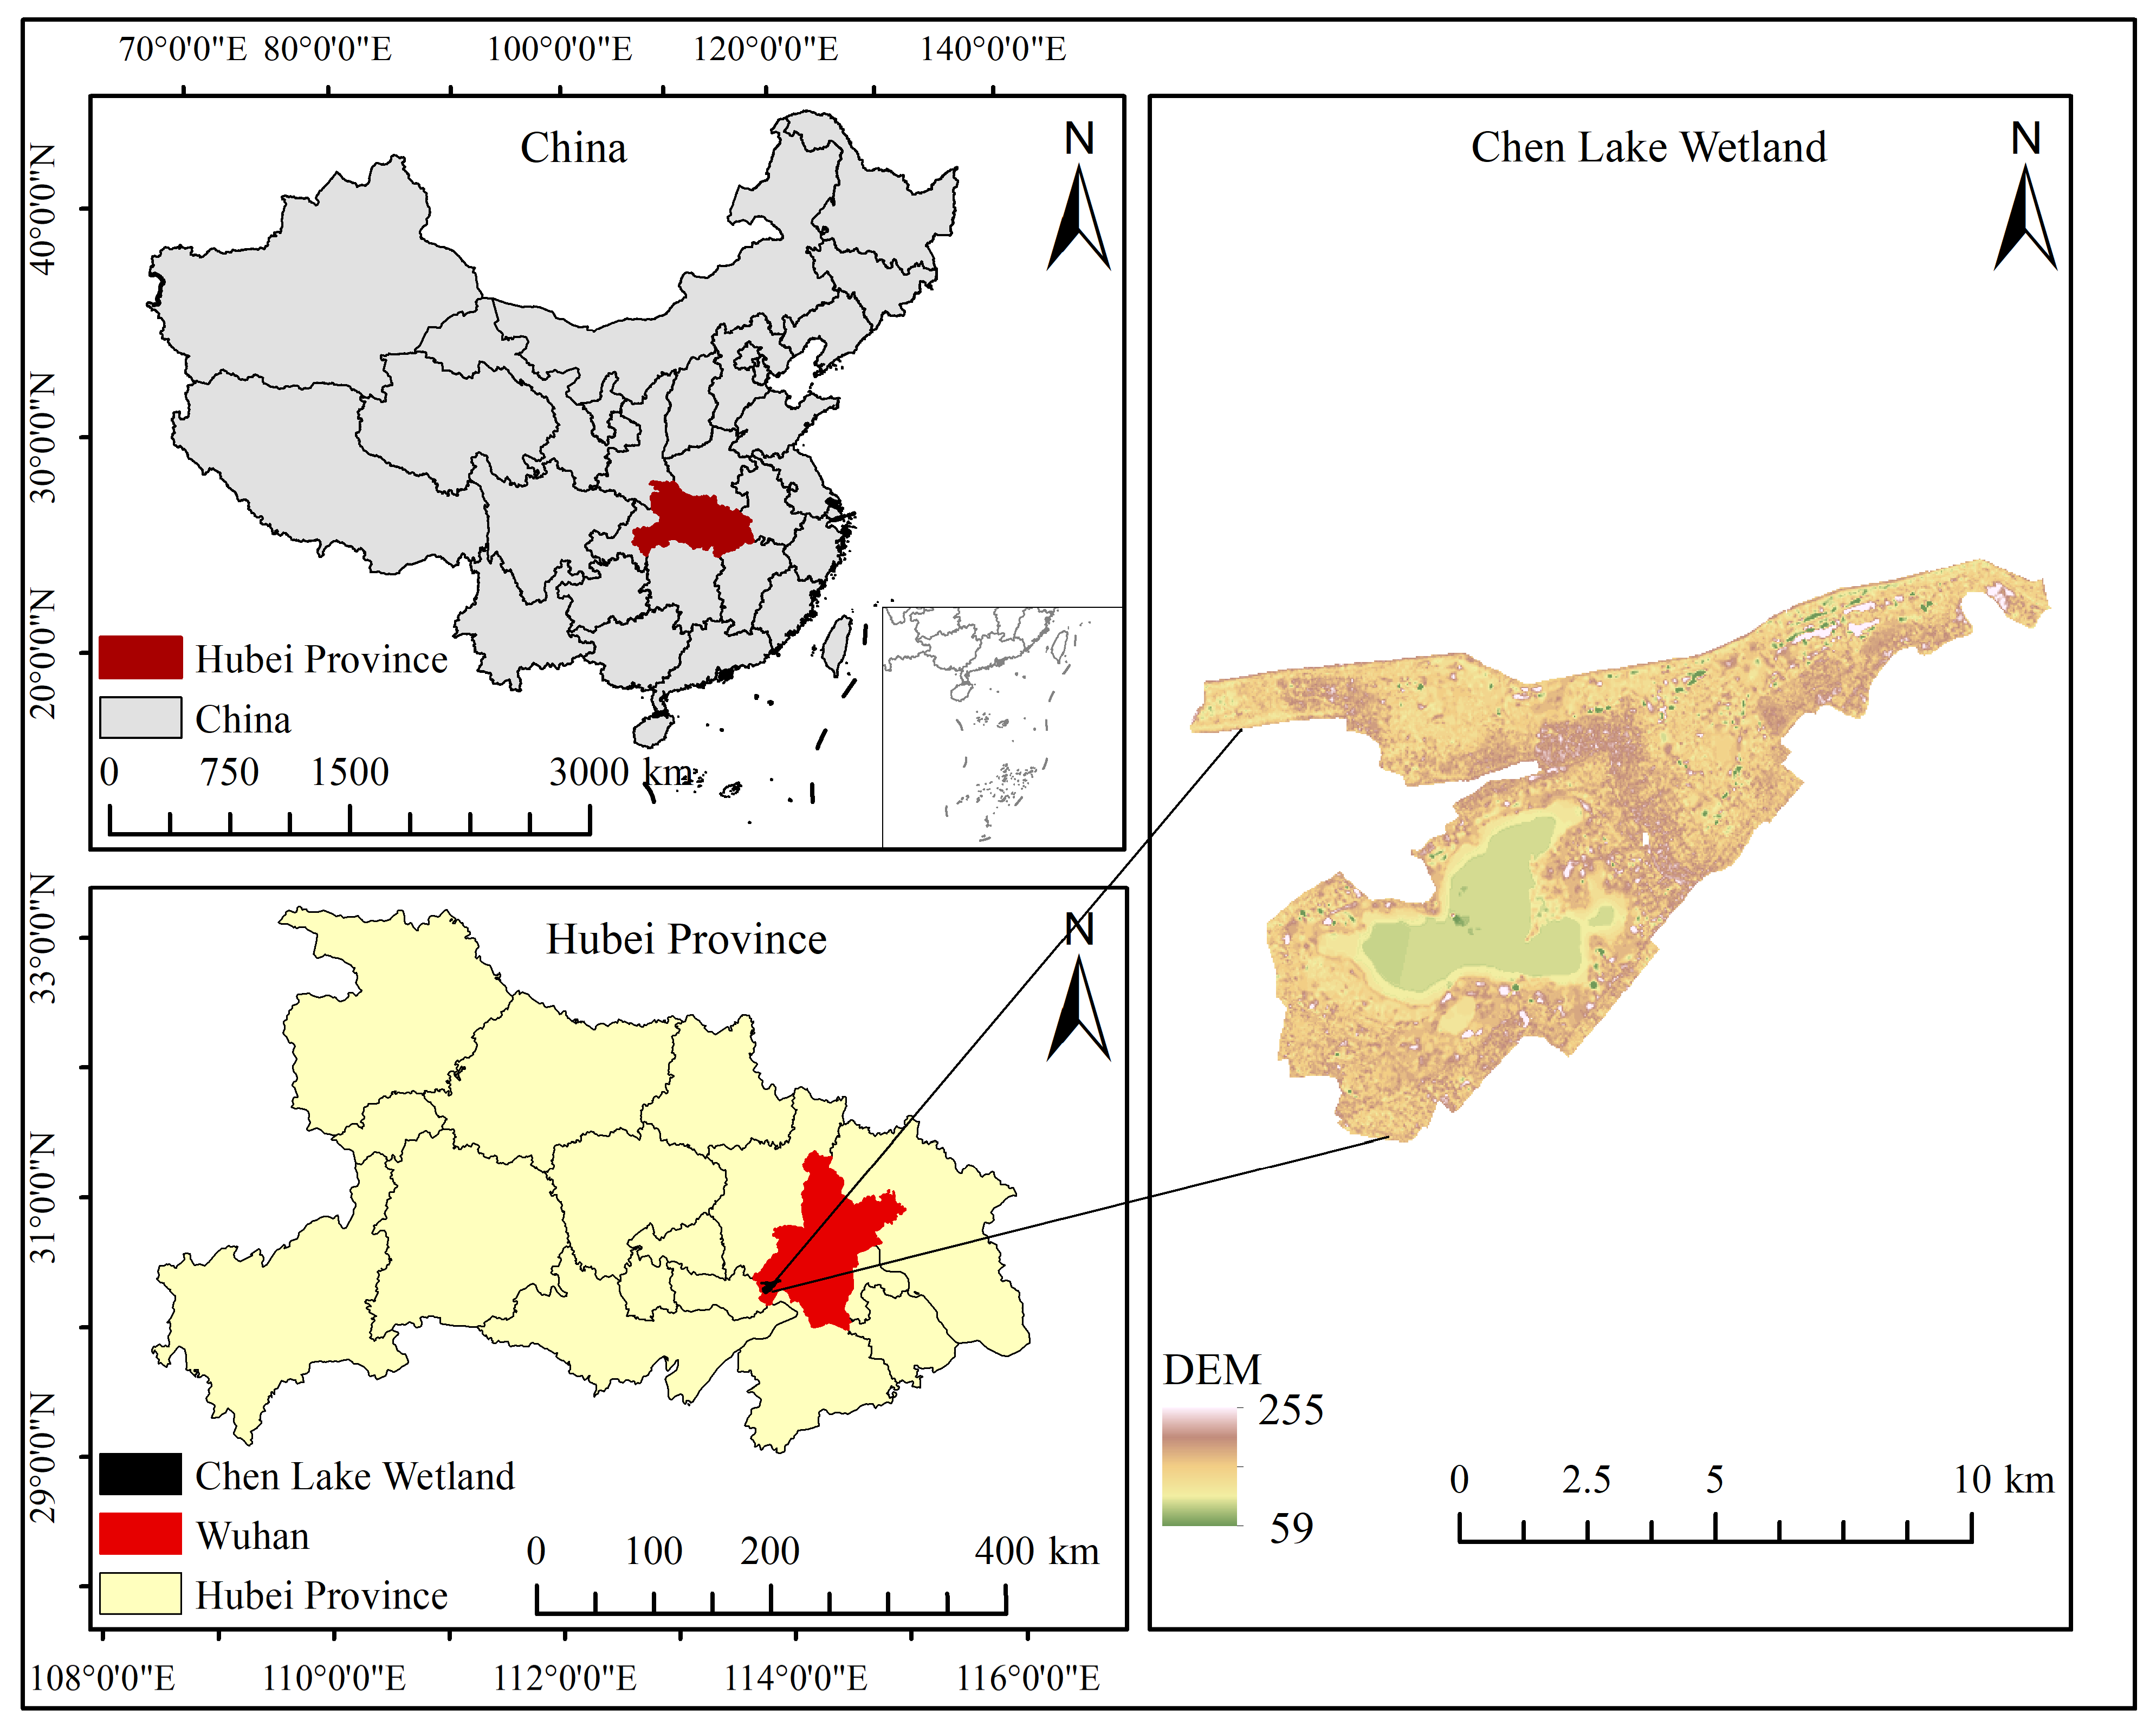
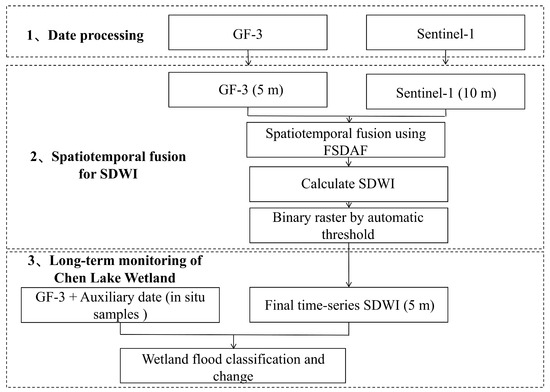
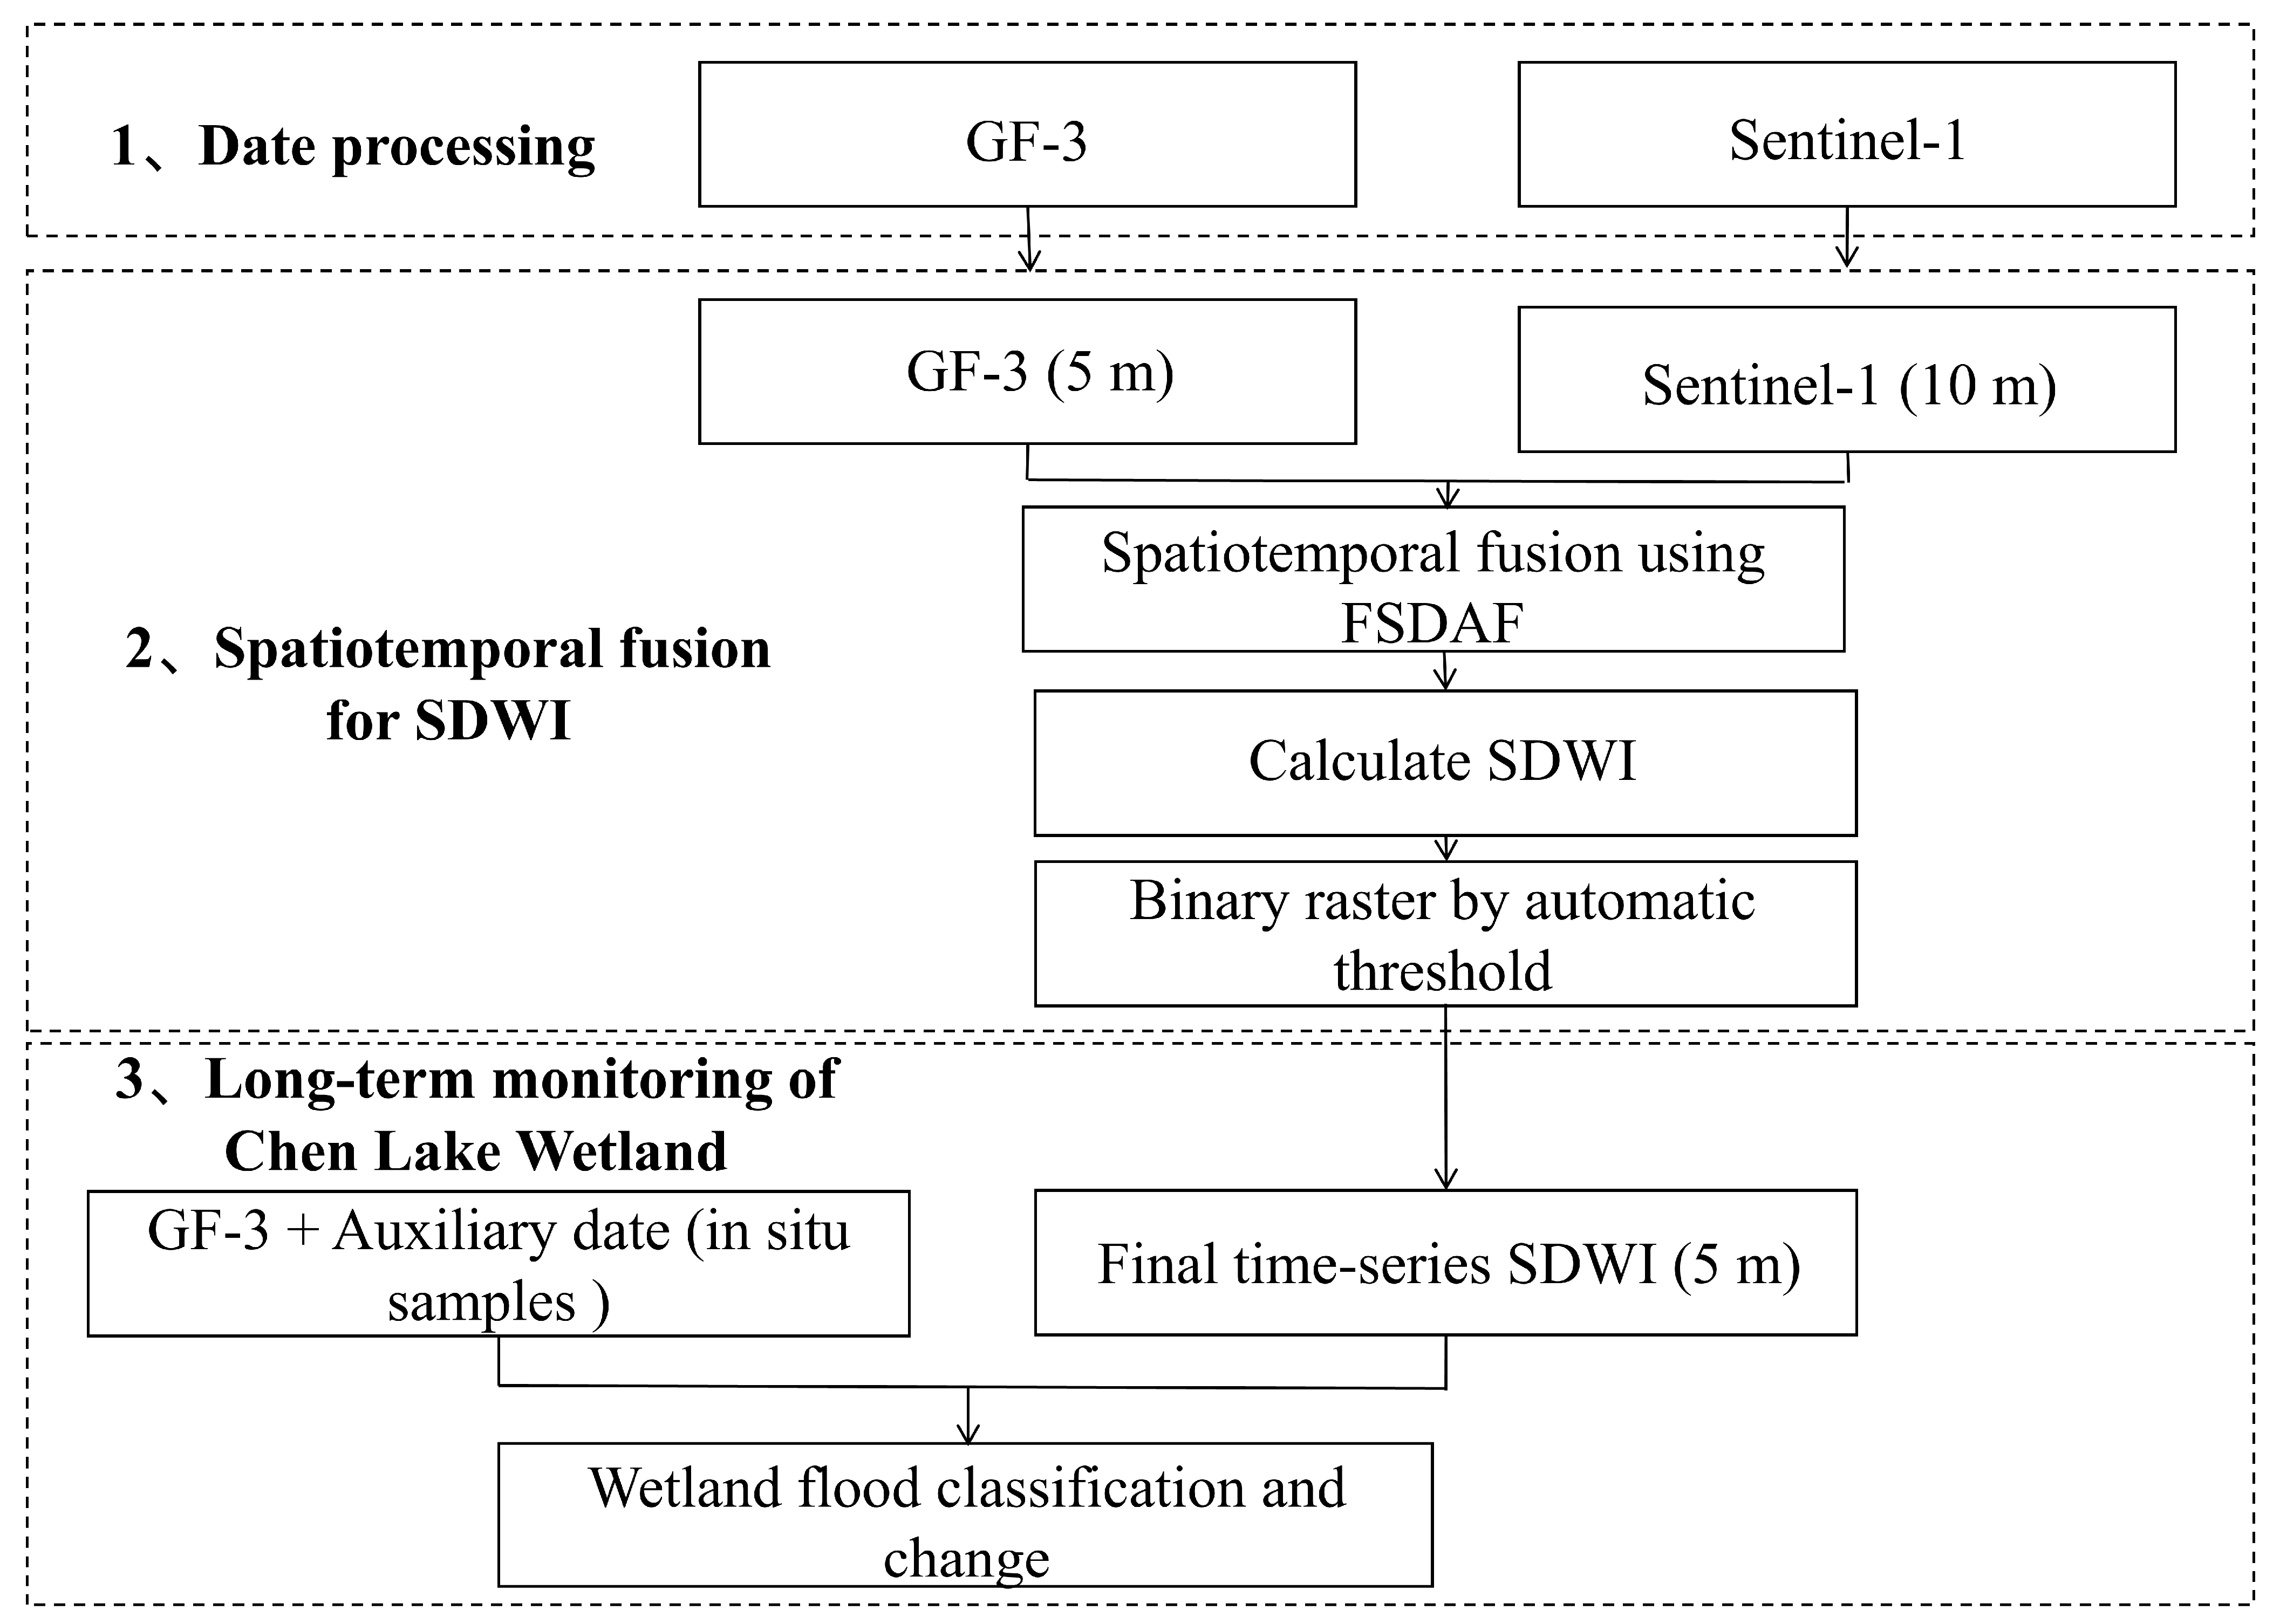
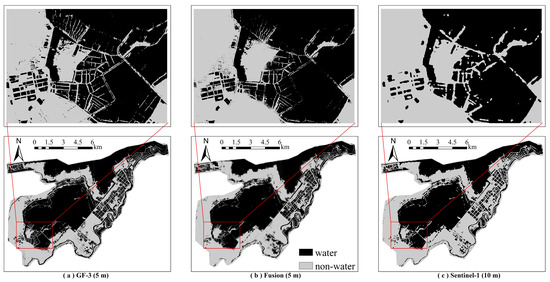
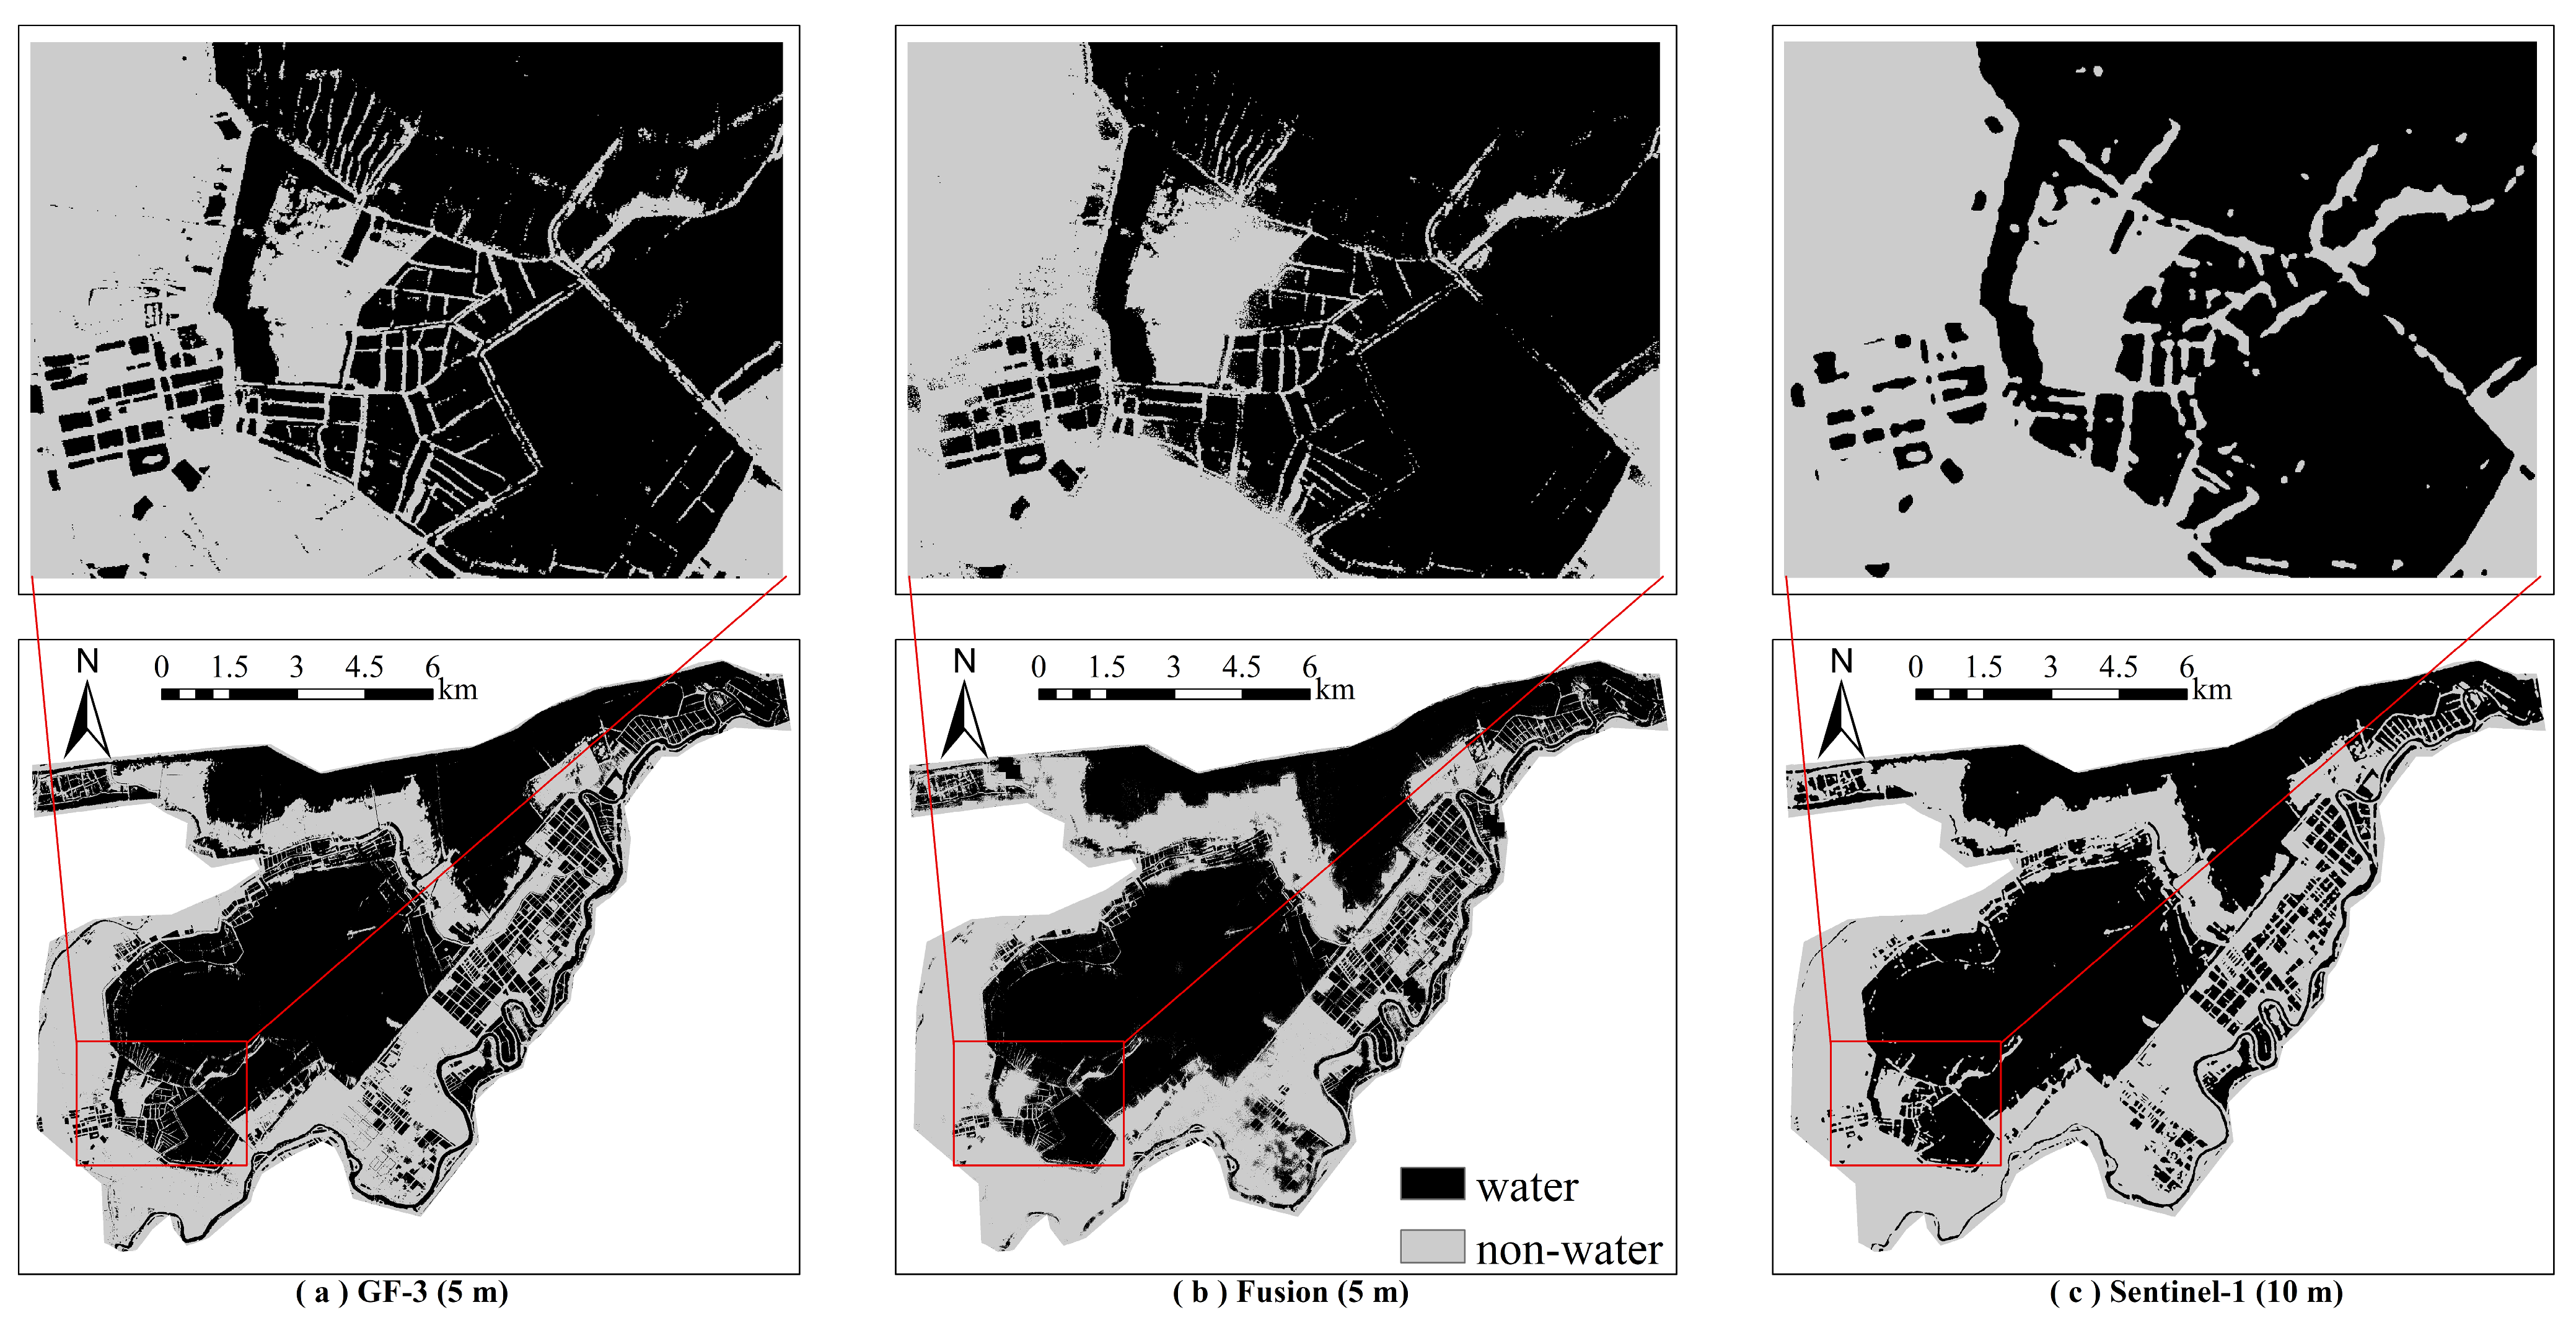
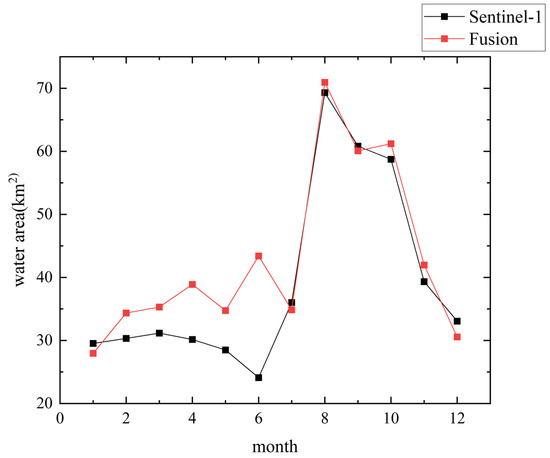
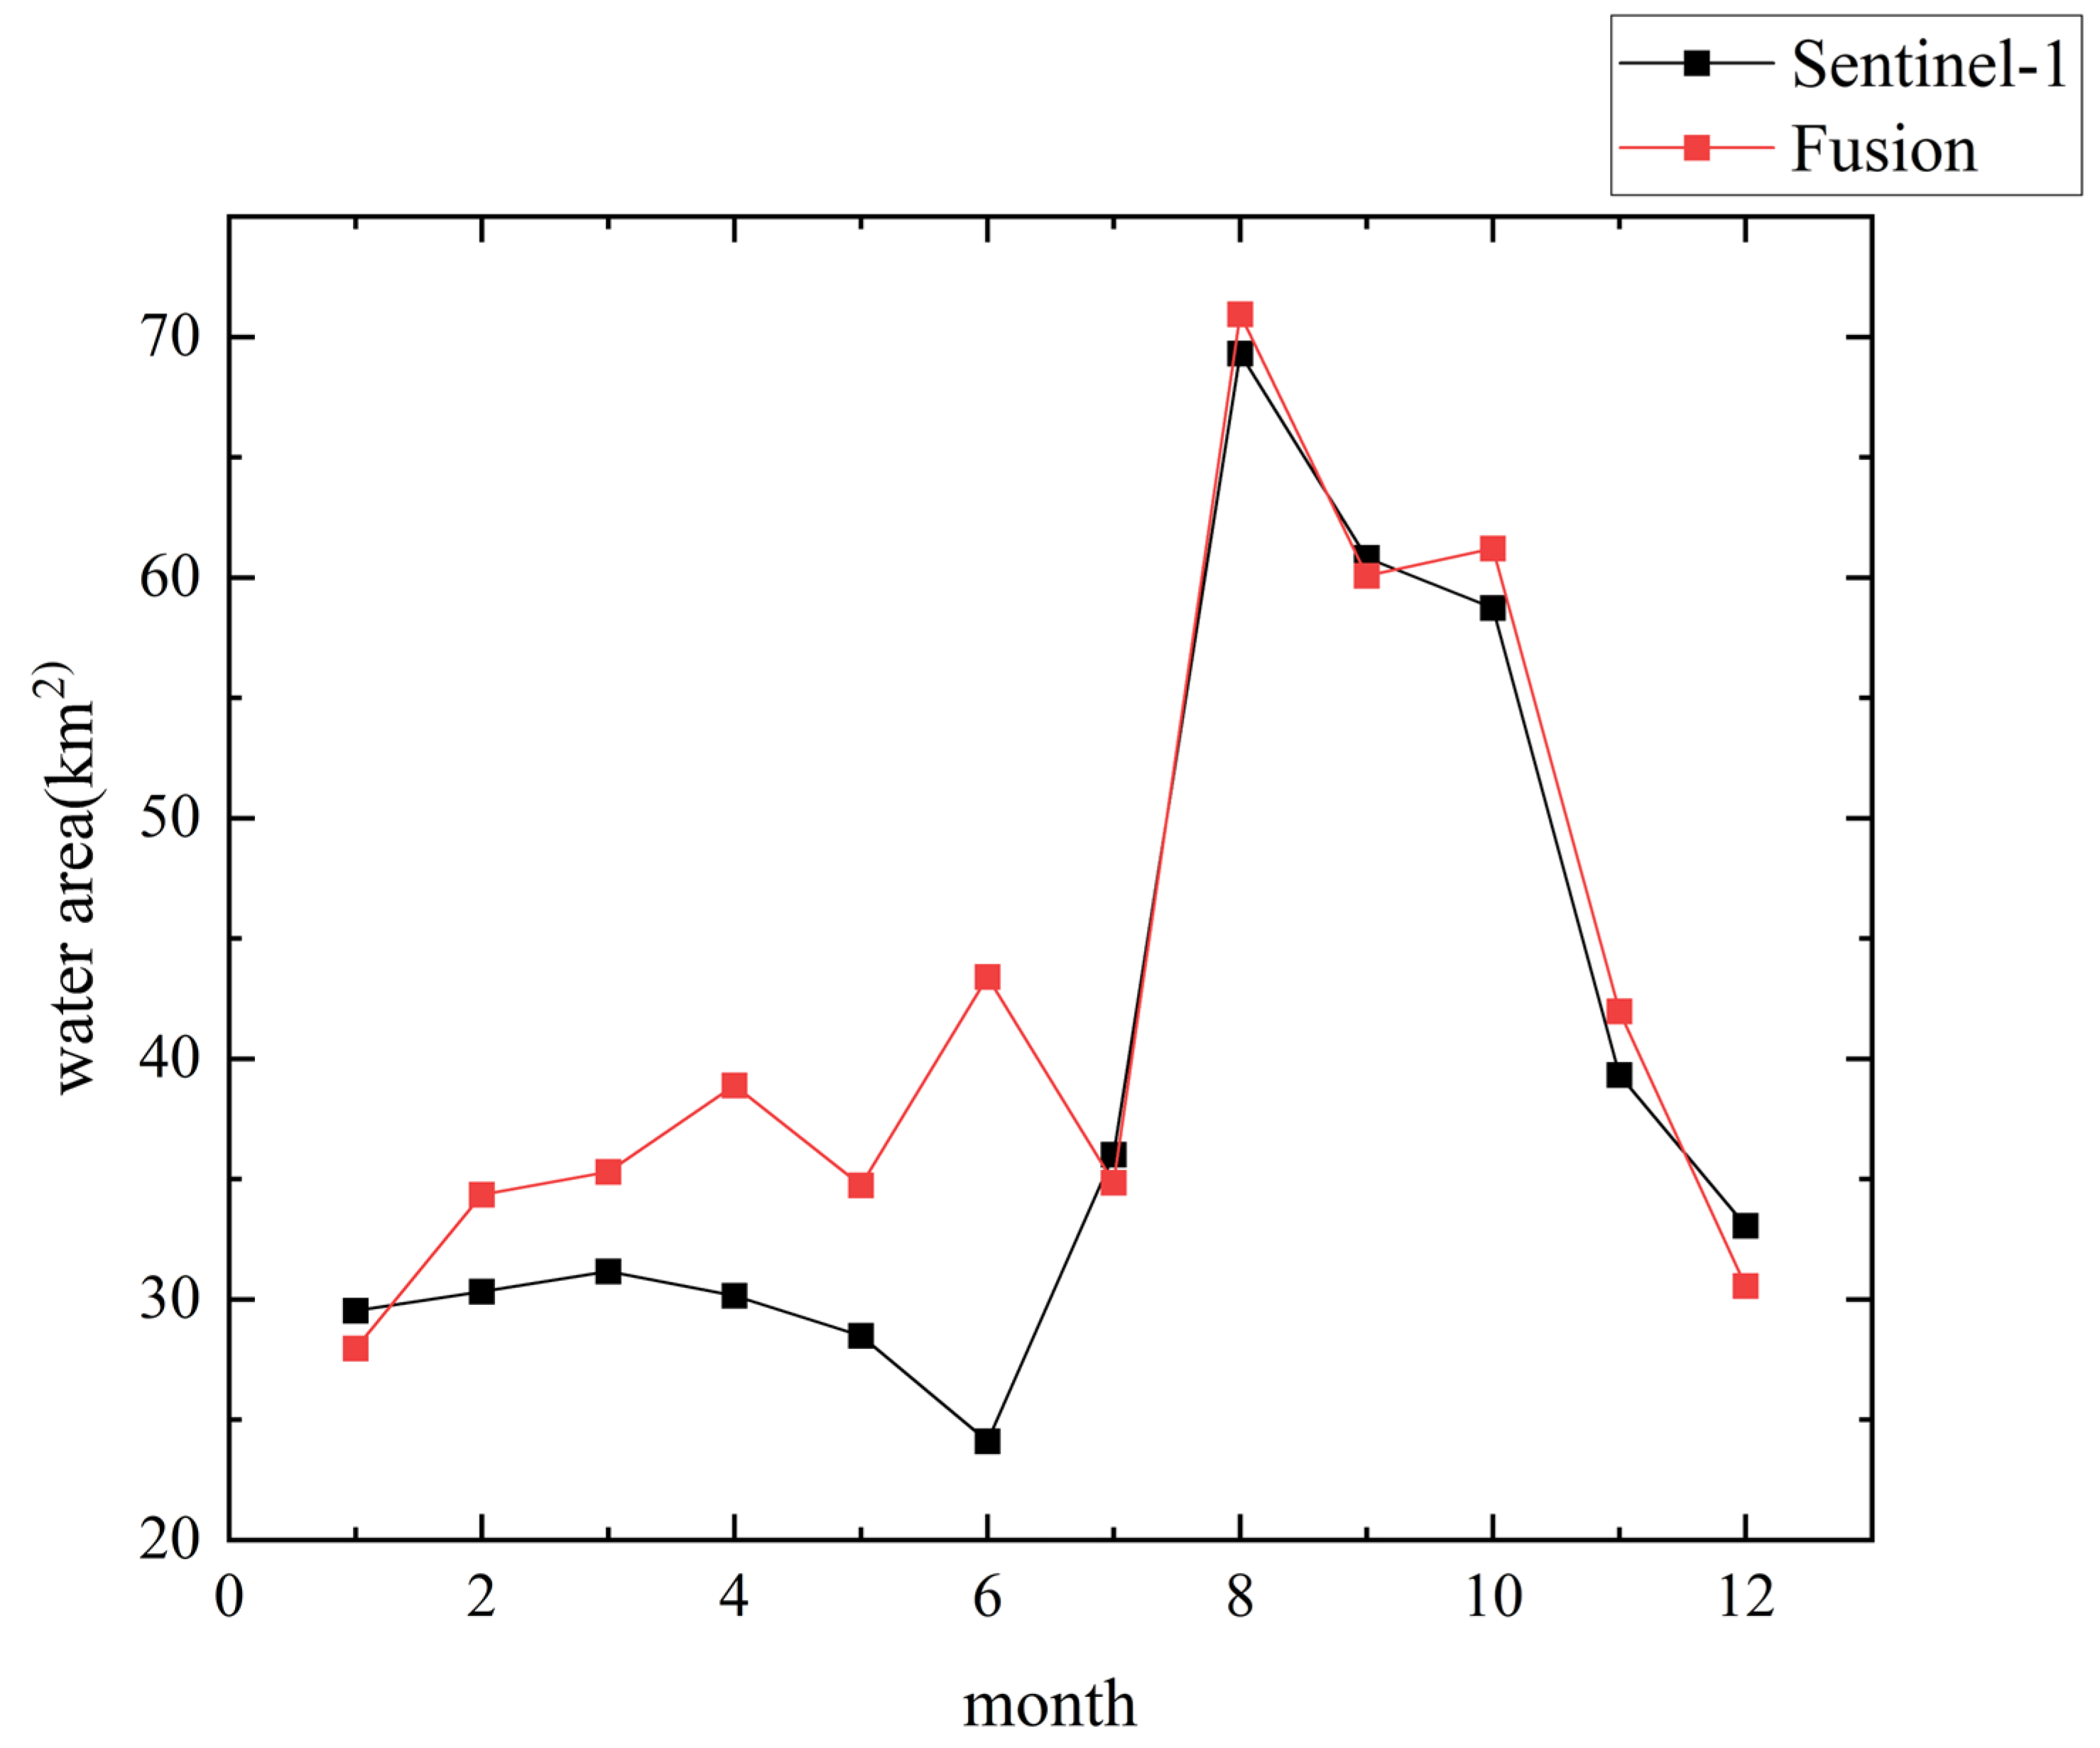
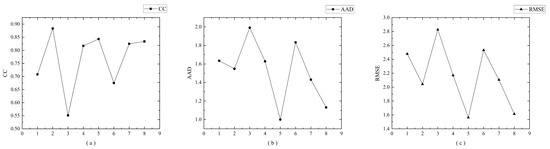
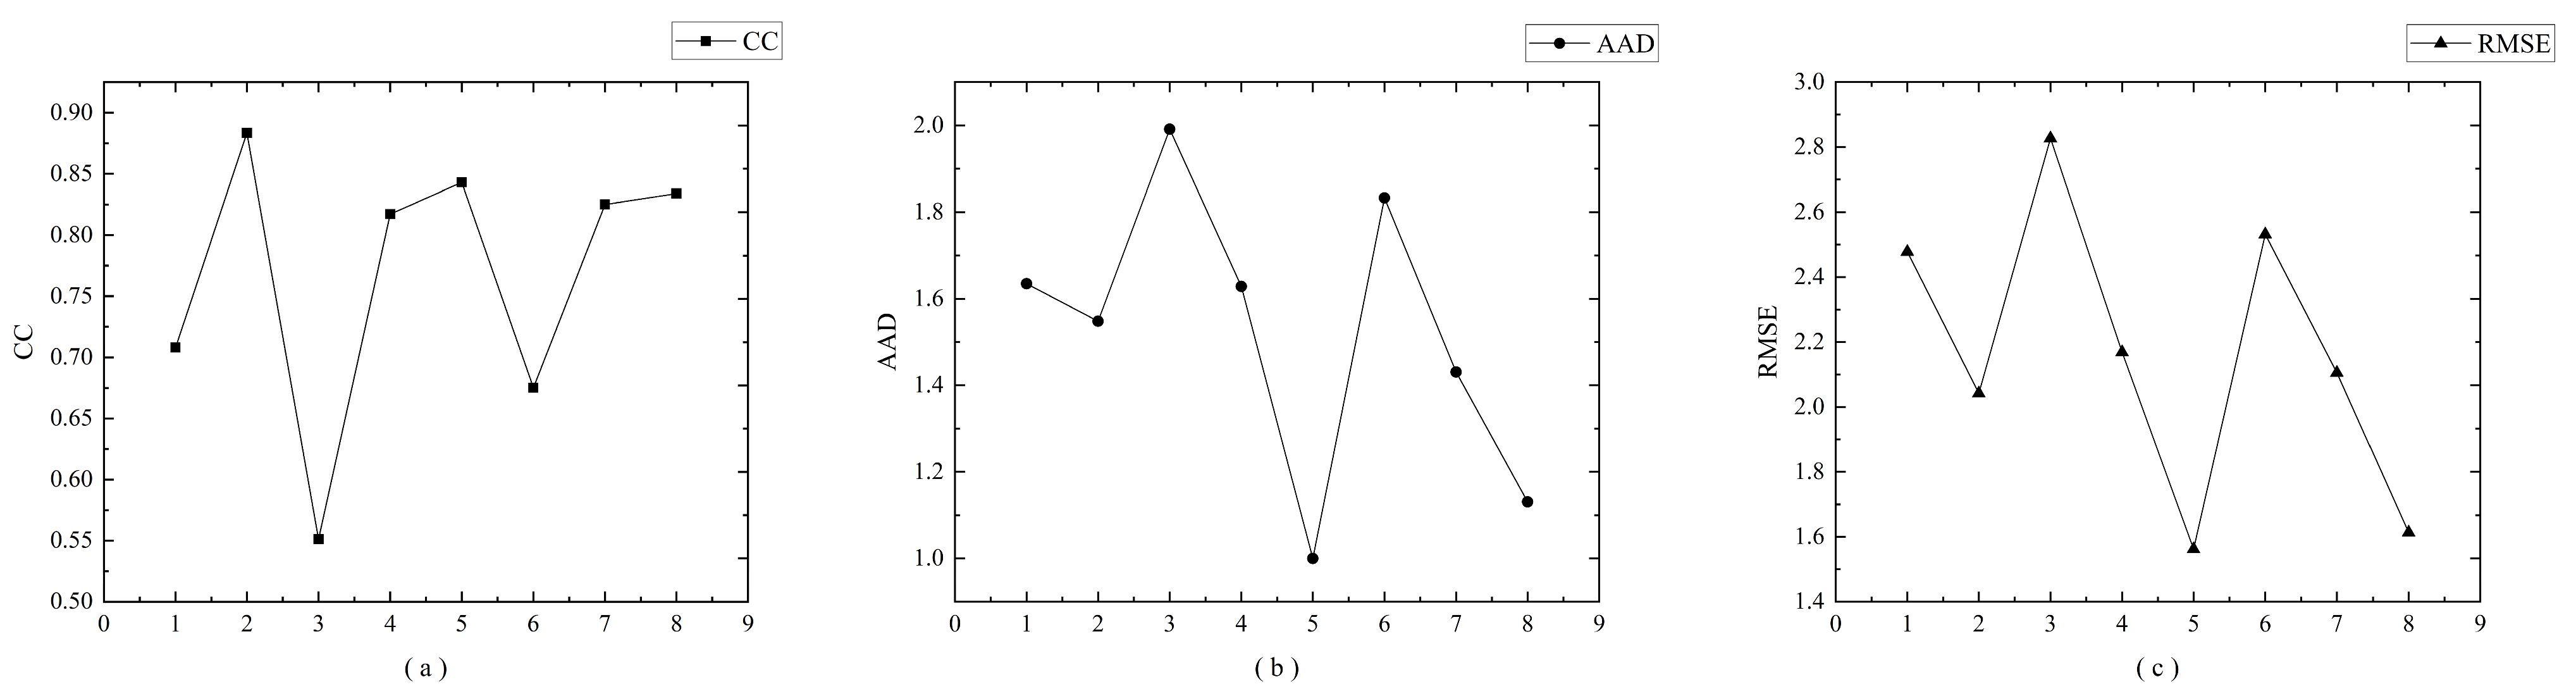
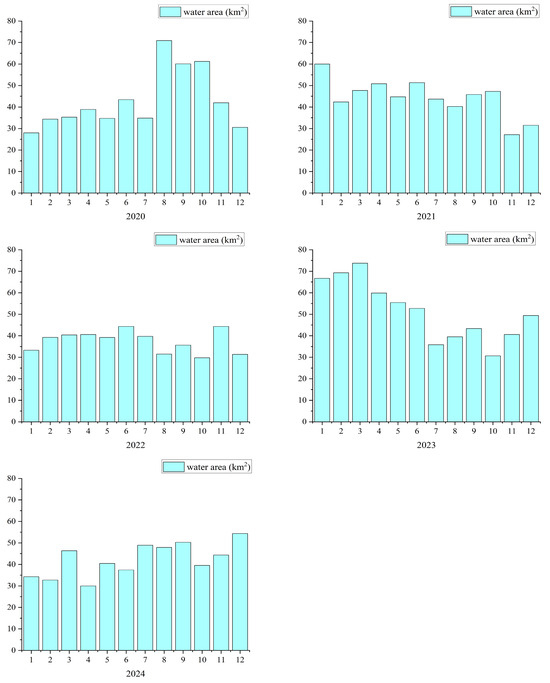
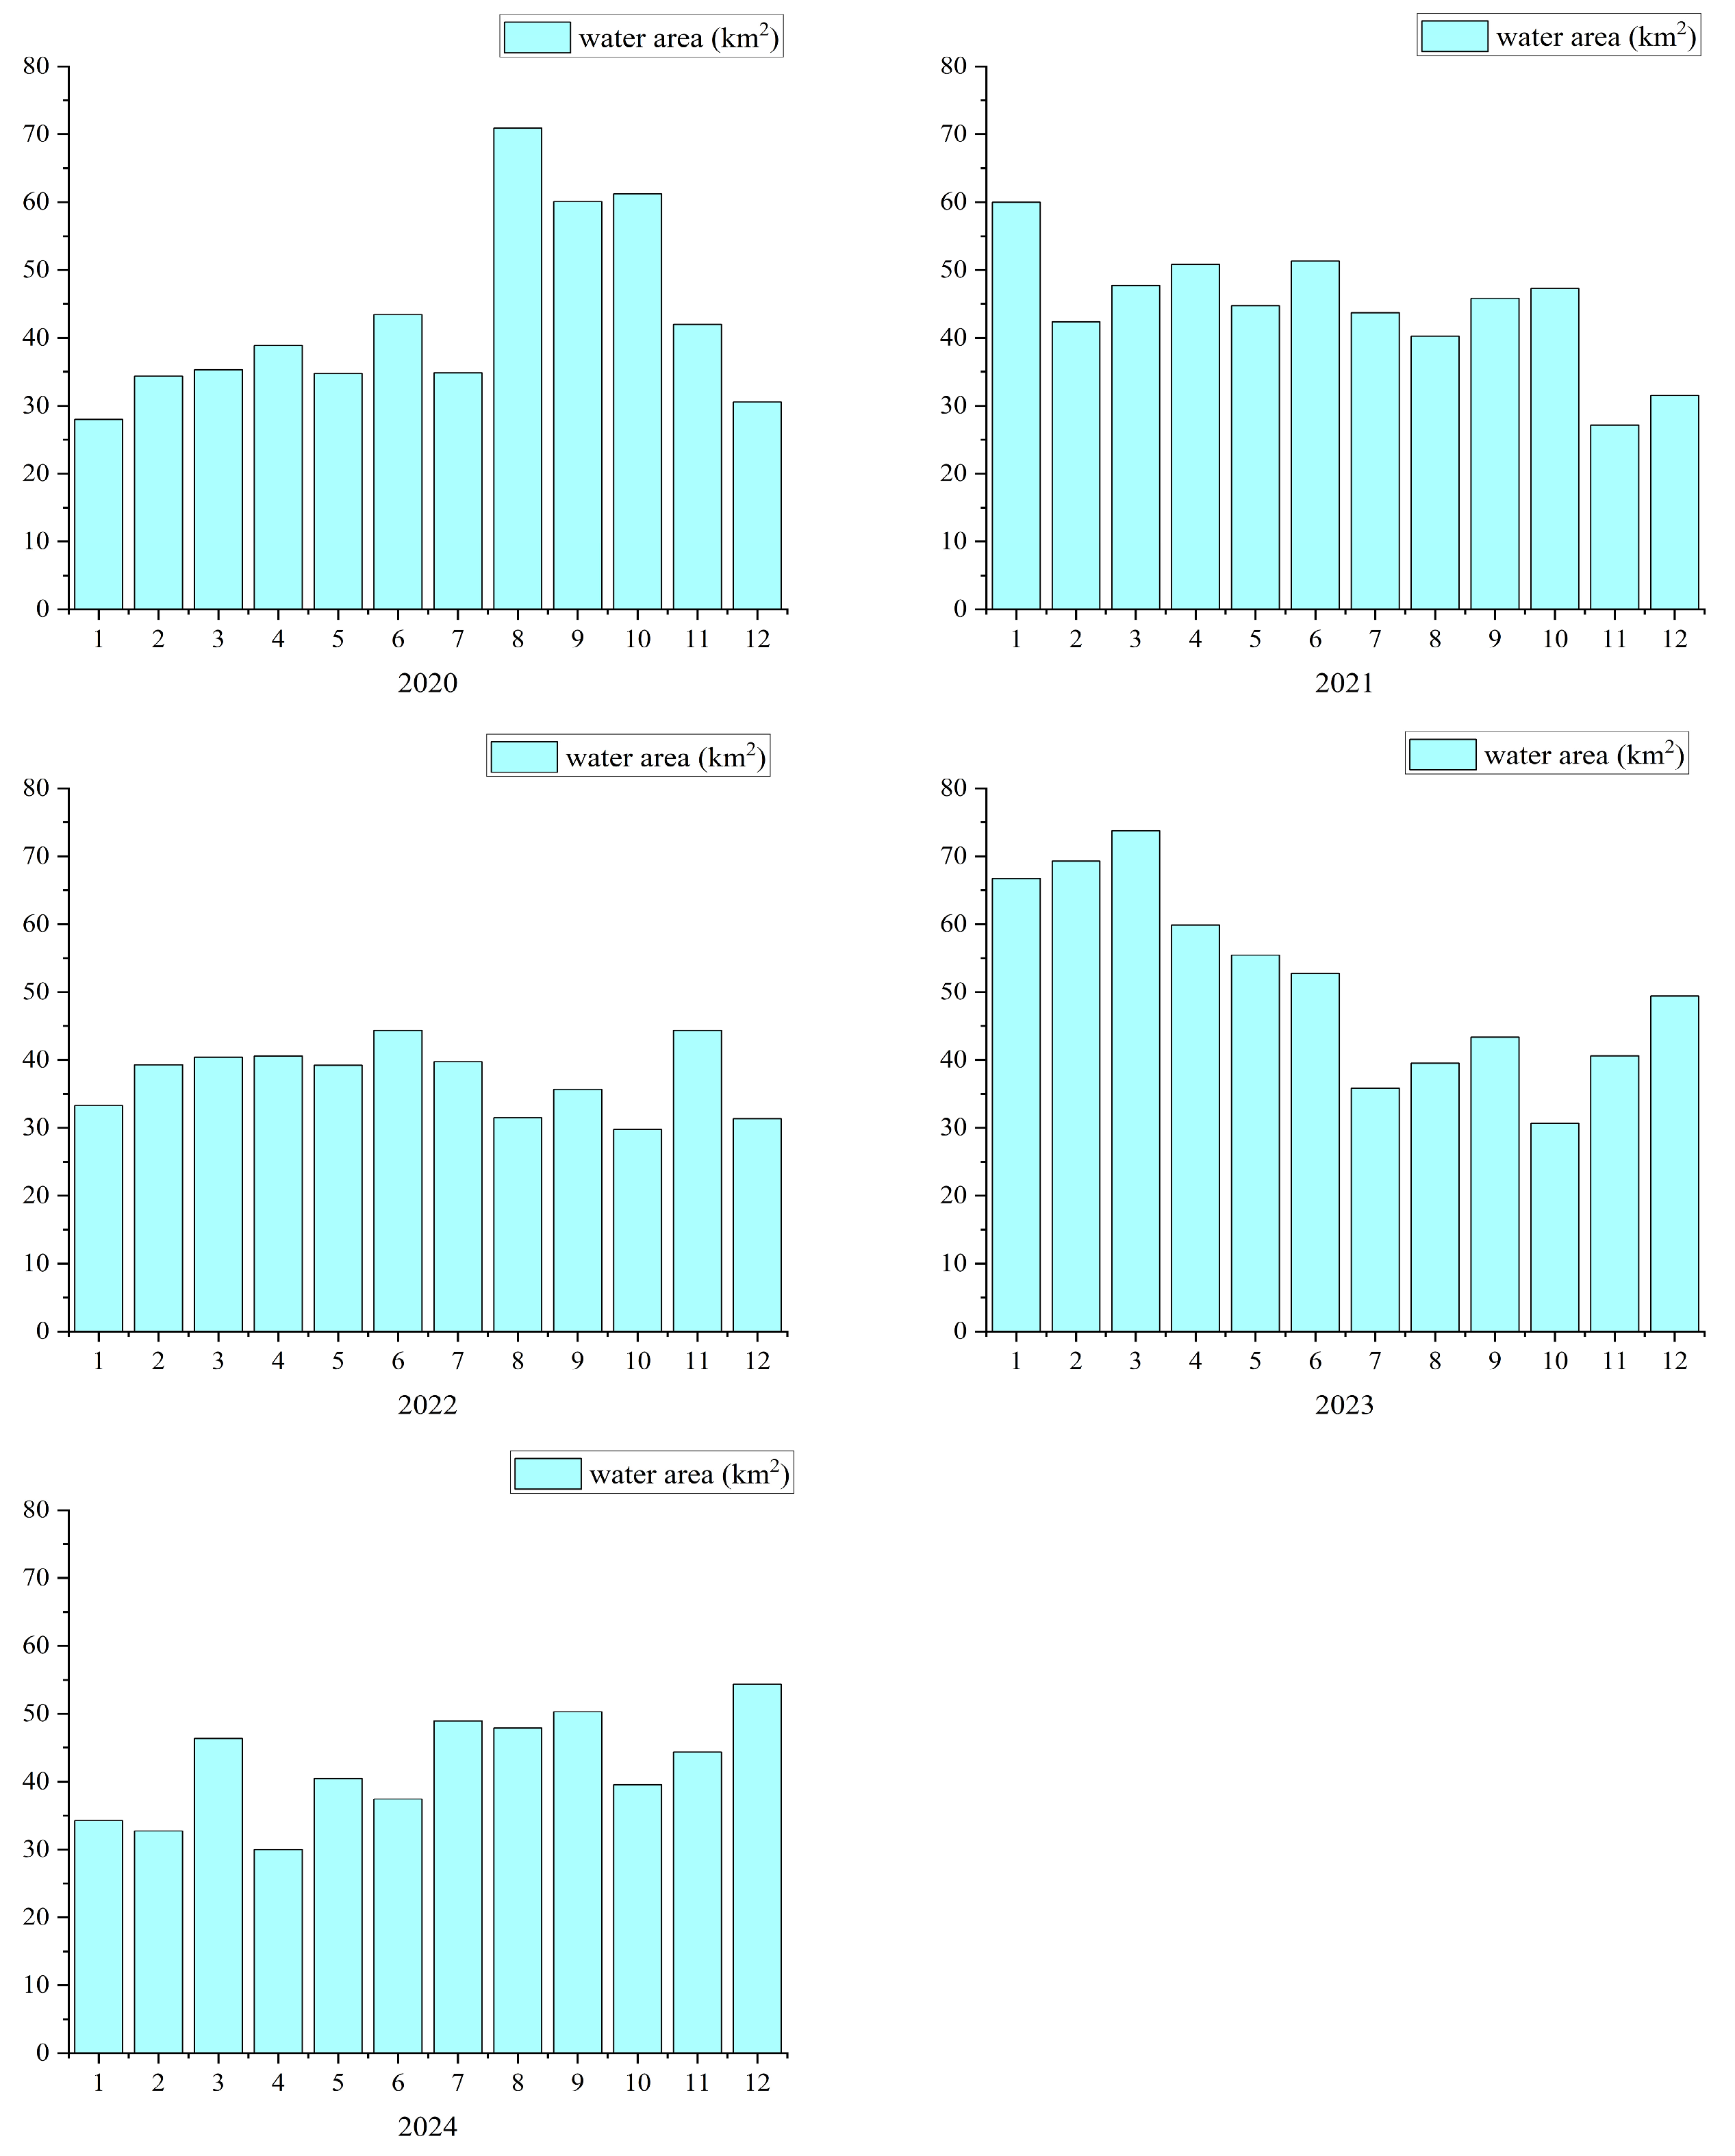
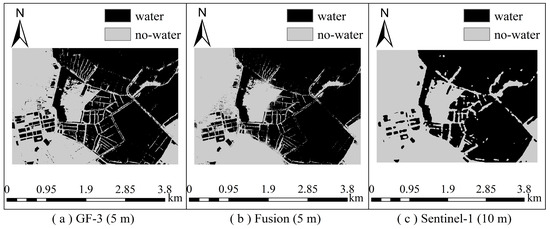
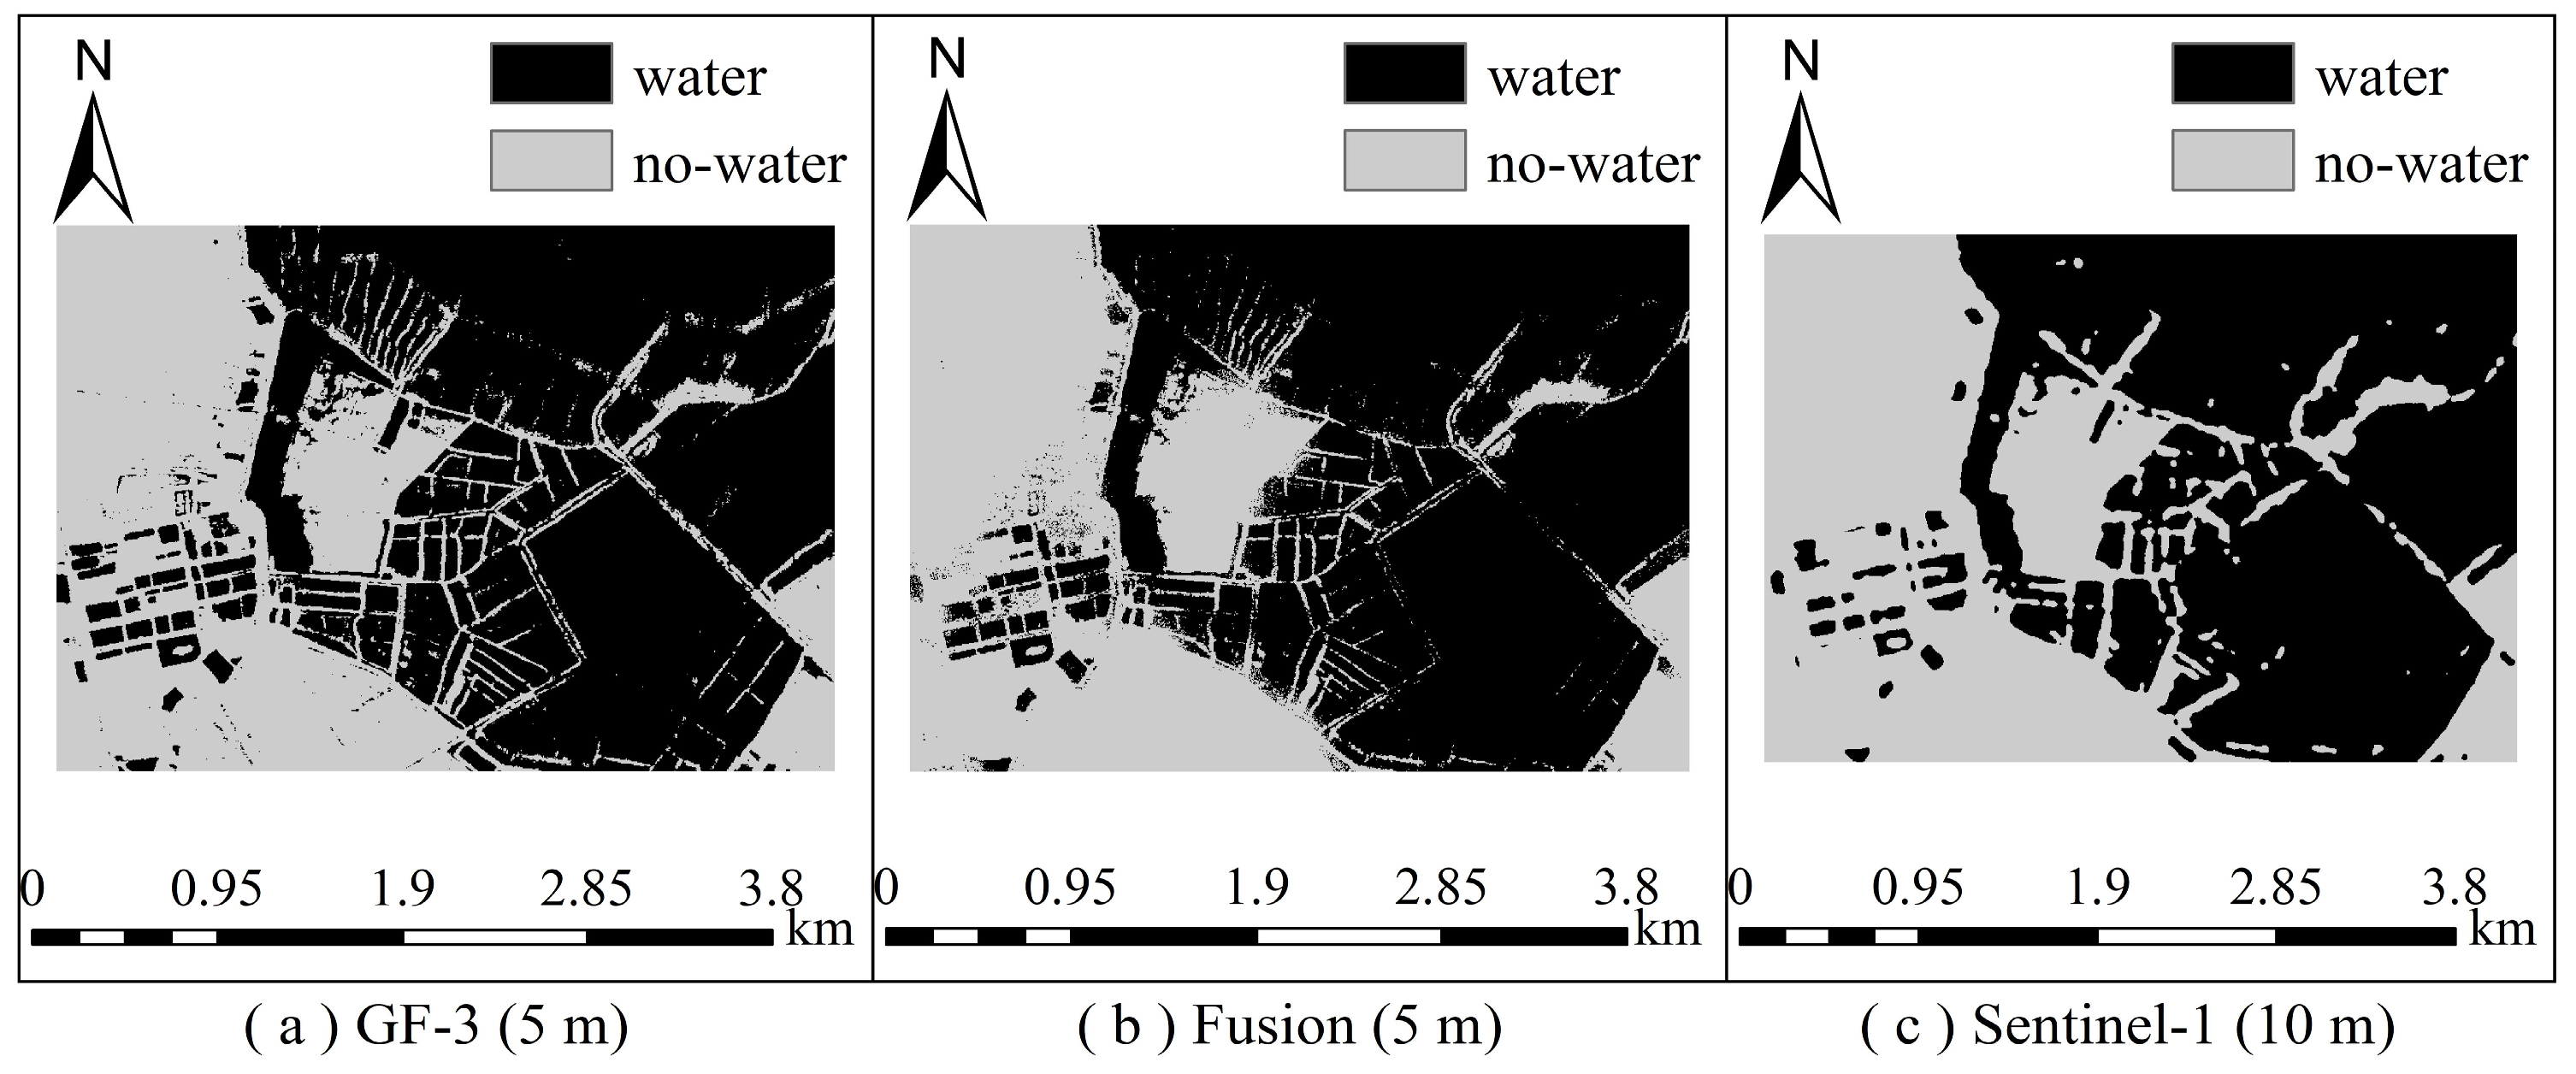

Disclaimer/Publisher’s Note: The statements, opinions and data contained in all publications are solely those of the individual author(s) and contributor(s) and not of MDPI and/or the editor(s). MDPI and/or the editor(s) disclaim responsibility for any injury to people or property resulting from any ideas, methods, instructions or products referred to in the content. |
© 2026 by the authors. Licensee MDPI, Basel, Switzerland. This article is an open access article distributed under the terms and conditions of the Creative Commons Attribution (CC BY) license.