


Abstract
The integration of intangible cultural heritage (ICH) and tourism development (TD) is regarded as a crucial national strategy for China’s sustainable development, as their synergistic relationship is considered pivotal for regional progress. A coupling coordination evaluation system was constructed. Kernel density estimation, entropy method, coupling coordination degree (CCD) and relative development degree (RDD) models, and a tobit model were employed to examine the spatiotemporal characteristics and influencing factors of ICH–TD integration in Sichuan Province. Key findings are as follows: (1) Sichuan is endowed with abundant ICH resources characterized by high heritage value and diverse typologies. However, the distribution is skewed toward traditional skills, exhibiting notable regional disparities. ICH demonstrates a “single-core, belt-shaped and multi-cluster” pattern, which is centered on Chengdu, extends along a north–south high-density belt, and forms several secondary high-density clusters. (2) Temporally, the CCD demonstrates a sustained upward trend, whereas the RDD transitions from ICH-lagged to TD-lagged. Spatially, the number of high coordinated cities increases annually, expanding radially from regional centers, while central-eastern regions consistently outperform the west. (3) Regarding influencing factors, comprehensive economic strength, distribution of industrial structure, overall level of urbanization, and transportation accessibility exert significant positive effects on the CCD, with comprehensive economic strength demonstrating the strongest influence. This study contributes to the theoretical understanding of ICH–TD synergy and provides policy-relevant guidance for integration.
1. Introduction
Intangible cultural heritage (ICH) is a vital component of global cultural heritage, originating from the long-term creative accumulation of diverse ethnic groups through their production and living practices. China has achieved significant progress in ICH preservation, leading the world with 44 UNESCO-listed ICH elements. Culture is regarded as the soul of tourism, and tourism serves as a carrier of cultural dissemination, and their relationship is mutually reinforcing [1]. Empirical evidence demonstrates that integrated development enhances tourism performance [2]. Since 2009, China has implemented progressive policies to promote culture–tourism convergence. Following the establishment of the Ministry of Culture and Tourism in 2018, a series of measures have been introduced to deepen and broaden the integration of ICH and tourism development (TD) to higher standards. The convergence of ICH and TD serves as an engine for social progress, offering substantial potential for economic growth and cultural propagation [3]. This strategic integration not only safeguards cultural diversity but also creates opportunities for sustainable tourism development.
Global tourism has grown exponentially, becoming a major driver of economic development worldwide [4]. This growth has been accompanied by a shift in tourist preferences. Modern travelers increasingly seek immersive cultural experiences that combine intellectual enrichment with personal fulfillment. Within this landscape, ICH has become a valuable resource by providing authentic cultural content that aligns with evolving market demands. Academic engagement with ICH has evolved through several distinct phases. Early research focused on foundational aspects, systematically examining ICH characteristics, classification systems, evaluation methodologies, and policy frameworks [5,6]. As the field matured, research expanded to explore more nuanced dimensions, including the visual experience of heritage [7], the effectiveness of transmission methods [8], and sustainable development models [9]. Theoretical underpinnings of this research can be traced to the concept of industrial convergence, first introduced in 1963 [10], which provides a critical framework for understanding cross-sectoral integration. Research examining the relationship between ICH and TD has followed a parallel trajectory toward increasing sophistication. Early studies frequently adopted a binary perspective, emphasizing either the positive symbiotic potential, where ICH enriches tourism offerings while tourism provides vital transmission channels [11], or the inherent tensions, particularly the conflict between commercialization and authenticity preservation [12,13]. Contemporary scholarship has moved beyond these simplified dichotomies to investigate more complex and dynamic interactions. Current research frontiers focus on the dynamic interplay between ICH preservation and TD [14], innovative approaches to maintaining authenticity in commercialized contexts [15,16], collaborative governance models for sustainable development [17,18], the application of emerging technologies in heritage experiences [19,20], and the potential and methodologies for tourism utilization of intangible cultural heritage [21,22].
With the maturation of research on industrial convergence, a critical question has emerged: how can the degree of integration be accurately evaluated? Recently, scholarly focus has shifted toward examining industrial convergence through the lens of coupling relationships [23,24]. The coupling coordination degree (CCD) model has proven to be a valuable tool in addressing this challenge. This model provides a quantitative framework for measuring the intensity of interaction between two or more systems [25,26]. It evaluates coordination effectiveness, whereby higher CCD values indicate stronger system compatibility and more harmonious development outcomes [27]. Empirical studies confirm that enhanced CCD facilitates deeper industrial integration [28]. This approach has yielded insights across multiple fields, including ecological environment systems [29], economic development patterns [30], digital transformation processes [31], culture–tourism convergence [32]. Various methods are employed for CCD analysis, such as entropy weighting for objective indicator measurement, expert consultation for qualitative validation, kernel density estimation for spatial pattern analysis, the geographical detector for factor identification, or gray relational analysis for dynamic assessment. As research advances, the CCD model continues to evolve as an essential tool for promoting high-quality industrial convergence.
Despite the theoretical and methodological foundations established by existing research on ICH and TD, several gaps persist. First, most studies adopt a macro-level perspective at the national scale, with limited research focusing on provincial or regional levels. This limitation hinders the accounting for regional heterogeneity. Second, the dynamic changes in integration and coordination degrees within specific regions have been insufficiently tracked and analyzed. Third, the driving factors influencing the balanced integration of ICH and TD at the regional level have not been fully identified, limiting the practical applicability of the findings. Sichuan Province is a major economic and cultural hub in China and holds a strategic position in the national cultural and tourism development agenda. It is characterized by abundant ICH resources and a well-developed tourism industry. Consequently, targeted research on the coupling and coordination between ICH and TD in Sichuan Province is needed to address these gaps.
This study aims to achieve three objectives to provide practical suggestions for promoting the deeper culture–tourism integration development in the region.
RQ1: What is the level of coupling and coordination between ICH and TD in Sichuan Province?
RQ2: What is the dynamic evolution trend of this coupling and coordination relationship?
RQ3: What are the key factors influencing the degree of its coupling coordination?
2. Materials and Methods
2.1. Study Area
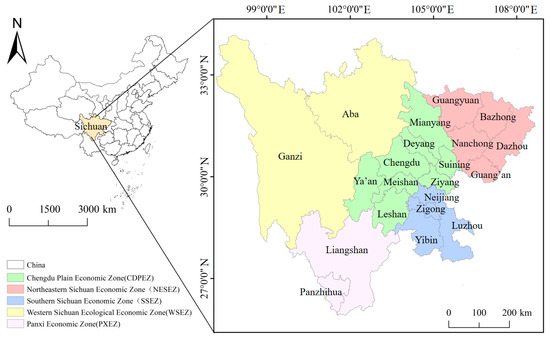
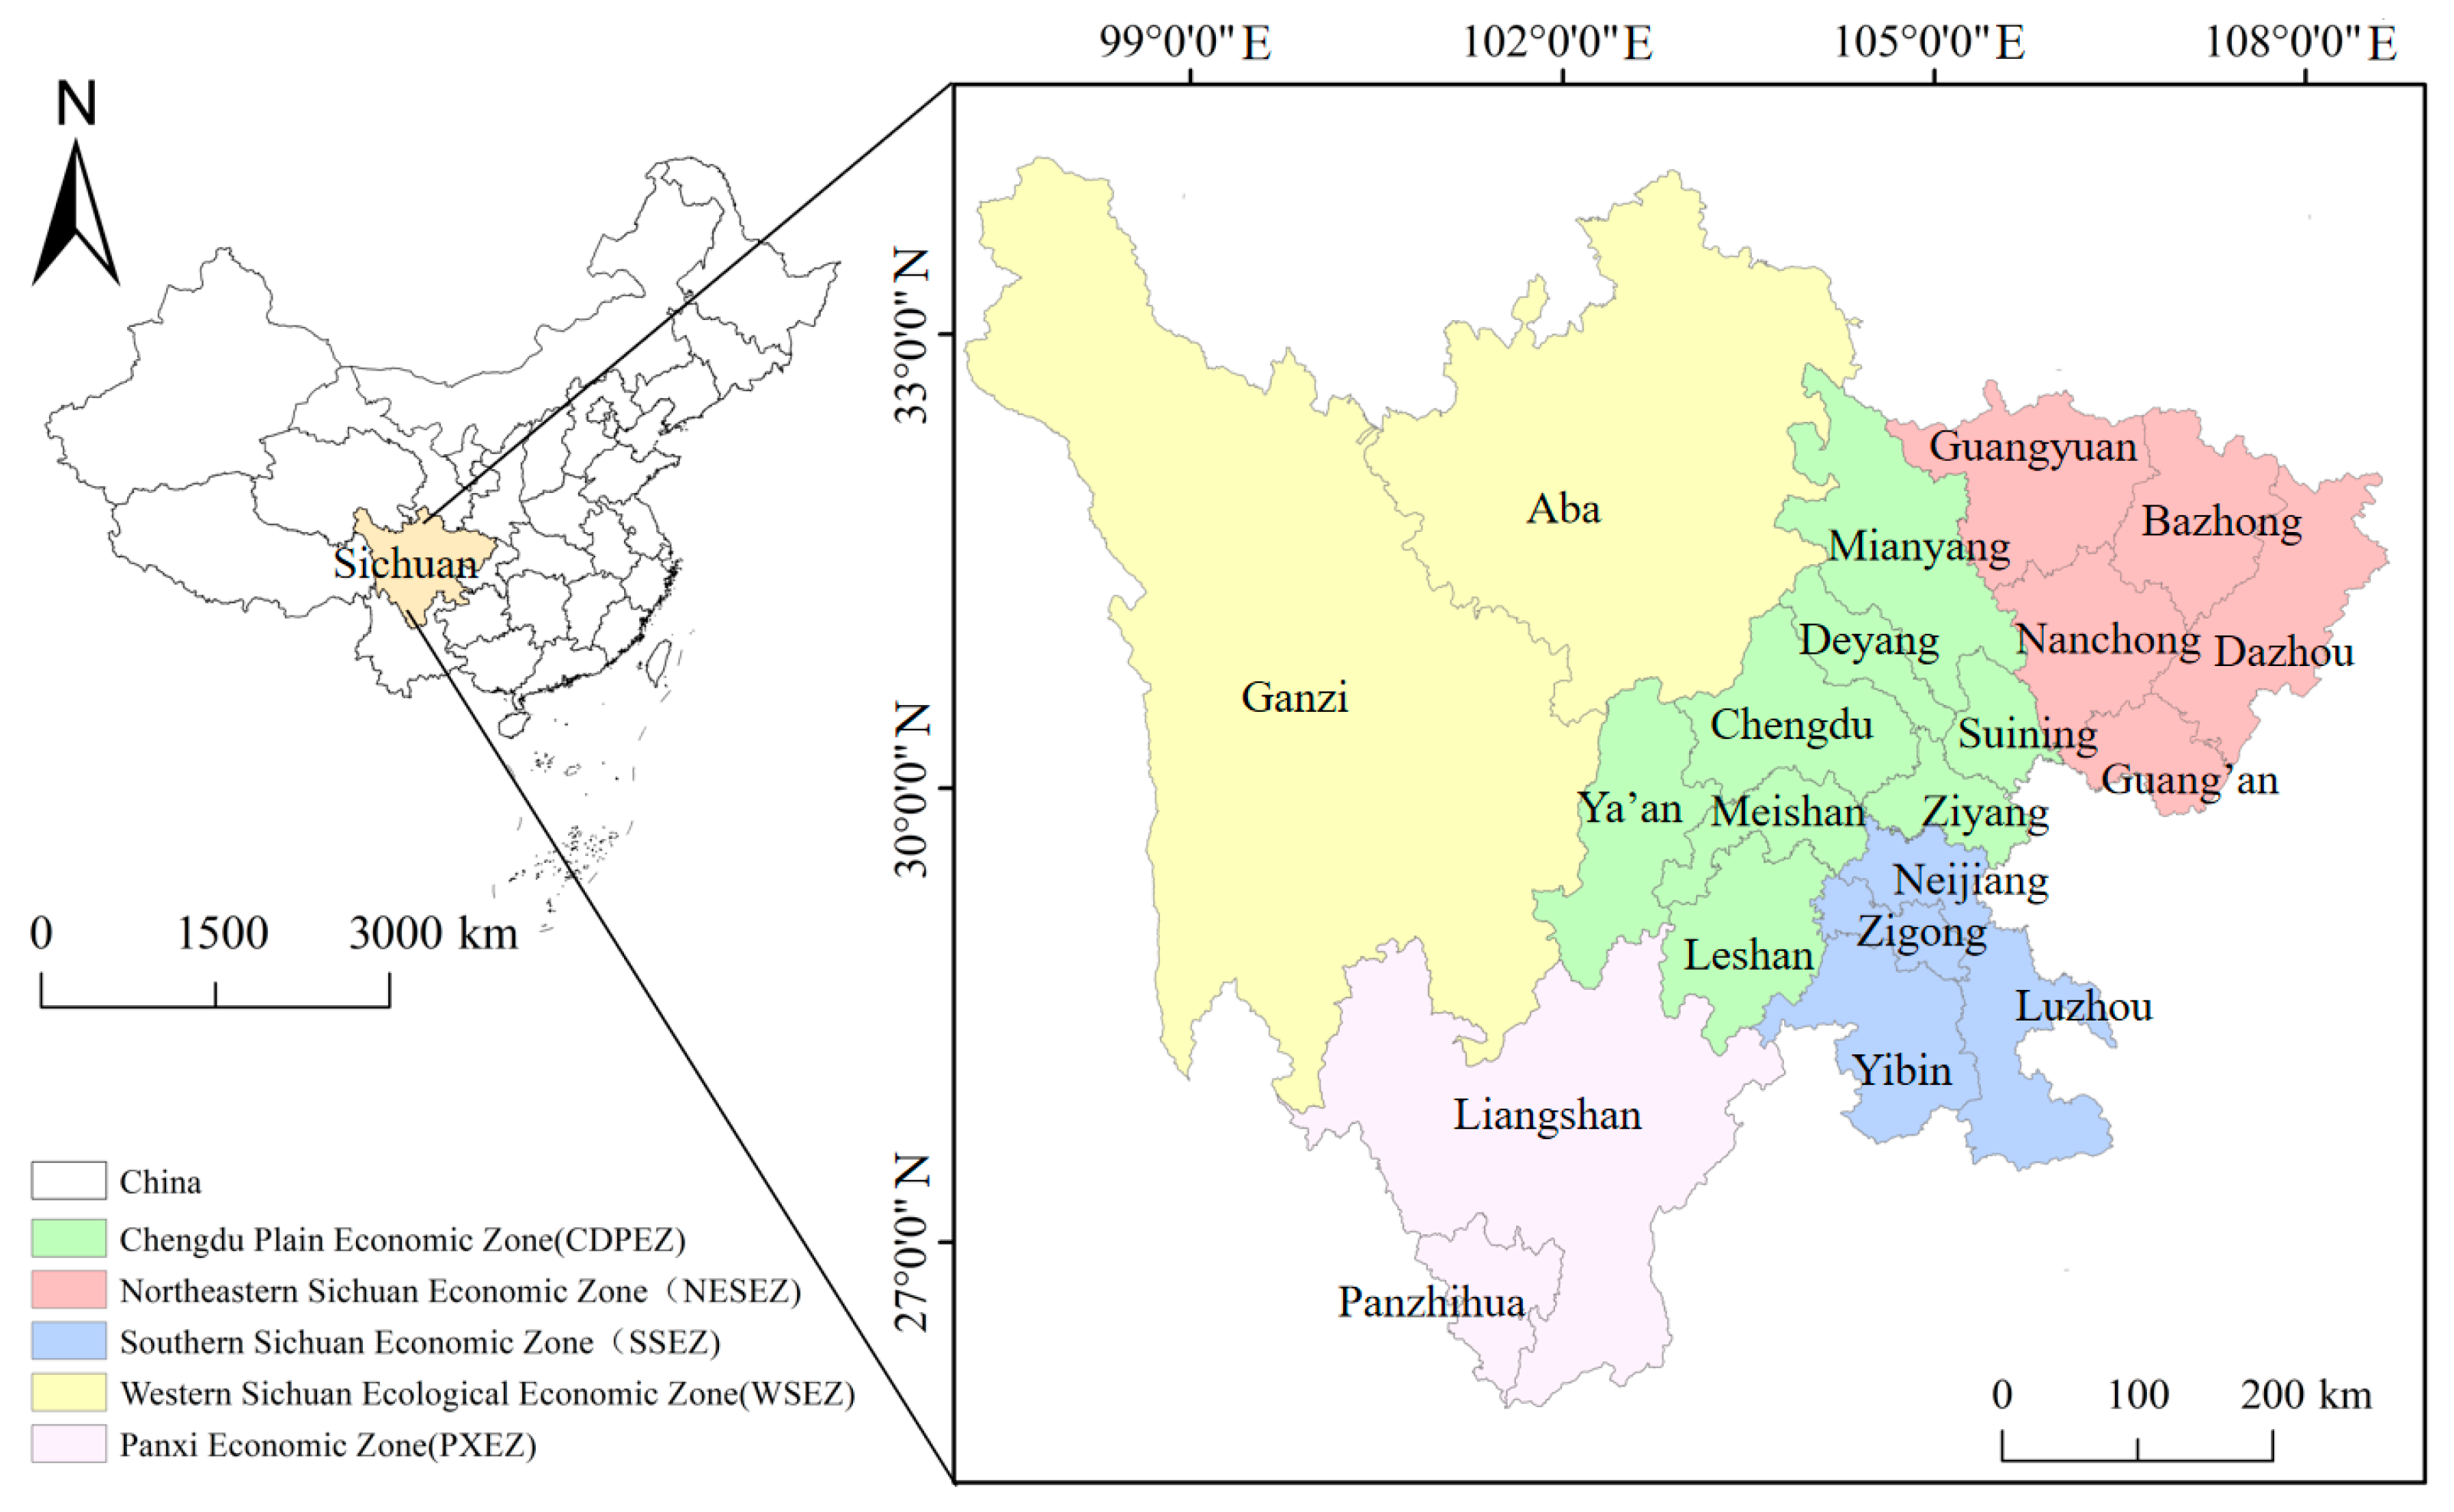
Located in southwestern China, Sichuan Province spans from 97°21′ E to 108°31′ E and 26°03′ N to 34°19′ N. This vast territory encompasses diverse landscapes, spanning across both the first and second topographic steps of China. For administrative and economic analysis, it is divided into five major regions (Figure 1): the Chengdu Plain Economic Zone (CDPEZ), comprising eight cities centered on the provincial capital, Chengdu; the Southern Sichuan Economic Zone (SSEZ), containing four major urban centers; the Panxi Economic Zone (PXEZ), covering the areas of Panzhihua City and Liangshan Prefecture; the Northeastern Sichuan Economic Zone (NESEZ), including five cities; and the Western Sichuan Ecological Economic Zone (WSEZ), consisting of Ganzi and Aba Prefectures, which are known for their exceptional natural landscapes. A comparative analysis of the five regions is presented in a subsequent section.
Figure 1.
Survey region. Note: This map is created based on the standard map from the official website of the Ministry of Natural Resources of China, with the map review No. GS(2023)2767; the boundary of the base map remains unmodified. The following maps are from the same source.
The terrain is characterized by complex topography, an extensive river network, and dramatic elevation changes that slope distinctly from west to east. Sichuan is endowed with abundant cultural and tourism resources. It hosts over 3.06 million cultural resources across six categories, including intangible cultural heritage and cultural relics, alongside more than 245,000 tourism resources spanning eight categories, such as geological landscapes and aquatic scenery. The province has established 18 5A-level scenic areas (the highest-grade sights in China) and possesses cultural and tourism resources that are recognized as among the most numerous, diverse, and high-quality in China. The scale and quality of its cultural and tourism industry rank first in western China and are competitive nationally.
The rich ethnic traditions and long-standing Bashu culture have collectively fostered exceptionally rich intangible cultural heritage and tourism resources in the province. In recent years, the province has emerged as a national leader in integrating cultural preservation with tourism development. Given its significant status in both tourism and ICH resources, Sichuan has achieved significant progress in TD and the protection and inheritance of ICH. Therefore, studying the coupling relationship between TD and ICH in Sichuan is both representative and of practical significance for promoting integrated conservation and regional development.
2.2. Construction of the Index System
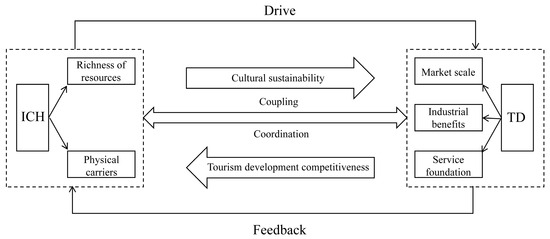
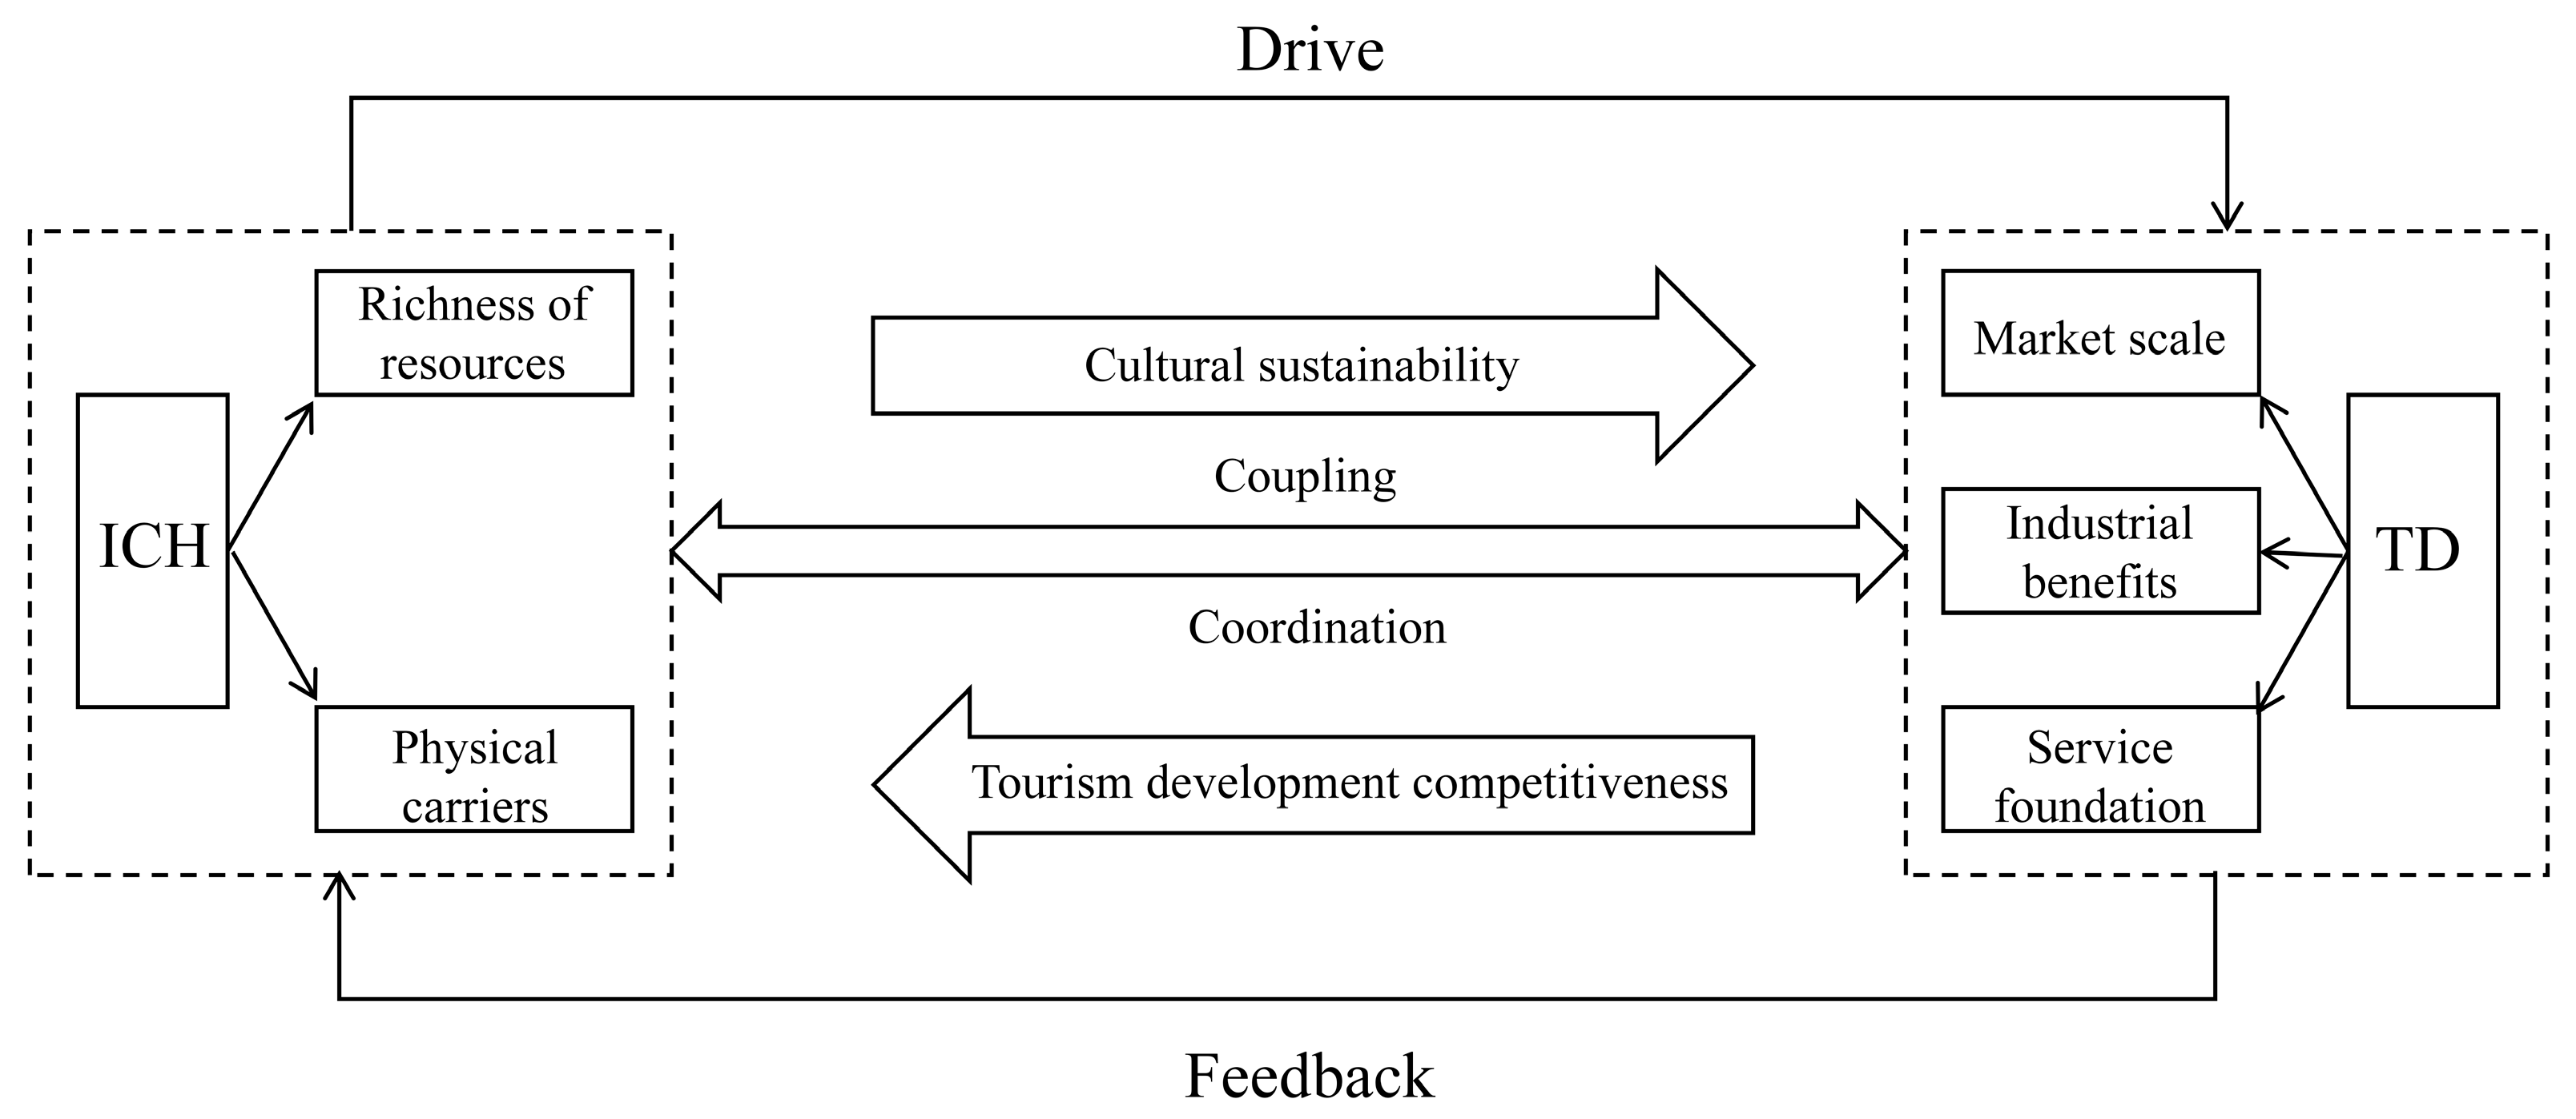
A close, mutually reinforcing relationship exists between intangible cultural heritage (ICH) and tourism development (TD), as conceptualized in Figure 2. On one hand, ICH encompasses not only quantitative attributes, such as the number, classification level, and spatial density of listed items [32,33,34], but is fundamentally embedded in living traditions. These traditions, including crafts, performances, and festivals, are sustained across generations within specific cultural spaces and communities. The richness of ICH resources constitutes the inherent cultural endowment of a region, while their physical and human carriers provide a tangible foundation for dynamic transmission and presentation. On the other hand, TD, as a significant sector for national and regional development, relies on attractions, accommodation facilities, and professional services. This infrastructure and service ecosystem generates considerable economic, social, and environmental value through visitor activities and expenditures [35].
Figure 2.
Coupling coordination mechanism.
Within the context of China’s cultural and tourism integration policies, many ICH resources have been channeled into the TD sector, thereby gaining broader public visibility. Through transformation into experience-based and consumable cultural products, ICH acquires renewed economic viability and social relevance. This, in turn, supports its sustainable safeguarding. Conversely, the distinctiveness and depth of ICH enrich tourism destinations with a unique cultural identity. This elevation of tourist experiences from superficial sightseeing to meaningful cultural engagement enhances TD competitiveness in an increasingly saturated market.
The coupling coordination mechanism embodies a bidirectional interaction. The sustained vitality of ICH drives the long-term cultural sustainability of tourism products. Conversely, TD competitiveness derived from a culturally enriched tourism sector can generate feedback, bringing increased support for ICH protection. This process forms a mutually reinforcing positive cycle.
Table 1 presents the evaluation index system for assessing the coupling coordination degree between ICH and TD, comprising 12 representative indicators across both subsystems.
Table 1.
Evaluation index system for the coupling coordination of ICH and TD.
In the system of ICH, the richness of resources and physical carriers are utilized to reflect the development status [32,33]. Three indicators, drawn from previous research, are used to measure resource richness: the number of ICH projects, density of ICH in the region, and grade of ICH. The first indicator, the number of projects, aggregates national- and provincial-level ICH items. The second, spatial density, refers to the distribution density of these projects per unit area within a specific region [34]. For the third indicator, grade of ICH projects, value weights are assigned to projects at different administrative levels: UNESCO (3), national (2), and provincial (1); the grade for a region is then calculated by summing the weighted counts of projects at each level. Due to the intangible nature of ICH, physical carriers are required for its transmission and sustainable development. First, recognized inheritors represent the mechanism of vertical transmission across time. This indicator is quantified as the count of provincially and nationally recognized ICH inheritors. Second, dedicated inheritance sites facilitate horizontal transmission across space. Therefore, this indicator is operationalized as the number of cultural centers and museums dedicated to preserving, exhibiting, and promoting ICH.
Within the TD system, three key dimensions are selected as evaluation indicators based on relevant research. Market scale serves as a primary indicator of the overall development level, measured by the annual number of domestic and international tourists visited [31,35]. Industrial benefits directly reflect the economic contribution of tourism, represented by domestic earnings and foreign exchange earnings [31,37]. Service foundation indicates tourism reception capacity and infrastructure support, captured by the number of A-level scenic spots, star-rated hotels, and travel agencies [36,38,39,40]. Therefore, market scale, industrial benefits, and service foundation constitute the core indicators for evaluating the TD subsystem.
2.3. Research Hypothesis About the Influencing Factors
This study focuses on the relationship between ICH and TD. CCD is influenced by a complex interplay of multidimensional factors. Drawing on established research [41,42,43], comprehensive economic strength (RGDP), distribution of industrial structure (IND), overall level of urbanization (URB), transportation accessibility (TRANS), scale of innovation (RD), and human resource capital (HC) were chosen, for a total of 6 factors. And Table 2 presents indications that characterize all variables.
Table 2.
Evaluation index system of influencing factors.
Regional comprehensive economic strength (RGDP) serves as the material guarantee for ICH protection and TD. Regions with higher per capita GDP usually have stronger financial capabilities for protecting intangible cultural heritage and can invest in the construction of high-level tourism infrastructure, thereby enhancing the CCD of the two. Distribution of industrial structure (IND), especially the increase in the proportion of the tertiary industry, reflects the trend of regional economy’s transformation towards being service-oriented. The tourism industry is the core component of the tertiary industry and its development is highly dependent on a complete industrial support system, which is more conducive to the formation of a positive interaction between culture and tourism. Overall level of urbanization (URB) creates market demand for the integration of ICH and TD through population aggregation and consumption upgrading. The increase in urban population means an expansion of the potential tourist consumer group, while the expansion of urban space also provides new activity scenarios. A well-developed transportation network can reduce tourists’ time and economic costs, expand the customer radius of ICH tourism destinations, improve transportation accessibility (TRANS) and convenience of tourism flows, and the improvement of transportation conditions plays an important role in promoting the integration of ICH and TD in remote areas. Scale of innovation (RD) is an important driving force for the digital transformation of the cultural and tourism industry. Through technological innovation, ICH resources can be digitally preserved, displayed and experienced, and the technological content and cultural appeal of tourism products can be enhanced. Human resource capital (HC) is the core element of the operation of the cultural and tourism industry. Highly qualified service industry employees can provide higher-quality tourism experiences in the market.
In order to analyze the impact of this on the CCD of ICH and TD, the following hypotheses are proposed:
H1.
RGDP has a positive impact on the CCD.
H2.
IND has a positive impact on the CCD.
H3.
URB has a positive impact on the CCD.
H4.
TRANS has a positive impact on the CCD.
H5.
RD has a positive impact on the CCD.
H6.
HC has a positive impact on the CCD.
2.4. Research Methods
2.4.1. Concentration Index
The Lorenz curve is employed to characterize the structural distribution of ICH resources, and the concentration index is an important indicator for quantifying the degree of concentration of ICH resources within a region [28]. It is calculated using the following formula:
In the formula, C represents the actual cumulative percentage of ICH resource distribution. M denotes the sum of cumulative percentages when the 10 types of ICH are fully distributed. K is the sum of cumulative percentages when the 10 types of ICH are evenly distributed. The calculated value of I reflects the degree of concentration of ICH resources. Its value ranges from 0 to 1, where a higher value indicates a greater degree of resource concentration.
2.4.2. Kernel Density Analysis
Kernel density analysis is used to calculate the density of elements within a specified bandwidth, which can visually display areas of spatial aggregation for intangible cultural heritage [44]. It can be applied to both point and line elements. The calculation formula is as follows:
In Equation (2), x represents the location of a certain ICH. h is the nuclear density radius value, n is the number of ICH points, k is the kernel density function, x − xi represents the distance from the valuation point x to the event xi. The kernel density value diffuses outward from each ICH point, decreasing with distance. Consequently, the density is highest at the location of the ICH points themselves.
2.4.3. Entropy Method
The entropy method takes the existing data information as a reference, which can avoid the interference of subjective human factors and objectively determine the weights of each indicator [45]. Suppose there are m evaluation objects and n evaluation indicators in total, that is i = 1, 2,⋯, m; j = 1, 2, ⋯, n. The original data matrix is:
First, the indicators of different measurement units require standardization. All the indicators in this article are positive indicators, indicated by a “+” in Table 1; the larger the value, the higher the level of the indicator. To avoid 0 values in the calculation process, a 0.0001 unit translation is performed. The processing formulas are as follows:
In Equations (4)–(8), Pij represents the proportion of the i-th evaluation object under the j-th indicator, ej indicates the entropy value of the j-th indicator, m is the sample size, wj is the weight of the j-th indicator, and Ui represents the comprehensive development level index of a system [33].
2.4.4. Coupling Coordination and Relative Development Degree Model
- (1)
- CCD model
The coupling coordination degree (CCD) model is used to measure the degree of synergistic interaction and coordinated development between two or more systems [46]. In this study, ICH and TD are treated as two mutually coupled systems, and a CCD model is constructed to assess their relationship.
In these formulas, indicates the comprehensive development level of ICH and the means level of TD, calculated using the entropy method. C is the coupling degree, T is the comprehensive evaluation index, α and β are undetermined coefficients. D is the CCD. Considering that ICH serves as a foundational resource for cultural tourism integration and actively influences TD, the contribution coefficients were set as α = 0.4 for ICH and β = 0.6 for TD.
- (2)
- RDD model
In order to further analyze the relationship between the two systems and identify their relative development status [43], the relative development degree (RDD) model is introduced:
In the formula, P represents the RDD. Based on the value, the relationship is classified into the ICH-lagged type, the synchronous balanced type, and the TD-lagged type. The classification criteria for both CCD and RDD are presented in Table 3.
Table 3.
Grade division of CCD and RDD between ICH and TD.
2.4.5. Tobit Model
To further test the research hypotheses regarding the determinants of the CCD between ICH and TD, the calculated CCD is employed as the dependent variable, while potential influencing factors are designated as independent variables for regression analysis. The CCD, which ranges between 0 and 1, is a typical restricted dependent variable, making it suitable for analysis via the Tobit model [47]. Therefore, a panel Tobit model is constructed to identify the influencing factors underlying the CCD of ICH and TD. The model is specified as follows:
In the formula, i represents the i-th city, j represents the j-th factor, t represents the year, Yit represents the CCD of the i-th city in the t-th year, Xijt is the influencing factor variable, βj is the parameter to be estimated, εit represents the random disturbance term, β0 is the constant term.
2.5. Data Resources
The study period spanned from 2014 to 2023. In the index system of ICH, data on the number of ICH and the inheritors were sourced from the list published on the China Intangible Cultural Heritage Network (https://www.ihchina.cn/, accessed on 1 June 2025) and The People’s Government of Sichuan Province (https://www.sc.gov.cn/10462/index.shtml, accessed on 1 June 2025). Data on the TD system, inheritance sites, and regional cities’ area were extracted from Sichuan Statistical Yearbook (https://tjj.sc.gov.cn/scstjj/c112132/pic_list.shtml, accessed on 1 June 2025). In the index system of influencing factors, factors data were all derived from the Sichuan Statistical Yearbook (https://tjj.sc.gov.cn/scstjj/c112132/pic_list.shtml, accessed on 1 June 2025).
3. Results
3.1. Distribution Characteristics of ICH Resources
3.1.1. Type Distribution Structure
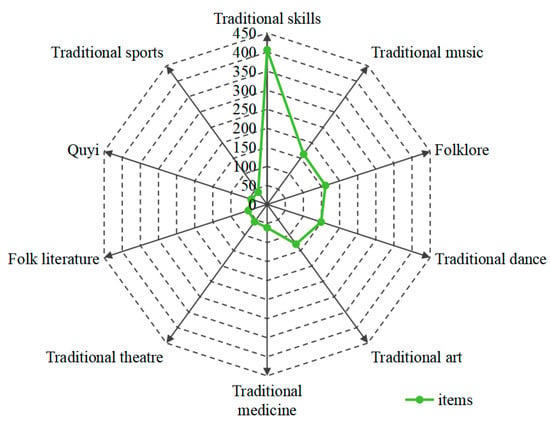
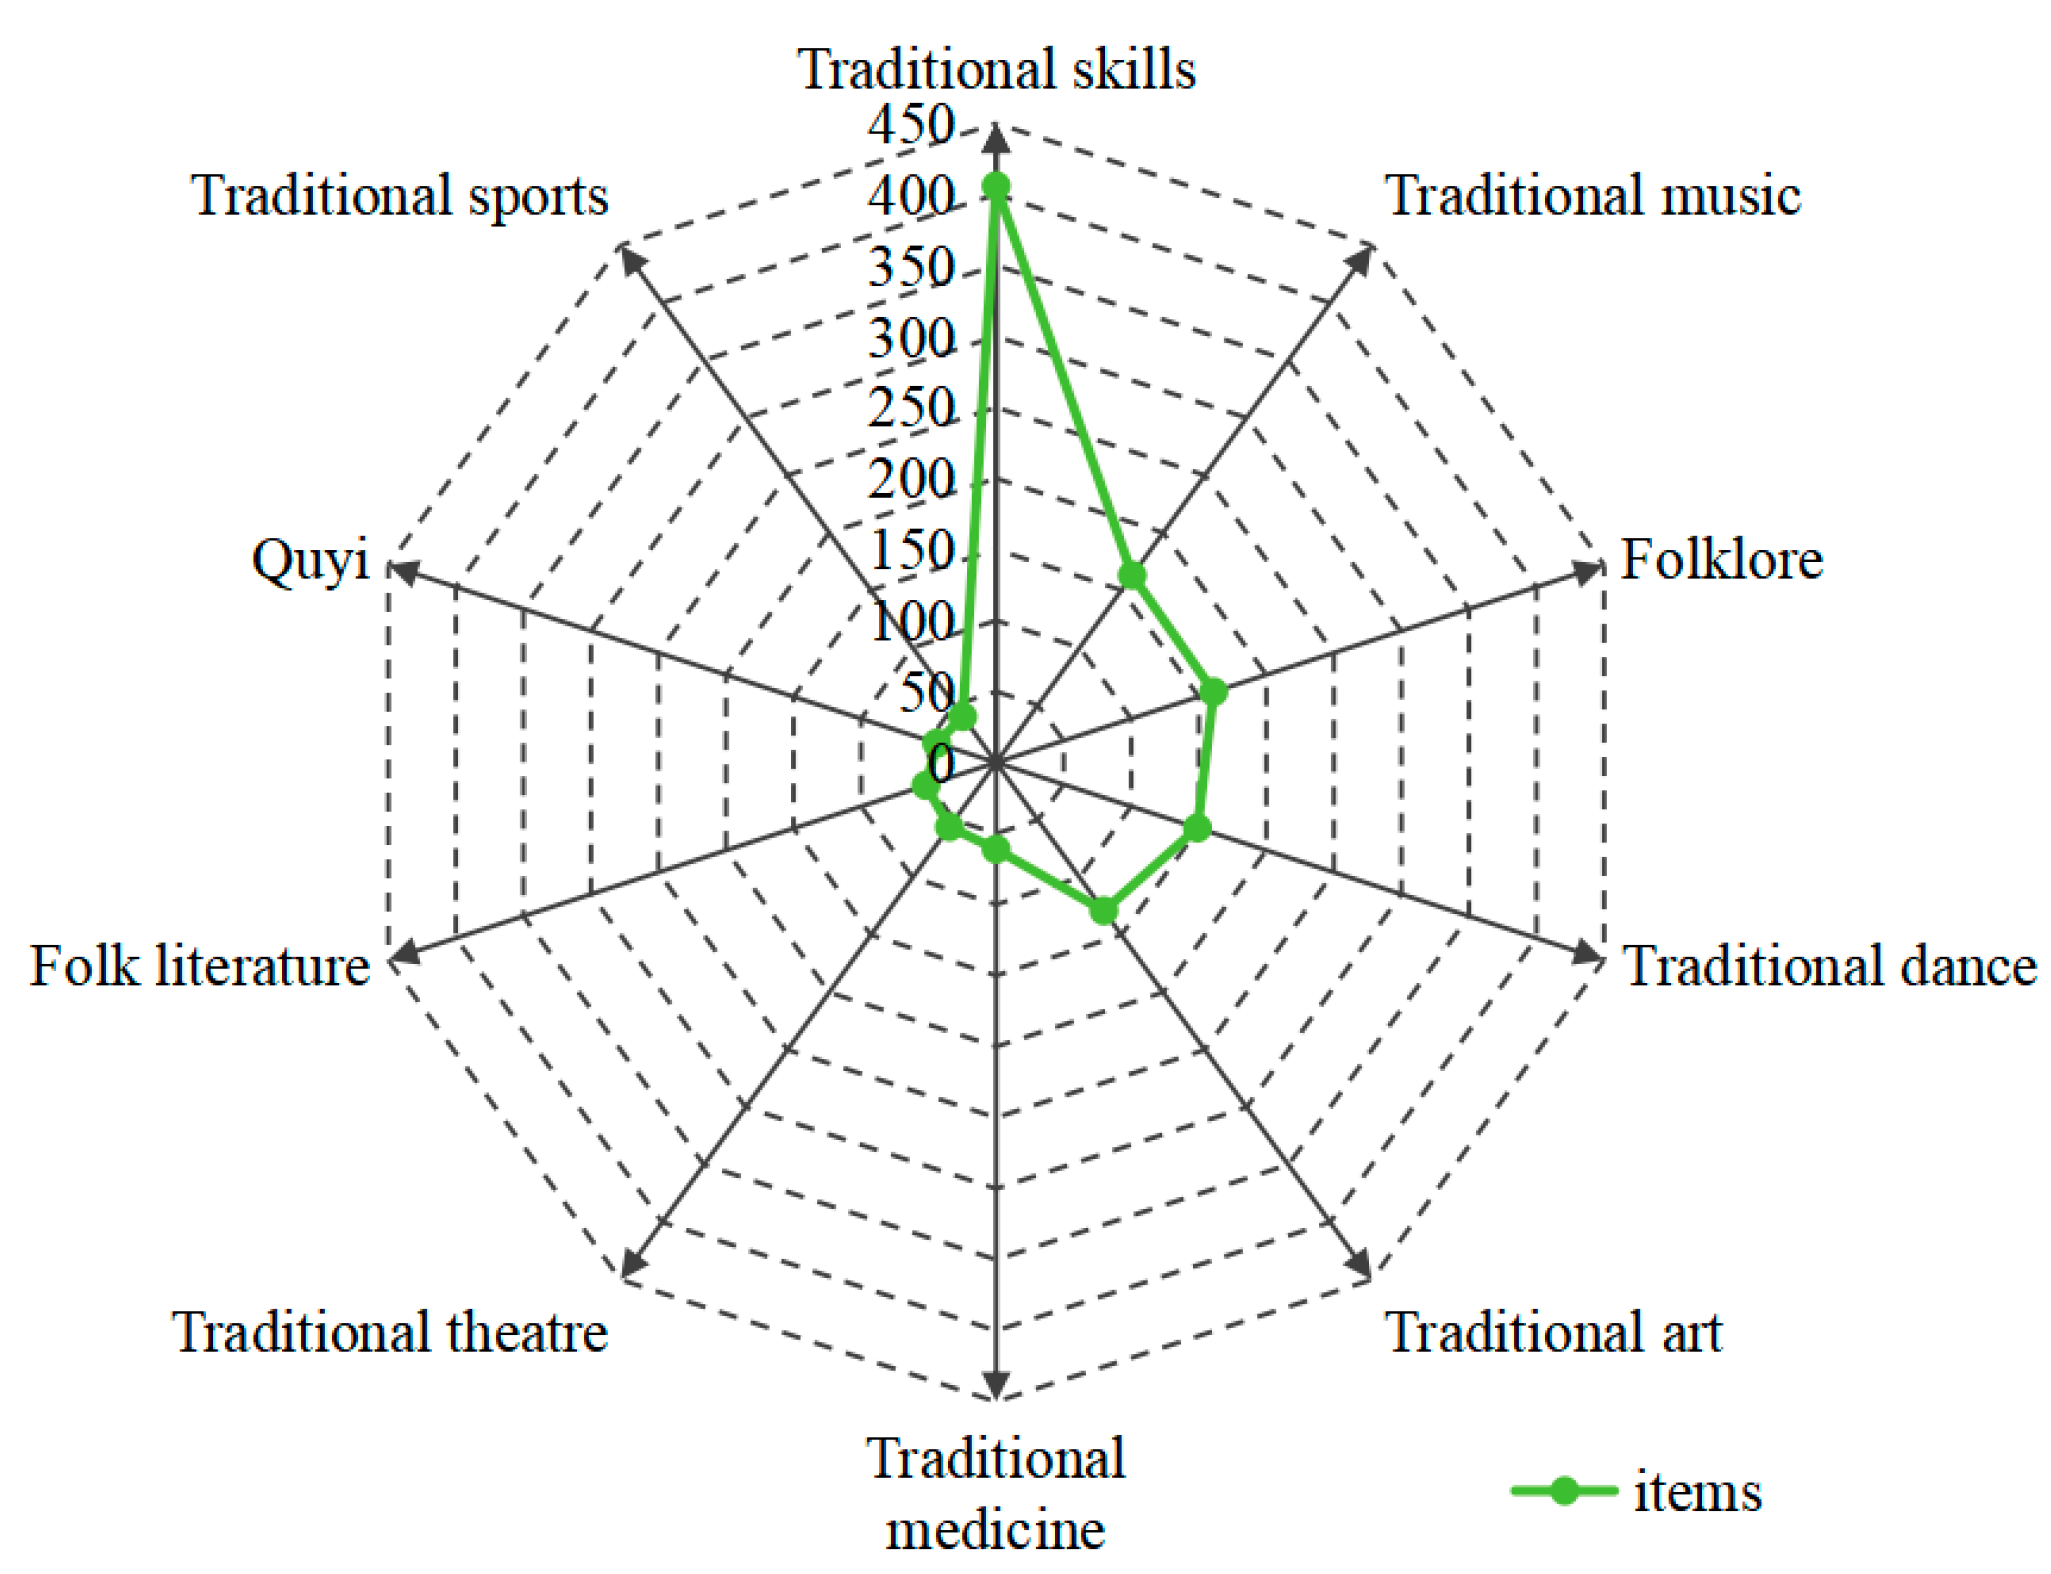
In China, intangible cultural heritage (ICH) is officially classified into 10 categories. As of June 2025, Sichuan Province possessed 15 UNESCO-listed elements, 153 nationally recognized items and 1132 provincially designated items. As some provincial-level heritage items are jointly administered by multiple institutions, they were further disaggregated into 1261 discrete entries based on protecting units. All subsequent analyses were based on the later number (n = 1261). The ICH of Sichuan Province exhibits considerable quantitative abundance, comprehensive typological coverage, and a high-value hierarchy. As shown in Figure 3, the distribution across categories was markedly uneven. Traditional skills were numerically dominant, comprising 406 items and accounting for 32.2% of the total. This was followed by traditional music (163 items; 12.9%), folklore (161 items; 12.8%), traditional dance (149 items; 11.8%), and traditional arts (129 items; 10.2%), with each category exceeding 10% of the total. All of them were important parts of people’s daily needs for food, clothing, and daily necessities, which likely contributes to their more extensive preservation. In contrast, quyi and traditional sports each accounted for less than 4% of the total. Calculated using Formula (1), the concentration index was 0.44, confirming a distinctly uneven structural distribution of ICH resources across categories.
Figure 3.
Statistical of types and quantity proportions of ICH.
3.1.2. Spatial Distribution Characteristics
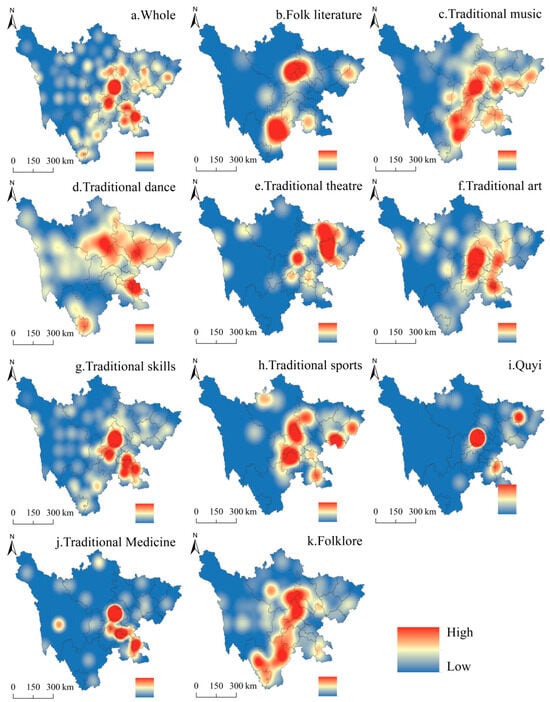
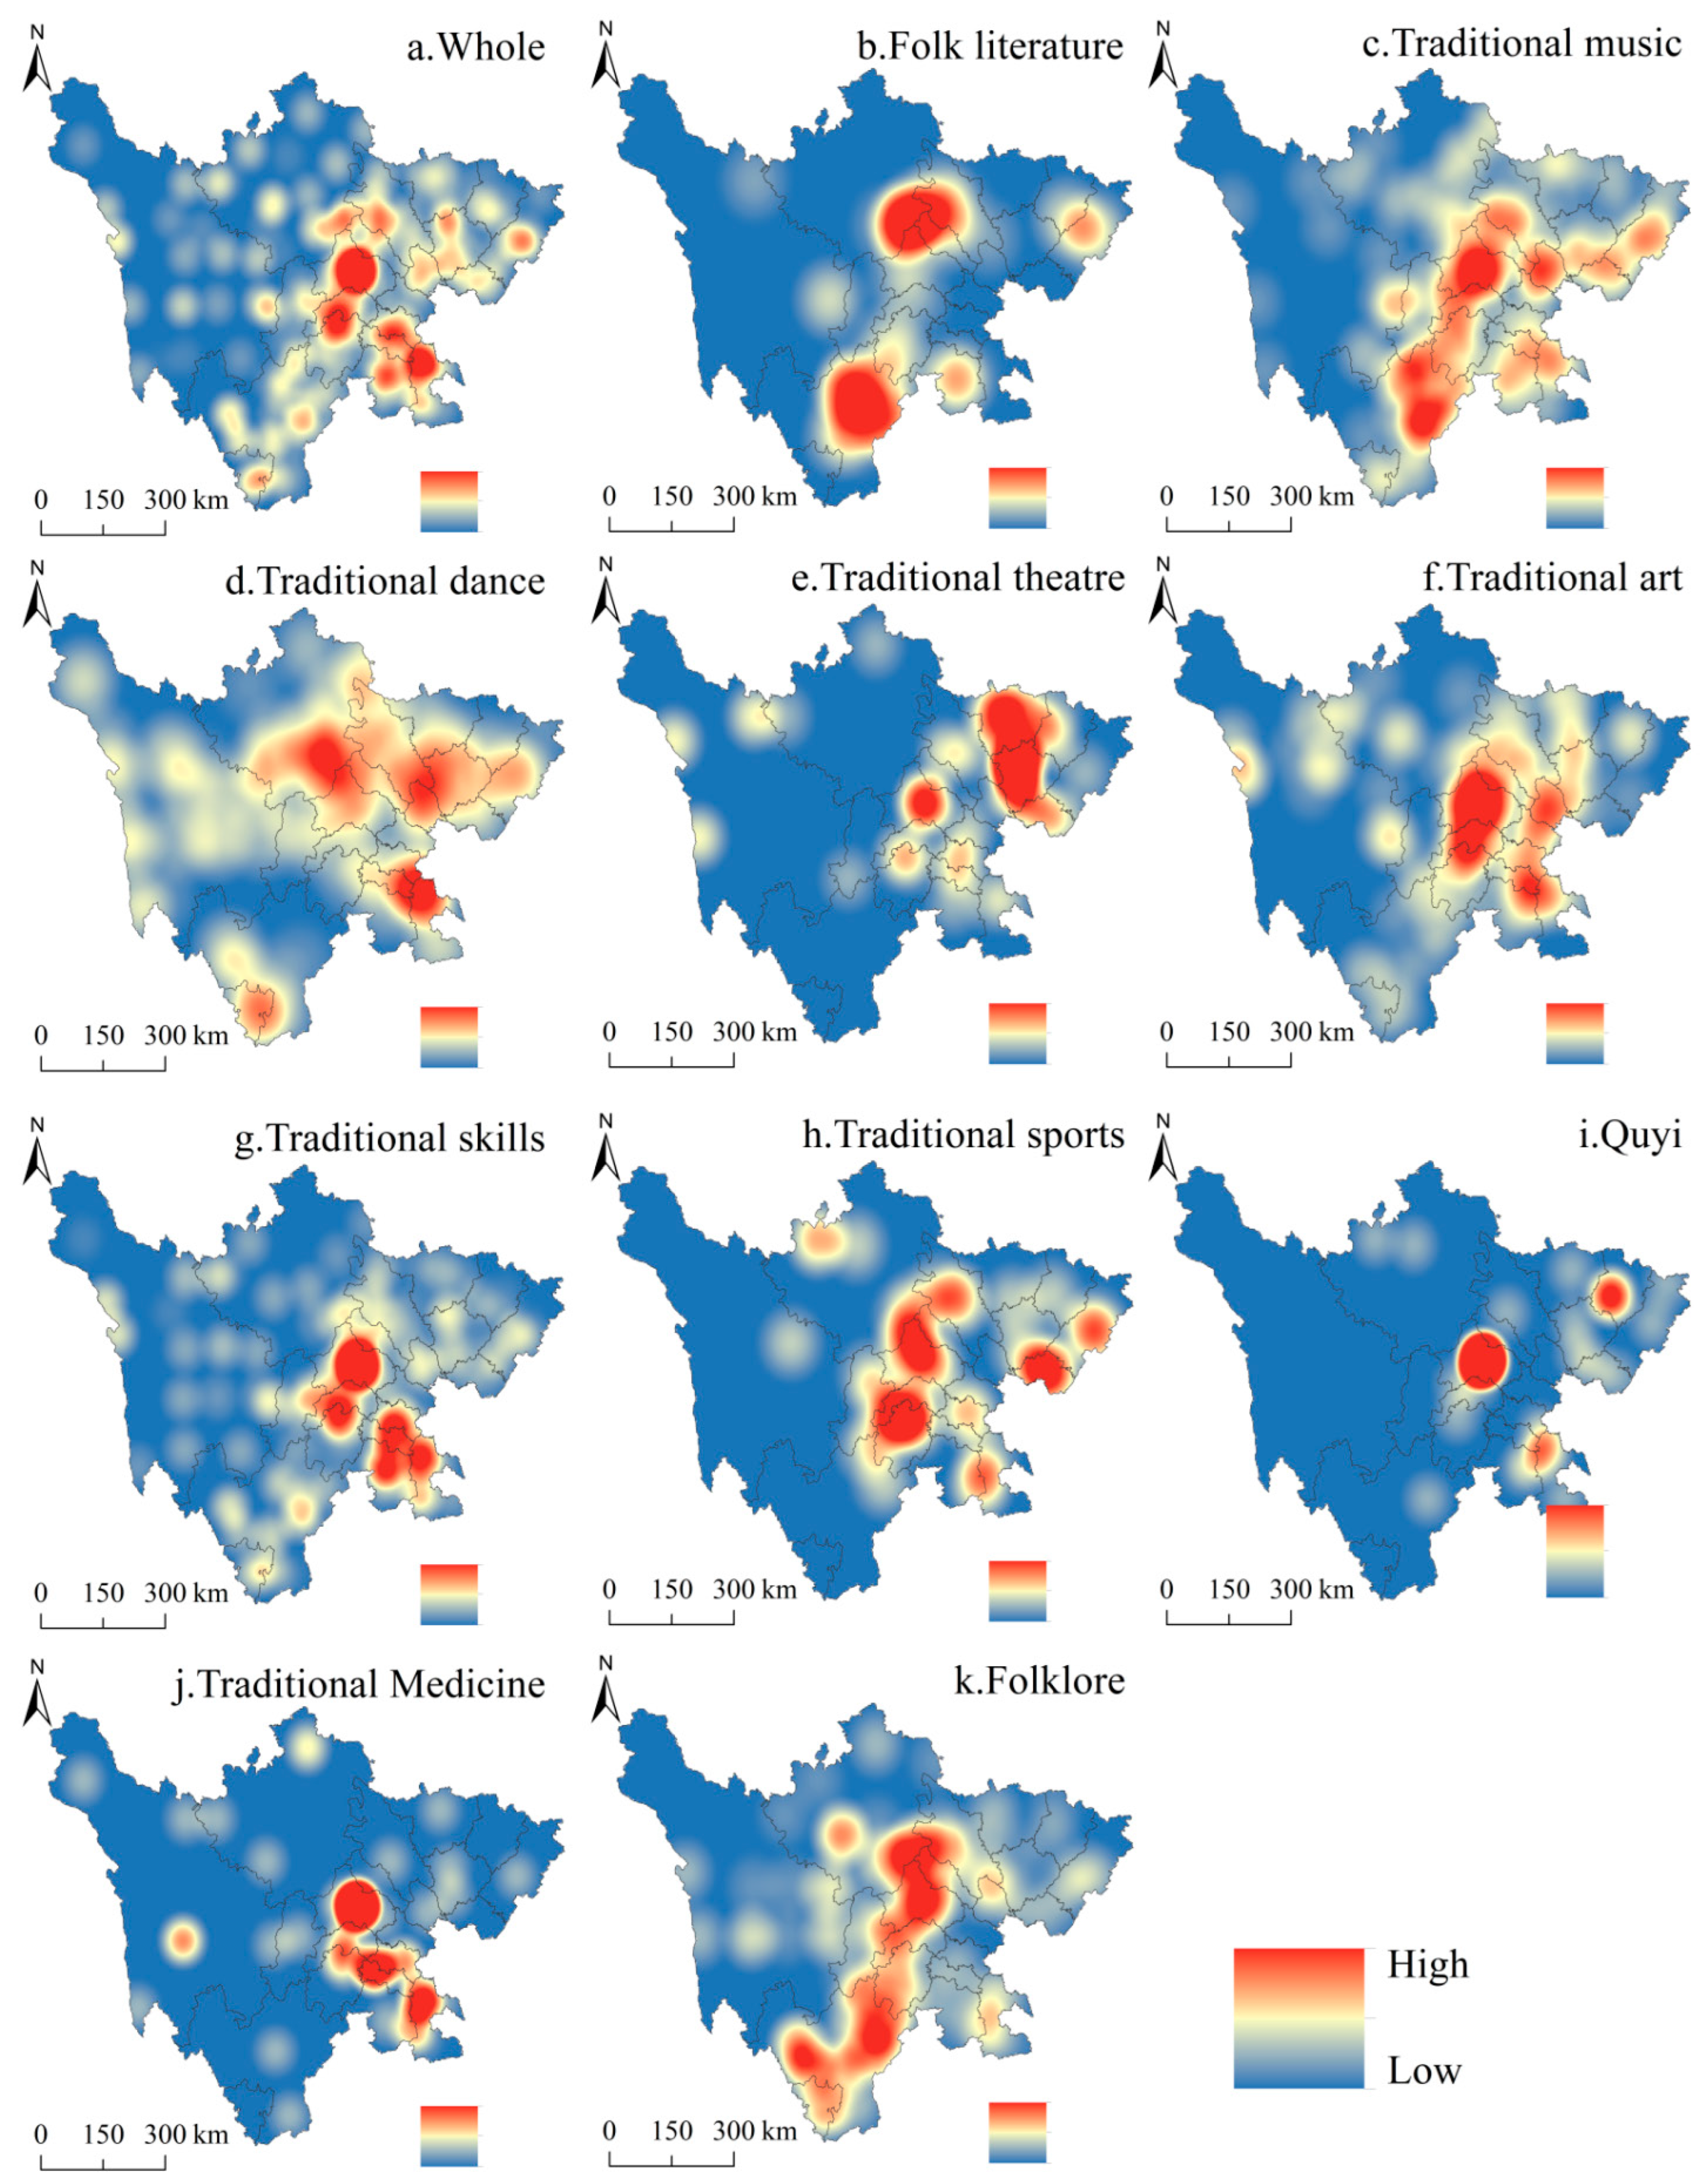
Kernel density analysis revealed an uneven geographical distribution of ICH across Sichuan, characterized by significant spatial heterogeneity characterized by a “one core-one belt-multiple clusters” pattern (Figure 4a). The high-density core area is centered on Chengdu, radiating outward to include Mianyang, Deyang, and Leshan. A relatively dense north–south belt extends from Panzhihua and Liangshan toward Chengdu. Southern clusters are concentrated around Luzhou and Yibin, while northeastern clusters are identified in Nanchong, Guang’an, and Dazhou. Overall, the Chengdu Plain exhibits the highest ICH concentration. Although Liangshan in the southwest, along with Ganzi and Aba in the west, possess substantial quantities, their vast territorial areas result in lower distribution densities.
Figure 4.
Kernel density analysis of ICH in Sichuan.
Kernel density analysis was applied to each of the ten ICH categories, revealing their distinct agglomeration and distribution characteristics (Figure 4b–k). Folk literature exhibits high-density areas at the junction of Chengdu, Deyang, Mianyang, and Aba, as well as in Liangshan. Secondary dense areas are located in Yibin and the Dazhou–Bazhong region, forming an agglomeration pattern of two primary and two secondary zones. Traditional music, traditional art, traditional skill, traditional sports and folklore are widely distributed but exhibit distinct spatial characteristics. Traditional music appears in patchy distributions east of Chengdu. In southern Sichuan, Luzhou forms the core of traditional dance, whereas in the north, it appears in clustered patches. Traditional arts are most densely concentrated in Chengdu, extending along a north–south axis. High-concentration areas of traditional skills were identified in Chengdu–Leshan and Yibin–Luzhou. Traditional sports are relatively concentrated in the Chengdu–Mianyang area, Leshan–Meishan and Guang’an area. Folklore exhibits an axial distribution across central Sichuan. Traditional theater is concentrated in the northeastern part of the province, with a secondary core in Chengdu and its surroundings. Traditional medicine clusters in Chengdu and southern regions, while quyi is focused on Chengdu, with secondary cores in Luzhou and Bazhong.
The results indicate that ICH resources in Sichuan are predominantly distributed in the central region surrounding Chengdu, as well as in the northeastern and southeastern parts of the province. This spatial pattern aligns with regional socioeconomic development levels, suggesting its supportive role in ICH preservation and transmission. Additionally, a notable presence of traditional dance, traditional skills, and traditional medicine was observed in the western region.
3.2. Spatiotemporal Characteristics of CCD Between ICH and TD
3.2.1. Comprehensive Development Levels of the ICH and TD
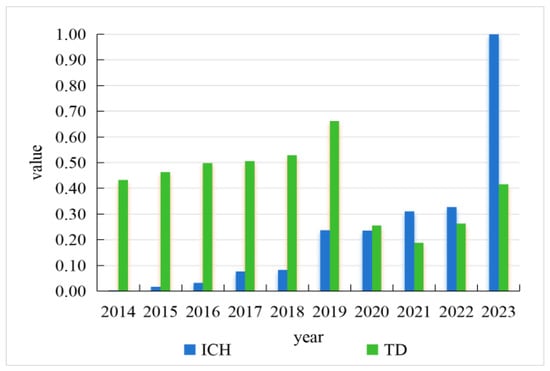
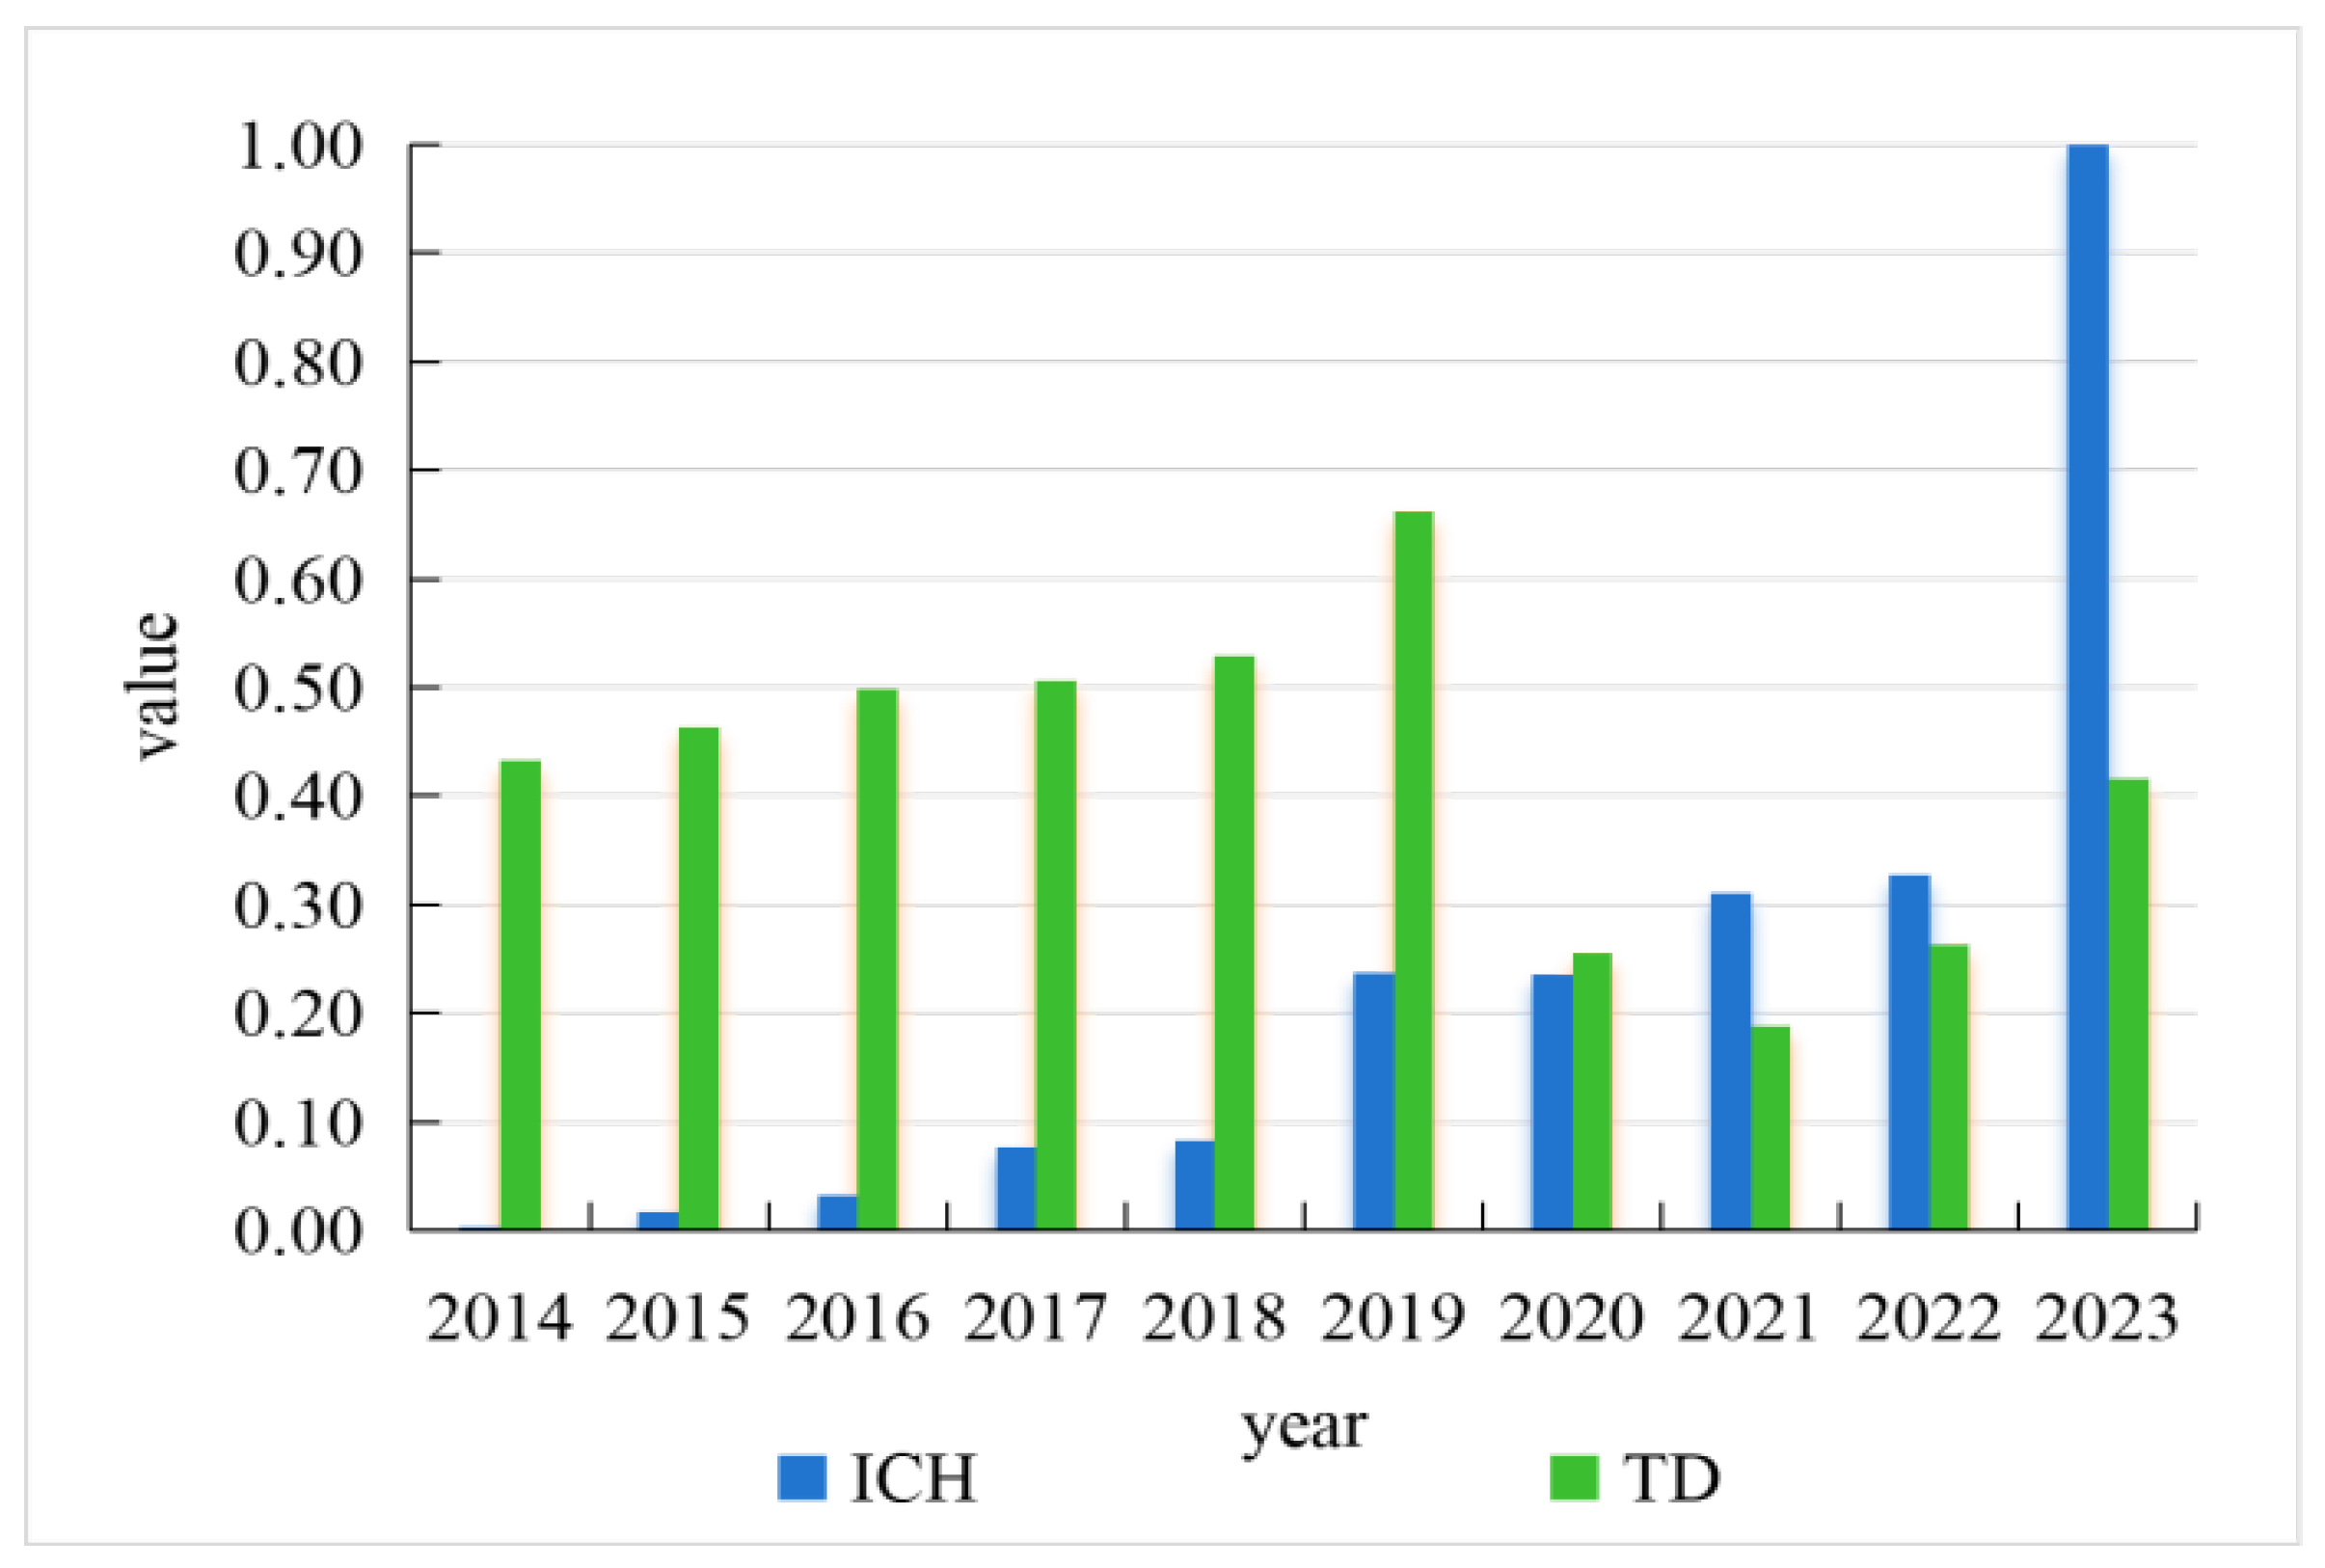
Comprehensive development levels of ICH and TD in Sichuan from 2014 to 2023 were calculated by the entropy method, and the temporal trends are presented in Figure 5.
Figure 5.
Trend of comprehensive level of ICH and TD.
- (1)
- Comprehensive development level of ICH
From 2014 to 2023, Sichuan Province demonstrated steady growth in its ICH development level. A phase of gradual improvement from 2014 to 2018 was followed by notable stepwise increases in 2019 (with a value of 0.2372) and 2023 (1.0000). This accelerated growth corresponds with China’s institutional efforts in ICH preservation, including national-level ICH designations in 2014 and 2021, national inheritor certifications in 2018, and multiple provincial-level recognitions through the period. These systematic surveys and official recognitions strengthened Sichuan’s ICH resource endowment through three mechanisms: continuous discovery of heritage items, expansion of tangible transmission channels, and growth of inheritor networks. The baseline year of 2014 showed the lowest value, reflecting both methodological normalization and the province’s initial stage in systematic ICH preservation efforts at that time. The period from 2019 to 2023 saw significant improvements, where the quantitative expansion of recognized heritage resources and inheritors contributed to measurable advancements in Sichuan’s overall ICH development index. This pattern demonstrates how policy-driven recognition cycles shape regional ICH development trajectories.
- (2)
- Comprehensive development level of TD
The comprehensive development level of tourism development (TD) exhibited consistent growth from 2014 to 2019, reaching a peak of 0.6624 in 2019. This expansion benefited from favorable global economic conditions, China’s Western Development Strategy, the Chengdu-Chongqing Economic Circle initiative, as well as the province’s abundant tourism resources and effective marketing. However, the index experienced significant fluctuations from 2020 to 2022. It declined to 0.2551 in 2020, reached its nadir (0.1873) in 2021, and recovered only marginally to 0.2632 in 2022. These downturns are one result of COVID-19 containment measures, including travel restrictions and lockdowns, which severely impacted the tourism sector. In December 2022, pandemic control measures in China were lifted. Subsequently, state and local governments implemented recovery policies to mitigate losses, promote tourism consumption and stimulate the domestic economy. Consequently, the level recovered rapidly in 2023, with the evaluation value rebounding to 0.4151.
- (3)
- Comparison of the two systems
A comparative analysis revealed shifting dynamics between ICH and TD systems. Initially, TD maintained a dominant position with higher scores from 2014 to 2019, reflecting its more mature development compared to initially limited resource endowment of ICH. A pivotal shift occurred in 2020, leading to a temporary equilibrium between the two systems through divergent pathways, sustained preservation efforts elevated ICH scores, while pandemic impacts depressed tourism performance. This reversal solidified from 2021 to 2023, with ICH surpassing TD to achieve a higher comprehensive development level.
3.2.2. Temporal Analysis of CCD and RDD
- (1)
- Temporal analysis in five zones
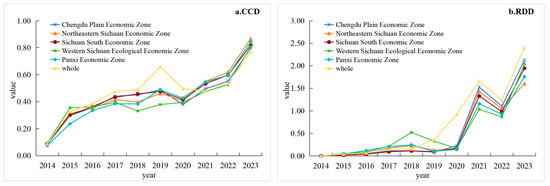
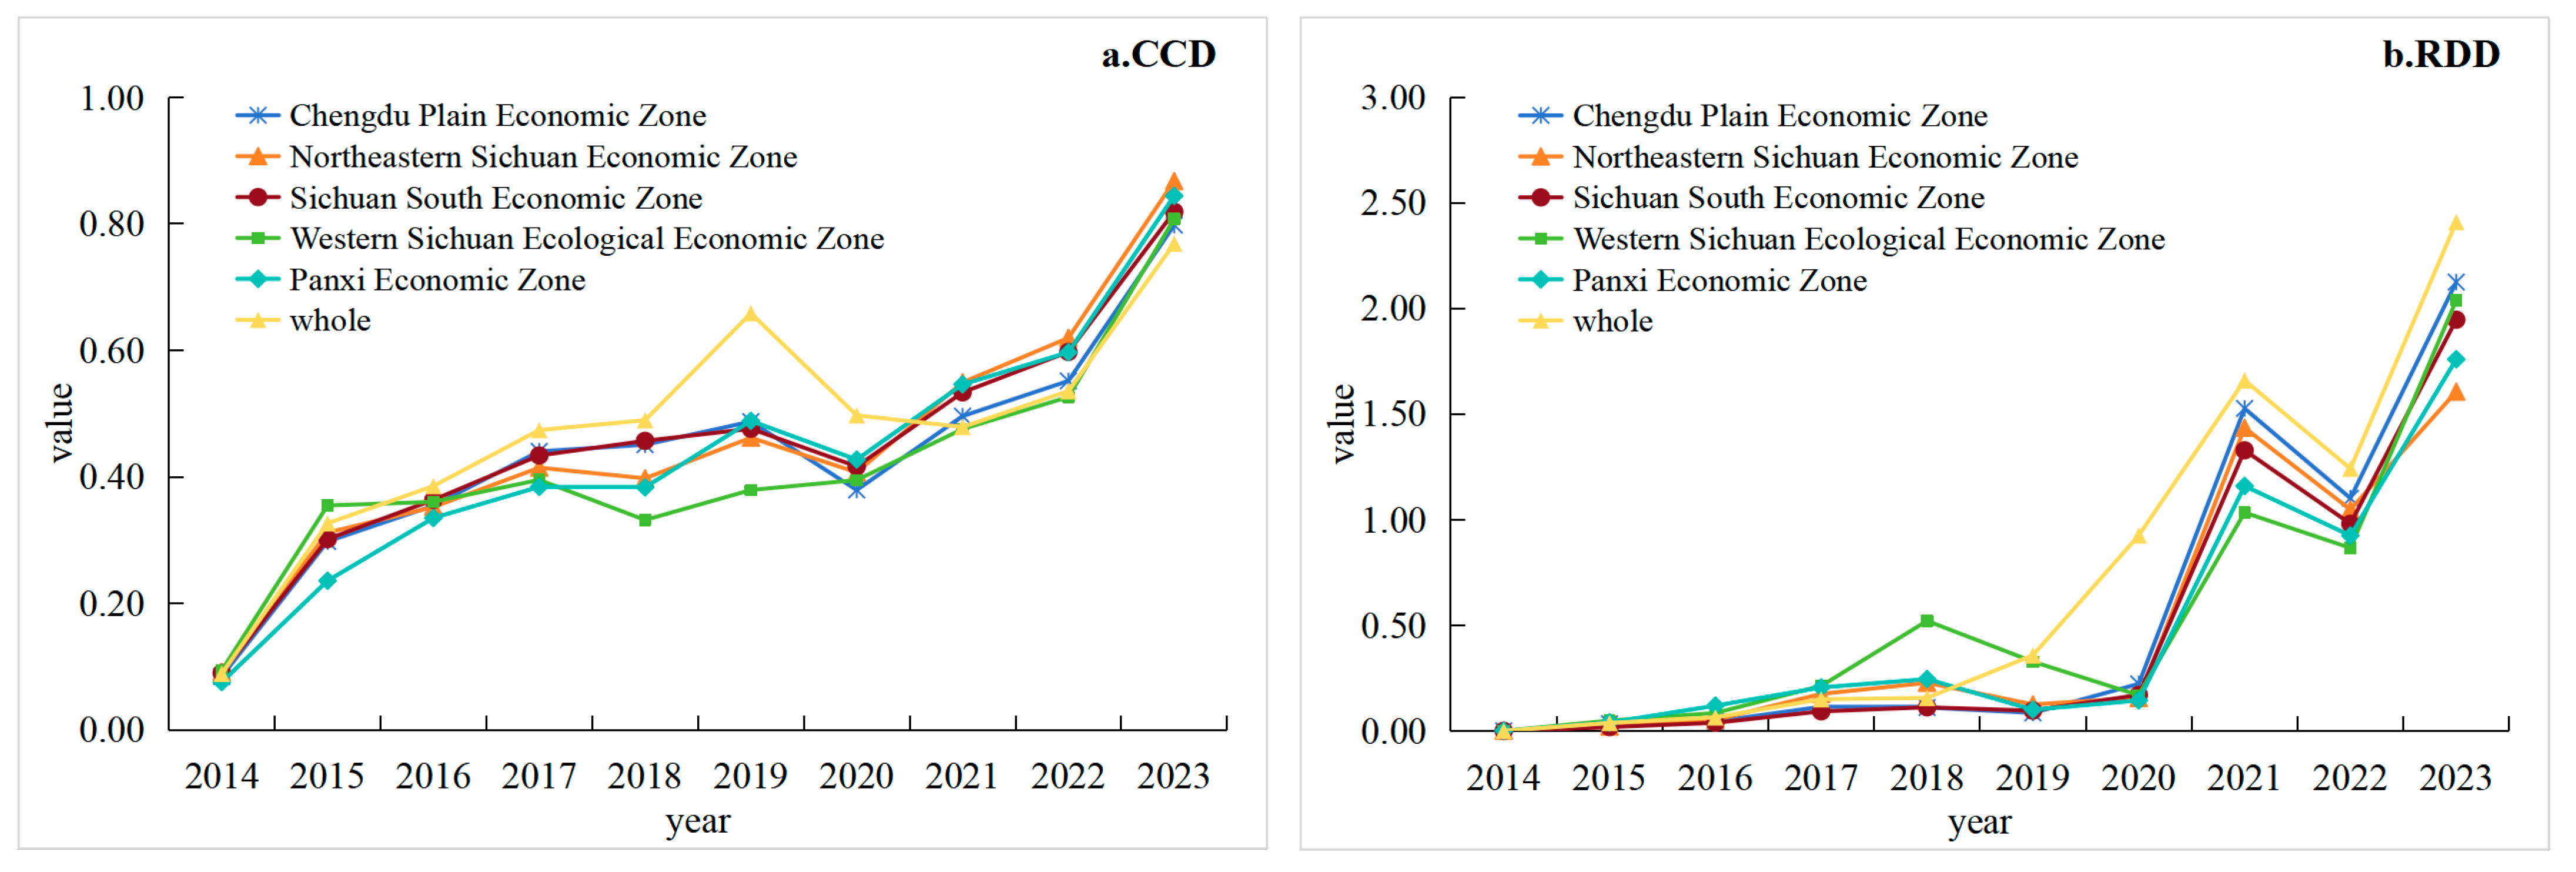
A comparative analysis of coupling coordination degree (CCD) and relative development degree (RDD) was conducted for Sichuan Province overall and its five constituent economic zones. Regarding CCD (Figure 6a), all five zones exhibit temporal trends generally similar to the provincial pattern. Aside from the collective decline or slowed growth in 2020 associated with COVID-19 impacts, CCD values show a consistent increase from near 0 to approximately 0.8 over the study period. This progression indicates a transition from serious imbalance to a state of high coordination. The Western Sichuan Ecological Economic Zone (WSEZ), however, displays more pronounced fluctuations in CCD compared to other zones.
Figure 6.
Temporal changes in CCD and RDD in the five zones. Note: The 5 regions have abbreviations, Chengdu Plain Economic Zone (CDPEZ); Southern Sichuan Economic Zone (SSEZ); Panxi Economic Zone (PXEZ); Northeastern Sichuan Economic Zone (NESEZ); Western Sichuan Ecological Economic Zone (WSEZ).
For RDD, all zones demonstrate upward trends that parallel CCD patterns, albeit with more abrupt transitions (Figure 6b). According to the RDD evaluation criteria presented in Table 2, synchronous development for the province as a whole was only achieved in 2020 and 2022. There was a comprehensive development level of TD, but the region obviously lagged behind in ICH before 2020, with RDD scores all below 0.8. In 2021, the WSEZ and Panxi Economic Zone (PXEZ) had RDD values between 0.8 and 1.2, indicating a synchronous balanced type, while the other zones rapidly transformed into the TD-lagged type. In 2022, all zones shifted to a synchronous development type. However, a sudden transition occurred in 2023, with all zones reverting to a TD-lagged pattern. RDD values for the Chengdu Plain Economic Zone (CDPEZ), WSEZ, and PXEZ exceeded 2.0, indicating a significant development imbalance.
From a coupled systems perspective, both ICH-lagged and TD-lagged patterns are suboptimal for achieving coordinated development. In summary, between 2014 and 2023, the two systems demonstrated clear mutual promotion, as evidenced by the continuously improving CCD. However, achieving sustained developmental synchrony requires further optimization.
- (2)
- Temporal analysis in cities
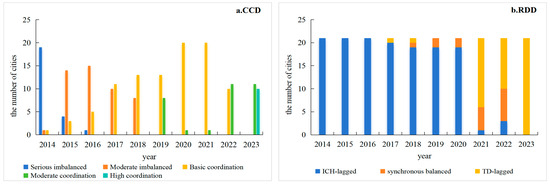
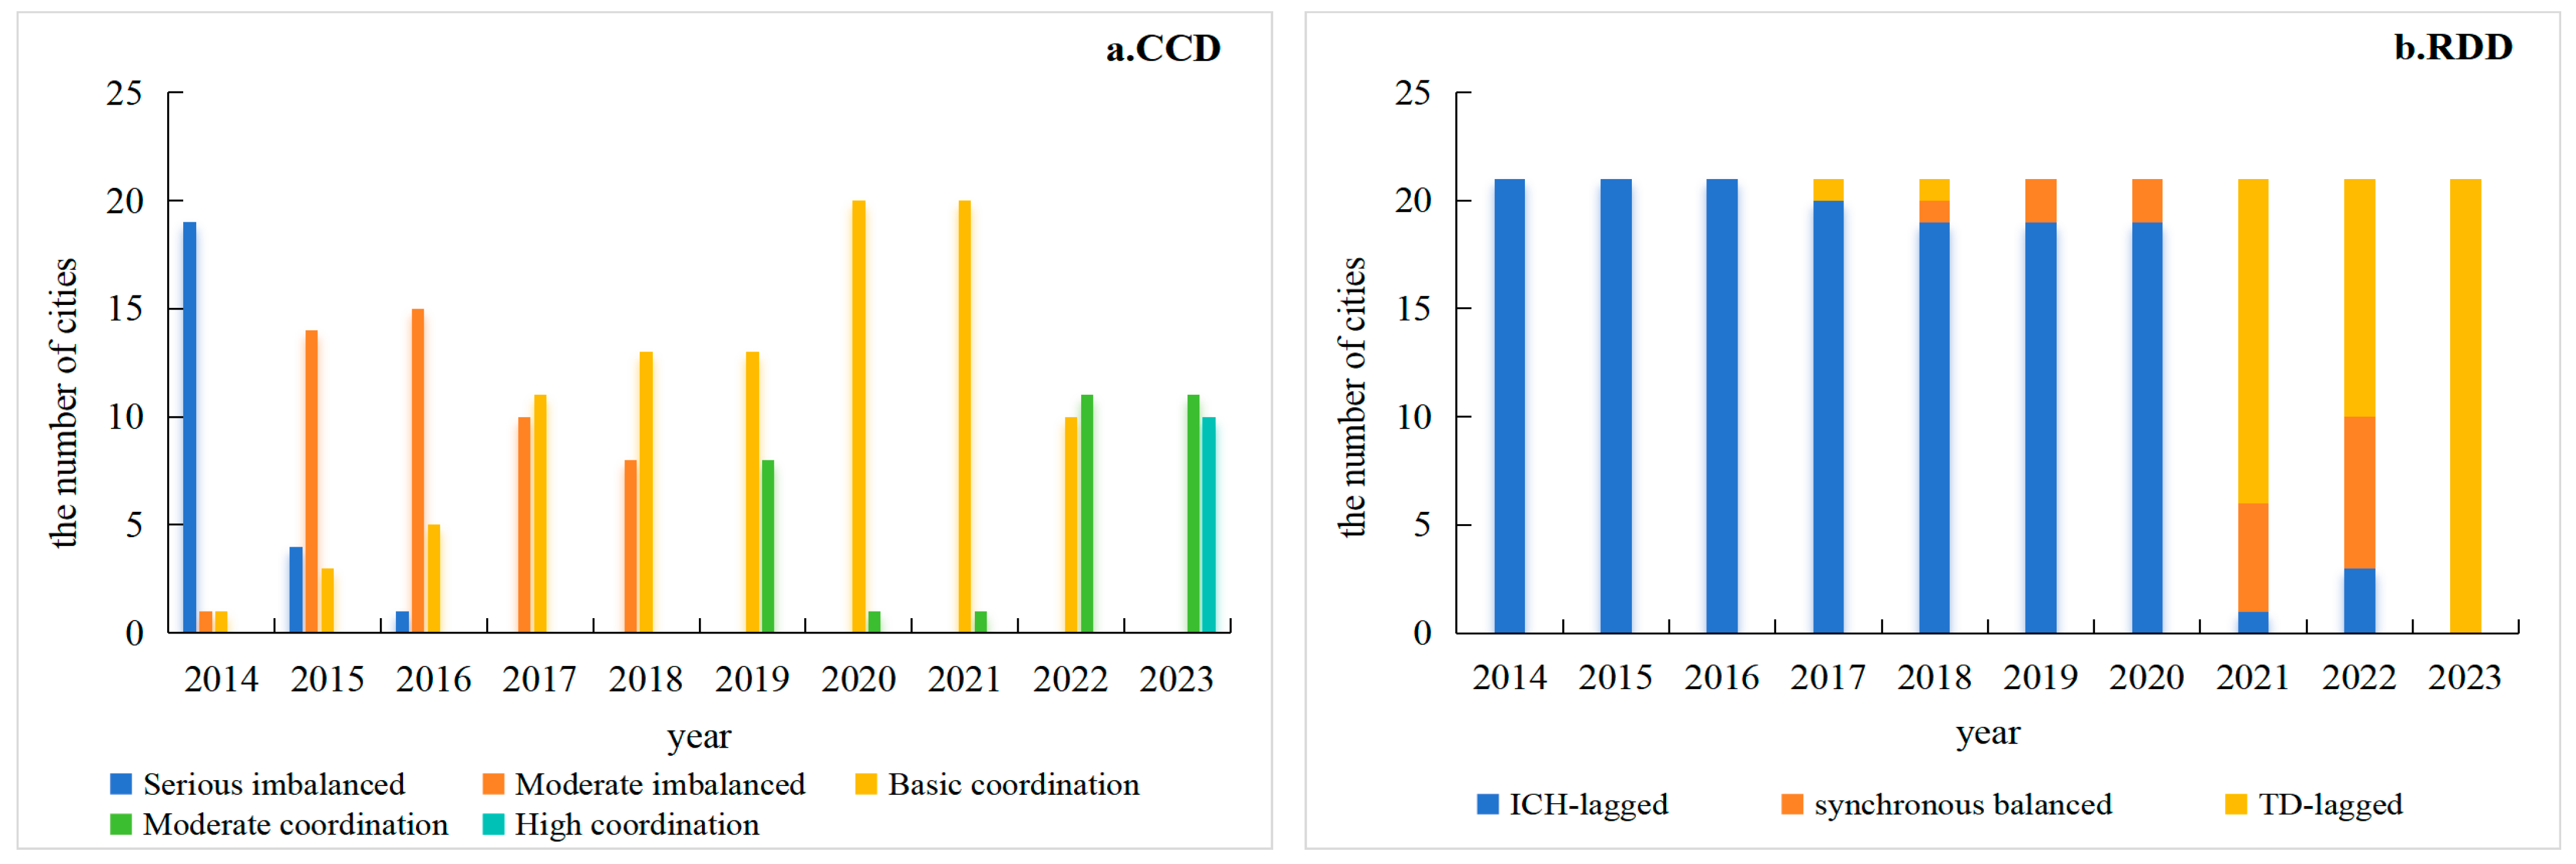
Figure 7 illustrates the temporal evolution of CCD and RDD between ICH and TD across individual cities in Sichuan.
Figure 7.
Temporal changes in CCD and RDD in cities.
Regarding CCD (Figure 7a), the number of cities at a seriously imbalanced stage decreased progressively. In 2014, 19 cities were classified as seriously imbalanced. This number declined in subsequent years, and by 2017, all cities had improved to at least a moderate imbalanced level. After 2019, all cities transitioned to at least a basic coordination stage. In both 2020 and 2021, 20 cities remained at basic coordination, while one city reached moderate coordination. By 2023, the overall developmental state had improved further, with 11 cities attaining moderate coordination and 10 achieving high coordination. Collectively, the study period witnessed pronounced improvement, with cities making a significant leap from serious imbalance to high coordination.
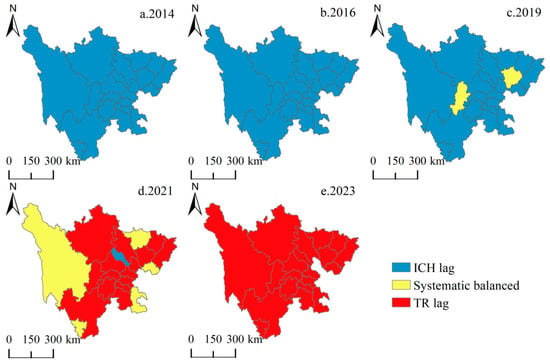
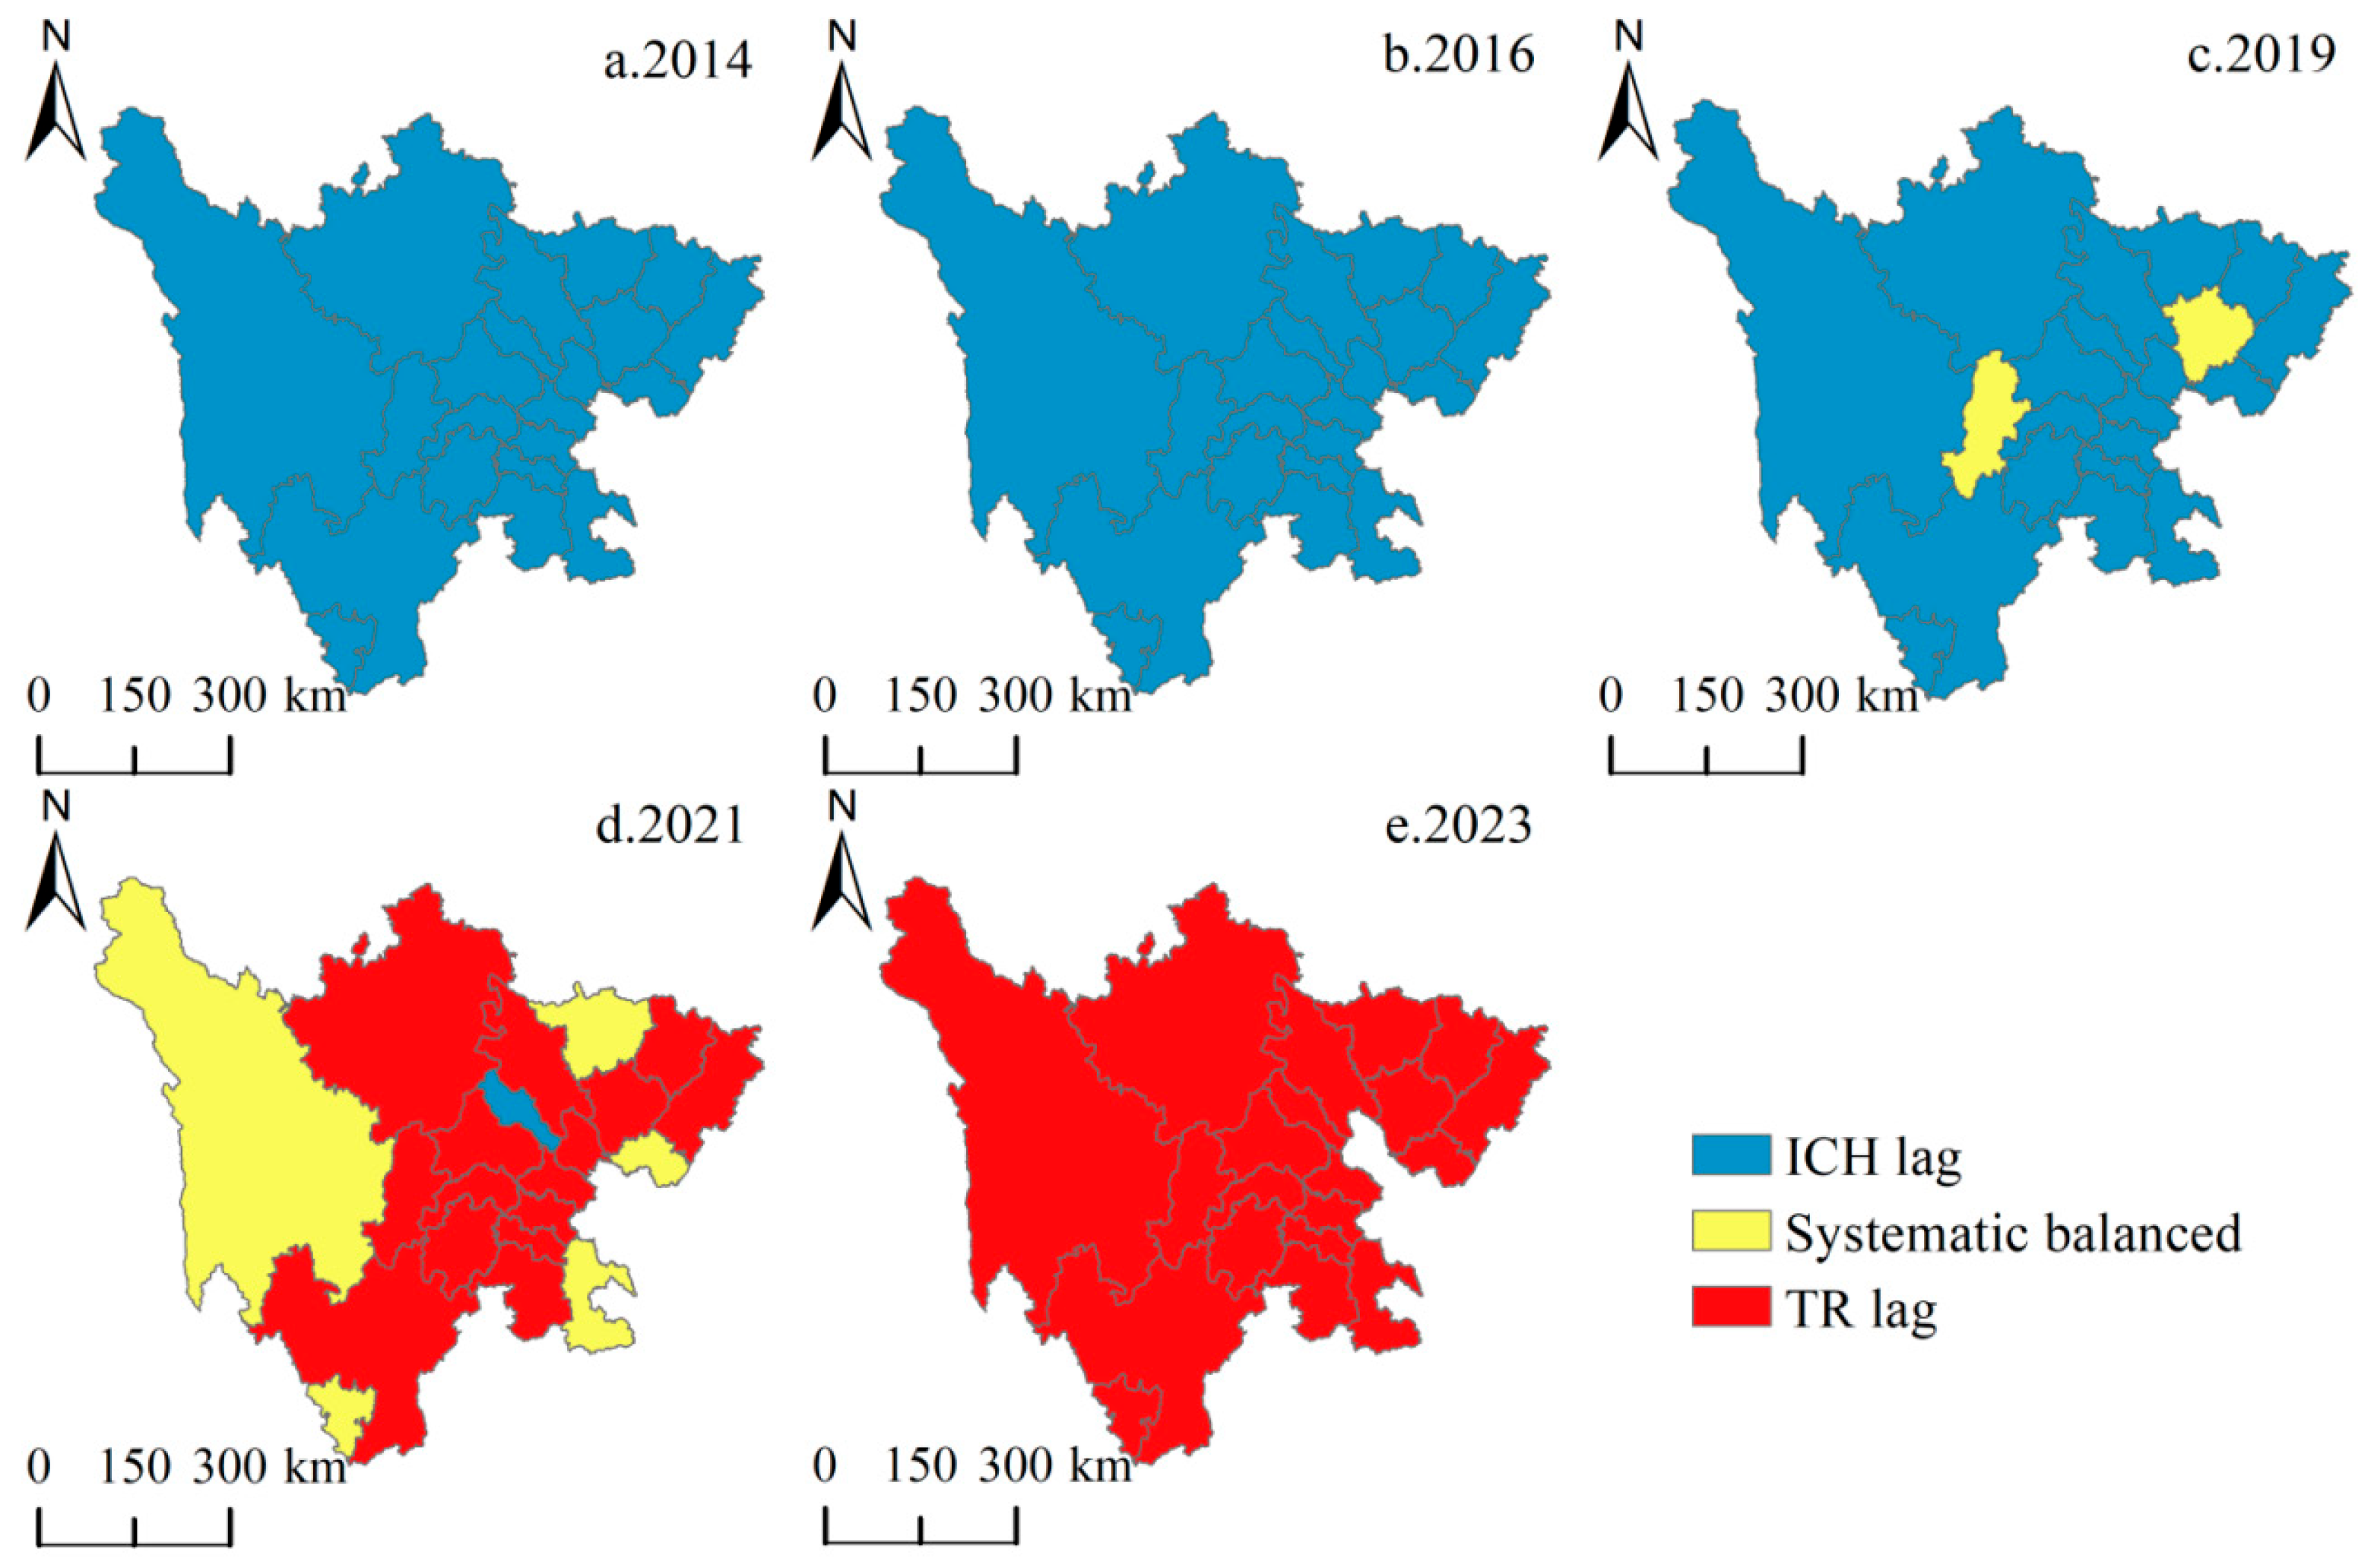
From the perspective of RDD (Figure 7b), all cities had an ICH-lagged pattern from 2014 to 2016. Beginning in 2017, one city shifted to a TD-lagged type. A limited number of cities entered a synchronous balanced phase between 2018 and 2020. A notable shift occurred in 2021, when 15 cities became TD-lagged, while five achieved synchronization. By 2023, a universal TD-lagged status had emerged, indicating systemic TD was now systemically lagging behind ICH progress.
3.2.3. Spatial Analysis of CCD and RDD
- (1)
- Spatial variation in CCD
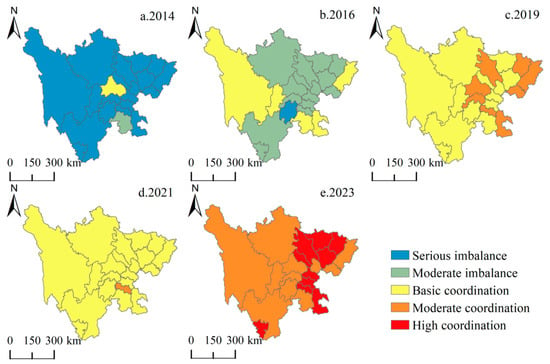
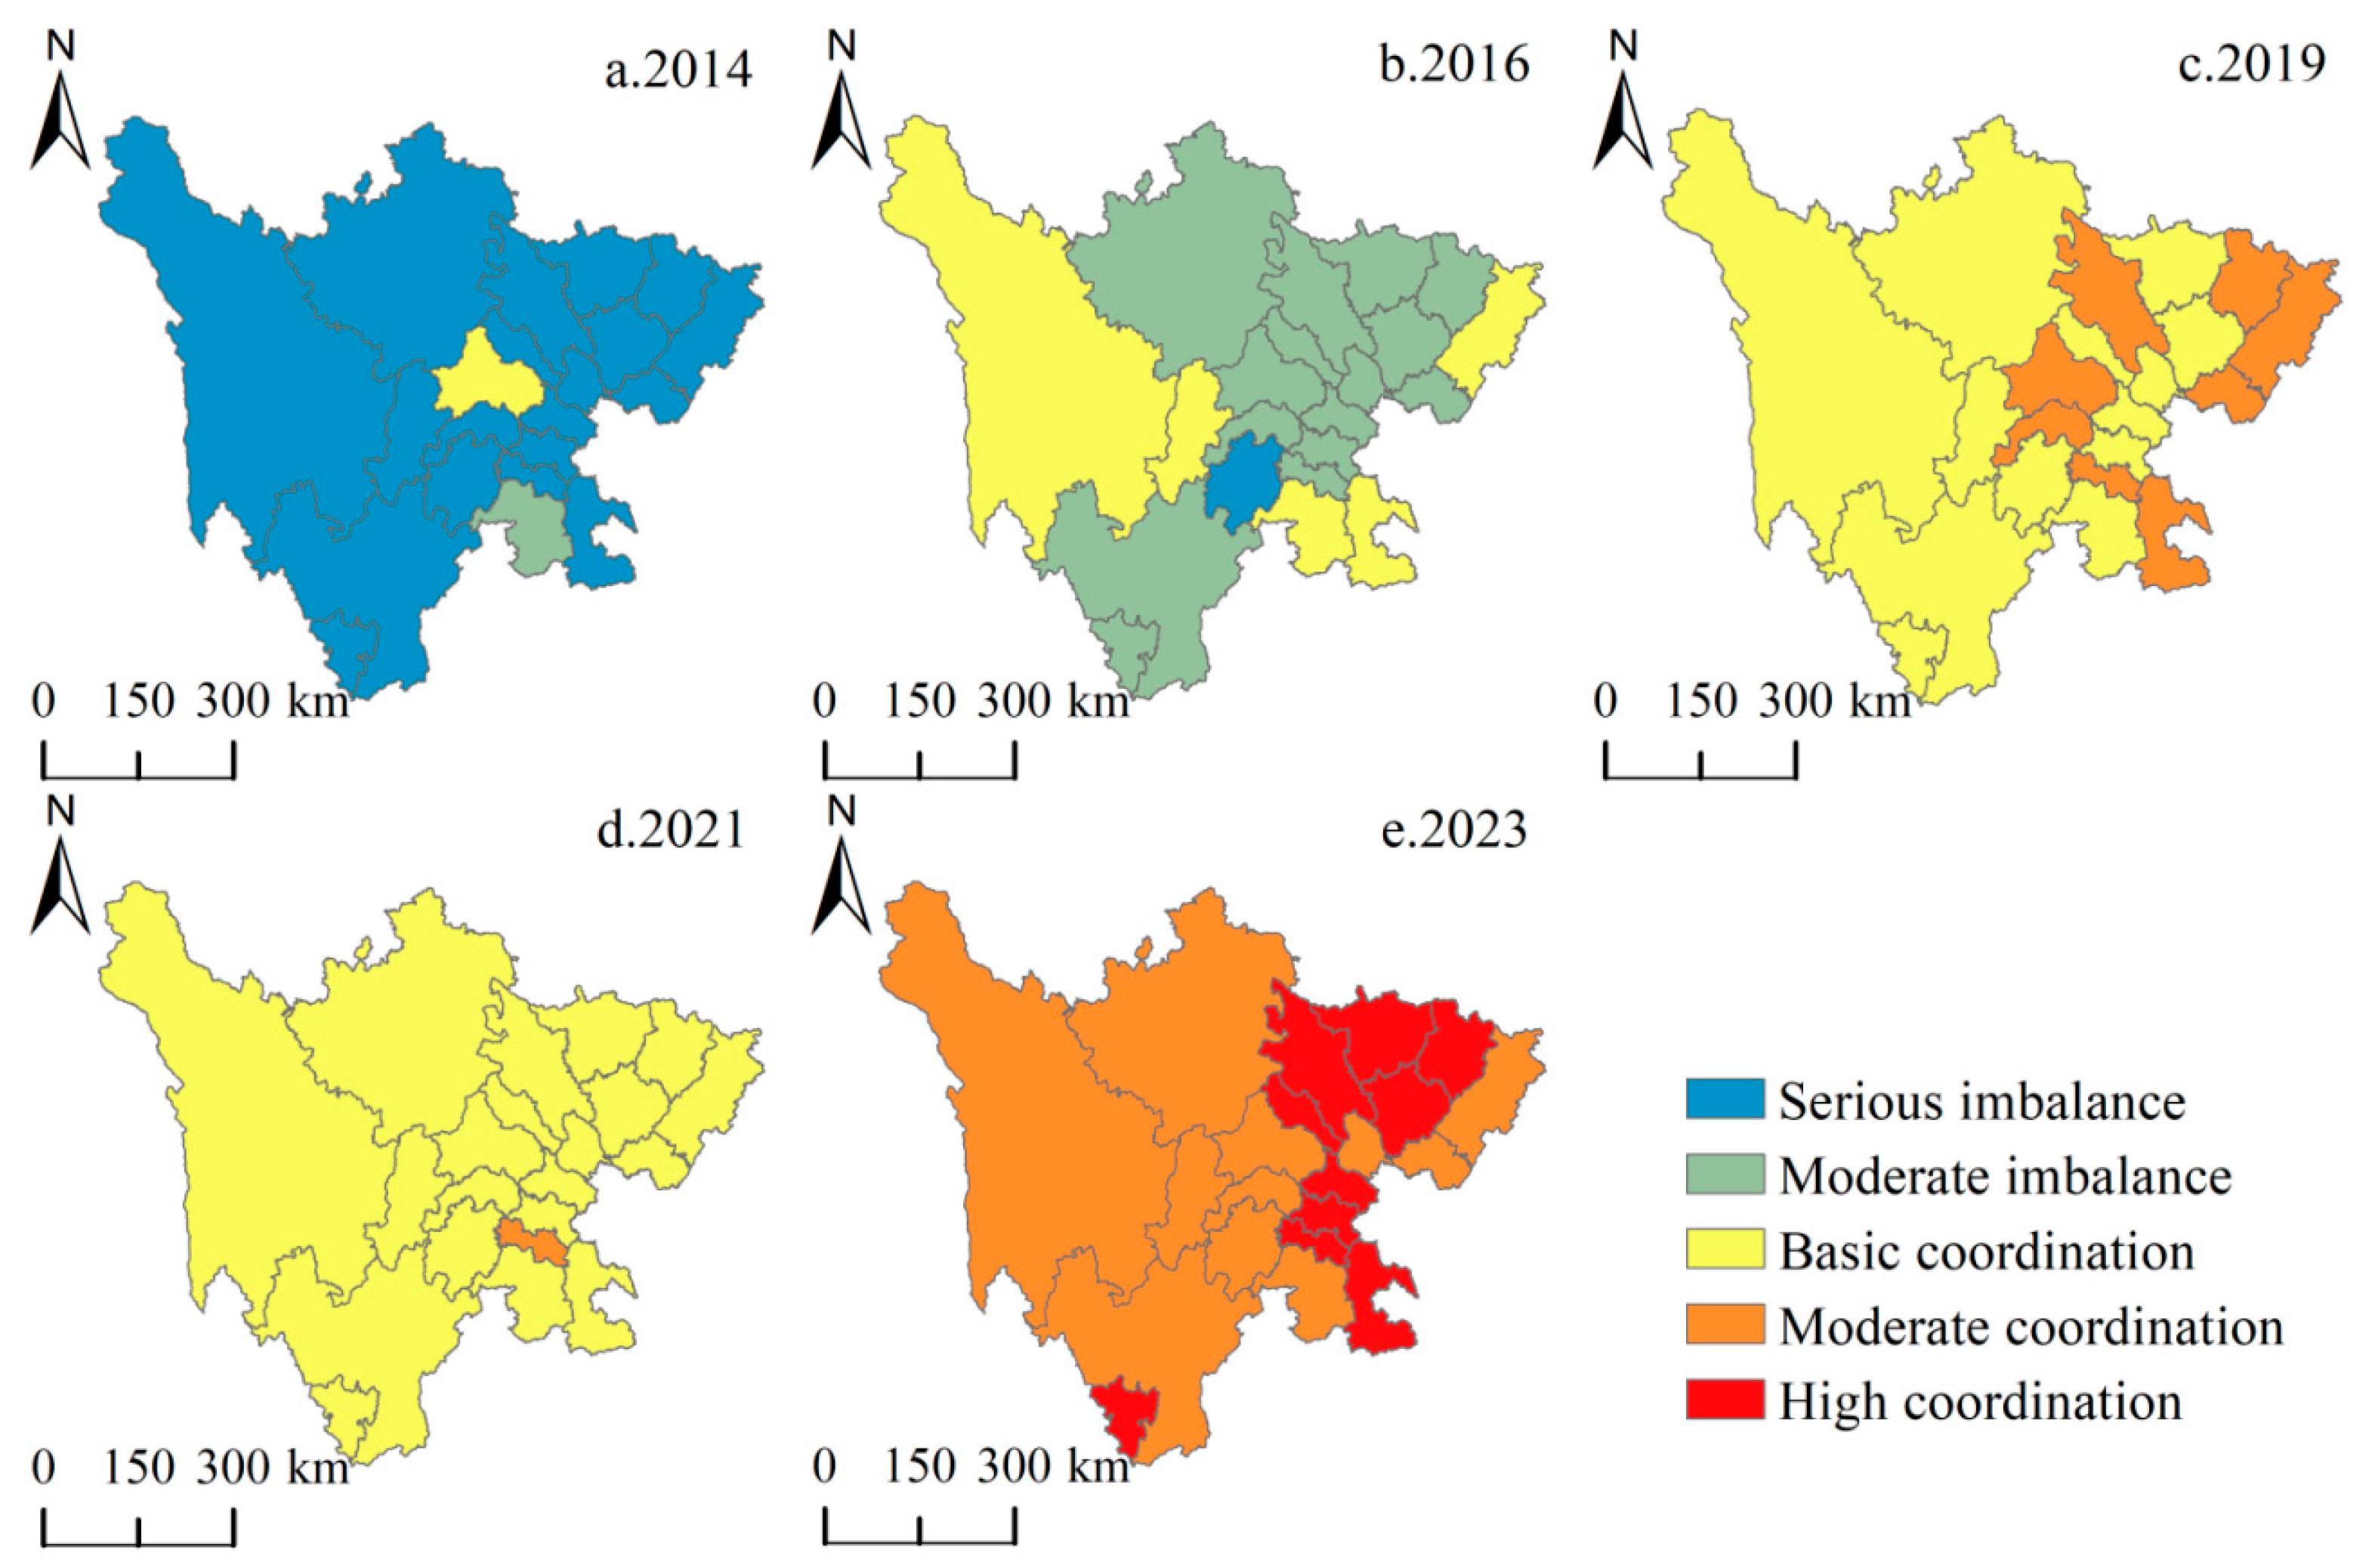
The CCD of each city for the years 2014, 2016, 2019, 2021, and 2023 was classified into five levels using the natural breaks method in ArcGIS 10.8, and the results are presented in Figure 8.
Figure 8.
Spatial evolution of CCD types.
In 2014, only Chengdu in central Sichuan and Yibin in the southern region exhibited relatively better coordination, while the remaining 19 cities were in a state of serious imbalance. By 2016, significant improvement was observed. The northern urban agglomeration and PXEZ had transitioned from serious to moderate imbalance, and six peripheral cities in Sichuan achieved basic coordination, leaving Leshan as the only severely imbalanced case. The year 2019 marked notable spatial differentiation. Cities including Chengdu, Meishan, and Mianyang in the CDPEZ, Dazhou, Guang’an, and Bazhong in the NESEZ, as well as Luzhou and Zigong in the SSEZ progressed to a moderate coordination status, forming a distinct cluster in central and eastern Sichuan. In 2021, likely due to external shocks, the overall spatial pattern regressed, with Zigong being the only city maintaining moderate coordination while others reverted to basic coordination. However, by 2023, all cities had not only recovered but had further advanced to high coordination. Notably, contiguous high-coordination zones emerged in northeastern and southeastern Sichuan.
Longitudinal analysis revealed three key spatial patterns over the study period. First, the CCD levels across cities improved progressively, and the number of coordinated cities increased continuously. Second, a persistent east–west disparity was evident, with central and eastern regions consistently outperforming western regions and exhibiting positive spillover effects. Third, a clear agglomeration effect emerged, forming contiguous high-synergy belts.
- (2)
- Spatial variation in RDD
The relative development between ICH and TD in Sichuan exhibits distinct phased evolutionary characteristics, as shown in Figure 9.
Figure 9.
Spatial evolution of RDD types.
The analysis reveals that all cities displayed an ICH-lagged development pattern before 2019, with TD capacity substantially exceeding ICH development. In 2019, Ya’an and Nanchong first achieved approximate equilibrium between the two systems, forming a temporary synchronized development zone in central and northeastern Sichuan. This observation corroborates previous findings regarding the strong resilience and sustained growth momentum of the ICH system. Subsequently, a limited number of cities transitioned from the ICH-lagged stage to synchronous balanced stage and then entered a TD-lagged phase by 2021. Meanwhile, a larger number of regions shifted directly from ICH-lagged to a TD-lagged status, displaying a latitudinal distribution pattern along the province’s north–south axis.
Ganzi, Guangyuan, Guang’an, and Luzhou maintained synchronized characteristics throughout much of the period. In contrast, Deyang persistently remained ICH-lagged, resembling an isolated island with the spatial pattern. Spatially, the Chengdu metropolitan area exhibited the most frequent development-type transitions. By 2023, all cities had evolved into a TD-lagged type. This indicates the emergence of significant structural imbalance between the two systems, with associated contradictions becoming prominent. This evolutionary pattern reveals the dynamic interplay in spatial coordination, indicating that regional development policies require more refined spatially differentiated regulation.
3.3. Influence Factors Analysis of the CCD Between ICH and TD
3.3.1. The Results of the Benchmark Regression Analysis
To eliminate the influence of differing units and facilitate comparison of variable importance, all continuous explanatory variables were standardized using Z-scores. Before conducting the tobit regression analysis, a multicollinearity test was performed on each explanatory variable. This diagnostic test was conducted using the variance inflation factor (VIF). The VIF values for all explanatory variables are below 10, indicating the absence of severe multicollinearity. Therefore, no substantial multicollinearity was detected among the selected variables, and the subsequent regression analysis was deemed appropriate. The Hausman test showed that the fixed effects model is superior to the random effects model, and the fixed effects panel tobit model was selected as the benchmark regression model in this research. The model likelihood ratio test is significant at the 1% level, indicating that the model fits well overall. Table 4 reports the regression results of the tobit model. Hypotheses H1, H2, H3, and H4 were verified, while H5 was not validated. H6 indicates that this factor has a significant impact on CCD, but it is negative.
Table 4.
Tobit regression results.
RGDP exhibits a positive and statistically significant coefficient (β = 0.148, p < 0.01), providing support for H1. This result suggests a positive association between the economic development level and the CCD. Regions with a higher level of economic development can provide more substantial financial support for ICH preservation. Simultaneously, they possess more comprehensive tourism reception facilities and greater market consumption capacity, thereby effectively fostering a beneficial interaction between ICH preservation and inheritance and the growth of the tourism industry. From the perspective of z-value, the influence intensity of RGDP is the most prominent among all variables, confirming the fundamental role of the economic base in the integrated development of culture and tourism.
The regression coefficient for the IND is 0.091, significant at the 1% level. It supports H2. The tertiary industry serves as the direct carrier for culture–tourism integration. An increase in its share signifies the regional economy’s transition towards a service-oriented and consumption-oriented model, which aligns highly with the inherent demands of ICH tourism industrialization. In recent years, Sichuan Province had actively promoted the optimization and upgrading of its industrial structure, vigorously developing modern service industries such as cultural tourism and health tourism. This created favorable conditions for the revitalization and utilization of ICH resources and the enhancement of TD product quality. The IND indicates that the impact of industrial structure upgrading on the CCD is relatively stable and reliable.
The coefficient for URB was 0.059, significant at the 10% level, and research hypothesis H3 has been verified. Urbanization creates market demand for integration through population agglomeration and consumption upgrading. Concurrently, the spatial expansion of urbanization provides new scenarios for the living preservation of ICH resources. After controlling for other variables, URB maintains a significantly positive impact, indicating that urbanization contributes independently to promoting culture–tourism integration. However, compared to variables such as RGDP and IND, the influence intensity of the urbanization rate is relatively weaker. Possible explanations are these. On one hand, the rapid expansion during urbanization might exert certain pressure on the original cultural ecology of ICH; on the other hand, the quality of urbanization in some areas of Sichuan Province still needs improvement, and the promotional effect of urbanization on ICH–TD integration has yet to be fully realized.
TRANS exhibited a positive and significant effect at the 1% level, with the regression coefficient of 0.085. Transportation accessibility acts as the physical link connecting ICH resources with the TD market. A well-developed highway network can effectively reduce tourists’ time and economic costs, expanding the tourist source radius of ICH tourism destinations. Sichuan covers a vast territory, encompassing extensive ethnic minority areas and mountainous regions around the basin. The improvement of transportation conditions yields particularly prominent marginal contributions to culture–tourism integration here.
The regression coefficient for RD, representing the scale of innovation, is −0.028, but it did not pass the significance test. This result suggests that, at the time of the study, R and D investment in Sichuan Province had not yet effectively empowered the integrated development of ICH and TD. A possible explanation is that the proportion of R and D investment-allocated culture and tourism sectors is relatively low, failing to effectively translate into innovative momentum for ICH preservation technologies and tourism experience enhancement. Furthermore, the transformation of R and D investment into actual productive forces typically involves a long cycle, suggesting a potential time-lag effect on its role in promoting ICH–TD integration.
HC exhibits a negative and highly significant coefficient (β = −0.121, p < 0.01), which is contrary to H6. This finding suggests that, contrary to theoretical expectations, an increase in the number of tertiary industry employees is associated with a lower CCD.
3.3.2. Robustness Test
To examine the sensitivity of the benchmark results to variable measurement, this study replaced employees in the tertiary industry with the permanent population size to re-measure the human resource capital (HC) and re-estimated the model. Additionally, a 5% winsorization was applied to all continuous variables to mitigate the potential influence of outliers. To rule out the possibility that the findings were driven by anomalies in a specific year, observations from 2021 were excluded, and the model was re-estimated using the remaining 189 samples. The re-estimated results of three methods are presented in Table 5. Across all three robustness checks, the results remained highly consistent with the benchmark model. The persistently positive effects of RGDP, IND, URB, and TRANS, along with the consistently negative effect of HC, confirm that the main findings are robust to alternative specifications, outlier treatments, and sample adjustments.
Table 5.
The results of the robustness tests for the three methods.
4. Discussion
4.1. Spatiotemporal Characteristics of ICH and TD
The comprehensive development level of ICH in Sichuan Province shows a steady upward trend from 2014 to 2023 (Figure 5), which is consistent with the findings on progressing the enhancement of ICH preservation under supportive policy frameworks [32]. This trend indicates that systematic surveys, official recognitions, and inheritor certifications have significantly strengthened ICH resource endowment and transmission capacity. In contrast, TD exhibits notable volatility, declining sharply between 2020 and 2022 due to the COVID-19 pandemic before recovering in 2023. This pattern aligns with global observations regarding tourism’s high sensitivity to external shocks [48]. The spatial distribution of ICH resources in Sichuan is characterized by a “one core, one belt, multiple clusters” pattern, with high densities in the Chengdu Plain and eastern regions. This reflects the influence of socioeconomic development and urbanization on cultural heritage agglomeration, supporting the recognized role of regional economic vitality in heritage sustainability [33]. Meanwhile, TD performance shows a clear east–west disparity, with central and eastern cities maintaining higher and more stable coordination levels, consistent with broader patterns of regional inequality in China’s tourism infrastructure and market maturity [23].
4.2. Coupling Coordination and Relative Development Dynamics
The CCD between ICH and TD in Sichuan improved consistently, progressing from serious imbalance to high coordination in most cities over the study period (Figure 8). Temporally, this indicates a strengthening synergistic relationship, largely driven by policy integration and increasing investment in culture–tourism convergence. However, the RDD shifted from ICH-lagged to a TD-lagged type after 2020, suggesting that tourism recovery lagged behind ICH development in the post-pandemic phase. This finding contrasts with some pre-pandemic studies that report synchronized growth of culture and tourism in developed regions and underscores the vulnerability of tourism-dependent development pathways. Spatially, CCD advancement is pronounced in central and eastern Sichuan, forming contiguous high-coordination zones that radiate from Chengdu. This spatial spillover effect echoes the core-periphery model observed in regional culture–tourism integration [46]. In contrast, western cities such as Ganzi and Aba, despite their rich ICH resources, show lower CCD levels. This highlights the constraints imposed by infrastructure, accessibility, and service capacity on synergistic development.
4.3. Influencing Factors
The tobit model reveals the mechanisms through which various factors influence the CCD between ICH and TD. RGDP, IND, URB, TRANS all exhibit significant positive effects, which aligns closely with international research emphasizing the critical roles of economic foundation, service sector transformation, and infrastructure in fostering heritage–tourism linkages. Among these, RGDP displays the highest z-value, confirming the fundamental role of the economic base, while the strong significance of IND indicates that the service economy provides the core carrier for the tourism utilization of ICH resources. However, two distinctive findings warrant attention. The HC shows a significant negative effect. Rather than constituting a paradox, this finding reveals a structural dilemma facing ICH–TD integration in Sichuan Province—the spatial polarization of employment. Consequently, the growth in the total number of service sector employees across the province may reflect widening regional development disparities rather than a general improvement in integration levels. The negative but insignificant effect of RD suggests that integration remains in an early exploratory stage, relying excessively on resource endowments while lacking innovation-driven empowerment. This contrasts with practices in coastal provinces, where digital technologies are increasingly employed to enhance heritage interpretation [19]. Although Sichuan possesses abundant and high-quality ICH resources, its weak innovation capacity may perpetuate a traditional pathway that prioritizes authenticity preservation but limits adaptive integration with modern forms of tourism.
4.4. Implications for Sustainable Development
The improving CCD in Sichuan reflects positive progress toward Sustainable Development Goal (SDG) 11.4, which aims to strengthen efforts to protect and safeguard cultural and natural heritage. However, the regional disparities and post-2020 tourism lag reveal challenges in achieving balanced and resilient development. This aligns with broader critiques of the sustainability of tourism-dependent growth, especially in heritage-rich but economically vulnerable regions [49]. From a cultural sustainability perspective, the dominance of traditional skills in ICH may support intergenerational transmission and community identity, but it also raises concerns about representational diversity and adaptive vitality. The findings suggest that sustainable ICH–TD integration should not only focus on economic gains but also ensure equitable resource distribution, community participation, and ecological responsibility. These principles are widely advocated in global heritage governance [50].
5. Conclusions and Recommendations
5.1. Conclusions
With the growth of the socio-economy and increasingly complex consumer demand, the integration of intangible cultural heritage (ICH) and tourism development (TD) has emerged as a significant industrial evolution shaped by multiple factors. Although this integration has garnered considerable attention, practical advancements have often outpaced theoretical understanding. To address this gap, this study constructed a tailored coupling coordination evaluation system for ICH and TD in Sichuan Province and analyzed its spatiotemporal dynamics and influencing factors. The main findings are summarized as follows:
- (1)
- Sichuan Province possesses abundant ICH resources with high heritage value and diverse types. However, the distribution across categories is uneven, with traditional skills representing the largest proportion. Kernel density estimation revealed notable spatial disparities in ICH distribution, characterized by a one-core one-belt multiple-clusters pattern. High-density concentrations were observed in the Sichuan Basin and in southwestern and northeastern regions.
- (2)
- Key findings regarding the spatiotemporal evolution of the coupling coordination degree (CCD) and relative development degree (RDD) are as follows. In the early stage of the study period, most cities exhibited serious imbalance of the CCD. Subsequently, CCD improved continuously, with an increasing number of cities achieving moderate or high coordination. Spatially, central and eastern Sichuan demonstrated faster CCD growth than the western region, driving regional development and forming distinct spatial clusters. The RDD underwent a transition from ICH-lagged to synchronous balanced and finally to TD-lagged. Before 2020, the ICH-lagged type was predominant, whereas the TD-lagged type became more pronounced in later years. Notably, cities in central and eastern Sichuan exhibit higher RDD values than those in the west, highlighting an imbalance in the development levels between the two systems.
- (3)
- The CCD between ICH and TD is significantly associated with multiple factors. Comprehensive economic strength, distribution of industrial structure, overall level of urbanization, and transportation accessibility all exhibit significant positive and statistically significant coefficients, with comprehensive economic strength demonstrating the strongest influence. In contrast, human resource capital shows a significant negative coefficient, while scale of innovation exhibits a negative but non-significant coefficient. These findings highlight the need for locally tailored strategies that address regional heterogeneity.
5.2. Policy Implications and Recommendations
Although the CCD between ICH and TD in Sichuan improved by the end of the study period, significant developmental imbalances persisted between the two systems. Notably, TD lags behind ICH since 2020. To achieve genuine synergistic coordination, the comprehensive capacity of tourism development must be restored, enabling both systems to reach a state of synchronous balance. This requires sustained efforts to rehabilitate the tourism industry and its operating environment, strengthen government macro-regulation, enhance inbound tourism reception standards, cater to diverse international consumption demands, and improve overall industrial efficiency to better support a resilient tourism system.
Spatially, the CCD showed faster development in central and eastern regions compared to the west, necessitating optimized regional planning. Building on the observed clustered distribution patterns, successful experiences from highly coordinated central and eastern cities should be systematically summarized and transferred to western regions through established cooperation mechanisms. These mechanisms should facilitate the sharing of advanced management models, operational strategies, and talent resources. Concurrently, targeted support for western cities must be intensified, with development plans customized to leverage local ICH resources and TD characteristics. In ICH-rich but CCD-deficient areas, such as Liangshan, Ganzi, and Aba, priority should be given to infrastructure investment, particularly in transportation networks and tourism service facilities. This is crucial for enhancing carrying capacity and promoting regionally coordinated development.
In light of the findings from the CCD analysis, targeted countermeasures are critical and important. Firstly, we should leverage economic foundations by increasing fiscal investment in ICH preservation and tourism infrastructure in economically advanced regions, while using their support to stimulate surrounding areas. Second, we should address employment spatial polarization by implementing targeted talent incentives, such as subsidies and career development programs, to attract service professionals to ICH-rich but economically underdeveloped regions like Ganzi and Aba. Third, we should strengthen innovation-driven empowerment by increasing R and D investment in cultural tourism technologies, promoting digital transformation of ICH presentation, and facilitating technology transfer from coastal provinces. Fourth, we should adopt region-specific strategies that recognize urban–rural and intercity heterogeneity, tailoring integration pathways to local resource endowments and development stages rather than applying uniform policies.
5.3. Remarks and Future Research
This study has several limitations. First, the reliance on provincial-level annual statistical data limits the ability to capture micro-level dynamic processes, such as community practices and tourist experiences. Second, although the constructed evaluation index system is representative, the quantification of cultural influence and social effects remains insufficient.
Future research could further expand in the following directions: First, conducting multi-scale and long-term case studies would allow for an in-depth exploration of the micro mechanisms of collaborative development in local contexts. Second, the evaluation system could be improved by integrating subjective and objective data and incorporating emerging dimensions such as digitalization and community well-being. Third, cross-regional and international comparative studies could be strengthened to derive more universal theoretical insights and facilitate the sustainable development of cultural heritage and tourism.
Author Contributions
Conceptualization, C.H.; supervision, Y.Z. and X.Z.; writing—original draft, C.H.; investigation, C.H. and X.Z.; methodology, C.H.; software, C.H. and X.Z.; visualization, C.H. and X.Z.; funding acquisition, Y.Z. and C.H. All authors have read and agreed to the published version of the manuscript.
Funding
This research was supported by the Nanchong Science and Technology Bureau’s City-University Cooperation Project (SXHZ027 and 23XNSYSX0069) and the Nanchong Tourism New Quality Productivity Development Research Center’s Special Project ‘Research on Nanchong’s Accelerated Construction of a Demonstration Zone for Bashu Characteristic Cultural Tourism Development’ (WLXZ2025C015).
Institutional Review Board Statement
Not applicable.
Informed Consent Statement
Not applicable.
Data Availability Statement
The original contributions presented in this study are included in the article. Further inquiries can be directed to the corresponding author.
Conflicts of Interest
The authors declare no conflicts of interest.
References
- Mele, E.; Kerkhof, P.; Cantoni, L. Analyzing cultural tourism promotion on Instagram: A cross-cultural perspective. J. Travel Tour. Mark. 2021, 38, 326–340. [Google Scholar] [CrossRef] [Scilit]
- Jin, Y.; Xi, H.; Wang, X.; Ren, X.; Yuan, L. Evaluation of the integration policy in China: Does the integration of culture and tourism promote tourism development? Ann. Tour. Res. 2022, 97, 103491. [Google Scholar] [CrossRef] [Scilit]
- Halder, S.; Sarda, R. Promoting intangible cultural heritage (ICH) tourism: Strategy for socioeconomic development of snake charmers (India) through geoeducation, geotourism and geoconservation. Int. J. Geoherit. Parks 2021, 9, 212–232. [Google Scholar] [CrossRef] [Scilit]
- Macdonald, C.; Turffs, D.; Mc Entee, K.; Elliot, J.; Wester, J. The relationship between tourism and the environment in Florida, USA: A media content analysis. Ann. Tour. Res. Empir. Insights 2023, 4, 100092. [Google Scholar] [CrossRef] [Scilit]
- Arizpe, L. Intangible cultural heritage, diversity and coherence. Mus. Int. 2004, 56, 130–136. [Google Scholar] [CrossRef] [Scilit]
- Schmitt, T.M. UNESCO and Jemaa el Fna Square in Marrakesh: On the genesis of a concept for the global protection of intangible cultural heritage. Geogr. Z. 2005, 93, 237–253. [Google Scholar]
- Chen, Z. Visualizing experiencescape from the art of intangible cultural heritage. Curr. Issues Tour. 2022, 25, 559–578. [Google Scholar] [CrossRef] [Scilit]
- Xue, K.; Li, Y.; Meng, X. An evaluation model to assess the communication effects of intangible cultural heritage. J. Cult. Herit. 2019, 40, 124–132. [Google Scholar] [CrossRef] [Scilit]
- Ghirardello, L.; Walder, M.; de Rachewiltz, M.; Erschbamer, G. Cultural sustainability from the local perspective: The example of transhumance in South Tyrol. Sustainability 2022, 14, 9052. [Google Scholar] [CrossRef] [Scilit]
- Rosenberg, N. Capital goods, technology, and economic growth. Oxf. Econ. Pap. 1963, 15, 217–227. [Google Scholar] [CrossRef] [Scilit]
- Kim, S.; Whitford, M.; Arcodia, C. Development of intangible cultural heritage as a sustainable tourism resource: The intangible cultural heritage practitioners’ perspectives. In Authenticity and Authentication of Heritage; Routledge: London, UK, 2019; Volume 14, pp. 422–435. [Google Scholar]
- Su, J. Managing intangible cultural heritage in the context of tourism: Chinese officials’ perspectives. J. Tour. Cult. Change 2020, 18, 164–186. [Google Scholar] [CrossRef] [Scilit]
- Eichler, J. Intangible cultural heritage, inequalities and participation: Who decides on heritage? Int. J. Hum. Rights 2021, 25, 793–814. [Google Scholar] [CrossRef] [Scilit]
- Tan, S.K.; Tan, S.H.; Kok, Y.S.; Choon, S.W. Sense of place and sustainability of intangible cultural heritage—The case of George Town and Melaka. Tour. Manag. 2018, 67, 376–387. [Google Scholar] [CrossRef] [Scilit]
- Su, X.; Li, X.; Chen, W.; Zeng, T. Subjective vitality, authenticity experience, and intangible cultural heritage tourism: An empirical study of the puppet show. J. Travel Tour. Mark. 2020, 37, 258–271. [Google Scholar] [CrossRef] [Scilit]
- Park, E.; Choi, B.K.; Lee, T.J. The role and dimensions of authenticity in heritage tourism. Tour. Manag. 2019, 74, 99–109. [Google Scholar] [CrossRef] [Scilit]
- Ricart, S.; Ribas, A.; Pavón, D.; Gabarda-Mallorquí, A.; Roset, D. Promoting historical irrigation canals as natural and cultural heritage in mass-tourism destinations. J. Cult. Herit. Manag. Sustain. Dev. 2019, 9, 520–536. [Google Scholar] [CrossRef] [Scilit]
- Wan, C.K.B.; Chow, K.K.N.; de Bont, C.J.P.M.; Hekkert, P. Finding synergy between oral and visual narratives on memorable and meaningful tourism experiences. Inf. Technol. Tour. 2020, 22, 107–130. [Google Scholar] [CrossRef] [Scilit]
- Chung, N.; Lee, H.; Kim, J.-Y.; Koo, C. The Role of Augmented Reality for Experience-Influenced Environments: The Case of Cultural Heritage Tourism in Korea. J. Travel Res. 2018, 57, 627–643. [Google Scholar] [CrossRef] [Scilit]
- Marasco, A.; Buonincontri, P.; van Niekerk, M.; Orlowski, M.; Okumus, F. Exploring the role of next-generation virtual technologies in destination marketing. J. Destin. Mark. Manag. 2018, 9, 138–148. [Google Scholar] [CrossRef] [Scilit]
- Feizizadeh, B.; Fathi, S.; Gonbad, Z.G.; Ghasmei, M.; Makki, M. A multiple geospatial approach for intangible cultural heritage tourism potentiality Mapping in Iran. Sustainability 2023, 15, 16659. [Google Scholar] [CrossRef] [Scilit]
- Maldonado-Erazo, C.P.; del Río-Rama, M.C.; Andino-Peñafiel, E.E.; Álvarez-García, J. Social use through tourism of the intangible cultural heritage of the Amazonian Kichwa nationality. Land 2023, 12, 554. [Google Scholar] [CrossRef] [Scilit]
- Song, C.; Zhang, Q.; Li, X.; Zhang, A. Co-agglomeration of the culture and tourism industries in Chinese cities. Int. J. Tour. Cities 2024, 10, 491–508. [Google Scholar] [CrossRef] [Scilit]
- Yu, Z.; Liu, W.; Ren, Q.; Zhong, J. Analysis of the coordinated evolution and driving mechanism of the coupling of tourism economy and urbanization in Southwest China. Curr. Issues Tour. 2025, 28, 891–909. [Google Scholar] [CrossRef] [Scilit]
- Cheng, X.; Long, R.; Chen, H.; Li, Q. Coupling coordination degree and spatial dynamic evolution of a regional green competitiveness system–A case study from China. Ecol. Indic. 2019, 104, 489–500. [Google Scholar] [CrossRef] [Scilit]
- Liu, F.; Wang, C.; Luo, M.; Zhou, S.; Liu, C. An investigation of the coupling coordination of a regional agricultural economics-ecology-society composite based on a data-driven approach. Ecol. Indic. 2022, 143, 109363. [Google Scholar] [CrossRef] [Scilit]
- Tan, J.; Zhang, P.; Lo, K.; Li, J.; Liu, S. Conceptualizing and measuring economic resilience of resource-based cities: Case study of Northeast China. Chin. Geogr. Sci. 2017, 27, 471–481. [Google Scholar] [CrossRef] [Scilit]
- Tomal, M. Evaluation of coupling coordination degree and convergence behaviour of local development: A spatiotemporal analysis of all Polish municipalities over the period 2003–2019. Sustain. Cities Soc. 2021, 71, 102992. [Google Scholar] [CrossRef] [Scilit]
- Liu, Y.; Li, J.; Zhan, X.; Zhao, H.; Wang, L.; Suk, S. Exploring the interactive coercing relationship between tourism and ecological environment: A case study in Kanto region, Japan. Environ. Dev. Sustain. 2025, 1–24. [Google Scholar] [CrossRef] [Scilit]
- Wang, Z.; Wang, F.; Ma, S. Research on the Coupled and Coordinated Relationship Between Ecological Environment and Economic Development in China and its Evolution in Time and Space. Pol. J. Environ. Stud. 2025, 34, 3333–3342. [Google Scholar] [CrossRef] [Scilit]
- Liu, M.; Lu, M.; Li, Z. Coupling coordination analysis on digital economy-tourism development-ecological environment. J. Clean. Prod. 2024, 470, 143320. [Google Scholar] [CrossRef] [Scilit]
- Wang, M.; Wang, X. A study of eco-culture-tourism coupling and coordinated development and influencing mechanism in the Yellow River Basin based on spatial production theory. Ecol. Indic. 2025, 176, 113689. [Google Scholar] [CrossRef] [Scilit]
- Lu, M.; Duan, Y.; Wu, X. Evaluation of the coupling and coordination degree of eco-cultural tourism system in the Jiangsu-Zhejiang-Shanghai-Anhui region. Ecol. Indic. 2023, 156, 111180. [Google Scholar] [CrossRef] [Scilit]
- Yan, J.Y.; Zhao, Y.; Hao, L.S. Evaluation and Zoning Research on the Tourism Utilization Potential of Intangible Cultural Heritage Resources in China Based on Multi-source Data. Geogr. Res. 2023, 42, 3294–3312. (In Chinese) [Google Scholar]
- Gan, C.; Voda, M.; Wang, K.; Chen, L.; Ye, J. Spatial network structure of the tourism economy in urban agglomeration: A social network analysis. J. Hosp. Tour. Manag. 2021, 47, 124–133. [Google Scholar] [CrossRef] [Scilit]
- Han, S.; Wang, B.; Ao, Y.; Bahmani, H.; Chai, B. The coupling and coordination degree of urban resilience system: A case study of the Chengdu-Chongqing urban agglomeration. Environ. Impact Assess. Rev. 2023, 101, 107145. [Google Scholar] [CrossRef] [Scilit]
- Tang, Z. An integrated approach to evaluating the coupling coordination between tourism and the environment. Tour. Manag. 2015, 46, 11–19. [Google Scholar] [CrossRef] [Scilit]
- Wang, Q.; Mao, Z.; Xian, L.; Liang, Z. A study on the coupling coordination between tourism and the low-carbon city. Asia Pac. J. Tour. Res. 2019, 24, 550–562. [Google Scholar] [CrossRef] [Scilit]
- Tian, F.; Weng, G. The integration and challenges of digital economy with the tourism industry: Evidence from the Yellow River Basin in China. J. Clean. Prod. 2024, 475, 143672. [Google Scholar] [CrossRef] [Scilit]
- Wu, Z.; Xie, J. The gospel of sustainable development? Spatiotemporal evolution and configuration pathways of the coupling coordination of the digital economy, tourism development and eco-efficiency. J. Environ. Manag. 2025, 380, 124903. [Google Scholar] [CrossRef] [Scilit]
- Yang, Q.; Tian, X.; Wang, H.; Tan, T. Exploration of the coupling coordination between rural tourism development and agricultural eco-efficiency in islands: A case study of Hainan Island in China. J. Nat. Conserv. 2025, 84, 126822. [Google Scholar] [CrossRef] [Scilit]
- Zhu, J.; Zhu, Z. The space-time evolution and driving mechanism of coordinated development of modern logistics industry and tourism industry. J. Clean. Prod. 2023, 423, 138620. [Google Scholar] [CrossRef] [Scilit]
- Wang, X.; Zhang, T.; Duan, L.; Liritzis, I.; Li, J. Spatial distribution characteristics and influencing factors of intangible cultural heritage in the Yellow River Basin. J. Cult. Herit. 2024, 66, 254–264. [Google Scholar] [CrossRef] [Scilit]
- Chen, P. Effects of the entropy weight on TOPSIS. Expert Syst. Appl. 2021, 168, 114186. [Google Scholar] [CrossRef] [Scilit]
- Cui, D.; Chen, X.; Xue, Y.; Li, R.; Zeng, W. An integrated approach to investigate the relationship of coupling coordination between social economy and water environment on urban scale—A case study of Kunming. J. Environ. Manag. 2019, 234, 189–199. [Google Scholar] [CrossRef] [Scilit]
- Wei, W.; Xiao, L.; Zhang, X.; Jin, L.; Wang, D.; Long, X.; Yang, Q.; Li, J.; Zhou, Y. Spatial-Temporal Analysis of Coupling Coordination Between New Urbanization and Ecological Environment in Ya’an, China. Land 2025, 14, 65. [Google Scholar] [CrossRef] [Scilit]
- Lv, Y.; Yan, S.; Lai, X.; Luo, S. Unveiling the water-energy-food nexus efficiency and influencing factors in China: An integrated EBM and Tobit model analysis. Ecol. Indic. 2025, 173, 113357. [Google Scholar] [CrossRef] [Scilit]
- Gössling, S.; Scott, D.; Hall, C.M. Pandemics, tourism and global change: A rapid assessment of COVID-19. J. Sustain. Tour. 2020, 29, 1–20. [Google Scholar] [CrossRef] [Scilit]
- Timothy, D.J. Contemporary cultural heritage and tourism: Development issues and emerging trends. Public Archaeol. 2014, 13, 30–47. [Google Scholar] [CrossRef] [Scilit]
- Deacon, H.; Smeets, R. Authenticity, value and community involvement in heritage management under the world heritage and intangible heritage conventions. Herit. Soc. 2013, 6, 129–143. [Google Scholar] [CrossRef] [Scilit]

Disclaimer/Publisher’s Note: The statements, opinions and data contained in all publications are solely those of the individual author(s) and contributor(s) and not of MDPI and/or the editor(s). MDPI and/or the editor(s) disclaim responsibility for any injury to people or property resulting from any ideas, methods, instructions or products referred to in the content. |
© 2026 by the authors. Licensee MDPI, Basel, Switzerland. This article is an open access article distributed under the terms and conditions of the Creative Commons Attribution (CC BY) license.