


Abstract
This study aimed to analyze changes in vegetation, built-up areas, and population growth in Lahore city from 1990 to 2023. The data was acquired from Google Earth Engine, and the spectral bands were retrieved from Landsat 5 and Landsat 8. The decadal analysis of the landscape was conducted from 1993 to 2001, 2001 to 2012, and from 2013 to 2023. Further analysis was conducted in ArcGIS version 10.3 to evaluate the Normalized Difference Vegetation Index and the Normalized Difference Built-up Index to assess vegetation and built-up areas, respectively. To analyze the urban population of Lahore, data were obtained from the Global Human Settlement Layer for 1990, 2000, 2010, and 2020. Results revealed that the total vegetated area of Lahore city decreased from 1453.0 km2 in 1993–2001 to 788.2 km2 in 2013–2023. Moreover, the urban built-up area expanded from 319.6 km2 in 1993–2001 to 966.8 km2 in 2013–2023. Sub-district-level analysis indicated that Model Town and Raiwind areas of Lahore depicted better vegetation recovery in this decade. The population of Lahore has been increasing steadily, with the 2010s being a particularly rapid period of growth. The projections for 2030 also depict a continuous growth pattern. This study was further developed by integrating multi-decadal averaging coupled with selected-year analysis to distinguish gradual land transformation from relatively accelerated phases of urban expansion of Lahore. Also, by combining NDVI and NDBI values on both Lahore and its tehsil level, the research provides a collective sub-district- and district-level perspective into the spatial heterogeneity of peri-urban transformations. The findings of the study explain how major infrastructural projects shape the urban growth patterns of cities like Lahore and cause a decline in the green areas of fast-growing cities in South Asia. This study further highlights the consequences of unplanned urban expansion in regions where high population growth has compromised green infrastructure and threatened ecological balance. In addition, it supports several Sustainable Development Goals (SDGs), particularly SDG 11 (Sustainable Cities and Communities), SDG 13 (Climate Action), and SDG 15 (Life on Land) by providing spatial evidence of urban expansion of the city and losses of its green spaces. The findings offer empirical insights to support climate-resilient developments. The study also demonstrates the necessity of integrating green infrastructure and providing robust strategies for forthcoming urban planning projects and policy development regarding urban expansion.
1. Introduction
Urbanization is a significant global challenge with profound environmental implications, including the loss of vegetated land, habitat destruction, and cumulative water and air pollution [1]. The United Nations projected that by 2050, approximately 70% of the global population will reside in urban areas. The World Bank reported that urbanization increases by 2.5% annually in developing countries and by 0.8% in developed nations [2]. The rapid, uncontrolled growth of urban areas results in the massive destruction of green spaces. According to the World Resources Institute, about 488 million hectares of green spaces and vegetated land have been degraded since 2000 due to urban expansion. The degradation trend also doubled to 28.3 million hectares in 2023 from 13.4 million hectares in 2001, driven by unplanned growth [3]. The urban green spaces of several countries have deteriorated since 2000, owing to infrastructure development, such as by 15% in Europe [4], by 50% in Nairobi [4], and by 60% in India [5]. Specifically, over the last three decades, rapid urbanization has reshaped the land-use patterns of the major metropolitan areas across Asia, Africa, and Latin America. South Asian cities such as Delhi, Dhaka, Lagos, Jakarta, and Beijing are where vegetation decline and intensification of built-up areas are widely documented. The demographic growth and infrastructural developments have increased the land-use transformations in these cities, specifically.
Many Asian and African cities in the Global South are shifting from gradual expansion to corridor-based infrastructure-driven growth. This phenomenon further intensifies land-use changes in the peri-urban areas, often leading to agricultural conversions, and green area fragmentation further increases the ecological stress. These processes are frequently associated with transportation and infrastructural projects, and housing and real estate developments, which then reshape the metropolitan city’s land-use pattern beyond its traditional urban core.
Pakistan is among the countries experiencing rapid urbanization in South Asia. By 2023, the urban population of Pakistan had expanded by four times, reaching 93.8 million, compared to 23.8 million in 1981 [6]. Lahore is the second-largest metropolitan city in Pakistan, and its population is escalating at an unprecedented rate, driven by rural-to-urban migration [7]. The population of Lahore was 3.9 million in 1990 and grew to 14.4 million in 2024 [8]. The urban cover of the metropolitan area has increased to 113.85 km2, while vegetated land has decreased exponentially to 392.78 km2, attributed to this growth pattern [9]. The city has lost its major green cover to infrastructure development, housing society construction, and commercial area development to meet population demands [10].
Lahore city is known as the City of Gardens, as it has been home to several gardens since the Mughal Empire, including Kamran Garden, the Palace Garden of Lahore Fort, Shalamar Garden, the Garden of Jahangir Mausoleum, and Gulabi Bagh [11,12]. Other green spaces of Lahore include major parks (e.g., Greater Iqbal Park and Jinnah Park), community parks (e.g., Model Town Park and gated societies parks), green belts (e.g., Canal Road Green Belt and Jail Road Green Belt), urban forests (e.g., Miyawaki Forest), and institutional green spaces [13]. It lies in the region’s temperate zone; hence, it provides a favorable environment for the Fabaceae, Moraceae, and Rosaceae families, which are observed to be significantly present in the city [14]. Stakeholders such as the Parks and Horticulture Authority (PHA) and Lahore Development Authority (LDA), NGOs such as WWF, local communities, and private companies play a significant role in maintaining and expanding Lahore’s green cover [15]. Green belts and public parks fall under the PHA’s authority. The PHA in Lahore manages about 830 public parks, 21 nurseries, and 1 museum [14].
The World Health Organization has mandated that per capita, 9 m2 of green spaces should be available to urban citizens [16]. Within the broader international context, Lahore represents a very crucial case of a rapidly urbanizing South Asian metropolitan city where demographic pressures, real estate developments, infrastructural expansion and vegetation decline intersect. The per capita accessibility of green space across different regions of Lahore is starkly contrasted. Areas like Gulberg Town have a per capita availability of 9.74 m2 of green space, whereas other regions do not meet WHO standards, e.g., Faisal Town has 1.28 m2, Garden Town has 1.02 m2, and Walled City has 0.01 m2 [17,18]. The uneven distribution of green spaces is primarily due to differences in urban planning, socioeconomic factors, population density, and other environmental and demographic factors. Planned residential areas have better alignment of allocated green spaces, such as the Defense Housing Society (DHA), Bahria Town, and Cantt, compared to densely populated regions like Walled City, Samanabad Town, and Township [19].
Lahore is included among the top four industrial hubs, which account for 62.42% of Punjab’s industries [14]. The excessive growth of industry around city intersections has led to issues such as resource degradation, deforestation, air pollution, and urban sprawl. Furthermore, the lack of a rigid policy framework, rapid urbanization, inadequate environmental considerations, and encroachments result in the destruction of vegetated land in the city. As a result, only 5% of the area in Lahore is now occupied by green spaces [20]. Urban forestry has the potential to make a city more resilient by mitigating climate change, reducing the impacts of extreme weather events, improving air quality and carbon sequestration, and providing cooling. Hence, it is crucial to consider it in urban growth strategies [21].
Google Earth Engine (GEE) is a cloud-based platform that provides an extensive collection of satellite imagery for remote sensing applications [22,23]. Algorithms are applied to analyze data and generate insights into changes in land cover, urbanization dynamics, terrestrial analysis, and other environmental phenomena across multiple time frames. It provides access to satellites such as Moderate Resolution Imaging Spectroradiometer (MODIS), Landsat 5, and Landsat 8 [24]. Landsat programs have been providing satellite imagery since 1972 and are managed by the United States Geological Survey (USGS) and NASA. Landsat 5 and Landsat 8 have been widely utilized globally for monitoring environmental fluctuations for several years. Landsat 5 includes a Thematic Mapper (TM) and a Multispectral Scanner (MSS) to provide high-resolution, accurate imagery [25]. It has a temporal range of 29 years prior to 2013, as it was decommissioned in 2013. Landsat 8 was launched in 2013 and is operational to date. It has progressive sensors, such as the Thermal Infrared Sensor (TIRS) and Operational Land Imager (OLI), which have enhanced capabilities and radiometric resolution for monitoring [26,27].
Remote sensing analyses using NDVI and NDBI have become widely accepted tools to quantify vegetation loss, green space fragmentation, and horizontal human development sprawl in these rapidly urbanizing regions. While many previous studies articulated the primary land-use changes at selected single time intervals, this research integrates multi-decadal averages with annual selected-year analysis to distinguish the gradual growth of the metropolitan city from accelerated phases of urbanization. By integrating NDVI and NDBI at the district and sub-district level, which enables a multidimensional interpretation of landscape changes for the selected years and decades, the study strengthens the understanding of demographic pressures, peri-urban land transformations, and infrastructural expansion over a long temporal range. This integrative approach contributes to broader theoretical research on urban sustainability transitions and green space fragmentation in increasingly urbanizing cities of South Asia and the Global South. By examining decadal and annual dynamics of vegetation cover and built-up areas at a tehsil and entire district level, the findings will contribute to comparative urban sustainability research. This also enhances the understanding of how medium to large metropolitan cities in South Asia are transitioning under increased anthropogenic developmental pressures.
Apart from documenting the changes in NDVI and NDBI over the past three decades, this study contributes to understanding the spatial dynamics of urban transition in the rapidly expanding metropolitan city of Lahore. This integrative approach demonstrates how demographic pressure, infrastructural expansion, and vegetation decline operate as interlinked components of metropolitan transformation rather than isolated processes. The identification of an accelerated phase of urbanization during 2013–2023 suggests the urban growth of Lahore has shifted from gradual expansion to infrastructure- and transportation-driven peri-urban intensification. This pattern aligns with broader theoretical perspectives describing linear urban development and green space fragmentation in the Global South and South Asian cities. This study helps distinguish between gradual urban change and rapid transformation phases. This study further provides a temporal perspective that can enhance urban sustainability assessments and planning strategies for Lahore city.
The objectives of this study are to (i) analyze the decadal trend of green spaces in Lahore city by the Normalized Difference Vegetation Index (NDVI), (ii) map out the areas affected by urbanization through the Normalized Difference Built-up Index (NDBI) in the metropolitan city, and (iii) evaluate the correlation between population expansion and the loss of green spaces in Lahore. This study will provide a holistic understanding of the consequences of unplanned urban growth in Lahore. It will also highlight regions with high risk where population growth has affected green infrastructure and threatened ecological balance. The GIS-based analysis will draw on urban planning expertise to inform decisions on preserving and restoring vegetated land in Lahore. In addition, the study will highlight the need to integrate green infrastructure and provide robust strategies for forthcoming urban planning projects and for policy development regarding urban expansion.
2. Materials and Methods
2.1. Study Area
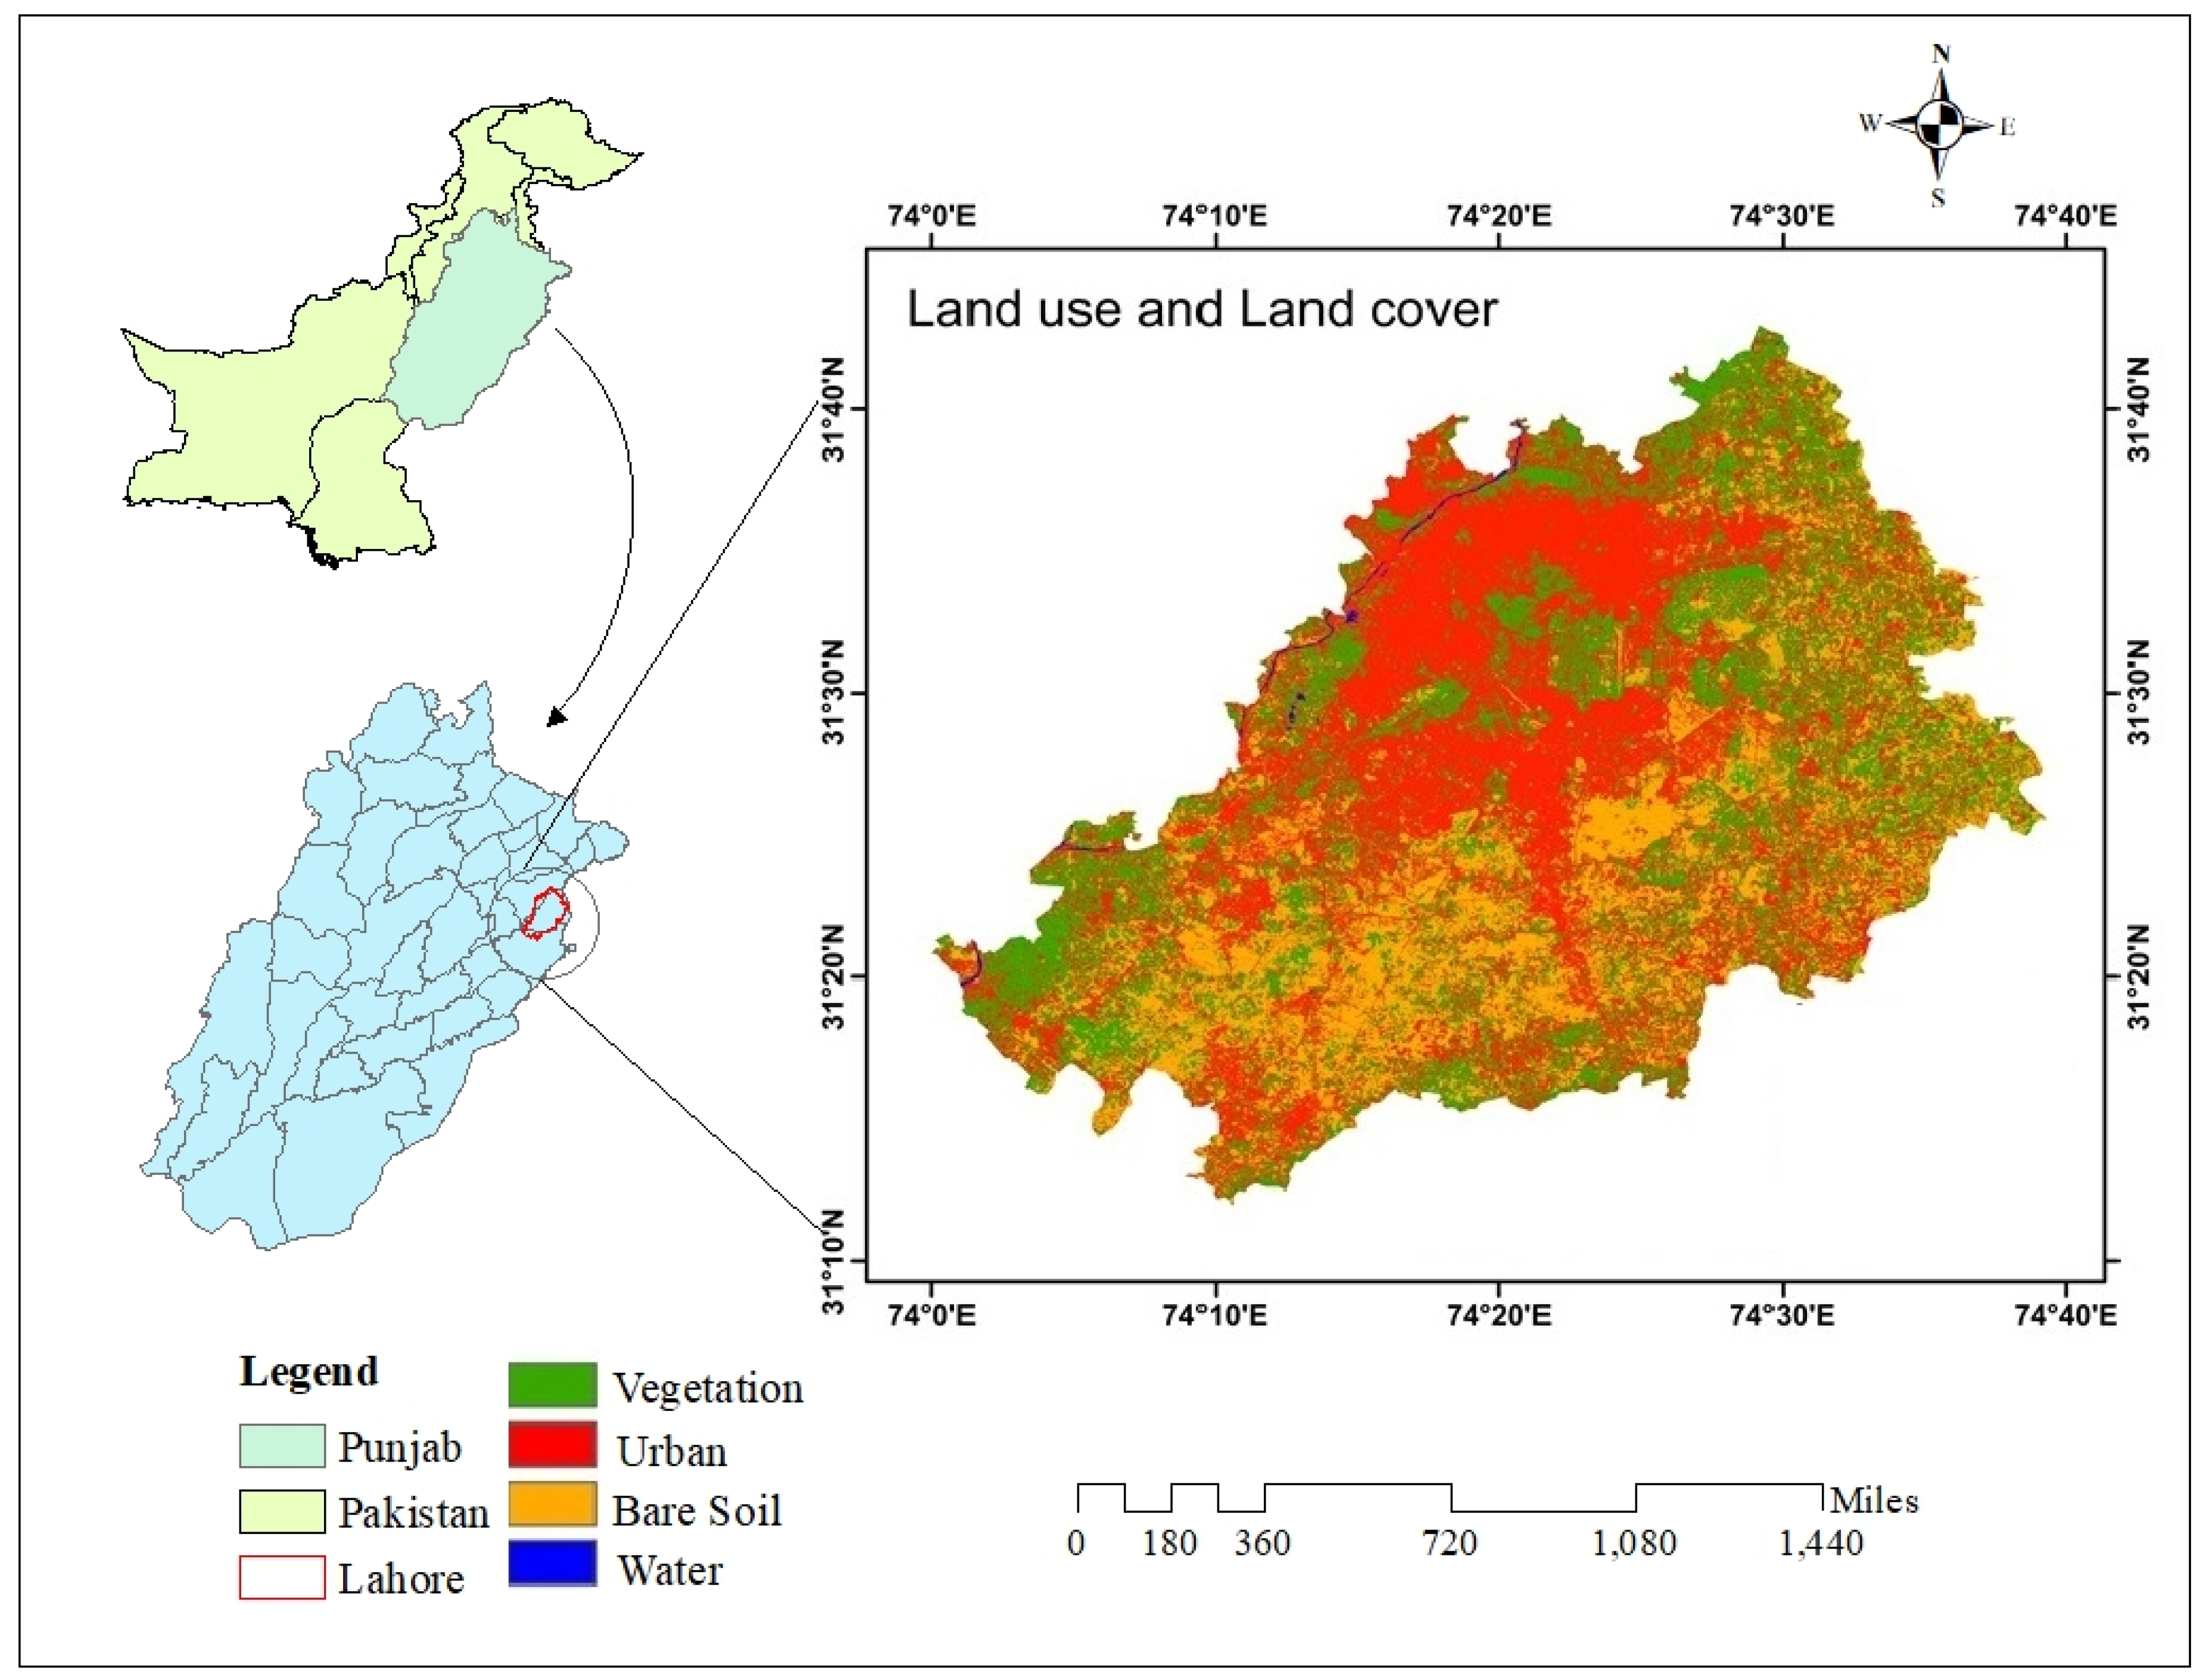
The study was conducted in Lahore city, the capital of the Punjab province, as shown in Figure 1. It is situated at the coordinates 31.5497° N latitude and 74.3436° E longitude [28]. It is the 2nd largest city in Pakistan, with an area of 1772 km2 [29]. It was established as a district in 1849 during the British colonial era [30]. Lahore’s climate is semi-arid, with four distinct seasons that shape the city’s vegetation and landscape. It is a seamless blend of economic development and cultural heritage [31]. The city has evolved into an industrial and commercial center, with significant progress in major sectors such as real estate and textiles and modernized transportation networks. It has a deep-rooted history reflected in Mughal-era landmarks such as the Badshahi Mosque and Lahore Fort and in British colonial architecture such as GC University Lahore and Aitchison College [32]. In Lahore, the sub-districts of the city are known as “tehsils”. A tehsil is a sub-district-level administrative unit within a district. This division method is widely used in South Asian countries for governance, regional planning, and census reporting purposes. This site was chosen for analysis because the city has been prone to substantial land transformations in recent decades, driven by robust growth that led to the clearing of vegetated land for urban development. The availability of high-resolution satellite data and widespread development made it a robust site for temporal and spatial analysis of urbanization.
Figure 1.
Study area map of Lahore, Pakistan, depicting land-use and land-cover (LULC) distribution.
2.2. Data Collection
The primary data was acquired from Google Earth Engine (GEE). The spectral bands for 1993, 2001, and 2013 were retrieved from Landsat 5, and data for 2023 were obtained from Landsat 8. Landsat was utilized due to its extensive temporal coverage until 1993, compared to other modern sensors. For each selected year, i.e., 1993, 2001, 2013, and 2023, Landsat imagery was acquired from 1st January to 31st December of each year. The image was processed to compute annual and decadal mean NDVI and NDBI values at the district and sub-district level. In addition to annual tehsil-level analysis, decadal averages were calculated for the periods 1993–2001, 2001–2012, and 2013–2023 to get a complete picture of the changes, minimize the influences of short-term variabilities, highlight long-term changes in the landscape dynamics, and gain a deeper understanding and better insights.
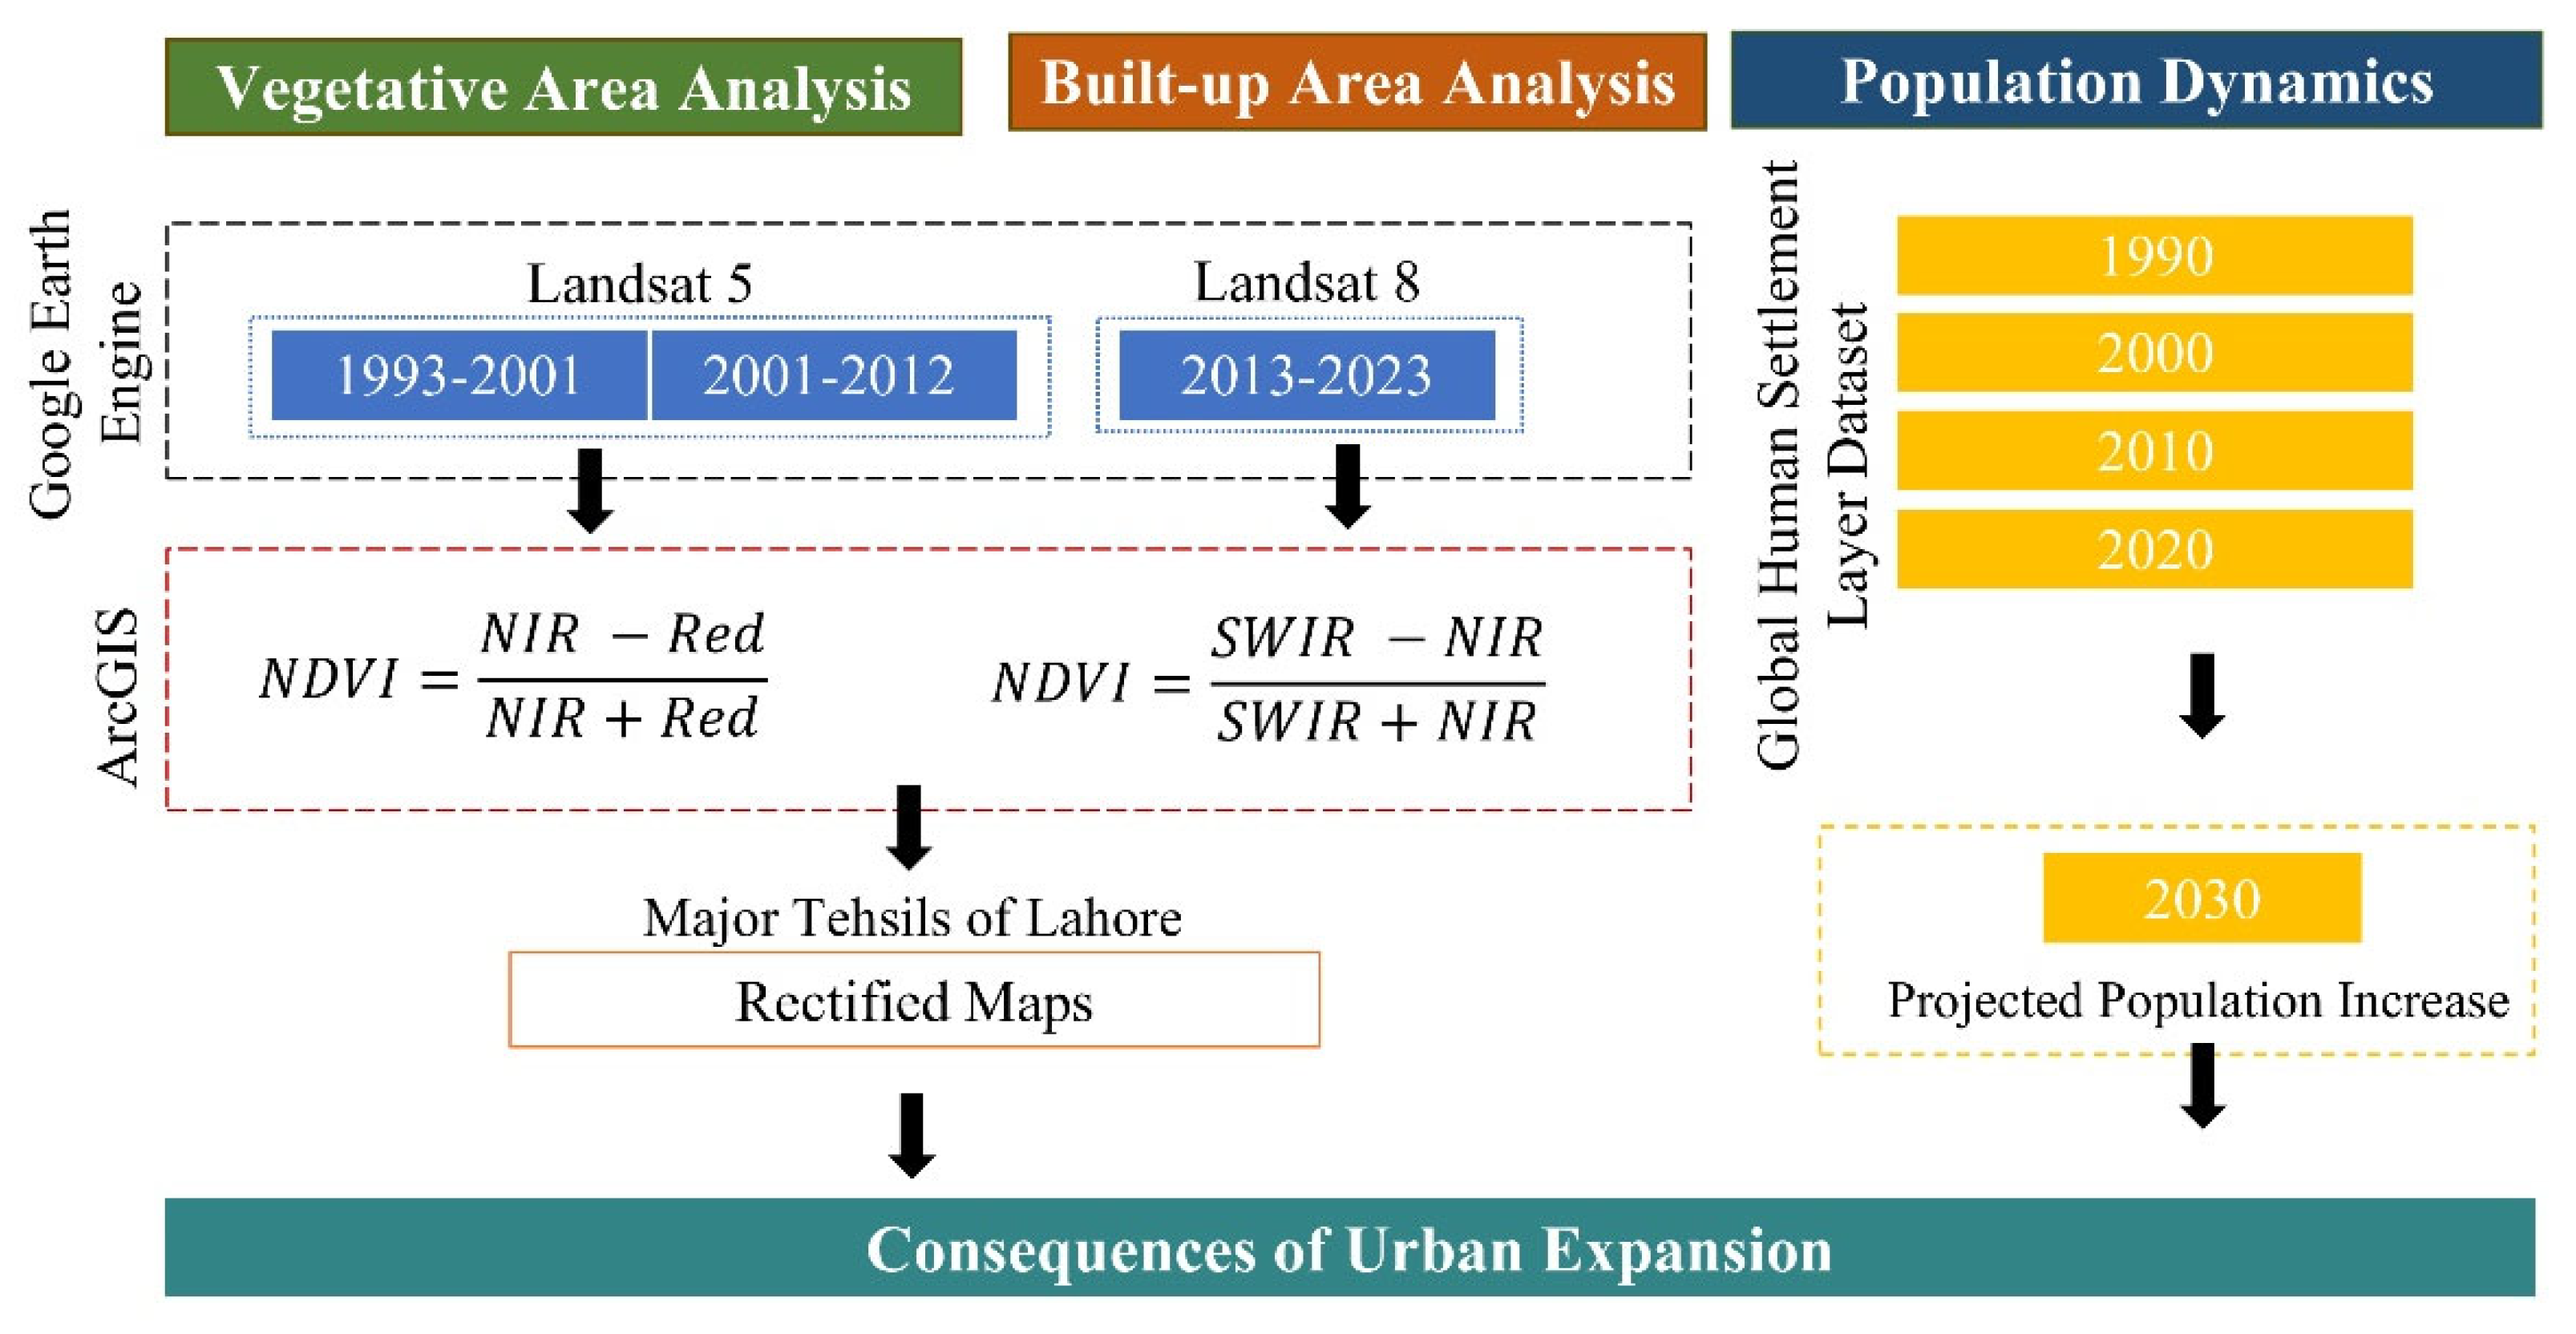
The year 2001 was selected instead of 2003 because the 2003 images were compromised, possibly due to seasonal variation. The yearly averages were taken for a comprehensive analysis of the complete period. A spatial resolution of 30 m was deemed suitable for analyzing spatial patterns over the years. The cloud cover was masked, and atmospheric corrections were applied using GEE’s built-in features to ensure accurate index calculation. The shapefiles were acquired from the Urban Unit for Lahore city. A schematic of the methodology opted for in the study is summarized in Figure 2.
Figure 2.
Methodological framework representing data sources, processing steps, and spatiotemporal assessment of vegetation cover, built-up areas, and population density in Lahore city.
According to the scope and temporal structure of the study, the five-tehsil administrative division was selected for analysis to ensure spatial and temporal consistency throughout the study period. The five tehsils in Lahore used for the current study were Lahore city, Lahore Cantt, Raiwind, Shalimar, and Model Town. To ensure temporal uniformity across all annual and decadal datasets for each reference period, NDVI and NDBI analyses were conducted, and data were organized according to five sub-districts and the entire Lahore district. This five-tehsil division was used to ensure comparability of land-use patterns in each tehsil across the selected years and decades. Any subsequent administrative restructuring of Lahore did not influence the spatial comparisons presented.
2.3. NDVI-Based Vegetation Analysis
The analysis was conducted on ArcGIS version 10.3. The shapefiles were uploaded to the software to analyze the city’s vegetative land. The Normalized Difference Vegetation Index (NDVI) was computed through red (Band 3) and near-infrared (NIR) (Band 4) spectral bands obtained from Landsat 5 and Landsat 8 for each selected year. The formula utilized for analysis was the following [33]:
NDVI = (NIR − Red)/(NIR + Red)
The NDVI layers were further exported as GeoTIFF files for further evaluation. The NDVI values were classified into the following 4 categories: (i) 0.199 for non-vegetative, bare, and built-up areas; (ii) 0.2–0.3 for sparse vegetation; (iii) 0.3–0.5 for moderate vegetation; and (iv) 0.5 for dense vegetation, as shown in Table 1. The description of Landsat images used in the study is depicted in Table 2. The classifications were further refined using NDVI layers generated through ArcGIS with the Reclassify tool. The reclassified maps were then used to evaluate the spatial distribution of vegetative land in Lahore city across different periods. The tehsil-wise analysis was also performed for Shalamar, Cantt, Raiwind, Lahore city, and Model Town to highlight the areas prone to the effects of urbanization in the city.
Table 1.
NDVI values of vegetation type.
Table 2.
Landsat image descriptions.
NDVI classification thresholds were kept consistent throughout the yearly and decadal averages used in the study to ensure comparability of vegetation changes over time. It is important to clarify that vegetation classes derived from NDVI thresholds reflect variations in the vegetation density and canopy coverage, rather than distinct forest ecosystem categories. Within the environmental baseline conditions of Lahore, the geobotanical interpretation of these NDVI ranges adopted for this study was as follows:
- Dense Vegetation (NDVI > 0.5) in Lahore primarily represents the irrigated agricultural lands, urban parks, institutional green spaces, dense green belts (canal road), Miyawaki forests, artificial forests (Jallo Park), tree plantations, managed orchards, and localized riparian vegetative areas along the Ravi River.
- Moderate Vegetation (NDVI 0.3–0.5) predominantly includes cultivated croplands, seasonal agricultural fields, institutional agricultural areas, green belts around the city, and managed vegetation with moderate canopy cover.
- Sparse vegetation (NDVI 0.2–0.3) generally includes peri-urban transitional landscapes like abandoned agricultural areas on the southern and southwestern fringes, transitional open spaces awaiting development, unevenly distributed scrub vegetation, degraded shrub communities, and transitional open spaces facing developmental pressures.
- Non-vegetative land (NDVI < 0.199) represents built-up areas, barren land, exposed soil areas, and impervious infrastructural developments.
2.4. Built-Up Area Identification Using NDBI Analysis
To examine the built-up area, the land of Lahore was classified into three major categories: built-up area, vegetated land, and water bodies (Table 2). The Lahore shapefiles were again uploaded for built-up area analysis. The Normalized Difference Built-up Index (NDBI) was calculated using NIR (Band 5) and Shortwave Infrared (SWIR, Band 6) spectral bands for selected time periods. The formula used for computing NDBI was the following [34]:
NDBI = (SWIR − NIR)/(SWIR + NIR)
The generated NDBI layers were also exported as GeoTIFF files. The NDBI values range from −1 to +1; negative values indicate water bodies, 0 represents vegetated land, and positive values indicate built-up areas, as shown in Table 3. These classifications were applied to the NDBI layers using the Reclassify tool. The quantified data was used to analyze the trend of the built-up areas in Lahore due to excessive urbanization.
Table 3.
Land-use classification.
2.5. Spatiotemporal Assessment of Population Dynamics in Lahore
To analyze the dynamics of the urban population of Lahore, census data were obtained from the Lahore Bureau of Statistics website and the Global Human Settlement Layer (GHSL) dataset. The census data was collected in 1998, 2017, and 2023, when official censuses were conducted in the country. GHSL is a comprehensive dataset established by the European Commission Joint Research Centre (JRC) to evaluate population density, distribution, and trends in global urbanization. It uses high-resolution geospatial data, census statistics, and machine learning to analyze population dynamics, urban expansion, and settlements. The time periods selected for understanding population expansion were 1990, 2000, 2010, and 2020. Moreover, projections were made for 2030 based on existing growth patterns and dynamics.
3. Results
3.1. Variation in Spatial Trends of Lahore’s Vegetation Cover
The results presented in this section are mainly based on the annual mean of NDVI and NDBI values derived for the years 1993, 2001, 2013, and 2023. For each reference year, the image was processed to calculate yearly averages at the tehsil level to minimize seasonal variabilities and ensure a comprehensive representation of landscape and land-use conditions. In addition to yearly assessments, decadal-based averages were calculated to normalize and smooth short-term fluctuations and reduce the influence of seasonal or short-term climatic factors. This was done to provide a clear representation of long-term changes in landscape dynamics.
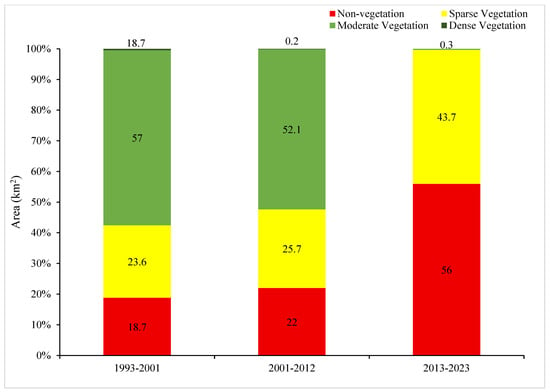
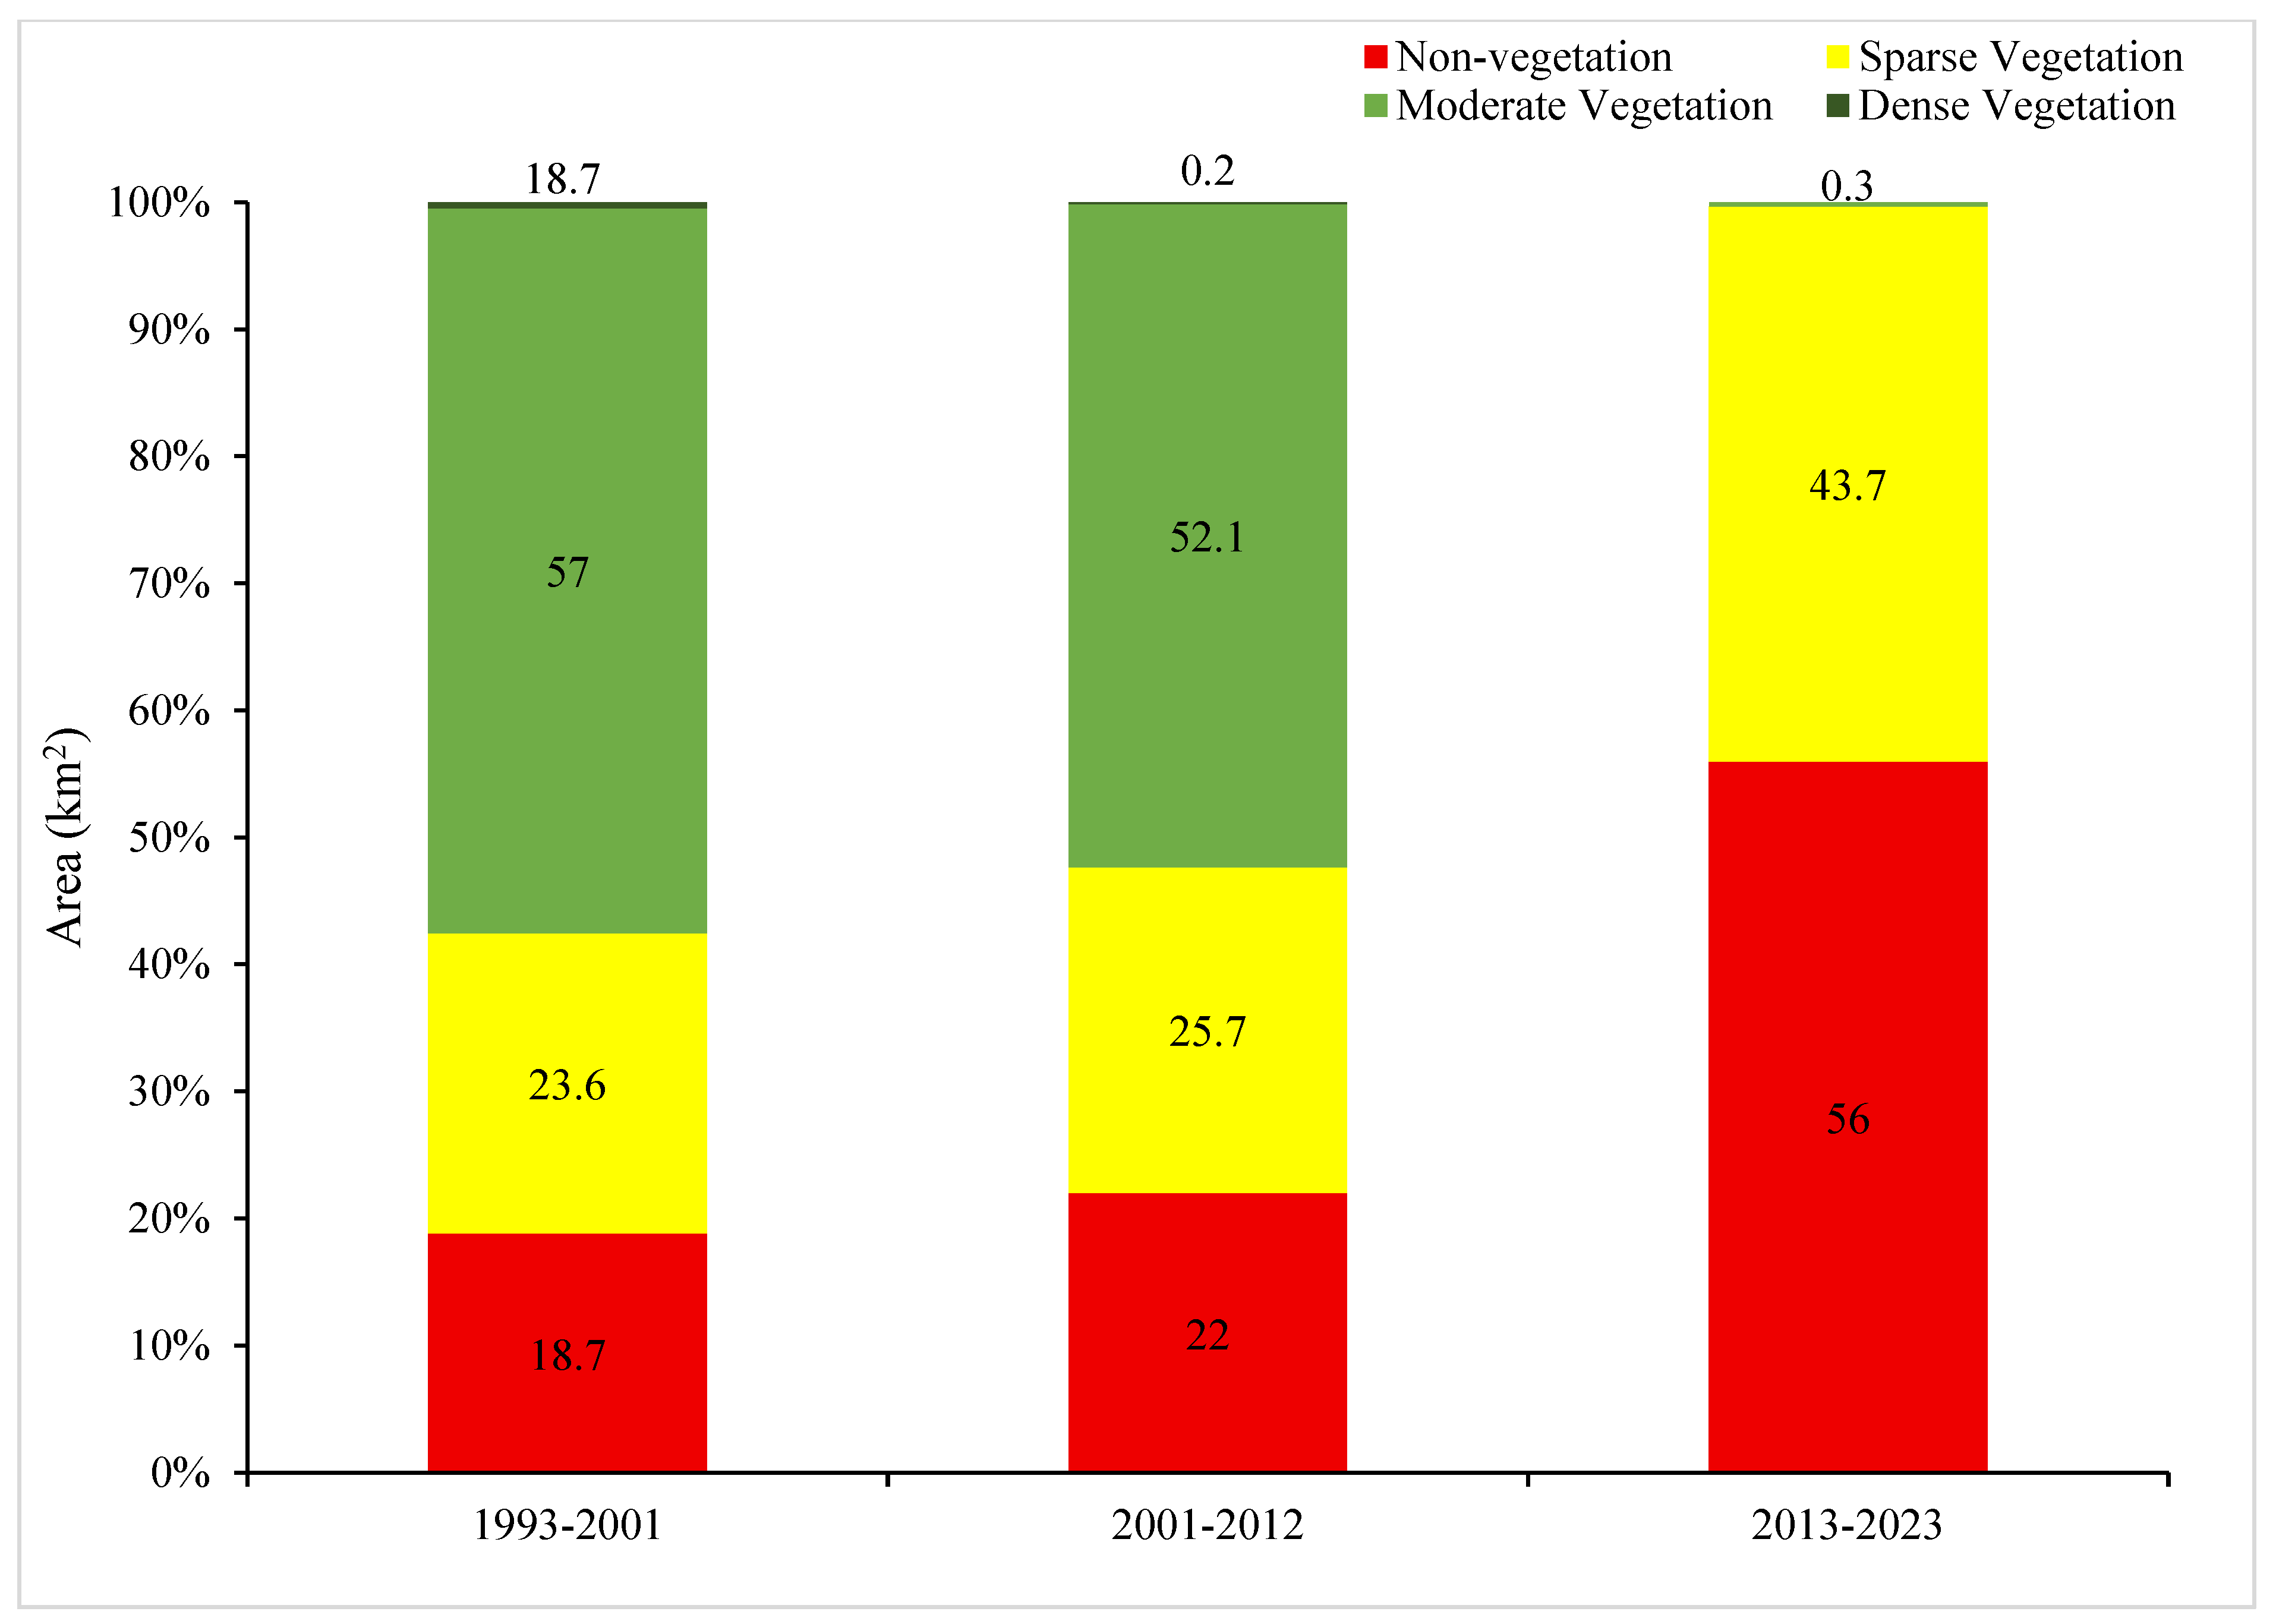
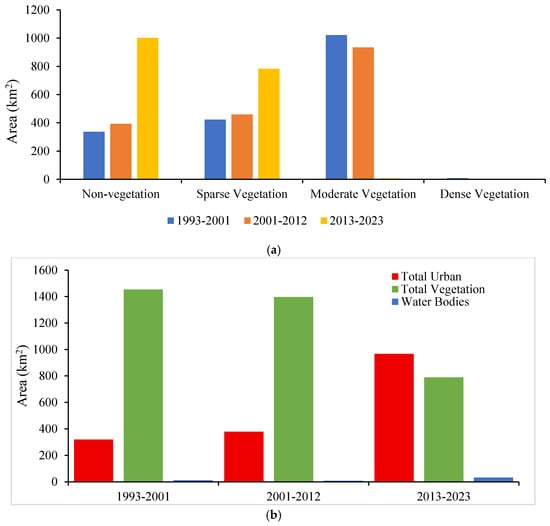
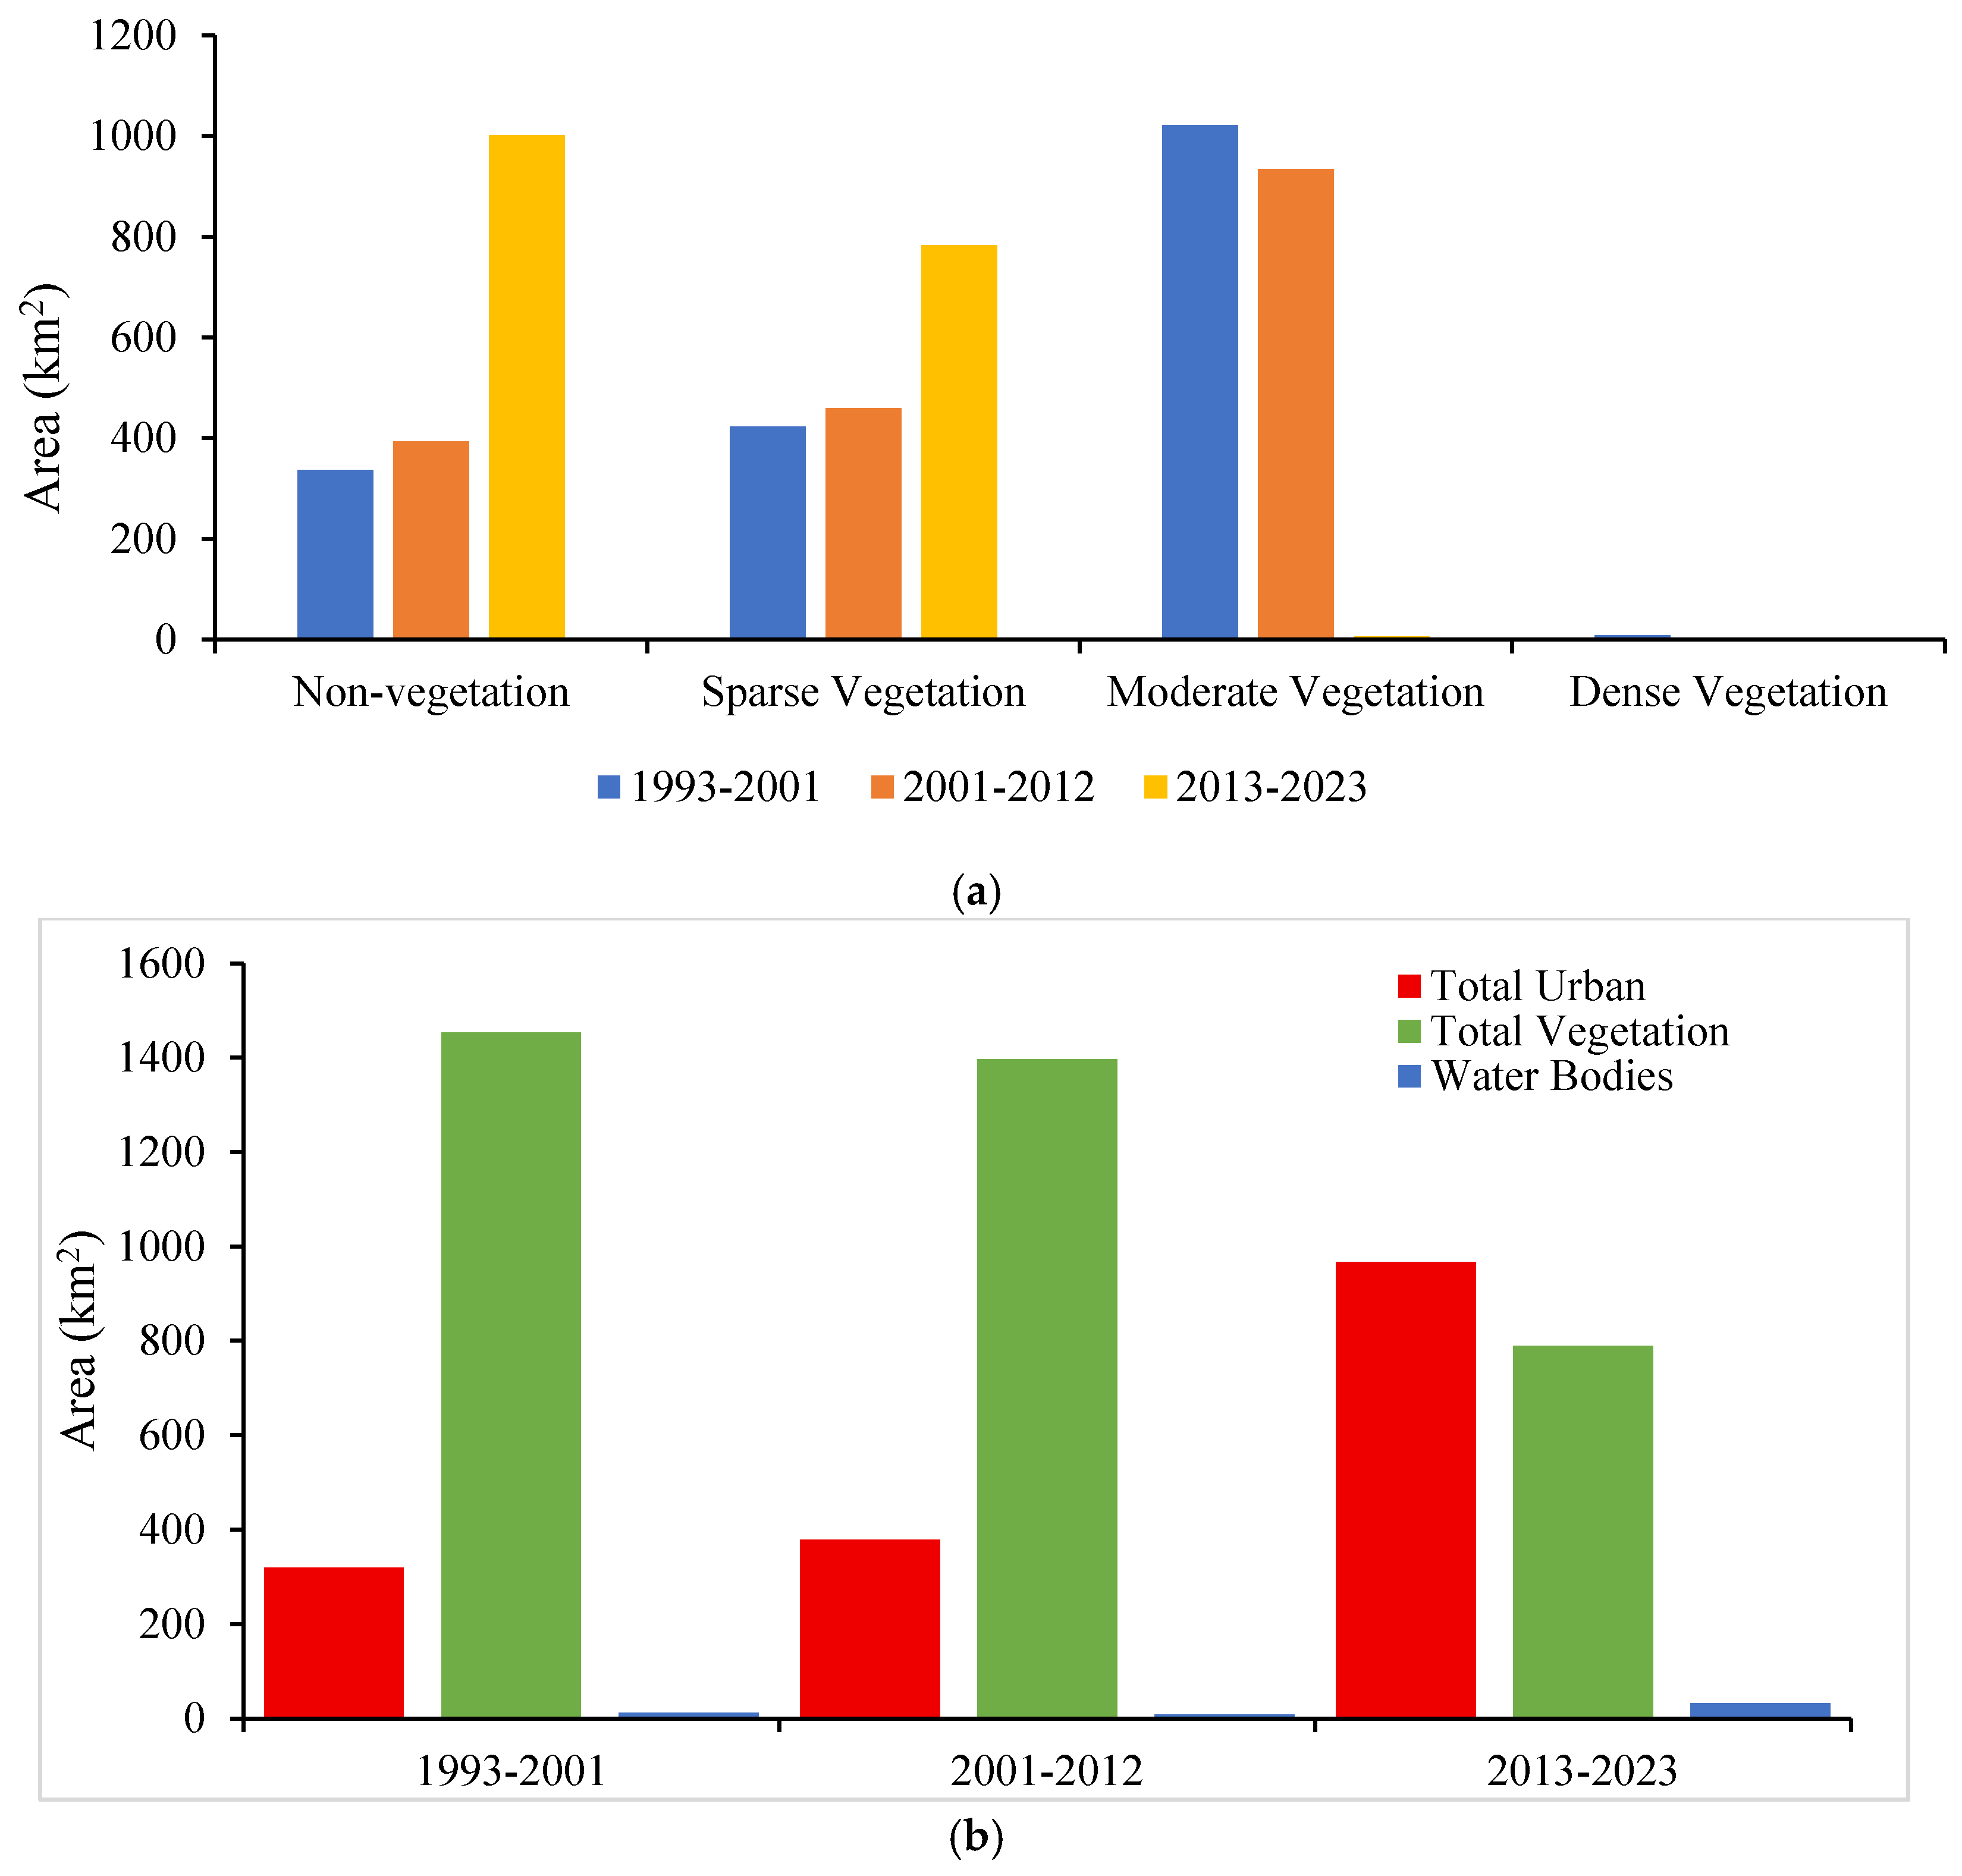
The NDVI analysis revealed a decadal trend of vegetation cover in Lahore city (Figure 3). In 1993–2001, the total vegetative and non-vegetative land was observed to be 1453.0 km2 (81.2%) and 336.5 km2 (18.8%), respectively. The trend showed a minor reduction over the decade 2001–2012 (vegetation = 78.0%; non-vegetation = 22.0%), followed by an exponential decrease in 2013–2023, leaving only 44.1% (788.2 km2) of vegetation in the city. The trend of sparse vegetation increased significantly over the decade 2013 to 2023, totaling 99.2% (782.6 km2) of the total vegetation in the city. Moderate vegetation experienced massive destruction, with 70.3% lost between 1993 and 2012 and only 0.7% remaining between 2013 and 2023. The trend of dense vegetation has been limited since 1993, and the city lost all of it from 2013 to 2023. This decadal trend of vegetation density is summarized in Figure 3.
Figure 3.
Classification of vegetation density in Lahore using decadal averages of NDVI for the 1993–2001, 2001–2012, and 2013–2023 periods.
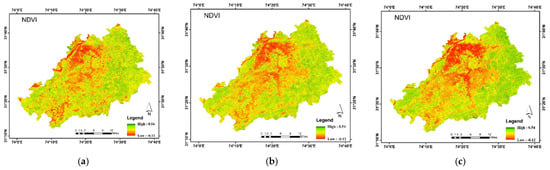
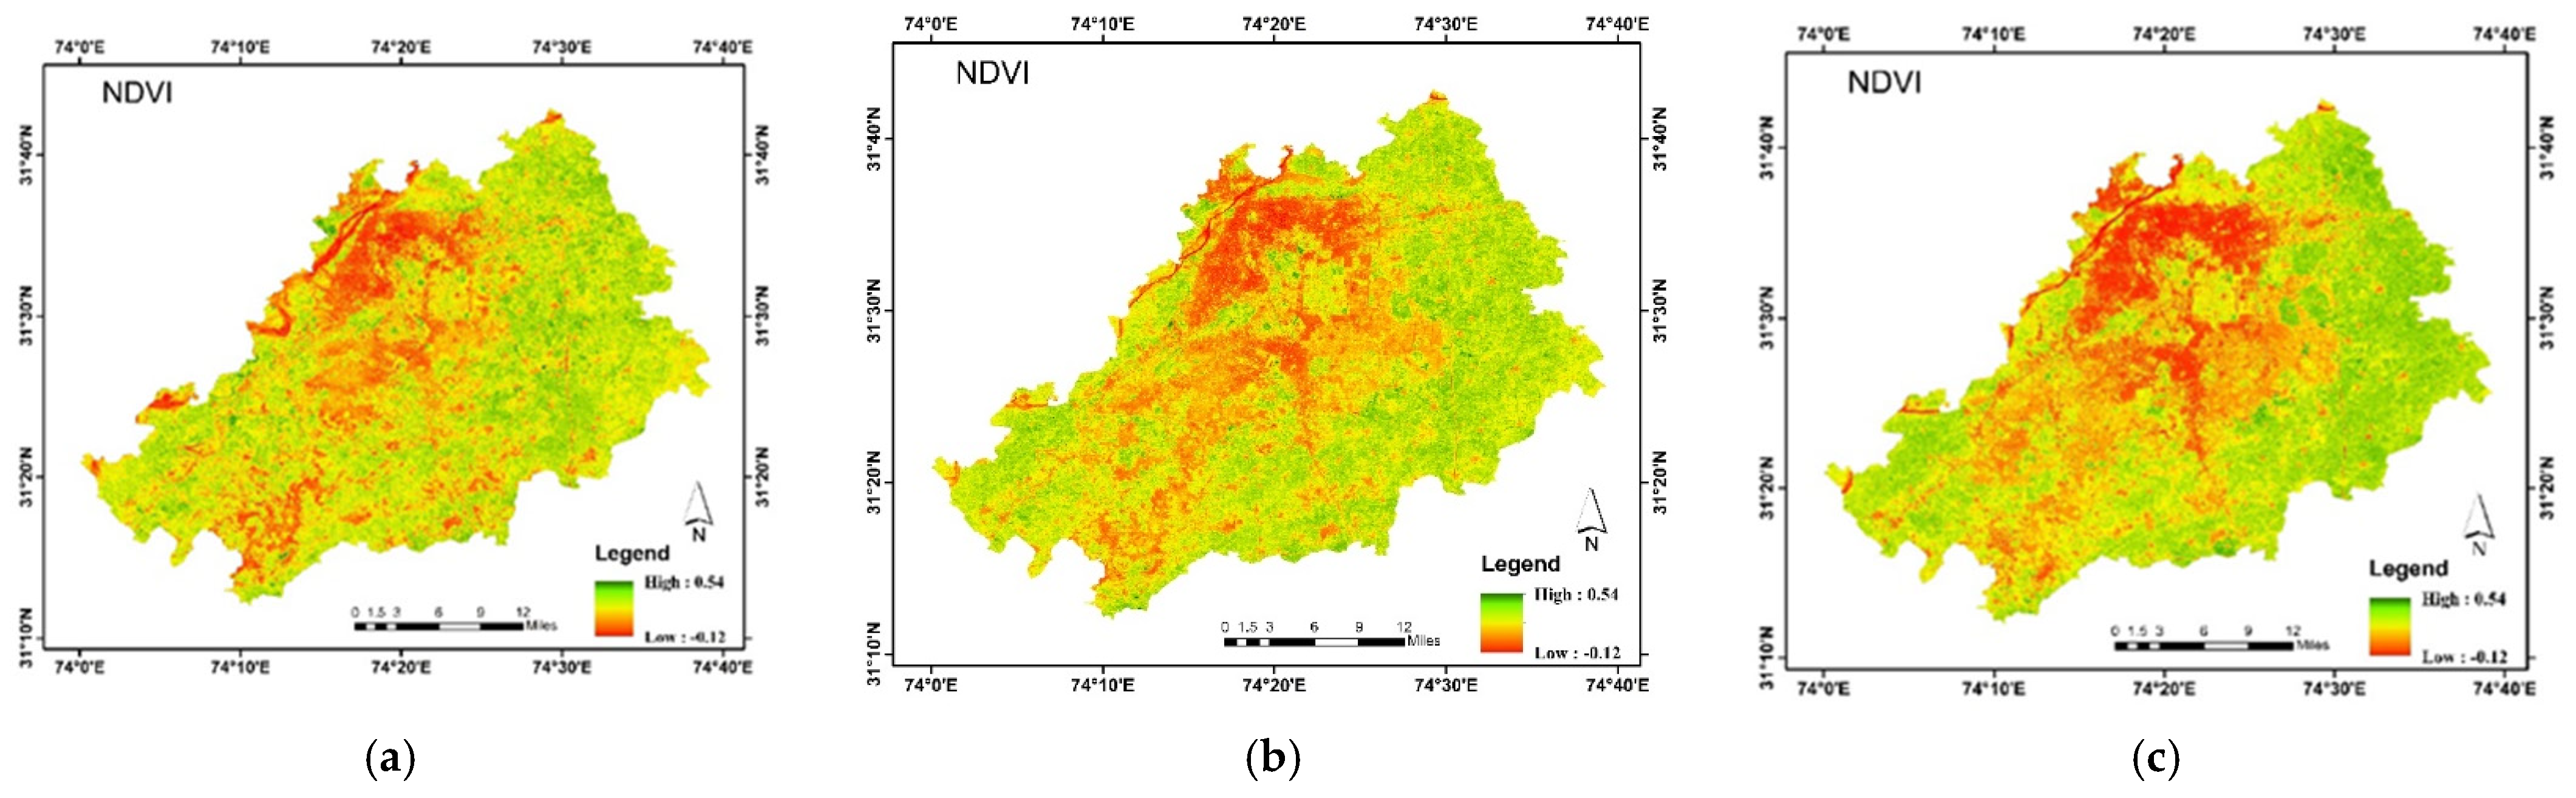
NDVI image classification depicts the variation in vegetation density in Lahore city since 1993 (Figure 2). A high NDVI (dense vegetation) was not vividly observed in all respective decades studied. Moreover, a moderate NDVI was correspondingly seen in 1993–2001 and 2001–2012 but diminished in the decade 2013–2023. The low NDVI values were scarce in 1993–2001. However, the values became more widespread in the succeeding decade of 2001–2012 and expanded further in 2013–2023, indicating the spread of urbanization in the city, as shown in the NDVI image classification for Lahore for 1993–2001, 2001–2012, and 2013–2023 in Figure 4.
Figure 4.
Decadal NDVI-based image classification of Lahore: (a) 1993–2001, (b) 2001–2012, and (c) 2013–2023.
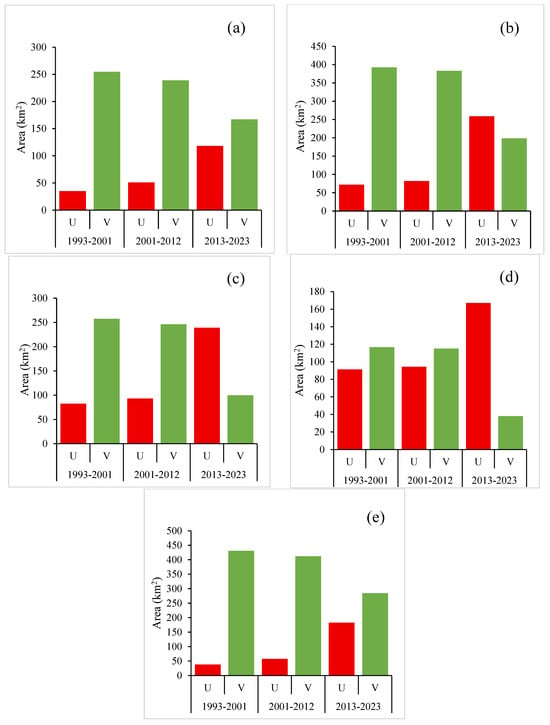
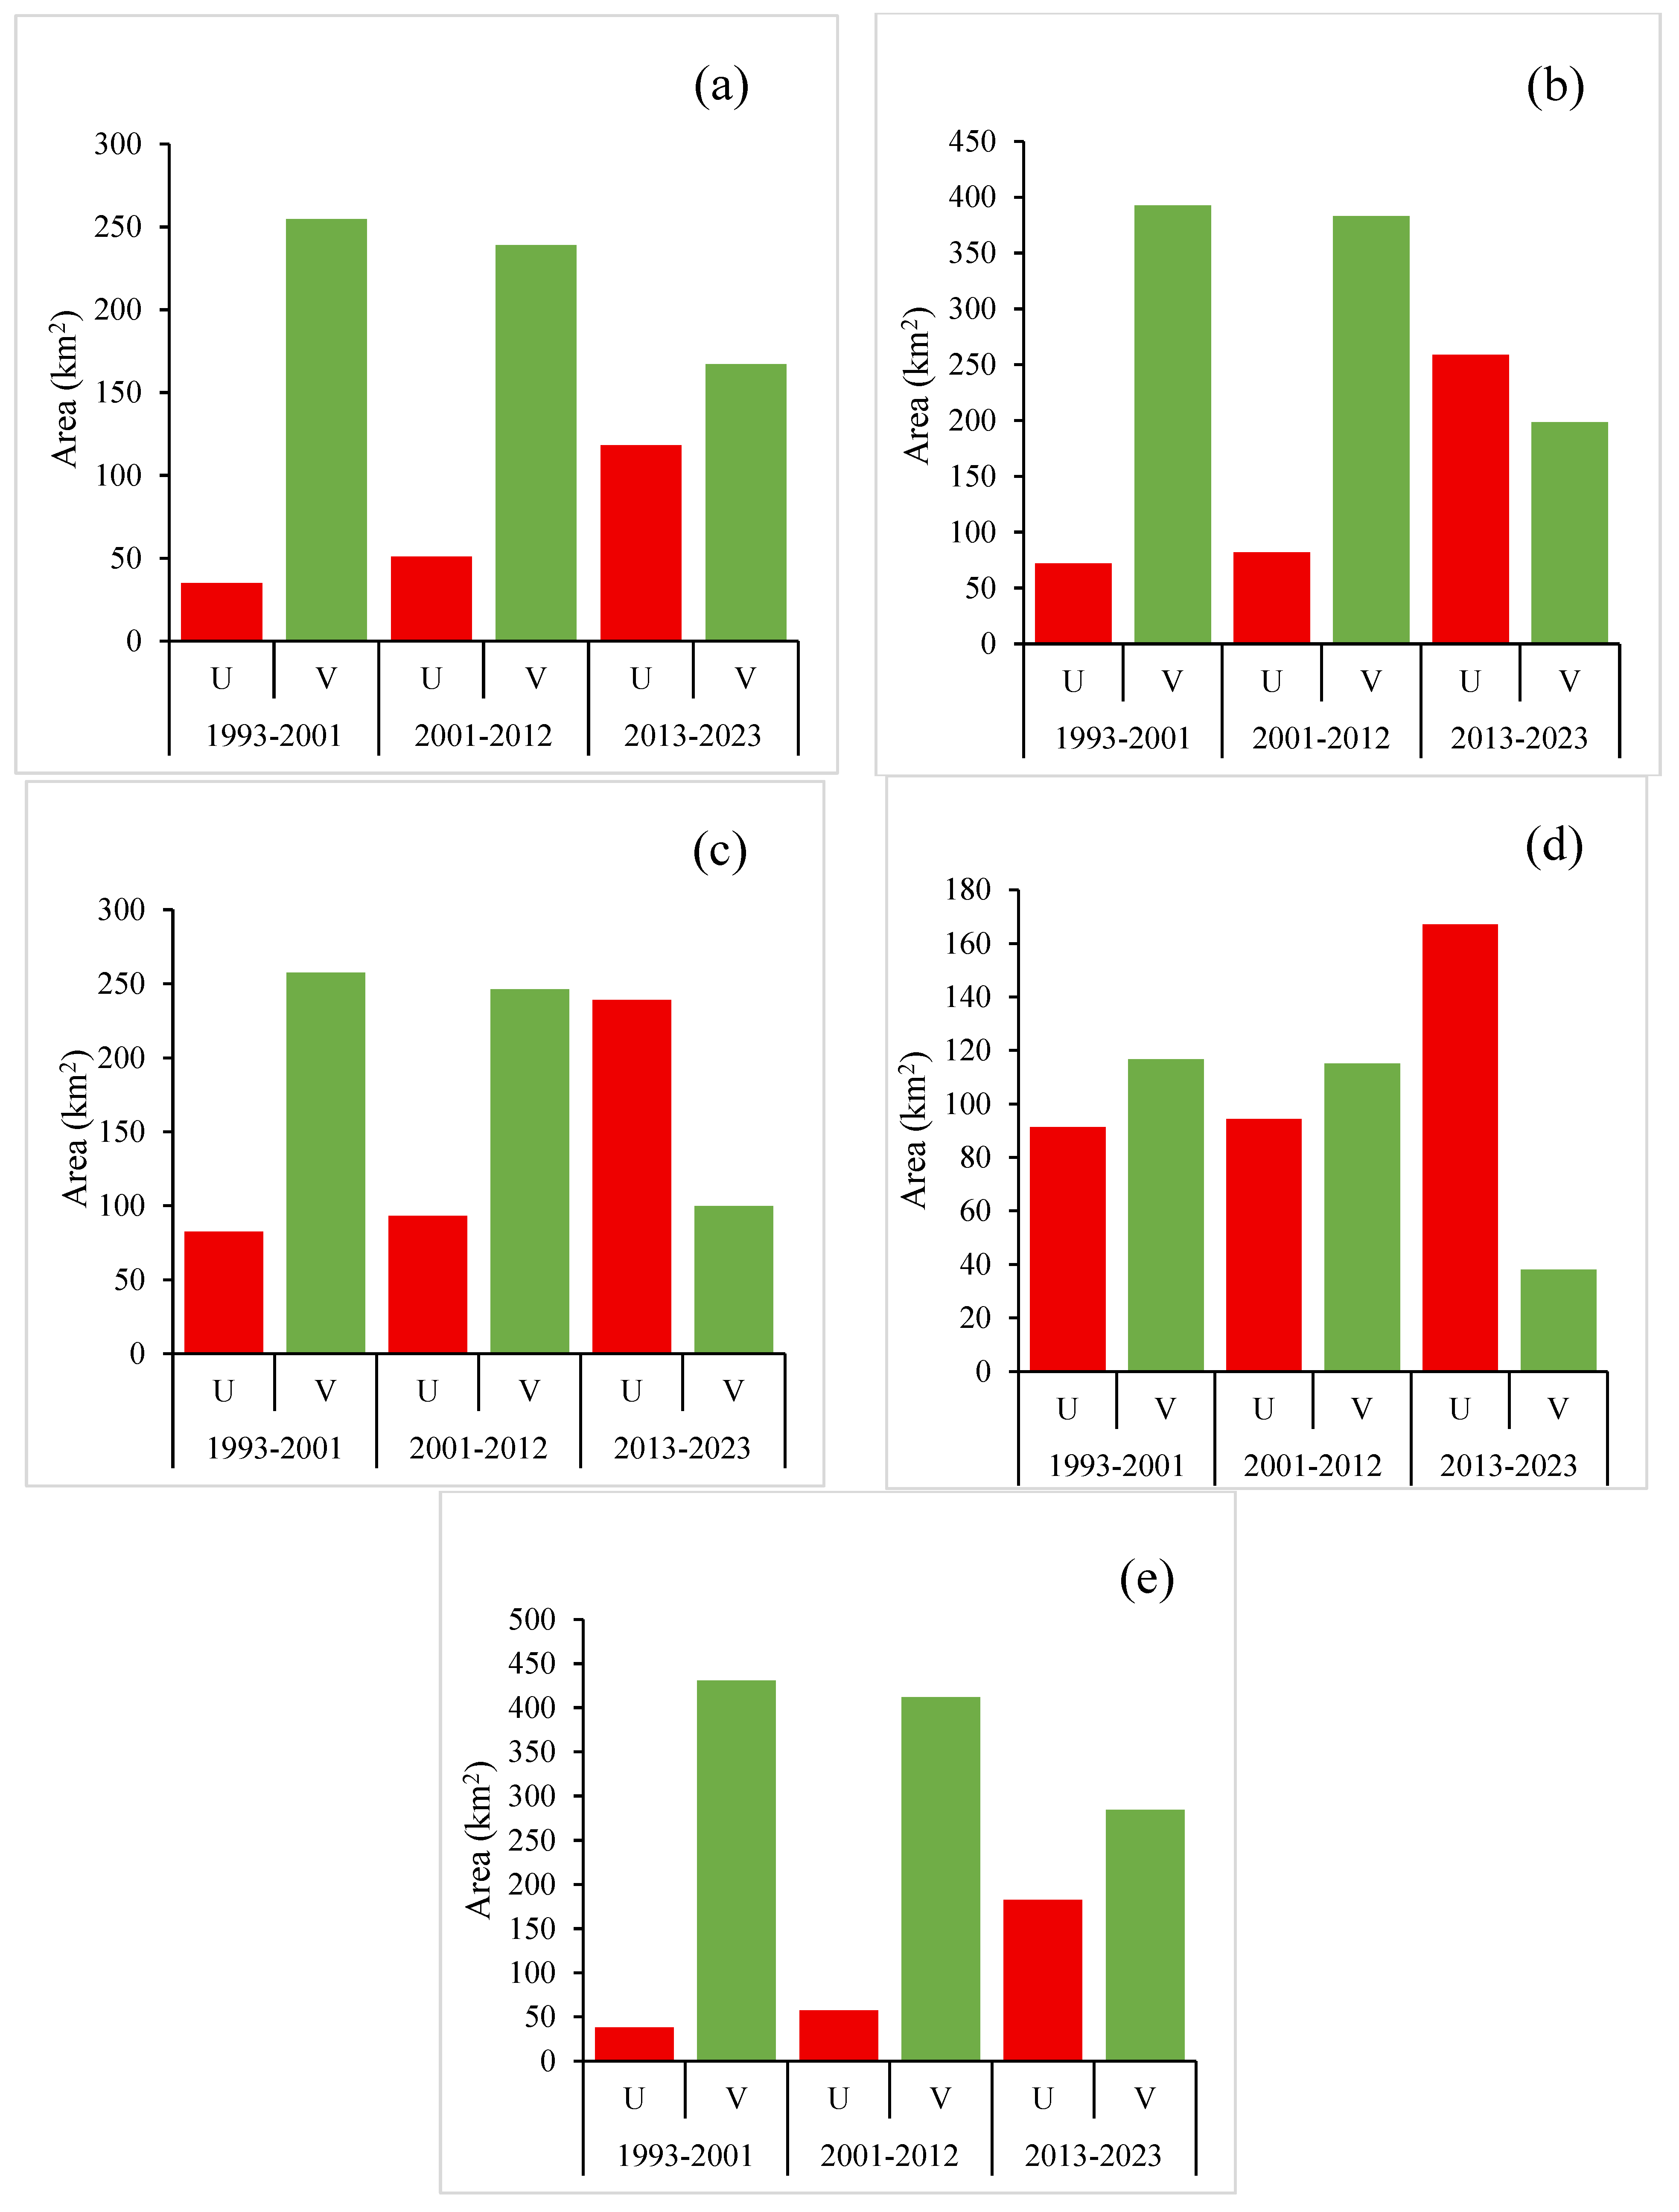
The tehsil-wise land distribution illustrated areas in Lahore that were more resistant and less prone to the effects of urbanization (Figure 5). In 2023, Lahore Cantt exhibited a notable 35.3% (305.3 km2) vegetation recovery over a decade, higher than in other regions. Secondly, Raiwind demonstrated remarkable vegetation regrowth of 26.0% (224.1 km2) in 2023, after a decline in 2013. In the Shalamar tehsil, the vegetation cover decreased over two consecutive decades, from 2001 (235.2 km2) to 2023 (142.3 km2), and then experienced growth in 2023 (169.6 km2). Lahore city experienced a decline in its growth rate, from 7.7% in 1993 to 5.8% in 2023. The vegetation in the Model Town region showed an upward trend in 2001 (18.7%) before declining. The tehsil-wise urban and vegetative land distribution of Shalamar, Raiwind, Model Town, Lahore city, and Lahore Cantt is depicted in Figure 5.
Figure 5.
Tehsil-wise decadal urban and vegetative land distribution: (a) Shalamar, (b) Raiwind, (c) Model Town, (d) Lahore city, and (e) Lahore Cantt.
3.2. Distribution of Built-Up Areas Across Lahore City
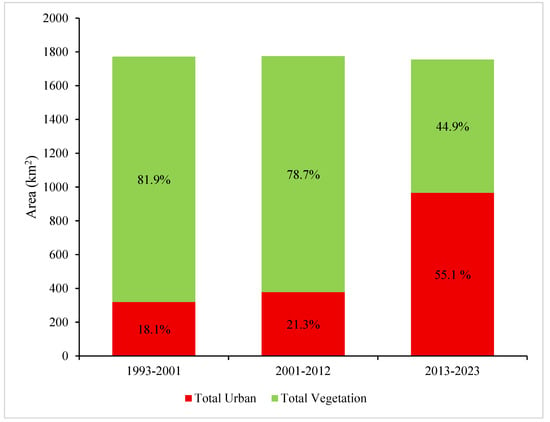
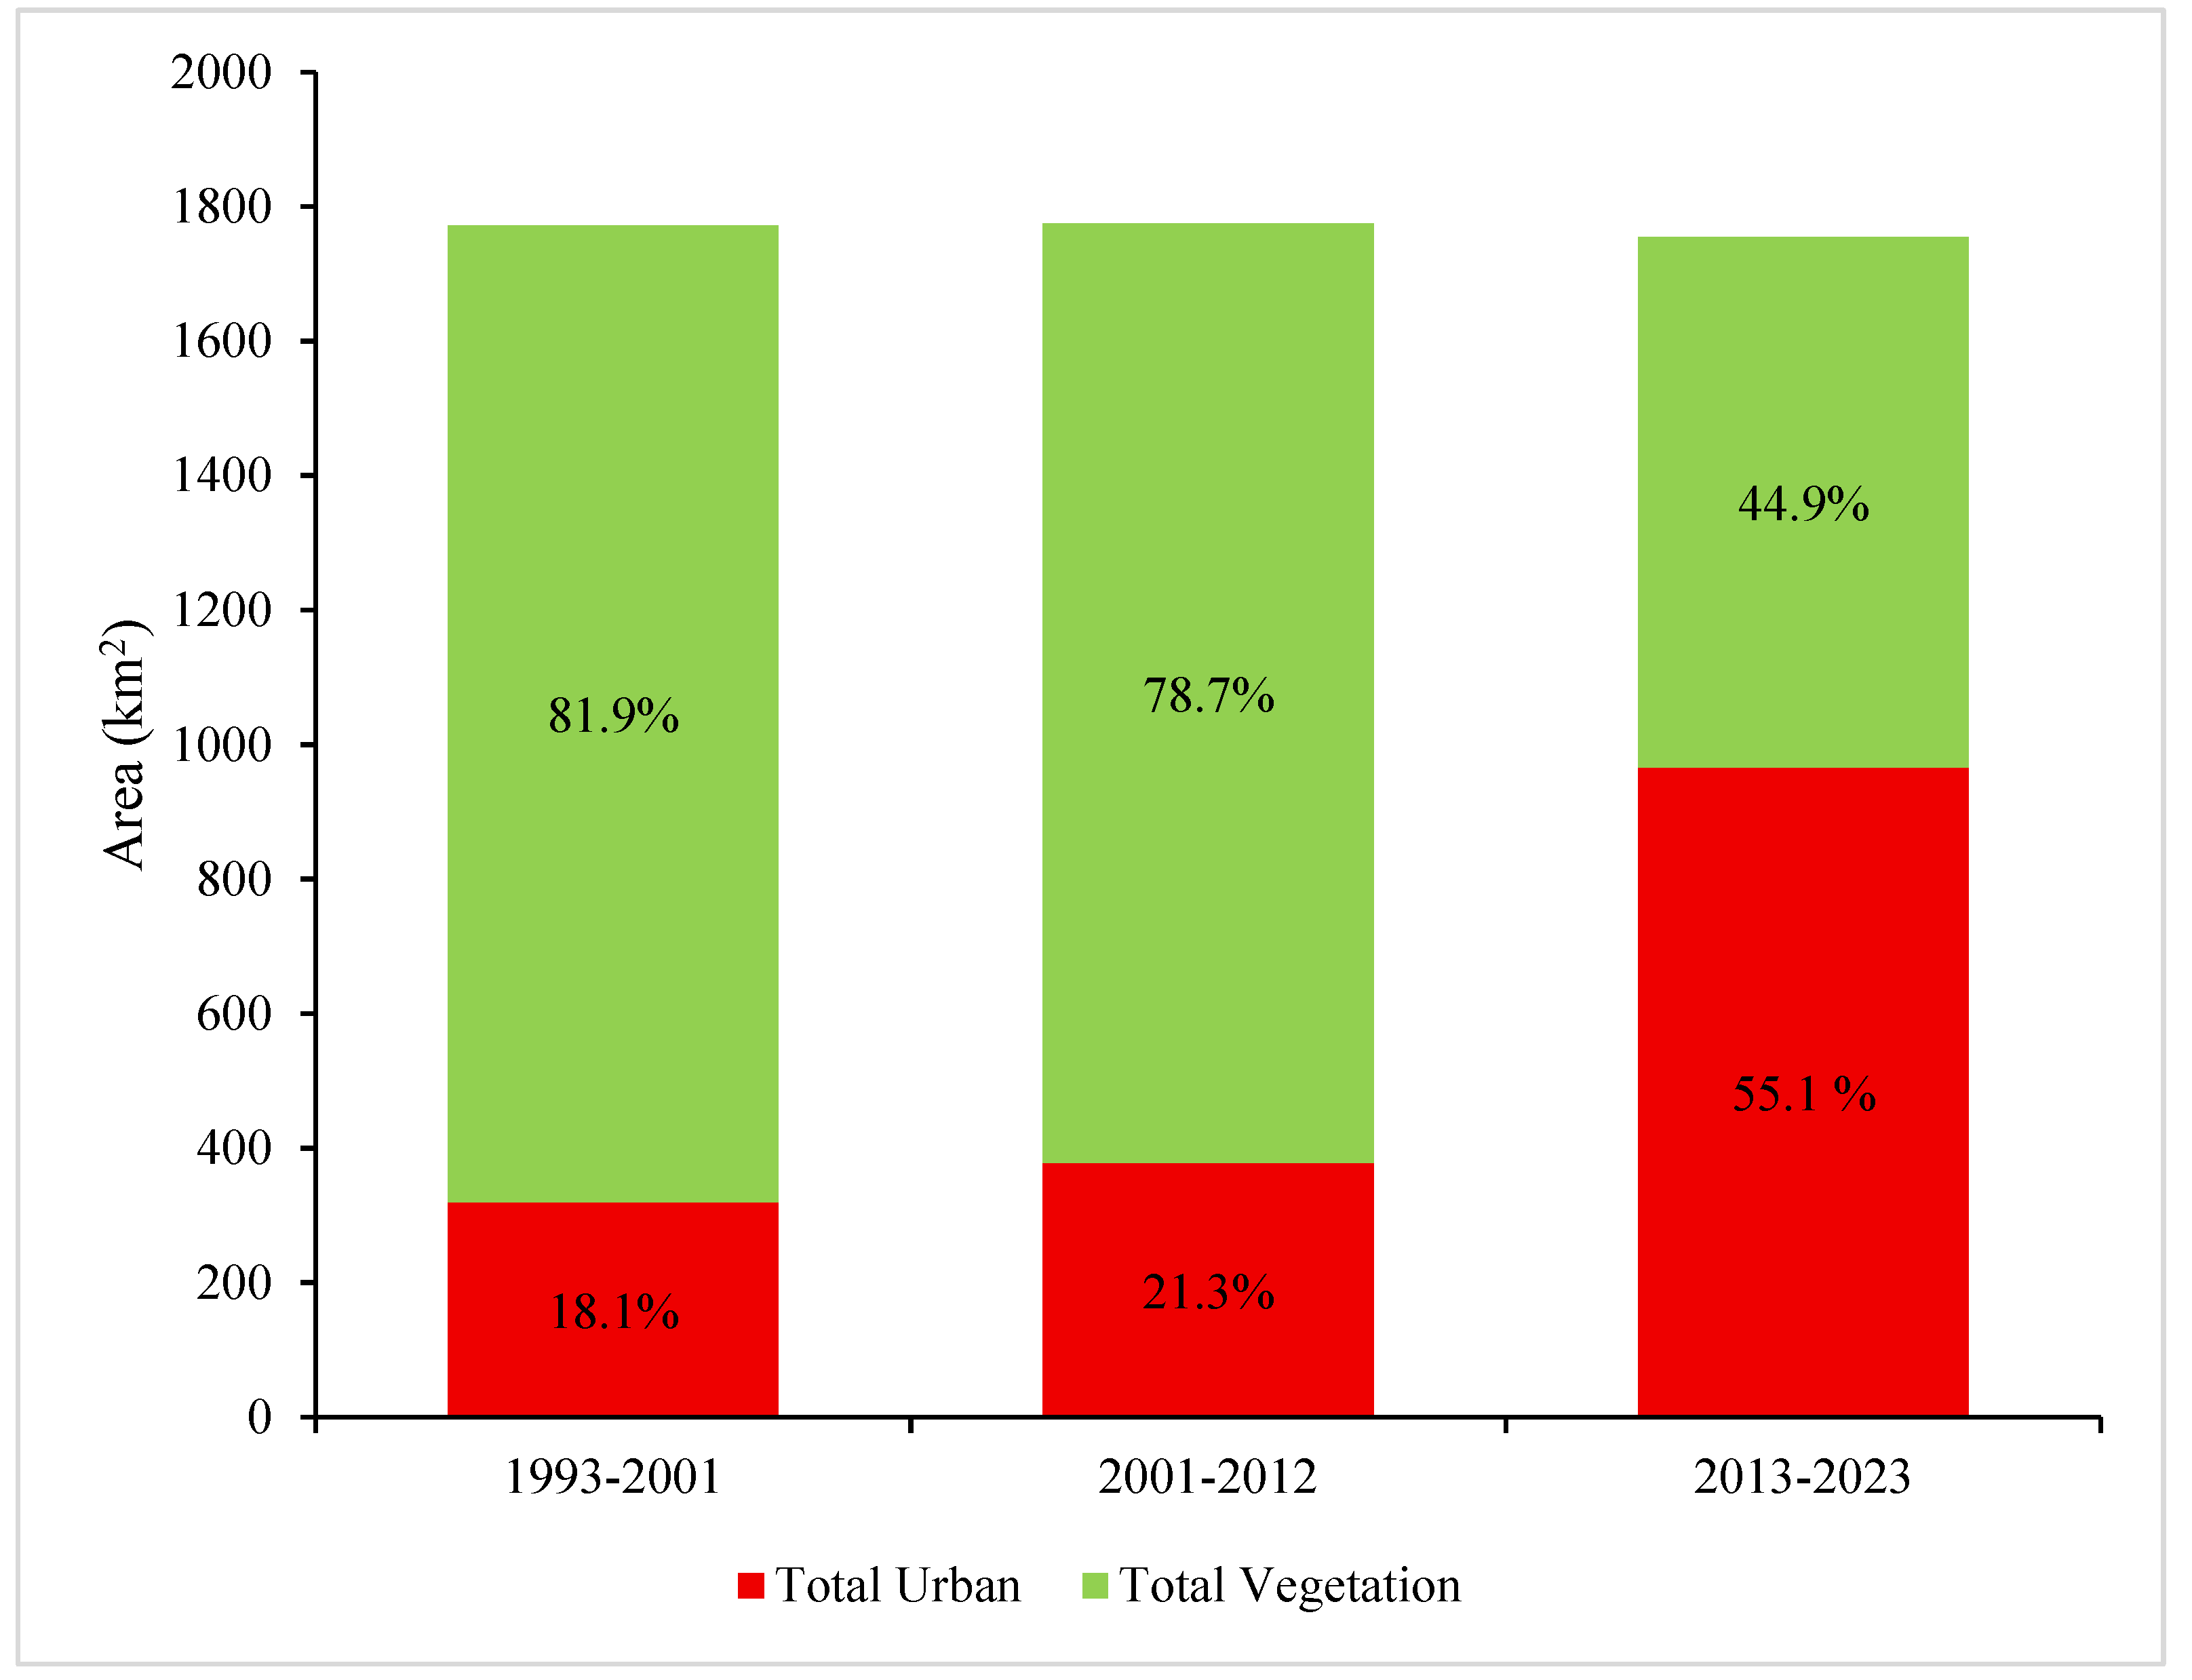
The land classification of Lahore city is given in Figure 6. Vegetative land decreased slightly from 1453.0 km2 (81.9%) in 1993–2001 to 1396.0 km2 (78.7%) in 2001–2012, but a drastic reduction was observed in 2013–2023, totaling only 788.6 km2 (44.9%) of the remaining land. The proportion of urban land steadily expanded, from 319.6 km2 (18.1%) in 1993–2001 to 378.7 km2 (21.3%) in 2001–2012 and eventually to 966.8 km2 (55.1%) in 2013–2023, as shown in Figure 6. Hence, more than half of the land in 2023 was urbanized.
Figure 6.
Trend of land classification in Lahore using decadal averages of NDVI and NDBI during 1993–2001, 2001–2012, and 2013–2023 periods.
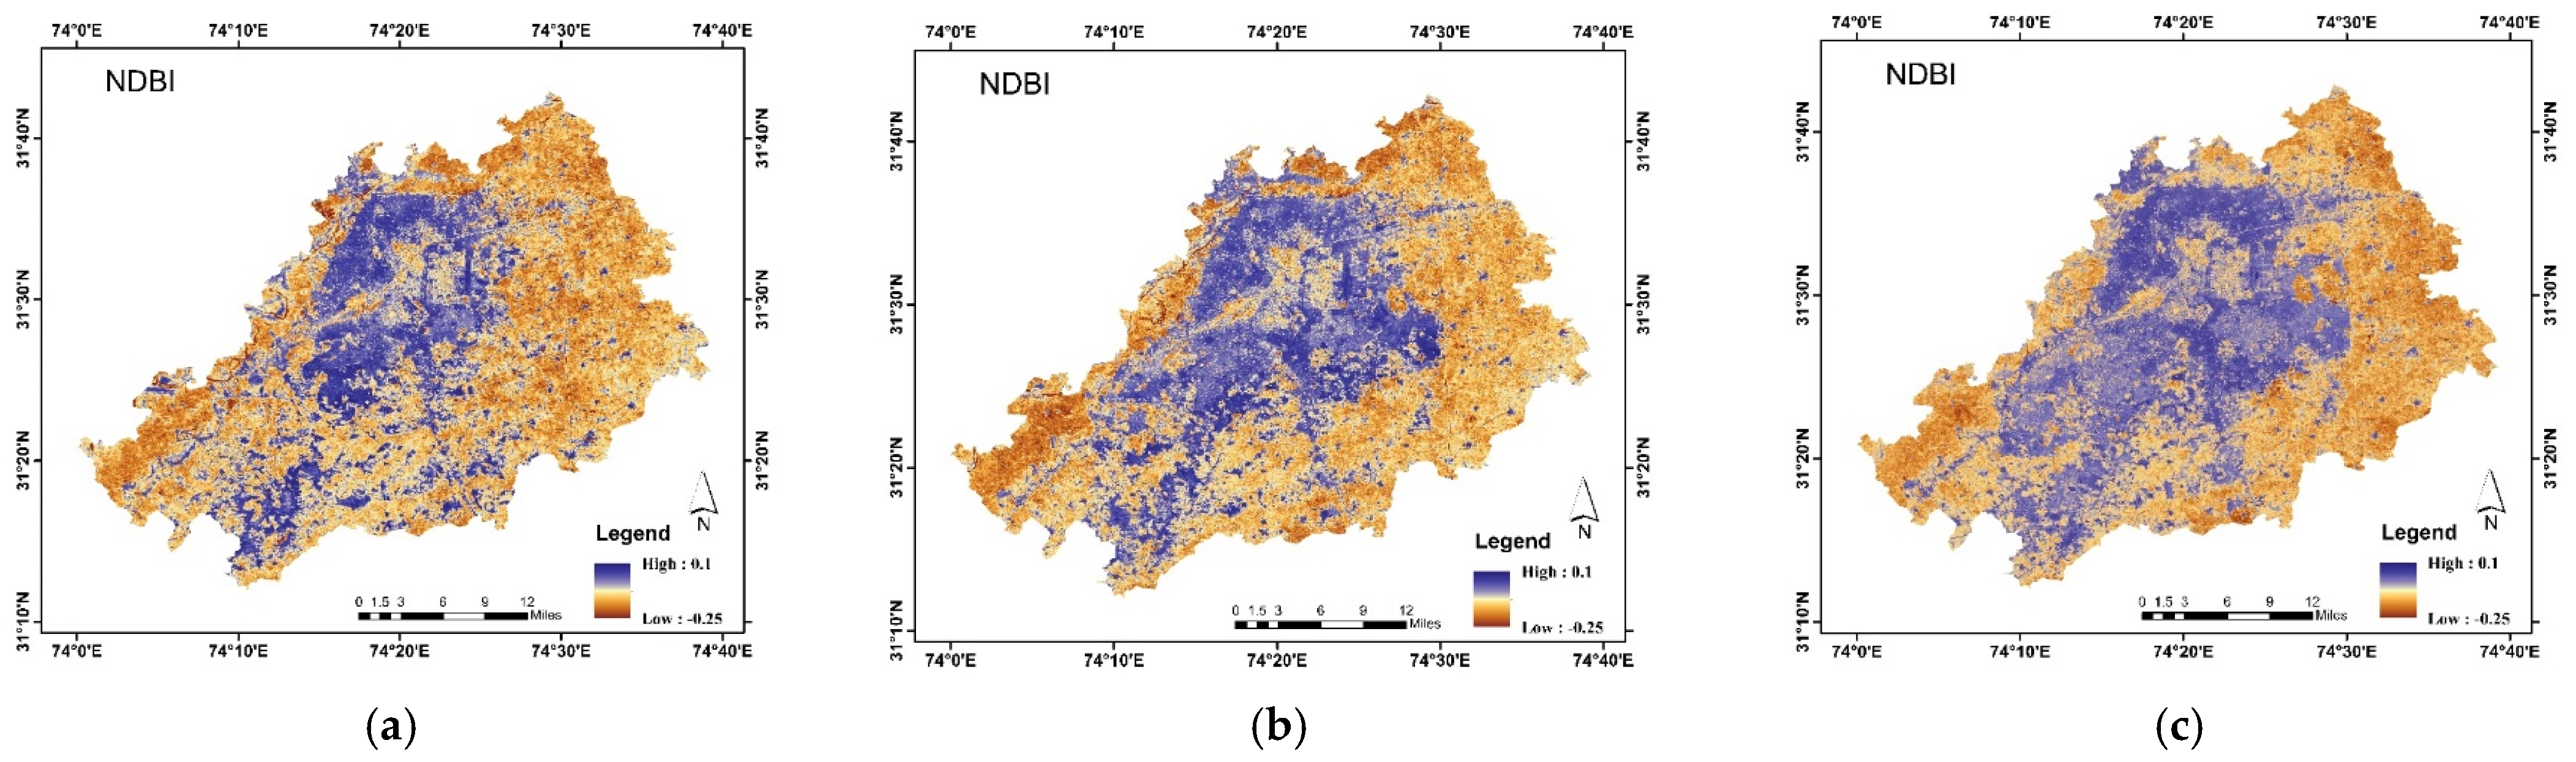
The high NDBI values were initially scattered across the decade 1993–2001, but they gradually became more uniform and widespread in 2012–2023, indicating the expansion of urbanized land. The low NDBI was predominantly observed in 1993–2001, followed by 2001–2012. Nevertheless, the decade 2013–2023 showed a greater prevalence of the NDBI and built-up areas, reflecting a shift from natural landscapes to more urbanized areas, as shown in Figure 7. This indicates that the urbanized built-up area in Lahore city is expanding. The summary of changes in land-cover dynamics and subsequent changes in the NDVI and NDBI for the city are depicted in Figure 8.
Figure 7.
Decadal NDBI image classification of Lahore: (a) 1993–2001, (b) 2001–2012, and (c) 2013–2023.
Figure 8.
(a) Decadal changes in the vegetation-cover classes (km2) derived using the NDVI-based classification and (b) subsequent variations in mean NDVI, NDBI and water bodies values in Lahore.
The values shown in Figure 3, Figure 5, Figure 6 and Figure 8 represent annual mean NDVI and NDBI values for the years 1993, 2001, 2013, and 2023 and decadal averages for the defined reference periods, 1993–2001, 2001–2012, and 2013–2023. The use of decadal averages allowed for identification of trends in vegetation and built-up area dynamics while also minimizing inter-annual variability.
3.3. Dynamics of Population Density and Growth in Lahore
Lahore has experienced significant population growth over the past few decades, according to the Lahore Bureau of Statistics (Table 4 and Table 5). The metropolitan city’s population more than doubled between 1998 and 2017. This represented the most significant population growth phase. It was followed by continued and comparatively gradual expansion during 2017 and 2013. The annual growth rate reached its highest point during the 1998–2017 period, and a subsequent moderate decline in the population growth was observed in the most recent interval of 2017–2013. These trends further represent persistent demographic pressures on the urban infrastructures and land resources of Lahore city.
Table 4.
Population size of Lahore from 1998 to 2023.
Table 5.
Annual average growth rate from 1981 to 2023.
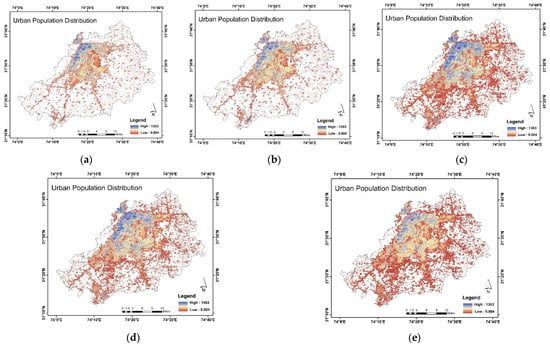
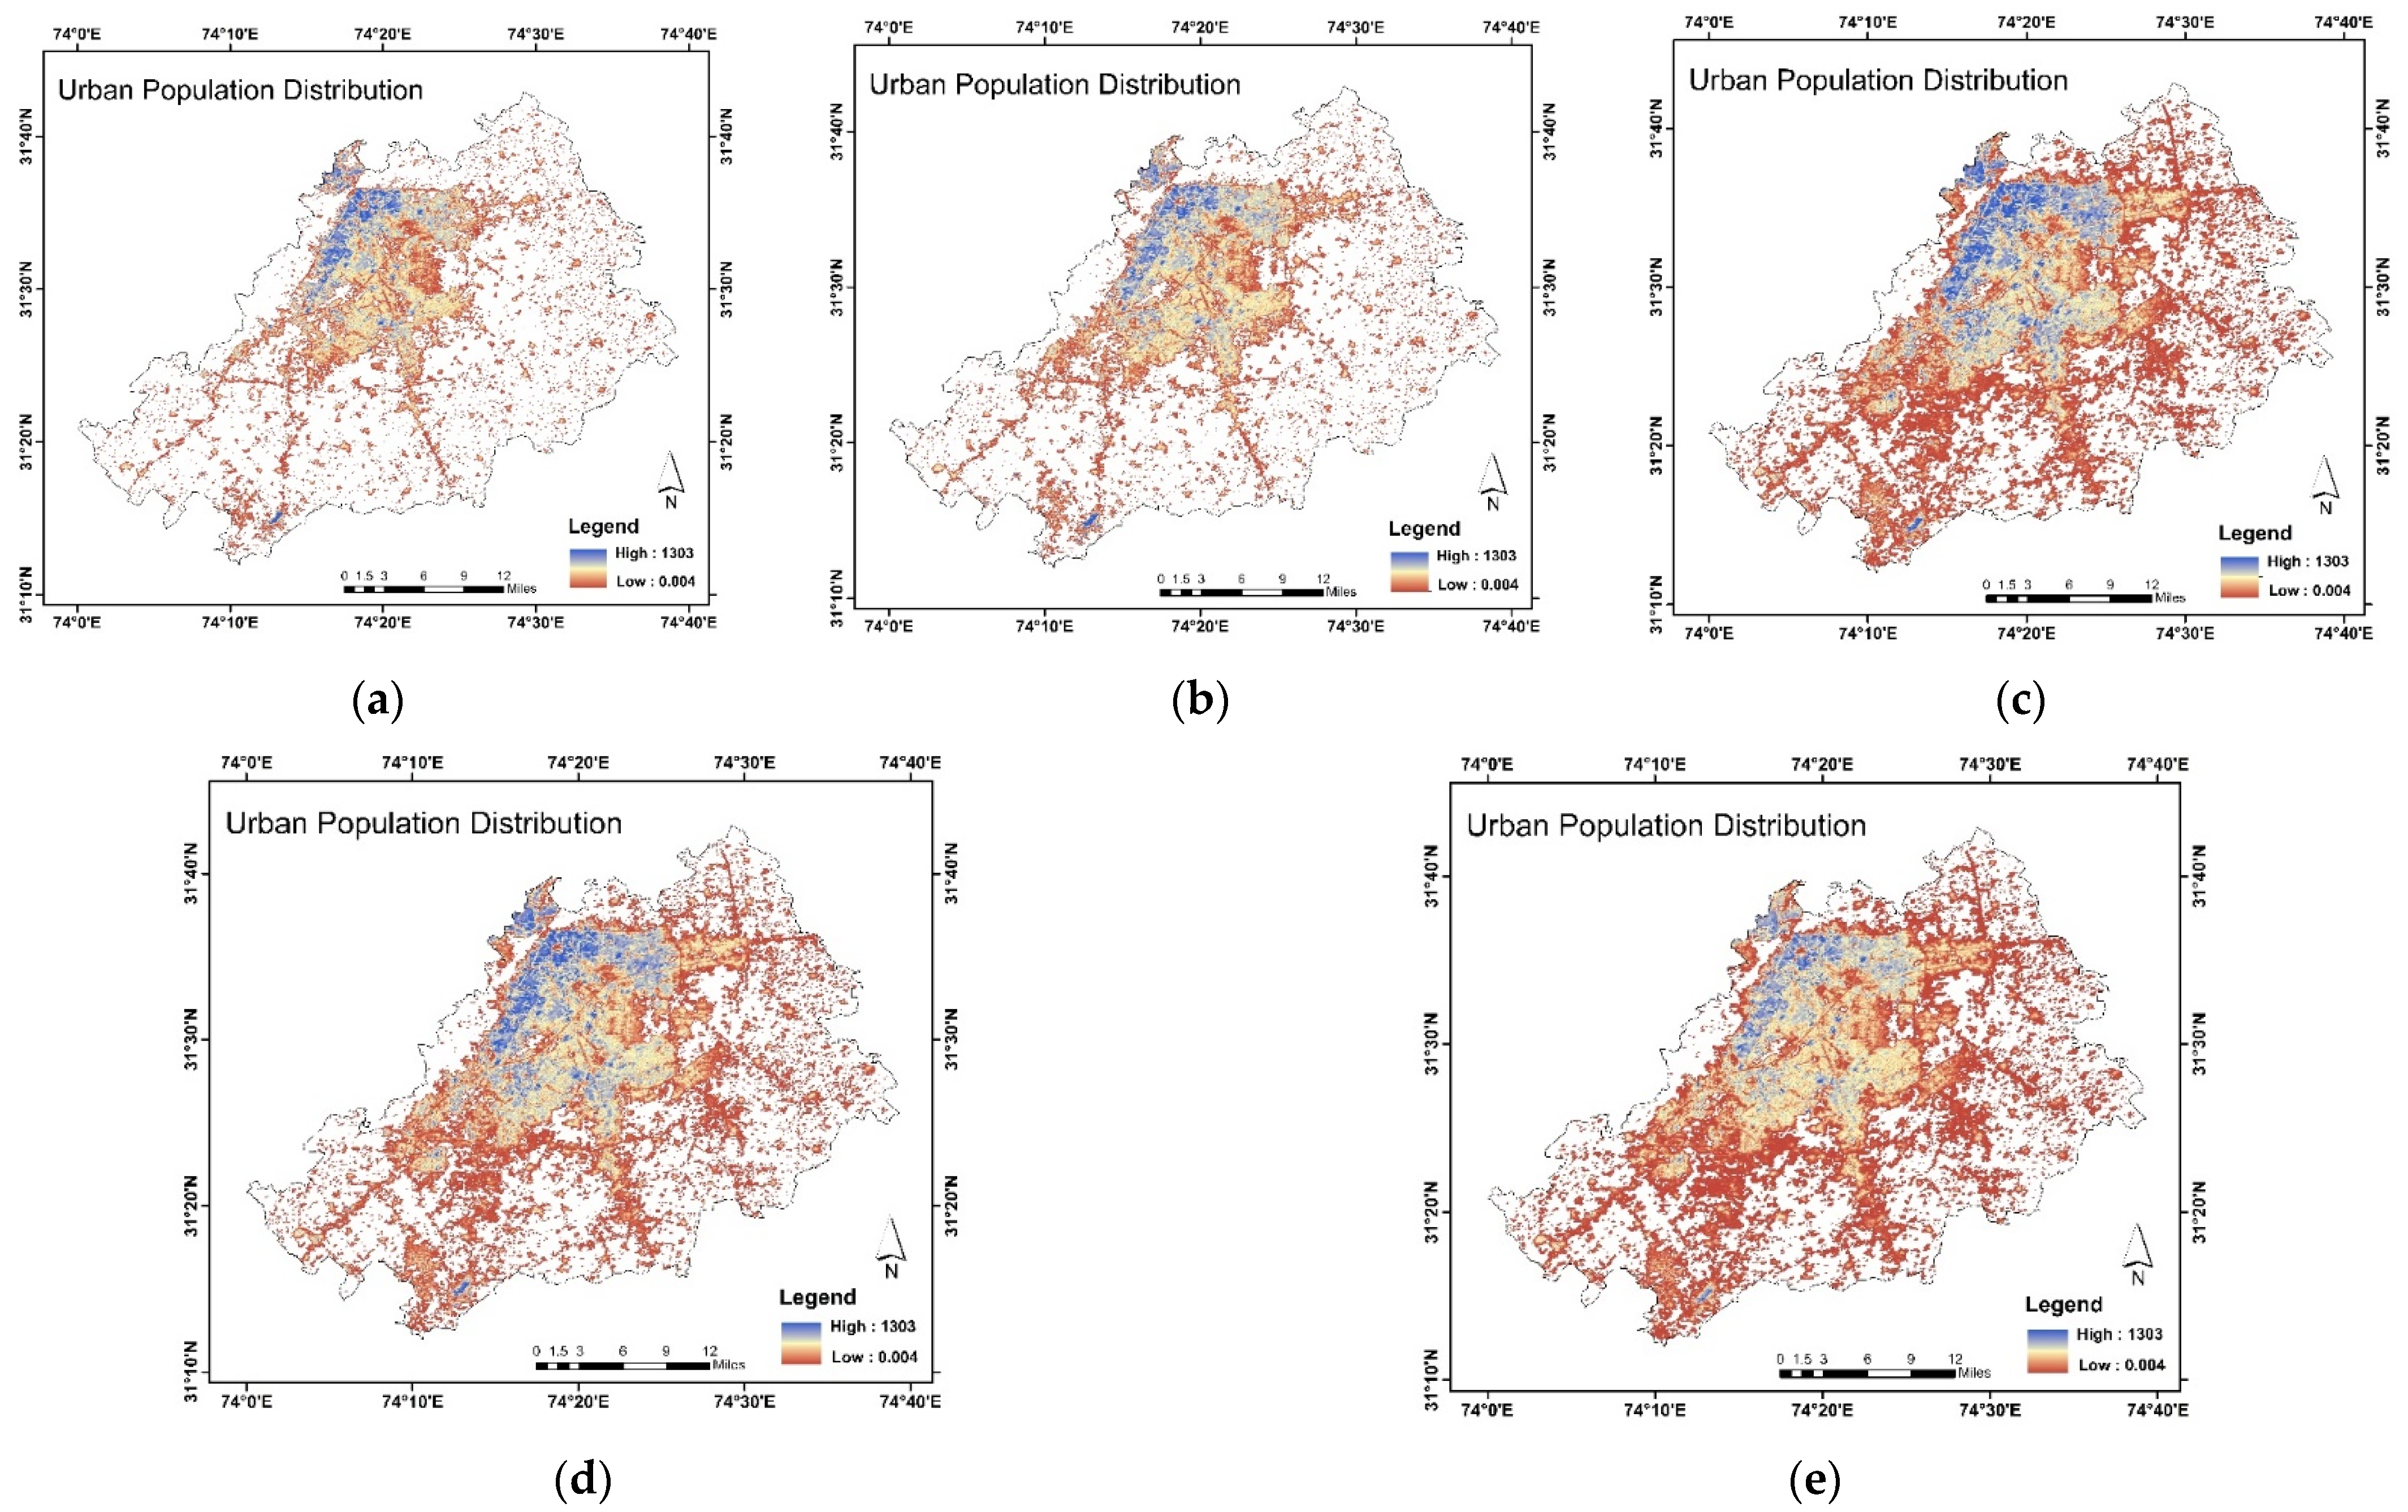
GHSL dataset analysis represented the decadal progression of urban population (persons/km2) distribution in Lahore (Figure 9). The analysis revealed that between 1990 and 2000, the built-up area in the western region of the city was inhabited, while the remaining areas exhibited a more scattered pattern. In 2010, the population density value reflected significant population expansion, resulting in a more congested pattern. A slight reduction was observed in 2020. It was further projected that by 2030, population growth will continue in Lahore. The analysis revealed a clear indication that the urbanization of Lahore has exponentially increased with rising population density.
Figure 9.
Annual urban population distribution in Lahore (persons/km2): (a) 1990, (b) 2000, (c) 2010, (d) 2020, and (e) projected 2030.
4. Discussion
4.1. Environmental Drivers of Spatial Urban Expansion in Lahore
The spatial distribution of vegetation decline and built-up area expansion in Lahore is largely related to the city’s baseline geomorphological and hydrological characteristics. The metropolitan city is situated on the alluvial Indus Plains and its geomorphological structure is defined by flat alluvial plains with minimal elevation, less variations, and largely uniform sediment composition [28]. These terrain and topographical features facilitated horizontal outward urban sprawl instead of compact vertical densification. This reduced the natural physical barriers to land-use transformations, and as a result, the urban growth predominantly occurred at the outer edges or outskirts of the city, particularly along developmental corridors towards southern and southwestern directions. These expansions occurred at the expense of agricultural fields and natural and semi-natural vegetative areas. These areas experienced significant conversions into residential housing schemes, urban utilities, transportation infrastructures, and commercial complexes as reflected by the increasing NDBI and declining NDVI patterns and trends.
The observed spatial pattern of an increase in NDBI and decrease in NDVI was, therefore, not uniform and mostly concentrated in the outskirts and the peri-urban transition zones of Lahore city, where the land suitability for new construction was relatively very high and regulatory enforcement was comparatively lenient. The proximity to major road networks, arterial roads, and the development of the Lahore Ring Road further accelerated the urban expansion. This further increased the land accessibility and real estate activity in the metropolitan area. Such corridor-based urban expansion further deteriorated and fragmented contiguous and consistent vegetative areas into smaller, isolated units, reducing the ecological connectivity and altering the urban landscape mosaic of Lahore substantially.
Other than this, the hydrological dynamics also played a crucial role in shaping the observed urban patterns. Historically, the areas specifically adjacent to the Ravi River supported riparian vegetation and cultivated and seasonal floodplain ecosystems. However, substantial changes in Ravi’s water flow regimes, water channel modifications, urban encroachments, and increased population pressures altered the ecological functions around the river [32]. The degradation and contractions of riparian vegetation observed in the findings of the current study represent intensified land conversion into built-up areas and reduced surface water availability.
Furthermore, Lahore city’s significant reliance on groundwater resources and continuous extraction gave rise to an additional environmental stressor, i.e., a declining groundwater level. Agricultural lands, UGSs, and peri-urban vegetative areas of the city are substantially dependent on groundwater resources for irrigation, which led to a decline in the groundwater levels across the metropolitan area [31]. This also explains the marked reduction in moderate vegetation classes during 2013–2023, as a decline in the soil moisture availability affected the vegetation intensity even in the areas not directly converted to built-up land.
After bringing all the topographical characteristics of the metropolitan area together, the findings indicate that vegetation decline occurred in various geographic zones, e.g., southern peri-urban areas, along the road networks and near newly constructed housing societies, rather than being evenly distributed across Lahore. The combination of flat terrain, favorable construction suitability, transport network expansion, riverine landscape modification, and groundwater depletion shaped the trajectory of urban growth over the past three decades in the city. Understanding these geographic drivers of urbanization are essential to forecast and anticipate future environmental changes and vegetation decline to design planning interventions that can respond well to the city’s physical and ecological structure.
4.2. Urban Expansion and Ecological Balance of Metropolitan Cities
One clear outcome of the temporal analysis is the rapid pace of landscape change during the 2013 to 2023 period. In earlier phases, specifically 1993 to 2001 and 2001 to 2012, changes in vegetation and built-up areas occurred gradually. In contrast, the last decade shows far more dramatic shifts, marking a move from slow urban growth to rapid expansion into peri-urban areas. The sharp decline in moderate vegetation during this time indicates increasing pressure on cultivated and semi-managed landscapes, which appear to be more vulnerable to urban conversion than areas with sparse or dense vegetation.
Built-up growth was also uneven across the study area. Instead of spreading evenly, expansion was largely concentrated in the northern, southern and southeastern tehsils, where land availability, infrastructure development, and housing projects were more extensive. This spatial concentration points to corridor-based urban growth and suggests that land transformation in Lahore follows a structured pattern rather than occurring randomly. The interaction between vegetation loss and built-up expansion reveals an uneven trend. While built-up areas increased significantly over the past three decades, dense vegetation showed only limited growth, and moderate vegetation declined sharply. This imbalance suggests that urban development has largely taken place at the expense of cultivated land and transitional green spaces.
When these patterns are viewed alongside population trends, the overlap between rapid population growth in the 2010s and intensified vegetation loss becomes clear. Although this study does not apply statistical correlation analysis, the close timing and spatial alignment of these trends strongly suggest that population pressure has been a major driver of peri-urban land conversion and land-cover change.
The results also indicated that the population of Lahore expanded exponentially from 2010 onward, following the destruction of green areas in the city. Moreover, the 2017 census also showed a drastic increase in the city’s population. Lahore’s population has been expanding at an unprecedented rate over the past two decades, with an annual growth rate of 4% [35]. Furthermore, research by [36] stated that unplanned urbanization expansion in megacities such as Lahore was the major contributor to vegetation cover decline during the period 1990 to 2000. Hence, a decrease in vegetation was observed in the metropolitan area. A study by [37] reported that urbanized land in Lahore increases by approximately 3.21% each year. A comparison over time between population growth and NDVI-based vegetation trends shows a clear inverse relationship. Lahore’s population has grown steadily from 1990 to 2023, with much faster growth after 2010, according to GHSL estimates and census data from 1998, 2017, and 2023. During this same period, areas with moderate vegetation declined noticeably, with the sharpest reduction occurring between 2013 and 2023.
The years from 2013 to 2023 mark the most intense phase of urban change and a sharp reduction in moderate vegetation cover in Lahore. During this decade, major infrastructural projects and activities took place, such as the widening of Canal Road, the construction of the Orange Line Train, requiring extensive land, and the modification of previously vegetated corridors. During the same decade, expansion of new phases of the DHA and other private housing schemes, the launch of the Ravi Riverfront Urban Development Project, and widespread commercial and residential growth accelerated the conversion of peri-urban agricultural land and transitional green spaces into built-up areas. These developments largely overlap with areas where moderate vegetation was replaced by built-up land. These changes occurred alongside a notable rise in NDBI values, pointing to a growing extent of impervious surfaces.
The close alignment in timing between population growth, increasing NDBI values, and declining vegetation suggests that rapid population increase and related urban development have been the main causes of green space loss in Lahore. Rising demand for housing, expansion of transport infrastructure, commercial projects and more intensive land use to support a growing population have together led to the fragmentation of and overall reduction in vegetation across the city. This also accelerated the transformation of vegetated and agricultural land into urban settlements. Higher population density also placed added pressure on peri-urban green spaces, contributing to the observed decline in moderate vegetation cover. These rapid developments have transformed the landscape of Lahore city, meeting the demand of the growing population.
The results indicate that much of the moderate vegetation was converted into high-density urban land cover. In addition, increased surface sealing, ongoing construction activity, and reduced soil permeability likely intensified urban heat island effects, which may have lowered vegetation health and NDVI values. This trend highlights the close relationship between infrastructure-led urban expansion and vegetation loss in fast-growing metropolitan areas. Rapid population growth increased the need for housing, transport infrastructure, and commercial facilities, leading to the continued conversion of peri-urban agricultural and vegetated land into impervious built-up surfaces. As population density increased, remaining open spaces and areas of moderate vegetation were gradually fragmented or replaced to support expanding urban functions.
The destruction of green spaces and expansion of the built-up area of Lahore in the 2001–2012 decade were driven by developmental projects. Research by [14] noted that, before the Traffic Engineering & Transport Planning Agency (TEPA) road widening project, the Lahore Canal Green Belt comprised 21,430 trees and shrubs. During this project’s implementation, about 5299 trees were removed at a height of 24 feet on both sides of the belt, indicating massive deforestation in the city. A study by [38] demonstrated that 486 housing schemes have been developed in Lahore with conventional urban planning. Moreover, the study highlighted that the DHA has developed nine phases across 158,709 hectares of open space, and 372 other schemes have occupied 265,651 hectares of land cover. These open spaces are mainly constituted of open green areas.
NDBI analysis also illustrated that the urbanization was predominantly observed on the north, south, and east sides of Lahore. The city has expanded both vertically and horizontally, with most housing societies forming on the south and east sides [39]. Research by [40] also reinforced the rationale that the green cover of Lahore decreased to 75% between 2007 and 2015 due to unplanned urban expansion. An analysis by [41] stated that housing schemes primarily focus on increasing the saleable area, whereas the least focus is on green cover. Research by [42] noted that these societies expanded the city’s population by offering improved settlement options, while reducing the previous vegetative cover and open green spaces in Lahore city.
The land-cover changes observed over the three decades indicate a substantial expansion of urban complexes at the expense of green land, highlighting the complex, inverse relationship between rising population density, urban expansion, and the deterioration of green spaces. A study by [17] also discussed the relationship between urban green space and population and built-up area expansion. A notable trend was observed among them: as the population and built-up complexes increase, green spaces tend to decrease exponentially, illustrating an inverse relationship between the two. This association is vital for understanding urban growth patterns and for efficient, sustainable urban planning and development, as it captures the effects on green areas, infrastructure, and the urban environment. This trend was mirrored in a study by [43], which highlighted that both built-up areas and population expansion not only decrease green cover but also reduce the number of water bodies present in metropolitan areas. This also aligns with the findings of [44], who stated that urban sprawl has a destructive impact on natural environments. These findings were consistent with a study by [45], which underscores the importance of strategic urban development for the conservation of green areas. Research by [46] indicated that factors such as industrial development, job opportunities, and a better lifestyle not only influence people to migrate from rural areas to urban areas but also contribute to urban sprawl and the expansion of the real estate industry. By providing urban facilities to smaller towns and rural areas, this issue of migration can be addressed, but it requires significant government support and development plans.
However, it is widely believed that Lahore is anthropogenically modified and lacks extensive forest cover, and qualitative degradation of vegetation cover of the city is linked to peri-urban developments, agricultural land fragmentation, rapid real estate growth, completion of road networks, and increased land-use pressure associated with transportation-driven urban growth. It is also important to recognize the methodological limitations inherent to NDVI-based classifications. The NDVI provides a comprehensive and widely accepted indicator of vegetation density and canopy intensity, but it does not differentiate species composition, structural diversities or ecological integrity. Hence, the present study offers a holistic quantitative assessment of long-term changes in vegetation density dynamics. Furthermore, studies integrating high-resolution remote sensing, object-based classifications, and field-based geobotanical surveys would enable more detailed evolutions of vegetation quality and ecosystem service implications in Lahore city.
4.3. Policies and Strategic Framework for Sustainable City Development
The development of Lahore is managed by several federal, provincial, and local agencies, which affect infrastructure development and the maintenance of newly developed spaces. The administration of Lahore development is under the authority of the LDA, Lahore Cantonment Board (LCB), Metropolitan Corporation Lahore (MCL), and Defense Housing Society (DHA). Cooperative Housing Societies (CHSs) and private establishments are included in the infrastructure development. A study by [47] emphasized that government support is the primary factor in preserving existing green spaces and planning for future expansion. Urban planners are actively seeking to rectify the previous trend of urban expansion and include green cover throughout.
With an increase in built-up areas, some significant expansion of vegetation in Lahore city from 2013 to 2023 was also observed due to governmental support from authorities like the Parks and Horticulture Authority (PHA) and LDA, as well as the growth of planned housing societies to combat the declining green cover of the city. The PHA is accountable for the preservation, expansion, and improvement of green spaces in Lahore. It plays a significant role in enhancing esthetic beauty and promoting environmental sustainability in metropolitan areas [48]. The Gazetteer of Lahore 2022 [14] highlighted that the PHA had cultivated more than 1.3 million trees and distributed more than 90,000 free samplings of these trees in the years 2019–2021. Moreover, the PHA also planted about 58,000 trees in Gulshan-e-Iqbal Park, 58,000 in an open area in Township, and 13,500 in Township Nursery.
Approximately 40,000 trees were planted in Bela Forest and along the Canal Road Green Belt under the Ten Billion Tree Tsunami program [14,49], while the Master Plan of Lahore 2050 aims to protect agricultural and ecological land of the city. It further commits to controlling urban sprawl and enhancing environmental health and public well-being by allocating 33,000 acres of land for green cover, 27,000 acres for agricultural activities in Kala Shah Kaku and Muridke and 6000 acres around Lahore Canal Road [50]. Another policy measure, the Punjab Private Housing Scheme Rules, mandates the allocation of 7% of the area to green cover in new housing societies [51], while the Affordable Colony Policy 2028 requires 20% to be organized vegetative land [52]. In addition to this, the LDA authorized 16 housing schemes for plantation drives and planted 126,852 trees in 2023 in the areas of the PCSIR Employees-II Housing society, Judicial Colony, Valencia Town, Lake City, and Sukh Chain Society [53]. However, the overall expanded green cover remains sparse, with some prominent private schemes like Bahria Town and the DHA operating under separate management rules, allocating more land to green spaces. The DHA mandated that more land be turned into green cover in its newer phases (6–9), where there is more land allocated for green belts, house lawns, and parks compared to its old phases (1–4) [38]. Subsequently, recent developments dominated by the presence of residential lawns, designated green belts, and community parks have contributed to a gradual growth in the urban green cover of Lahore.
4.4. Environmental Justice: Combating Disparity Among Tehsils
The tehsil-wise NDVI and NDBI analyses reveal an uneven distribution of green areas across the five tehsils of Lahore, which further aggravates the concerns of environmental justice, with Lahore city, Raiwind, and Model Town characterized by prevalent built-up areas, while Lahore Cantt retains more vegetative land comparatively. The Government of Punjab mandated 7% of land allocation for green areas in new housing societies [51], and some societies like the DHA, Bahria Town, and Lake City incorporated residential lawns, parks, open spaces, golf courses, and green belts in their developmental plans [18]. However, per capita green space remains inadequate in most tehsils of Lahore. Studies show insufficient green cover in Shadara Town [19] and extremely low per capita vegetative area in densely populated areas, including Railway Colony (0.01 m2), Bibi Pak Daman (0.01 m2), Gari Shahu (0.12 m2), Makkah Colony (0.03 m2), and Daras Barey Mian (0.01 m2) [18]. This fails to meet WHO standards for per capita green space allocations and equitable distribution of green areas in urban planning [17]. To address this disparity, green areas must be systematically integrated into both existing and new developments [54] and include mandates of establishing roadside green belts [55], promoting rooftop gardening in dense metropolitan areas like Lahore [56] and thus promoting community involvement in green space management [57].
4.5. The Role of Planned Real Estate Development for Sustainable Metropolis Progress
Some tehsils, such as Cantt, have shown more green cover than built-up areas, mainly due to institutional control and well-regulated planning policies under the military administration. The Cantonment Board ensures the stringent enforcement of zoning laws, limits excessive commercial development, and protects green spaces, resulting in a low-density environment. It has extensive tree-lined roads, community parks, and green belts across the tehsil. Cantt has also maintained a well-planned land-use design, prioritizing green space and open areas for esthetic, environmental, and strategic purposes, unlike other rapidly urbanizing areas of Lahore, supporting significantly higher levels of vegetation, thereby contributing to several ecological benefits. A study by [58] supported this argument, suggesting that the Lahore Cantonment Board enforced more efficient regulations mandating open and green spaces to safeguard the esthetics and environmental performance of the society.
Planned real estate developments contributed to urban sustainability and resilience by integrating mandated green space areas and organized planning, as required by the LDA. This made it easier for the developers to prioritize urban environmental sustainability and improve the well-being of the inhabitants of the city. For instance, Bahria Town features extensive green belts, theme parks, and golf courses [59], while another housing estate, Park Avenue, allocated 25% of its land to green space and reported making the largest private Miyawaki forest in the city [60]. Studies further indicate that housing developments with larger green areas are often more expensive and considered luxurious [61]. Similar findings from a gated community in Cairo showed that allocating more green spaces enhances urban sustainability but also raises the affordability concerns for the inhabitants [62]. Emphasizing urban green space developments is, therefore, considered necessary for attracting the majority of consumers and further enhancing the real estate market [63].
4.6. Urban Transformation of Lahore and the Sustainable Development Goals SDGs
Expansion in urban land and subsequent vegetation losses directly intersect with the framework of the Sustainable Development Goals (SDGs) established by the United Nations [64]. SDG 11 (Sustainable Cities and Communities) emphasizes the need for safe, resilient, inclusive, and sustainable cities, including public access to green spaces. This goal also stresses the reduced environmental impact of urban areas with green spaces and further states that rapid urbanization without adequate green spaces challenges the stated goal, predominantly in the rapidly growing cities of South Asia. In addition, SDG 13 (Climate Action) highlights the importance of climate action, including the carbon sequestering capacity of the urban centers through vegetation preservation and mitigation of urban heat island impacts. This strongly emphasizes that the observed decline in the vegetated area of Lahore underscores increased vulnerability to climate stressors. SDG 15 (Life on Land) reinforces the importance of preventing land degradation and protecting terrestrial ecosystems [65]. The conversion of the peri-urban vegetated areas of Lahore into built-up land draws attention towards ongoing land degradation trends that may undermine the ecological resilience of the city. This study contributes to monitoring the progress of relevant SDGs by providing spatially clear annual and multi-decadal evidence and further supports the formulation of an empirically sound urban policy for Lahore.
Many recent studies have increasingly indicated the importance of integrating SDGs into urban development policies, frameworks and sustainability assessments of fast-growing metropolitan cities. Global indicator-based assessments affirm the necessity of incorporating systematic monitoring and well-managed governance to track SDG progress throughout metropolitan cities, countries, and regions [66]. At the urban level, a study by [67] reinforces the significance of knowledge-based and participatory approaches as crucial mechanisms for aligning urban development with SDG targets, specifically SDG 11. Additionally, advances in analytical technologies and environmental monitoring highlight the contribution of innovative tools by enhancing environmental control systems and resource management, indicating the importance of sustainability objectives [68]. These studies collectively reflect a growing emphasis on integrating SDG-centered approaches into the policy and planning of urban centers. In this regard, the current study promotes sustainable urban practices by providing clear spatial evidence of land transformation to strengthen urban governance within the SDG framework.
4.7. Practical Implications of the Study
The study provides practical recommendations for promoting urban resilience and environmental sustainability in Lahore city. The findings further confirm that the unplanned urban sprawl and population growth have excessively contributed to vegetation losses, air pollution, urban heat island effects, and reduced ecological balance. The spatial analysis of the study highlights disparities in green cover distribution throughout the five tehsils of Lahore and identifies high-risk zones where targeted government interventions are required and stringent planning controls are needed. The GIS-based findings support evidence-based urban planning by identifying areas where restoration of green cover and preservation of vegetation are most crucial. The results further emphasize the urgency to integrate structured green infrastructure into future development policies by the LDA and private housing societies to ensure equitable and sustainable urban growth. It is also important to note that the administrative shapefile used for spatial analysis was acquired from Urban Unit, Lahore, which defined the jurisdictional extent of the study.
5. Conclusions
Urban green cover is the foundation of a sustainable, resilient metropolitan area. The analysis of vegetation, built-up areas, and population expansion has demonstrated the impacts of urban expansion in Lahore. NDVI analysis indicated that the green cover of Lahore has diminished significantly in the past few decades. The NDBI results, combined with GHSL dataset analysis, revealed population growth in the metropolitan area. The results further provide evidence-based findings that support SDGs 11, 13, and 15 by identifying the patterns of urban sprawl of Lahore, its vegetation decline, and spatial inequalities between the distribution of green areas at its district and sub-district levels. By quantifying the population-driven peri-urban transformation of Lahore city, the research offers a practical perspective for sustainable urban governance, ecological conservation strategies, and climate-resilient planning. Integration of geospatial monitoring into policy frameworks can further enhance the progress towards resilient and sustainable urban futures. The study highlights the necessity of planned urban expansion. Moreover, it advocates the inclusion of green cover, such as green belts, urban forests, parks, and rooftop gardening, in infrastructure development. It emphasizes the preservation of existing Urban Green Spaces (UGSs) and their inclusion in all new developmental projects in Lahore.
Author Contributions
Conceptualization, B.A. and F.S.; methodology, B.A. and M.S.; software, B.A. and A.M.; validation, F.S., A.D.R. and A.-S.N.; formal analysis, M.S. and A.-S.N.; investigation, F.S. and A.D.R.; resources, A.D.R. and F.S.; data curation, F.S.; writing—original draft preparation, B.A. and M.S.; writing—review and editing, F.S. and A.-S.N.; visualization, A.D.R.; supervision, F.S. and A.-S.N.; project administration, B.A. and F.S.; funding acquisition, B.A. and F.S. All authors have read and agreed to the published version of the manuscript.
Funding
This study was carried out with the funding and support of the Office of Research, Innovation and Commercialization (ORIC) at Government College University, Lahore (GCUL). The authors are thankful to Government College Lahore (GCUL) for providing financial support to carry out this research, vide letter NOs. 676/ORIC/22 and 102/ORIC/12.
Institutional Review Board Statement
Not applicable.
Informed Consent Statement
Not applicable.
Data Availability Statement
All data generated or analyzed during this study are included in this published article.
Conflicts of Interest
This work has no ethical issues in any regard. Also, the manuscript is neither under review nor published elsewhere. The authors have no relevant financial or non-financial interests to disclose.
Abbreviations
The following abbreviations are used in this manuscript:
| NDVI | Normalized Difference Vegetation Index |
| NDBI | Normalized Difference Built-up Index |
| GEE | Google Earth Engine |
| LDA | Lahore Development Authority |
References
- Mishra, H. Environmental degradation and impacts on agricultural production: A challenge to urban sustainability. In Sustainable Urban Environment and Waste Management: Theory and Practice; Springer Nature: Singapore, 2025; pp. 53–92. [Google Scholar]
- Ogujiuba, K.; Maponya, L.; Stiegler, N. Determinants of human development index in South Africa: A comparative analysis of different time periods. World 2024, 5, 527–550. [Google Scholar] [CrossRef] [Scilit]
- World Resources Institute (WRI). Forest Loss: Global Forest Review. 2023. Available online: https://research.wri.org/gfr/forest-extent-indicators/forest-loss (accessed on 20 October 2025).
- Gerow, A.; Kathambi, V.; Locke, D.; Ashton, M.; Brodersen, C. Street Tree Communities Reflect Socioeconomic Inequalities and Legacy Effects of Colonial Planning in Nairobi, Kenya. Urban For. Urban Green. 2024, 101, 128530. [Google Scholar] [CrossRef] [Scilit]
- The Daily Star. Dhaka Losing Its Greenery. 25 July 2022. Available online: https://www.thedailystar.net/news/bangladesh/news/dhaka-losing-its-greenery-3077001 (accessed on 16 July 2025).
- Asian Development Bank. Pakistan National Urban Assessment 2024; Asian Development Bank: Manila, Philippines, 2023; Available online: https://www.adb.org/sites/default/files/institutional-document/988626/pakistan-national-urban-assessment.pdf (accessed on 15 July 2025).
- Karim, S.; Chen, Y.; Kayumba, P.M.; Ahmad, I.; Iqbal, H. Comprehensive geospatial analysis of urban expansion dynamics in Lahore, Pakistan (1998–2023). J. Urban Manag. 2024, 14, 577–589. [Google Scholar] [CrossRef] [Scilit]
- Macrotrends. Lahore Population 1950–2024. 2025. Available online: https://www.macrotrends.net/global-metrics/cities/22046/lahore/population (accessed on 9 February 2025).
- The Urban Unit. Emission Inventory of Lahore 2023; The Urban Unit: Lahore, Pakistan, 2023. Available online: https://urbanunit.gov.pk/Download/publications/Files/8/2023/Emission%20Inventory%20of%20Lahore%202023.pdf (accessed on 20 February 2025).
- Rehman, A.U.; Aziz, A.; Anwar, M.M.; Majeed, M.; Albanai, J.A.; Almohamad, H.; Abdo, H.G. Quantifying the impacts of urbanization on urban green: Evidence from Maga City, Lahore, Pakistan. Discov. Sustain. 2023, 4, 48. [Google Scholar] [CrossRef] [Scilit]
- Wescoat, J.L., Jr. The paradise gardens of Lahore: Islamic ideals and historical realities. In Religion and Sustainability: Interreligious Resources, Interdisciplinary Responses; Springer International Publishing: Cham, Switzerland, 2022; pp. 273–288. [Google Scholar]
- Nadiem, I.H. Gardens of Mughal Lahore; Sang-e-Meel Publications: Lahore, Pakistan, 2005. [Google Scholar]
- Shoaib, A.; Islam, H.S. Urban sustainability and green spaces: A comprehensive analysis of spatiotemporal variations and residents’ perspective in Lahore, Pakistan. J. Geovisualization Spat. Anal. 2024, 8, 28. [Google Scholar] [CrossRef] [Scilit]
- Sultan, A.; Zubair, S. Gazetteer of the Lahore District 2022; Sang-e-Meel Publications: Lahore, Pakistan, 2022. [Google Scholar]
- Mumtaz, M. Green infrastructure as key tool for climate adaptation planning and policies to mitigate climate change: Evidence from a Pakistani city. Urban Clim. 2024, 56, 102074. [Google Scholar] [CrossRef] [Scilit]
- European Environment Agency. Who Benefits from Nature in Cities? Social Inequalities in Access to Urban Green and Blue Spaces Across Europe. 2021. Available online: https://www.eea.europa.eu/publications/who-benefits-from-nature-in (accessed on 30 December 2024).
- Azhar, R.; Javed, M.A.; Minallah, M.N.; Machado, S.; Jabbar, M. Urban transformation in Lahore: Three decades of land cover changes, green space decline, and sustainable development challenges. Geogr. Environ. Sustain. 2024, 17, 6–17. [Google Scholar] [CrossRef] [Scilit]
- Alam, R.; Shirazi, S.A.; Bhalli, M.N.; Zia, S. Spatial distribution of urban green spaces in Lahore, Pakistan: A case study of Gulberg Town. Pak. J. Sci. 2014, 66, 277–286. [Google Scholar]
- Anwar, M.M.; Hashim, M.; Aziz, A.; Stocco, A.; Abdo, H.G.; Almohamad, H.; Al-Mutiry, M. Urban green spaces distribution and disparities in congested populated areas: A Geographical Assessment from Pakistan. Sustainability 2023, 15, 8059. [Google Scholar] [CrossRef] [Scilit]
- Shoaib, A.; Nadeem, K.; Islam, H.S.; Saleemi, A. Assessing spatial distribution and residents’ satisfaction for urban green spaces in Lahore city, Pakistan. GeoJournal 2022, 87, 4975–4990. [Google Scholar]
- Hallett, R.A.; Piana, M.R.; Johnson, M.L.; Brandt, L.A. Climate change and urban forests. In Future Forests; Elsevier: Amsterdam, The Netherlands, 2024; pp. 243–264. [Google Scholar]
- Tesfaye, W.; Elias, E.; Warkineh, B.; Tekalign, M.; Abebe, G. Modelling of land use and land cover changes using Google Earth Engine and machine learning approach: Implications for Landscape Management. Environ. Syst. Res. 2024, 13, 31. [Google Scholar] [CrossRef] [Scilit]
- Zhao, Z.; Islam, F.; Waseem, L.A.; Tariq, A.; Nawaz, M.; Islam, I.U.; Hatamleh, W.A. Comparison of three machine learning algorithms using Google Earth Engine for land use land cover classification. Rangel. Ecol. Manag. 2024, 92, 129–137. [Google Scholar] [CrossRef] [Scilit]
- Banerjee, A.; Ariz, D.; Turyasingura, B.; Pathak, S.; Sajjad, W.; Yadav, N.; Kirsten, K.L. Long-term climate change and anthropogenic activities together with regional water resources and agricultural productivity in Uganda using Google Earth Engine. Phys. Chem. Earth 2024, 134, 103545. [Google Scholar] [CrossRef] [Scilit]
- Li, P.; Li, H.; Si, B.; Zhou, T.; Zhang, C.; Li, M. Mapping planted forest age using LandTrendr algorithm and Landsat 5–8 on the Loess Plateau, China. Agric. For. Meteorol. 2024, 344, 109795. [Google Scholar]
- Reddy, S.L.K.; Rao, C.V.; Kumar, P.R. Road feature extraction from Landsat-8 Operational Land Imager images using simplified U-Net model. Int. J. Electr. Comput. Eng. 2025, 15, 328–336. [Google Scholar] [CrossRef] [Scilit]
- Pande, C.B.; Egbueri, J.C.; Costache, R.; Sidek, L.M.; Wang, Q.; Alshehri, F.; Pal, S.C. Predictive modelling of land surface temperature (LST) based on Landsat-8 satellite data and machine learning models for sustainable development. J. Clean. Prod. 2024, 444, 141035. [Google Scholar] [CrossRef] [Scilit]
- Naseer, A. MATLAB/Simulink-based instantaneous solar radiation modelling, validation and performance analysis of fixed and tracking surfaces for the climatic conditions of Lahore city, Pakistan. Int. J. Renew. Energy Dev. 2022, 11, 608. [Google Scholar]
- Shah, S.I.H.; Ahmed, A.; Nawaz, R. Analysis of Land use Change and Population Growth Using Geospatial Techniques in Lahore, Pakistan. Pak. J. Sci. 2021, 2, 490. [Google Scholar]
- Talbot, I.; Kamran, T. Colonial Lahore: A History of the City and Beyond; Oxford University Press: Oxford, UK, 2022. [Google Scholar]
- Waheed, H.; Naz, S. Socio-cultural aspects of identity formation of Lahore city. Ann. Hum. Soc. Sci. 2023, 4, 1–12. [Google Scholar] [CrossRef] [Scilit]
- Ahmed, Z.; Yasir, A. Restoring cultural heritage: Inner cities of Lahore. Winter J. IMWI Stud. Res. J. 2024, 5, 98–109. [Google Scholar] [CrossRef] [Scilit]
- Idrees, M.O.; Omar, D.M.; Babalola, A.; Ahmadu, H.A.; Yusuf, A.; Lawal, F.O. Urban land use land cover mapping in tropical savannah using Landsat-8 derived normalized difference vegetation index (NDVI) threshold. S. Afr. J. Geomat. 2022, 11, 100. [Google Scholar] [CrossRef] [Scilit]
- Imran, M.; Qalb, A.M. Analysis and mapping of present and future drivers of local urban climate using remote sensing: A case of Lahore, Pakistan. S. Afr. J. Geomat. 2020, 9, 100–114. [Google Scholar] [CrossRef] [Scilit]
- Worldometer. Pakistan Population Live. 2021. Available online: https://www.worldometers.info/world-population/pakistan-population/ (accessed on 27 July 2025).
- Jabbar, M.; Yusoff, M. Assessing and modelling the role of urban green spaces for human well-being in Lahore (Pakistan). Geocarto Int. 2022, 37, 14379–14398. [Google Scholar] [CrossRef] [Scilit]
- Arshad, S.; Ahmad, S.R.; Abbas, S.; Asharf, A.; Siddiqui, N.A.; ul Islam, Z. Quantifying the contribution of diminishing green spaces and urban sprawl to urban heat island effect in a rapidly urbanizing metropolitan city of Pakistan. Land Use Policy 2022, 113, 105874. [Google Scholar] [CrossRef] [Scilit]
- Abbas, M.; Wakil, I. Exploring and analyzing the drivers of urban sprawl in Pakistan: A case study of Lahore. In Proceedings of the 3rd RASTA Conference, Islamabad, Pakistan, 14–15 September 2023; Research for Social Transformation and Advancement (RASTA): Islamabad, Pakistan, 2023; pp. 1–63. [Google Scholar]
- Union Developers. Top Housing Societies in Lahore for Investment in 2025. 2025. Available online: https://www.uniondevelopers.com/blog/top-housing-societies-in-lahore/ (accessed on 16 May 2025).
- Ghani, A. Lahore is Losing Its Green Cover–Fast. MIT Technology Review Pakistan. 2018. Available online: http://www.technologyreview.pk/lahoreis-losing-its-green-cover-fast/ (accessed on 15 June 2025).
- Fruth, E.; Kvistad, M.; Marshall, J.; Pfeifer, L.; Rau, L.; Sagebiel, J.; Soto, D.; Tarpey, J.; Weir, J.; Winiarski, B.J. Economic valuation of street-level urban greening: A case study from an evolving mixed-use area in Berlin. Land Use Policy 2019, 89, 104237. [Google Scholar] [CrossRef] [Scilit]
- Colding, J.; Gren, Å.; Barthel, S. The incremental demise of urban green spaces. Land 2020, 9, 162. [Google Scholar] [CrossRef] [Scilit]
- Sattar, T.; Mirza, N.F.; Javed, M.A.; Nasar-u-Minallah, M.; Malik, S. Changing pattern of urban landscape and its impact on thermal environment of Lahore: Implications for climate change and sustainable development. Environ. Monit. Assess. 2025, 197, 151. [Google Scholar] [CrossRef] [Scilit]
- Duan, J.; Wang, Y.; Fan, C.; Xia, B.; de Groot, R. Perception of urban environmental risks and the effects of urban green infrastructures (UGIs) on human well-being in four public green spaces of Guangzhou, China. Environ. Manag. 2018, 62, 500–517. [Google Scholar] [CrossRef] [Scilit]
- Aboulnaga, M.; Mostafa, M. Climate change adaptation: Prioritising districts for urban green coverage to mitigate high temperatures and UHIE in developing countries. In Renewable Energy and Sustainable Buildings: Selected Papers from the World Renewable Energy Congress WREC 2018; Springer International Publishing: Cham, Switzerland, 2020; pp. 825–837. [Google Scholar]
- Ahmed, S.; Huifang, W.; Akhtar, S.; Imran, S.; Hassan, G.; Wang, C. An analysis of urban sprawl in Pakistan: Consequences, challenges, and the way forward. Int. J. Agric. Ext. 2021, 8, 257–278. [Google Scholar] [CrossRef] [Scilit]
- Ngome, C.S.; Yeom, C. Charting sustainable paths: Balancing urban green dilemmas in East Africa. Asia-Pac. J. Converg. Res. Exch. 2024, 10, 283–301. [Google Scholar] [CrossRef] [Scilit]
- Rehman, Z.; Zubair, M.; Hafiz, D.O.; Manzoor, S.A. Biodiversity and quality of urban green landscape affect mental restorativeness of residents in Multan, Pakistan. Front. Sustain. Cities 2024, 5, 1286125. [Google Scholar] [CrossRef] [Scilit]
- Ashraf, U. Participation and Exclusion in Mega Tree-Planting Projects: A Case Study of the Ten Billion Tree Tsunami Programme, Pakistan; International Institute for Environment and Development: London, UK, 2022. [Google Scholar]
- Nadeem, M.; Aziz, A.; Al-Rashid, M.A.; Tesoriere, G.; Asim, M.; Campisi, T. Scaling the potential of compact city development: The case of Lahore, Pakistan. Sustainability 2021, 13, 5257. [Google Scholar] [CrossRef] [Scilit]
- Government of Punjab. Punjab Private Housing Schemes Rules 2022; Housing, Urban Development & Public Health Engineering Department: Punjab, Pakistan, 2022; Available online: https://www.scribd.com/document/809276706/Punjab-Private-Housing-Schemes-Rules-2022-PDF (accessed on 15 May 2025).
- Government of Punjab. Affordable Colony Policy 2018; Department of Housing and Urban Development: Punjab, Pakistan, 2018. Available online: https://puda.punjab.gov.in/sites/default/files/Affordable-Colony-2018.pdf (accessed on 15 May 2025).
- Lahore Development Authority (LDA). Trees Planted from May 2023 to till. 2023. Available online: https://lda.gop.pk/website/images/plantation_drive_by_LDA.pdf (accessed on 20 May 2025).
- Mostafa, A.M.; Alshahrani, A. Humanizing sustainable development through green spaces: A case study of Saudi cities. Front. Sustain. Cities 2024, 6, 1416983. [Google Scholar] [CrossRef] [Scilit]
- Zhou, L.; Gong, Y.; López-Carr, D.; Huang, C. A critical role of the capital green belt in constraining urban sprawl and its fragmentation measurement. Land Use Policy 2024, 141, 107148. [Google Scholar] [CrossRef] [Scilit]
- Dey, C.; Monica, V.; Gurpur, A.K.; Venugopal, S.; Lavanya, M.; Samudrala, S.C.C.; Raja, A.; Haris, J. Review of Terrace Gardening Literature and Suggestions for Increasing Adoption; IGI Global: Hershey, PA, USA, 2024; pp. 234–247. [Google Scholar] [CrossRef] [Scilit]
- Likongwe, P.; Chimaimba, F.B.; Chiotha, S.; Mandevu, T.; Kamuyango, L.; Garekae, H. Urban community power: Enhancing urban forest diversity and reversing ecosystem disservices in Zomba City, Malawi. Land 2021, 10, 1258. [Google Scholar] [CrossRef] [Scilit]
- Asim, M.; Gulzar, S.; Ali, M.M.; Shirwani, R.K. Study on impediments and success of building byelaws implementation in Lahore. Pak. J. Res. Archit. Plan. 2017, 22, 34–42. [Google Scholar] [CrossRef] [Scilit]
- UPN. Bahria Town Lahore. 8 April 2023. Available online: https://www.ourupn.com/bahria-town-lahore/ (accessed on 14 February 2025).
- Park Avenue Lahore. Park Avenue Lahore. Available online: https://parkavenuelahore.com/ (accessed on 14 February 2025).
- Łaszkiewicz, E.; Czembrowski, P.; Kronenberg, J. Can proximity to urban green spaces be considered a luxury? Classifying a non-tradable good with the use of hedonic pricing method. Ecol. Econ. 2019, 161, 237–247. [Google Scholar] [CrossRef] [Scilit]
- Alagamy, S.F. The influence of sustainable building of gated communities on the natural environment and the user: The case of Madinaty city. J. Eng. Appl. Sci. 2023, 70, 90. [Google Scholar] [CrossRef] [Scilit]
- García-Lamarca, M.; Anguelovski, I.; Cole, H.V.; Connolly, J.J.; Pérez-del-Pulgar, C.; Shokry, G.; Triguero-Mas, M. Urban green grabbing: Residential real estate developers’ discourse and practice in gentrifying Global North neighborhoods. Geoforum 2022, 128, 1–10. [Google Scholar] [CrossRef] [Scilit]
- Bexell, M.; Jönsson, K. Responsibility and the United Nations’ Sustainable Development Goals. Forum Dev. Stud. 2017, 44, 13–29. [Google Scholar] [CrossRef] [Scilit]
- Carlsen, L.; Bruggemann, R. The 17 United Nations’ Sustainable Development Goals: A status by 2020. Int. J. Sustain. Dev. World Ecol. 2022, 29, 219–229. [Google Scholar] [CrossRef] [Scilit]
- D’Adamo, I.; Della Sciucca, M.; Gastaldi, M.; Lupi, B. Indicator Assessment of Sustainable Development Goals: A Global Perspective. Sustainability 2025, 17, 8259. [Google Scholar] [CrossRef] [Scilit]
- Basilico, P.; D’Adamo, I.; Del Giudice, M.; Di Santo, F.; Gastaldi, M.; Passarelli, F.; Uricchio, A.F. Sustainable schools and knowledge management: Driving urban and social transitions for sustainable development. Sustain. Dev. 2026, 34, 915–935. [Google Scholar] [CrossRef] [Scilit]
- Bonifazi, G.; Gasbarrone, R.; Palmieri, R.; Serranti, S. Near infrared hyperspectral imaging-based approach for end-of-life flat monitors recycling. Automatisierungstechnik 2020, 68, 265–276. [Google Scholar] [CrossRef] [Scilit]

Disclaimer/Publisher’s Note: The statements, opinions and data contained in all publications are solely those of the individual author(s) and contributor(s) and not of MDPI and/or the editor(s). MDPI and/or the editor(s) disclaim responsibility for any injury to people or property resulting from any ideas, methods, instructions or products referred to in the content. |
© 2026 by the authors. Licensee MDPI, Basel, Switzerland. This article is an open access article distributed under the terms and conditions of the Creative Commons Attribution (CC BY) license.