


Abstract
Accurate estimation of structural damping is essential for seismic performance assessment and design for earthquake-resistant buildings. From a sustainability perspective, reliable evaluation of dynamic properties is crucial in extending the service life of existing structures and reducing the need for material-intensive interventions. Ambient vibration measurements enable non-invasive identification of damping characteristics, supporting sustainable assessment of the built environment. This paper presents an analysis of the dynamic response of a four-story reinforced concrete structure. Ambient vibration recordings are obtained with Geodas Aquisition Station and one-second velocity sensors made by Butan Service And Tokio Soil Ltd., available from CERS (Seismic Risk Assessment Research Center) research center from TUCEB (Technical University of Civil Engineering of Bucharest). The sensors were installed at the top level of the analyzed structure. The method used for estimating the damping ratio is the Random Decrement Technique (RDT). The influence of the several parameters involved in the method is investigated, such as the triggering value, the dimension of the time window sub-samples, and the number of cycles considered within a window relative to the natural period of the structure. For the analysis of the parameters specific to the RDT method, computational routines were developed using syntax compatible with OCTAVE/MATLAB R2019b. Filters were applied to isolate the natural vibration modes. The variability in the parameters demonstrates that the developed method is robust.
1. Introduction
The dynamic responses of buildings to various actions is influenced by their inherent characteristics: their inertial, elastic, and dissipative properties. Both the inertial and elastic characteristics can be determined through analytical calculations. However, the dissipative characteristics cannot be calculated directly due to the complexity of the phenomenon: the energy induced by the oscillation of the structure is dissipated through damping mechanisms that involve multiple processes, including the opening and closing of cracks, friction within connections, friction between the load-bearing structure and non-structural elements, and others [1,2]. These mechanisms are practically impossible to describe and quantify analytically. For this reason, damping in real structures is typically represented using idealized approaches, most commonly by assuming linear viscous damping, where the dissipative force is obtained by multiplying the damping coefficient by the velocity. The damping force is not calculated but rather assumed based on design codes, expressed as damping ratio, depending on the type of material used. However, such assumptions may lead to conservative or inaccurate evaluations of structural performance, particularly in the case of existing buildings. From a sustainability perspective, this uncertainty can result in unnecessary strengthening interventions or premature demolition, increasing material consumption and environmental impact. Therefore, in order to obtain a more realistic evaluation of the damping coefficient, various scientific studies have developed experimental methods based on the analysis of building vibrations. These experimental approaches support sustainable structural assessment by enabling non-invasive evaluation of existing structures and by contributing to the extension of their service life.
Within the framework of structural health monitoring (SHM), vibration-based estimation of damping parameters supports a life-cycle-oriented assessment of buildings by enabling continuous evaluation of their dynamic performance throughout their service life. The analysis of recorded vibrations allows for tracking changes in damping characteristics that may indicate structural degradation or damage, thereby facilitating timely maintenance and retrofit interventions. By promoting condition-based decision making and reducing the need for intrusive inspections or premature replacement, SHM contributes to the sustainable management of the built environment and the extension of structural service life. A key challenge in SHM is optimal sensor placement, which directly impacts monitoring accuracy, cost-efficiency, and overall system performance [3].
The estimation of damping in buildings using vibration records is based on the acquisition and analysis of different types of vibration data, each providing unique insights into the dynamic behavior of the structure. Time histories of acceleration, velocity, and displacement are types of data that can be used to characterize a building’s motion and estimate its damping properties. The choice of data type can influence the suitability and accuracy of various damping estimation methods.
Methods for identifying the damping ratios are generally classified as either time domain or frequency domain approaches. Time domain methods analyze the time variation of vibration recordings directly. One of the most used techniques in the time domain is the logarithmic decrement method, which is useful for estimating the damping ratio in lightly damped systems by examining the decay of free vibrations. This method involves measuring the amplitudes of successive peaks in the vibration record. The logarithmic decrement, Δ, is then calculated as the natural logarithm of the ratio between two successive peak amplitudes, or over n cycles. This decay directly quantifies the rate at which vibrations decrease in amplitude, providing a measure of the energy dissipation within the system [1,2]. The damping ratio ζ can then be determined from the logarithmic decrement using the relation:
For systems with low damping values (ζ < 0.1), a simplified approximation is often used:
The logarithmic decrement method is most effective for single-degree-of-freedom (SDOF) systems with viscous damping. However, real building structures are typically multi-degree-of-freedom (MDOF) systems, and applying this method requires careful isolation of individual vibration modes in order to obtain reasonable damping estimates. Accurate measurement of peak amplitudes from the time history of displacement, velocity, or acceleration is crucial for this method. Potential sources of error include noise in the measured signal, nonlinear system behavior, and the influence of other unisolated vibration modes. The accuracy of the estimated damping ratio can be improved by averaging results obtained from multiple peak sets or by using curve-fitting techniques applied to the entire response.
Another important time domain method for damping estimation is the Random Decrement Technique (RDT) [4]. This technique uses statistical analysis of vibration responses generated by random excitations—such as ambient vibrations—to estimate the damping characteristics of a structure. It operates by averaging multiple segments of the vibration response that are triggered under a specific condition, effectively extracting the system’s free decay from random data.
A group of researchers from Hunan University studied the damping characteristics of Nanjing Yangtze River Bridge using a combined Empirical Mode Decomposition (EMD) and Random Decrement (RD) method to identify modal parameters from nonstationary vibration data [5].
An improved version of the Hilbert–Huang Transform was introduced to identify operational modal parameters in structures with closely spaced modes [6]. The approach replaces traditional empirical mode decomposition with Analytical Mode Decomposition to break down the measured response into mono-component signals. The Random Decrement Technique was then applied to these components to extract free-decay responses, which are subsequently analyzed using Hilbert Transform to obtain the modal parameters. The effectiveness of the proposed method was demonstrated using simulated data from a three-degree-of-freedom system and a 24-story building, as well as field measurements from a cable-stayed bridge.
Another paper developed using the RDT concepts [7] reports on long-term monitoring of an 11-story reinforced concrete building near Bucharest to assess variations in its dynamic characteristics. The study extracted the building’s fundamental frequencies and damping ratios, revealing that frequency values depend on base and top accelerations. The transverse direction showed lower frequencies than the longitudinal one, with the largest frequency drop occurring during the Mw 5.5 earthquake on 28 October 2018.
The importance of selecting an appropriate triggering value has also been emphasized by other researchers [8]. In their work, a more general triggering condition is considered, in which the conditioning is applied simultaneously to the signal and its time derivative. Under this formulation, the resulting random decrement function is obtained as a linear combination of the cross-correlation function and its derivative.
Brincker and Amador [8] have established a general framework to relate the Random Decrement (RD) functions to correlation functions and their derivatives. Based on this framework, all major established theoretical solutions have been derived, and it has been demonstrated that the resulting estimators are unbiased. The study indicates that both the free decay response and its derivative, when estimated using the RD approach, perform comparably well in identifying modal properties from vibration response data.
Frequency domain methods analyze the vibration signal after it has been transformed from the time domain into the frequency domain, typically using the Fourier Transform. One of the fundamental frequency domain techniques for damping estimation is the half-power bandwidth method. This method examines the Frequency Response Function (FRF) of the structure, focusing on the resonance peaks corresponding to the natural frequencies of vibration. Damping is estimated from the bandwidth of these resonance peaks [9]. Although relatively simple to apply, the half-power bandwidth method relies on certain assumptions, including light viscous damping and well-separated vibration modes. These assumptions may limit its accuracy in structures with higher damping ratios or closely spaced modes, which are common in many real-world buildings. Moreover, the resonant response associated with a particular mode may be affected by contributions from other vibration modes, potentially impacting the accuracy of the estimated bandwidth.
Damping ratios and natural frequencies were determined by Noh et al. [10] using the power spectrum within the deconstructed modal response. The State-Space-Based Modal Decomposition technique extracts modal responses and identifies modal attributes from acquired data of highly damped structures.
Another frequency domain method is Frequency Domain Decomposition (FDD). FDD uses Singular Value Decomposition (SVD) of the cross-spectral density matrix, which is computed from vibration response measurements at each frequency line. SVD is a powerful tool because it aids in separating noisy data and identifying individual vibration modes, even when the excitation source is ambient and unmeasured [11].
The experimental determination of the damping ratio constitutes a potentially significant parameter in the context of ongoing advancements in machine learning. Within the broader framework of sustainability-oriented development, the design and implementation of artificial intelligence and machine learning algorithms have gained increasing prominence. Recent contributions, including those by Lazaridis et al. [12] and Hwang et al. [13], propose numerical approaches grounded in machine learning techniques for predicting the damage state of structural systems based on sufficiently comprehensive input datasets. Additional investigations into the application of artificial intelligence in structural engineering have been reported by Munteanu et al. [14] and Calofir et al. [15,16]. The reliable prediction of structural response, as well as of degradation mechanisms induced by seismic events, is influenced not only by fundamental mechanical properties such as mass and stiffness, but also by the damping ratio. Consequently, improved characterization and refinement of data associated with the damping ratio parameter may contribute to enhanced predictive accuracy of machine learning and artificial intelligence algorithms, thereby supporting more sustainable engineering practices.
In continuation of the previously discussed need for accurate structural response prediction, stochastic ground motion simulations were assessed for intermediate-depth Vrancea earthquakes [17]. The analysis of 371 recorded accelerograms highlighted inconsistencies in significant duration due to inadequate representation of energy distribution in time, which is governed by the shaping window function. To address this issue, a two-interval window function was defined to capture the specific rapid–slow energy release pattern of Vrancea events, leading to more realistic simulated ground motions and, implicitly, to improved input data for machine-learning-based structural response prediction [18]. An important concern refers to resilience and this is the reason for adopting ground motion modeling in probabilistic structural dynamics. According to Li Guo et al. [18], the stochastic nature of ground motions is related to three key parameters: the Fourier spectrum of the base input, the predominant period of the site, and the equivalent damping ratio. By appropriately determining the mean values and coefficients of variation of the fundamental uncertainty parameters in the stochastic ground motion model, a set of seismic acceleration time histories are generated.
The novelty of this research consists of analyzing the variability in certain parameters involved in the RDT in order to estimate the value of the damping ratio. More precisely, the natural frequency, triggering value, time window length, number of sub-segments, are systematically questioned and the robustness of the RDT method is investigated.
Accurate evaluation of the damping ratio enables engineers to precisely determine the structural response, optimize material use, and lower maintenance and environmental costs. The damping ratio is a key parameter that promotes safer, more resilient, and sustainability-focused engineering design but its accurate value is often considered a marginal parameter in current practice.
2. Materials and Methods
The basic concept of the RDT is based on the fact that a random response of a structure to a random input is composed of two parts, a deterministic part and a random part (assumed to have zero average) [19]. By averaging enough sample responses with a prescribed initial condition, the random part associated with the random excitation will average out, leaving the deterministic part. The prescribed initial condition is called a triggering condition.
The algorithm implemented by Cheynet in MATLAB consists of two main components: the application of the RDT function, followed by using the expofit function [9]. The RDT.m file processes the random signal into the deterministic Random Decrement Signature. The function utilizes as parameters the ambient time series, the time step, the trigger amplitude and the segment duration.
The statistical convergence of the RDT average is analyzed with respect to the selection of the triggering amplitude. If the triggering amplitude is chosen too low, the extracted segments are statistically dominated by noise and general signal fluctuations. Conversely, if it is chosen too high, the number of triggering events will be insufficient, which compromises the statistical convergence required for effective noise cancellation.
The triggering value defines the starting points from which the subsequent deterministic decay segments are extracted. The desired segment duration is converted into a discrete number of time steps per segment. A matrix is initialized to store all extracted segments. The dimensions of this matrix are defined by the number of segments found and the segment length.
The final RDT signature, R, is calculated by taking the mean across all rows of the segment matrix, S:R = mean (S). This collective averaging step is where the random components of the excitation and noise are statistically eliminated, thus isolating the system’s deterministic free decay response. The resulting averaged signature is normalized by its initial value.
The normalized RDT signature is a decaying oscillatory function characteristic of the system’s free decay. To obtain the quantitative modal damping ratio, the expoFit.m function is applied. This function fits an exponential decay envelope to the RDT signature. The fit is analyzed to determine the slope of the envelope, which is directly related to the damping ratio. The implementation involves two steps: (i) the envelope identification of the peak amplitudes of R in the time domain, which define the boundary points of the decay envelope and (ii) the parameter fitting, by applying a fitting technique, such as the logarithmic decrement method, to the identified peak amplitudes versus time. The resulting fit provides the decay parameter.
In this study, Cheynet’s method has been enhanced by developing algorithms that allow the variation of several parameters involved in the procedure. First, a set of ambient vibrations are analyzed in order to accurately identify the natural period of vibration of the structure. The sub-segments duration is related to the natural period of the structures for having a better representation of the decay function. For the triggering value, a variation between 4% and 20% of the maximum signal amplitude has been considered, thus providing insight into the influence of this selection on the response parameters. This chosen interval produces sufficient sub-segments such that R has a relevant statistical meaning. Spectral peaks were identified from the averaged signals, and the corresponding decay curves were selected based on these characteristics. In cases where a nearby frequency peak was identified, it was filtered out to ensure the accuracy of the damping estimation.
This study employs the Random Decrement Technique (RDT) as implemented in MATLAB by E. Cheynet [20].
The ambient vibration measurements were made at the last floor (4th) of the building of Faculty of Civil, Industrial and Agricultural Constructions from TUCEB Erected in ‘60 s this building section was recently retrofitted. The building comprises four units.
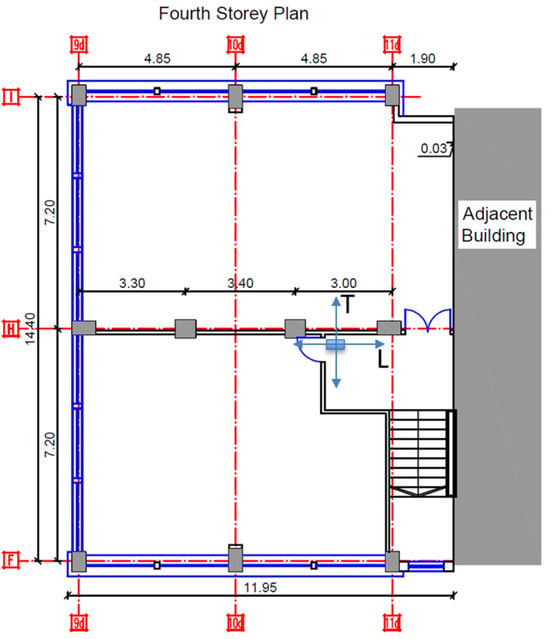
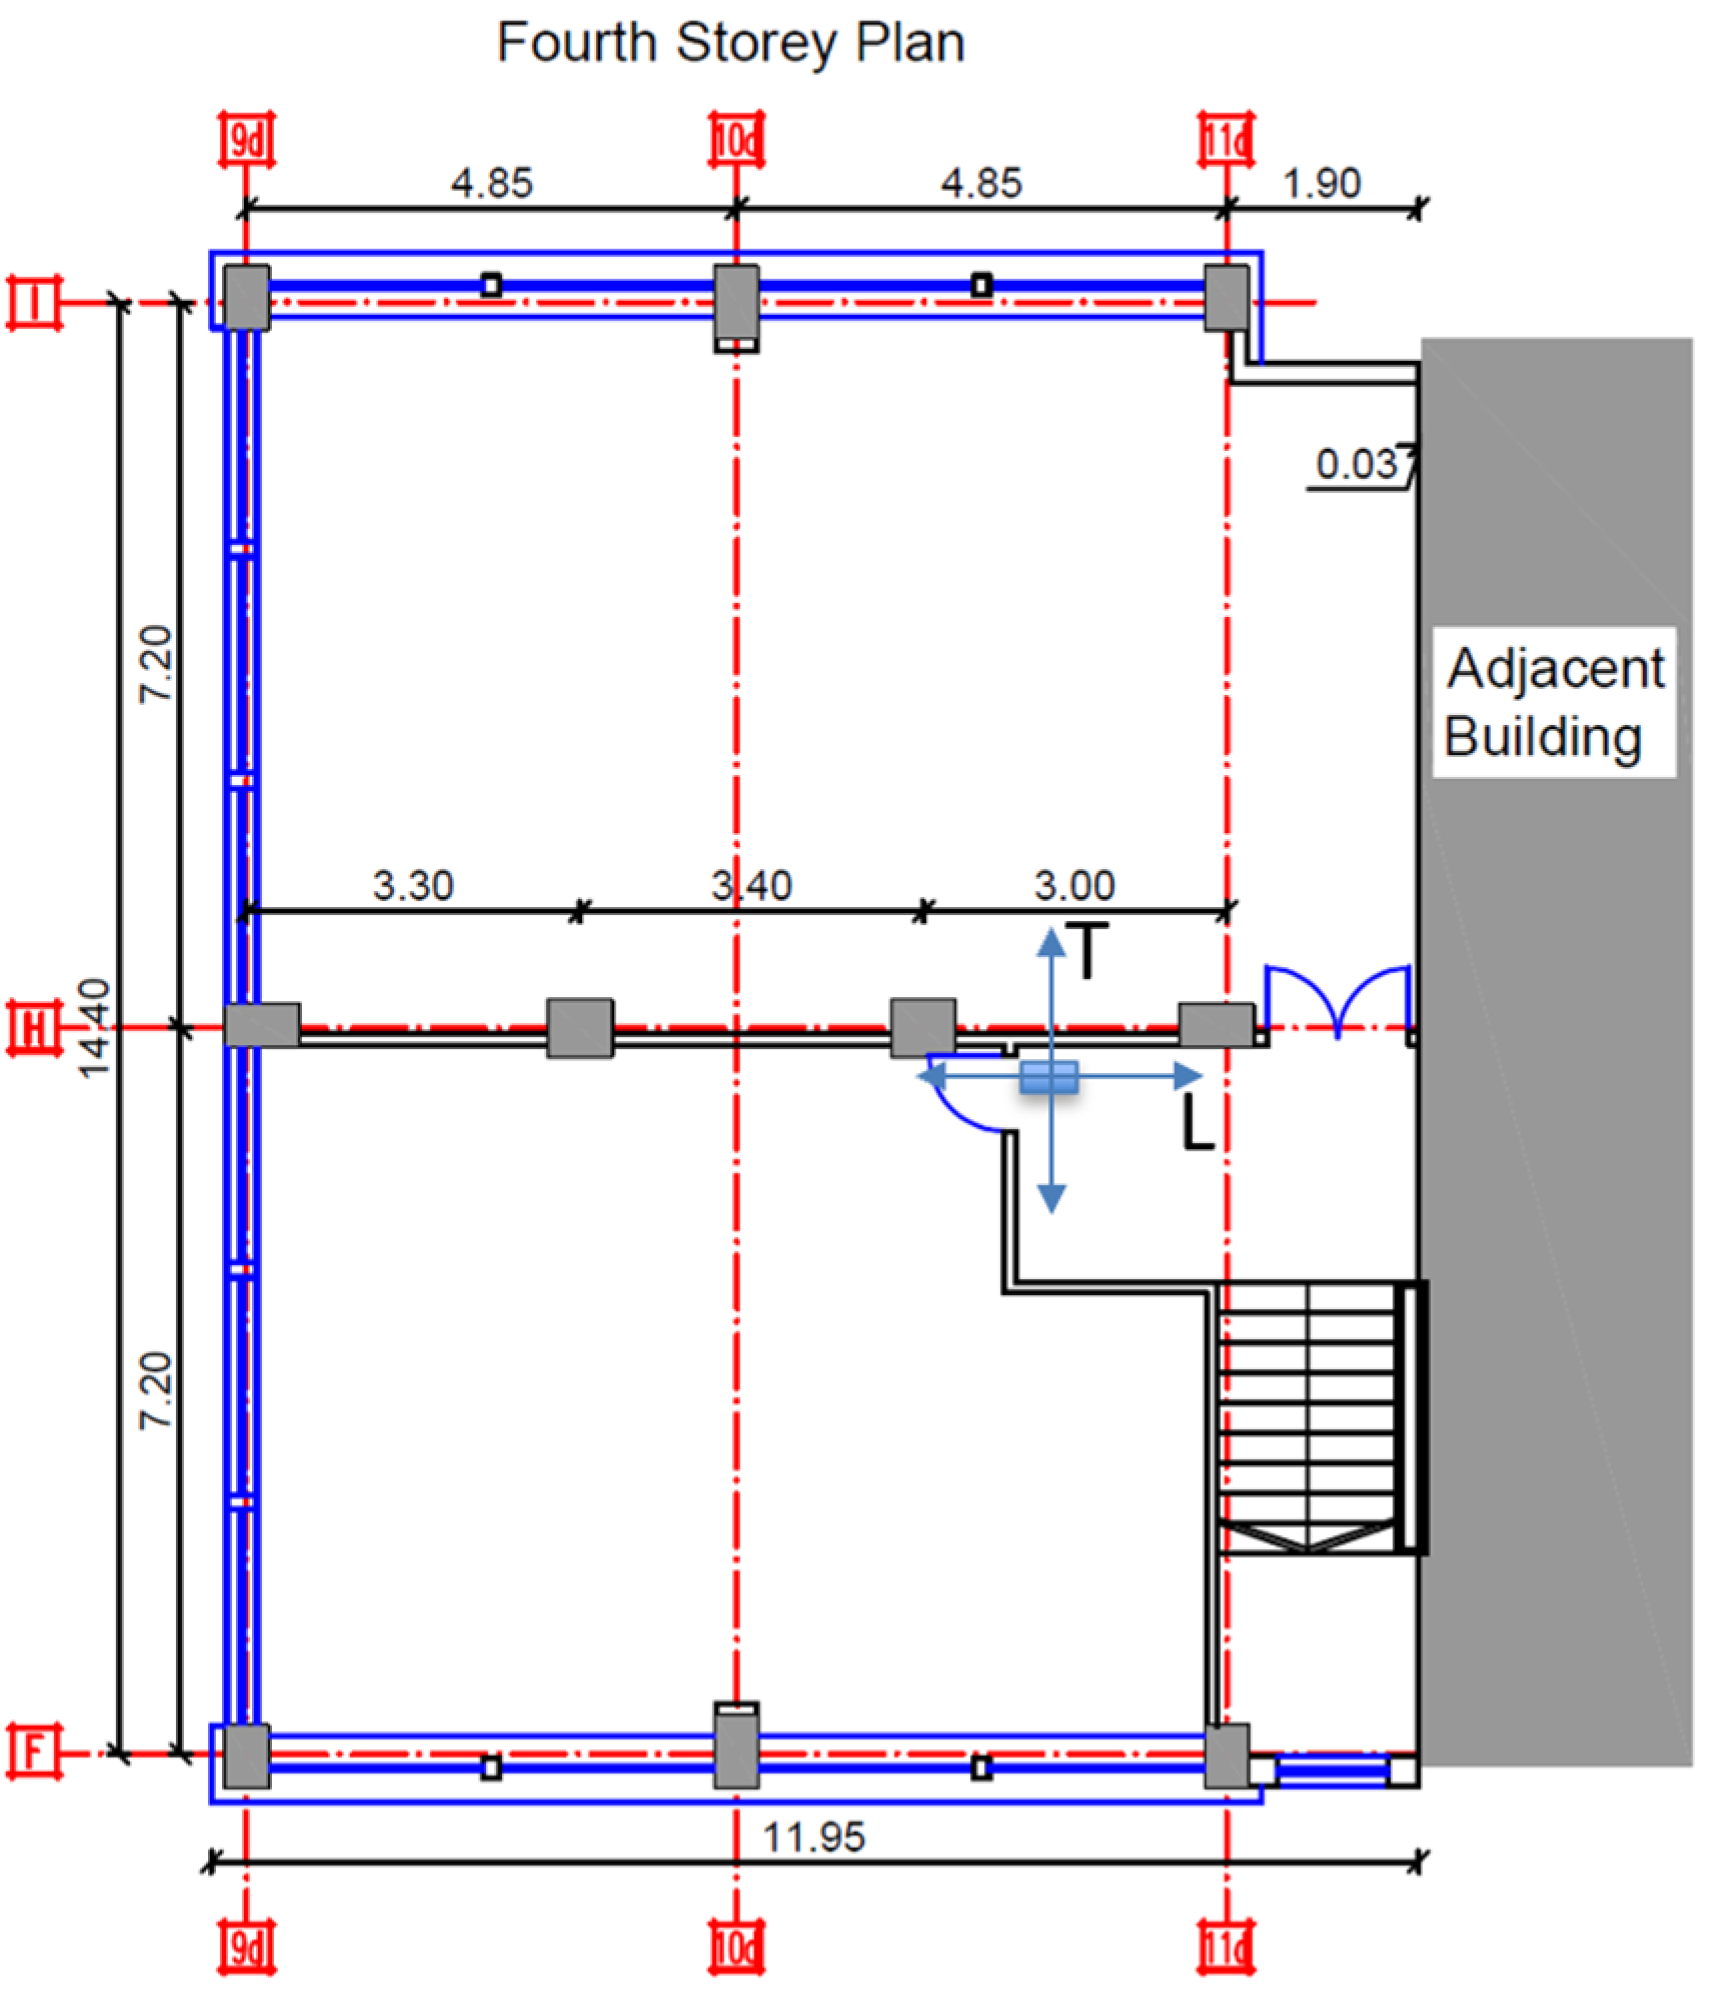
The equipment, consisting of the acquisition system (24 bits digitizer) and 1 s and 2 s velocity sensors, manufactured by Buttan Service-Tokyo & Tokyo Soil Research Co., Ltd. (Tokyo, Japan), belong to the Seismic Risk Assessment Research Center at the Technical University of Civil Engineering Bucharest. The sensors are placed in Unit D as illustrated in Figure 1. The orientation followed the longitudinal and transverse directions of the building. Unit D is a RC frame structure with a partially embedded basement and 4 storeys.
Figure 1.
Plan view of Unit D.
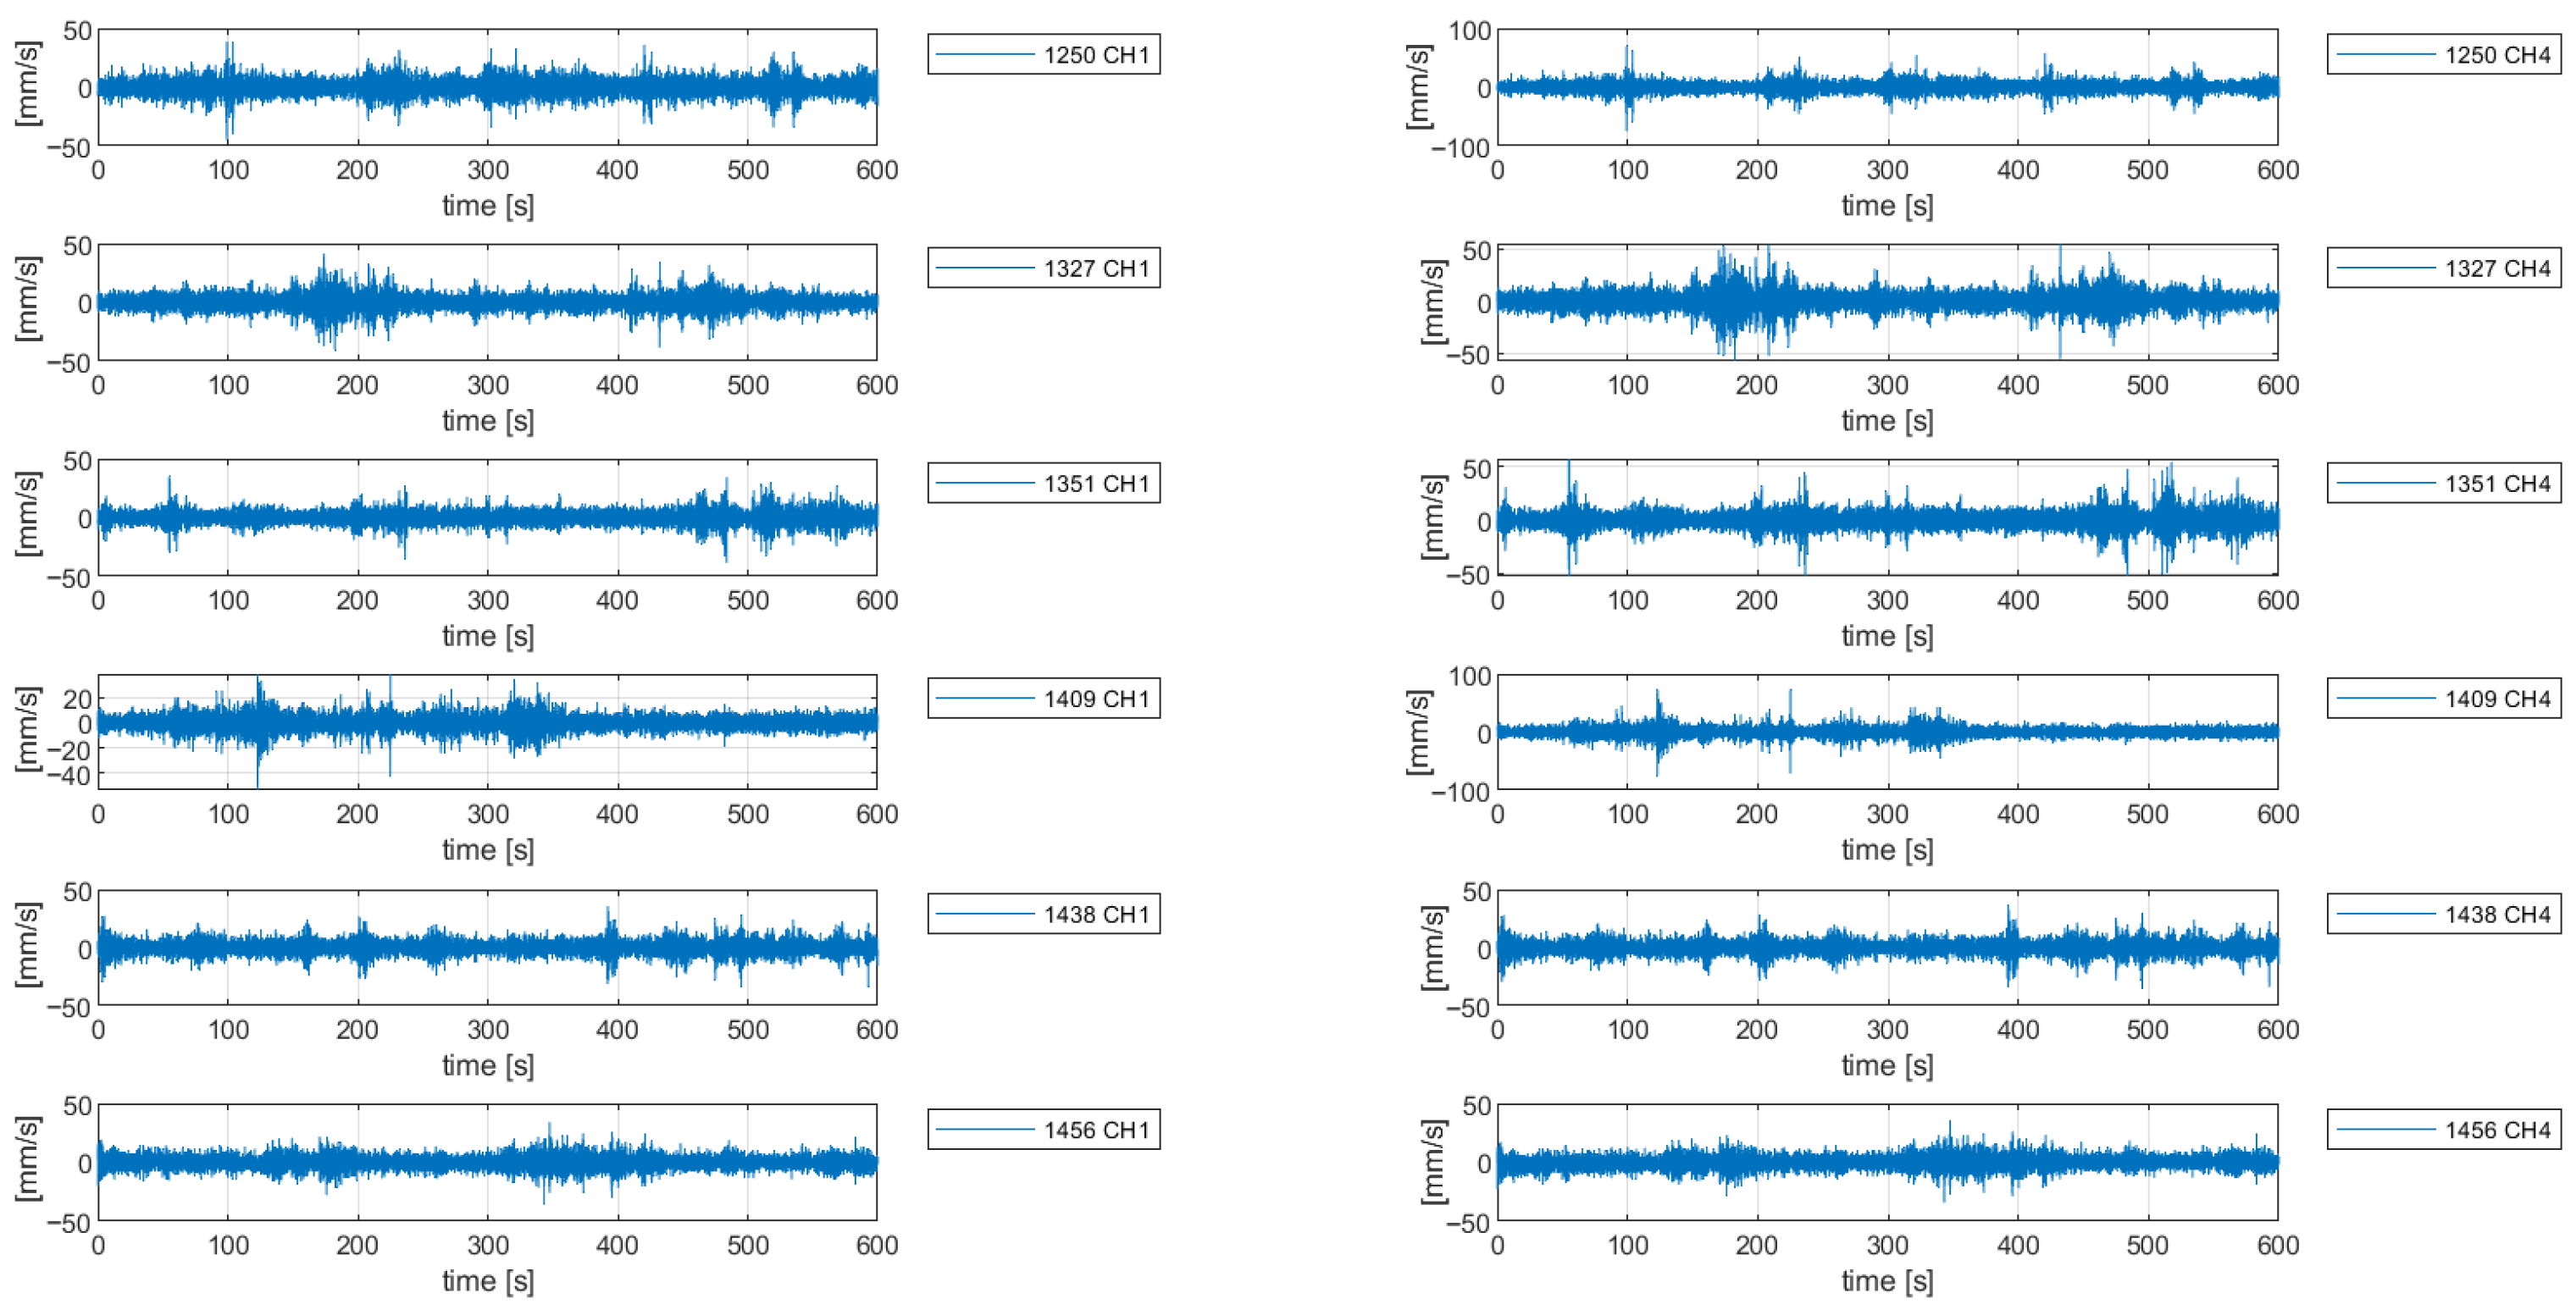
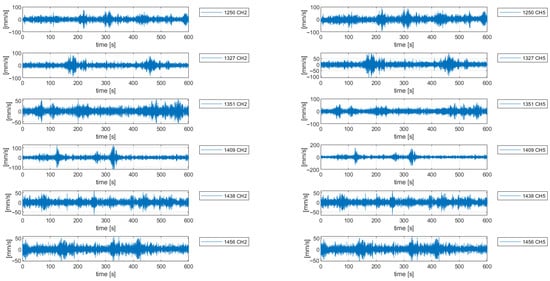
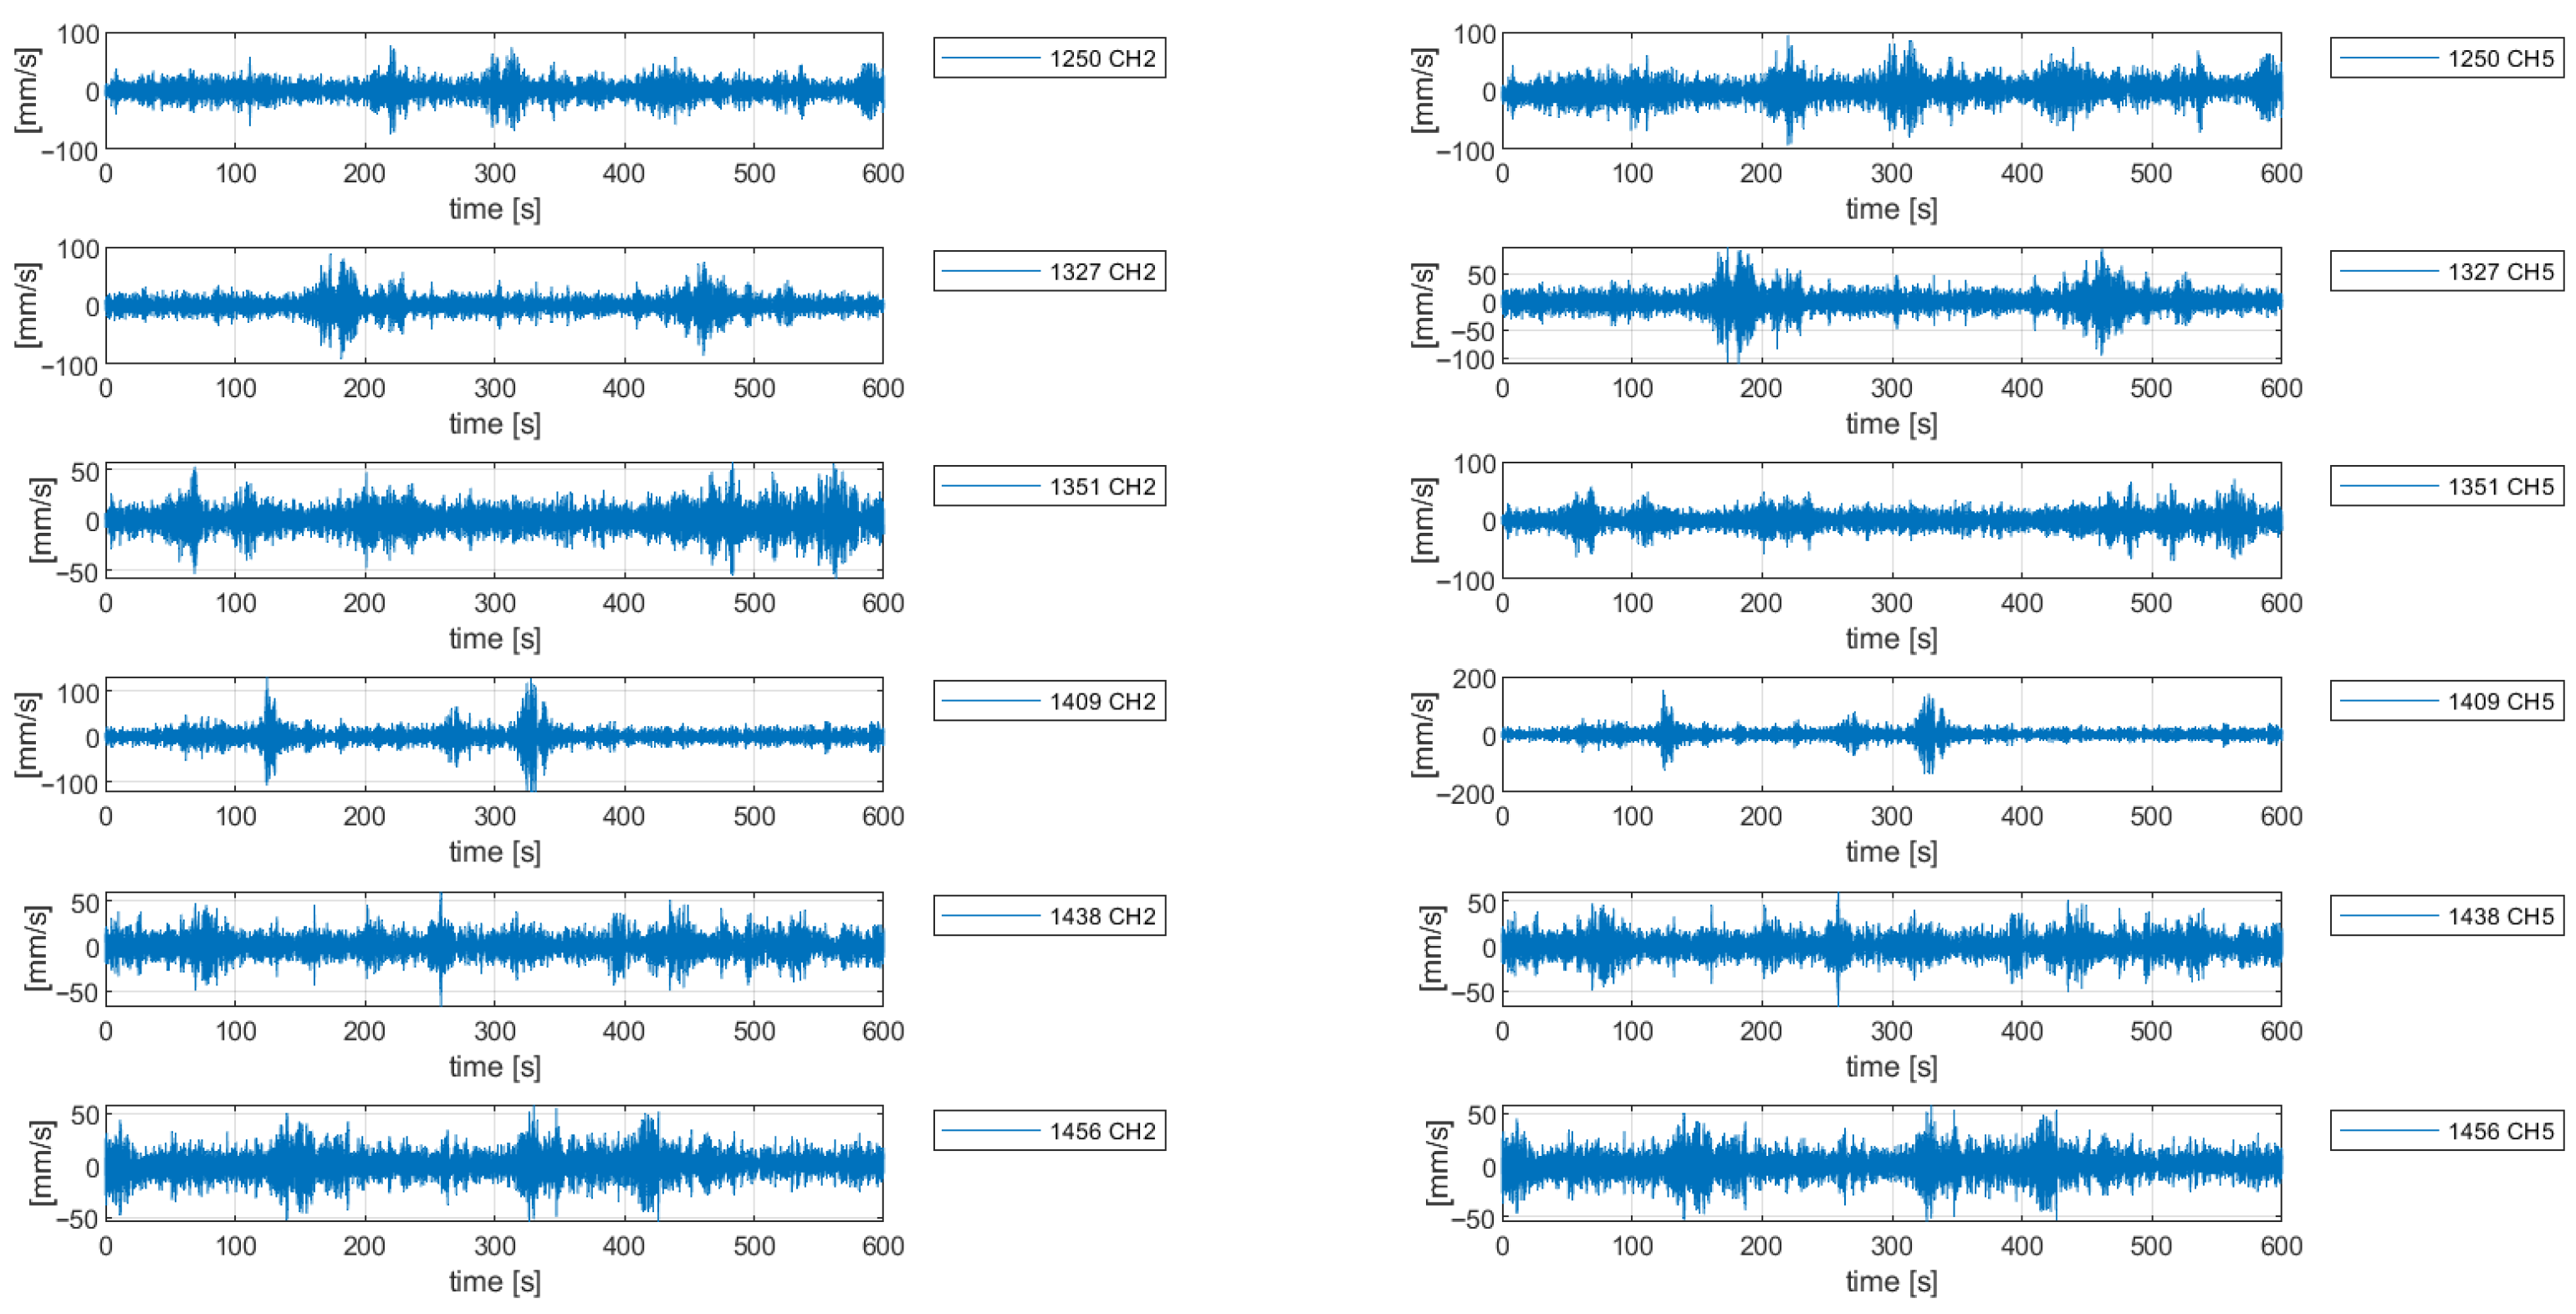
The study has been done on six recordings of velocities, on two directions, using two channels for each direction. The recordings used in this paper are available at https://doi.org/10.5281/zenodo.17878695 (accessed on 5 January 2026). Figure 2 and Figure 3 illustrate the 24 time histories represented by 60,000 values of velocities recorded at 0.01 s.
Figure 2.
Ambiental velocity recordings (longitudinal direction).
Figure 3.
Ambiental velocity recordings (transversal direction).
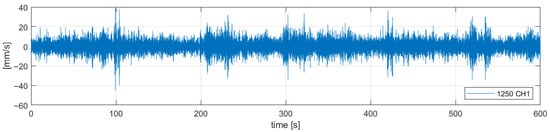
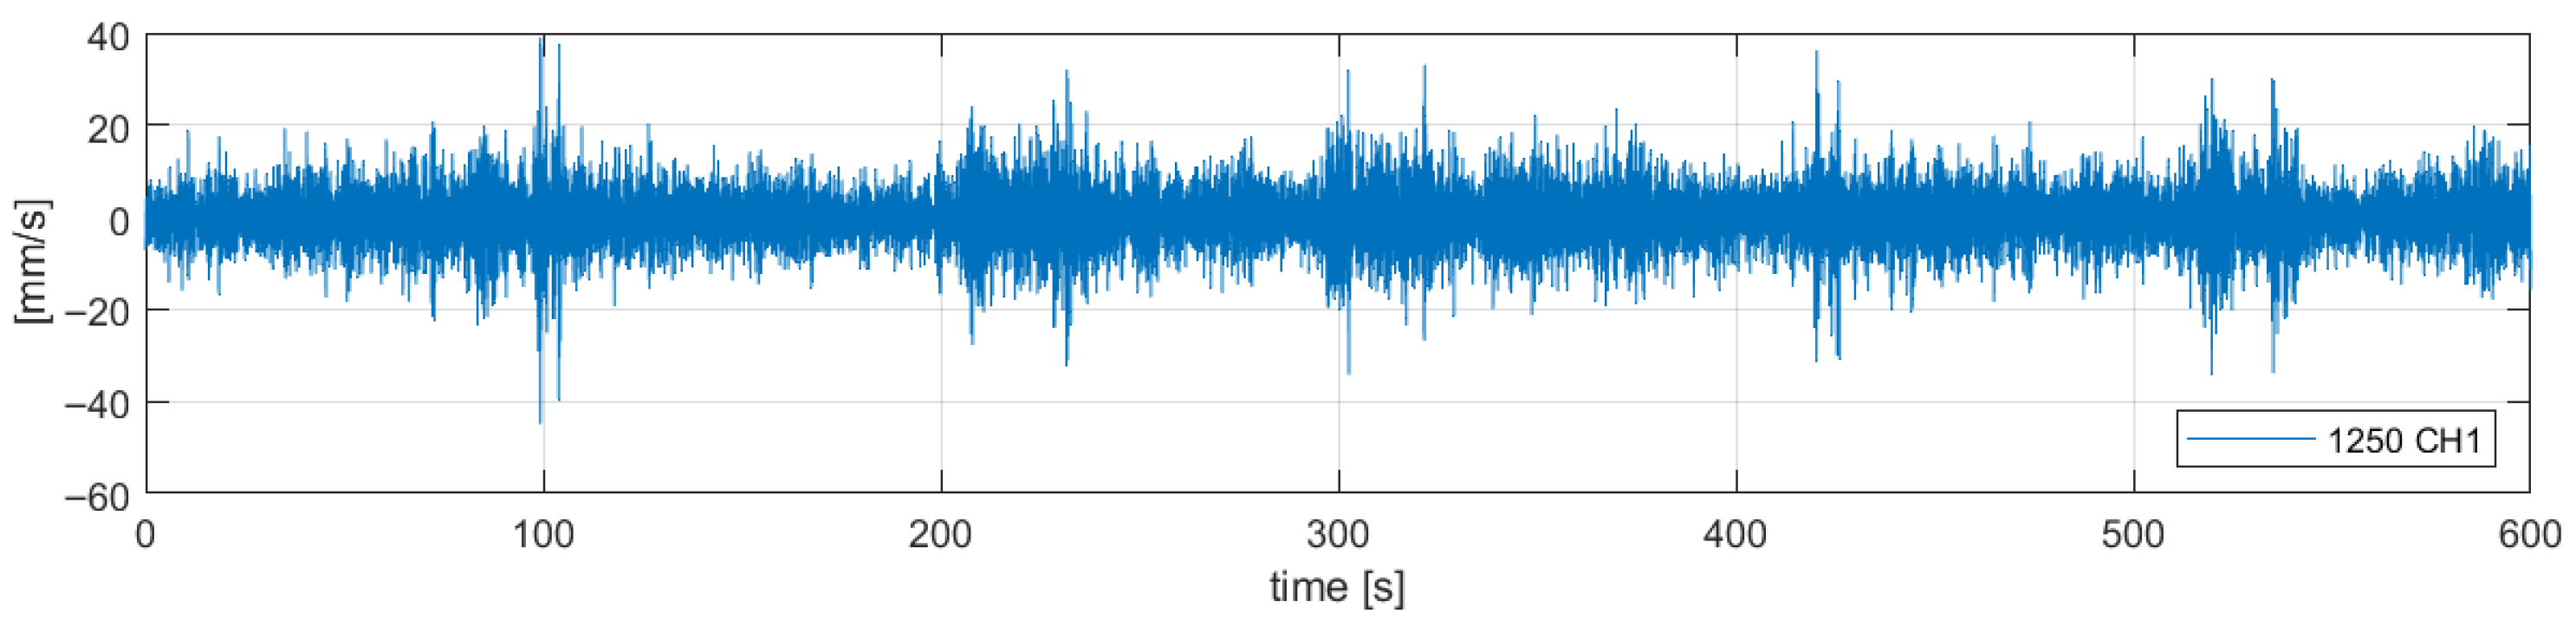
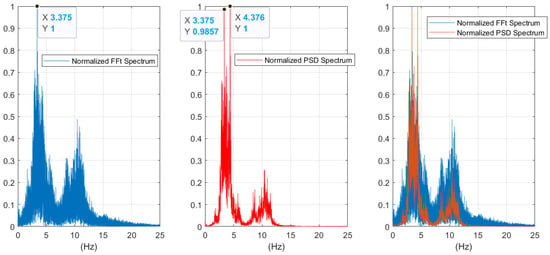
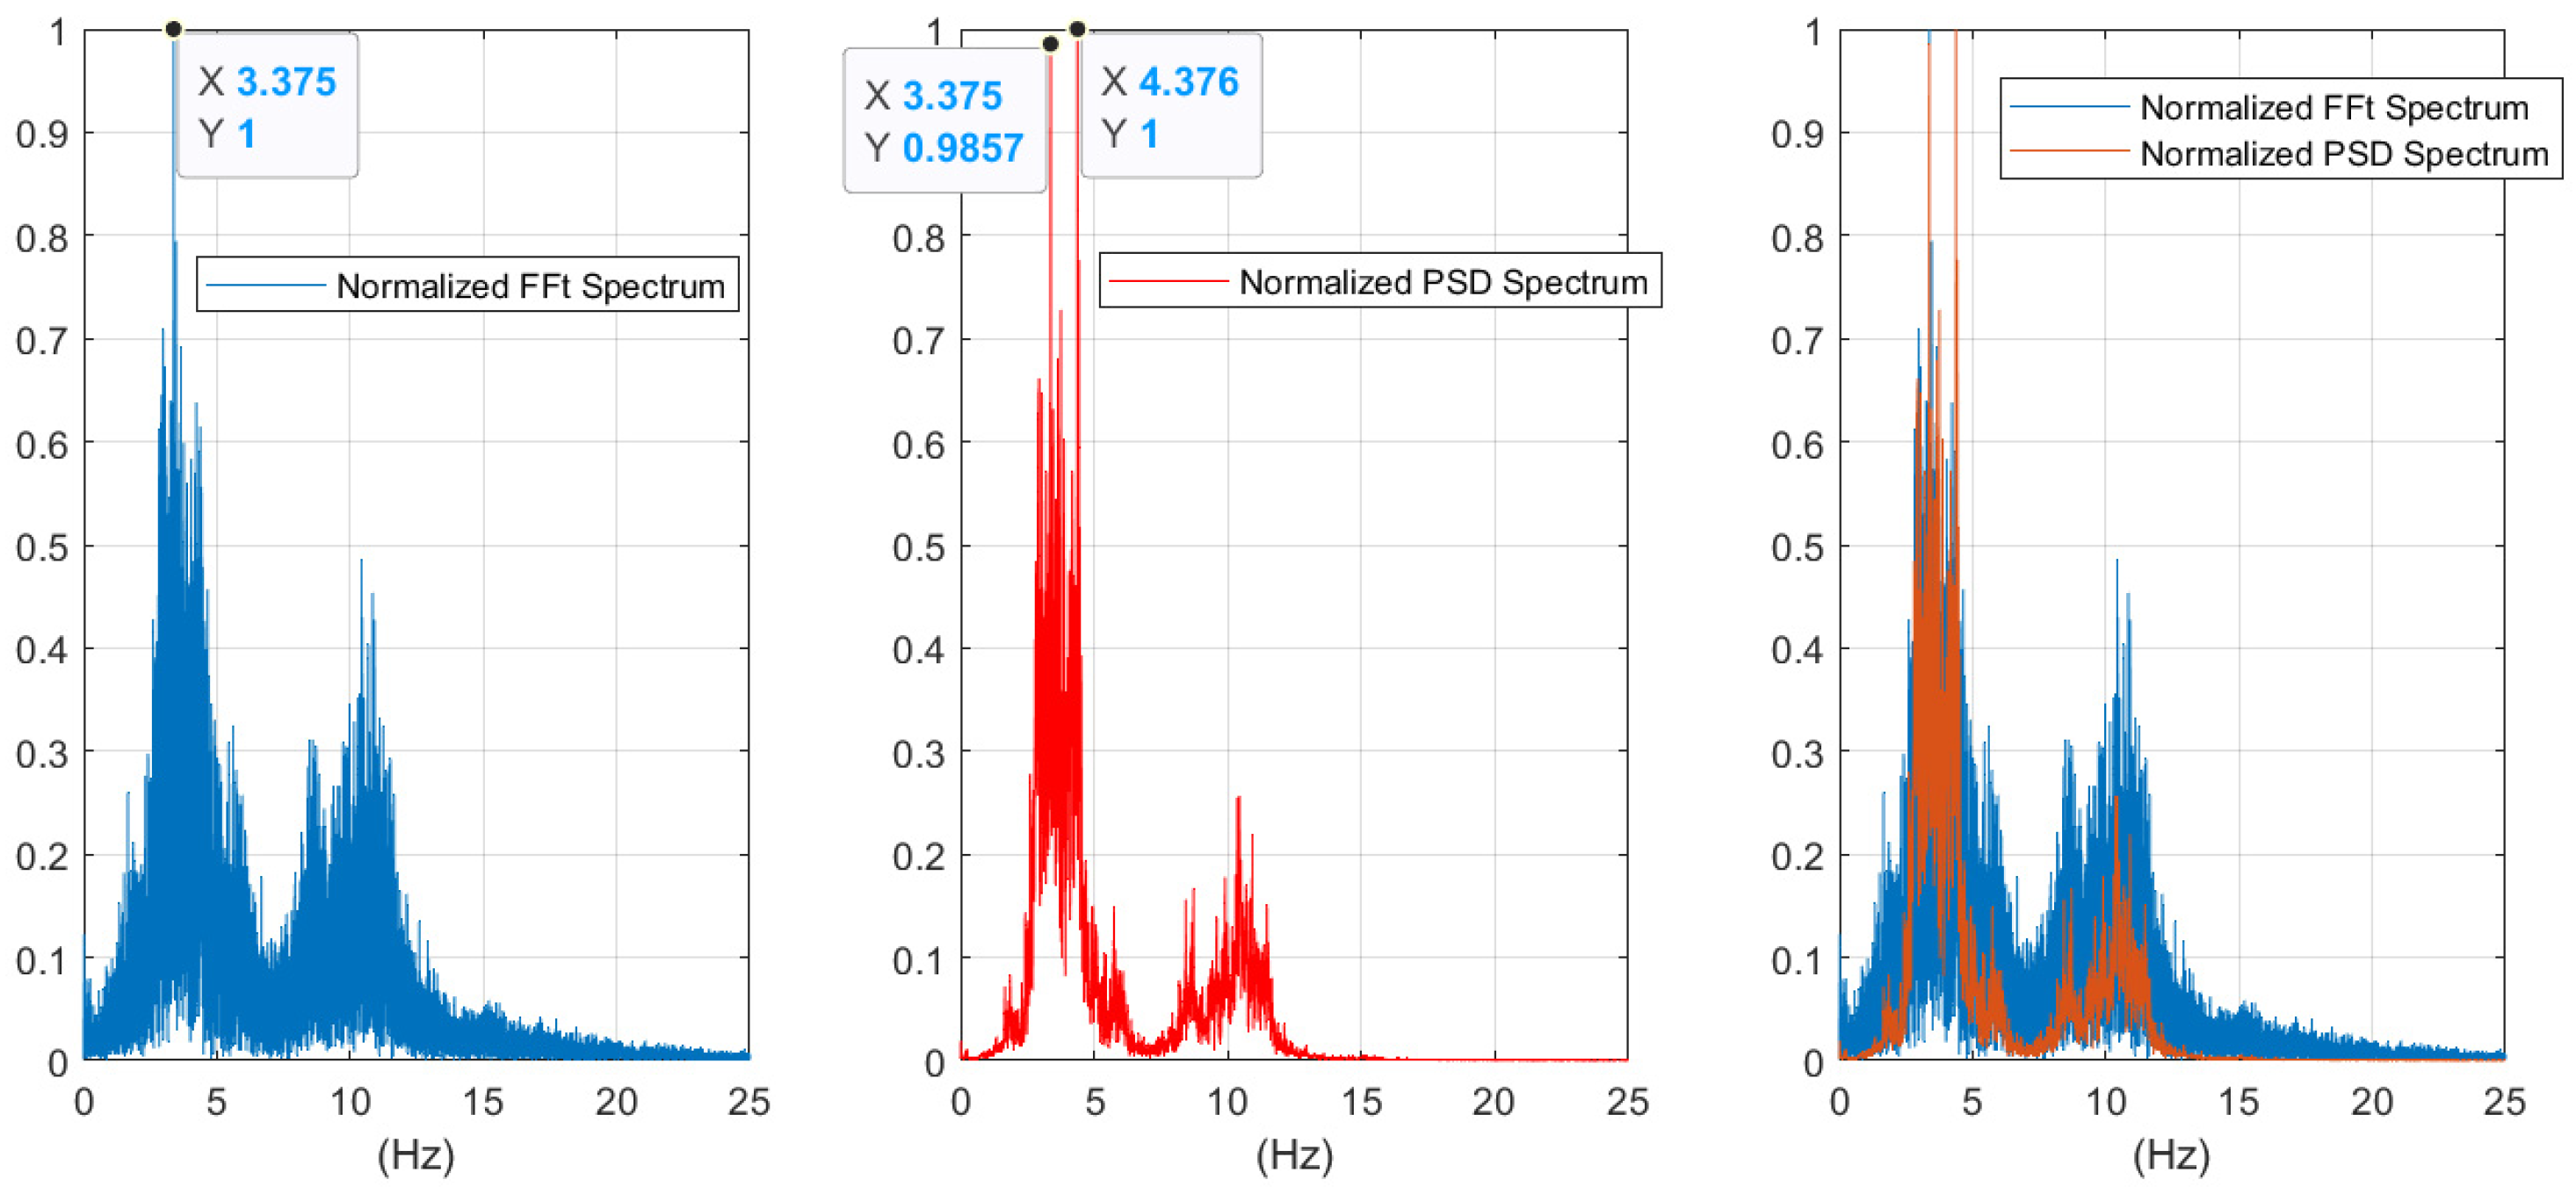
The recording 1250 CH1, corresponding to the longitudinal direction, is illustrated in Figure 4 and further used to detail the analysis procedure. Fast Fourier transform is employed to obtain the frequency domain representation of the velocity recording. In addition, the power spectral density of the velocity signal is obtained using Welch’s overlapped segment averaging estimator. The illustration of the mentioned frequency domain representations is provided in Figure 5.
Figure 4.
Ambiental velocity recording of 1250 CH1.
Figure 5.
Normalized Fourier spectrum (left), the Normalized Power Spectral Density spectrum (middle) and their comparison (right) for the velocity recording 1250 CH1.
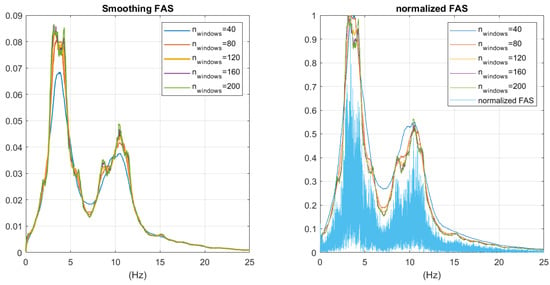
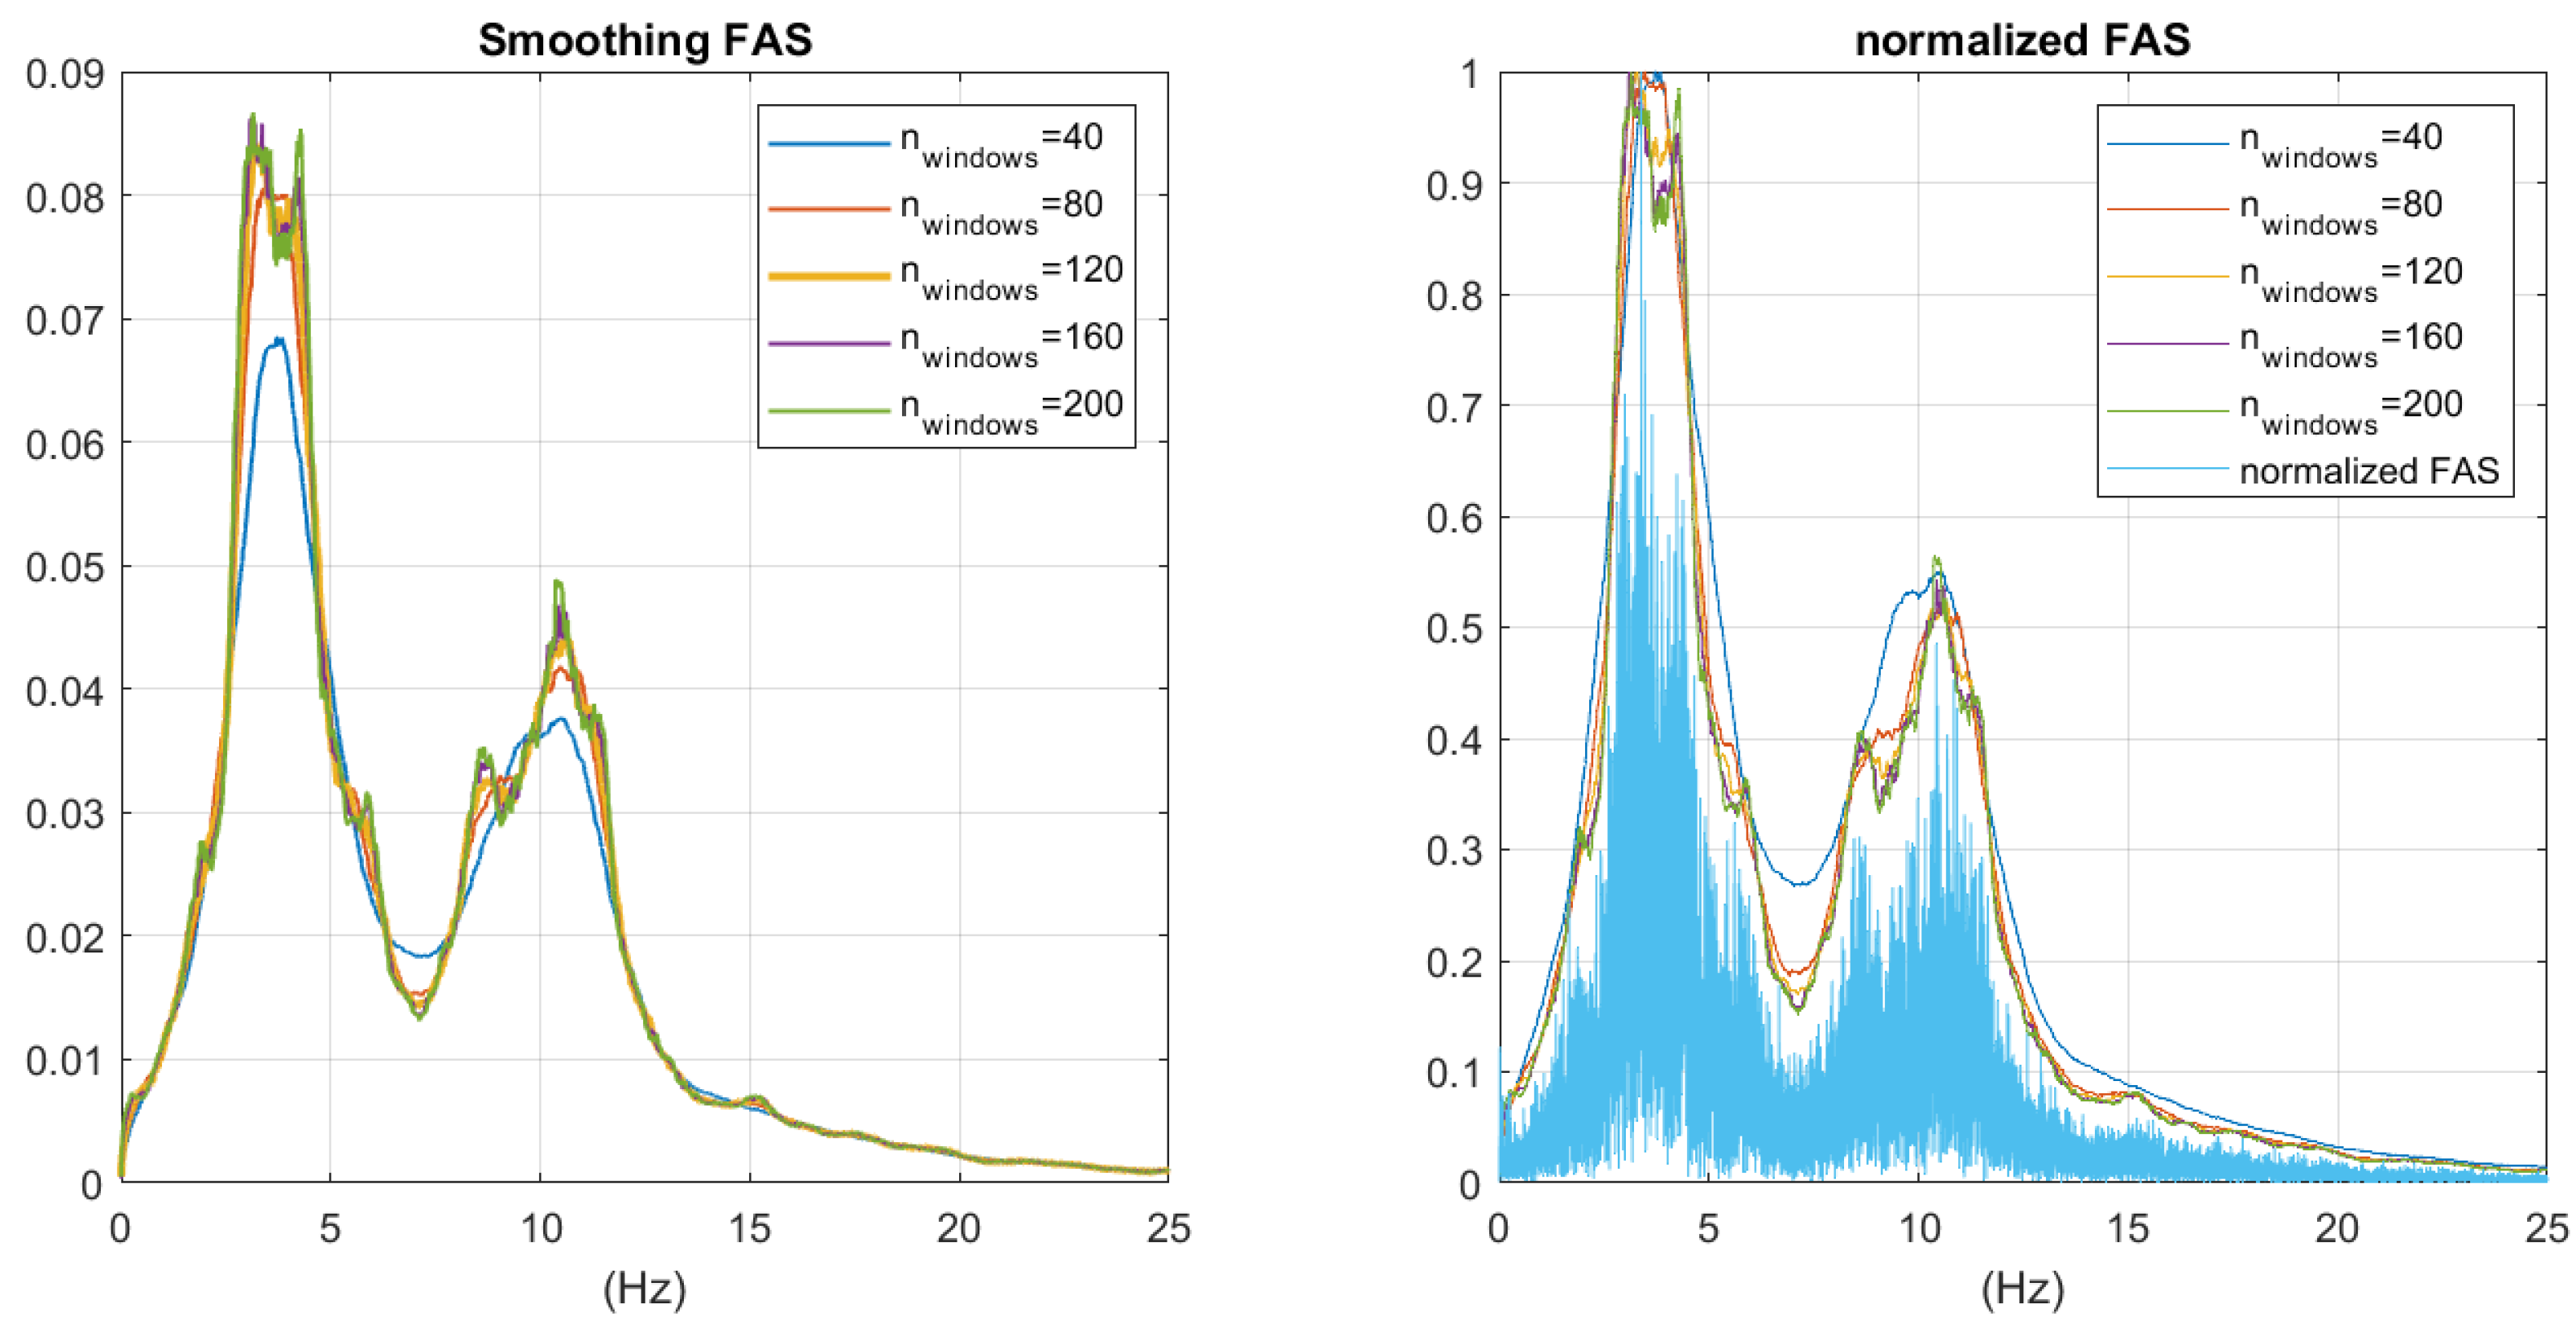
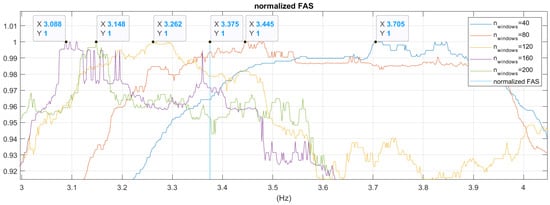
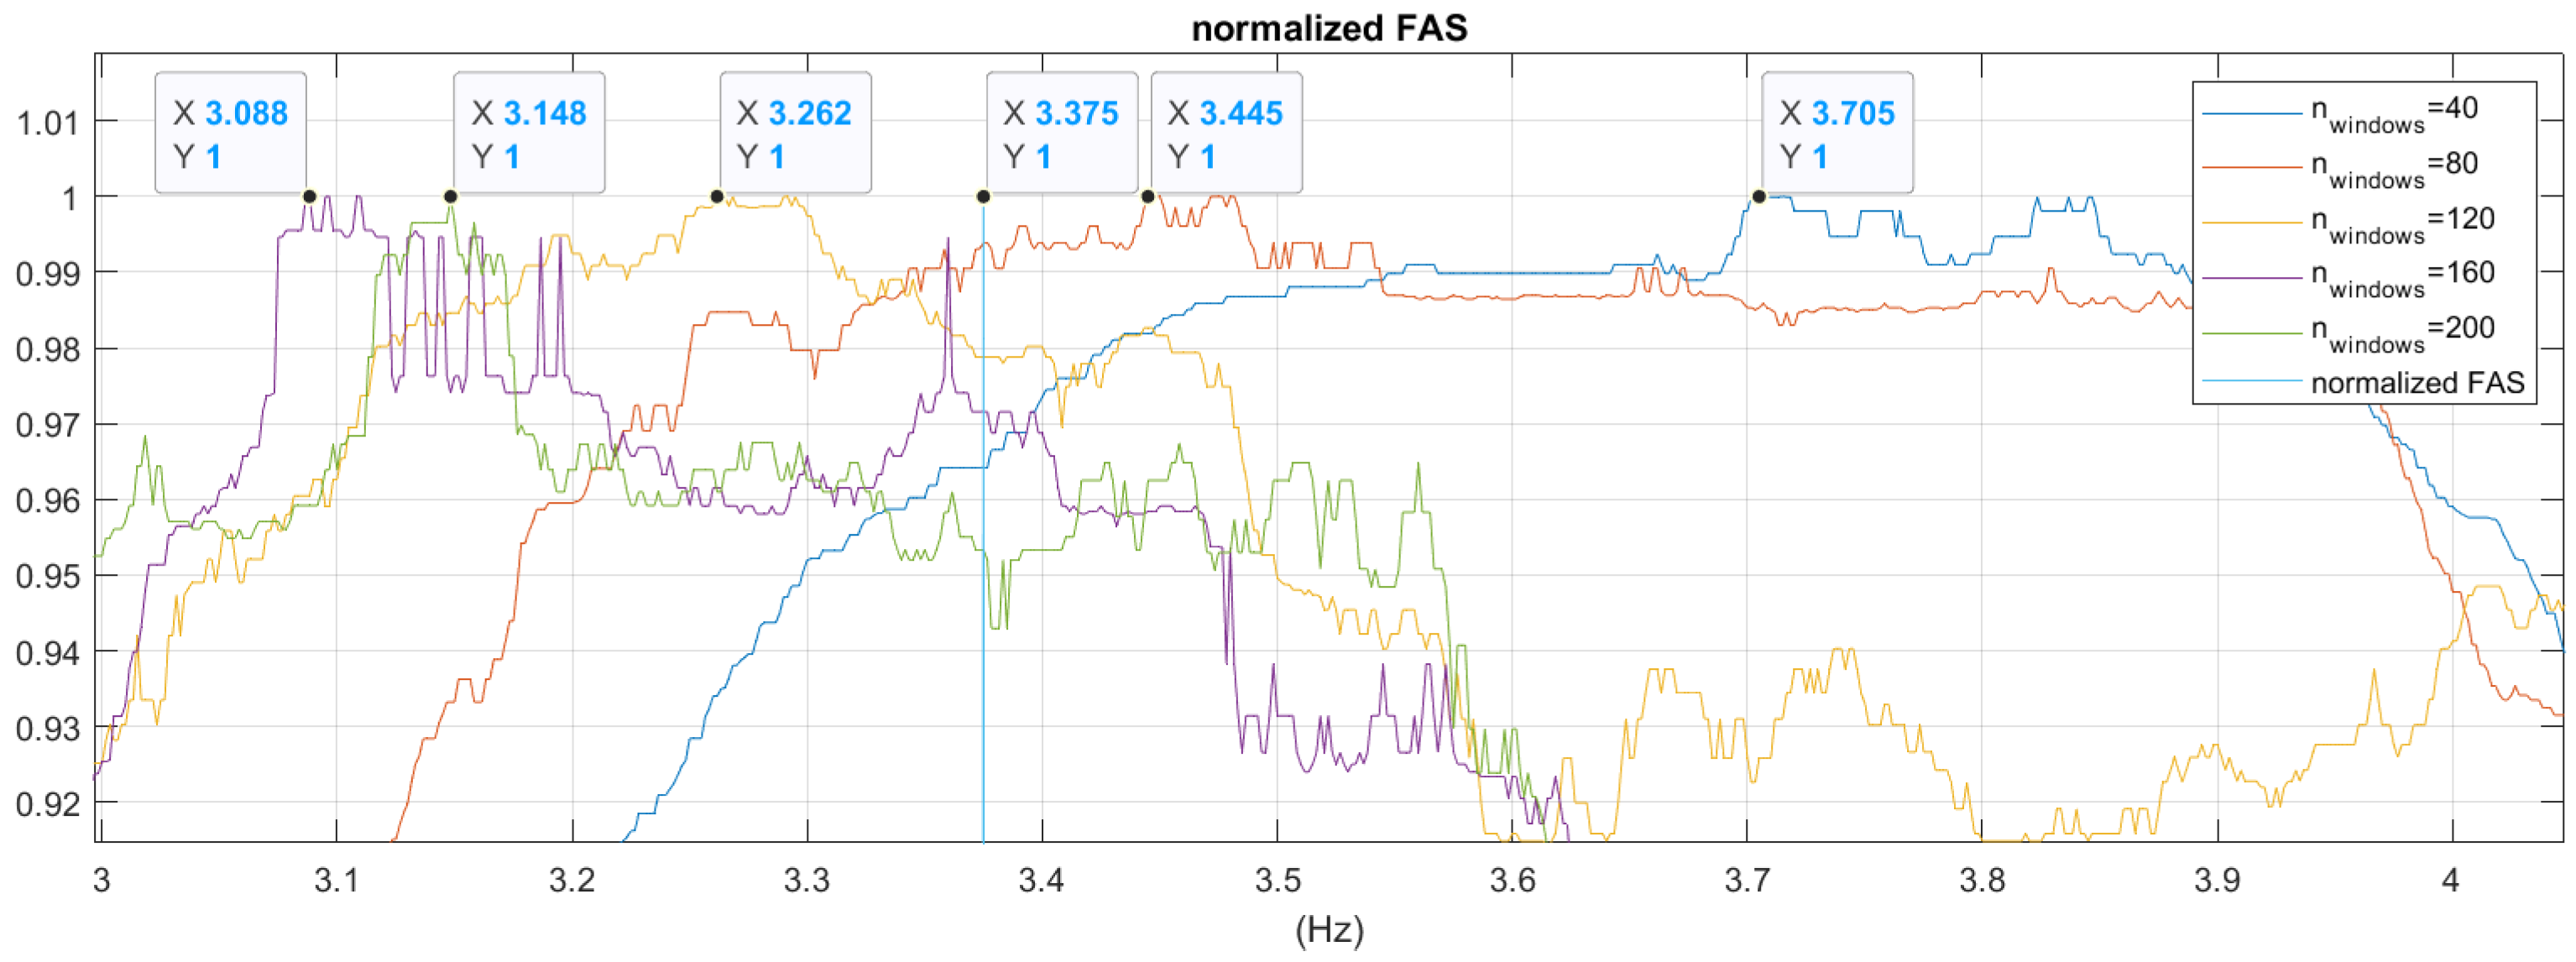
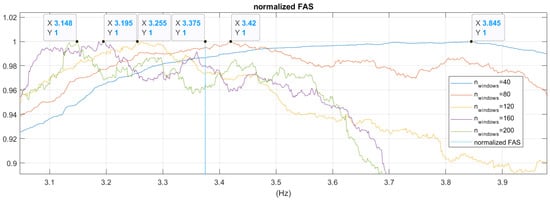
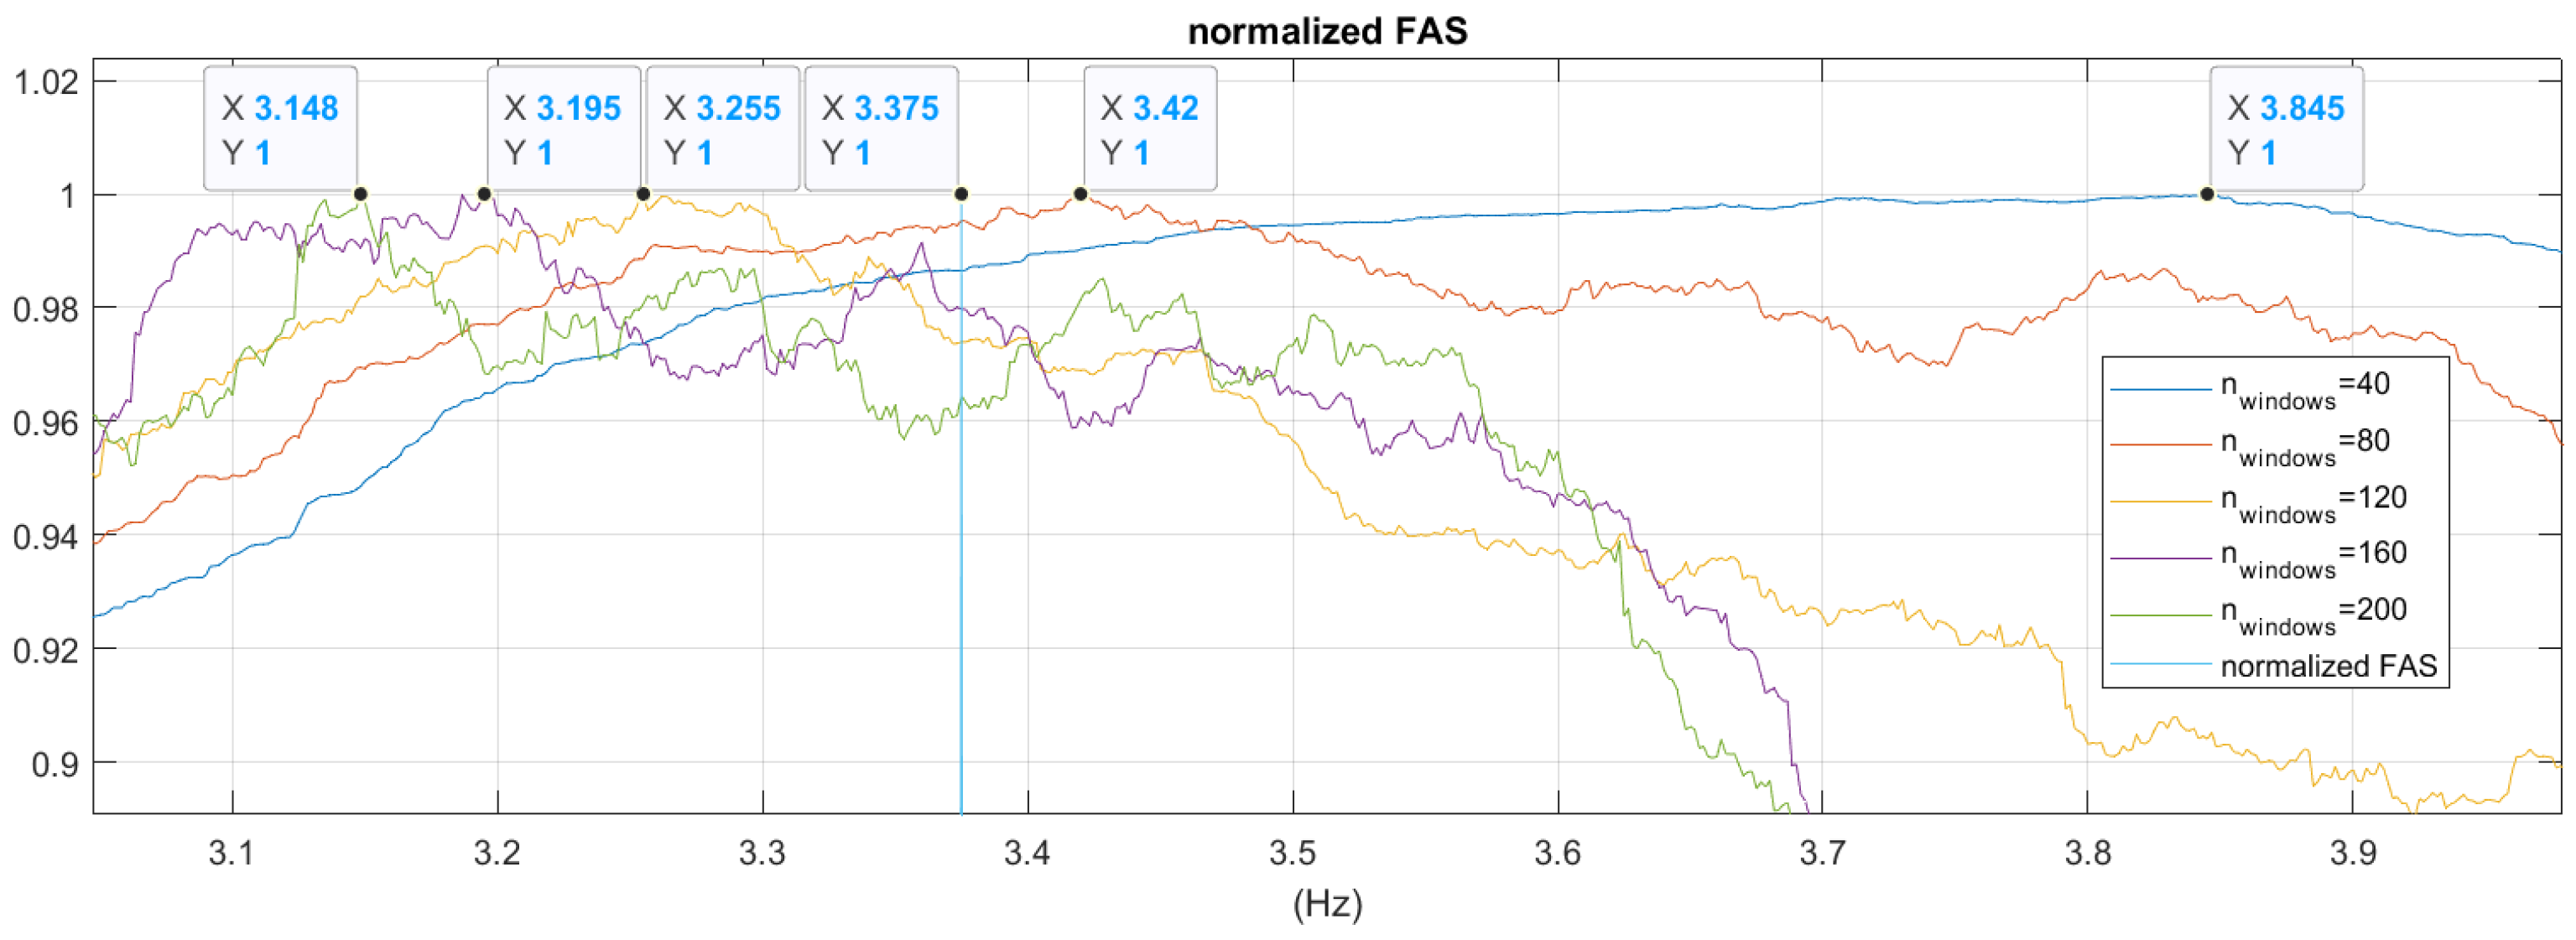
The importance of smoothing of the Fourier Amplitude Spectrum is further investigated using the smoothing procedure implemented in MATLAB by Kalkan [21]. A certain variation of the number of windows considered in the smoothing function is analyzed in this paper in an attempt to accurately determine the predominant frequency. Both the median and RMS methods suggested for smoothing by Kalkan [21] are implemented. The smoothed Fourier amplitude spectra for various numbers of windows is provided in Figure 6 (left), while the normalized comparison is provided in Figure 6 (right). The detail of the predominant frequencies obtained in the various smoothing scenarios analyzed in this paper is further illustrated in Figure 7 and Figure 8. A choice of the number of windows of 120 is equivalent to a window length of for the given recording, for which the entire duration is 600 s.
Figure 6.
The smoothed Fourier spectra (Median method) (left), the normalized smoothed spectra (right) of velocity recording 1250 CH1.
Figure 7.
Detail of the predominant frequency obtained from the normalized smoothed Fourier amplitude spectra (Median method) of the velocity recording 1250 CH1.
Figure 8.
Detail of the predominant frequency obtained from the normalized smoothed Fourier amplitude spectra (RMS method) of the velocity recording 1250 CH1.
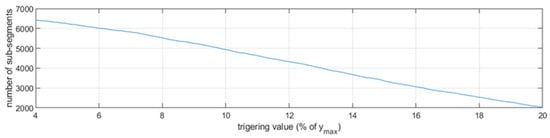
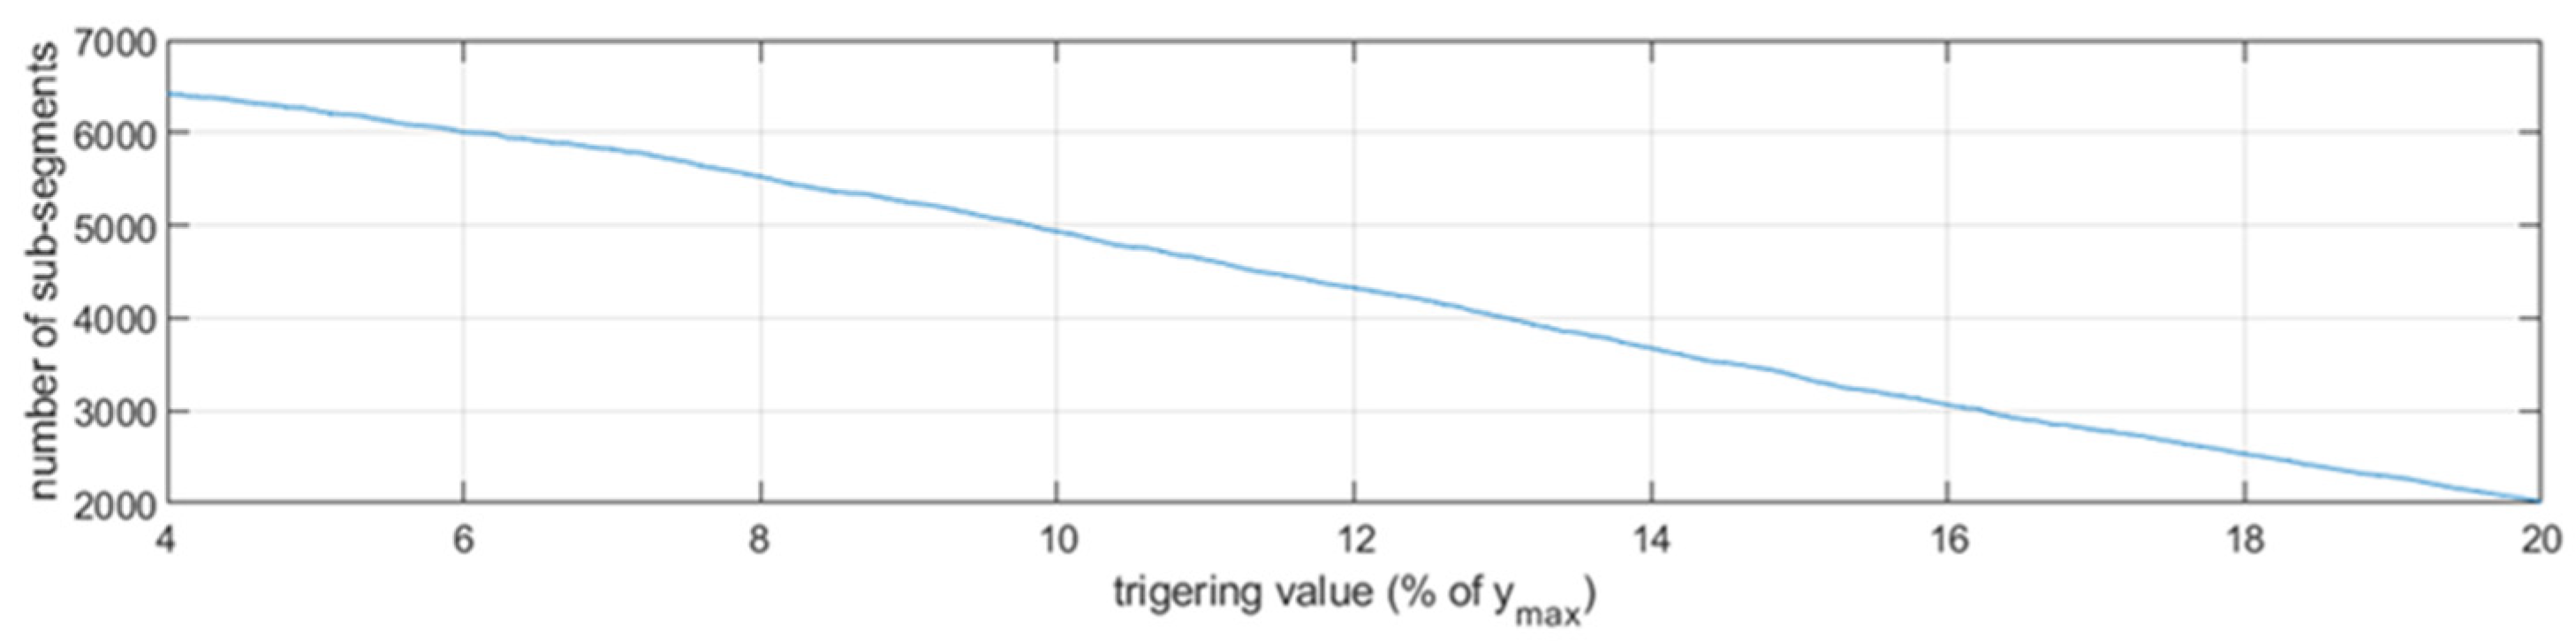
The fundamental frequency on the longitudinal direction is obtained by analyzing the smoothed Fourier spectra for all the corresponding recordings. The natural frequency is important for determining the length of the time window. The analysis uses a time window equal to four times the natural period determined from the Fourier spectrum. Therefore, a time window is used, which corresponds to a sequence of 119 data points following the determined triggering value. The triggering value itself is considered to be a parameter in this paper, which ranges in the interval 4–20% out of the maximum absolute value of the analyzed recording , with an increment of 0.1%. Consequently, 160 different triggering values are used to analyze each recording. The Random Decrement Technique function developed in MATLAB by E. Cheynet [20], is further employed to split the velocity recording into a series of recordings having the above-mentioned duration of the time window. Each sub-segment recording starts once the difference between two consecutive data points in the original velocity recording exceeds the desired triggering value. Hence, the sub-segments having the desired time window can overlap Figure 9.
Figure 9.
The variation of the number of considered sub-segments as the triggering value increases.
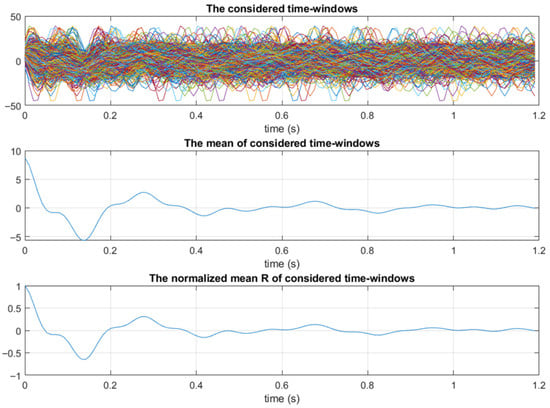
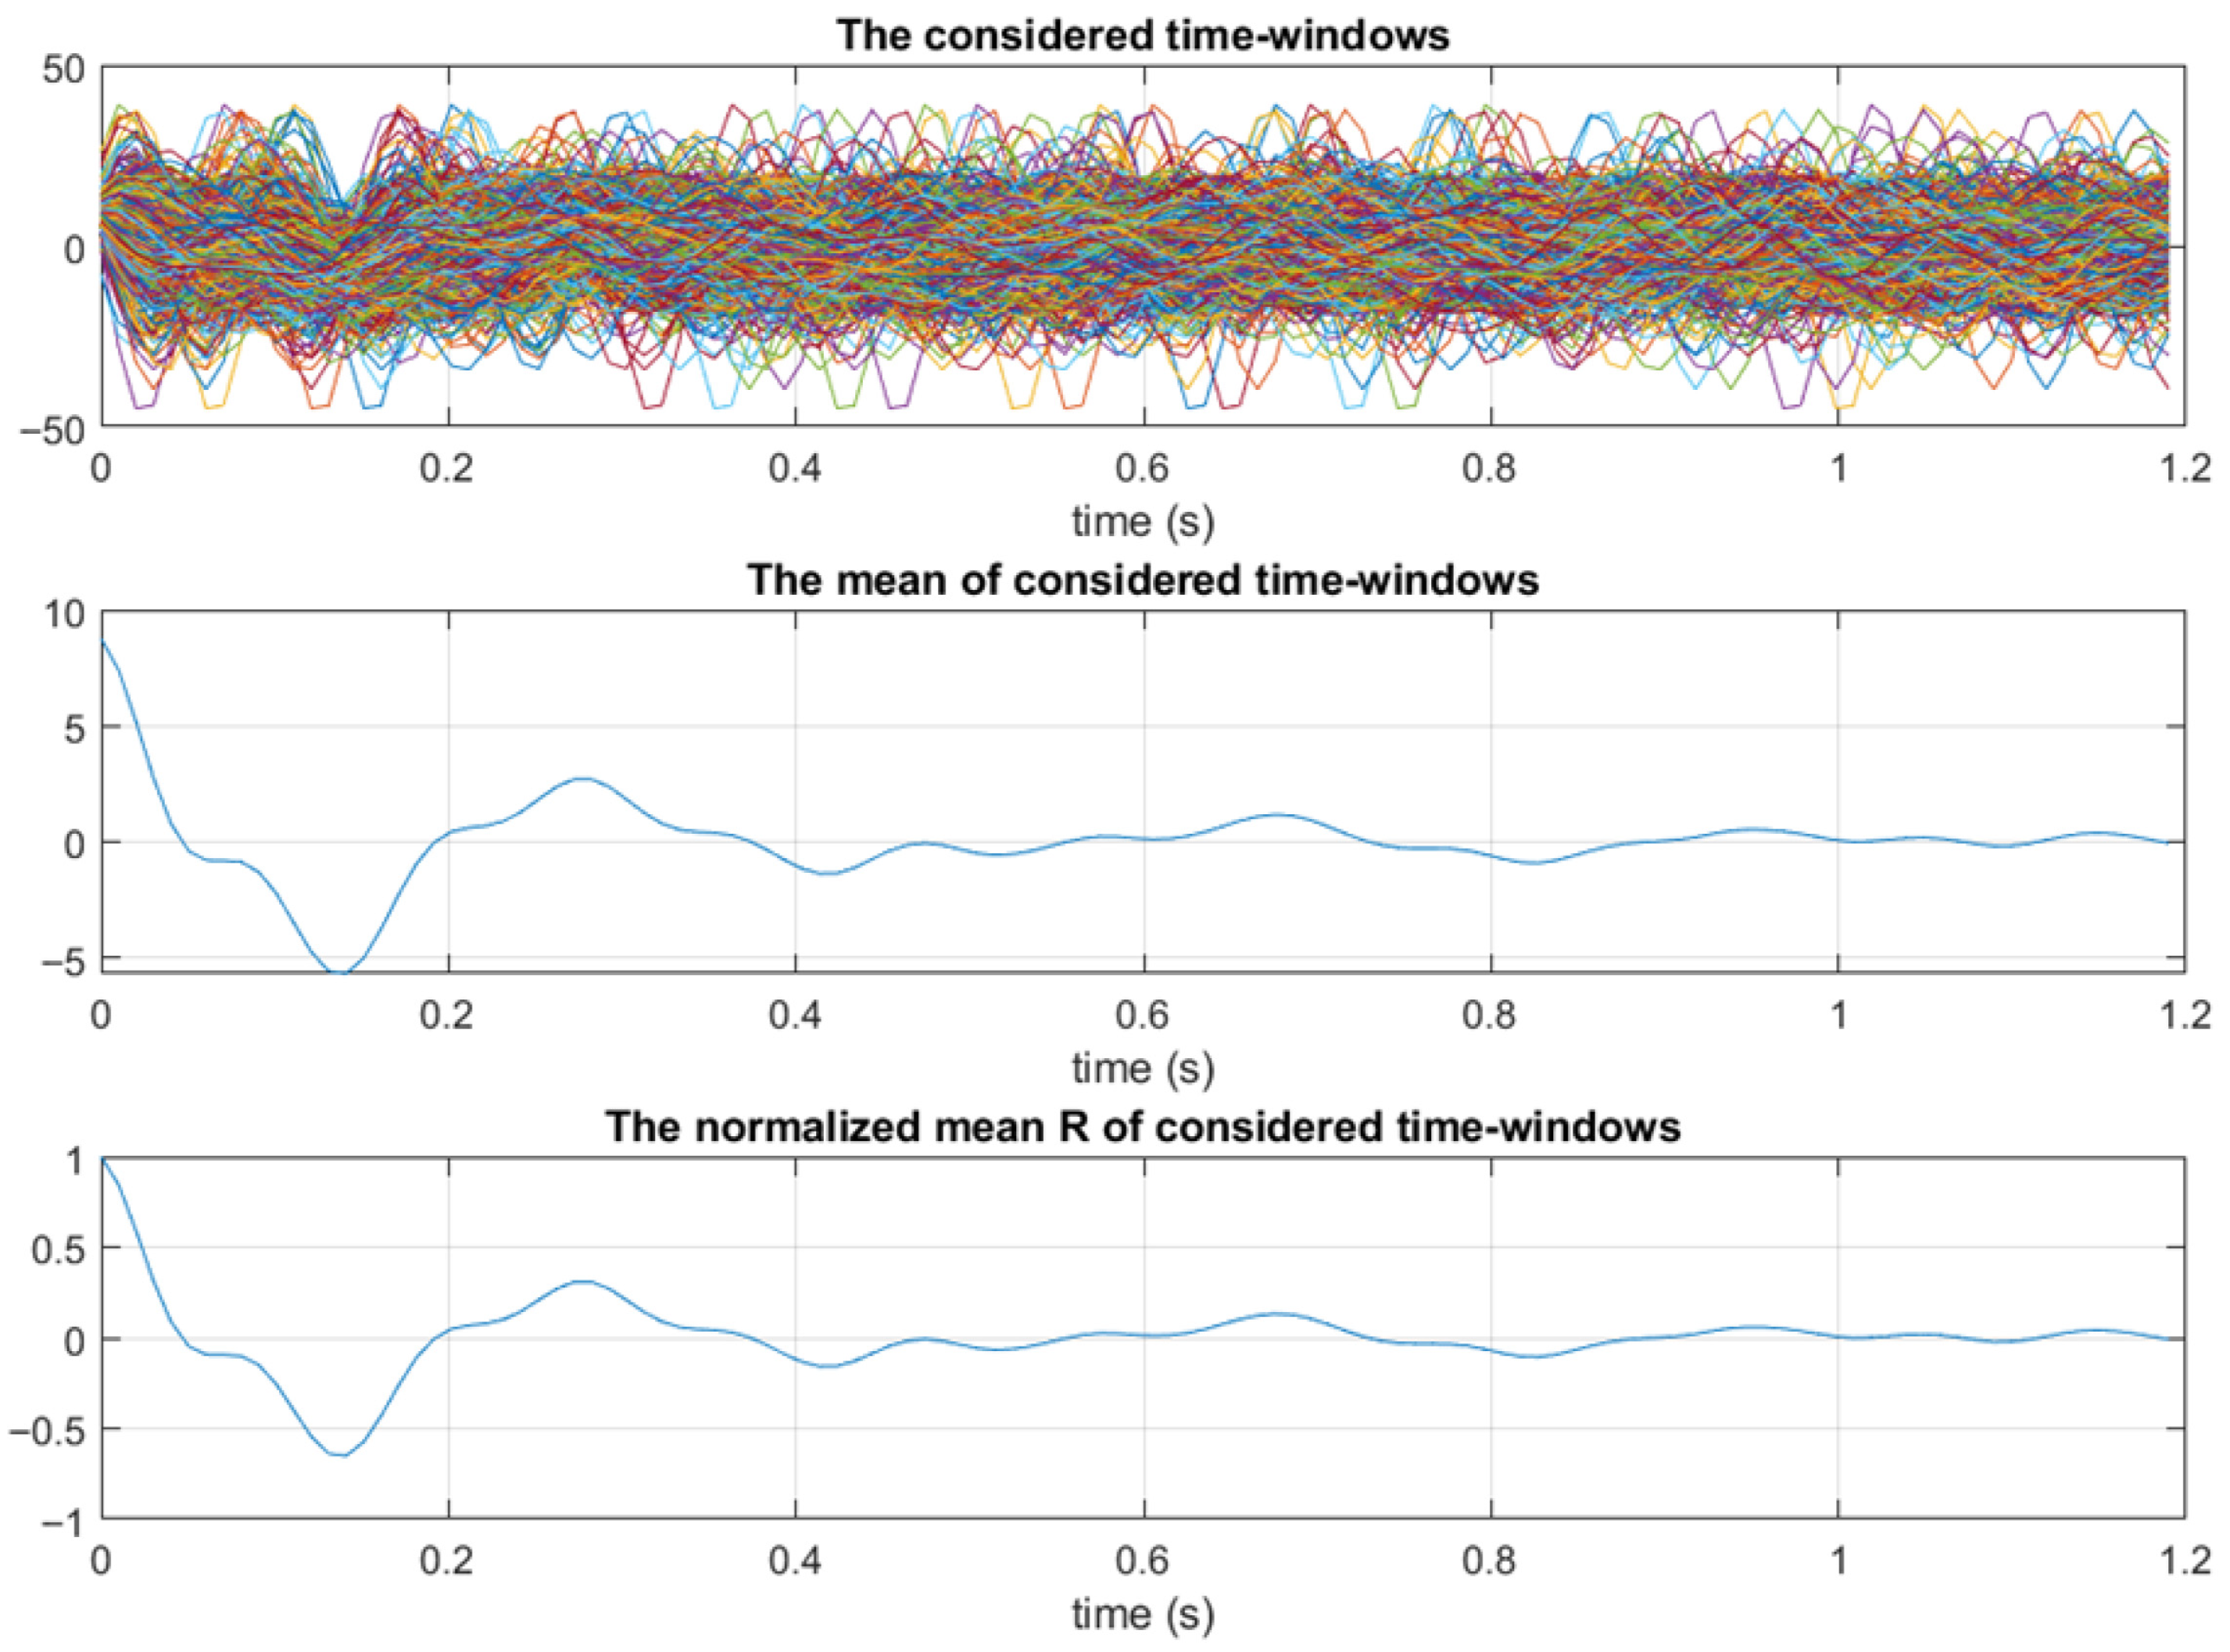
In order to eliminate the random part of the response, the 2016 sub-segments obtained for a triggering value are superposed, as illustrated in Figure 10 (top). The final RDT signature, R, is calculated by taking the mean across all rows of the segment matrix, S:R = mean (S). The mean and the corresponding normalized mean are also illustrated in Figure 10.
Figure 10.
The 2016 sub-segments considered when (top), the mean of the 2016 sub-segments (middle), and the normalized mean R (bottom).
The figure illustrates the variation of the number of considered sub-segments as the triggering value increases. Therefore, a triggering value of 20% out of the maximum absolute value in the recording will conduct to a split of the signal 1250 CH1 into 2016 sub-segments, each having a length of 1.19 s.
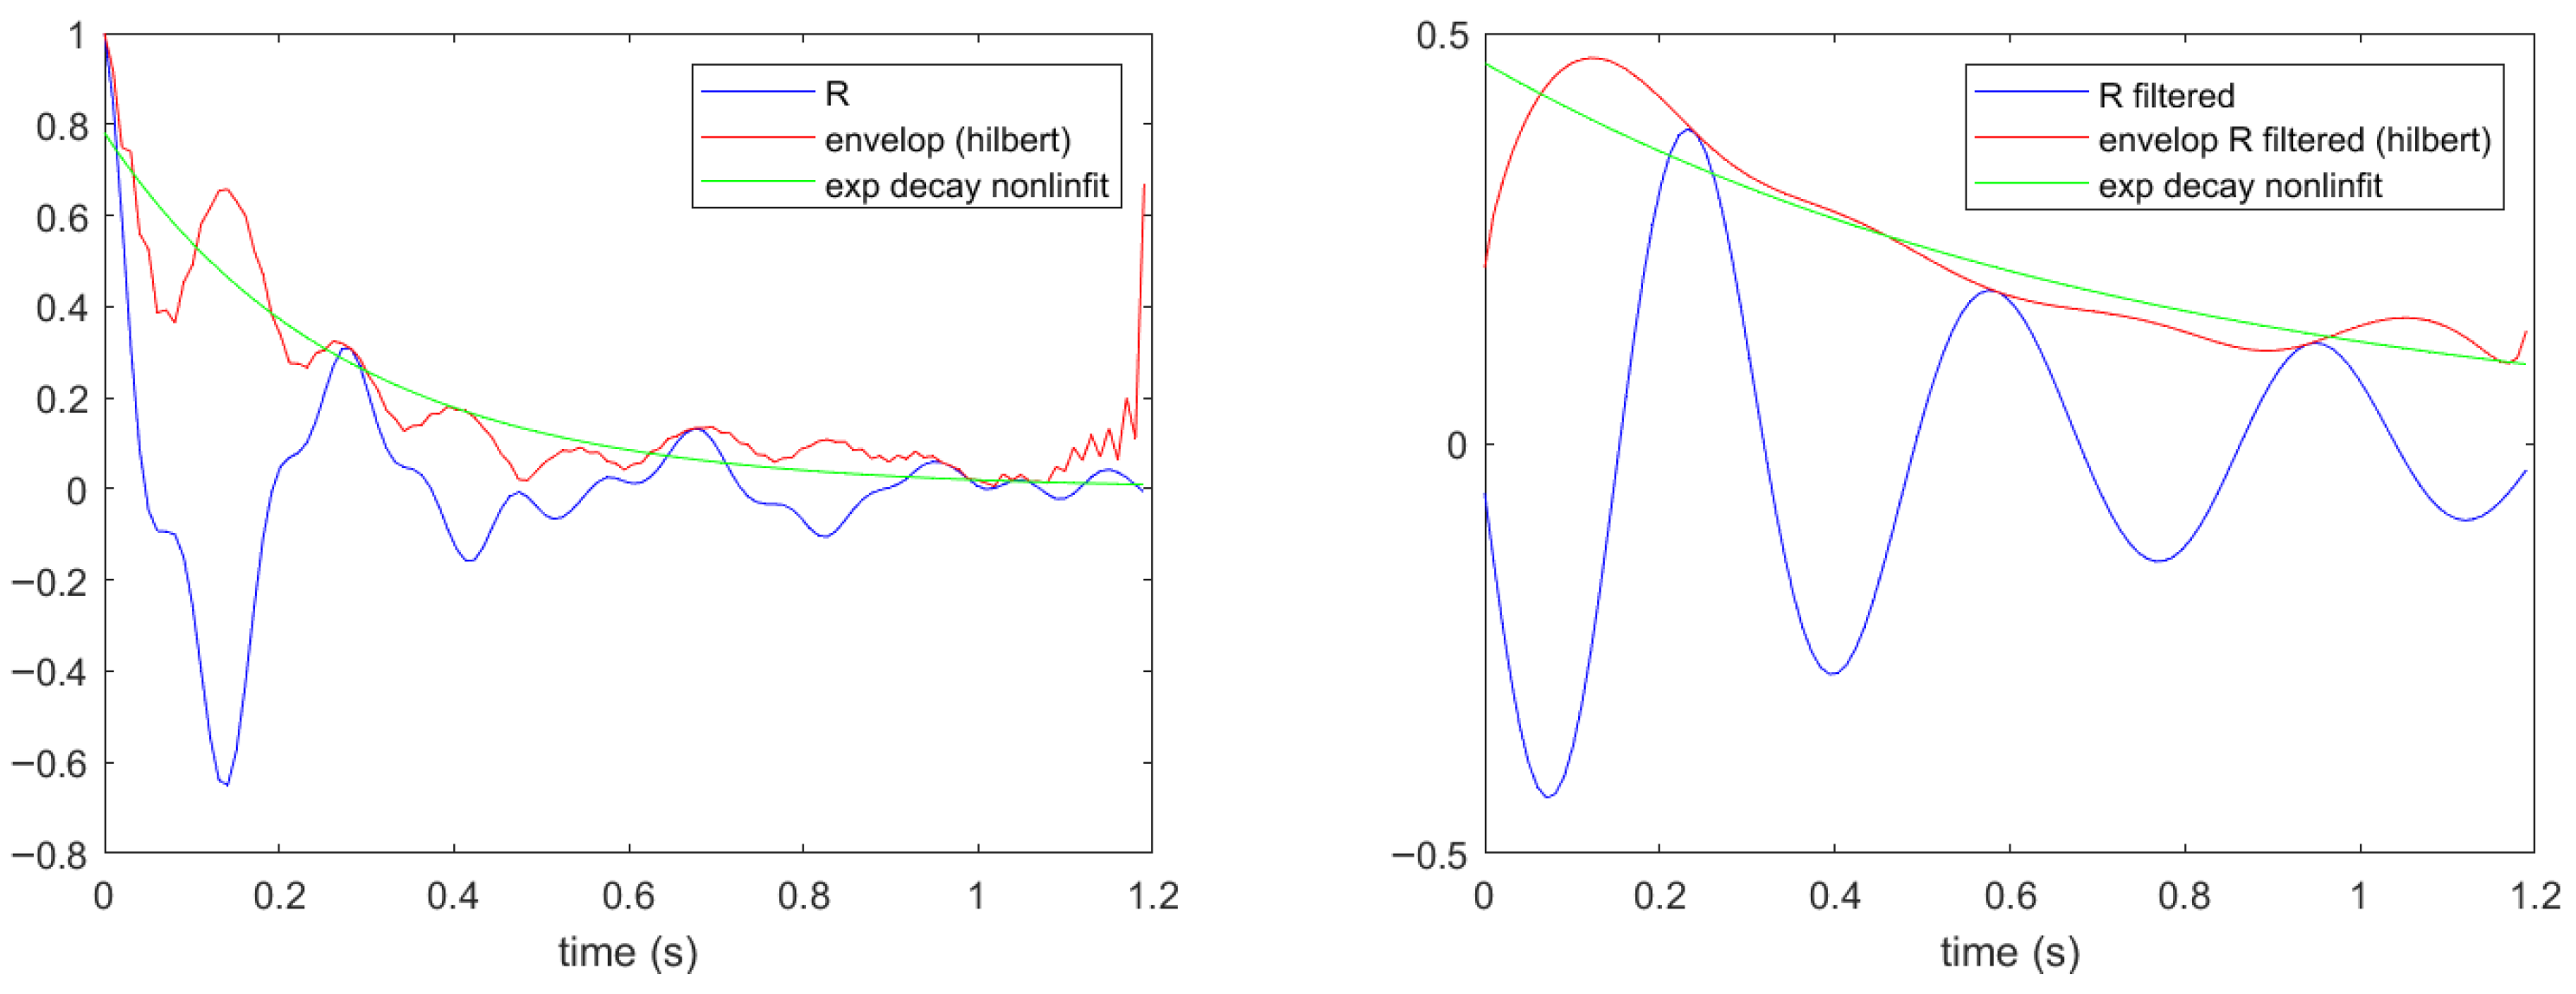
The normalized mean illustrated in Figure 10 is further filtered using the bandpass filter available in MATLAB, for a range of values ±20% in the vicinity of the fundamental frequency . In this paper, both the original mean and the filtered mean are further analyzed to estimate the damping ratio. Following E. Cheynet [20], a Hilbert envelope is computed first, for both original and filtered RDT signatures. Secondly, the coefficients of an exponential decay function of type
are computed using the nonlinear fit function applied to the Hilbert envelope. The determined fundamental frequency plays a key role at this final step, since the coefficient is actually the product between the unknown damping ratio and the fundamental circular frequency. Once the fit function is determined and the fundamental frequency is known, the determination of the damping ratio is straightforward.
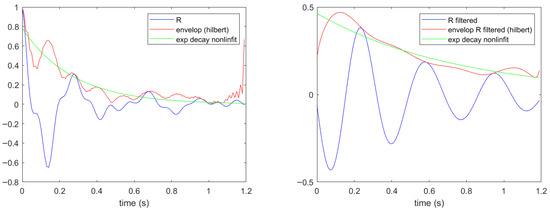
The left side of Figure 11 illustrates the envelope of the original mean and the exponential decay fit. The right side of Figure 11 illustrates the effect of the filtering of the mean signal around the fundamental frequency .
Figure 11.
The exponential decay fit on the normalized mean R (for ) (left), the exponential decay fit on the filtered normalized mean (right).
3. Results
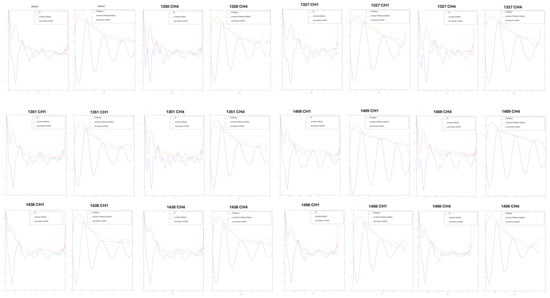
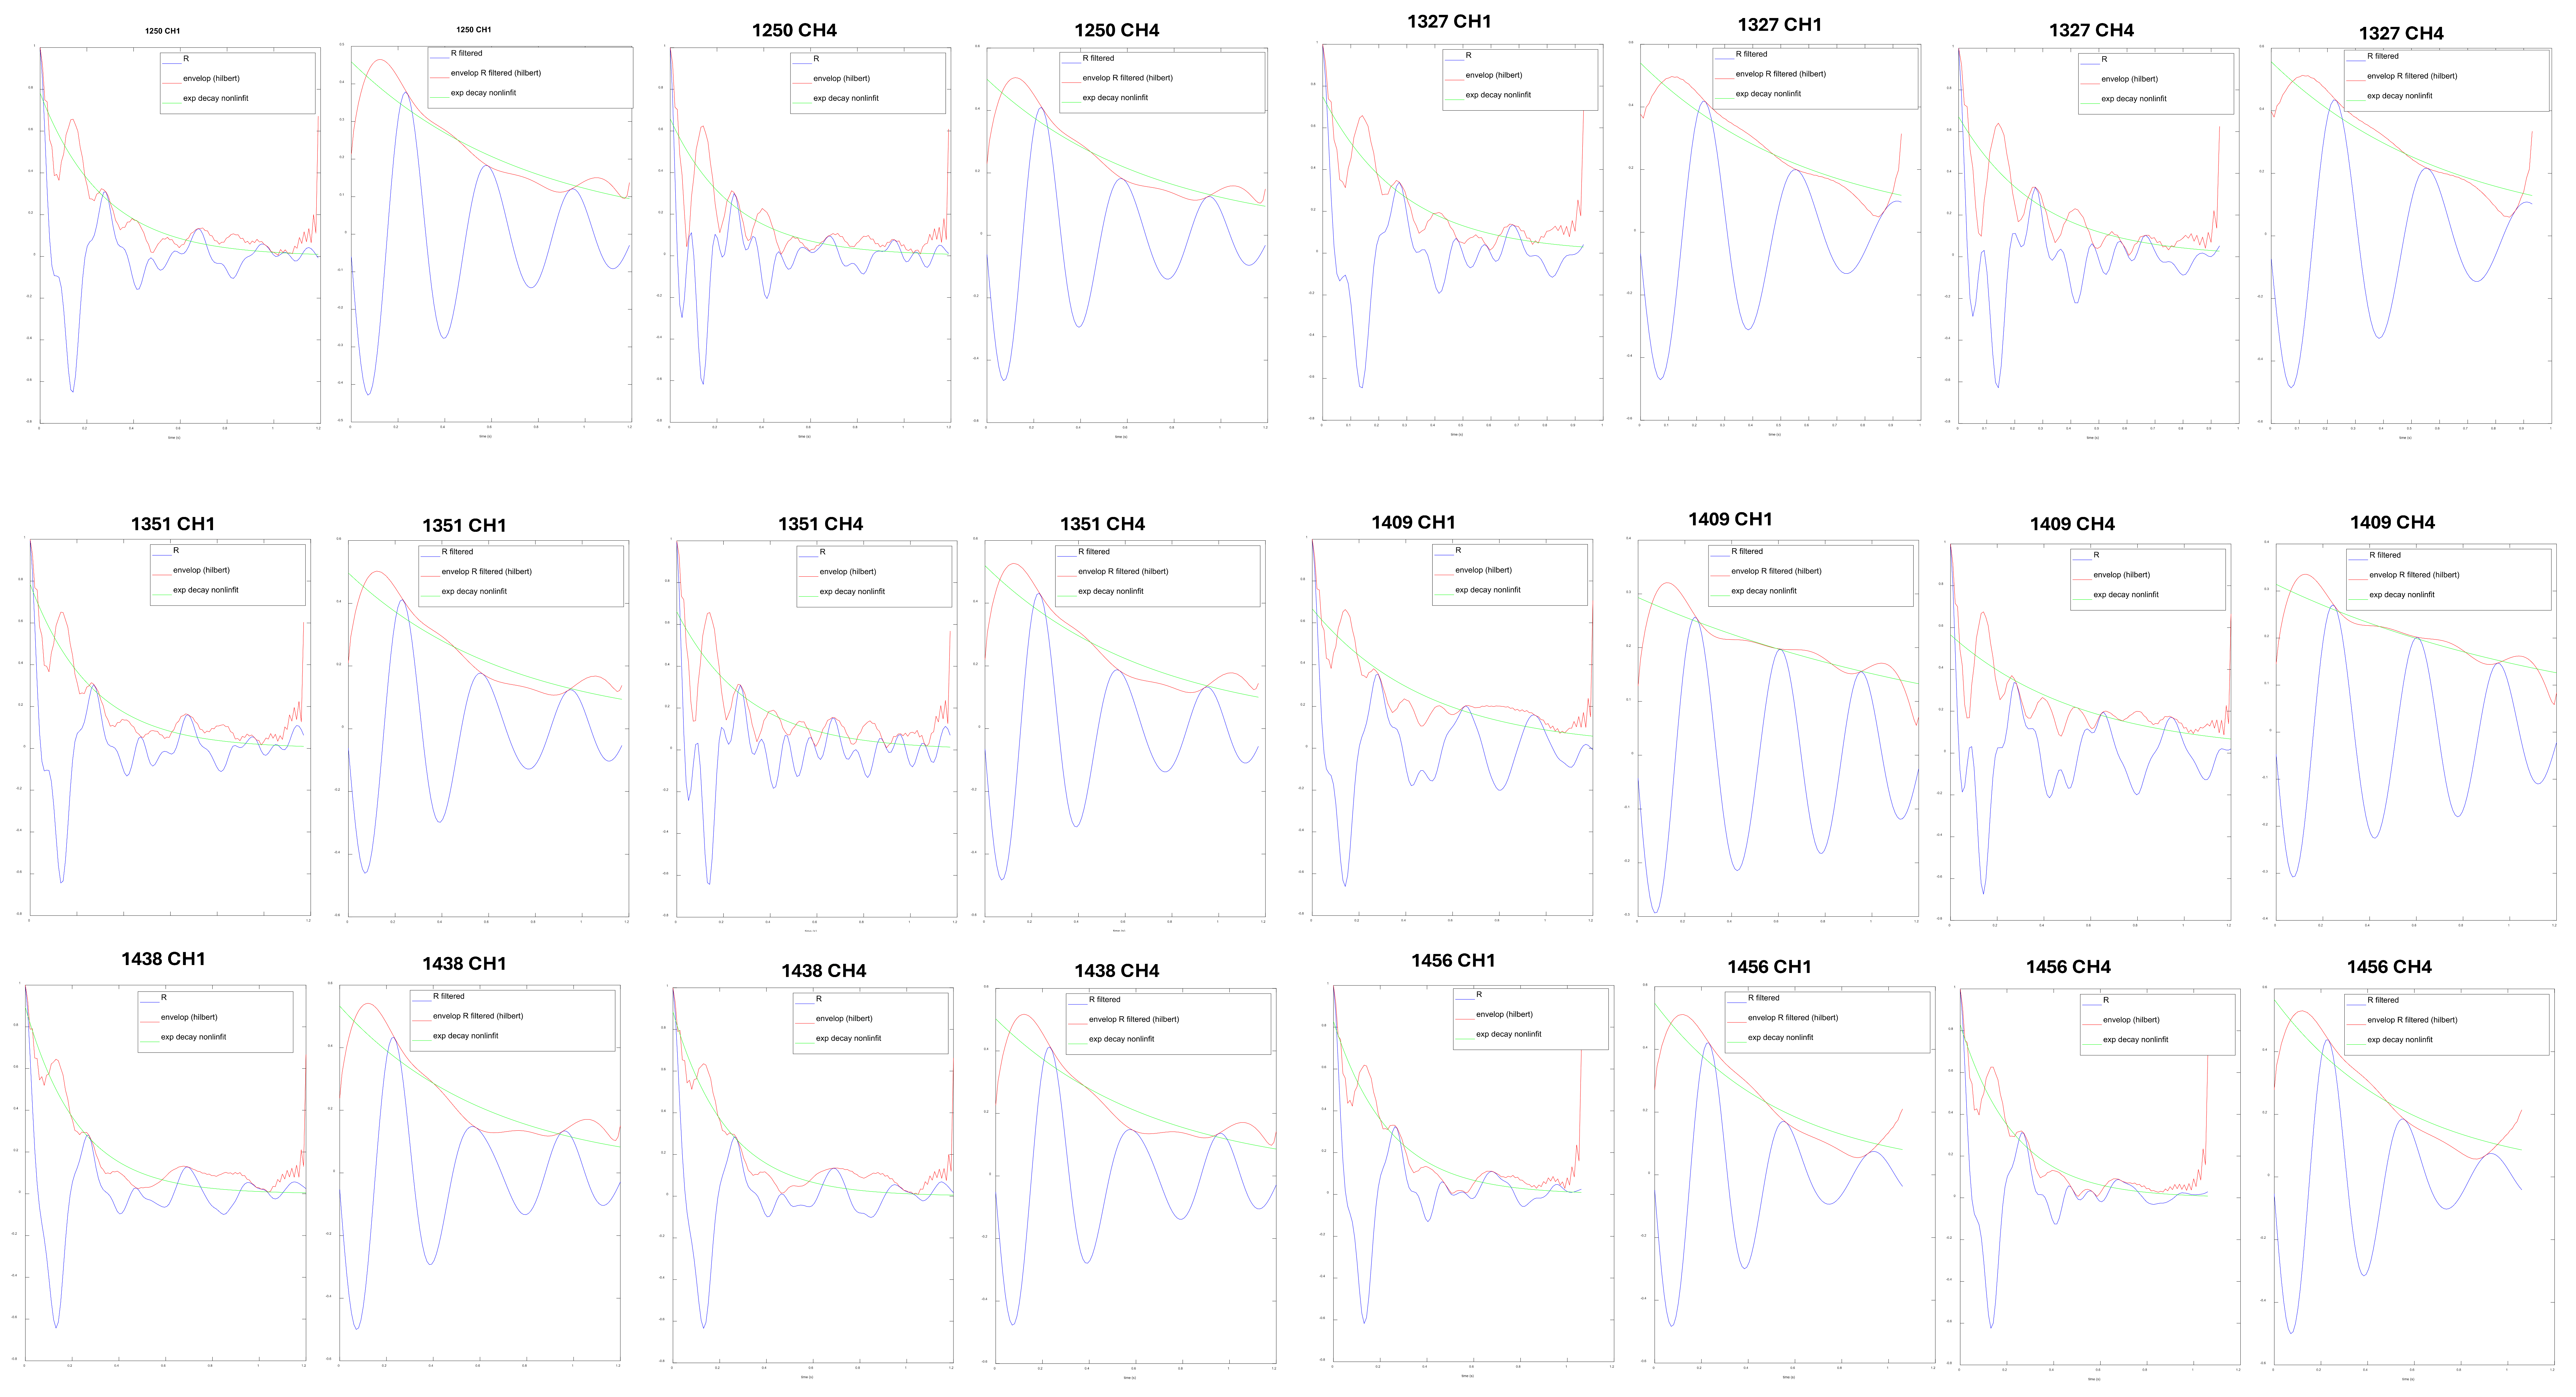
The mean and the exponential decay fit are determined for all recordings on the longitudinal direction. Both unfiltered and filtered functions of RDT signature, as well as the exponential fit functions, are provided in Figure 12. Filtering was found to be necessary because the normalized RDT signature contained multiple frequency components. The filtering was done using the bandpass filter in the vicinity of the fundamental frequency identified from all the recordings on the longitudinal direction.
Figure 12.
The exponential decay fit on the normalized mean R (for ) and the exponential decay fit on the filtered normalized mean for longitudinal direction.
We have analyzed several options for the bandpass range and ±20% seems to be large enough not to stabilize artificially the resulting damping ratio. A filtration quality check can be seen in Figure 11 and Figure 12, where the filtered R function exhibits the characteristics of damped free oscillations.
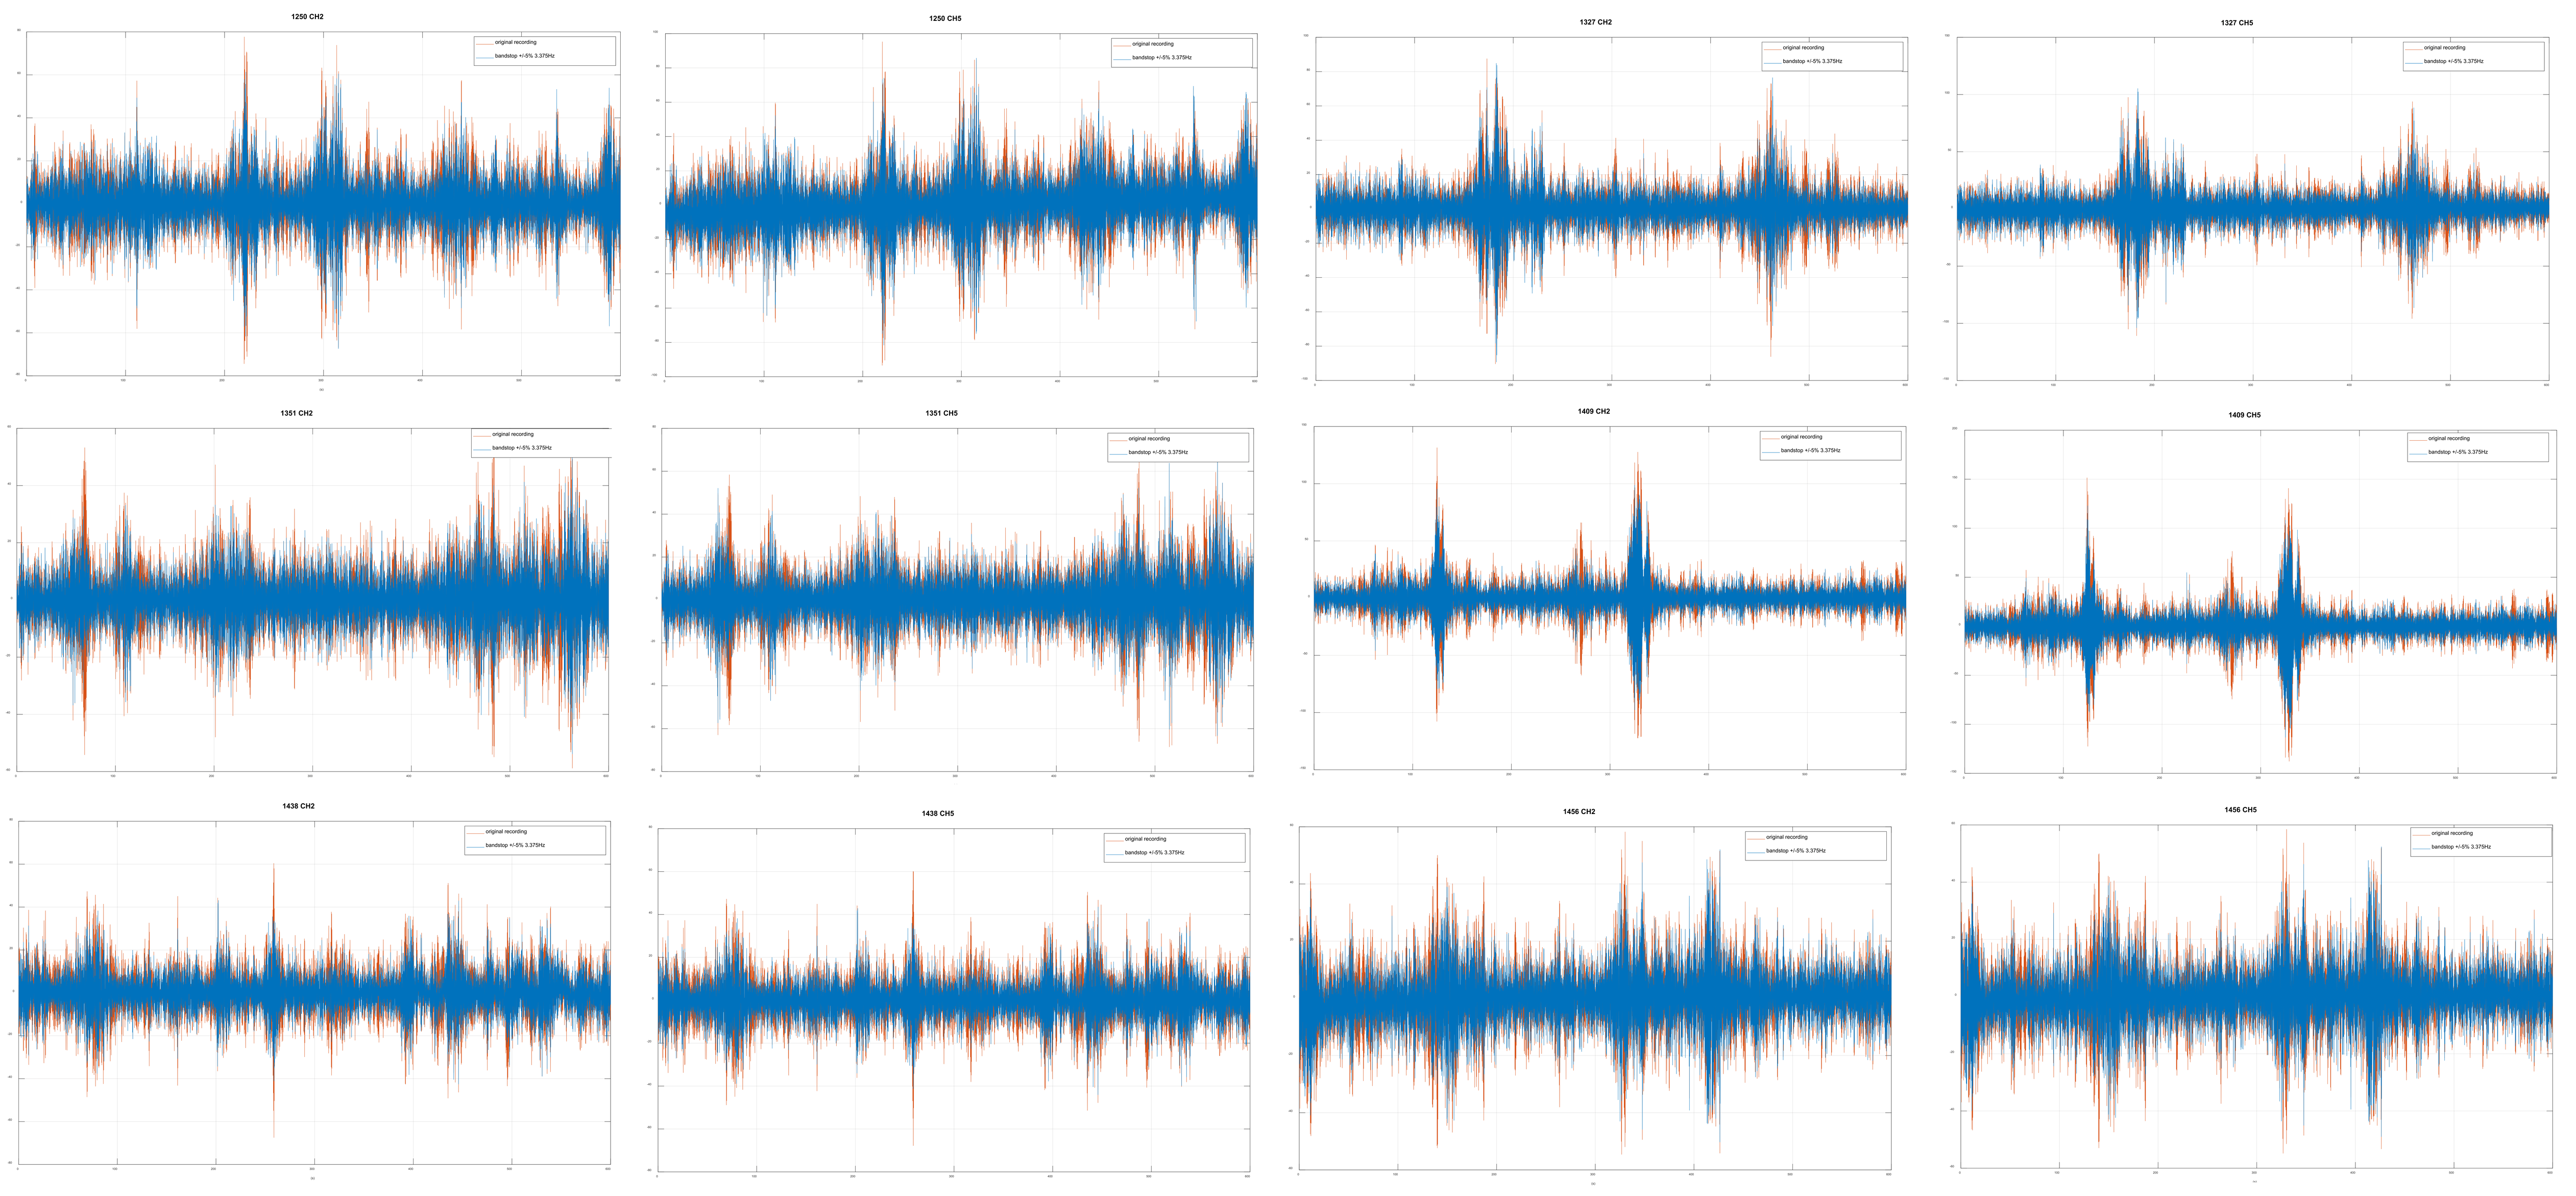
By inspecting the Fourier spectrum for the recordings on the transversal direction a filtering was found to be necessary prior to applying the algorithm previously described. Thus, the time histories of the velocities on transversal direction were modified by filtering out a bandwidth of frequencies of ±5% from the natural frequency on the longitudinal direction. The resulting time histories are illustrated in Figure 13. The natural frequency on the transversal direction was determined .
Figure 13.
The modified recordings on the transversal direction.
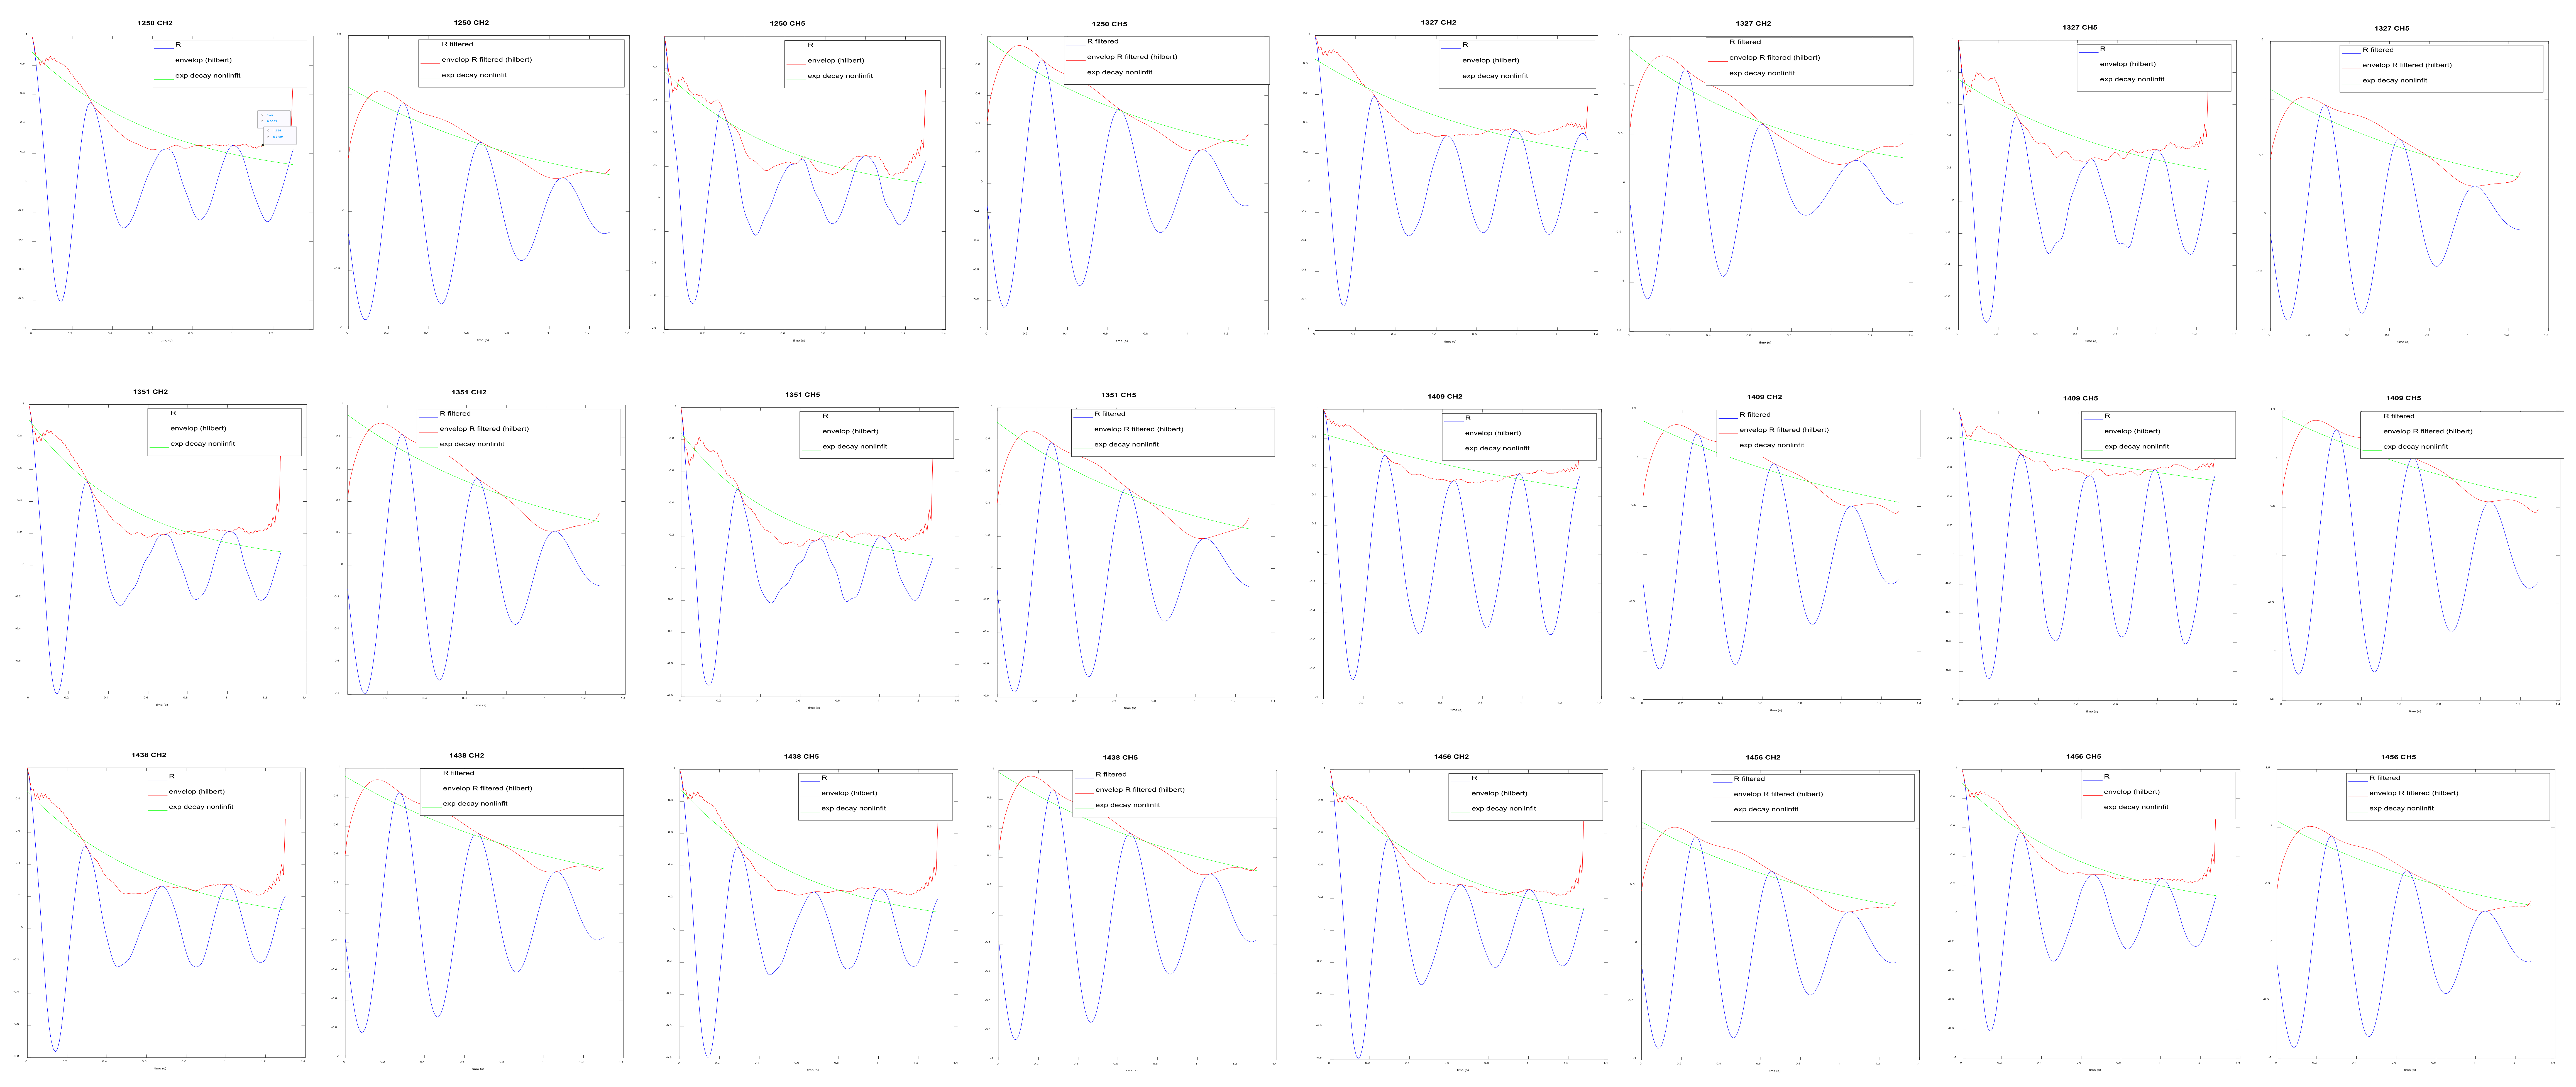
The mean and the exponential decay fit are determined for all modified recordings on transversal direction. Both unfiltered and filtered functions of RDT signature, as well as the exponential fit functions, are provided in Figure 14.
Figure 14.
The exponential decay fit on the normalized mean R (for ) and the exponential decay fit on the filtered normalized mean for transversal direction.
The purpose of this paper is to examine the variability in key parameters within the RDT to estimate the damping ratio. Specifically, it investigates the choice of the triggering value and assesses the robustness of the RDT method.
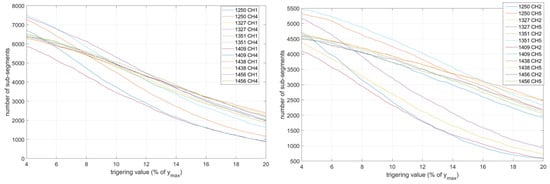
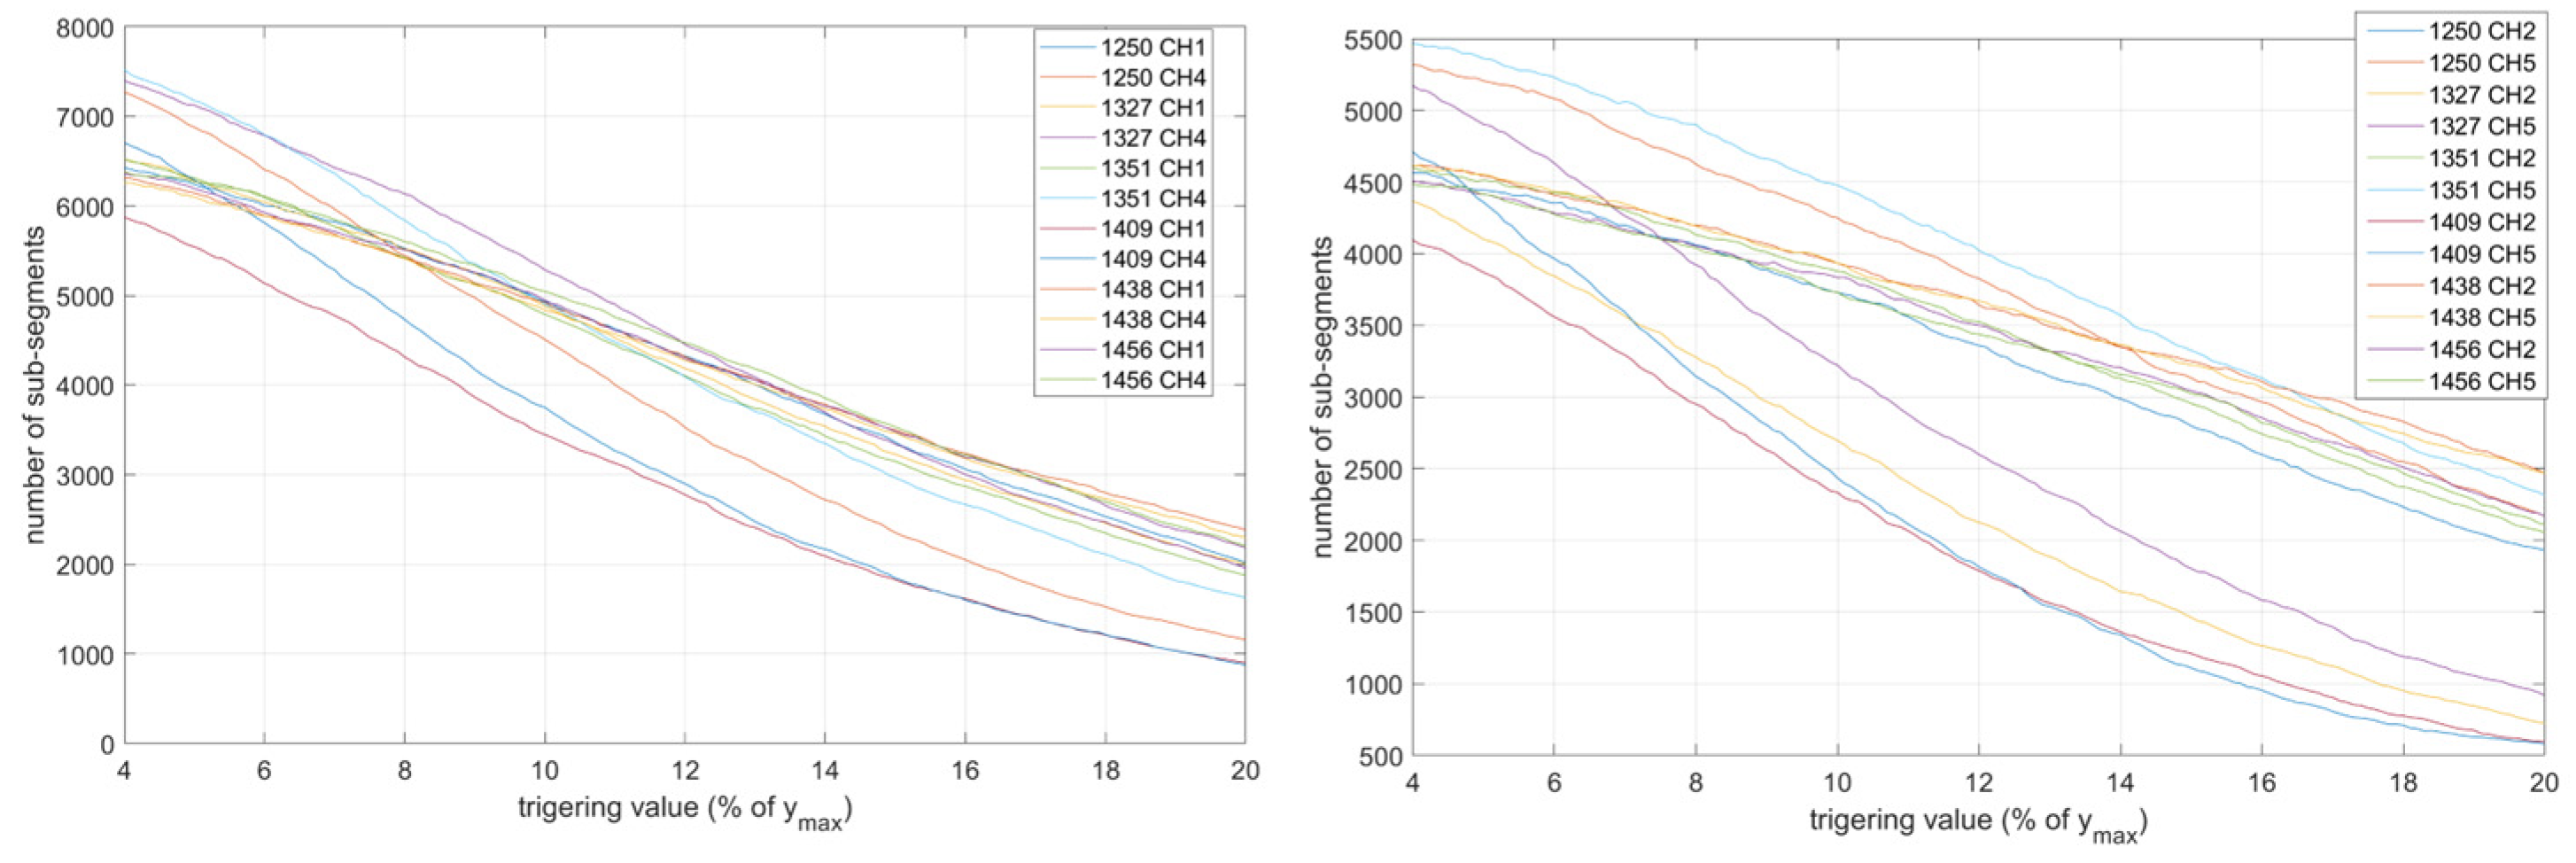
The influence of the triggering value on the number of sub-segments used to compute the RDT signature for all the recordings is represented in Figure 15. As the triggering value increases from 4% to 20% of , a reduction in the number of sub-segments falling within the range of 7000–1000 is observed.
Figure 15.
The influence of the triggering value on the number of sub-segments for longitudinal direction (left) and transversal direction (right).
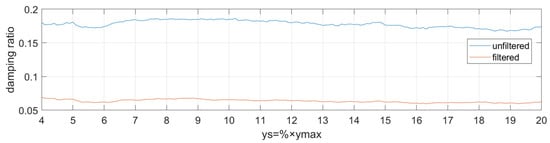
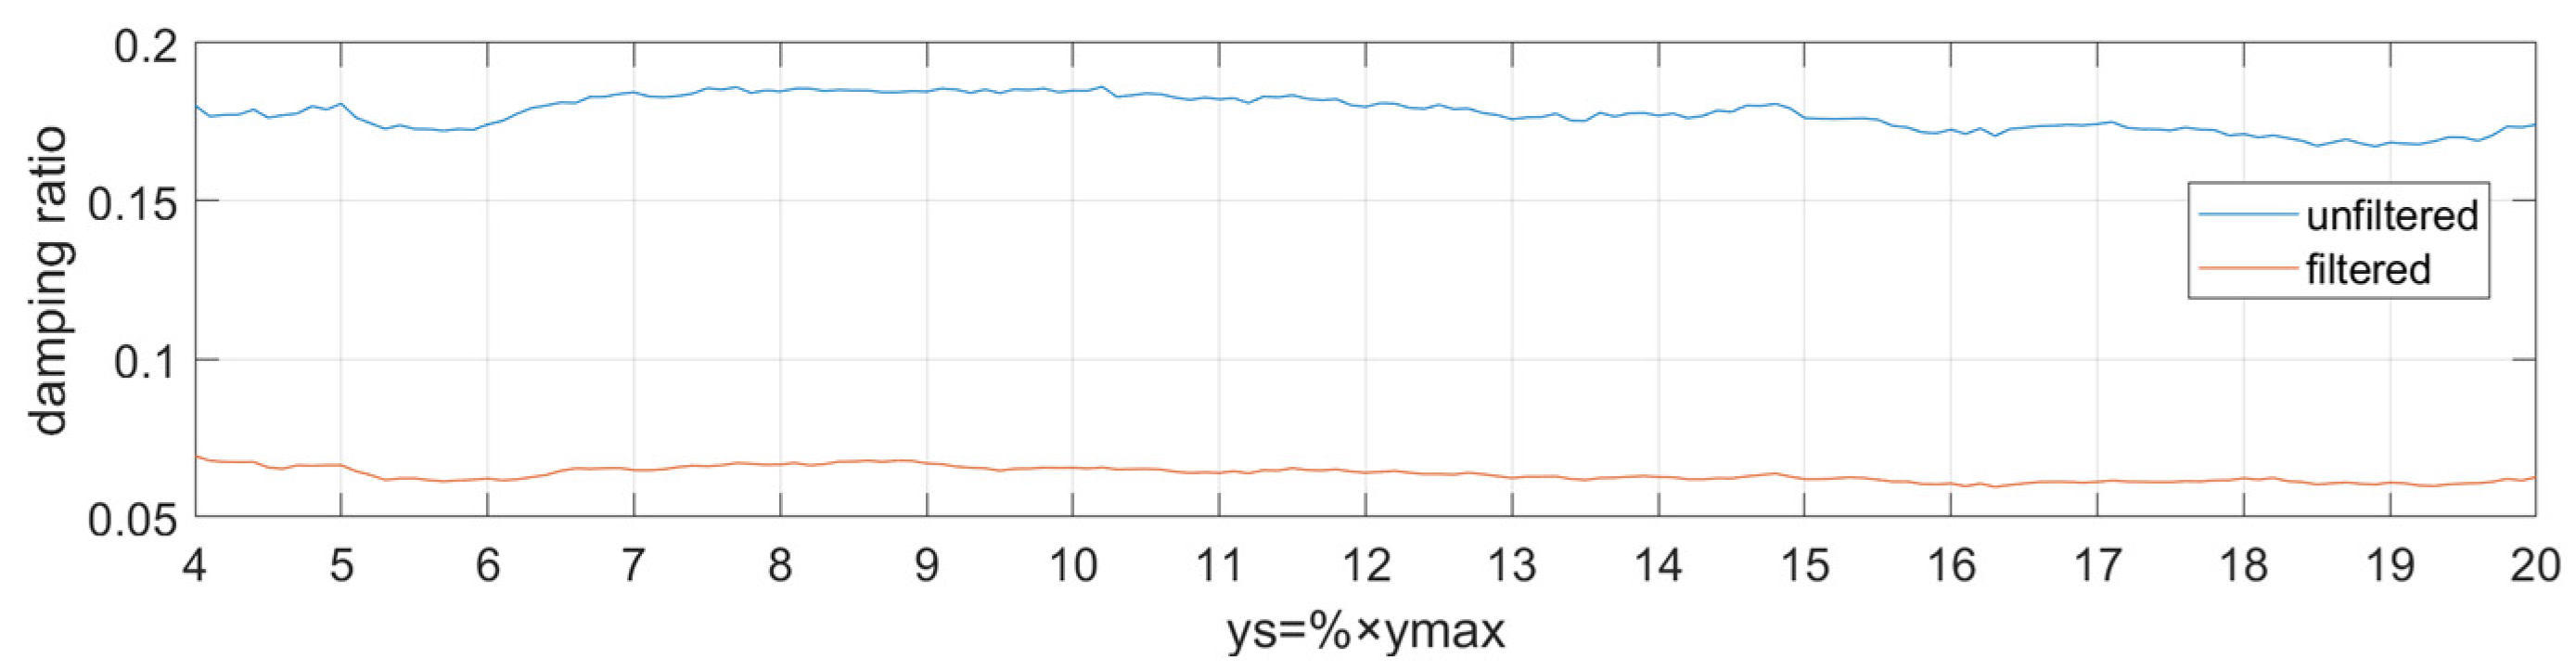
The influence of the choice of the triggering value on the computed damping ratio is further analyzed by considering it in the range . The process described in Section 2 is repeated for each triggering value within the specified range. Therefore, in the case of the recording 1250 CH1, the influence of the choice of the triggering value in the range is illustrated in Figure 16, for both the unfiltered and filtered RDT signatures. The graph in Figure 16 indicates that, within reasonable limits, the triggering value does not play a significant role in determining the value of the damping ratio. In addition, the effect of the proposed filtering can produce data which fall into the range of expected results.
Figure 16.
The variation of the computed damping ratio for different triggering values.
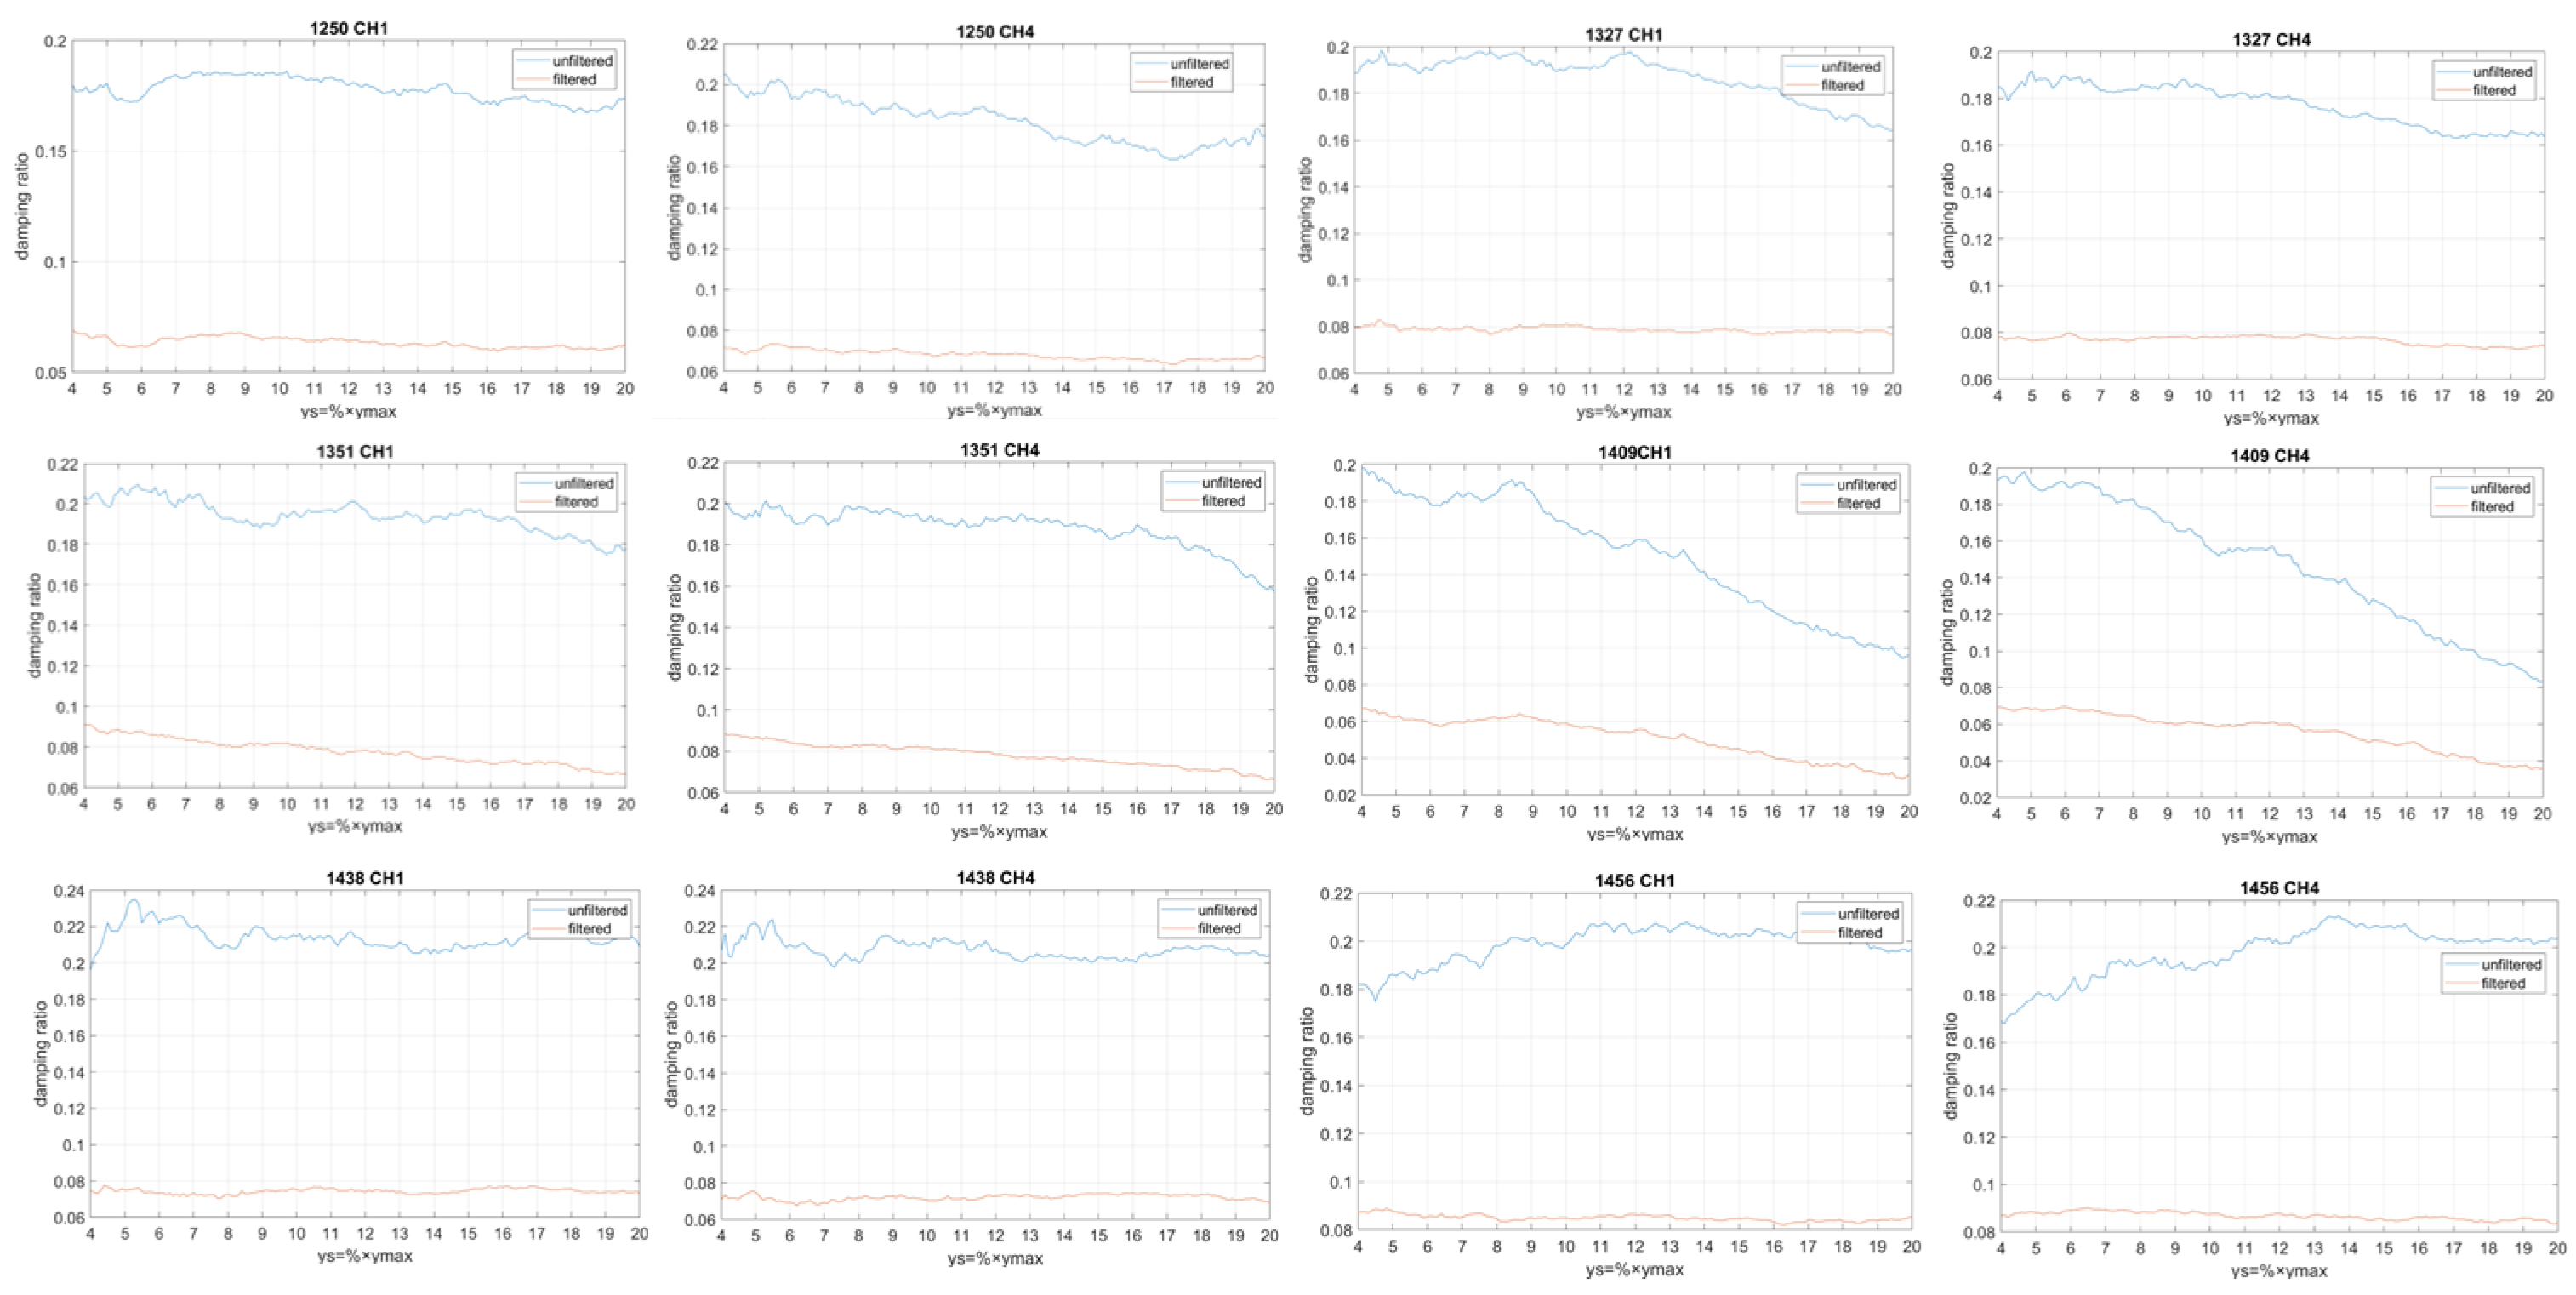
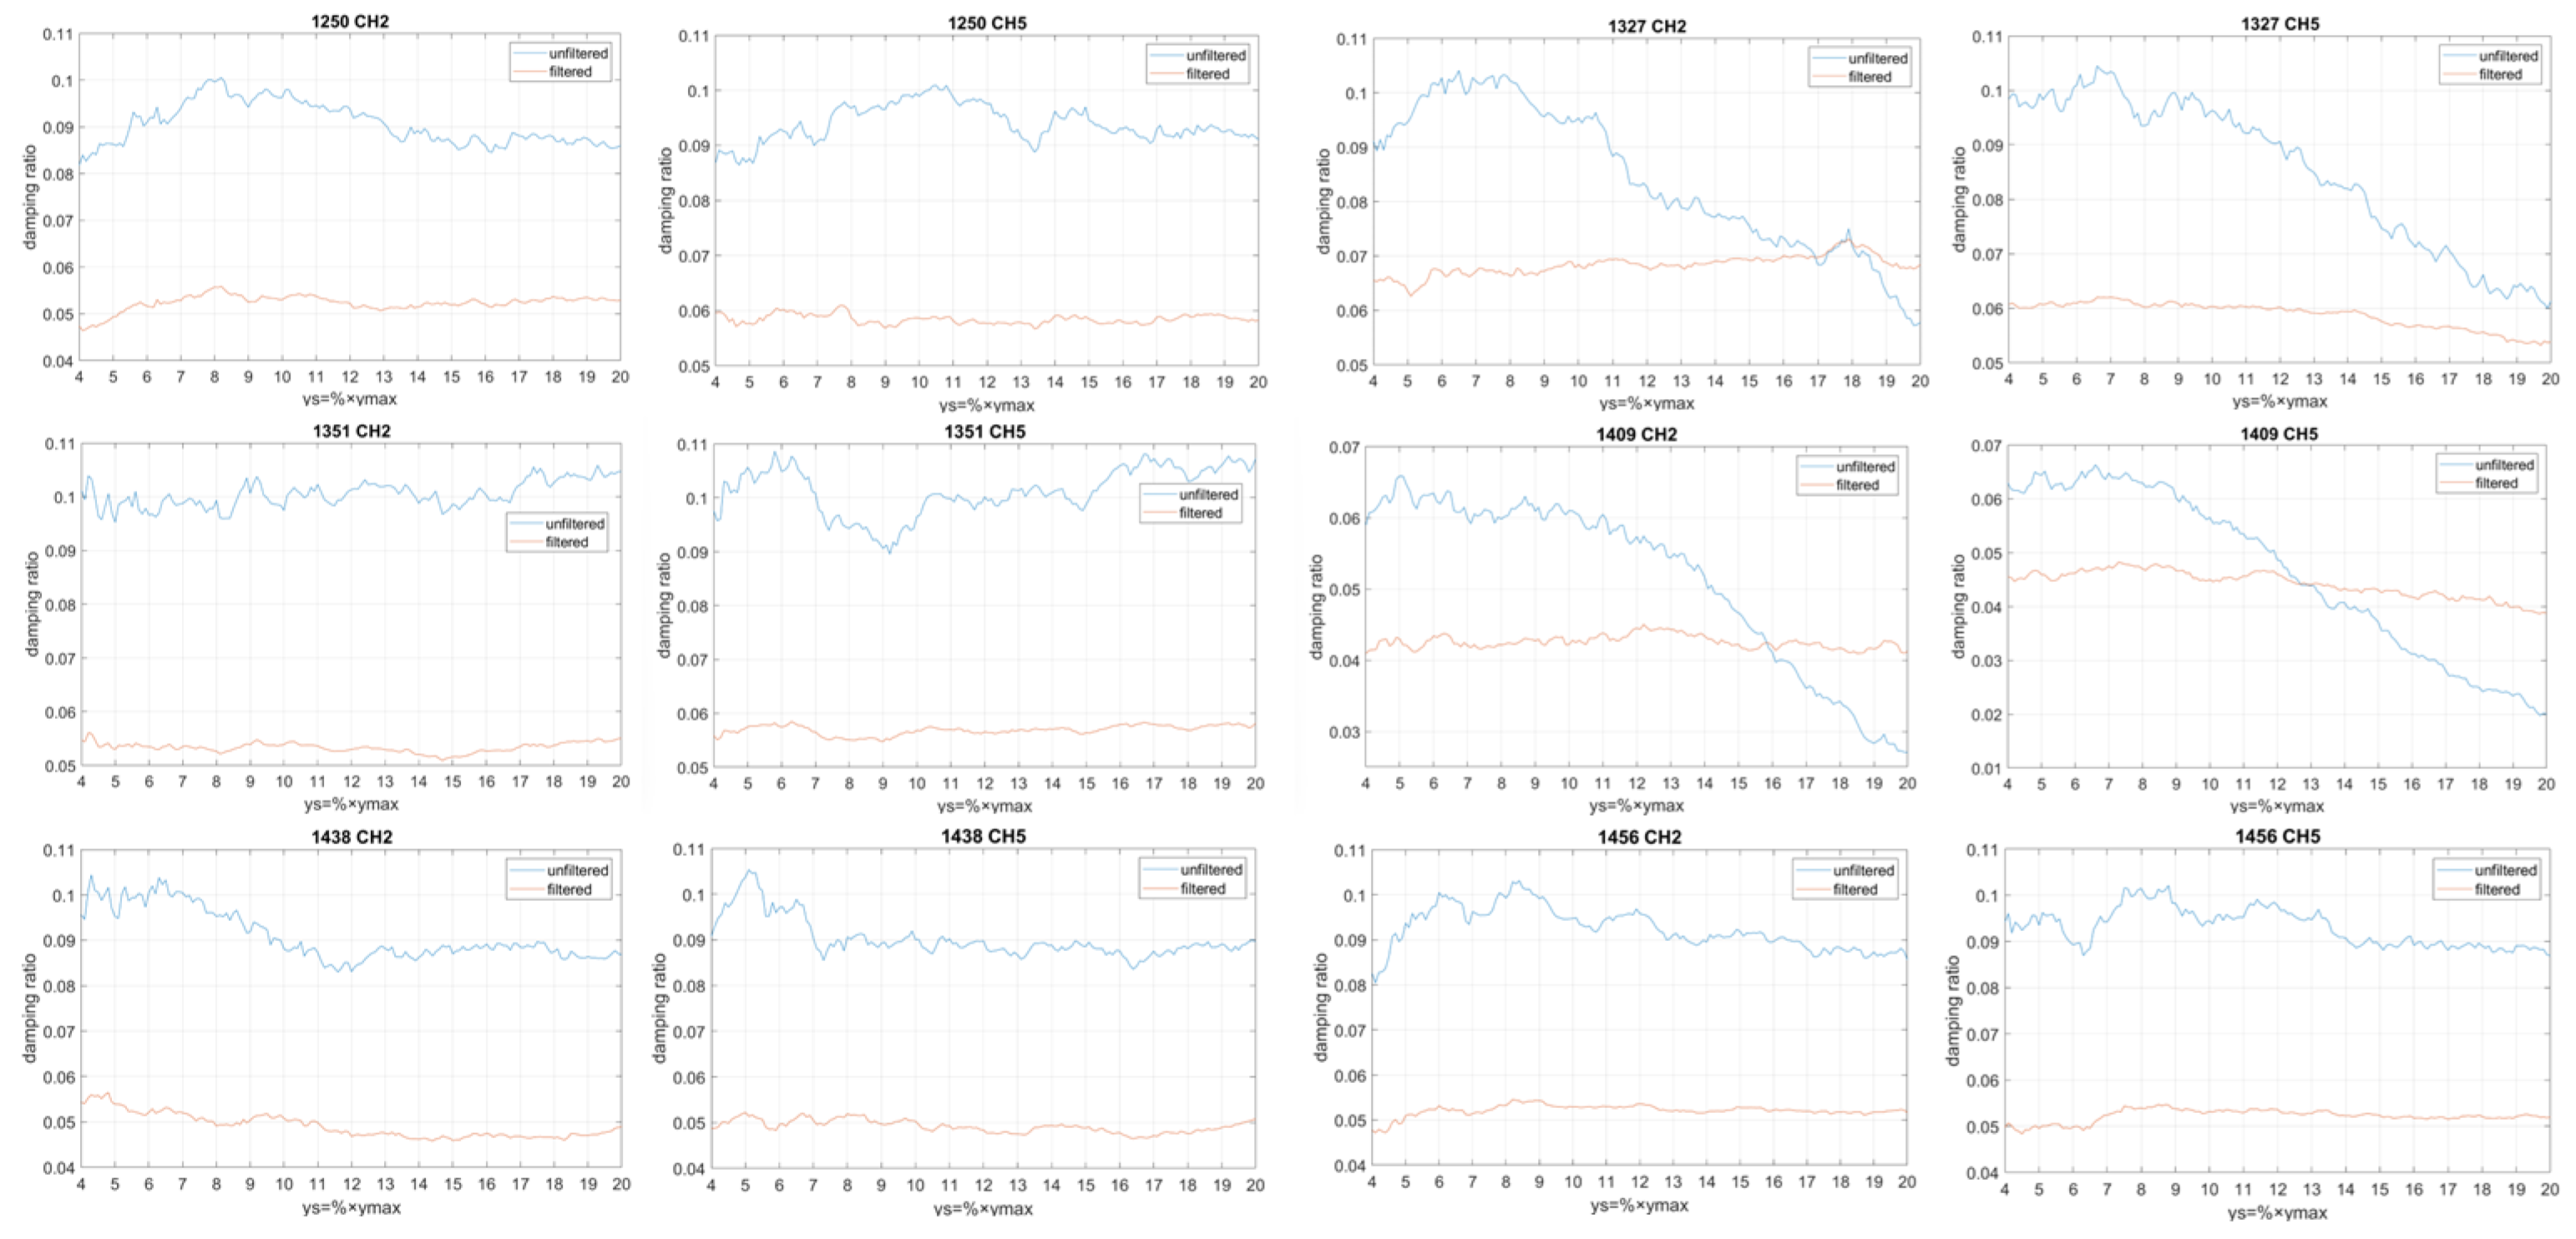
The stability of the resulting damping ratio is investigated for the mentioned velocity recordings and represented in Figure 17 and Figure 18. The inconsistencies observed in Figure 18 for the recordings 1327 CH2, 1327 CH5, 1409 CH2 and 1409 CH5 will be further discussed in Section 4.
Figure 17.
Longitudinal direction: computed damping ratio for different triggering values.
Figure 18.
Transversal direction: computed damping ratio for different triggering values.
The values for damping ratio extracted from the 24 velocity recordings reflect the subsidiary aim of this paper. For each of the 24 recordings, the value of the damping ratio values were calculated as the mean value, taking into account the variation of the triggering value presented above, as well as the filtering around the fundamental frequency. The results are presented in Table 1.
Table 1.
Damping ratio values for the filtered case (L = longitudinal, T = transversal).
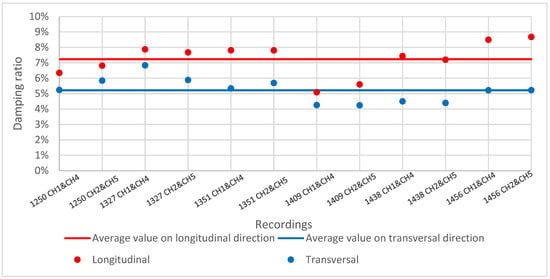
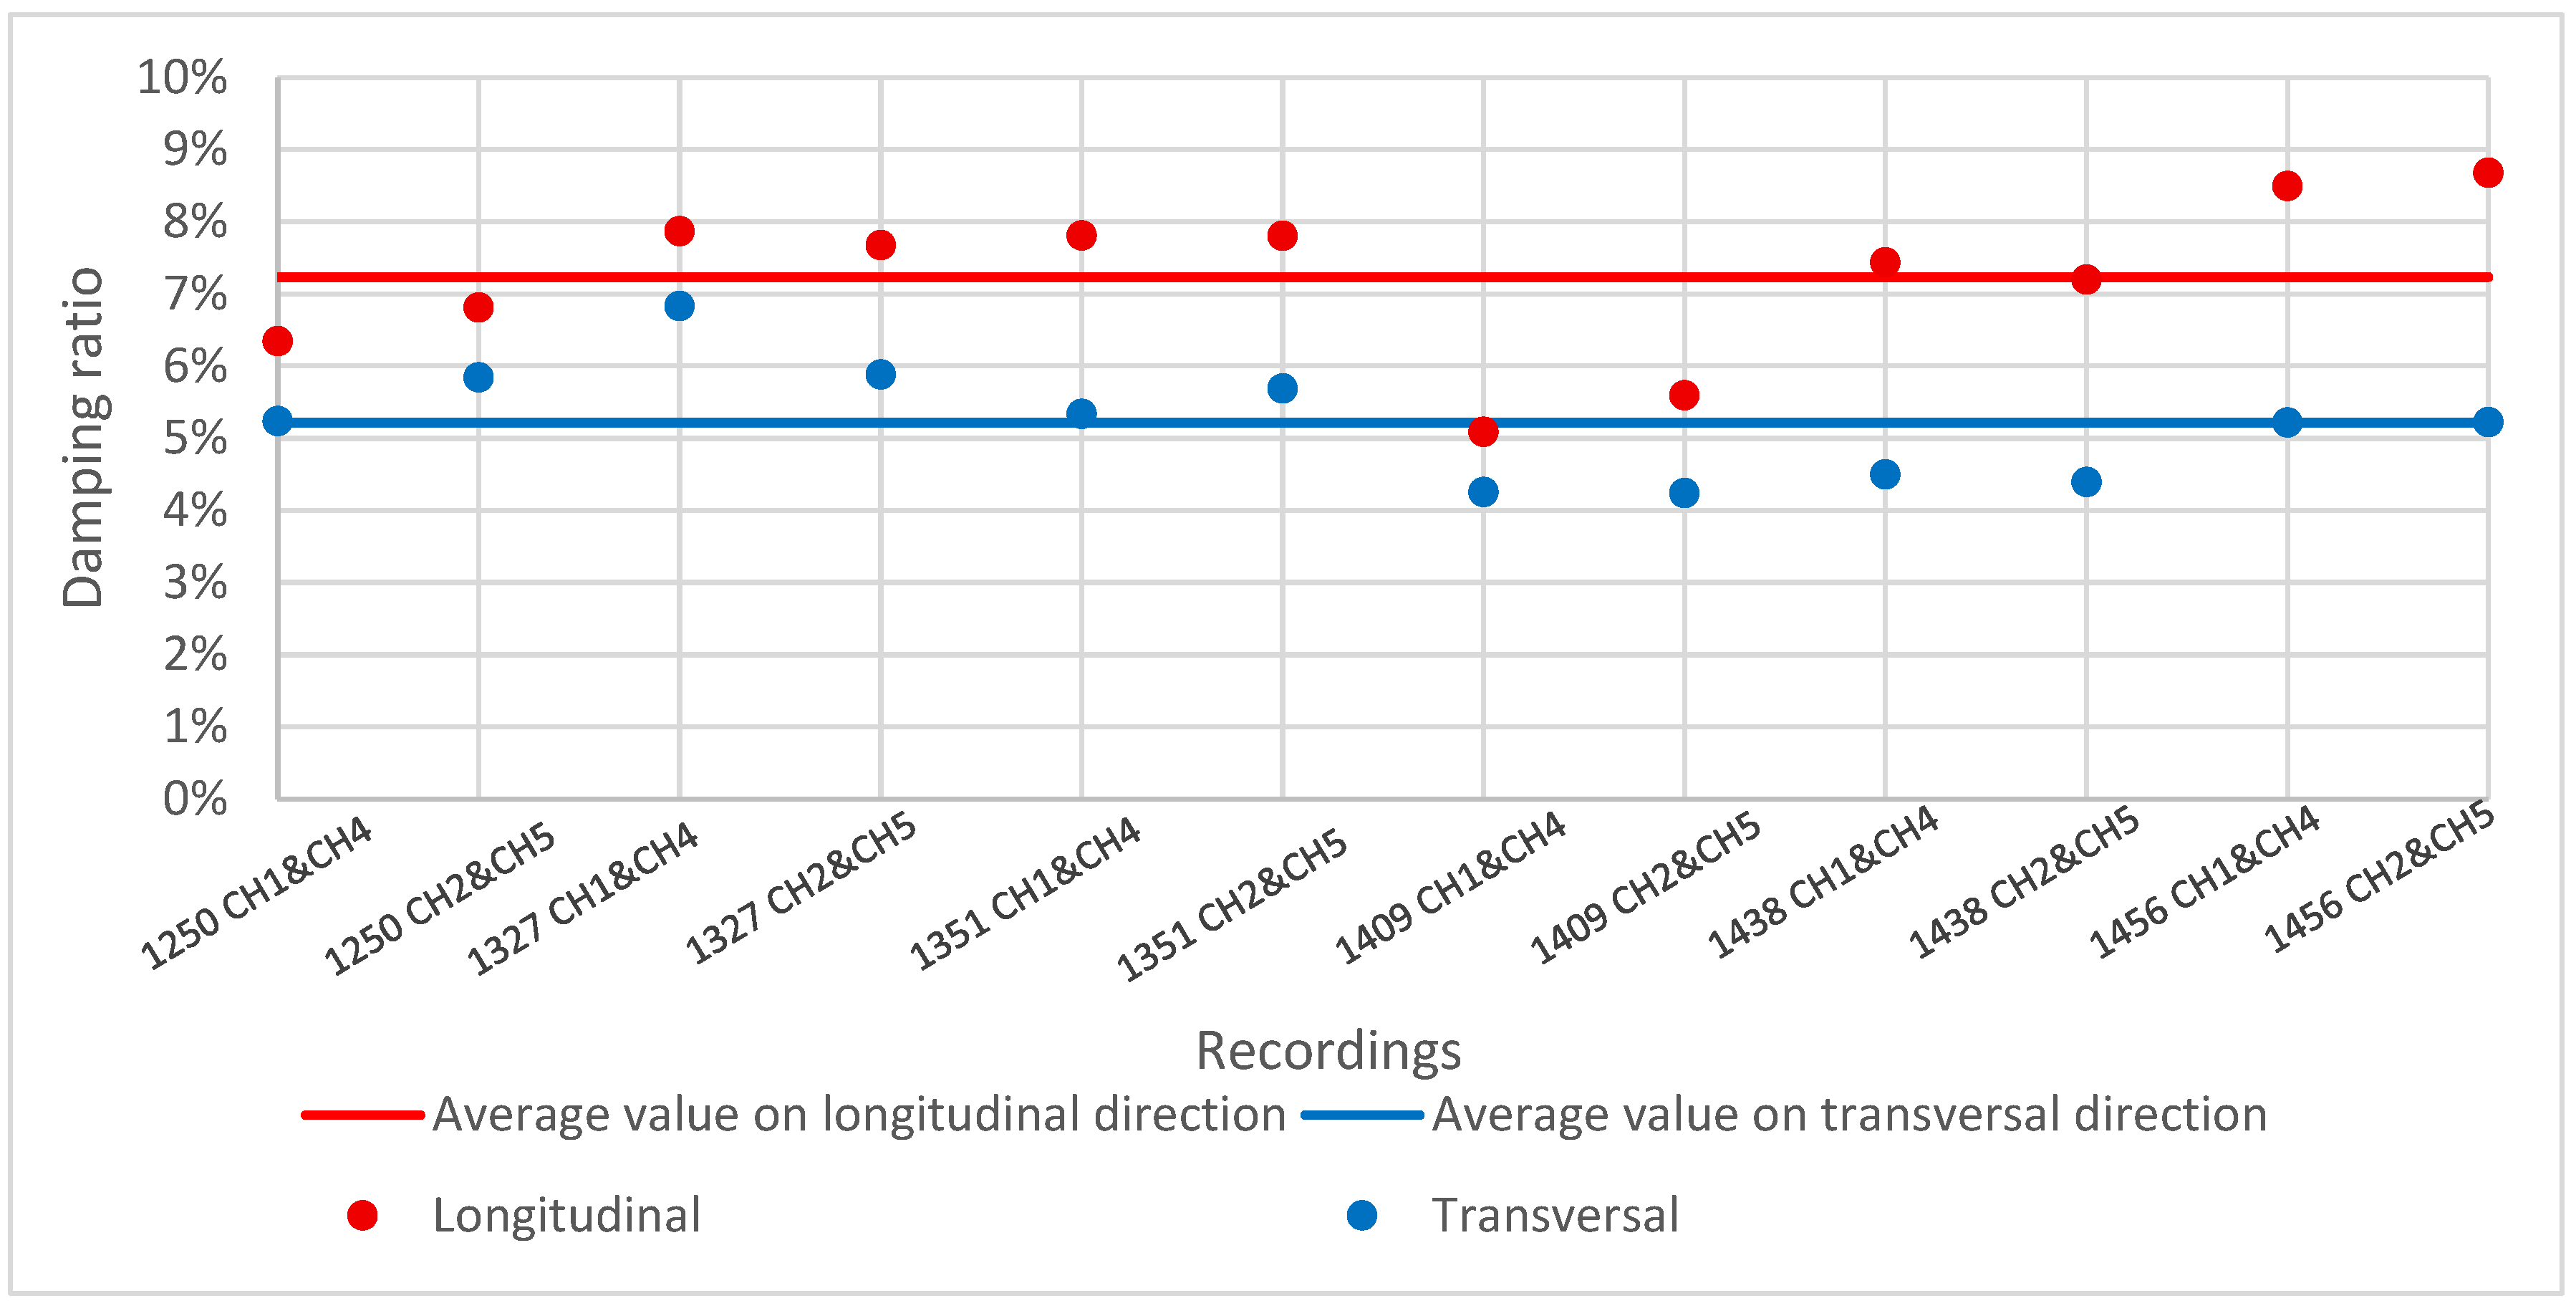
The average value for the damping ratio on longitudinal direction is 0.0723 and on transversal direction is 0.0522, while the median value is 0.0756 on longitudinal and 0.0523 on transversal direction. The obtained values are graphically represented in Figure 19.
Figure 19.
Values of damping ratio.
4. Discussion
This study examines the dynamic response of a four-story reinforced concrete building using ambient vibration data recorded at the fourth story. The damping ratio is estimated using the Random Decrement Technique (RDT). Key RDT parameters, such as natural frequency, triggering value, time window length, and number of sub-segments, are systematically analyzed. Signal filtering is applied to enhance signal clarity, making the time domain and frequency domain analyses more reliable. Custom OCTAVE/MATLAB [22] routines are developed for this analysis. The results show limited sensitivity to parameter variation, indicating that the proposed methodology is robust.
As emphasized in Section 2 and Section 3, the fundamental frequency plays a key role in the proposed methodology. Since all measurements were performed at the same location and on the same structure, the fundamental frequency obtained from the data analysis is expected to be identical across all recordings. To ensure its accurate determination, all recordings in each direction are analyzed by using the smoothed Fourier spectra.
Both the median and RMS smoothing techniques proposed by Kalkan [21] are applied in this study. The predominant frequencies obtained under the various smoothing configurations are analyzed. After evaluating the influence of the smoothing procedure on the Fourier spectra, a total of 120 windows was selected for use in the smoothed spectral analysis, which corresponds to a window length of , equivalent to a Parzen window width of 0.2 Hz. The median method was used in the smoothing procedure.
If closely spaced peaks that may correspond to nearby natural frequencies are identified in the Fourier spectrum, the application of a filtering procedure is recommended. In this study, such a filtering technique was employed to obtain modified recordings for the transversal direction. The modified recordings are further used in the analysis.
The discrepancies observed in Figure 18 for recordings 1327 CH2, 1327 CH5, 1409 CH2, and 1409 CH5 are correlated with the decrease in the number of sub-segments used for the transversal direction. An analysis of the velocity time histories for these recordings in Figure 13 indicates the presence of significant peaks, which lead to a high triggering threshold corresponding to . Monitoring the number of sub-segments employed in the construction of the RDT signature is therefore recommended.
Filtering around the fundamental natural frequency (i.e., refining the value of ) is crucial for accurately determining the damping ratio . Several options for the bandpass range were analyzed and ±20% seems to be large enough not to artificially stabilize the resulting damping ratio. A filtration quality check can be seen in Figure 11 and Figure 12, where the filtered R function exhibits the characteristics of damped free oscillations. Figure 17 and Figure 18 allow a comparative assessment of the damping ratios obtained using filtered and unfiltered RDT signatures. The values of remain relatively stable when the triggering threshold varies within reasonable limits.
5. Conclusions
It is important to acknowledge that the obtained results appear comparatively higher when evaluated against the statistically derived formulations proposed by Ha et al. [23]. The reported damping ratios are consistent with the outcomes derived from the proposed methodology, which utilizes the available ambient vibration recordings. Furthermore, the resulting data should be interpreted in relation to the structural configuration of the analyzed system, necessitating a comprehensive assessment of both structural and non-structural components. Such an investigation, however, extends beyond the scope of the present study. As stated in the introduction, the primary objective of this work is to conduct a parametric analysis of selected variables within the Random Decrement Technique (RDT) procedure.
In this study, the full duration of the recorded signals was used for data analysis. However, experienced users may wish to examine specific segments of the signals obtained from the recording equipment.
The present study may be extended along several research directions.
Regarding the application of the RDT, the influence of variability in the fundamental frequency on the estimated damping ratio would be of particular interest to evaluate. Furthermore, uncertainty associated with the correlation between the Hilbert envelope and the exponential-type envelope can be investigated.
Future work should investigate alternative methodologies for estimating the fraction of critical damping, with the aim of improving accuracy and robustness. Since the Random Decrement Technique (RDT) is known to be sensitive to closely spaced modes and noisy data, benchmarking its results against established frequency domain methods would be necessary to ensure confidence in the absolute values obtained.
A comparative analysis of the temporal evolution of the critical damping fraction would also provide valuable insight into its variability and long-term behavior.
Further parametric studies encompassing a wider range of building typologies and structural configurations are necessary to enhance the general applicability of the proposed approach. In addition, the identification of modal damping ratios could contribute to a more refined understanding of structural dynamic behavior.
The estimation of damping ratios based on recordings obtained during seismic events can be helpful in order to assess damping characteristics under real earthquake conditions and to validate analytical assumptions against observed structural response.
Regarding the analyzed structure, the possible structural pounding can be investigated in future study by recording ambient vibrations on both sides of the seismic joint.
Author Contributions
Conceptualization, R.-G.E.; methodology, G.I.; software, G.-B.N.; validation, R.-G.E., G.I., G.-B.N. and I.A.V.; formal analysis, R.-G.E., G.I., G.-B.N. and I.A.V.; investigation, R.-G.E., G.I., G.-B.N. and I.A.V.; resources, R.-G.E., G.I., G.-B.N. and I.A.V.; data curation, R.-G.E., G.I., G.-B.N. and I.A.V.; writing—original draft preparation, R.-G.E., G.I., G.-B.N. and I.A.V.; writing—review and editing, R.-G.E., G.I., G.-B.N. and I.A.V.; supervision, R.-G.E.; project administration, R.-G.E.; funding acquisition, R.-G.E. All authors have read and agreed to the published version of the manuscript.
Funding
This research was funded by Technical University of Civil Engineering of Bucharest, project number GnaC-ARUST-2024-UTCB-24.
Institutional Review Board Statement
Not applicable.
Informed Consent Statement
Not applicable.
Data Availability Statement
The original data presented in the study are openly available in zenodo.org at https://doi.org/10.5281/zenodo.17878695 (accessed on 5 January 2026).
Acknowledgments
The authors are grateful to the Organizing Committee of the 20th International Scientific Conference CIBv-Civil Engineering and Building Services 2025 for the support throughout the publishing process.
Conflicts of Interest
The authors declare no conflicts of interest.
Abbreviations
The following abbreviations are used in this manuscript:
| SDOF | Single degree of freedom systems |
| MDOF | Multiple degree of freedom systems |
| RDT | Random Decrement Technique |
| FRF | Frequency Response Function |
| FDD | Frequency Domain Decomposition |
| SVD | Singular Value Decomposition |
| TUCEB | Technical University of Civil Engineering of Bucharest |
| RC | Reinforced concrete |
| SHM | Structural health monitoring |
References
- Chopra, A.K. Dynamics of Structures; Pearson: Boston, MA, USA, 2017. [Google Scholar]
- Clough, R.W.; Penzien, J. Dynamics of Structures; Computers and Structures, Inc.: Berkeley, CA, USA, 2003. [Google Scholar]
- Sun, Z.; Mahmoodian, M.; Sidiq, A.; Jayasinghe, S.; Shahrivar, F.; Setunge, S. Optimal Sensor Placement for Structural Health Monitoring: A Comprehensive Review. J. Sens. Actuator Netw. 2025, 14, 22. [Google Scholar] [CrossRef] [Scilit]
- Ibrahim, S.R.; Wentz, K.R.; Lee, J. Damping Identification from Non-Linear Random Responses Using a Multi-Triggering Random Decrement Technique. Mech. Syst. Signal Process. 1987, 1, 389–397. [Google Scholar] [CrossRef] [Scilit]
- He, X.H.; Hua, X.G.; Chen, Z.Q.; Huang, F.L. EMD-Based Random Decrement Technique for Modal Parameter Identification of an Existing Railway Bridge. Eng. Struct. 2011, 33, 1348–1356. [Google Scholar] [CrossRef] [Scilit]
- Shang, X.-Q.; Huang, T.-L.; He, Y.-B.; Chen, H.-P. Operational Modal Analysis of Civil Engineering Structures with Closely Spaced Modes Based on Improved Hilbert–Huang Transform. Sensors 2024, 24, 7600. [Google Scholar] [CrossRef] [Scilit]
- Tiganescu, A.; Craifaleanu, I.G.; Balan, S.F. Dynamic Parameters of a RC Building Extracted from Earthquake Data Using the Random Decrement Technique. IOP Conf. Ser. Earth Environ. Sci. 2020, 664, 012088. [Google Scholar] [CrossRef] [Scilit]
- Brincker, R.; Amador, S. On the Theory of Random Decrement. Mech. Syst. Signal Process. 2022, 173, 109060. [Google Scholar] [CrossRef] [Scilit]
- Ewins, D.J. Modal Testing: Theory, Practice and Applications; Research Studies Press: Baldock, UK, 2000. [Google Scholar]
- Noh, J.; Hwang, J.-S.; Valluzzi, M.R. Damping Ratio Estimation of Heavily Damped Structures Using State-Space Modal Responses. Sensors 2025, 25, 5416. [Google Scholar] [CrossRef] [Scilit]
- Brincker, R.; Zhang, L.; Andersen, P. Modal Identification of Output Only Systems Using Frequency Domain Decomposition. Smart Mater. Struct. 2001, 10, 441–445. [Google Scholar] [CrossRef] [Scilit]
- Lazaridis, P.C.; Kavvadias, I.E.; Demertzis, K.; Iliadis, L.; Vasiliadis, L.K. Structural Damage Prediction of a Reinforced Concrete Frame under Single and Multiple Seismic Events Using Machine Learning Algorithms. Appl. Sci. 2022, 12, 3845. [Google Scholar] [CrossRef] [Scilit]
- Hwang, H.; Oh, K.; Choi, I.; Kang, J.; Shin, J. Rapid Estimation Method of Allowable Axial Load for Existing RC Building Structures to Improve Sustainability Performance. Sustainability 2024, 16, 6578. [Google Scholar] [CrossRef] [Scilit]
- Munteanu, R.I.; Calofir, V.; Lemnaru, K.-C.; Ponta, C. Advanced Investigation into Active Control Force Requirements for Seismic Damage Mitigation of Inelastic Structures. Buildings 2025, 15, 1402. [Google Scholar] [CrossRef] [Scilit]
- Calofir, V.; Munteanu, R.-I.; Simoiu, M.-S.; Lemnaru, K.-C. Innovative Approach to Estimate Structural Damage Using Linear Regression and K-Nearest Neighbors Machine Learning Algorithms. Results Eng. 2024, 22, 102250. [Google Scholar] [CrossRef] [Scilit]
- Calofir, V.; Simoiu, M.-Ștefan; Munteanu, R.-I.; Calofir, E.; Iliescu, S.-S. Machine Learning-Based Estimation of Seismic Structural Damage via an Accessible Web Application. Alex. Eng. J. 2025, 127, 848–862. [Google Scholar] [CrossRef] [Scilit]
- Coțovanu, A.; Vacareanu, R. Modeling Energy Release Parameters in Stochastic Simulation of Ground Motions Generated by Vrancea Intermediate-Depth Seismic Source. Bull. Earthq. Eng. 2020, 18, 2557–2580. [Google Scholar] [CrossRef] [Scilit]
- Guo, L.; Shen, Y.; Lyu, M.; Zhang, D.; Huang, Z. Non-Parametric Seismic Fragility Assessment of Underground Structures Incorporating Stochastic Ground Motion. Soil Dyn. Earthq. Eng. 2026, 200, 109893. [Google Scholar] [CrossRef] [Scilit]
- Ibrahim, S.R. Random Decrement Technique for Modal Identification of Structures. J. Spacecr. Rockets 1977, 14, 696–700. [Google Scholar] [CrossRef] [Scilit]
- Cheynet, E. Damping Ratio Estimation from Ambient Vibrations (SDOF); Zenodo: Geneva, Switzerland, 2020. [Google Scholar] [CrossRef]
- Erol Kalkan, P.E. Compute Smooth Fourier Amplitude Spectrum (smoothFAS). Version 1.0.5. MATLAB Central File Exchange. 2025. Available online: https://www.mathworks.com/matlabcentral/fileexchange/70166-compute-smooth-fourier-amplitude-spectrum-smoothfas (accessed on 3 November 2025).
- MATLAB, Version R2019b; The MathWorks, Inc.: Natick, MA, USA, 2019.
- Ha, T.; Shin, S.-H.; Kim, H. Damping and Natural Period Evaluation of Tall RC Buildings Using Full-Scale Data in Korea. Appl. Sci. 2020, 10, 1568. [Google Scholar] [CrossRef] [Scilit]

Disclaimer/Publisher’s Note: The statements, opinions and data contained in all publications are solely those of the individual author(s) and contributor(s) and not of MDPI and/or the editor(s). MDPI and/or the editor(s) disclaim responsibility for any injury to people or property resulting from any ideas, methods, instructions or products referred to in the content. |
© 2026 by the authors. Licensee MDPI, Basel, Switzerland. This article is an open access article distributed under the terms and conditions of the Creative Commons Attribution (CC BY) license.