


Abstract
Large-scale urban infrastructure projects are essential, yet they often introduce prolonged disruptions that affect residents’ perceived wellbeing. Existing research has demonstrated temporary declines in wellbeing during construction periods, but often relies on aggregate indicators, longitudinal averages, aggregate indicators, or proximity-based measures, providing limited insight into neighbourhood-level spatial inequalities and local clustering. This study addresses this gap by developing a Perceived Wellbeing Indicator (PWI) and applying a place-based, spatially explicit framework to examine patterns of perceived wellbeing associated with the Thessaloniki Flyover project. A questionnaire survey captured residents’ experiences of stress, accessibility, and perceived air and noise pollution. Indicator weights were derived using a hybrid approach combining Principal Component Analysis and the Analytic Hierarchy Process. Exploratory Spatial Data Analysis techniques were applied to identify clusters, spatial outliers, and neighbourhood typologies of perceived wellbeing, which were further interpreted with child dependency ratios and perceived air pollution and noise annoyance. Results reveal pronounced spatial heterogeneity in perceived wellbeing. Low-wellbeing clusters are concentrated in Evosmos, Sykies, and Ano Toumpa, while higher wellbeing is observed in Efkarpia, Kato Toumpa, and Thermi. Lower PWI values are more frequent near the Flyover axis, indicating a spatial concentration of lower values in its vicinity, although similar patterns also appear in districts distant from the project. Overall, the findings demonstrate that perceived wellbeing is shaped by a combination of local environmental, socioeconomic, and neighbourhood conditions, including pre-existing spatial inequalities, rather than infrastructure proximity alone. By providing a spatially explicit understanding of wellbeing, this framework supports sustainable urban planning, enabling interventions that reduce environmental stress, promote social equity, and enhance community resilience during and after large-scale infrastructure development.
1. Introduction
Large-scale infrastructure projects are widely recognized as vital components of urban development and economic growth. However, they also entail extended construction periods that can negatively affect residents’ everyday lives. Several studies document that perceived wellbeing often declines during major transport construction phases due to disruptions, noise, environmental changes, traffic congestion and altered daily routines [1,2,3]. Perceived environmental exposures have been linked to higher levels of stress among urban residents and are recognized as a significant environmental health risk, contributing to annoyance, sleep disturbance, and other stress-related effects that can be detrimental to the wellbeing [4,5]. Empirical studies also indicate that perceived air and noise pollution often shape satisfaction with the living environment more strongly than objective measures, suggesting that residents’ subjective experience of environmental exposures is an important determinant of perceived wellbeing [1]. These findings highlight that disruptions, environmental exposures, and altered daily routines associated with infrastructure constructions can influence both objective and perceived wellbeing of residents.
Wellbeing is a multidimensional concept encompassing both objective and perceived (subjective) components. Objective wellbeing refers to externally measurable conditions of life, such as income, employment, housing quality, accessibility, environmental exposures, and health outcomes, and is commonly assessed using administrative, environmental, or economic data [6,7]. By contrast, perceived wellbeing captures individuals’ personal evaluations of their lives and experiences, including life satisfaction, emotional affect, perceived stress, and quality of daily life [8,9]. While objective indicators provide essential context for living conditions, they do not fully reflect how these conditions are experienced, interpreted, and valued by residents. Research shows that people exposed to similar objective conditions can report different levels of wellbeing depending on personal expectations, social context, and subjective perceptions of environmental exposures and daily routines [10]. In urban and infrastructure research, perceived wellbeing is particularly important because disruptions such as construction noise, altered mobility, and changes in environmental exposure are mediated through residents’ experiences and perceptions rather than through measurable exposures [11]. Incorporating subjective wellbeing thus allows for a more citizen-science approach assessment, capturing dimensions of everyday life that objective measures alone cannot fully represent.
Previous research on assessing perceived wellbeing during large-scale urban infrastructure construction has primarily relied on longitudinal, mixed-methods, and qualitative approaches tailored to capture subjective experiences while construction is ongoing. In longitudinal survey designs, researchers have exploited panel or repeated cross-sectional household surveys to track changes in residents’ satisfaction with their neighbourhoods and wellbeing indicators over time, with comparison across periods before, during, and after project implementation; for example, data from the nationally representative Household Income and Labour Dynamics in Australia (HILDA) survey were used to model residents’ satisfaction with neighbourhoods using random-effects ordered logit models, explicitly distinguishing the construction phase as an exposure period while controlling for sociodemographic attributes and life events [1]. Natural experimental designs also employ multiple waves of postal or community surveys, conducted in cohort and repeated cross-sectional formats, to measure wellbeing using validated instruments such as the SF-8 Mental Component Summary and the short Warwick-Edinburgh Mental Well-being Scale (SWEMWBS), with individual exposure defined by spatial proximity to active motorway construction [12]. Large mixed-methods protocols, such as the Wellbeing Impact Study of High-Speed 2 (WISH2), combine longitudinal and repeated cross-sectional surveys with planned semi-structured interviews and focus groups, along with administrative data linkage (e.g., medical records aggregated at the primary care level) to comprehensively assess mental health and wellbeing across phases of the infrastructure project [13]. Qualitative and inductive methods, grounded in grounded theory, use structured observations, expert consultations, and open-ended resident questionnaires to develop explanatory frameworks of how construction activities relate to perceived quality of life, systematically organizing themes that emerge from residents’ descriptions of their lived experience during active construction [3,14]. In addition to standalone instruments, Social Impact Assessment (SIA) frameworks are applied to integrate these diverse methods, such as surveys, interviews, and participatory engagements, into a structured evaluation of psychosocial wellbeing impacts during construction, enabling systematic documentation and comparison of subjective indicators across different stakeholder groups [15,16].
Despite the rich repertoire of research examining perceived wellbeing during large urban infrastructure construction, work has primarily focused on temporal change and narrative experience, with limited integration of spatial analytic perspectives. Existing studies predominantly rely on longitudinal, mixed-methods, or qualitative designs that examine temporal changes in wellbeing before, during, and after construction. While these approaches are well-suited to capturing dynamics over time, they typically treat space in a limited or instrumental manner, most often operationalizing exposure as distance-based proximity or binary categories (construction/non-construction). As a result, they provide relatively little insight into how perceived wellbeing is spatially structured across neighbourhoods, how local wellbeing patterns relate to broader urban contexts and how intra-urban inequalities emerge during active construction periods.
In the broader wellbeing and quality of life literature, there is increasing recognition of the importance of spatial approaches. Recent reviews and empirical work highlight that composite wellbeing indices, spatial principal component analysis, and Bayesian latent factor models can reveal neighbourhood-level heterogeneity, clustering, and spatial dependence that would otherwise remain hidden [17,18,19,20]. For instance, GIS-based composite indices of urban quality of life in Athens and Italian provinces demonstrate how spatial autocorrelation, clustering, and latent factor modelling can alter the identification of wellbeing hotspots and reshape the interpretation of local disparities [18,19]. These spatially explicit methodologies underscore that ignoring spatial dependence can bias interpretations of multidimensional wellbeing patterns.
However, few studies simultaneously integrate subjective wellbeing survey data with spatially explicit composite index construction at fine neighbourhood scales, particularly in the context of ongoing infrastructure projects. Existing composite indices typically operate at broad administrative scales (e.g., cities or provinces) and rely primarily on objective socioeconomic or environmental indicators. Meanwhile, infrastructure wellbeing studies emphasize temporal dynamics but rarely apply spatial statistical techniques, such as spatial autocorrelation, hotspot detection, or co-location analysis, to identify and characterize local patterns of perceived wellbeing or its relationship to socioeconomic conditions.
To address these gaps, the current study introduces a Perceived Wellbeing Indicator (PWI) designed to capture the multidimensional and spatially heterogeneous nature of residents’ lived experience during large urban infrastructure construction. The PWI integrates multiple thematic pillars (stress and wellbeing, accessibility and mobility, noise, and air pollution) into a single, interpretable metric suitable for spatial aggregation and analysis, enabling systematic examination of intra-urban variability in perceived wellbeing through Exploratory Spatial Data Analysis (ESDA) techniques. Rather than replacing validated wellbeing instruments, the indicator complements them by translating individual perceptions into a place-based framework that supports spatial interpretation, comparative assessment, and targeted urban mitigation strategies within the context of large-scale infrastructure interventions.
The proposed PWI is implemented in Thessaloniki, Greece, where a major urban transport construction project, the Flyover, is underway in a dense urban context that directly affects residential neighbourhoods over an extended construction period. Its scale, spatial extent, and proximity to urban life make it a suitable case for examining neighbourhood-level variability in perceived wellbeing and for testing a place-based, spatially explicit wellbeing assessment framework.
Understanding neighbourhood-level variations in perceived wellbeing during infrastructure construction is critical for promoting sustainable urban development. By capturing the interplay between social, environmental, and mobility-related factors, the proposed Perceived Wellbeing Indicator (PWI) supports planning decisions that enhance environmental quality, reduce social inequities, and improve overall quality of life, aligning with broader sustainability goals.
2. Materials and Methods
2.1. The Flyover Project in Thessaloniki
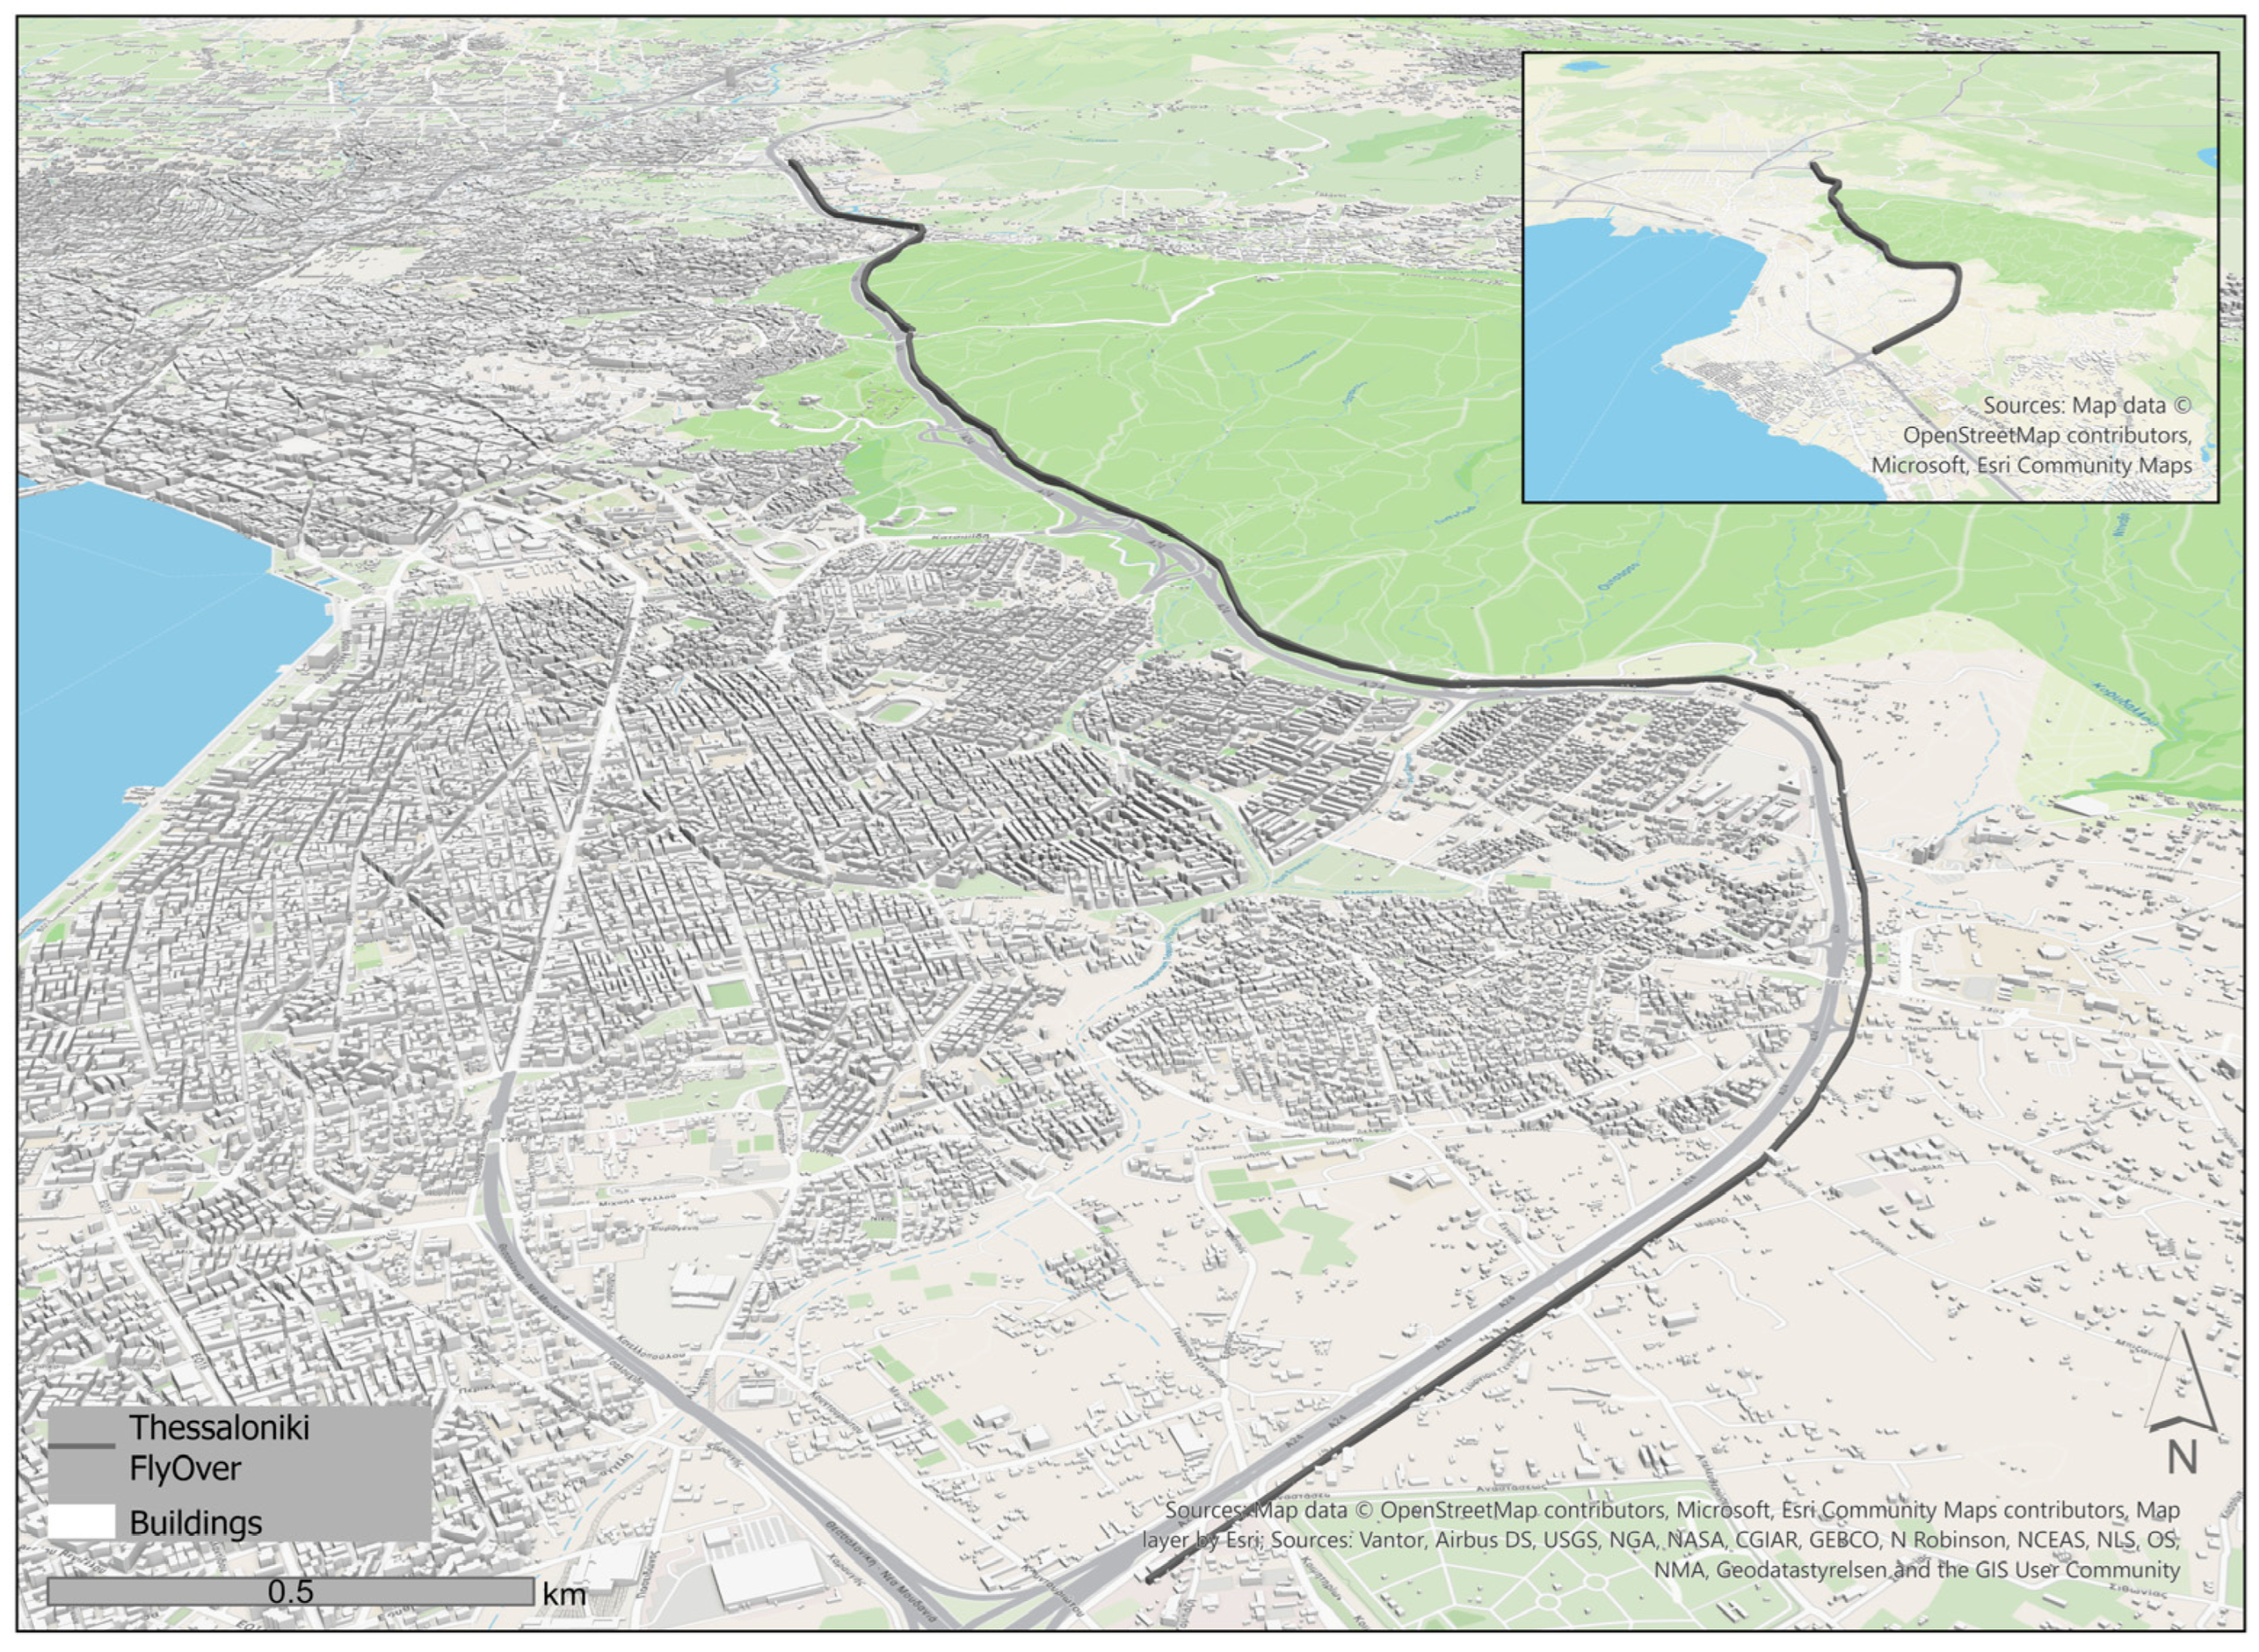
Thessaloniki is the second-largest city in Greece, with 1 million inhabitants according to the 2021 census [21]. Mobility is one of the most pressing environmental and urban challenges in Thessaloniki, where the limited availability of diverse travel options and transport modes has led to overreliance on private vehicles, resulting in deteriorating air quality and a diminished overall quality of life [22]. Thus, the Flyover project was adopted as a solution and is among Greece’s most significant ongoing road infrastructure redevelopment projects. This elevated expressway, located along the eastern section of the Thessaloniki Ring Road, is intended to improve overall urban traffic flow and alleviate congestion within the existing network. The initiative is expected to benefit daily commuters by improving quality of life, road safety, and regional accessibility [23]. The Flyover will be 13 km in total, with 4 km of the route elevated. Key design elements include elevating nine bridges, opening three tunnels, constructing six grade-separated interchanges, and 15 km of auxiliary roads flanking the main axis. It is estimated to serve 10,000 vehicles per hour in each direction. The Greek Ministry of Infrastructure and Transport officially launched the project in autumn 2022, and it is anticipated to be delivered in spring 2027 [23]. Simulated renderings of the Flyover and the exact location of the infrastructure are presented in Figure 1. Despite the expected advantages of this large-scale infrastructure project, notable concerns persist. Construction phases have disrupted local traffic, generating noise and dust, and drivers experience multiple daily delays across the whole city. Land-use changes and encroachments affect certain neighbourhoods, while environmental impacts are significant, particularly the partial destruction of the Seich Sou peri-urban forest. The project entails clearing 82,000 m2 of forested land for road elements and supporting infrastructure. This loss threatens air quality and living conditions citywide, extending beyond adjacent communities.
Figure 1.
Simulated Renderings and Location of the Thessaloniki Flyover.
2.2. Study Participants and Ethics
The eligibility criteria for participants were that they were adult volunteers who lived in the city of Thessaloniki. In total, 341 participants completed the questionnaire via social media and word of mouth. Participants were provided with detailed information about the study’s aims, methods, and data collection and management. Ethical approval was granted by the Committee on Ethics and Research Ethics of Aristotle University of Thessaloniki (February 2024: 43723/2025).
2.3. Data Collection
Data were collected via a web-based questionnaire on the Limesurvey platform, with responses being fully anonymized. The survey was active for four months (May–August 2025). Although day-to-day fluctuations in construction activity were not monitored, the construction phases were generally high in intensity due to pressure to finish earlier than originally estimated, resulting in substantial traffic congestion and contributing to residents’ frustration.
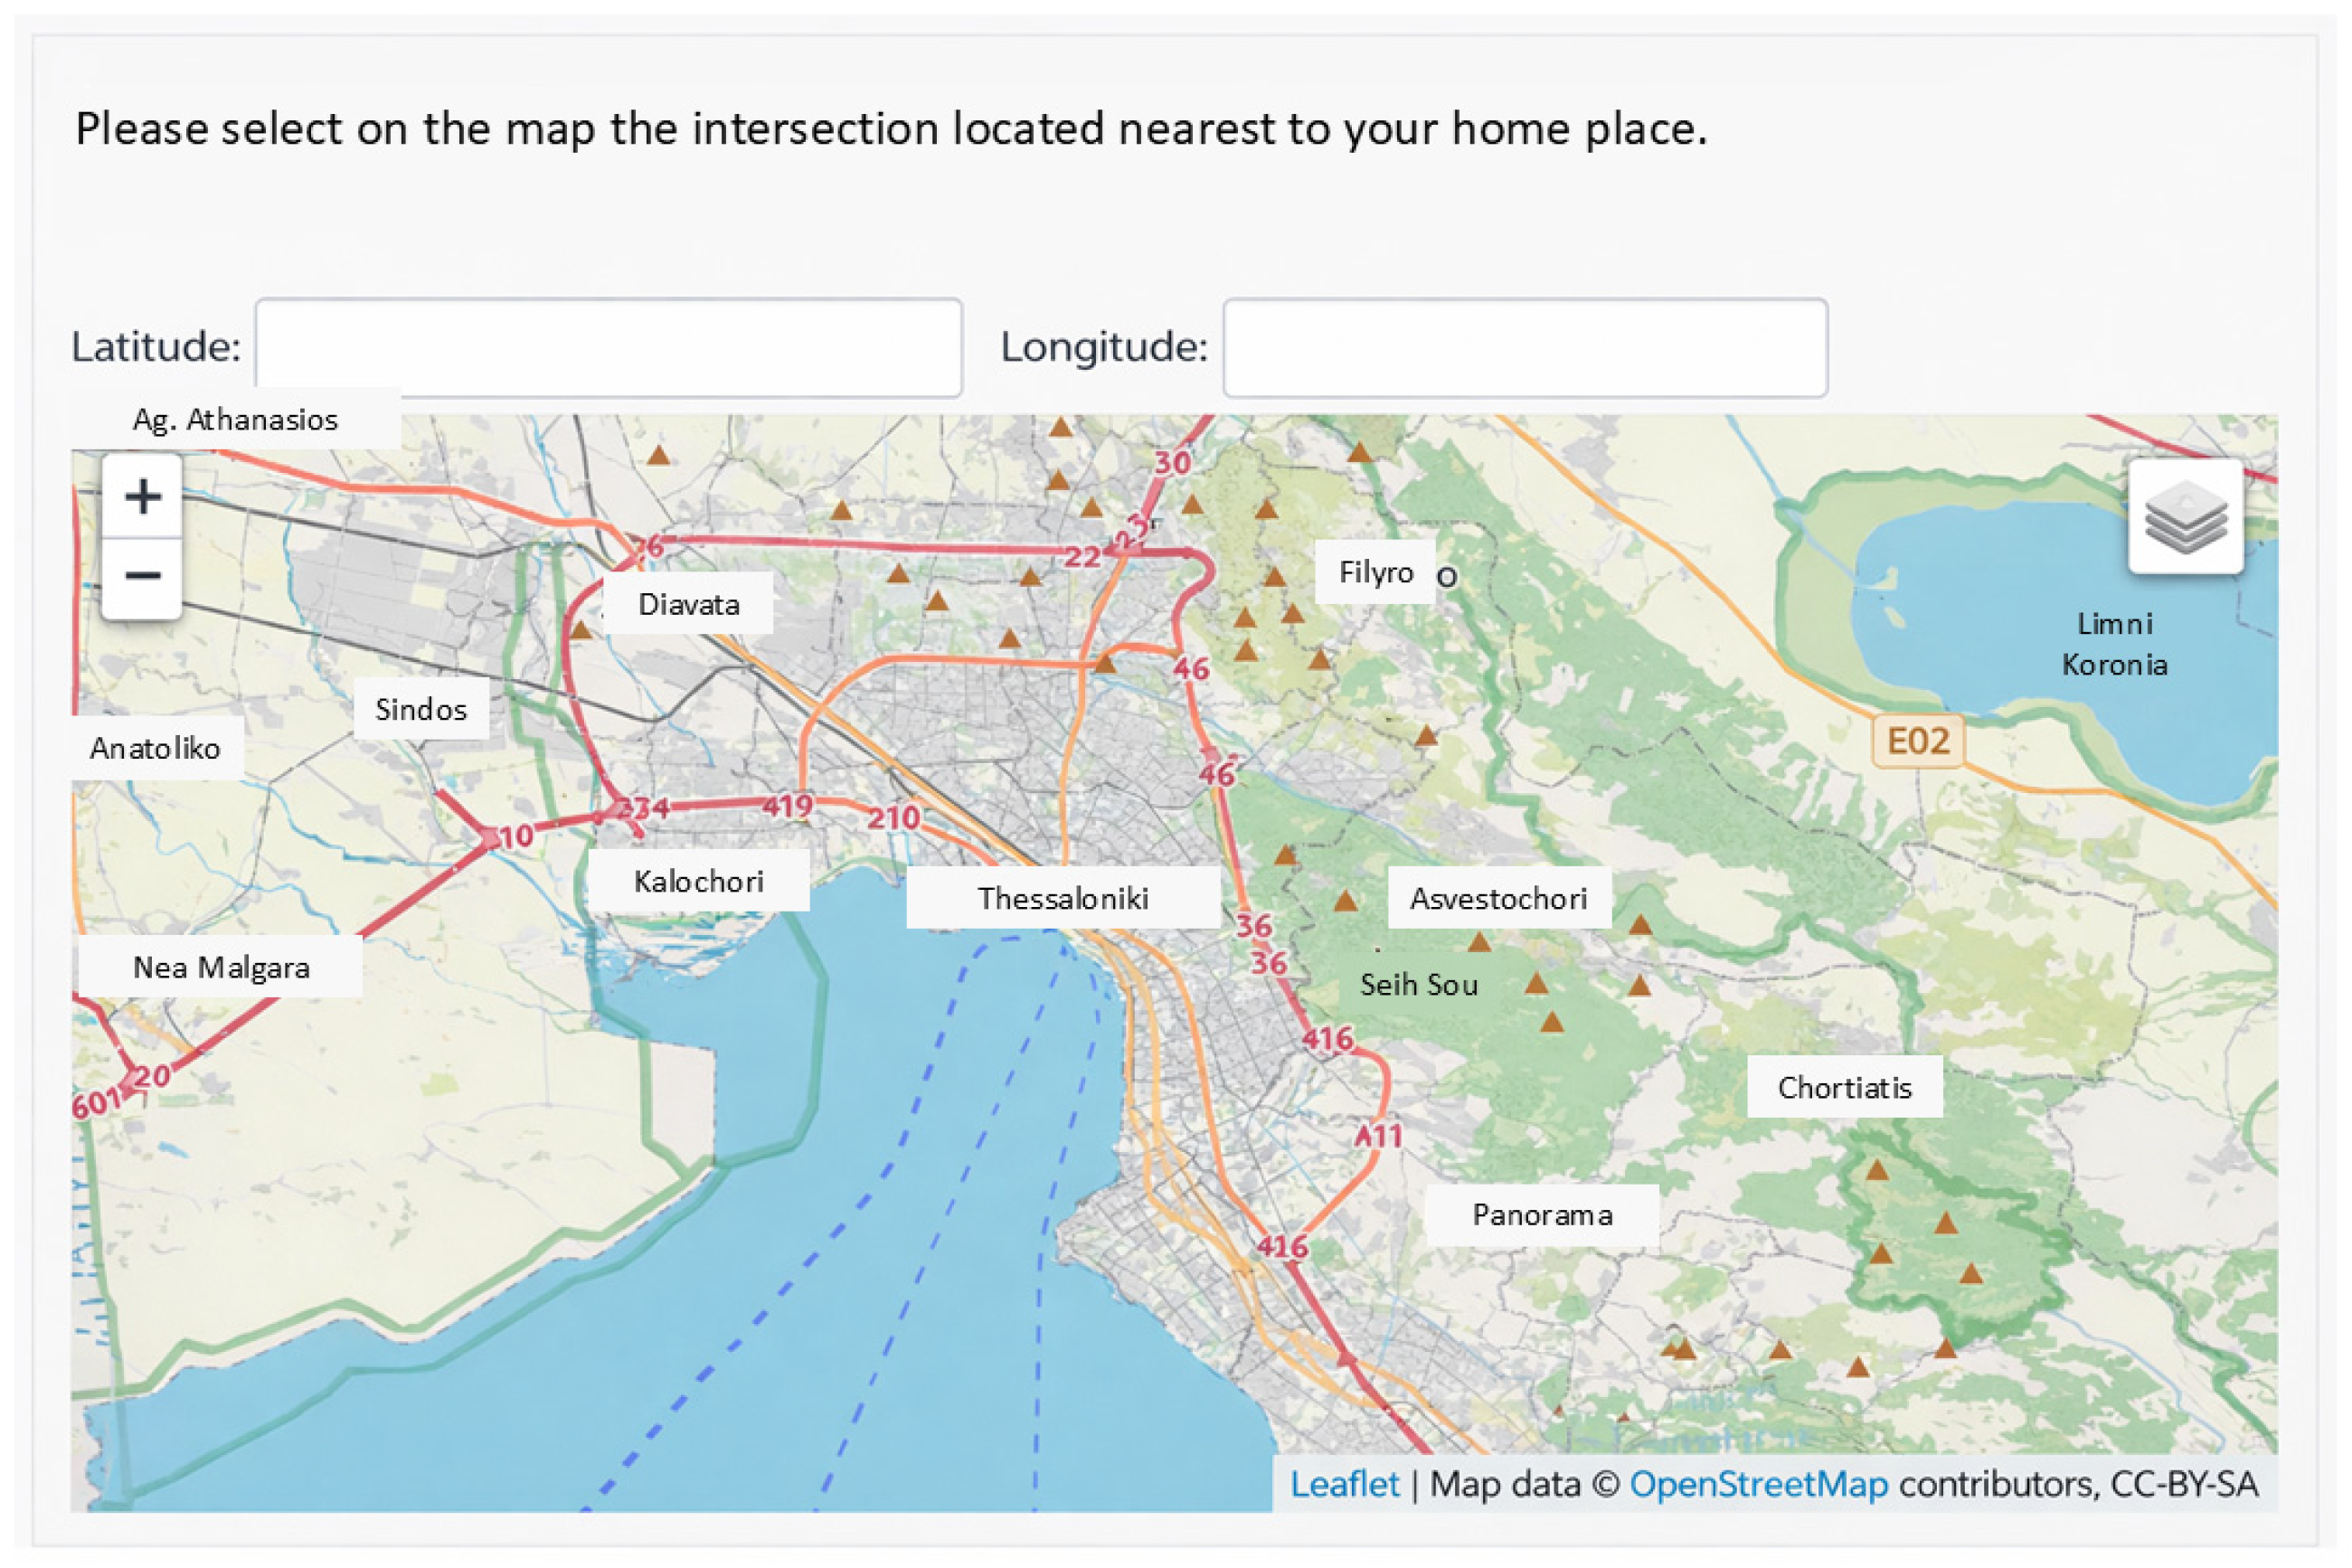
The survey comprised five sections: (1) stress and wellbeing, (2) accessibility and mobility, (3) noise annoyance, (4) air pollution and (5) participants’ demographics. More details about each section are provided in Appendix A (Table A1). There was also an integrated geospatial tool (Figure 2) in which participants were asked to place a pin at the nearest crossroad to their home and workplace on an interactive map. Thus, it was feasible to aggregate spatial data with responses without compromising individual privacy.
Figure 2.
Interactive tool for Geolocating Home and Workplace via Nearest Crossroad.
2.4. Development of the Perceived Wellbeing Indicator (PWI)
To assess the impact of the flyover project on residents’ wellbeing, a novel multidimensional indicator was developed comprising four pillars: stress and wellbeing (SW), accessibility and mobility (AM), noise (N), and air pollution (AP). Generative artificial intelligence (ChatGPT, OpenAI GPT-5) was used to assist in articulating and refining textual interpretations of PCA component loadings. All methodological decisions, analyses, and final interpretations were performed and verified by the authors. The use of AI did not influence data collection, statistical analyses, or the study’s conclusions.
2.4.1. Questionnaire Reliability and Structural Analysis for Indicator Development
To assess the internal consistency of the questionnaire items within each thematic pillar, Cronbach’s alpha was calculated. This statistic assesses the degree to which items within a scale measure the same underlying construct, ensuring that the thematic pillars reliably capture their intended dimensions (e.g., Stress, Accessibility, Noise, Air Pollution). Items that did not contribute to internal consistency were excluded to improve reliability. High Cronbach’s alpha values indicate that the items within each pillar are coherent and suitable for further analysis [24,25]. To further examine the underlying structure of the questionnaire and the conceptual relationships among items, Principal Component Analysis (PCA) with Varimax rotation was applied. PCA reduces data dimensionality and identifies latent components that account for the maximum variance in the dataset. This method helps confirm whether items cluster according to the theoretically defined thematic pillars, providing evidence of structural validity. Components with eigenvalues greater than 1 were retained, and their factor loadings were interpreted to determine which items contribute to each dimension [26]. Last, to assess the degree of association between the thematic pillars and examine whether related constructs co-occur while remaining distinct, both Pearson and Spearman correlation coefficients were computed:
- Pearson correlations were applied to the mean scores of the pillars to quantify linear relationships between continuous variables.
- Spearman’s rho was used due to the ordinal nature of the underlying Likert-scale items, capturing monotonic relationships without assuming normality [27,28].
Significant positive correlations indicate convergent validity, confirming that related dimensions of stress, mobility disruption, and environmental impacts tend to co-occur. Strong but imperfect correlations support discriminant validity, indicating that the pillars measure conceptually distinct aspects of the urban experience.
2.4.2. Pillars Weighting
Weights for each pillar of the proposed indicator framework were derived through two independent procedures: Principal Component Analysis (PCA) and the Analytic Hierarchy Process (AHP). Pillar weights were derived via Principal Component Analysis (PCA) using IBM SPSS Statistics 29 software [29]. Originally formulated by Hotelling [30], PCA is a dimensionality-reduction technique that identifies principal components that maximize the variance explained in the dataset, producing objective weights based on factor loadings. The approach generates orthogonal components and explains variance proportions, computed via eigenvalue decomposition of the covariance matrix: the principal eigenvectors yield component loadings (weights), and the corresponding eigenvalues quantify the variance captured [31]. Weights reflected the dataset’s underlying structure from participant responses.
Pillar weights were also calculated using the Analytic Hierarchy Process (AHP) with the AHP Priority Calculator (bpmsg.com/ahp/ahp-calc.php). Originally developed by Thomas L. Saaty, the AHP facilitates multi-criteria decision-making by deriving ratio scales from pairwise comparisons of criteria and accommodating minor inconsistencies in judgments. The approach generates priority weights and a consistency ratio (CR), which are computed by solving an eigenvalue problem: pairwise comparisons are represented as a matrix whose principal normalized right eigenvector yields the weights, with the corresponding eigenvalue indicating consistency [32,33]. The AHP weighting process was conducted by the interdisciplinary research team, representing environmental studies, geography, urban planning, and engineering. All experts have documented research and/or professional experience in spatial analysis, urban exposure assessment, urban wellbeing and engineering applications in urban traffic systems. The experts provided their judgments independently, and the individual matrices were aggregated using the geometric mean method. The consistency ratio (CR < 0.1) confirmed acceptable coherence.
Thus, PCA objectively derived pillar weights based on the variance explained in the dataset, whereas AHP elicited subjective weights through structured pairwise comparisons conducted by the research team. A hybrid approach was subsequently developed by averaging the PCA objective weights with the AHP expert judgments to determine the most suitable weighting scheme for the indicator. Sensitivity analysis was performed using Pearson and Spearman correlation coefficients computed between composite indicators derived from PCA-based, AHP-based, and hybrid (averaged) weighting schemes. This approach evaluated the robustness, stability, and consistency across the different weighting methods to determine the most appropriate scheme for the final indicator.
2.5. Exploratory Spatial Data Analysis of Perceived Wellbeing
Because participants were distributed across Thessaloniki, including its outskirts, hexagonal aggregation units with a 300 m radius were employed to produce a spatially coherent representation of the composite indicator. This radius was selected to capture local sensitivity and aggregation stability [34]. After exploratory checks, smaller radii resulted in many empty hexagons, while larger radii smoothed out local variations and obscured meaningful patterns. All 300 m hexagons were included regardless of the number of observations. While some hexagons contain few participants, the chosen radius balances spatial resolution with aggregation stability, and the resulting spatial patterns remain interpretable. These hexagons provided a regular tessellation that avoided boundary effects common in administrative units, enabling consistent spatial analysis. Mean indicator values were subsequently calculated for each hexagon based on the aggregated participant scores within its boundaries, facilitating visualization of spatial patterns in urban environmental perceptions.
2.5.1. Hotspot Analysis (Getis-Ord )
The first stage utilized the Getis-Ord statistic to identify the presence of broad regional clusters. This method is particularly effective for identifying the “spatial reach” of the Flyover’s impact on community wellbeing. The statistic identifies locations where high or low PWI values are surrounded by similar values, resulting in statistically significant Hotspots and Cold Spots [35]. In the context of this study, this tool was prioritized to visualize the general “wellbeing landscape” and to determine whether the Flyover route intersects with large-scale clusters of low perceived wellbeing.
2.5.2. Cluster and Outlier Analysis (Anselin Local Moran’s I)
In the second stage, Anselin’s Local Moran’s I (LISA) was employed to refine the analysis by identifying spatial outliers. Unlike the Hotspot analysis, which focuses on similarity, LISA identifies locations that are significantly different from their neighbours [36]. This was a critical step for “unmasking” economic disparities that might be hidden within broader regional trends [37].
2.5.3. Hotspot Comparison Between Perceived Wellbeing and Economic Prosperity
To examine the spatial relationship between perceived wellbeing and economic prosperity, hotspots of PWI were compared with area-level income. The economic variable was aggregated to the same hexagonal grid used for the PWI, and Getis-Ord Gi* statistics were applied to identify significant hotspots and Cold Spots. Hexagons were then classified based on the co-location of PWI and economic significance (e.g., Hot-Hot, Cold-Cold, Hot-Not Significant, Cold-Not Significant), thereby enabling identification of neighbourhoods in which wellbeing aligns with or diverges from the local economy. These co-location patterns informed the exploratory typology of Thessaloniki neighbourhoods.
3. Results
3.1. Participants’ Demographics
A total of 341 participants completed the survey. However, not all respondents completed the questionnaire in full, prompting the establishment of a completeness threshold. Specifically, responses from participants who completed fewer than 50% of the items were excluded from the analysis. Consequently, data from 236 participants were retained for subsequent analysis. Table 1 presents the participants’ demographic characteristics. To assess the campaign’s representativeness, national demographic data for the Greek population were used for comparison [38,39].
Table 1.
Demographic characteristics of the study participants compared with national census data.
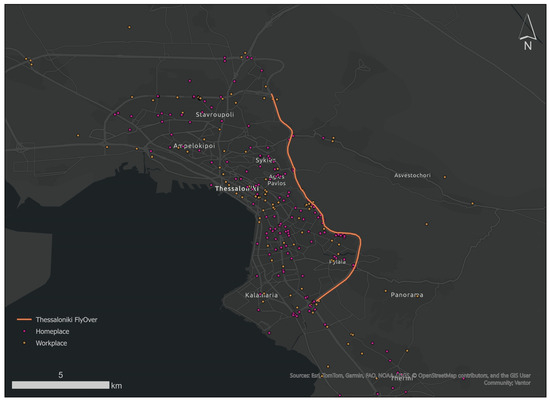
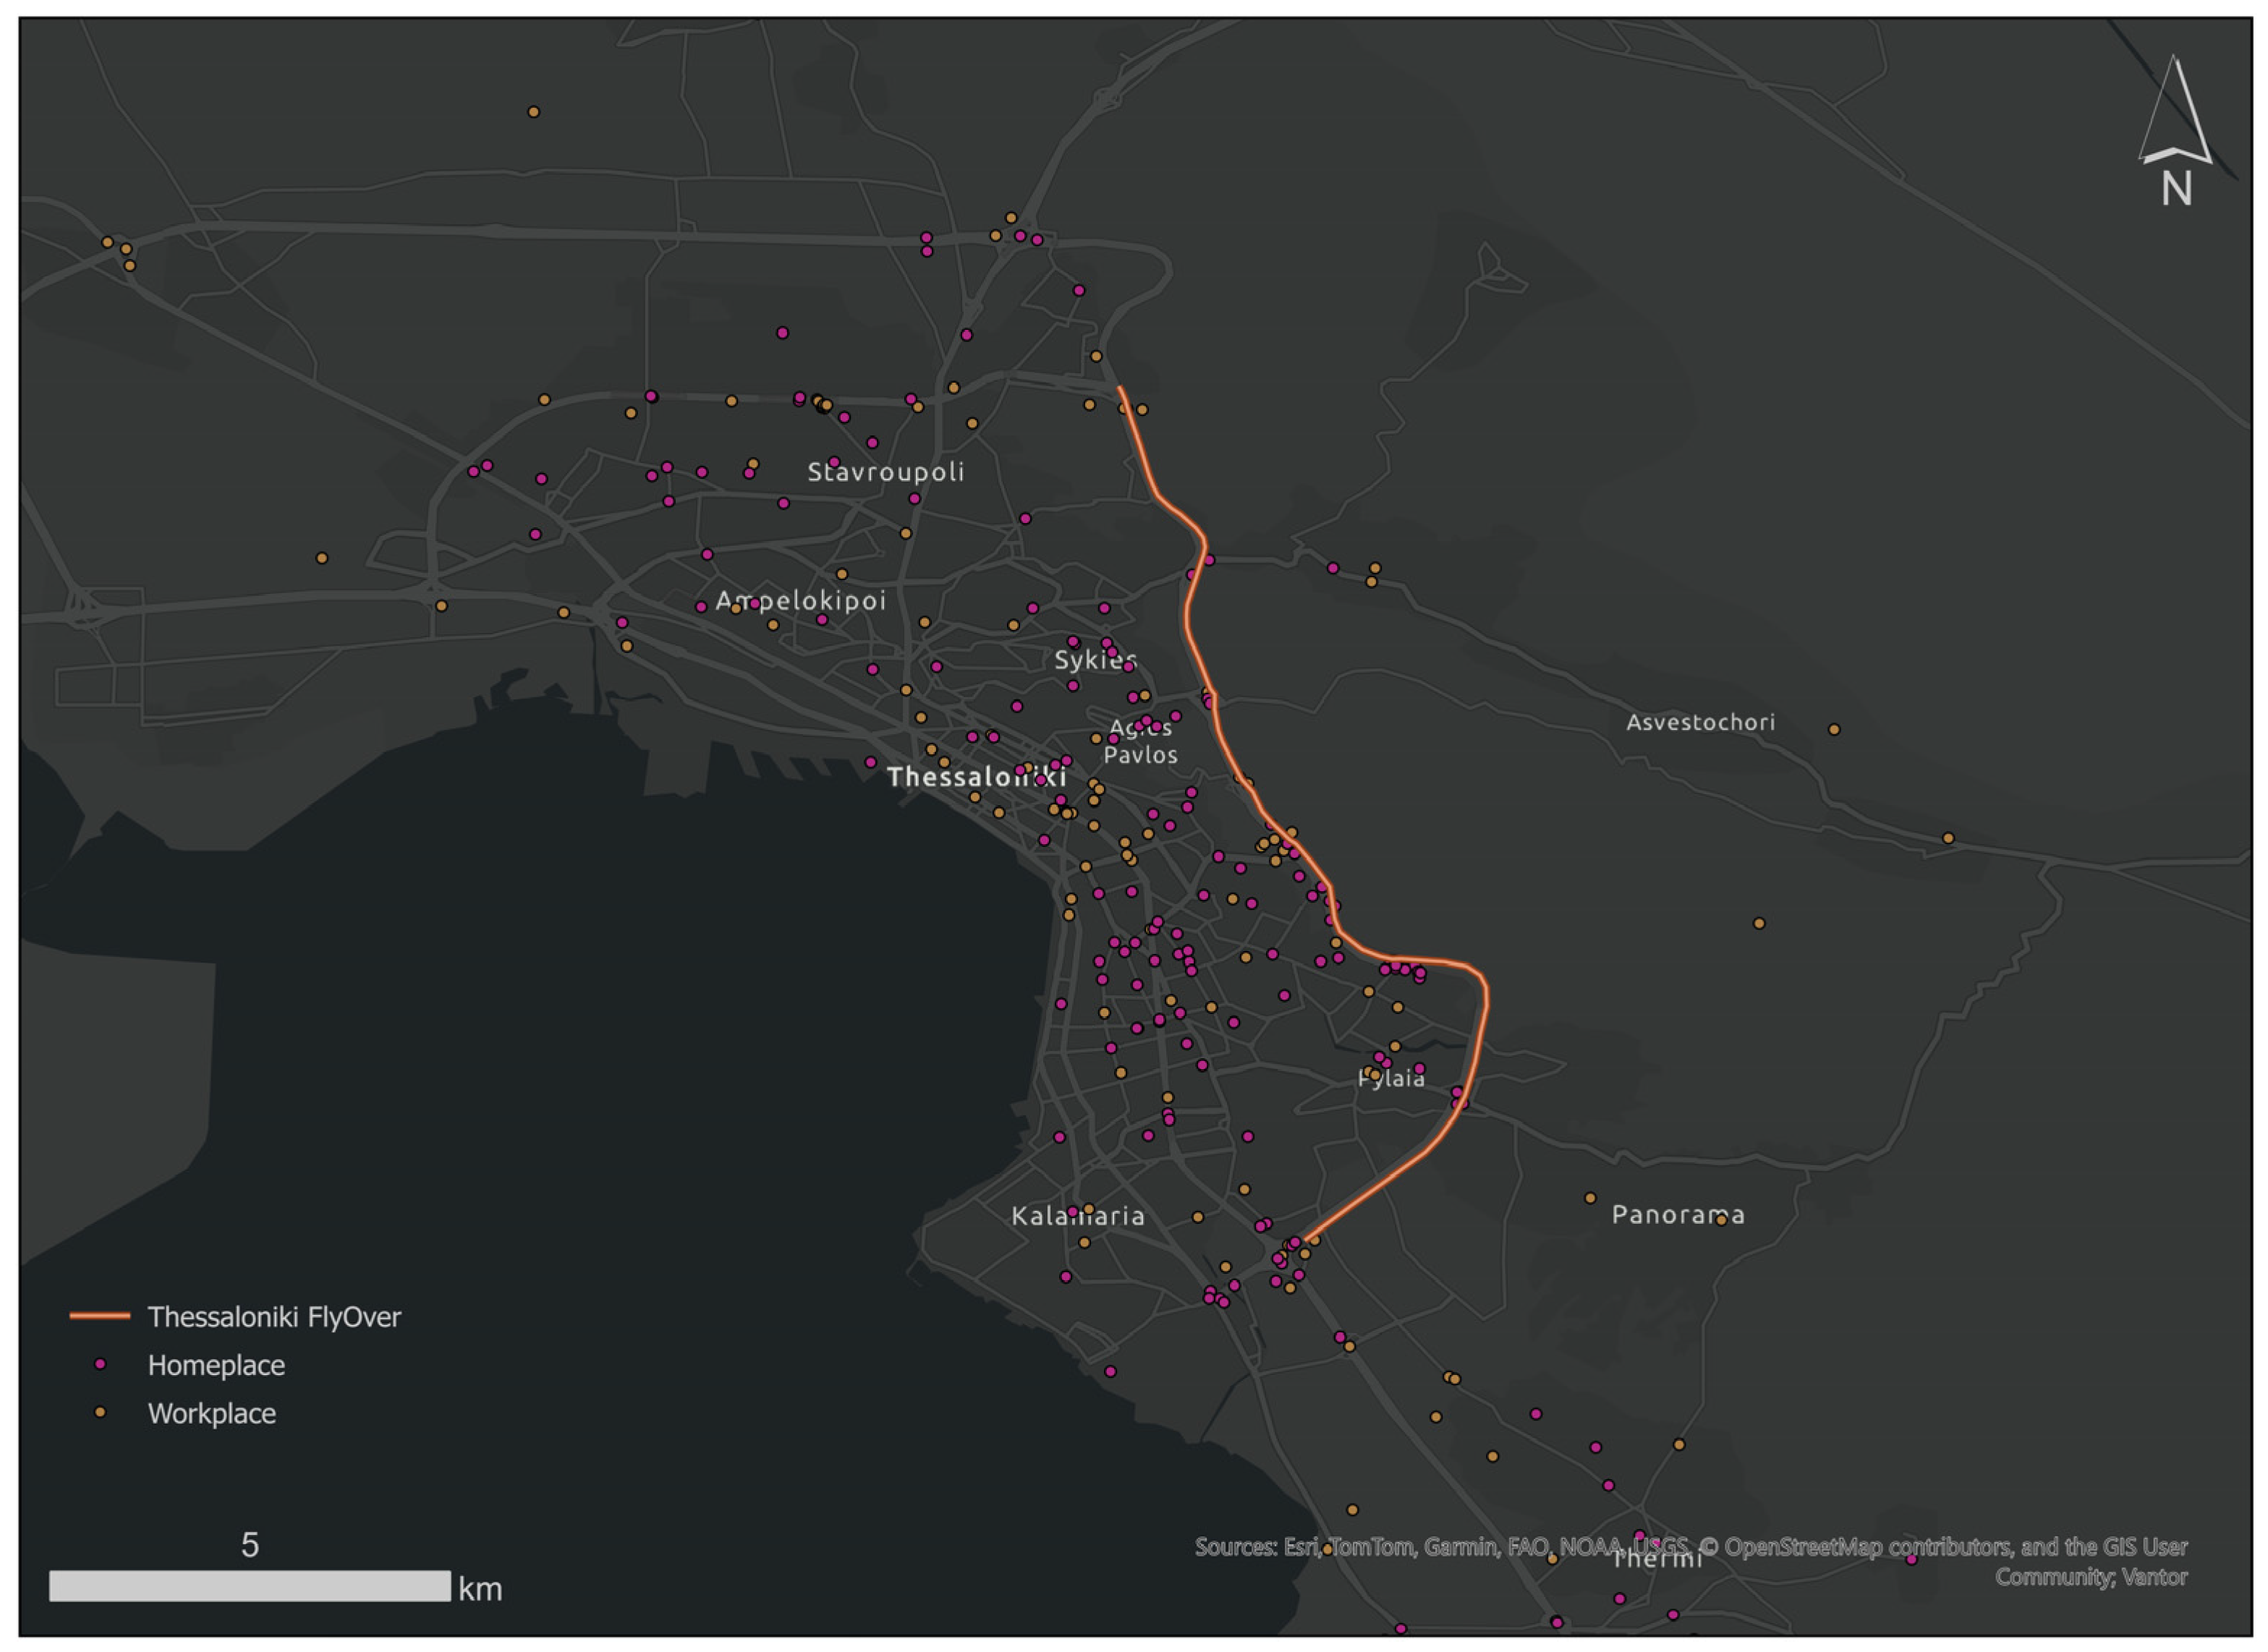
Females were overrepresented in the campaign. Most participants were employed, with a smaller proportion unemployed or otherwise economically inactive. Individuals with higher levels of education and higher incomes were also overrepresented. Compared with national demographic data, it was clear that the campaign did not fully represent either population. Participants aged 18–29 were overrepresented. Participants were asked to indicate their home and workplace locations on an interactive map within the questionnaire. The Spatial Distribution of Participant Locations (Figure 3) shows a dispersed pattern across Thessaloniki, including its outskirts. Workplaces situated outside Thessaloniki or Greece were excluded from the analysis.
Figure 3.
Spatial Distribution of Participant Locations.
3.2. Perceived Wellbeing Indicator (PWI)
3.2.1. Questionnaire Reliability and Structural Analysis for Indicator Development
The Stress thematic pillar, comprising items related to emotional strain, psychological burden, and perceived quality-of-life impacts, demonstrated excellent internal consistency (Cronbach’s α = 0.947). This high coefficient indicates strong coherence among the included items and suggests that they reliably capture a common underlying construct associated with the emotional and psychological impacts of commuting and construction-related disruptions. Items that did not contribute to internal consistency were excluded to enhance the scale’s reliability. The Accessibility pillar, which includes items addressing commuting time, delays, parking availability, access to services, and restrictions on daily activities, also exhibited very high reliability (Cronbach’s α = 0.903). This result confirms that the selected questions consistently measure the perceived impacts of construction works on urban mobility and accessibility. The Noise pillar, comprising items measuring perceived noise pollution at both the workplace and the place of residence, demonstrated good internal consistency (Cronbach’s α = 0.815). This indicates that the items reliably measure a single construct of environmental disturbance related to noise exposure. Finally, the Air Pollution pillar, based on items assessing perceived atmospheric pollution at the workplace and at the place of residence, demonstrated acceptable internal consistency (Cronbach’s α = 0.701). Although lower than the other pillars, this value remains above commonly accepted thresholds for exploratory research, indicating that the scale is suitable for inclusion in further analyses.
Table 2 summarizes the thematic pillars derived from the questionnaire, the items retained within each pillar following reliability analysis, the underlying constructs measured, and the corresponding Cronbach’s alpha values. The reliability coefficients demonstrate strong internal consistency for the Stress and Accessibility pillars and satisfactory reliability for the environmental disturbance pillars (Noise and Air Pollution). To achieve this reliability, 9 items were removed from the Stress pillar, while all items were retained in the remaining pillars. The questions are provided in Table A1 of Appendix A. Overall, the Cronbach’s alpha results support the reliability and construct validity of the developed thematic pillars.
Table 2.
Thematic pillars, questionnaire items, measured constructs, and reliability coefficients (Cronbach’s alpha).
The PCA extraction yielded six components with eigenvalues greater than 1, accounting cumulatively for 79.2% of the total variance. However, inspection of the eigenvalue distribution revealed a pronounced dominance of the first component (49.5%), followed by a substantial drop to the second component (9.3%) and a gradual levelling-off thereafter. This pattern suggests the presence of a strong general factor accompanied by smaller residual dimensions rather than six equally substantive components. The first two components together accounted for approximately 59% of the total variance and demonstrated the clearest and most theoretically coherent loading structure. Following Varimax rotation, items related to Stress and Wellbeing, Accessibility and Mobility, and Noise pillars loaded predominantly on Component 1, with factor loadings ranging from 0.61 to 0.91. This pattern indicates that respondents tend to perceive construction-related impacts as an integrated experience, reflecting a broader construct associated with psychosocial strain and daily mobility disruption. In contrast, items measuring Air Pollution (Q21, Q32) loaded strongly on Component 2 (0.82–0.83), indicating that perceived air pollution constitutes a partially distinct environmental dimension. This differentiation supports the conceptual distinction between air quality impacts and the broader psychosocial–mobility-related effects captured by the first component. Although additional components (3–6) exceeded the Kaiser threshold (eigenvalue > 1), their individual variance contributions were modest (3.7–6.2%), and their loading patterns exhibited cross-loadings and limited theoretical coherence (see Table A2 and Table A3). So, dimensional retention was therefore guided not solely by the Kaiser threshold, but also by the variance distribution, interpretability, and theoretical alignment. Overall, the PCA results indicate a predominantly general impact dimension with a secondary environmental differentiation, providing evidence of structural validity while also highlighting the integrated nature of perceived construction-related effects.
Despite the strong statistical association among Stress, Accessibility, and Noise, these domains were retained as separate pillars in the composite index to preserve conceptual and policy-relevant distinctions: Stress captures perceived psychosocial strain, Accessibility and Mobility captures access to urban amenities and mobility disruption, and Noise captures environmental exposure. Maintaining them as independent pillars ensures the index conveys meaningful information for interpretation and decision-making beyond what statistical covariance alone represents.
To further examine the relationships between the four thematic pillars, Pearson and Spearman correlation analyses were conducted. Pearson correlations were computed on the mean scores of each pillar, while Spearman’s rho was applied, given the ordinal nature of the underlying Likert-scale items. Pearson correlation results (Table 3) indicated statistically significant positive associations across all pillars, with coefficients ranging from r = 0.595 (Stress and Air Pollution) to r = 0.887 (Stress and Accessibility; p < 0.01). The strongest correlation was observed between the Stress and Accessibility pillars, indicating some overlap between these constructs. However, stress reflects perceived environmental strain, whereas accessibility measures proximity and ease of movement. The observed correlation likely arises from the fact that reduced accessibility contributes to higher perceived stress in areas affected by construction. This potential limitation regarding discriminant validity should be considered when interpreting the results. Future studies could consider alternative indicators or multivariate techniques to further disentangle these constructs and reinforce discriminant validity. Lower, yet significant, correlations between Stress and Air Pollution confirm that the pillars represent distinct constructs while remaining related aspects of the urban experience. Similarly, Spearman correlation analysis yielded strong positive associations across all pillars (ρ = 0.768–0.876, p < 0.001), with the highest correlation between Noise and Air Pollution (ρ = 0.876). This further indicates that perceived environmental disturbances tend to co-occur, while remaining conceptually distinguishable from psychosocial impacts. Together, these correlation results provide evidence for convergent validity, confirming that the thematic pillars measure related aspects of the impacts of construction and urban mobility conditions, while maintaining discriminant validity, as the correlations are strong but do not approach unity. These findings complement the PCA results, which identified a shared underlying dimension for Stress, Accessibility, and Noise, and a separate dimension for Air Pollution, reinforcing the conceptual structure of the index.
Table 3.
Pearson and Spearman correlations between thematic pillars (above and below, respectively).
These results reinforce the conclusion that the proposed index captures interrelated yet conceptually distinct dimensions of psychosocial strain, mobility disruption, and environmental impacts, supporting its use as a robust tool for assessing the multifaceted effects of urban construction projects.
3.2.2. Pillars Weighting
PCA-Derived Weights
Principal Component Analysis (PCA) identified four principal components from the questionnaire items, which together explain key dimensions of urban environmental perception. Component 1, labelled “Stress,” exhibited the highest mean loading (0.809), with loadings ranging from 0.664 (Q10) to 0.906 (Q41), indicating a robust association with stress and wellbeing factors. Component 1 also captured “Accessibility and mobility”, though with moderate mean loading (0.590) and variability (e.g., low Q11 at –0.094 vs. high Q38 at 0.825), suggesting nuanced accessibility perceptions. Component 2 (“Noise”) included Q23 (0.722) and Q33 (0.693), with a solid mean loading of 0.708, highlighting auditory environmental stressors. Component 3 (“Air Pollution”) comprised Q21 (0.827) and Q32 (0.382), yielding a mean loading of 0.605 and reflecting air quality concerns, although Q32 contributed less. These components demonstrate a clear factorial structure, with Component 1 accounting for most of the variance through high-loading stress and accessibility items, supporting their use in subsequent weighting for the composite indicator. The mean loadings were then normalized to sum to 1, and the final PCA-derived weights are presented in Table 4.
Table 4.
Derived weights per method.
AHP-Derived Weights
After applying the Analytic Hierarchy Process, the following weights (Table 5) for the objective and subjective factors were obtained, with a consistency ratio of 9.5%.
Table 5.
Derived weights from AHP.
Hybrid Weights
The hybrid weights were calculated as the mean of the PCA-derived objective weights and the AHP-derived authors’ judgement weights, integrating both data-driven variance patterns and expert assessment to produce a balanced weighting scheme for the indicator. The results of all implemented methods are presented in Table 4.
Sensitivity Analysis Results
Sensitivity analysis compared pillar rankings and composite indicator scores across PCA, AHP, and hybrid weighting schemes, revealing high consistency among methods. Pillar ranking correlations showed a strong positive association between PCA and AHP (r = 0.800) and between PCA and hybrid (r = 0.800), and a perfect correlation between AHP and hybrid (r = 1.000), indicating nearly identical priority structures. Pearson correlations between composite indicators further confirmed robustness: PCA vs. AHP (r = 0.930, p < 0.001), PCA vs. hybrid (r = 0.994, p < 0.001), and AHP vs. hybrid (r = 0.965, p < 0.001), all based on n = 234 cases. Spearman rho correlations yielded similarly strong results: PCA vs. AHP (ρ = 0.930, p < 0.001), PCA vs. hybrid (ρ = 0.992, p < 0.001), and AHP vs. hybrid (ρ = 0.966, p < 0.001). Although sensitivity analysis revealed very high correlations among PCA, AHP, and hybrid weighting schemes (r = 0.93–0.99), indicating largely consistent rankings and scores, the hybrid approach was retained to integrate objective data patterns with expert judgement, providing a transparent framework that balances quantitative robustness with stakeholder-informed priorities. So, the proposed indicator is shaped as follows. All variables were aggregated in their original scales, since they were measured on comparable units; no standardization was applied.
3.3. Geospatial Assessment of Perceived Wellbeing
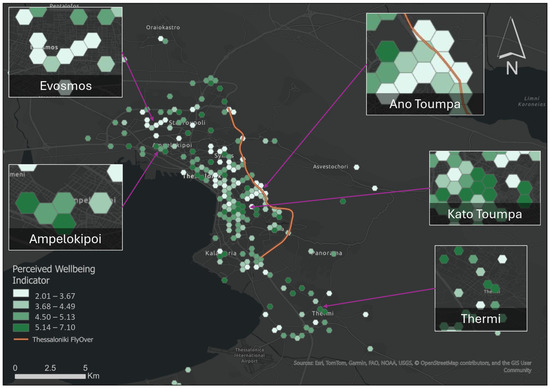
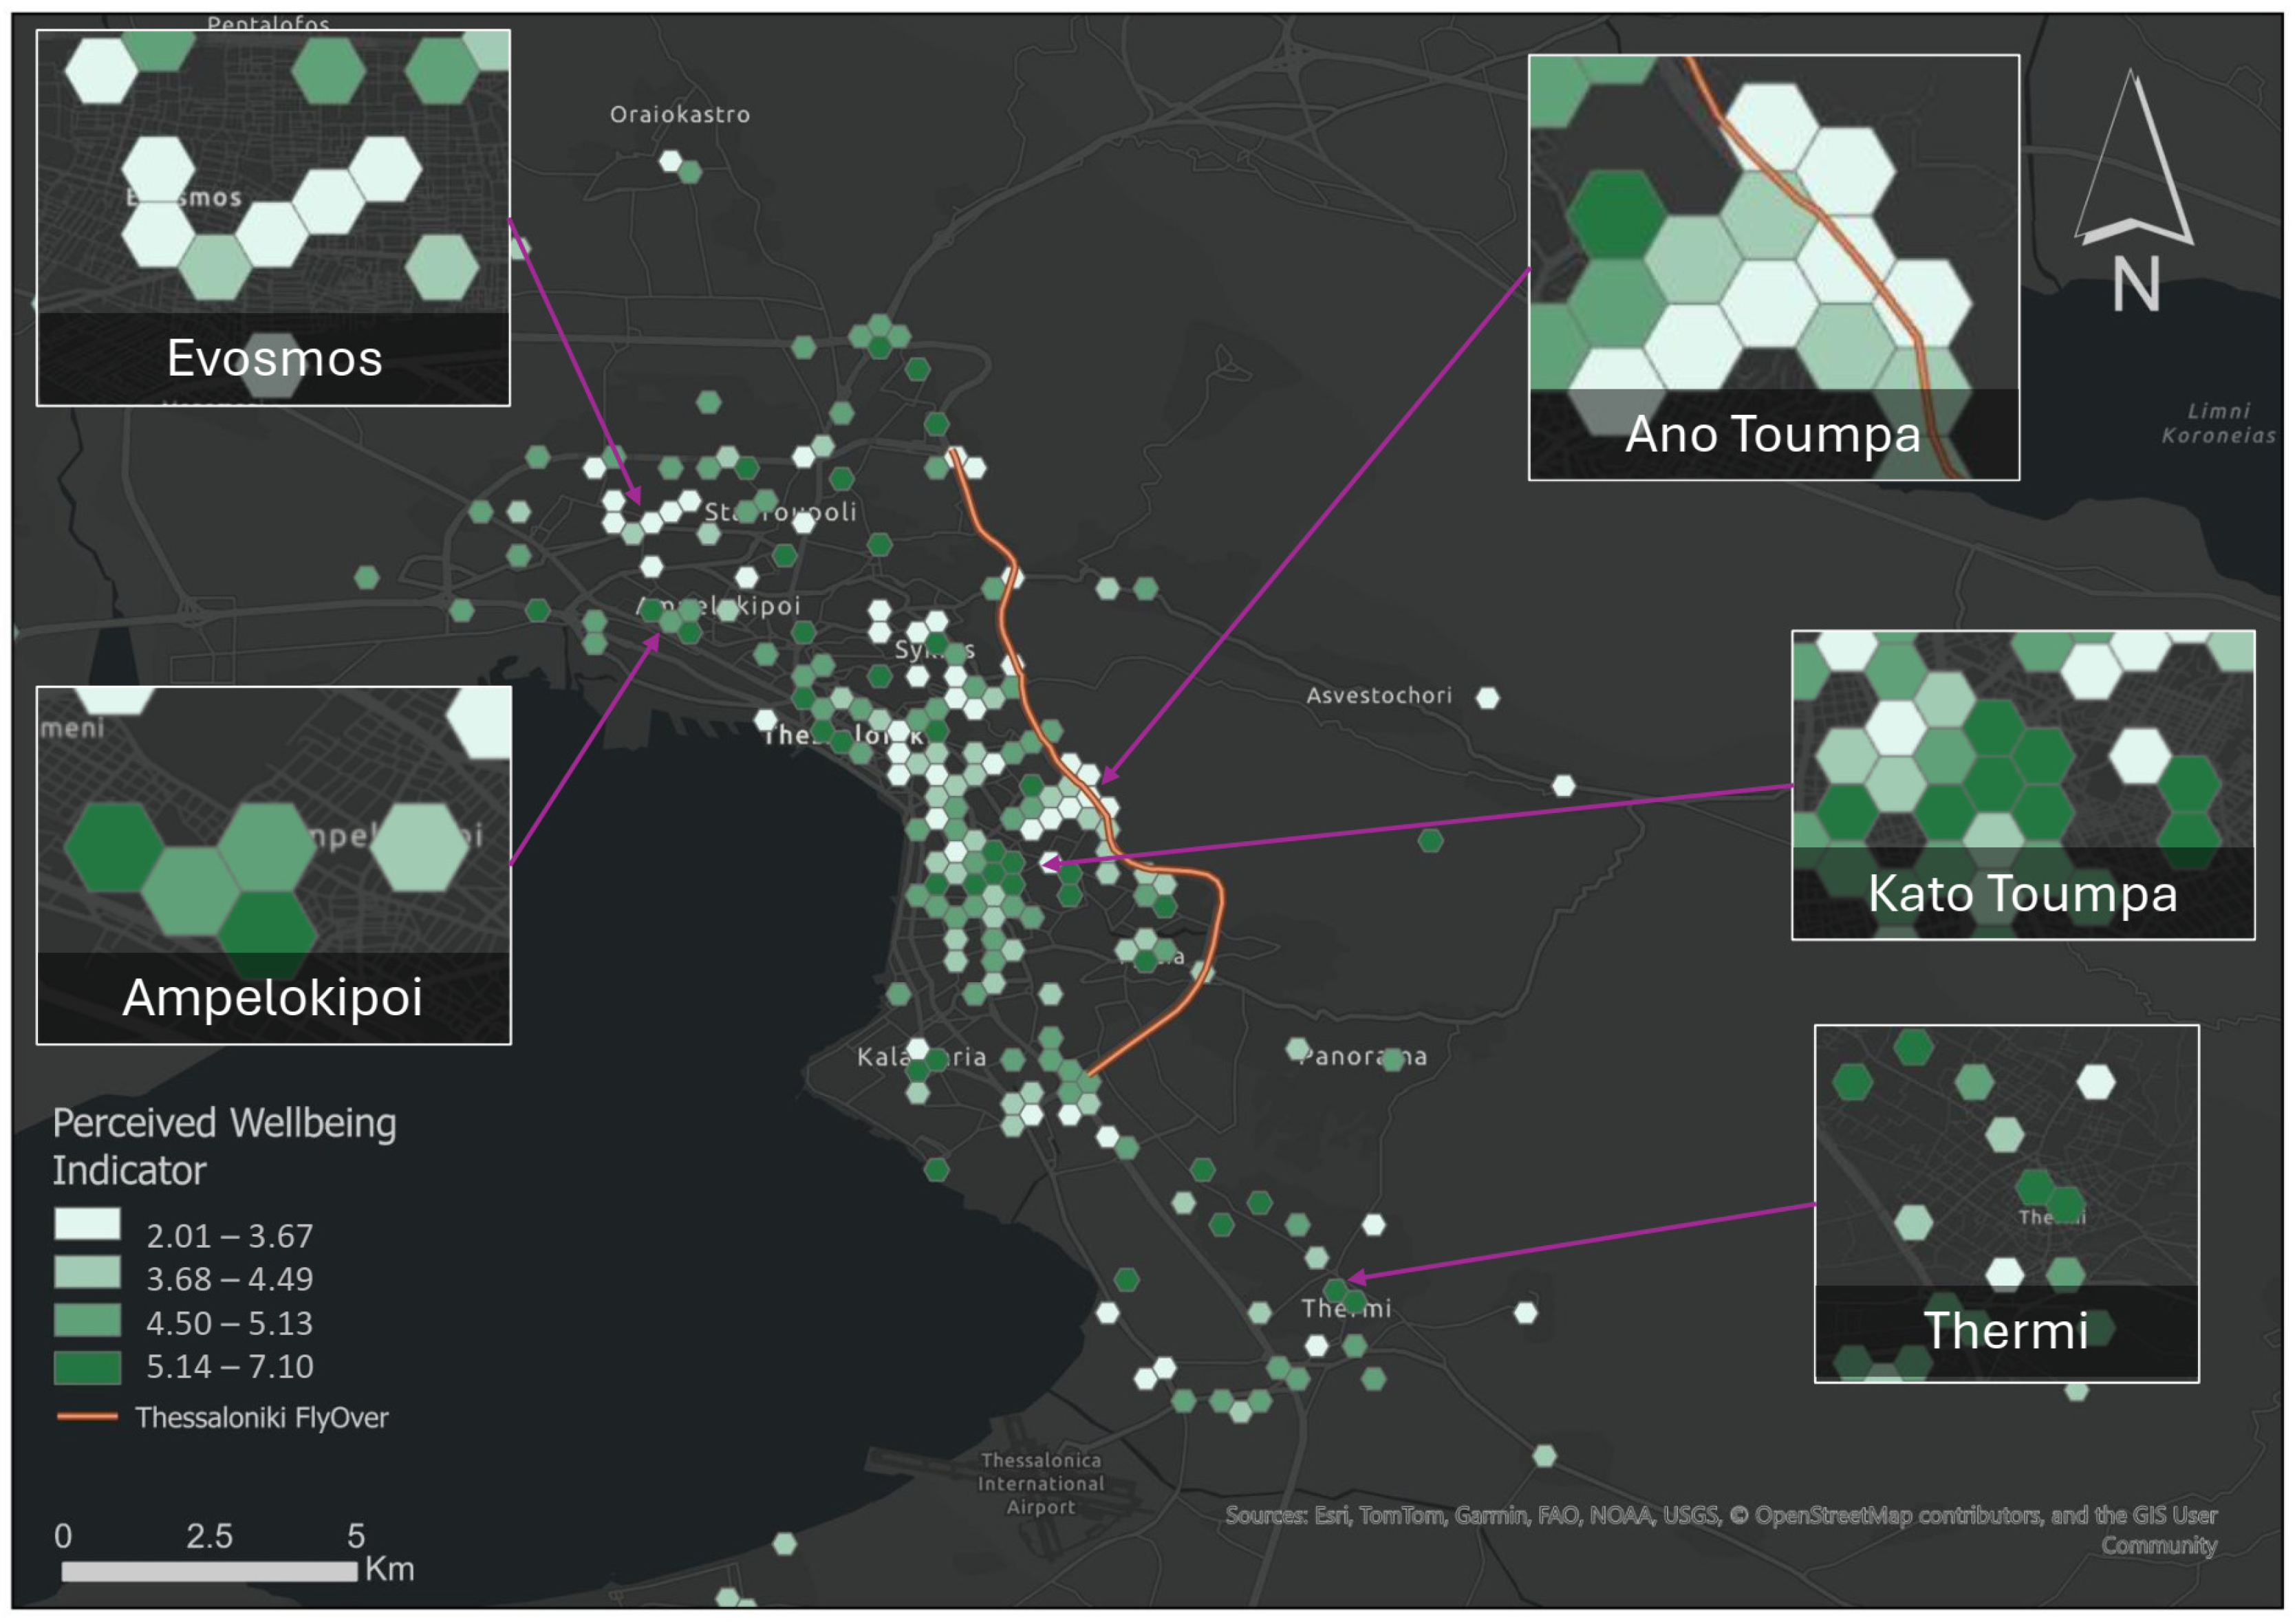
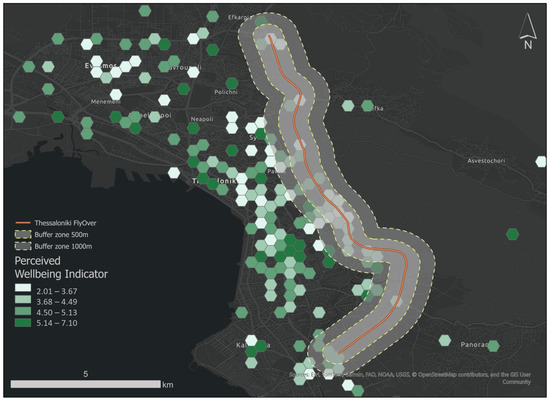
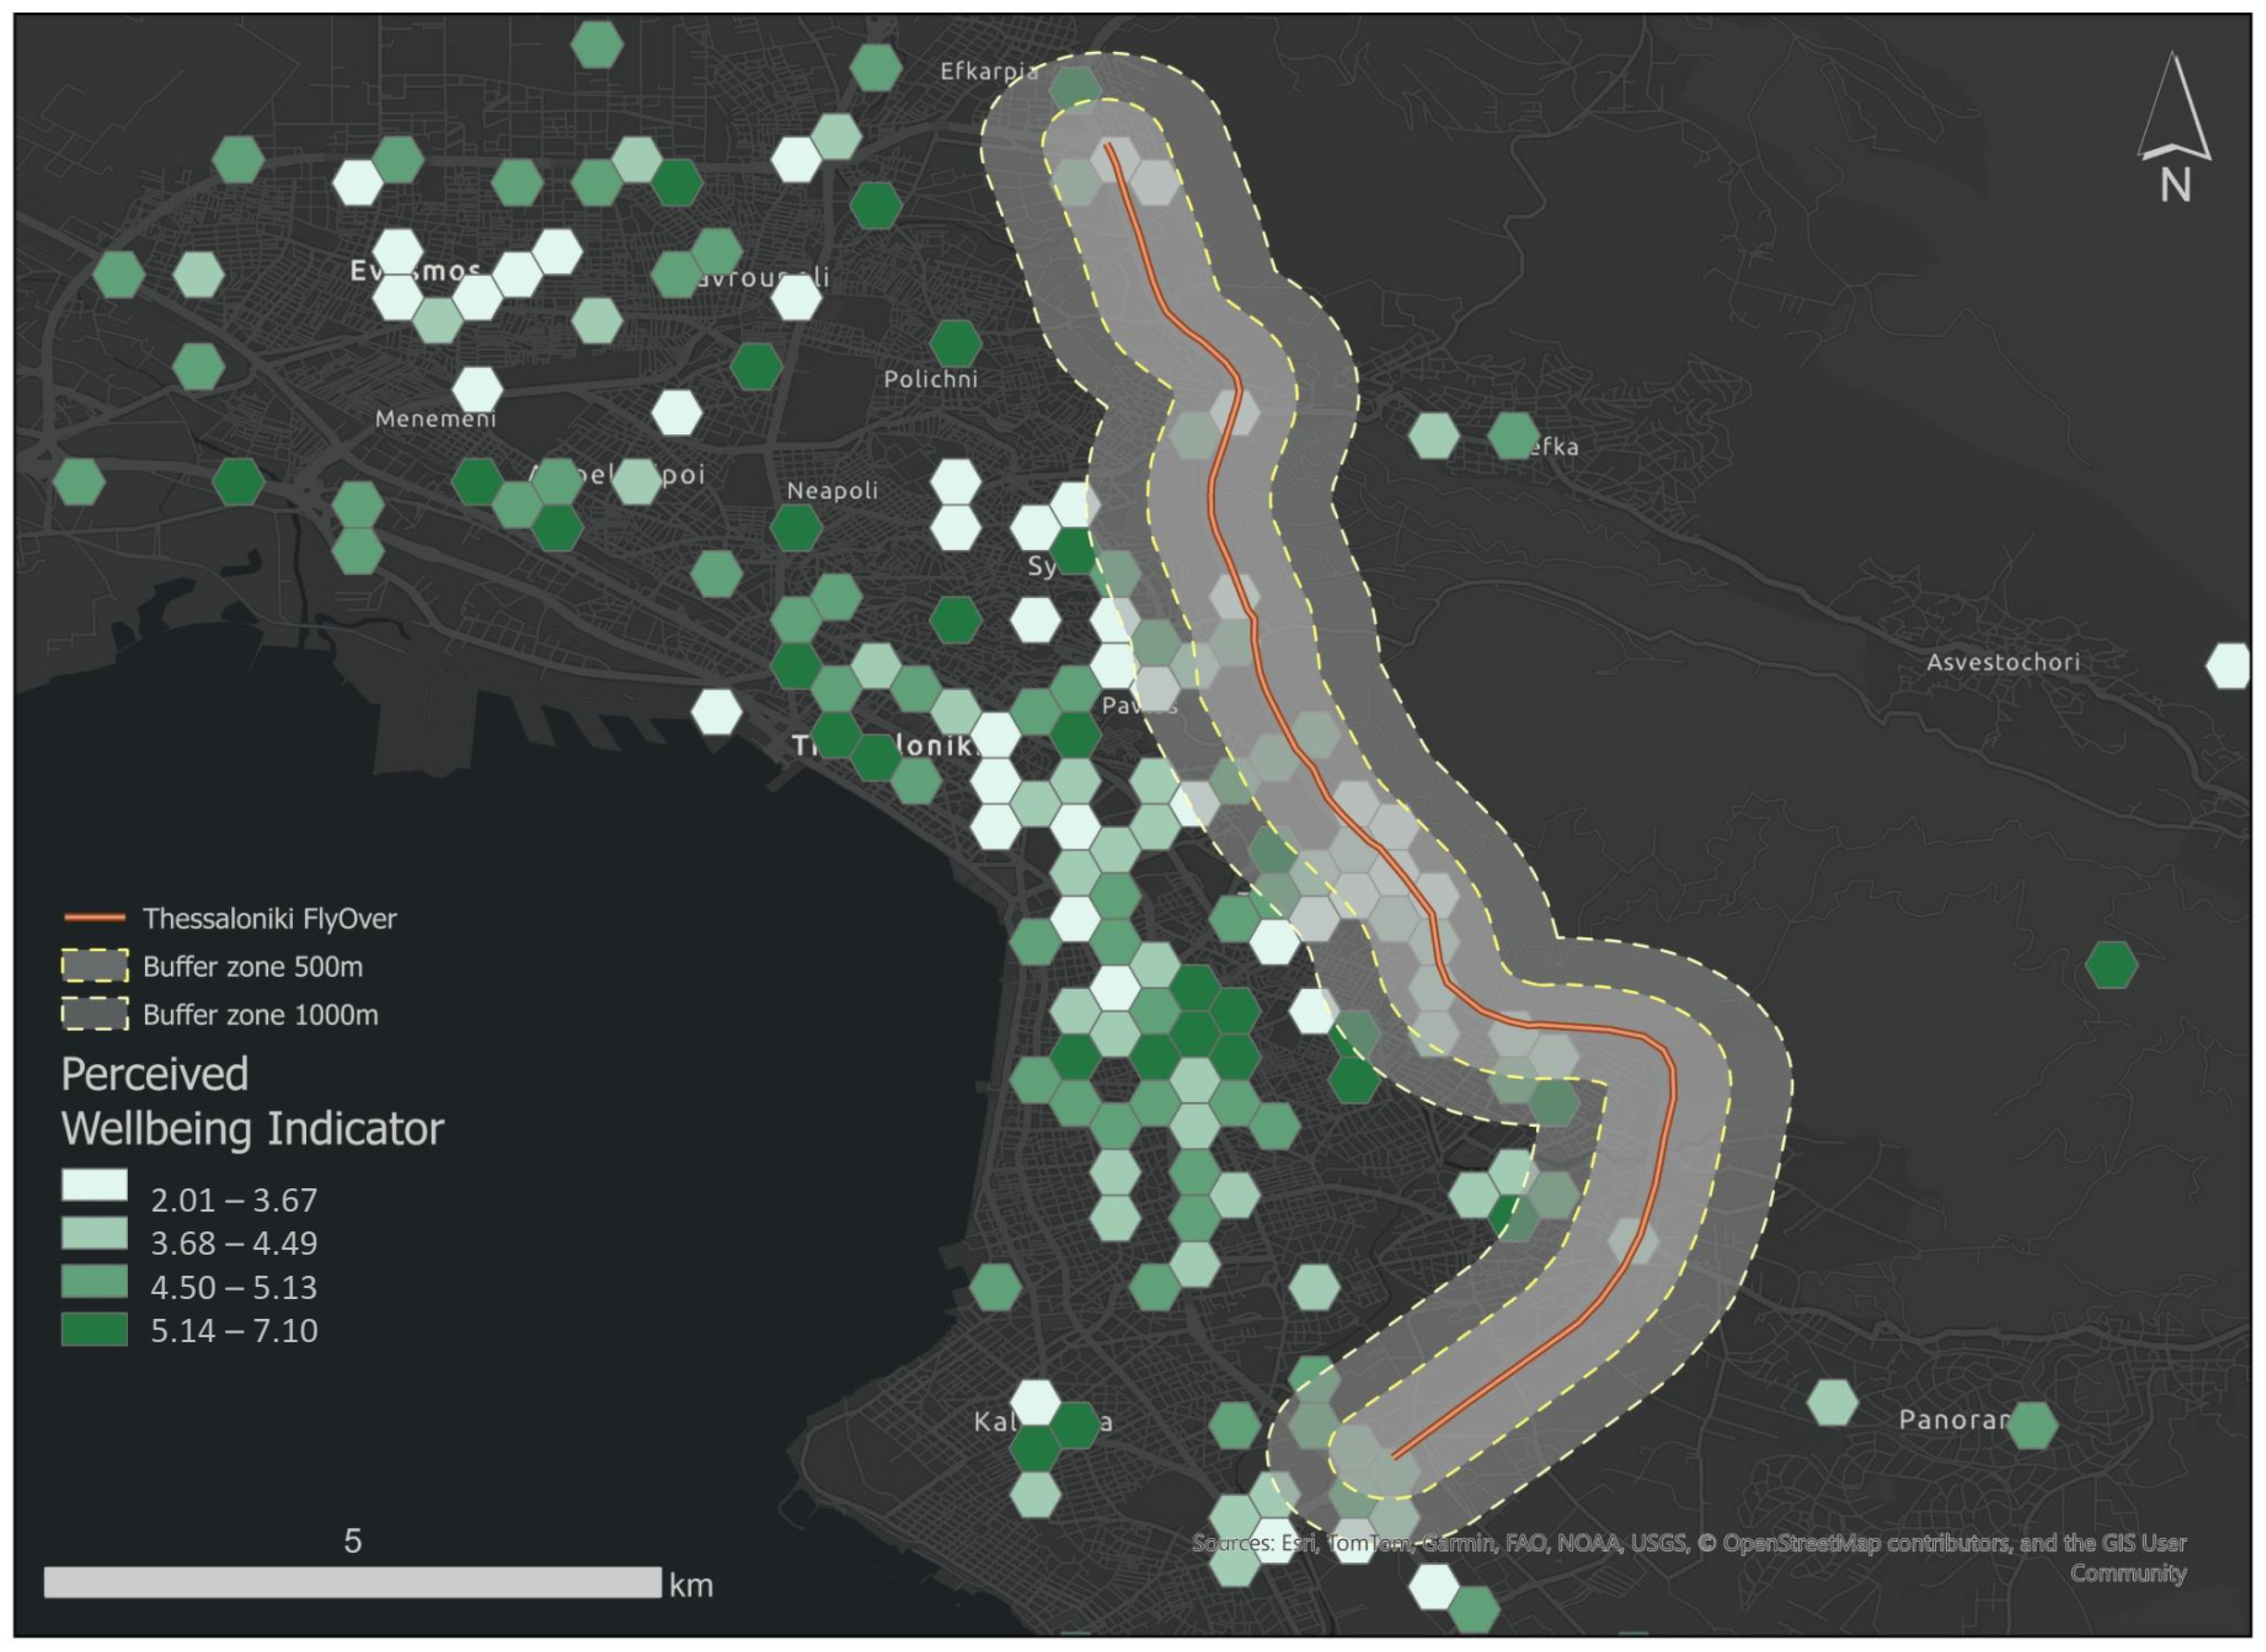
Following initial data collection, raw point values were aggregated into a hexagonal grid to normalize for varying response densities and to mitigate the Modifiable Areal Unit Problem (MAUP). No spatial weighting or adjustment for sampling density was applied. The spatial analysis reflects the observed distribution of respondents across space. Figure 4 displays the mean PWI score per hexagon, providing a clearer visualization of the city’s wellbeing gradient. The hexagonal map clearly illustrates a broad geographic disparity in wellbeing. The lowest values are identified in Evosmos (northwestern), in the city centre and Ano Toumpa (north-eastern), with lower mean PWI values (2.01–4.49). By contrast, the Southeastern peri-urban areas (Thermi), Kato Toumpa, and Ampelokipoi show a high concentration of dark-green hexagons, indicating significantly higher average wellbeing (5.14–7.10). The map highlights specific areas of concern where the Flyover route intersects with residential zones. Notably, in the Ano Toumba and Sykies regions, hexagons directly adjacent to the construction areas often exhibit lower mean scores than their immediate neighbours farther from the axis. This suggests that the aggregation process has successfully captured a localized spatial pattern characterized by lower wellbeing values. Figure 5 depicts the spatial variation in PWI with buffer zones of 500 m and 1000 m, respectively, enabling a proximity-based assessment of potential construction-related impacts. Mean PWI values inside and outside the buffer zones are shown for descriptive comparison, although no formal statistical tests were performed. Hexagons intersected by the 500 m buffer zone tend to exhibit lower PWI values than more distant areas, suggesting a potential proximity effect associated with the construction. Intermediate patterns observed within the 1000 m buffer indicate a gradual attenuation of this effect with distance.
Figure 4.
Spatial distribution of the Perceived wellbeing Indicator.
Figure 5.
Spatial distribution of the Perceived wellbeing Indicator in relation to the construction area.
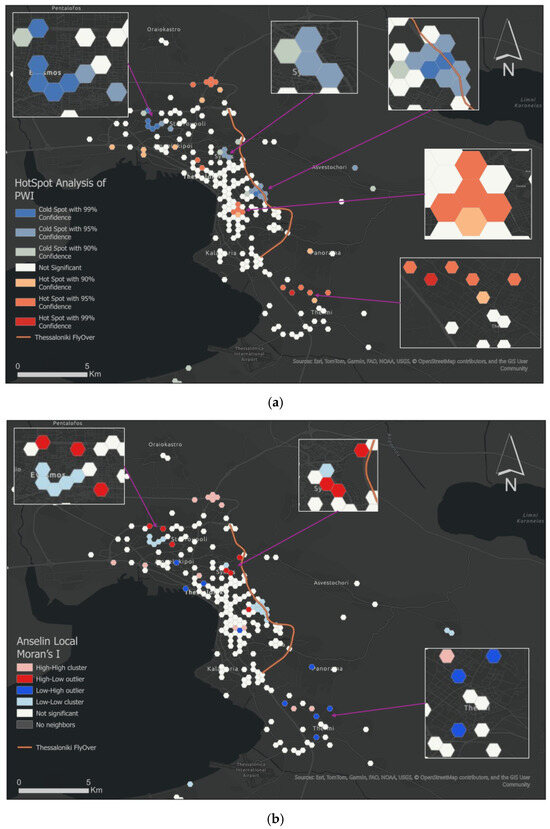
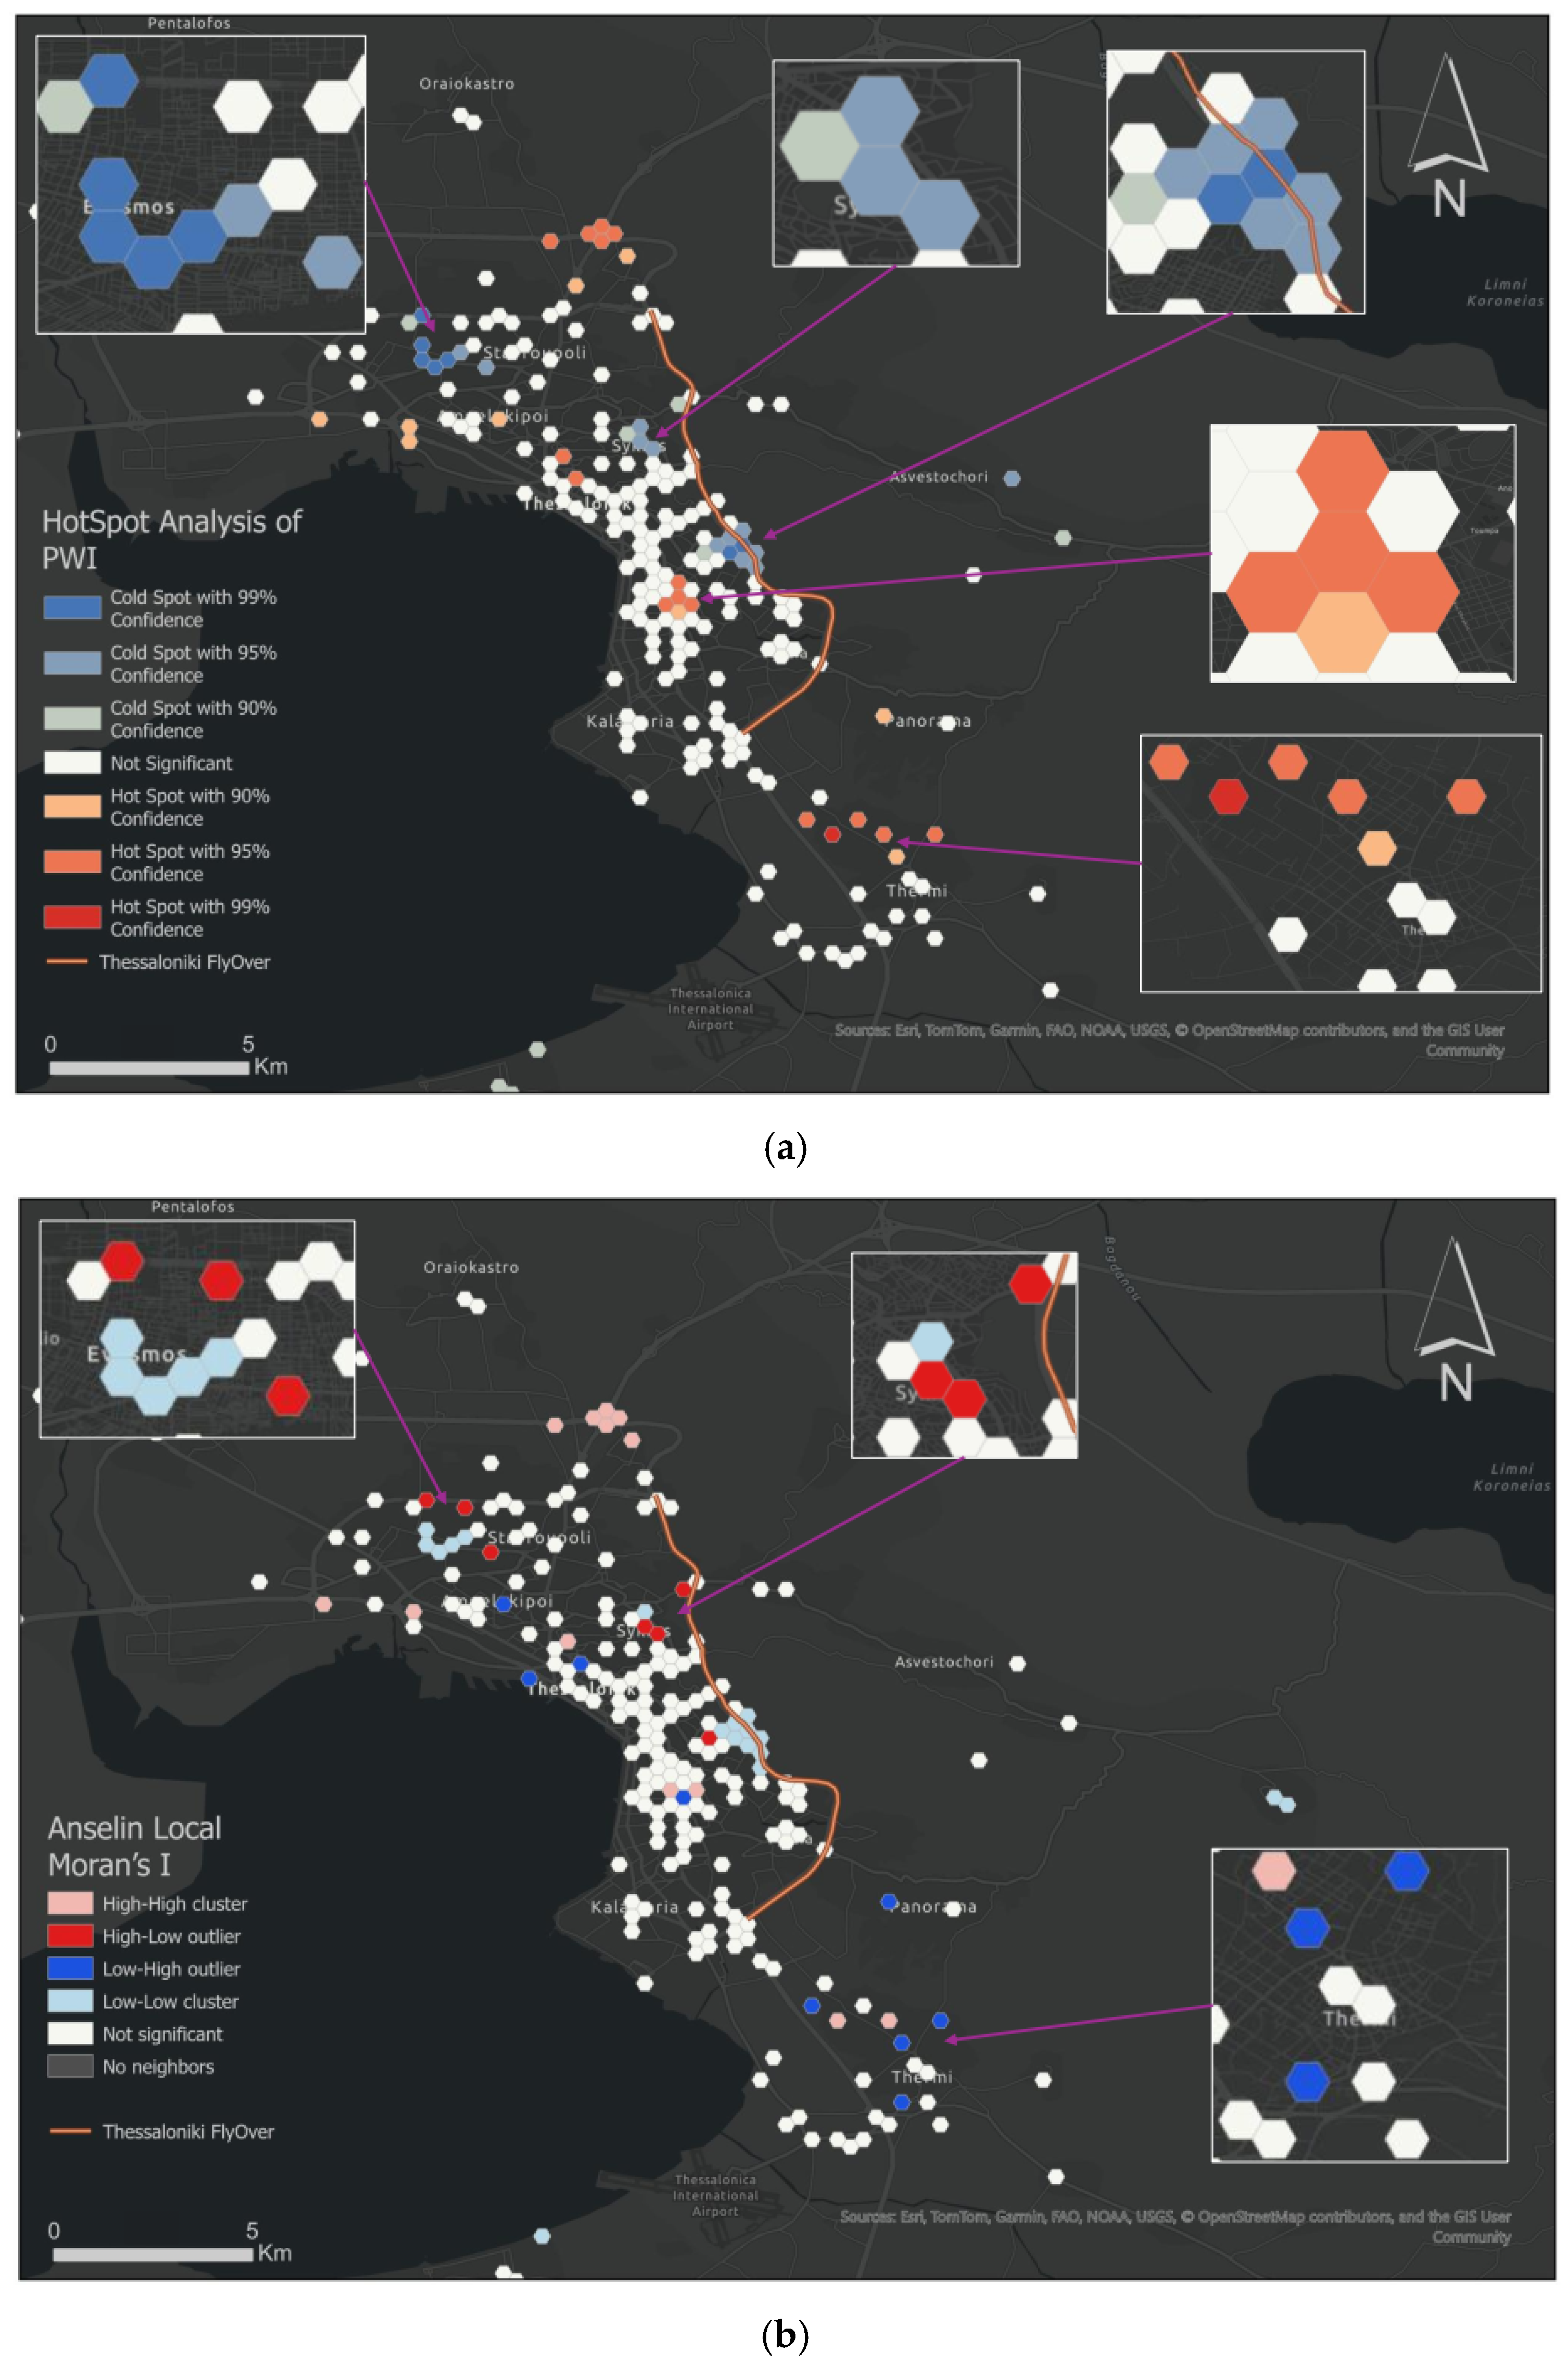
The Getis-Ord () Hotspot Analysis (Figure 6a) reveals a marked spatial polarization of Perceived Wellbeing Indicator (PWI) across the study area using the K nearest neighbours method. Eight neighbours were selected to balance detection of local spatial patterns with statistical stability: fewer neighbours could yield unstable Gi* values in sparse areas, while more neighbours could smooth out meaningful local variations. A statistically significant Cold spot (at a confidence level > 95%) is identified northeast (Ano Toumpa), an area where Flyover intersects the district directly. Beyond the intersection at Ano Toumba, other significant Cold spots were identified in Evosmos and Sykies, indicating a concentration of residents with lower perceived wellbeing, even though the Flyover does not physically intersect these areas. This suggests that wellbeing perceptions are influenced by broader district-level characteristics rather than immediate proximity to the infrastructure axis alone. Conversely, a robust Hotspot of high perceived wellbeing (at a confidence level > 95%) is in the southeastern peri-urban zone (Thermi), in Efkarpia (northwestern), and in Kato Toumpa. Rest areas intersected by the flyover project are predominantly statistically non-significant.
Figure 6.
(a) Hot spot analysis of Perceived wellbeing Indicator, (b) Local Moran’s I of Perceived wellbeing Indicator.
Figure 6b further refines these findings by identifying specific outliers. The Local Moran’s I analysis identified 47 statistically significant local spatial associations (p ≤ 0.05; |Z| > 1.96), with Z-scores ranging from –3.41 to +4.07. These included 13 high–high clusters and 18 low–low clusters, indicating spatial concentration of similar perceived wellbeing levels. Additionally, 7 high–low and 9 low–high spatial outliers were detected, reflecting localized spatial contrasts. Notably, High-Low (HL) outliers were detected in Sykies, representing areas of high wellbeing within a statistically significant low-wellbeing environment. On the contrary, the presence of Low-High (LH) outliers in the southeastern sector (Thermi) highlights localized “Pockets of Vulnerability” where residents report significantly lower wellbeing than their immediate neighbours.
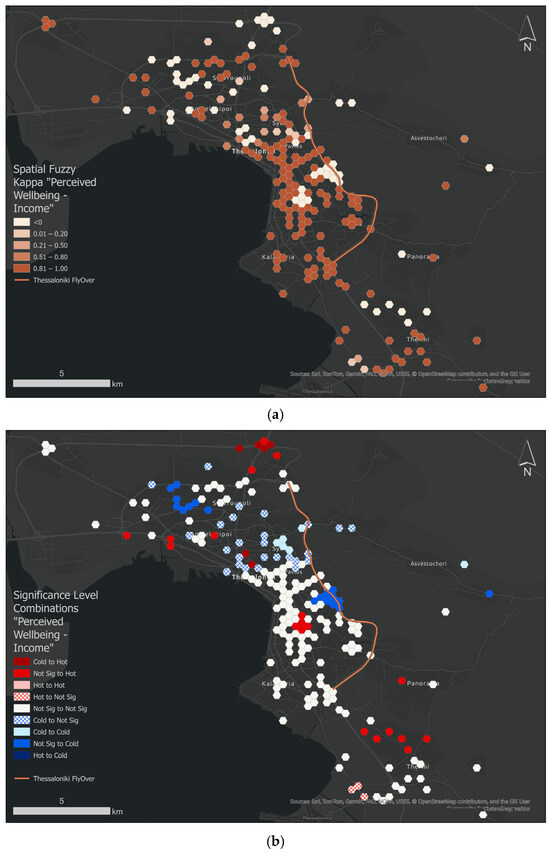
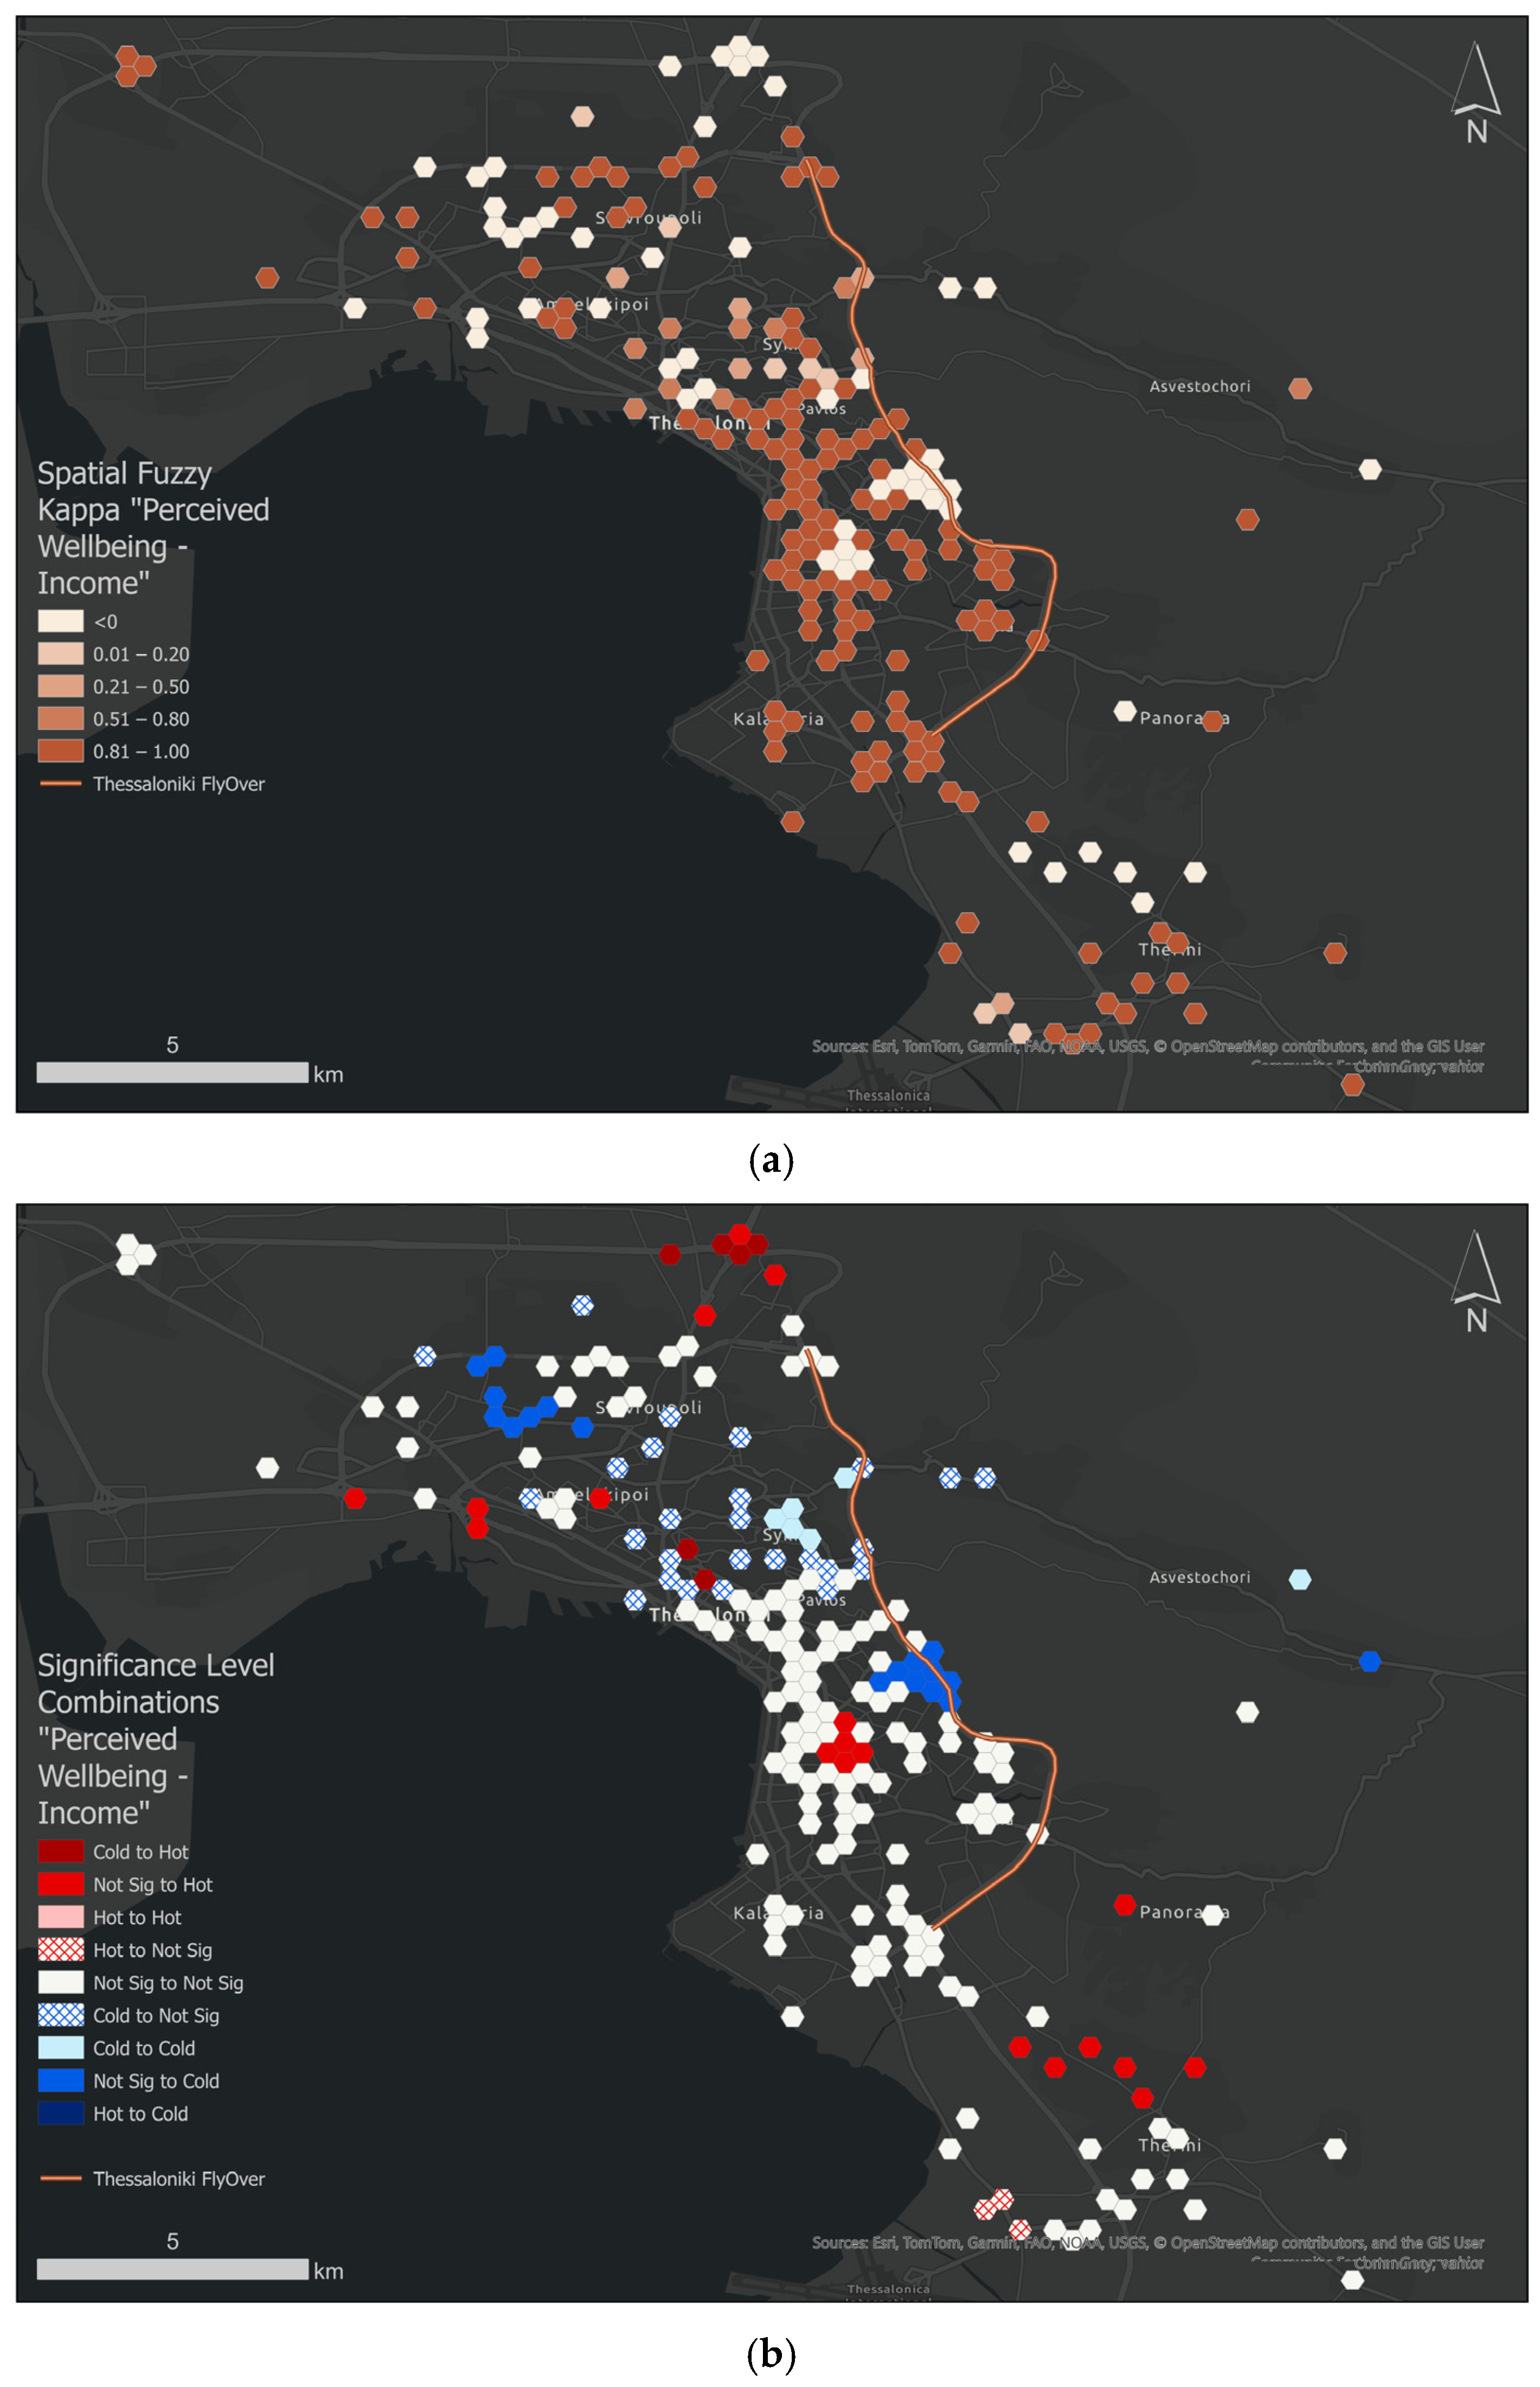
Figure 7a presents the spatial distribution of local spatial fuzzy kappa values between perceived wellbeing and income, calculated at the hexagonal grid level. Default classification thresholds and the default fuzziness parameter (0.5) were applied, and no parameters were manually modified. This approach allows assessment of spatial congruence while accounting for partial membership in neighbouring classes. Darker shades indicate higher kappa values, reflecting more pronounced spatial heterogeneity in the relationship between economic prosperity and perceived wellbeing. These high kappa values (0.81–1.00) dominate the central urban area of Thessaloniki and adjacent corridors, indicating very strong to near-perfect spatial agreement, suggesting that income levels closely align with perceived wellbeing in these locations. Conversely, lower kappa values in peripheral zones highlight areas where wellbeing appears to be influenced by additional contextual factors. Overall, the results demonstrate that while economic prosperity is a key determinant of wellbeing across much of the study area, its influence is not spatially uniform. Figure 7b depicts the spatial distribution of statistically significant local combinations between perceived wellbeing and income.
Figure 7.
Spatial distribution of (a) local spatial fuzzy kappa values between perceived wellbeing and income, (b) statistically significant local combinations between perceived wellbeing and income.
- Cold to Hot areas (dark red) denote areas where income is a cold spot (significantly low) but perceived wellbeing is a hot spot (significantly high). These areas are only notified in Efkarpia and a few in the city centre, implying that, despite economic hardship, the population reports high perceived wellbeing.
- Not Significant to Hot areas (red) like in Kato Toumpa and Thermi, denote areas where income is not significant (average/random), but Wellbeing is a Hot Spot. In these areas, wellbeing is “over-performing” relative to wealth, so the high wellbeing is likely driven by Non-Economic Factors. This could be due to the physical environment (e.g., parks or proximity to nature) or to specific demographics (e.g., a high concentration of retirees or a particular gender balance).
- Not Significant to Cold (light blue) areas, such as in Ano Toumpa and Evosmos. In this case, income is not significant (average/random), but Wellbeing is significantly low. These are areas where wellbeing is “under-performing.” Even though these people are not technically in an “income cold spot,” they feel significantly worse than their neighbours. These are “At-Risk” areas. They may not qualify for economic aid solely based on salary, but they are clearly struggling.
- Cold to Not Sig areas (blue hash) denote areas where the perceived wellbeing is low, but the relationship between wellbeing and income is not significant. People in these areas (i.e., the western part of the city centre) report lower wellbeing, but income differences are not evident in the data.
Following the completion of the spatial analyses, the results were synthesized to develop an exploratory typology of neighbourhoods within the city of Thessaloniki. The typology was constructed by jointly considering absolute levels of perceived wellbeing (PWI), their spatial configuration, and their relationship with surrounding socioeconomic conditions. Specifically, local wellbeing intensity, spatial embeddedness, and co-location with income patterns were used to characterize distinct spatial wellbeing profiles across the study area.
To enrich the interpretation of these spatial patterns, additional contextual information was incorporated. Socioeconomic context was represented by the child dependency ratio, while environmental conditions were captured by residents’ perceptions of annoyance from air and noise pollution. These variables were not treated as spatially analyzed indicators but were included to provide complementary insight into neighbourhood conditions. Environmental stress indicators were calculated as area-level ratios based on survey responses and subsequently classified into qualitative frequency categories (e.g., rare, often, very often). No spatial statistical analysis was applied to these variables. Their role in the analysis is therefore descriptive and interpretative, supporting the contextual understanding of the identified wellbeing patterns rather than contributing to their spatial delineation. The resulting typology combines absolute perceived wellbeing levels, their spatial embeddedness, and their co-location with socioeconomic conditions. It is intended as an exploratory, place-based framework that supports the interpretation of spatial heterogeneity in perceived wellbeing across Thessaloniki, rather than as a basis for causal inference.
Table 6 summarizes neighbourhood typologies by combining absolute perceived wellbeing levels, their spatial embeddedness, and their co-location with economic prosperity.
Table 6.
Neighbourhood Profiles Combining Wellbeing and Economic prosperity spatial patterns.
The typology presented in Table 6 is based exclusively on spatial wellbeing structure and its spatial-economic alignment. To further interpret and contextualize the identified types, additional descriptive variables (namely child dependency ratio, frequency of perceived air pollution annoyance, and frequency of perceived noise pollution annoyance) are examined (Table 7). These variables were not used in the classification process but serve to enrich the interpretation of the spatial patterns.
Table 7.
Contextual Profiling Variables (Descriptive Only).
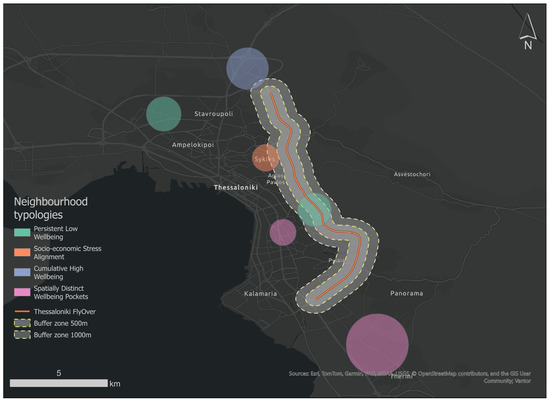
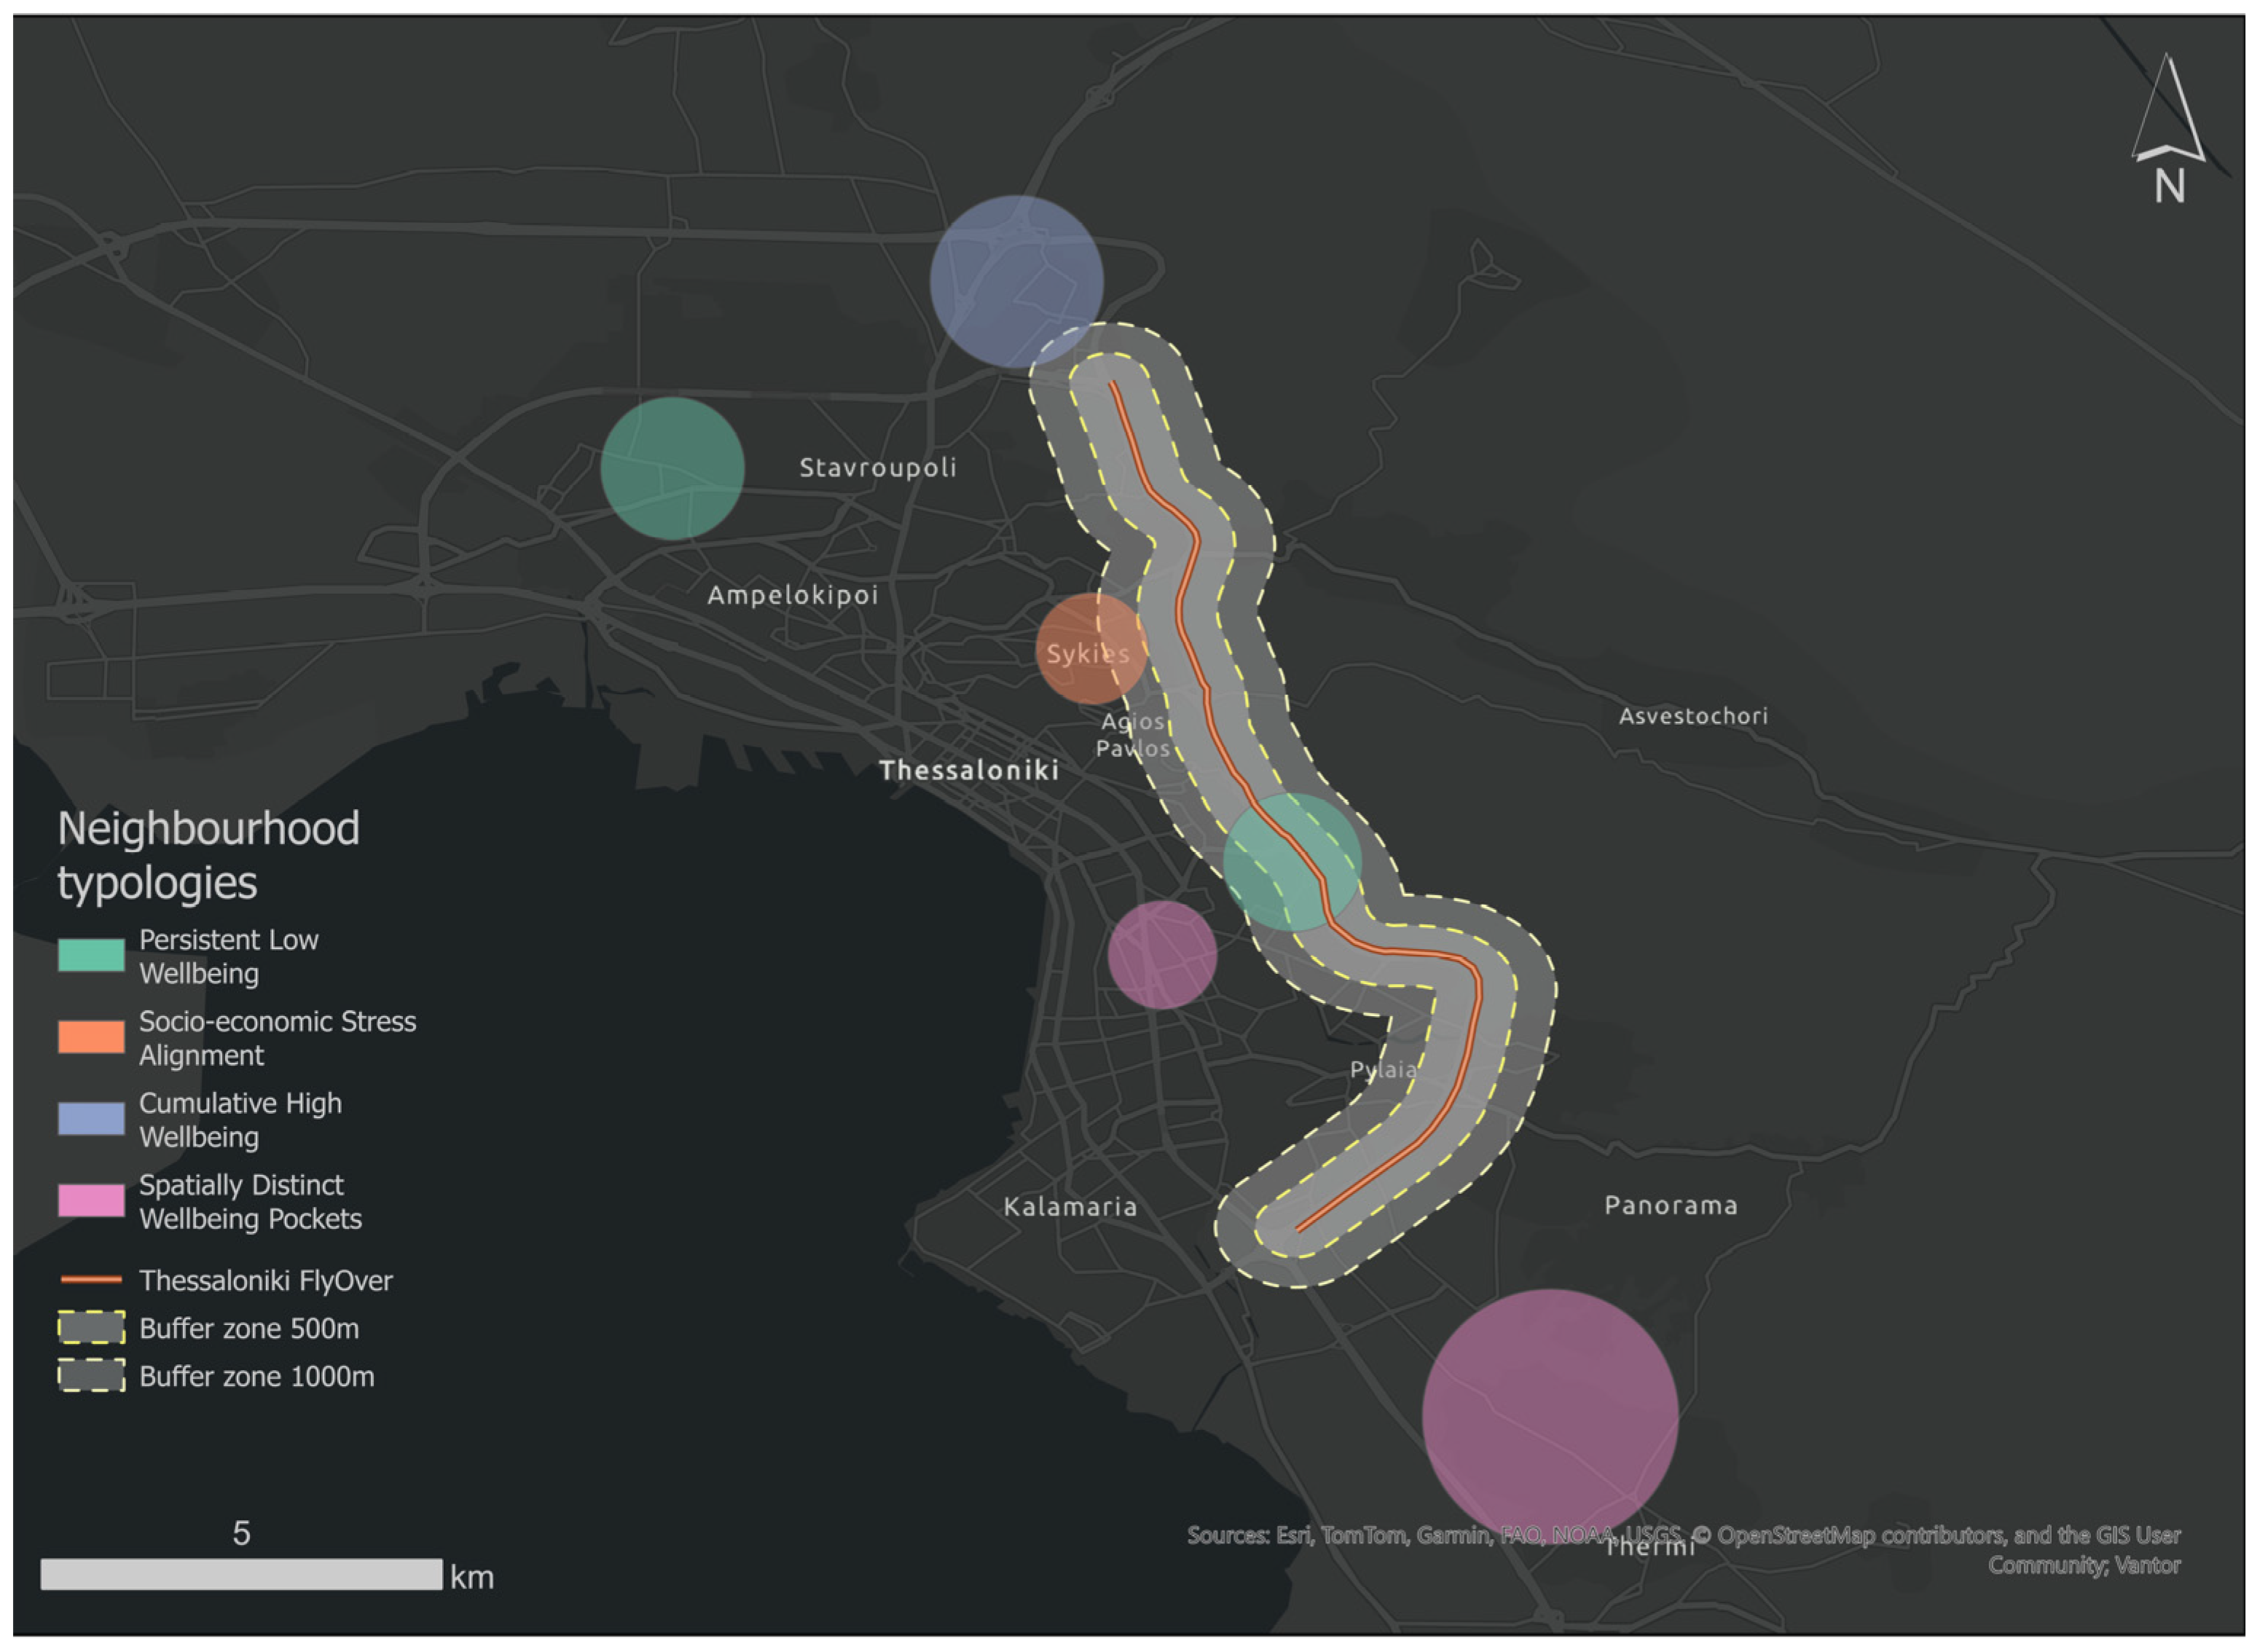
Figure 8 illustrates the typology of neighbourhoods derived from the Perceived Wellbeing Indicator (PWI), spatial configuration, and co-location with economic factors. Typologies are classified as follows:
Figure 8.
Spatial Distribution of Neighbourhood Profiles in Thessaloniki.
- Type 1—Persistent Low Wellbeing (Evosmos, Ano Toumpa): Exhibits low absolute PWI values embedded within broader low-wellbeing environments and lacks significant co-location with income hotspots. Descriptively, these areas are characterized by frequent reports of air and noise pollution annoyance and relatively low child dependency ratios, suggesting that perceived environmental stress may contextualize the observed spatial wellbeing pattern.
- Type 2—Socioeconomic Stress Alignment (Sykies): Displays low PWI values aligned with low-income hotspots. In descriptive terms, pollution annoyance is reported less frequently than in Type 1 areas, suggesting that socioeconomic alignment rather than environmental disturbance may better contextualize the spatial wellbeing structure.
- Type 3—Cumulative High Wellbeing (Efkarpia): Type 3 areas combine high PWI values, strong spatial embeddedness, and co-location with income hotspots. Descriptively, these areas exhibit higher child dependency ratios and lower levels of perceived noise disturbance, reinforcing the interpretation of cumulative contextual advantage.
- Type 4—Spatially Distinct Wellbeing Pockets (Kato Toumpa, Thermi): Type 4 areas exhibit high PWI values without strong spatial embedding or income co-location. Descriptive variables suggest mixed contextual conditions, indicating that localized place-based or social characteristics may contribute to the observed spatial configuration.
These descriptive patterns should be interpreted as contextual associations rather than explanatory determinants of the typology.
4. Discussion
While previous longitudinal studies demonstrate temporal declines in satisfaction and wellbeing during transport construction, they typically do not explicitly measure spatial proximity [1]. The findings of this study confirm that perceived wellbeing in Thessaloniki is highly heterogeneous and spatially structured, rather than uniformly distributed across the urban fabric. The hotspot analyses reveal clear geographic contrasts, with clusters of low perceived wellbeing concentrated Evosmos, Sykies and Ano Toumpa, while higher wellbeing is predominantly observed in Efkarpia, Kato Toumpa and Thermi. These patterns suggest that residents’ perceived wellbeing is shaped by a combination of local conditions and broader neighbourhood contexts, rather than by proximity to infrastructure works alone. The identification of lower PWI values in areas intersecting or adjacent to the Flyover axis, particularly in Ano Toumpa and parts of Sykies, may reflect a combination of construction-related disruptions and pre-existing pressures on daily life, highlighting that observed low wellbeing cannot be attributed exclusively to the Flyover project. At the same time, the presence of cold spots in areas not directly intersected by the Flyover, such as Evosmos, indicates that perceived wellbeing is influenced by district-level characteristics that extend beyond immediate construction exposure.
A key contribution of this study lies in the combined use of hotspot analysis and local spatial autocorrelation to move beyond simple identification of high- and low-wellbeing areas. While Getis–Ord Gi* highlights broader regional patterns, the Local Indicators of Spatial Association (LISA) analysis reveals more nuanced spatial configurations, including localized pockets of resilience and vulnerability embedded within contrasting neighbourhood environments. The detection of High–Low outliers in Sykies, where relatively high perceived wellbeing occurs within a low-wellbeing spatial context, suggests the presence of local buffering factors that mitigate wider district-level pressures. Conversely, Low–High outliers identified in Thermi point to areas where residents experience lower wellbeing despite being surrounded by generally high-wellbeing environments. These findings support previous work highlighting the risk of “masking effects” in hotspot analyses [36], in which global spatial statistics can obscure localized vulnerabilities. By explicitly addressing these outliers, the analysis provides a more fine-grained understanding of urban wellbeing inequalities.
The spatial comparison between perceived wellbeing and income in Thessaloniki aligns with evidence from previous studies indicating that local socioeconomic conditions are significant correlates of perceived wellbeing. For example, research using longitudinal and multilevel data indicates that individuals residing in more deprived neighbourhoods tend to report lower perceived wellbeing compared to those in less deprived areas, even after controlling for individual characteristics [40,41]. Moreover, analyses of neighbourhood income distributions suggest that relative income-rank effects within neighbourhoods are associated with perceived wellbeing, highlighting the importance of local socioeconomic context. At the same time, other studies find that income inequality at the neighbourhood level does not always exert a uniform effect on wellbeing, as observed in analyses of elderly populations where absolute income differences, rather than income inequality per se, were more predictive of wellbeing outcomes [42,43]. These findings support our finding that while economic prosperity is an important factor in shaping perceived wellbeing across Thessaloniki, its influence varies across neighbourhoods and interacts with other place-based and social factors. In particular, neighbourhoods classified as “Not significant income—High PWI”, such as Kato Toumpa and Thermi, indicate that favourable wellbeing outcomes can emerge even in the absence of strong economic signals. These areas may benefit from non-economic attributes, such as environmental quality, urban form, access to green space, or specific demographic compositions. Conversely, areas where wellbeing is significantly low despite non-significant income patterns, such as Ano Toumpa and Evosmos, indicate that factors beyond economic prosperity contribute to residents’ perceived wellbeing.
Regarding the role of environmental stress perceptions, although perceived air and noise pollution were not subjected to spatial statistical analysis, their inclusion as contextual indicators provides important interpretative depth. Studies have shown that perceptions of air and noise pollution are significantly associated with perceived wellbeing, highlighting that environmental annoyance can meaningfully shape residents’ lived experience and quality of life [44]. Moreover, research comparing subjective and objective environmental measures suggests that perceptions capture dimensions of environmental quality that objective indicators alone may miss, reinforcing the value of integrating subjective environmental indicators into wellbeing assessments. Other work demonstrates that noise exposure influences mental health through pathways such as environmental annoyance and diminished restorative quality, which may help explain why frequent perceived pollution may co-occur with lower perceived wellbeing in neighbourhoods [45]. In the current study, the typology reveals that neighbourhoods with persistently low perceived wellbeing, such as Evosmos and Ano Toumpa, are also characterized by frequent reports of environmental annoyance. This alignment suggests that environmental stress perceptions may amplify wellbeing challenges, particularly in areas where economic disadvantage is not the dominant factor. By contrast, areas with high perceived wellbeing consistently report low levels of noise and air pollution annoyance, reinforcing the idea that environmental quality is a meaningful component of residents’ lived experience. While causal relationships cannot be inferred, the findings underline the value of integrating subjective environmental indicators into wellbeing assessments, especially in the context of large-scale infrastructure projects that alter everyday urban conditions.
The exploratory typology of Thessaloniki neighbourhoods provides additional nuance to the spatial patterns of perceived wellbeing revealed by the hotspot and LISA analyses. Type 1 neighbourhoods (Evosmos, Ano Toumpa) exhibit persistently low wellbeing, closely aligned with frequent reports of environmental annoyance, suggesting that environmental stress may be a primary driver of wellbeing deficits even in the absence of strong economic deprivation. Type 2 areas (Sykies) exhibit low wellbeing, which appears more strongly influenced by socioeconomic pressures than by environmental factors, indicating that interventions targeting social and economic support may be particularly relevant. In contrast, Type 3 neighbourhoods (Efkarpia) demonstrate cumulative high wellbeing across both socioeconomic and environmental dimensions, highlighting the synergistic benefits of favourable conditions. Finally, Type 4 areas (Kato Toumpa, Thermi) represent localized pockets of high wellbeing despite mixed contextual signals, suggesting that place-based factors, such as urban form, access to green space, or social cohesion can buffer residents against broader neighbourhood pressures. Collectively, this typology underscores that low or high perceived wellbeing arises through multiple pathways, emphasizing the need for tailored, place-sensitive urban planning and mitigation strategies rather than uniform interventions.
Several limitations should be acknowledged. The survey sample was relatively small and not fully representative of the Thessaloniki population, with younger, higher-educated, and higher-income participants overrepresented. No spatial weighting or adjustment for sampling density was applied. The spatial analysis reflects the observed distribution of respondents across space, and results should therefore be interpreted considering the not fully representative campaign. While the spatial dispersion of respondents supports the robustness of the spatial analysis, the results should be interpreted as reflecting perceived, rather than objective, conditions. Additionally, environmental stress indicators were derived from self-reported perceptions and analyzed descriptively. Future research could strengthen this framework by integrating objective environmental measurements, longitudinal survey data, or participatory approaches to further explore how perceptions evolve over time in response to infrastructure interventions.
Despite these limitations, the proposed framework can inform urban planning and infrastructure decision-making by providing a spatially nuanced understanding of perceived wellbeing at the neighbourhood level. The proposed indicator and typology enable planners and policymakers to distinguish between areas where low wellbeing may be more influenced by environmental stress, socioeconomic disadvantage, or construction-related disruptions. This differentiation can support the design of more targeted, place-based interventions, such as prioritizing environmental mitigation measures in environmentally stressed neighbourhoods or complementing infrastructure projects with social and community-focused actions in areas experiencing socioeconomic pressure. In the context of large-scale transport infrastructure, such as the Thessaloniki Flyover, the framework can be used as an ex ante or ex post-evaluation tool to identify neighbourhoods that may be more sensitive to construction-related disruption or long-term environmental change. More broadly, the approach offers a transferable method for integrating subjective wellbeing indicators into spatial planning processes, supporting people-centred assessments of urban quality of life alongside conventional technical and economic criteria.
5. Conclusions
This study examines how perceived wellbeing is distributed across Thessaloniki during the construction of a large-scale infrastructure project, moving beyond temporal assessments of construction impacts to consider their spatial patterns. The findings demonstrate that perceived wellbeing is neither uniform nor randomly distributed across the city. Instead, it exhibits clear spatial patterns and neighbourhood-level differentiation. Clusters of low perceived wellbeing are concentrated in specific districts, notably Evosmos, Sykies, and Ano Toumpa, while higher wellbeing is consistently observed in Efkarpia, Kato Toumpa, and Thermi. These patterns confirm that residents’ perceived wellbeing is shaped by a combination of local conditions and broader neighbourhood contexts, rather than by proximity to infrastructure works alone, and suggest that low wellbeing reflects both pre-existing spatial inequalities and potential construction-related disruptions. At the same time, lower perceived wellbeing values in areas intersecting or adjacent to the Flyover axis, particularly in Ano Toumpa and parts of Sykies, suggest that construction-related disruption may intensify existing pressures on everyday life in certain neighbourhoods. Importantly, the presence of low-wellbeing clusters in areas not directly affected by the Flyover, such as Evosmos, indicates that district-level characteristics and environmental or social conditions play a critical role in shaping perceived wellbeing. In conclusion, the findings of the presented research in this paper highlight the need to interpret infrastructure impacts within their wider urban context, recognizing that large projects interact with pre-existing spatial inequalities rather than producing uniform effects across the urban fabric.
Building on these findings, this study also contributes to urban sustainability. By revealing how low perceived wellbeing arises from environmental stress, socioeconomic pressures, or construction-related disruptions, the PWI enables targeted, place-based strategies that enhance environmental quality, promote equitable access to urban amenities, and strengthen social resilience. These insights support planning interventions that not only mitigate the impacts of infrastructure projects but also advance sustainable, people-centred urban development. Overall, the proposed framework offers a transferable methodology for embedding subjective wellbeing assessment into spatially informed urban planning processes, supporting decision-making that balances infrastructure development with social and environmental wellbeing.
Several open challenges will be addressed in future research. These include the implementation of a larger survey campaign with a more diverse and representative sample of participants, the systematic incorporation of experts’ knowledge to refine the PWI and the integration of objective environmental exposures and stress moments of participants through wearable sensors, complemented by machine learning approaches.
Author Contributions
Conceptualization, K.K. and A.P.; methodology, K.K. and A.M.; validation, K.K. and K.L.; formal analysis, K.K.; investigation, K.K.; resources, A.M.; data curation, K.K. and A.M.; writing—original draft preparation, K.K.; writing—review and editing, K.K.; visualization, K.K.; supervision, K.K. and K.L.; project administration, K.K.; All authors have read and agreed to the published version of the manuscript.
Funding
This research received no external funding.
Institutional Review Board Statement
IRB approval obtained (approved by the Ethics Committee of the Committee on Ethics and Research Ethics of Aristotle University of Thessaloniki (43723/2025) on 18 February 2025).
Informed Consent Statement
Written informed consent was obtained from all participants prior to data collection via questionnaires.
Data Availability Statement
The data presented in this study are available on request from the corresponding author. The data is not publicly available due to ethical considerations and the confidentiality of survey respondents.
Acknowledgments
The authors thank all participants who completed the questionnaire and made this study possible.
Conflicts of Interest
The authors declare no conflicts of interest.
Abbreviations
The following abbreviations are used in this manuscript:
| PWI | Perceived Wellbeing Indicator |
| PCA | Principal Component Analysis |
| AHP | Analytic Hierarchical Process |
Appendix A
Table A1.
Data collected via an online questionnaire.
Table A2.
Total Variance Explained.
Table A3.
Component Matrix a.
References
- Corpuz, D.R.; Ghasri, M.; Hosseini Shoabjareh, A. The Impact of Motorways and Public Transport Construction on Residents’ Satisfaction with Neighbourhoods. Case Stud. Transp. Policy 2024, 17, 101251. [Google Scholar] [CrossRef] [Scilit]
- Lucas, K.; Philips, I.; Verlinghieri, E. A Mixed Methods Approach to the Social Assessment of Transport Infrastructure Projects. Transportation 2022, 49, 271–291. [Google Scholar] [CrossRef] [Scilit]
- Chełstowska, A.; Oleksandra, O.; Sosik, K. The Impact of Construction Logistics and Project Implementation on Urban Quality of Life: The Grounded Theory Approach. Sustainability 2025, 17, 2651. [Google Scholar] [CrossRef] [Scilit]
- European Environment Agency. Environmental Noise in Europe 2025; Publications Office of the European Union: Luxembourg, 2025; Available online: https://www.eea.europa.eu/en/analysis/publications/environmental-noise-in-europe-2025 (accessed on 12 December 2025).
- Mucci, N.; Traversini, V.; Lorini, C.; De Sio, S.; Galea, R.P.; Bonaccorsi, G.; Arcangeli, G. Urban Noise and Psychological Distress: A Systematic Review. Int. J. Environ. Res. Public Health 2020, 17, 6621. [Google Scholar] [CrossRef] [Scilit] [PubMed] [PubMed Central]
- Stiglitz, J.E.; Sen, A.; Fitoussi, J.-P. Report by the Commission on the Measurement of Economic Performance and Social Progress; OECD: Paris, France, 2009. [Google Scholar]
- Veenhoven, R. Well-being in the Welfare State: Level Not Higher, Distribution Not More Equitable. J. Comp. Policy Anal. Res. Pract. 2000, 2, 91–125. [Google Scholar] [CrossRef] [Scilit]
- Diener, E. Subjective Well-Being. Psychol. Bull. 1984, 95, 542–575. [Google Scholar] [CrossRef] [PubMed]
- OECD. OECD Guidelines on Measuring Subjective Well-Being; OECD Publishing: Paris, France, 2013. [Google Scholar] [CrossRef] [Scilit]
- Helliwell, J.F.; Layard, R.; Sachs, J.; De Neve, J.-E. (Eds.) World Happiness Report 2020; Sustainable Development Solutions Network: New York, NY, USA, 2020. [Google Scholar]
- Mouratidis, K. Urban Planning and Quality of Life: A Review of Pathways Linking the Built Environment to Subjective Well-Being. Cities 2021, 115, 103229. [Google Scholar] [CrossRef] [Scilit]
- Foley, L.; Prins, R.; Crawford, F.; Humphreys, D.; Mitchell, R.; Sahlqvist, S.; Thomson, H.; Ogilvie, D. Effects of Living near an Urban Motorway on the Wellbeing of Local Residents in Deprived Areas: Natural Experimental Study. PLoS ONE 2017, 12, e0174882. [Google Scholar] [CrossRef] [Scilit] [PubMed]
- Morley, K.I.; Hocking, L.; Saunders, C.L.; Bousfield, J.W.; Bostock, J.; Brimicombe, J.; Burgoine, T.; Dawney, J.; Hofman, J.; Lee, D.; et al. Wellbeing Impact Study of High-Speed 2 (WISH2): Protocol for a Mixed-Methods Examination of the Impact of Major Transport Infrastructure Development on Mental Health and Wellbeing. PLoS ONE 2024, 19, e0298701. [Google Scholar] [CrossRef] [Scilit]
- Osypchuk, O.; Sosik, K.; Chełstowska, A. Impact Exerted by Construction Projects Implementation on the Quality of Life of Urban Residents. Cities 2026, 169, 106585. [Google Scholar] [CrossRef] [Scilit]
- Vanclay, F. International Principles for Social Impact Assessment. Impact Assess. Proj. Apprais. 2003, 21, 5–12. [Google Scholar] [CrossRef] [Scilit]
- Vanclay, F.; Esteves, A.M.; Aucamp, I.; Franks, D. Social Impact Assessment: Guidance for Assessing and Managing the Social Impacts of Projects; International Association for Impact Assessment: Fargo, ND, USA, 2015. [Google Scholar]
- Papachrysou, P.; Vasilakos, C. Quality of Life Indicators and Geospatial Methods Across Multiple Spatial Scales: A Systematic Review. Urban Sci. 2026, 10, 52. [Google Scholar] [CrossRef] [Scilit]
- Faka, A.; Kalogeropoulos, K.; Maloutas, T.; Chalkias, C. Spatial Variability and Clustering of Quality of Life at Local Level: A Geographical Analysis in Athens, Greece. ISPRS Int. J. Geo-Inf. 2022, 11, 276. [Google Scholar] [CrossRef] [Scilit]
- Montorsi, C.; Gigliarano, C. Spatial Comprehensive Well-Being Composite Indicators Based on Bayesian Latent Factor Model: Evidence from Italian Provinces. Soc. Indic. Res. 2024, 175, 347–383. [Google Scholar] [CrossRef] [Scilit]
- Giacalone, M.; Mattera, R.; Nissi, E. Well-being analysis of Italian provinces with spatial principal components. Socioecon. Plan. Sci. 2022, 84, 101377. [Google Scholar] [CrossRef] [Scilit]
- Hellenic Statistical Authority. Census Results 2022; Hellenic Statistical Authority: Piraeus, Greece, 2023; Available online: https://elstat-outsourcers.statistics.gr/census_results_2022_en.pdf#page=11.19 (accessed on 4 February 2026).
- THEPTA. Resilient Thessaloniki: A Strategy for 2030; THEPTA Report; THEPTA: Athens, GA, USA, 2020. [Google Scholar]
- AVAX Group. Thessaloniki Flyover Project. Available online: https://avax.gr/ta-erga-mas/flyover-enaerios-aftokinitodromos-thessalonikis/ (accessed on 22 December 2025).
- Nunnally, J.C.; Bernstein, I.H. Psychometric Theory, 3rd ed.; McGraw-Hill: New York, NY, USA, 1994. [Google Scholar]
- Tavakol, M.; Dennick, R. Making Sense of Cronbach’s Alpha. Int. J. Med. Educ. 2011, 2, 53–55. [Google Scholar] [CrossRef] [Scilit] [PubMed]
- DeVellis, R.F. Scale Development: Theory and Applications, 4th ed.; Applied Social Research Methods Series; SAGE: Los Angeles, CA, USA, 2017; ISBN 978-1-5063-4156-9. [Google Scholar]
- de Winter, J.C.F.; Gosling, S.D.; Potter, J. Comparing the Pearson and Spearman Correlation Coefficients Across Distributions and Sample Sizes: A Tutorial Using Simulations and Empirical Data. Psychol. Methods 2016, 21, 273–290. [Google Scholar] [CrossRef] [Scilit]
- Boateng, G.O.; Neilands, T.B.; Frongillo, E.A.; Melgar-Quiñonez, H.R.; Young, S.L. Best Practices for Developing and Validating Scales for Health, Social, and Behavioral Research: A Primer. Front. Public Health 2018, 6, 149. [Google Scholar] [CrossRef] [Scilit] [PubMed]
- IBM Corp. IBM SPSS Statistics, version 29.0; IBM Corp.: Armonk, NY, USA, 2024.
- Hotelling, H. Analysis of a complex of statistical variables into principal components. J. Educ. Psychol. 1933, 24, 417–441. [Google Scholar] [CrossRef] [Scilit]
- Jolliffe, I.T. Principal Component Analysis, 2nd ed.; Springer: New York, NY, USA, 2002. [Google Scholar]
- Saaty, T.L. The Analytic Hierarchy Process; McGraw-Hill: New York, NY, USA, 1980. [Google Scholar]
- BPMSG. AHP Online Calculator Documentation. 2024. Available online: https://bpmsg.com/ahp/ahp-calc.php (accessed on 28 December 2022).
- Burdziej, J. Using hexagonal grids and network analysis for spatial accessibility assessment in urban environments–a case study of public amenities in Toruń. Misc. Geogr. 2019, 23, 99–110. [Google Scholar] [CrossRef] [Scilit]
- Ord, J.K.; Getis, A. Local Spatial Autocorrelation Statistics: Distributional Issues and an Application. Geogr. Anal. 1995, 27, 286–306. [Google Scholar] [CrossRef] [Scilit]
- Anselin, L. Local Indicators of Spatial Association—LISA. Geogr. Anal. 1995, 27, 93–115. [Google Scholar] [CrossRef] [Scilit]
- Rogerson, P.A. Statistical Methods for Geography: A Student’s Guide, 5th ed.; SAGE Publications Ltd.: London, UK, 2022. [Google Scholar]
- Hellenic Statistical Authority (ELSTAT). Population, Employment, Income and Social Conditions Statistics for Greece, 2021; ELSTAT: Piraeus, Greece, 2021; Available online: https://www.statistics.gr (accessed on 10 January 2026).
- Eurostat. Population and Social Conditions Database—Greece, 2021; European Commission: Luxembourg, 2021; Available online: https://ec.europa.eu/eurostat (accessed on 10 January 2026).
- Ayalon, L. Perceived Neighborhood Characteristics and Wellbeing: Exploring Mediational Pathways. J. Environ. Psychol. 2023, 88, 102020. [Google Scholar] [CrossRef] [Scilit]
- Mouratidis, K. Neighborhood Characteristics, Neighborhood Satisfaction, and Well-Being: The Links with Neighborhood Deprivation. Land Use Policy 2020, 99, 104886. [Google Scholar] [CrossRef] [Scilit]
- Knies, G.; Melo, P.C.; Zhang, M. Neighbourhood Deprivation, Life Satisfaction and Earnings: Comparative Analyses of Neighbourhood Effects at Bespoke Scales. Urban Stud. 2021, 58, 2640–2659. [Google Scholar] [CrossRef] [Scilit]
- Visser, K.; Bolt, G.; Finkenauer, C.; Jonker, M.; Weinberg, D.; Stevens, G.W. Neighbourhood Deprivation Effects on Young People’s Mental Health and Well-Being: A Systematic Review of the Literature. Soc. Sci. Med. 2021, 270, 113542. [Google Scholar] [CrossRef] [Scilit]
- Herrera, C.; Cabrera-Barona, P. Impact of Perceptions of Air Pollution and Noise on Subjective Well-Being and Health. Earth 2022, 3, 825–838. [Google Scholar] [CrossRef] [Scilit]
- Dzhambov, A.M.; Markevych, I.; Tilov, B.; Arabadzhiev, Z.; Stoyanov, D.; Gatseva, P.; Dimitrova, D.D. Pathways Linking Residential Noise and Air Pollution to Mental Ill-Health in Young Adults. Environ. Res. 2018, 166, 458–465. [Google Scholar] [CrossRef] [Scilit]

Disclaimer/Publisher’s Note: The statements, opinions and data contained in all publications are solely those of the individual author(s) and contributor(s) and not of MDPI and/or the editor(s). MDPI and/or the editor(s) disclaim responsibility for any injury to people or property resulting from any ideas, methods, instructions or products referred to in the content. |
© 2026 by the authors. Licensee MDPI, Basel, Switzerland. This article is an open access article distributed under the terms and conditions of the Creative Commons Attribution (CC BY) license.