


Abstract
In recent times, countries have made it a point of duty to promote economic activities that will foster a sustainable environment following the Sustainable Development Goals (SDGs). One of the measures employed to achieve these goals, especially SDGs 7 and 13, is the adoption of renewable energy consumption. As a result, this research investigates the effect of financial globalization (FGLO) and technological innovation (TECH) on renewable energy consumption (RENC) in Nigeria from 1990 to 2020 using the Autoregressive Distributed Lag (ARDL) model. In addition, this research contributes to the existing literature by employing the Frequency Domain Causality Approach to capture long- and short-run causal relationships. Also, control variables such as financial development (FIND) and economic growth (GDP) were employed. The ARDL result is as follows: (1) The bounds test confirms a long-run association between the variables. (2) In the long-run, TECH and FIND spur RENC, while GDP reduces RENC. In addition, FGLO has a positive long-run coefficient, but the evidence is not strong enough to claim a clear long-run effect. (3) In the short-run, FGLO and FIND increase RENC, while GDP reduces RENC. Furthermore, the Frequency Domain Causality results confirm that TECH Granger causes RENC in the medium and long term, FIND Granger causes RENC in the medium and long term, while GDP Granger causes RENC in the short, medium, and long term. Based on these results, policies are recommended.
1. Introduction
One of the most significant issues of our time is global warming. The world’s natural equilibrium gets destabilized as a result of this issue [1,2]. For instance, some regions experience extreme droughts because of global warming. This could further lead to food shortages. Furthermore, the seasons may not be fully enjoyed because of global warming. As a result, many animal breeds become extinct, and animal species are unable to procreate [3]. Nutritional issues will worsen as a result of the hunger brought on by global warming. Several organisms will become unwell and perish because of this. Fossil fuel preference in energy production is one of the main causes of global warming [4]. A substantial quantity of carbon dioxide (CO2) is released into the environment because of the usage of these fuels [5]. Global warming results from rising temperatures brought on by excessive CO2 [6].
A practical way to provide a solution to solving the problem of global warming is by adopting renewable energy. Clean energy sources have a limited negative impact on the environment, generate the least amount of secondary waste, and are sustainable in light of present and future social and economic demands. By replacing traditional energy sources, clean energy sources offer a great chance to mitigate greenhouse gas emissions (GHGs) and lower global warming [7]. However, it is essential to state that one of the biggest obstacles to the use of clean energy has been its high initial cost. Clean energy sources are more capital-demanding than traditional energy sources since they require a larger initial capital investment to start production. Furthermore, clean energy projects typically demand significant funding and have lengthy payback periods [8].
Some other factors to consider in the influence of renewable energy consumption (RENC) are financial globalization (FGLO), technological innovation (TECH), financial development (FIND), and economic expansion (GDP).
Globalization fosters the easy interaction of countries with one another. Ref. [9] opined that developing economies may find it challenging to meet climate-related objectives due to inadequate renewable energy utilization and funding issues. FGLO can therefore assist developing nations in overcoming the financial obstacles associated with green and sustainable projects. The strength of the FGLO of a country is linked to FIND.
FIND boosts RENC by lowering the cost of borrowing, improving access to credit, and promoting energy-efficient goods and innovative technology [10,11]. FIND affects demand for energy in three ways [11]. First, there is the direct effect, which is linked to better FIND when customers can borrow money more cheaply and easily to purchase expensive, energy-intensive goods. When enhanced FIND facilitates enterprises’ access to financial resources, the business effect takes place. The demand for energy is driven by the wealth effect, which happens when a growing economy is accompanied by a rise in confidence. However, FIND may have an adverse effect on energy consumption. Ref. [12] pointed out that in countries with sound financial systems, financial institutions are essential because they make it simple for businesses to get funding from banks and stock exchanges. Businesses interested in investing in cutting-edge, green technology would thus have easier access to funding. The demand for energy would drop as a result.
A key component of productivity and rate of progress is TECH, which is the technical basis for RENC [13]. In a similar vein, TECH is one element that lessens ecological degradation [14,15]. The optimal utilization of clean energy sources is guaranteed by cutting-edge technology, which works to satisfy energy demands. Investing in clean energy technologies can assist in attaining sustainable economic expansion as well as address ecological challenges, and technology integration with renewables is socially and commercially acceptable [16].
To explain the relationship between GDP and RENC, it is essential to outline our hypotheses for the following three aspects: growth, conservation, feedback, and neutrality [17,18,19]. As the primary component of labour and capital inputs, the growth hypothesis postulates that energy use affects the growth process both directly and indirectly. The growth hypothesis highlights the significance of raising the consumption of energy in order to raise real GDP and proposes a unidirectional causal relationship between energy use and economic expansion. According to the conservation hypothesis, energy conservation measures that lower energy use may have little to no detrimental effects on economic expansion. Conversely, the feedback hypothesis suggests that usage of energy and economic expansion are causally related in both directions. The neutrality hypothesis argues that there is no link between the use of energy and economic expansion.
Why is Nigeria used as a case study? Nigeria is on a trajectory to achieve its climate change goals. As a result, the country is exploring its clean energy resources through various environmental and economic policies. It is important to state that Nigeria is endowed with various renewable energy sources, such as wind, solar, hydro, and geothermal energy [20,21]. In addition, Nigeria has one of the highest GDPs and population sizes in Africa. The implication of a rising population is that energy demand will also increase. As a result, investigating various factors that can drive clean energy consumption is essential.
Thus, based on these arguments, this study investigates the impact of financial globalization (FGLO), technological innovation (TECH), financial development (FIND), and economic growth (GDP) in Nigeria from 1990 to 2020, using the Autoregressive Distributed Lag (ARDL) model and the Frequency Domain Causality Approach. Based on these objectives, the research questions are as follows:
- What is the impact of FGLO on RENC in Nigeria?
- What is the effect of TECH on RENC in Nigeria?
- What is the influence of FIND on RENC in Nigeria?
- What is the impact of GDP on RENC in Nigeria?
The gaps and contributions of this research are as follows. Firstly, much emphasis has been placed on asking the question of whether RENC can drive GDP, and not on the factors that spur RENC. Without further investigating the factors that can promote RENC, Nigeria might find it difficult to harness the full potential of its clean energy resources. Secondly, the variables used in this research are unique. GDP captures the productive capacity of the Nigerian economy. FGLO captures technological transfers and investment flows. FIND captures the dimensions of capital access and green financing, while TECH enables cost reduction and improves efficiency. Thirdly, this research uses a well-known methodological approach called the ARDL model. This approach is used because it accounts for small sample size data, and its stationarity conditions are flexible. This involves I(0), I(1), or a combination of I(0) and I(1) stationarity conditions. This approach, however, is not suitable for I(2) variables. In addition, the Frequency Domain Causality Approach [22] is used, which examines the causal relationship between variables at the long, medium, and short-term. Unlike conventional time-domain Granger causality, which provides an average causal effect over time, the Frequency Domain Causality Approach allows the decomposition of causal relationships across different horizons. This is particularly useful in macroeconomics and energy studies, where short- and long-run dynamics differ. Lastly, one of this study’s primary innovations is the policies it offers to Nigeria to boost investments in clean energy sources that support long-term social and economic growth. Conclusively, addressing the issue of global warming may be considerably simpler with the support of expanding clean energy initiatives. Section 2, Section 3, Section 4 and Section 5 capture the remaining aspects of this research.
2. Literature Review
2.1. FGLO and RENC Nexus
In EU transition economies, using the Bootstrap Panel Granger Causality test, Ref. [23] found no causal relationship between FGLO and RENC. To assess the long-term outcomes, Ref. [24] used cutting-edge econometric methodologies like CUP–FM and CUP–BC approaches. The empirical results demonstrate that the use of RENC is encouraged by FGLO, ecological innovation, productivity of energy, and the price of energy. On the other hand, economic expansion hinders RENC. In China, using the linear approach, Ref. [25] found that the linear approach emphasizes how FGLO has a positive short- and long-term impact on investments in clean energy sources. Conversely, the non-linear framework suggests that an increase in FGLO leads to a short- and long-term increase in clean energy investment, whereas a decrease in FGLO only results in a long-term decrease in green energy investment. Furthermore, in both linear and non-linear models, national income encourages investment in clean energy sources over the long and short terms. Ref. [26] argued that foreign trade and technology advancement have a beneficial short-term impact on India’s RENC, while financial development has a negative impact. Furthermore, advances in technology and FGLO have long-term beneficial and negative effects on the use of renewable energy, respectively. In 24 Asian economies, employing the GMM and VAR techniques, Ref. [27] ascertained that FGLO spurs RENC. Among the top 15 RENC economies, Ref. [28] found that FGLO reduces RENC. Employing the Multivariate Wavelet-based technique for the United States’ economy, Ref. [29] established that the impact of FGLO on RENC is positive, but heterogeneous, specifically at higher quantiles, in the medium- to long-term. Based on these findings, this study proposes the following hypothesis:
H1:
FGLO can either spur or reduce RENC in Nigeria.
2.2. TECH and RENC Nexus
In developing economies, Ref. [30] found a bidirectional causal relationship between TECH and RENC. In BRICS, Ref. [31] claimed that TECH encourages the use of greener energy sources. In BRI economies, using the GMM estimators, Ref. [32] found that TECH and economic progress hinder RENC, while FIND improves it. In Germany, the result of [33] confirmed that both positive and negative effects of TECH on RENC exist across a number of sub-samples. Similarly, in sub-samples, RENC has a significant impact on TECH, suggesting that improvements in RENC lead to higher investments in TECH. Employing the FMOLS and DOLS techniques, Ref. [34] affirmed that TECH positively drives RENC in China. The following studies also ascertained that TECH is good for RENC [35,36]. Based on these investigations, the hypothesis is as follows:
H2:
TECH will spur RENC in Nigeria.
2.3. FIND and RENC Nexus
In India, Ref. [37] asserted that a unidirectional association exists between FIND and RENC. In the USA, Ref. [38] argued that RENC is determined by both positive and negative changes in FIND metrics. In 28 EU economies, Ref. [39] established that FIND contributes positively to RENC. In addition, FIND can foster green technologies. Using the ARDL method for the Nigerian economy, Ref. [40] found that FIND spurs RENC. In Turkey, Ref. [1] found a positive link between FIND and RENC. This positive link has also been observed for E7 economies [41]. In a panel of 35 economies, Ref. [42] also confirmed a positive association between FIND and RENC. This assertion is also confirmed by [43] for 103 economies. Ref. [44], however, found that FIND undermines RENC in Ghana. Based on these arguments, this study hypothesizes the following:
H3:
FIND will spur RENC in Nigeria.
2.4. GDP and RENC Nexus
Ref. [37] found a positive relationship between GDP and RENC in India. Using the ARDL, FMOLS, and DOLS methods for OECD economies, Ref. [45] found that economic expansion drives RENC. Ref. [19] opined that RENC provides greater evidence in favour of the growth hypothesis. For E7 economies, Ref. [46] affirmed that GDP has a causal impact on RENC. In the USA, using the wavelet quantile methods, Ref. [29] found that the link between GDP and RENC varies across different quantiles and time horizons. More specifically, they found that GDP could reduce RENC. Based on these arguments, and taking into consideration that Nigeria is a dynamic country, the following hypothesis is proposed:
H4:
GDP will undermine RENC in Nigeria.
Based on the investigated studies, the following gaps are identified: Studies focusing on the link between TECH and RENC in Nigeria are quite scarce, necessitating further investigations. More studies have focused on the impact of TECH on the quality of the environment [47,48]. It is also observed that the relationship between GDP and RENC is barely explored. Other studies have focused on the RENC–economic expansion nexus [18,49]. Furthermore, the frequency domain causality approach is scant in the literature.
3. Data and Methodology
3.1. Data
The data used in this research from 1990 to 2020 include Renewable Energy Consumption (RENC), Financial Globalization (FGLO), Technological Innovation (TECH), Financial Development (FIND), and Economic Growth (GDP). The dependent variable is RENC, while the independent variables are FGLO, TECH, FIND, and GDP. All variable sources are from [50], except FGLO, which is from [51]. Table 1 shows the summary of the variables.
Table 1.
Variables employed.
Additionally, the study’s model, which is adapted from the research of [29], is shown in Equation (1) and converted to log form in Equation (2). It is important to note that the patent variable contains no zero observations during the sample period; therefore, the natural logarithm transformation (LTECH) was applied directly without adjustment.
As discussed in the literature, and considering the structure of the Nigerian economy, this study hypothesizes the following: ; and .
3.2. Methodology
This study used the ARDL method proposed by [52] and the Frequency Domain Causality Approach proposed by [22]. The flexibility of the stationarity condition required to estimate the ARDL method makes this method suitable for our research. The stationarity condition involves the use of the variables when they are I(0), I(1), or a mix of both. However, the ARDL method cannot be used in the scenario of I(2) stationarity conditions. One of the main advantages of the ARDL model is its versatility, which allows for the simultaneous estimation of short- and long-term interconnections between variables. Additionally, even with a small sample size, the ARDL technique has the benefit of generating accurate and efficient predictions [53]. The model can be seen as follows:
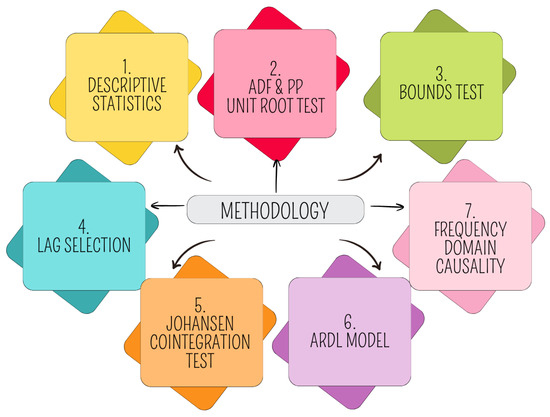
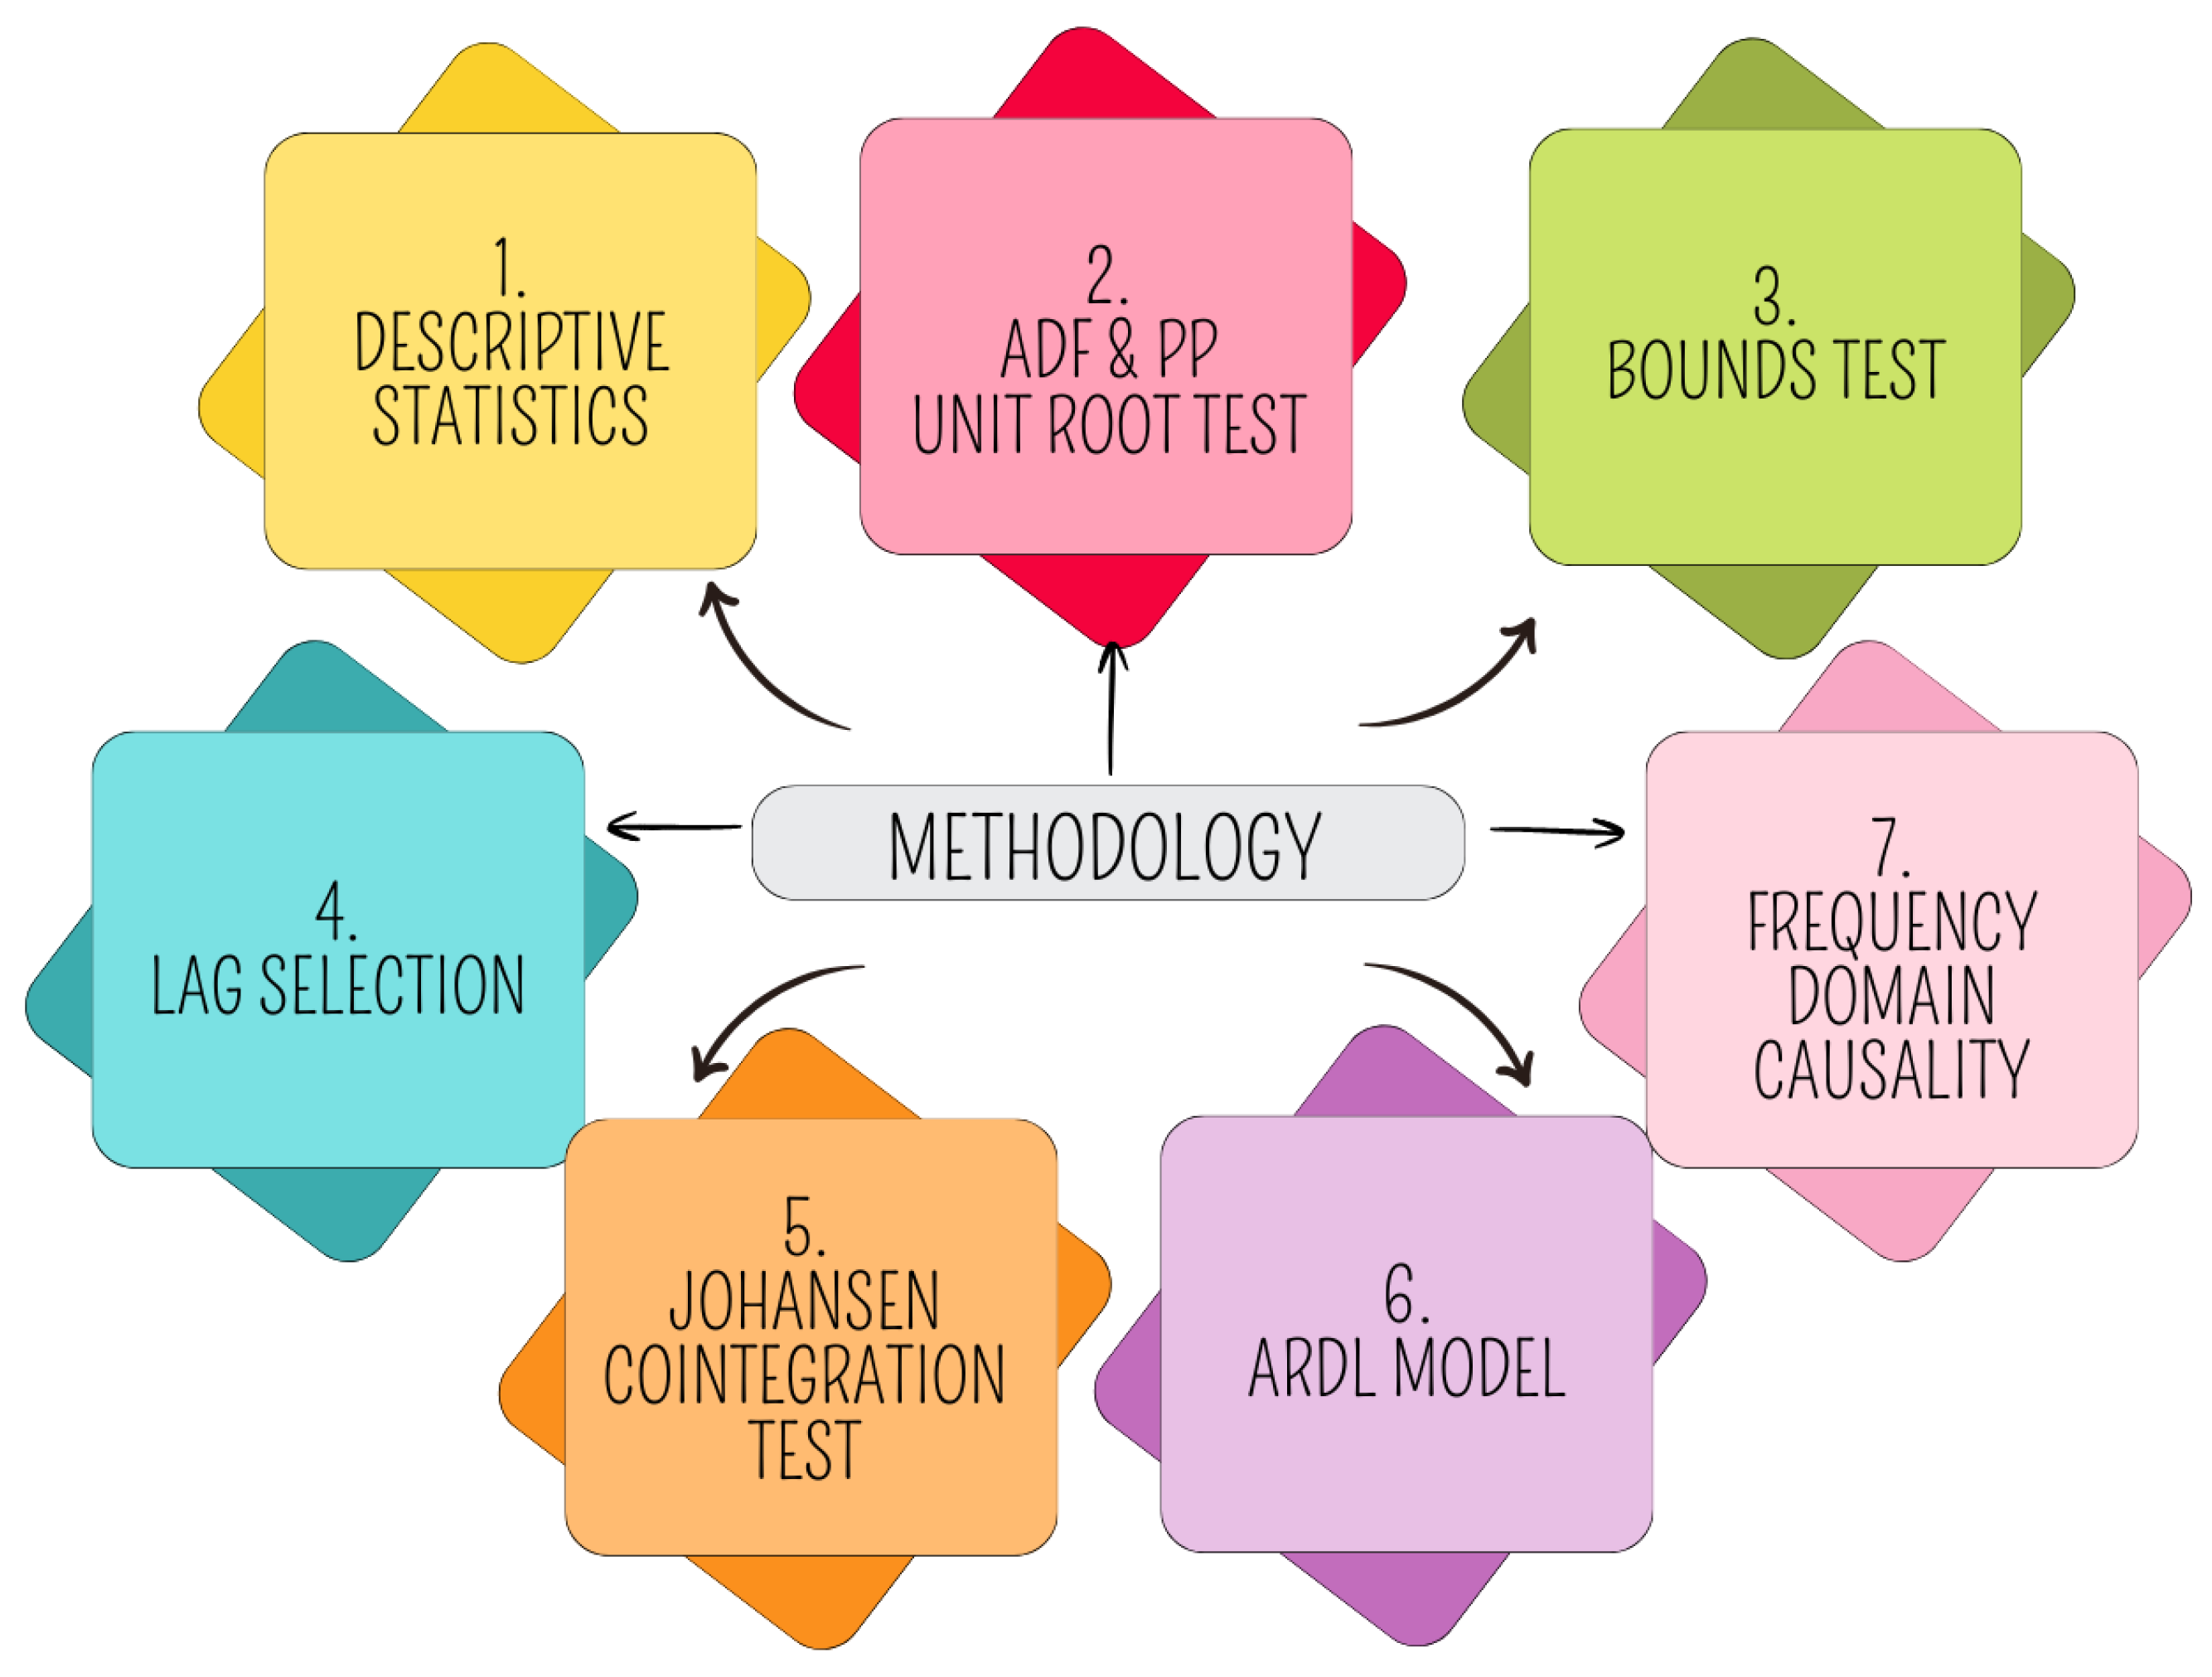
While – represent parameters in the long term, – represent parameters in the short term, and the error correction term is denoted by ECT. Furthermore, this study also used the frequency domain causality approach [22]. This approach suits this research more than the time domain approach. The “time-domain” technique indicates when a specific variation occurs within a time series, whereas the “frequency domain” method quantifies the extent of a specific variation in a time series. This is the primary distinction between the two approaches. The frequency domain approach enables the elimination of seasonal changes, which may be significant in short series research. Additionally, non-linearities and causality cycles—that is, the causality in high or low frequencies—can be observed using the frequency domain technique [54]. Table 2 summarizes the research classification, indicating the nature of the study, its objectives, the analytical approach, and the methodological procedures. In addition, the methodological flowchart of this research can be seen in Figure 1.
Table 2.
Research design.
Figure 1.
Methodological flowchart.
In summary, it is important to state that the relatively small sample size (31 observations) may impose limitations in terms of statistical power. However, the ARDL approach is considered suitable for small sample sizes, as it provides consistent long-run estimates regardless of whether variables are I(0) or I(1).
4. Analysis and Discussions
4.1. Descriptive Statistics
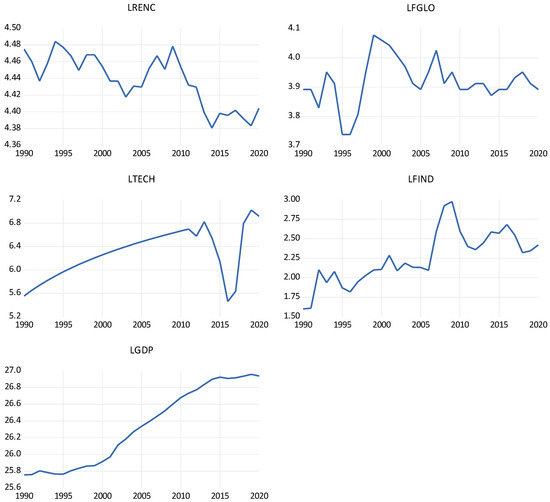
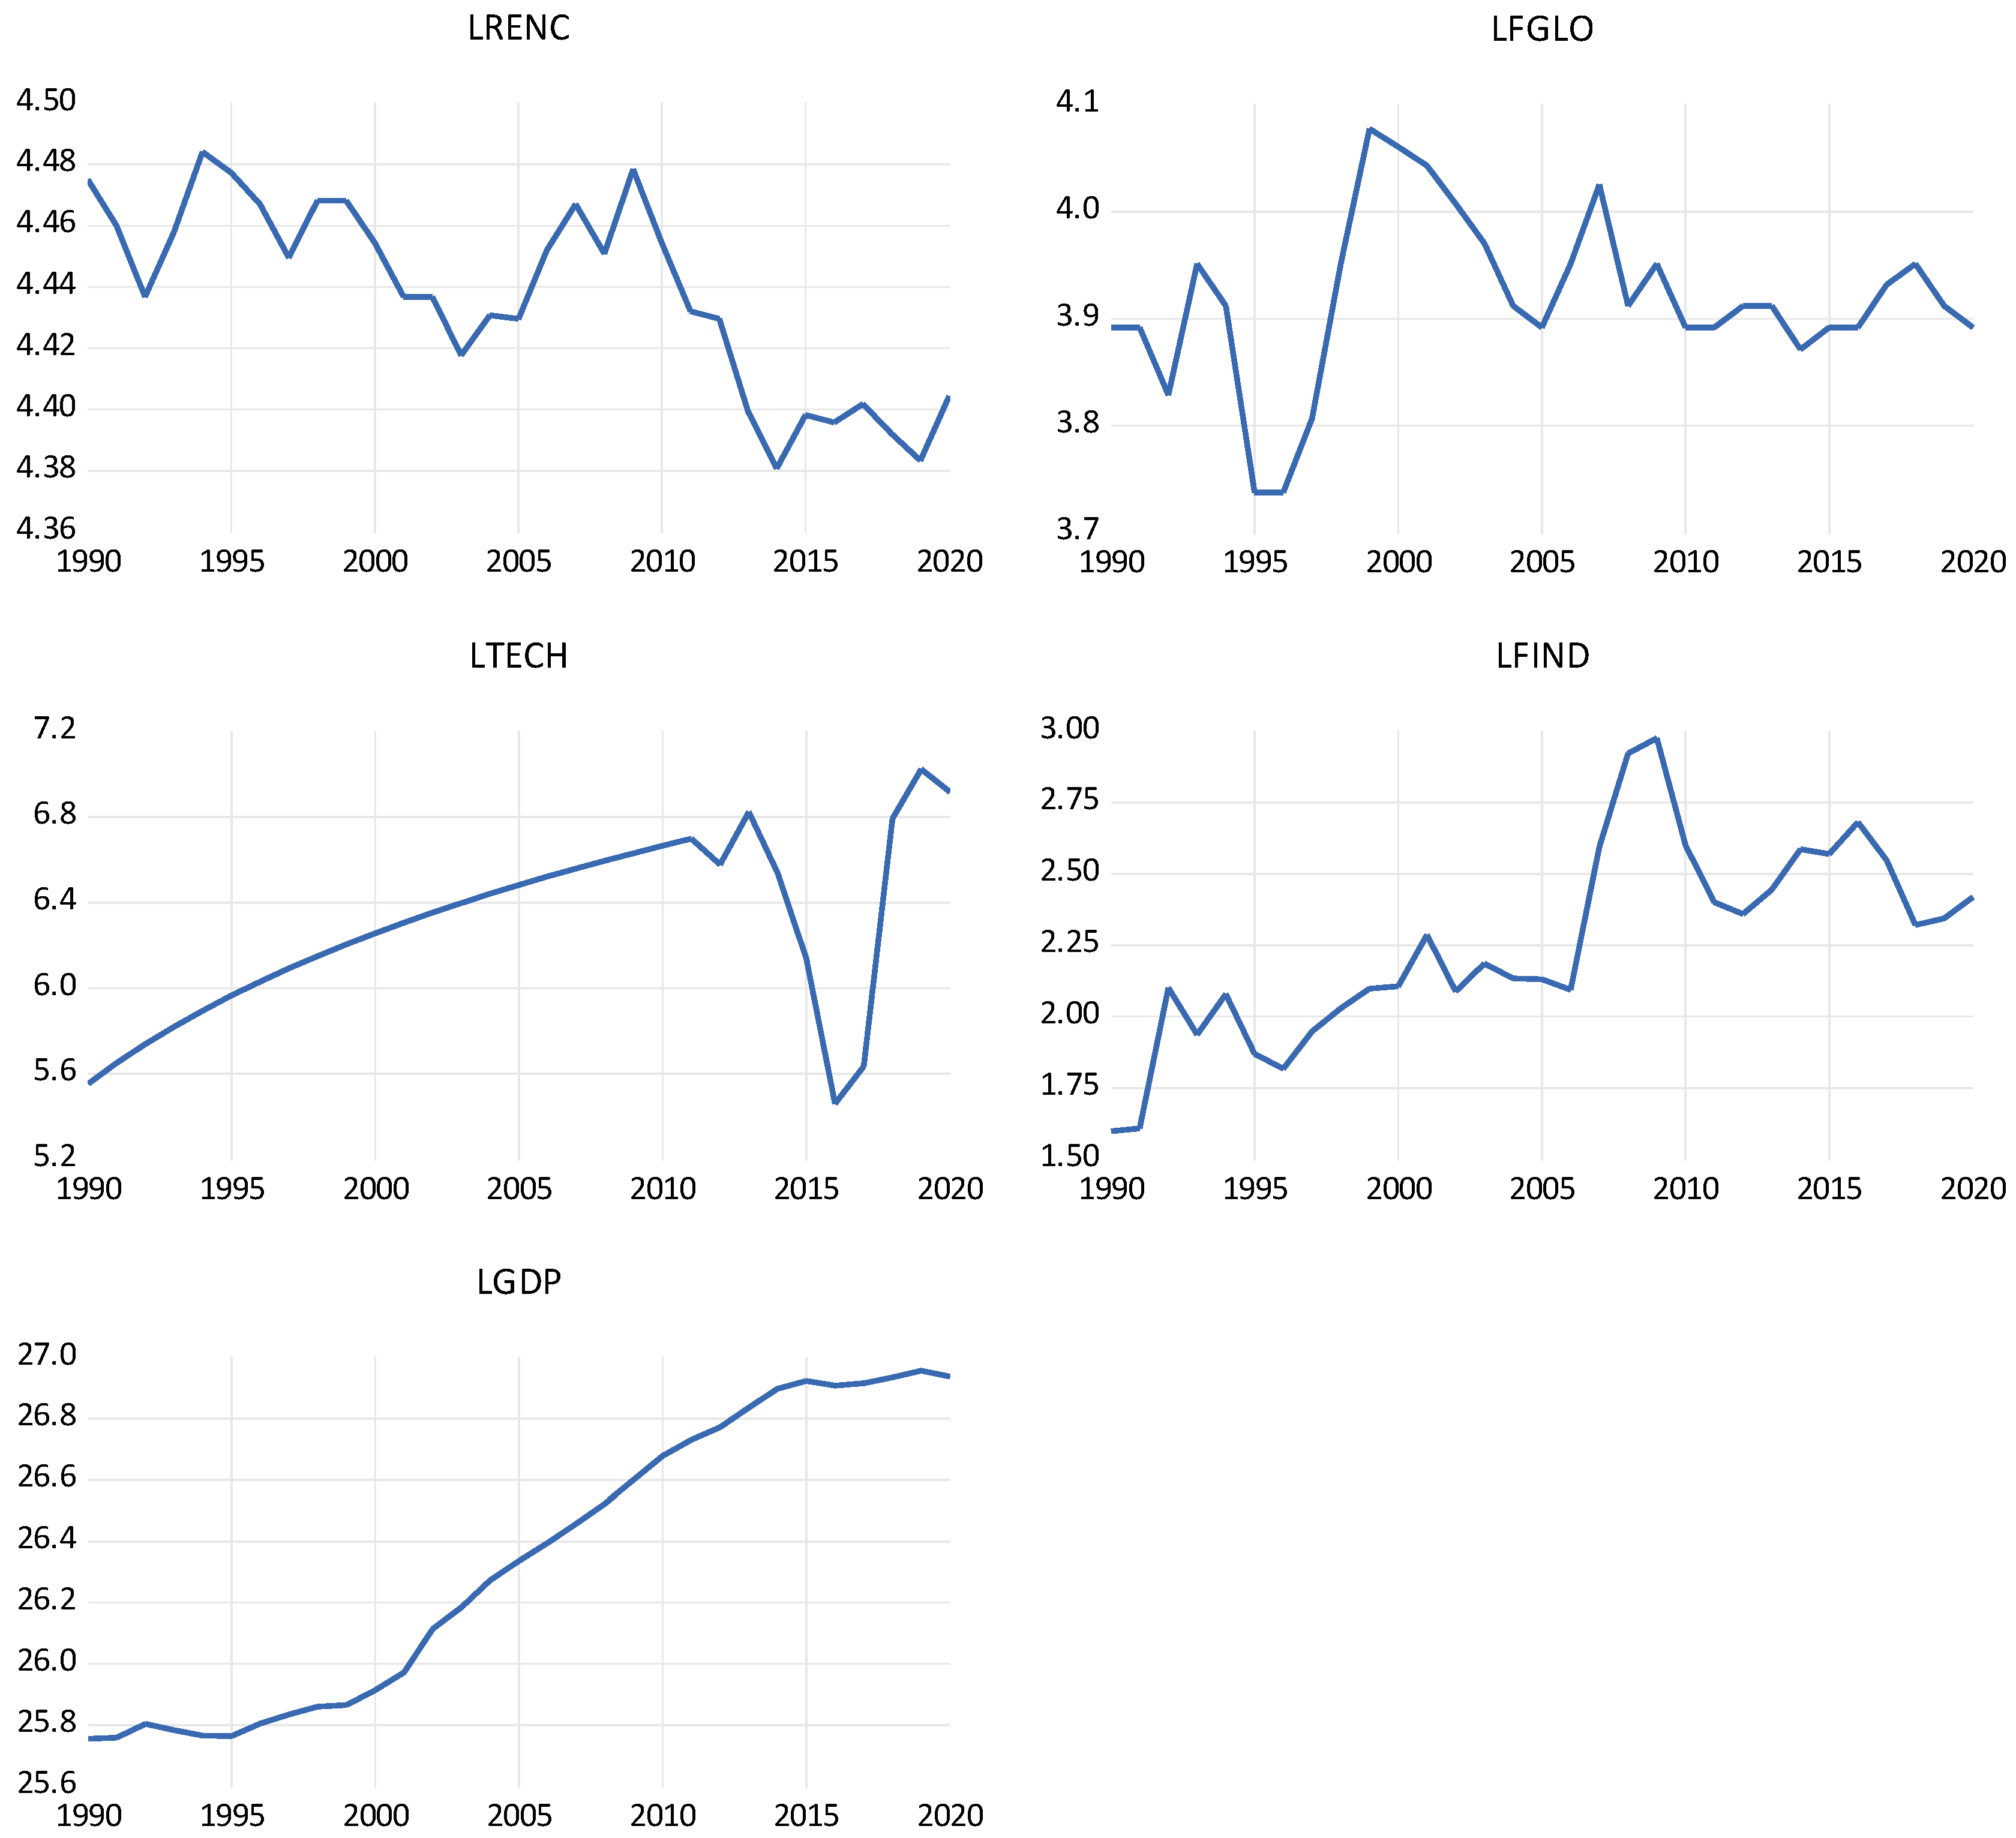
Examining the mean and median in Table 3, it is observed that LGDP 26.33103 has the highest mean (26.33103), median (26.33630), and maximum values (26.95644). This is followed by the LTECH variable across all parameters. In terms of skewness, LRENC (−0.353777), LFGLO (−0.208968), and LTECH (−0.307967) are negatively skewed, while LFIND (0.132971) and LGDP (0.053359) are positively skewed. In terms of kurtosis, LRENC, LTECH, LFIND, and LGDP are platykurtic because the values are <3, while LFGLO is leptokurtic because the value is >3. Lastly, all variables demonstrate normality (variables >5% p value), confirming the suitability of the ARDL approach. The diagrammatic representation of the variables is seen in Figure 2, which shows that LRENC and LFGLO are downward sloping, while LTECH, LFIND, and LGDP are upward sloping.
Table 3.
Descriptive statistics.
Figure 2.
Variable trend.
4.2. Unit Root Analysis
The unit root tests for ADF [55] and PP [56] are shown in Table 4. According to the ADF result, LTECH is stationary at I(0), but LRENC, LFGLO, LFIND, and LGDP are stationary at I(1). All variables, however, are stationary at I(1) for the PP test.
Table 4.
Unit root analysis.
4.3. Bounds Test
Table 5’s bounds test shows that there is a long-term relationship between the variables. The reason for this is that the F-stat. value (3.555059) exceeds the boundaries of I(0) and I(1) at the 10% and 5% significance level, respectively. However, at the 2.5% level, the value falls short of the I(1) critical value (3.87).
Table 5.
Bound test.
4.4. Lag Selection
The outcomes of the lag order selection for a vector autoregressive (VAR) model are displayed in Table 6. To find the ideal number of lags, three criteria were used: the Hannan–Quinn Criterion (HQ), the Schwarz Criterion (SC), and the Akaike Information Criterion (AIC). According to the SC approach, the results show that one lag is the most suitable. This lag selection is essential for carrying out the Johansen cointegration test.
Table 6.
Lag selection.
4.5. Johansen Cointegration Test
In Table 7a, at None*, the Trace Statistic (91.53950) is greater than the 5% critical value of 69.81889. Thus, the null hypothesis of no cointegration is rejected at 1% level of significance. In At most 1 *, the Trace Statistic (48.24400) is greater than the 5% critical value of 47.85613. Thus, the null hypothesis of no cointegration is rejected at 5% level of significance. In Table 7b, at None *, the Trace Statistic (43.29550) is greater than the 5% critical value of 33.87687. Thus, the null hypothesis of no cointegration is rejected at 1% level of significance. These results confirm that there is a long-run relationship between the variables. This agrees with the result of the bounds test. It is important to state that the condition of all (1) variables has to be met before this approach can be employed. This study confirms that all our variables are stationary at I(1).
Table 7.
Johansen cointegration test. (a) shows Trace Statistic, (b) shows Maximum Eigenvalue.
4.6. ARDL Long- and Short-Run Results
The outcome in Table 8 shows that LFGLO has a positive long-run coefficient, but the evidence is not strong enough to claim a clear long-run effect. LTECH and LFIND increase LRENC in the long run, while LGDP reduces LRENC. Empirically, a 1% rise in LTECH increases LRENC by 0.04%, a 1% increase in LFIND increases LRENC by 0.11%, and a 1% rise in LGDP reduces LRENC by 0.13%.
Table 8.
ARDL long and short-run outcomes.
In the short-term, a 1% rise in LFGLO spurs LRENC by 0.08%. However, at lag 1 and lag 2, the impact of LFGLO on LRENC is negative. A 1% rise in LFGLO reduces LRENC by 0.11% and 0.05%, respectively. The impact of LFIND on LRENC is positive, confirming that a 1% rise in LFIND will spur LRENC by 0.03%. On the other hand, LGDP reduces LRENC by 0.35% and 0.25%, at no lag and at lag 1, respectively. However, at lag 2, LGDP increases LRENC by 0.35%, which is significant.
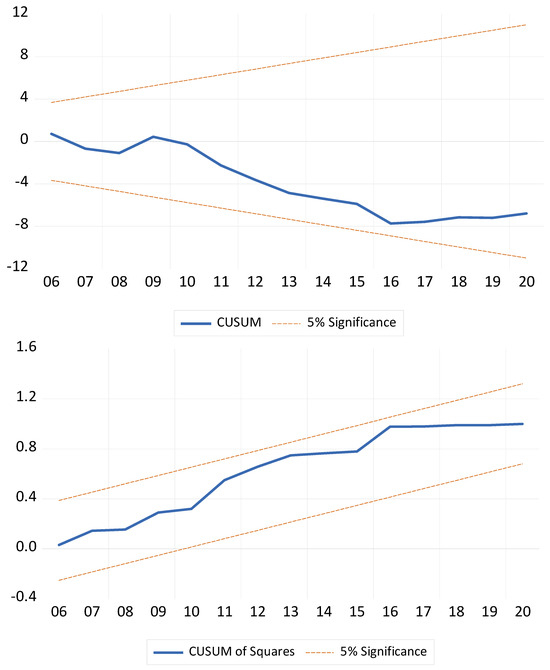
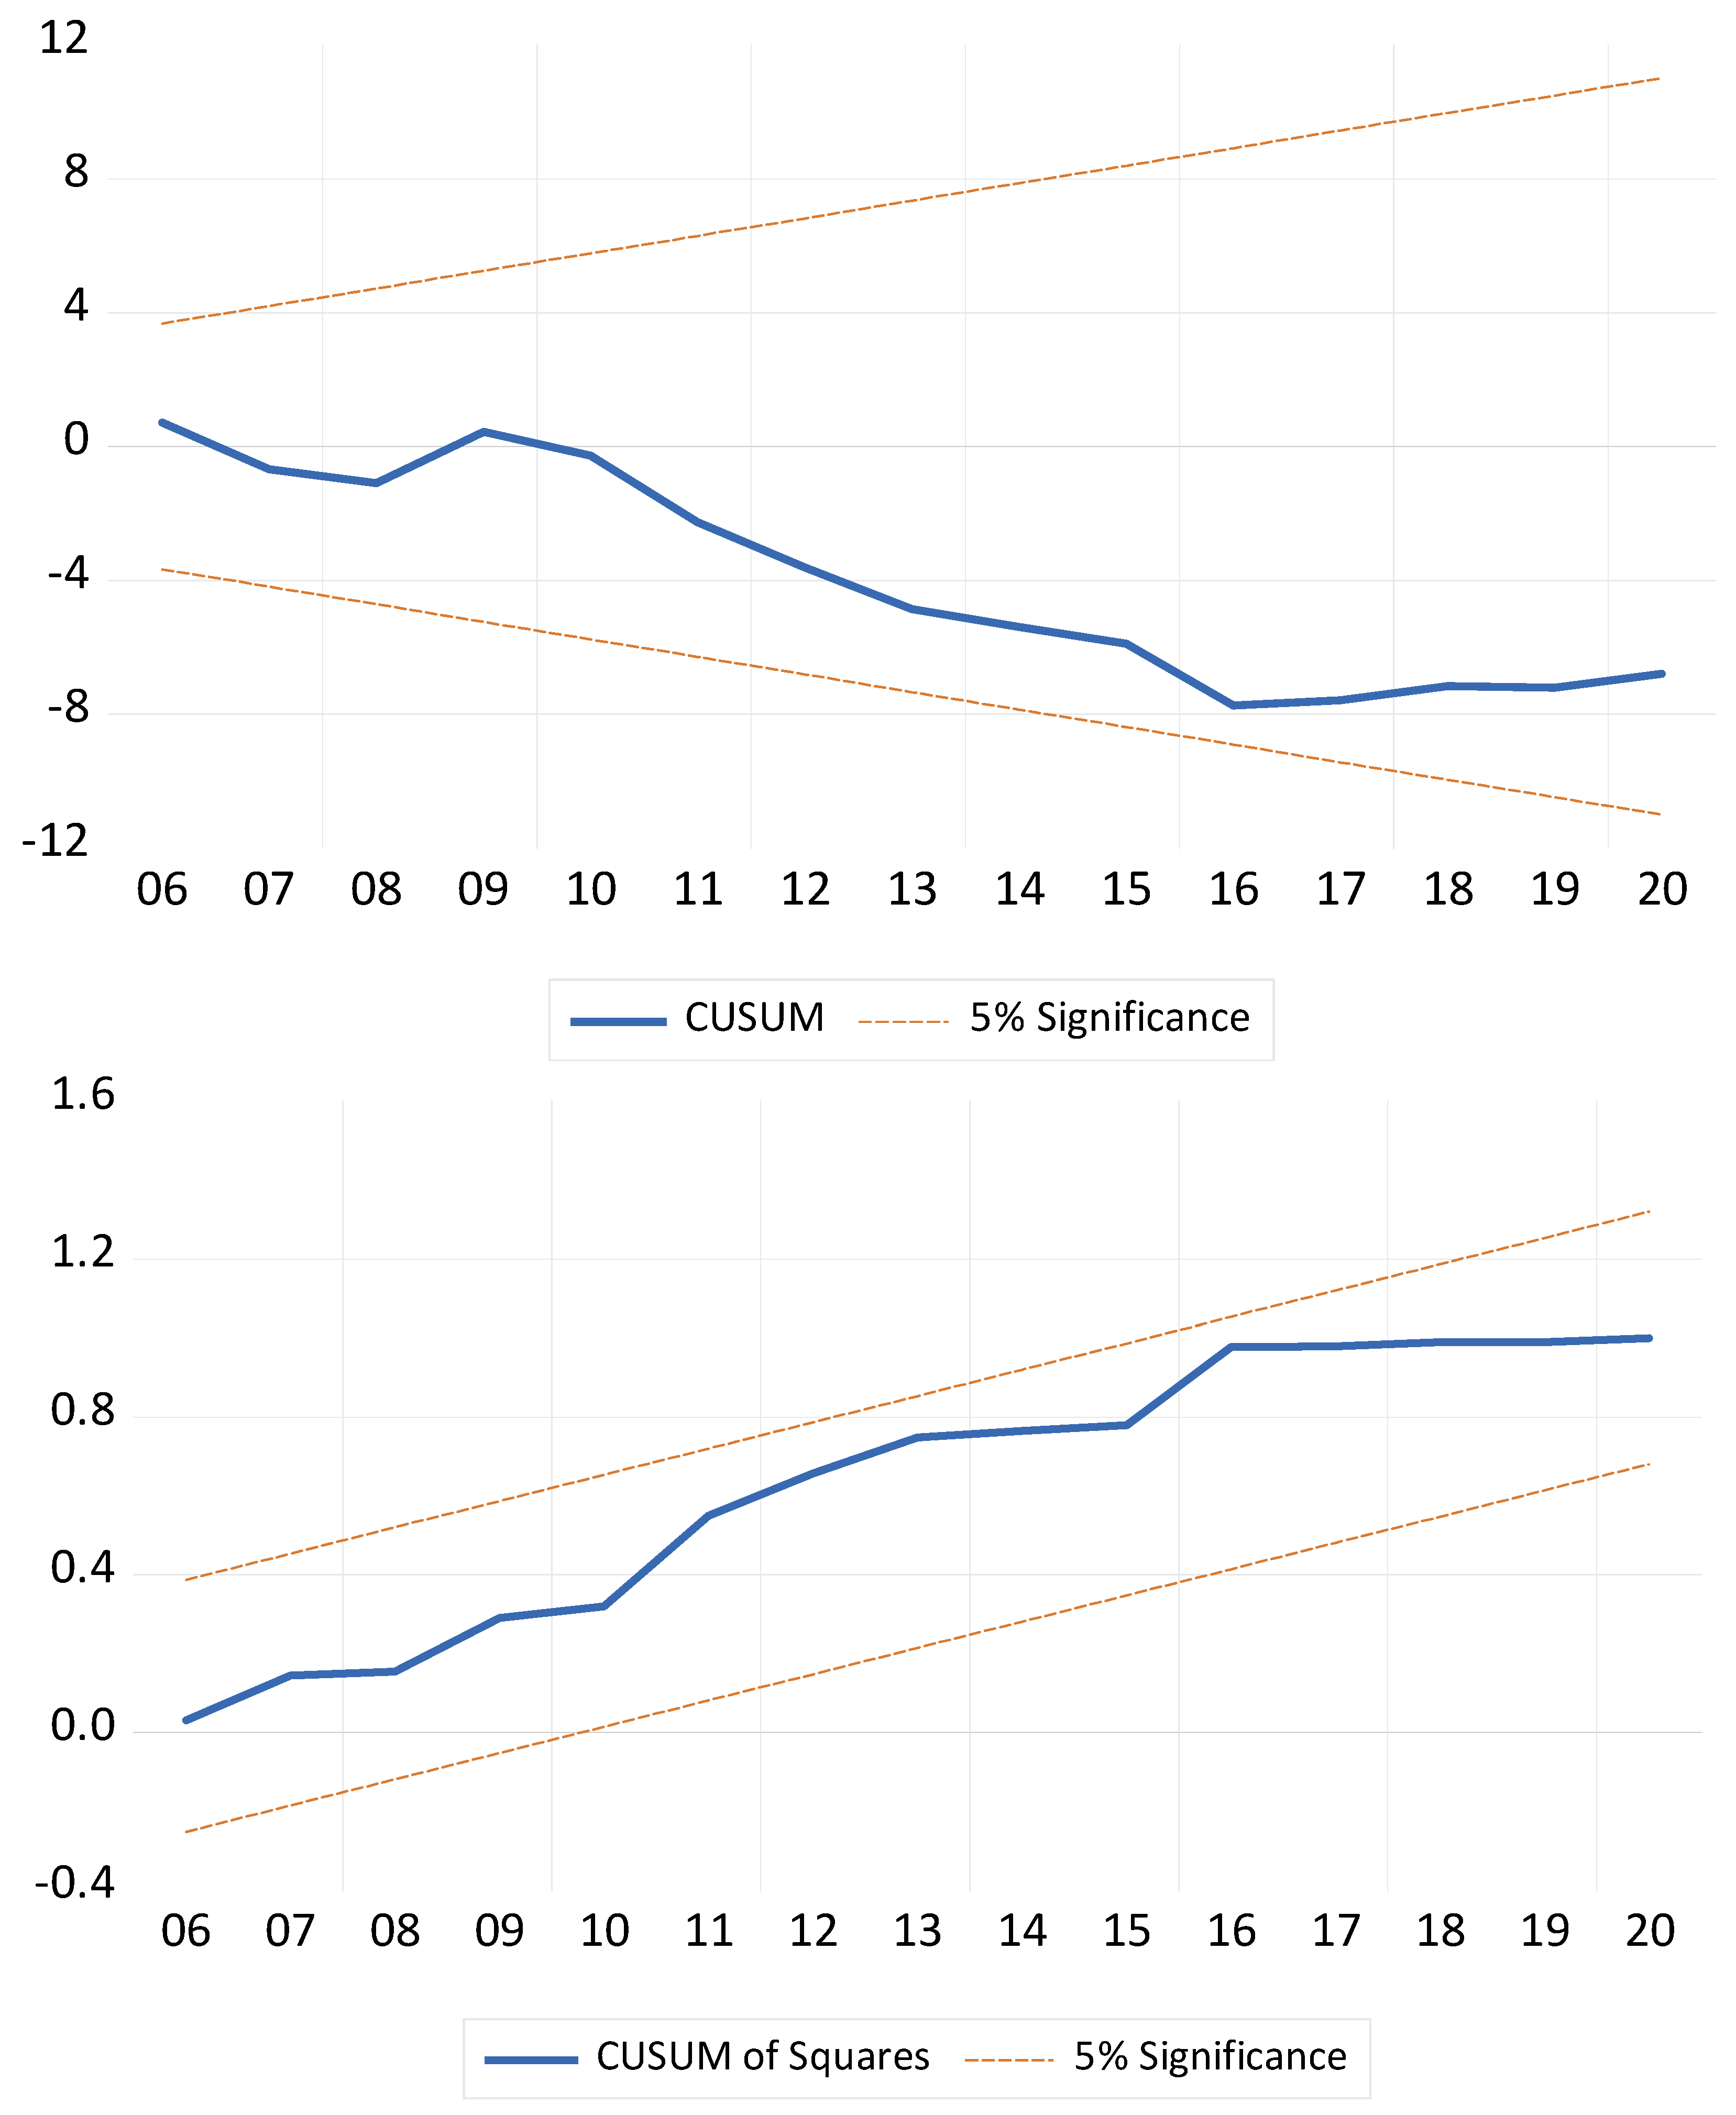
The ECT coefficient of −0.511483 indicates a 51.1% adjustment speed per period, meaning approximately half of any disequilibrium is corrected within one year. The R-squared value shows that the regressors explain 78% of the variation in LRENC. Our model confirms homoskedasticity (0.7509 > 5% p-value), normal distribution (0.886737 > 5% p-value), and no serial correlation (0.4335 > 5% p-value), based on the results of the diagnostic tests in Table 5. The model’s stability is confirmed by the CUSUM and CUSUMQ, shown in Figure 3.
Figure 3.
CUSUM and CUSUMQ.
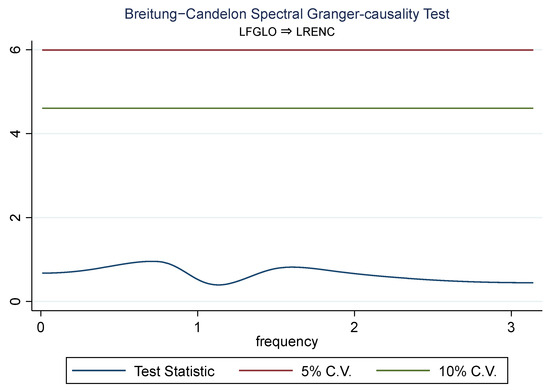
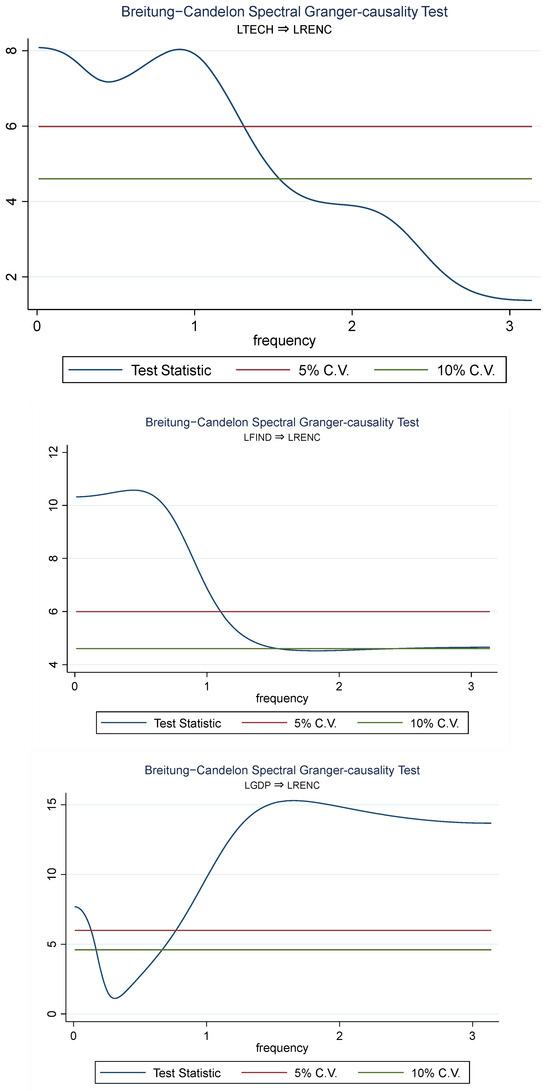
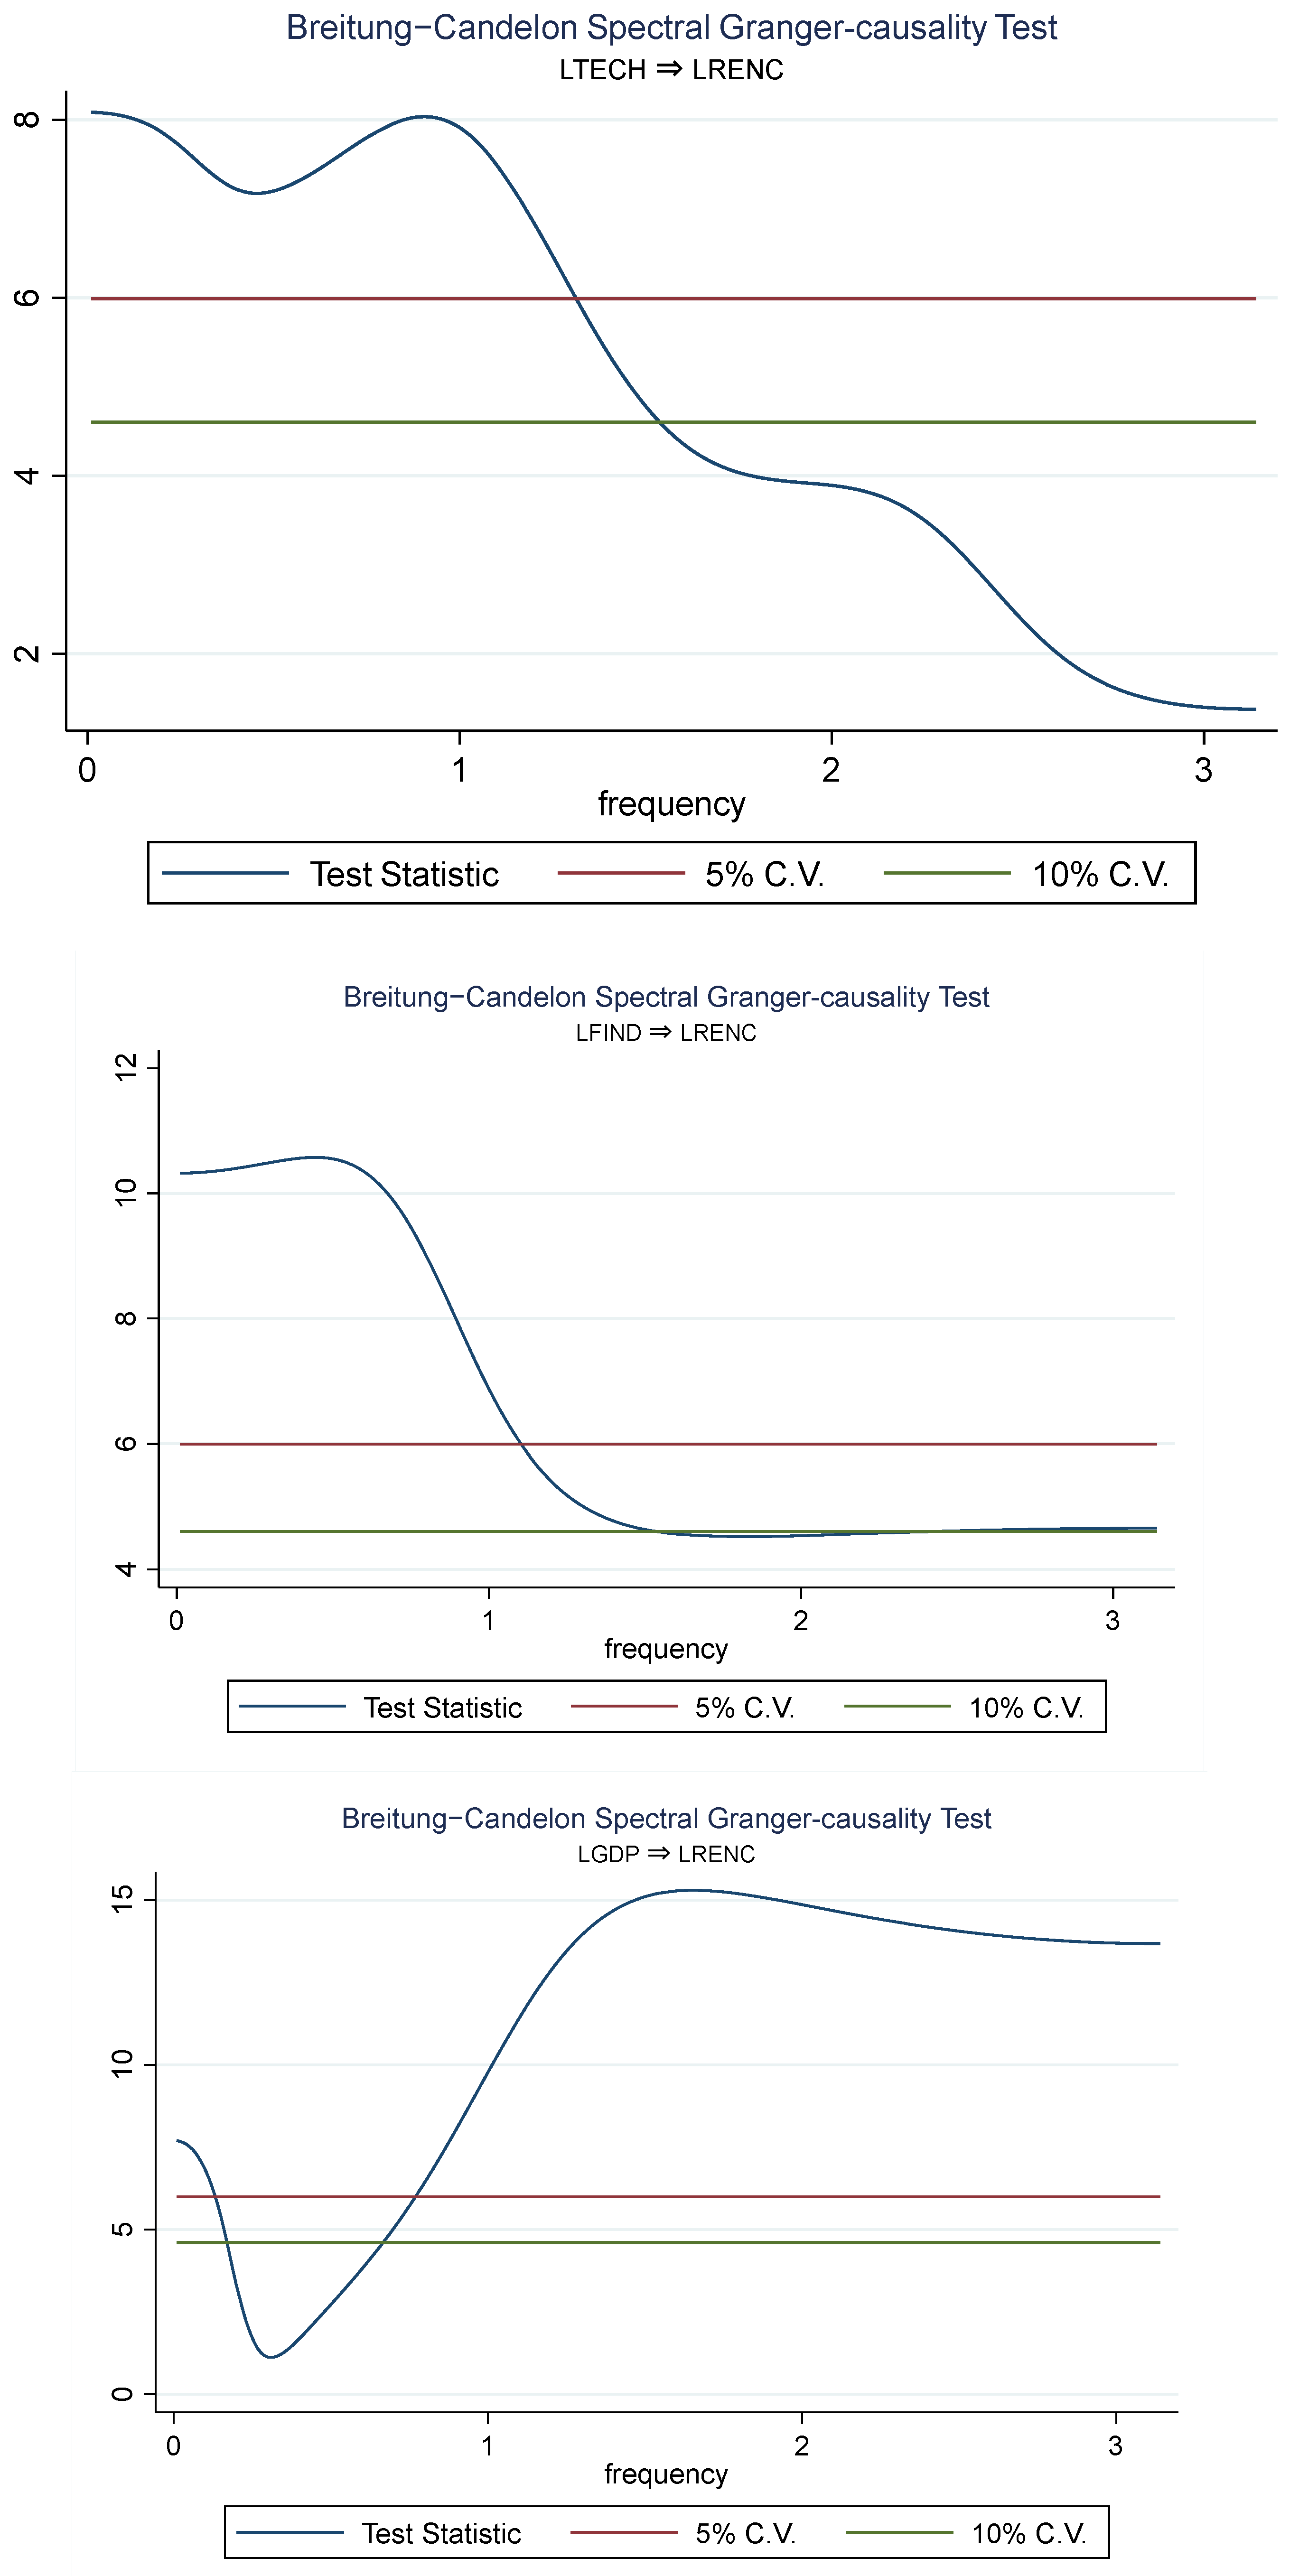
4.7. Frequency Domain Causality
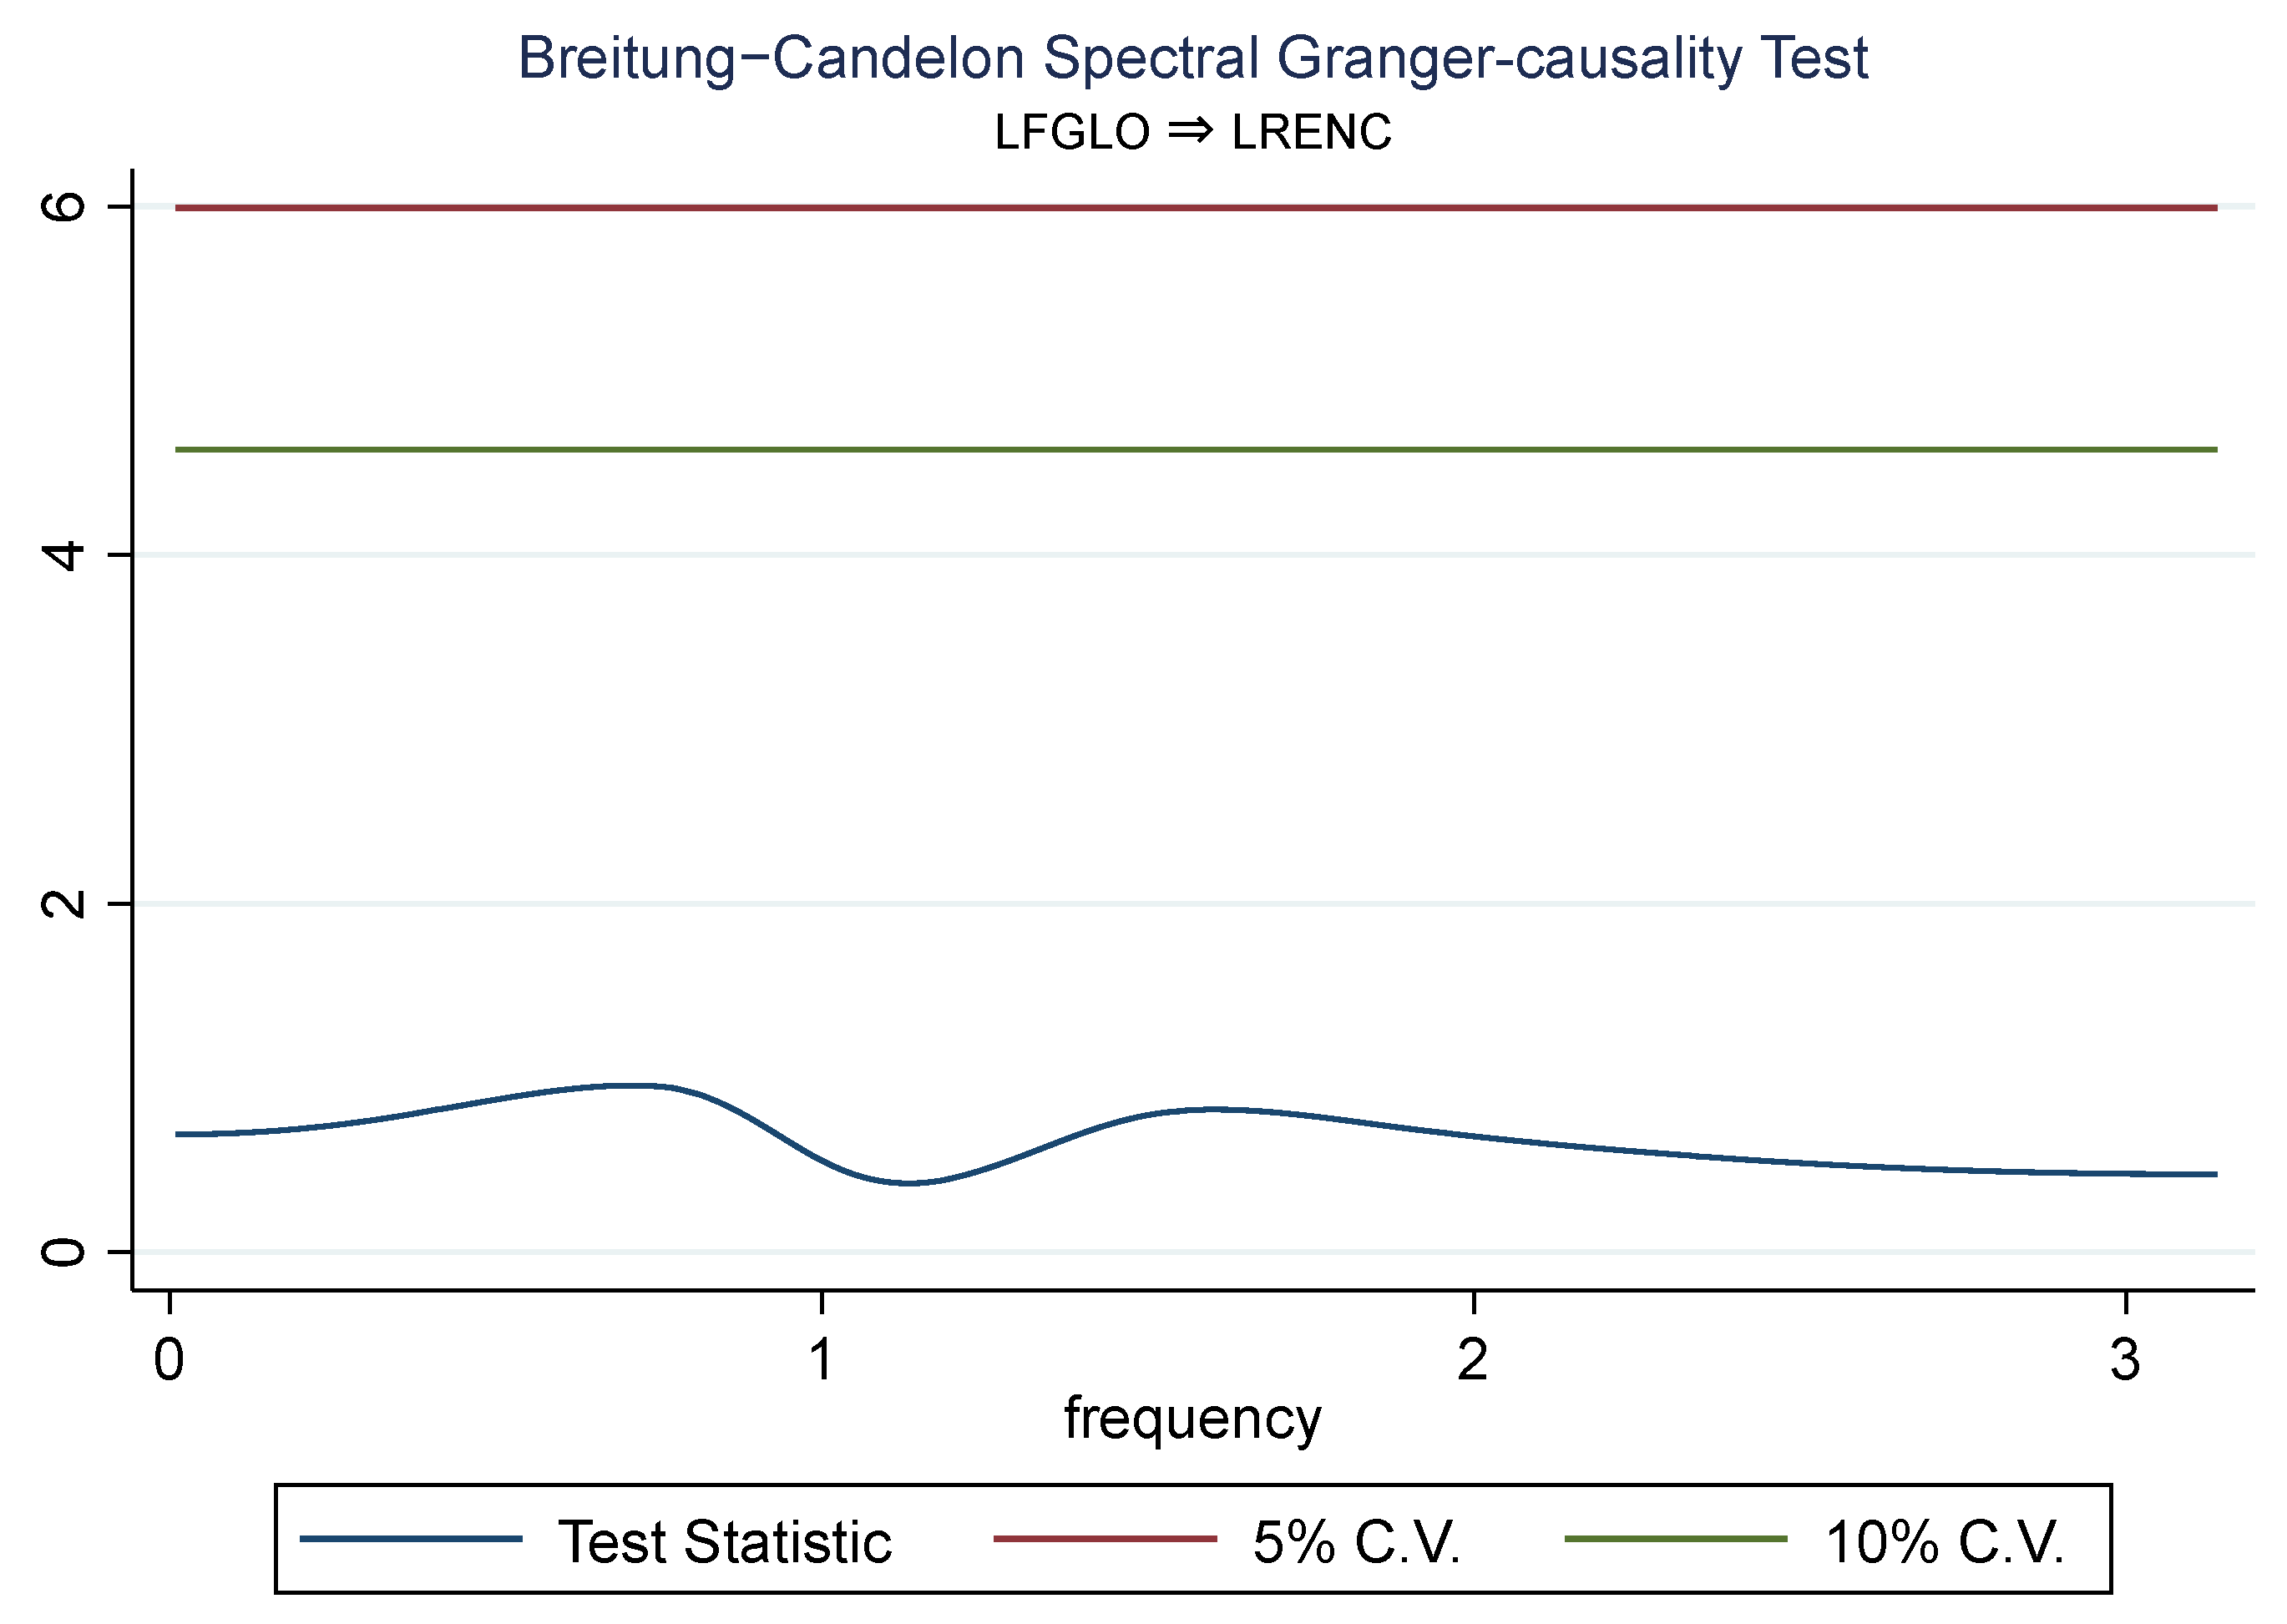
Table 9 and Figure 4 shows the causal interaction between LFGLO, LTECH, LFIND, LGDP, and LRENC in the short (1–2 years), medium (3–5 years), and long-term (5 years and above). LFGLO does not Granger cause LRENC in the short, medium, or long term. The lack of a causal relationship between LFGLO and LRENC shows that financial openness alone is insufficient to stimulate RENC. As a result, targeted green financial policies, regulatory incentives, or sustainable investment frameworks are crucial.
Table 9.
Frequency domain causality.
Figure 4.
Frequency domain causality.
The findings further confirm that LTECH Granger causes LRENC in the medium and long run, but the short-term impact is not significant. This shows that LTECH does not immediately boost LRENC in Nigeria, since innovation takes time to convert into practical applications. Before new technologies can have an impact on energy consumption, they must be developed, financed, adopted, and incorporated into the energy system. However, in the medium and long term, innovation lowers costs, increases efficiency, and promotes sustainable energy infrastructure. As these effects accumulate over time, LTECH begins to drive LRENC. Both the medium- and long-term effects are statistically significant at the 5% level.
LFIND also granger causes LRENC in the medium and long term, while the short-term impact is insignificant. LFIND does not have an immediate impact on LRENC because sustainable energy projects need time to seek funds, complete regulatory processes, and create infrastructure. However, in the medium and long term, a highly developed financial system enhances credit availability, lowers financial costs, and mobilizes funds for clean energy projects.
Lastly, LGDP Granger causes LRENC in the short, medium, and long term. The implication of this is that as the economy grows, government revenue increases, private sector profits rise, and household income increases, which makes it easier to finance clean energy projects.
4.8. Discussions
The positive impact of FGLO on RENC [24,25], with no lag in the short term, most likely represents an immediate liquidity or capital availability effect. Financial restrictions for clean energy projects may be momentarily alleviated by increased foreign capital inflows. The negative coefficients at lags 1 and 2 [28,29], however, might point to adjustment effects or capital reallocation, when foreign investments return to more lucrative conventional energy industries. On the other hand, the positive but negligible long-term outcome [23] demonstrates that while financial integration may open up avenues for funding clean energy, these flows are not always focused on the clean energy industry. Instead of green energy, FGLO in Nigeria is frequently focused on banking, telecommunications, and oil and gas. The inconsistencies in results align with the FGLO and RENC hypothesis stated in Section 2.
Regarding the positive TECH and RENC nexus, Ref. [31] stated that growing ecological concerns, particularly in recent years, may have compelled developing countries, like Nigeria, to support low-carbon, cleaner manufacturing methods to meet economic goals without endangering biodiversity. In accordance with other studies, Ref. [33] affirmed that TECH is a crucial component of RENC and that it can aid in the resolution of ecological issues. Refs. [29,57] argued that creating innovative technology can increase the beneficial impact of using clean energy on the green economy. Ref. [29] argued that the association between TECH and RENC is reinforced by FGLO, which enables technologies to be diffused, allowing nations to embrace cutting-edge renewable solutions. Ref. [58] further opined that TECH, together with a favourable economic scenario, can assist in eliminating the bottlenecks linked with RENC. Thus, the hypothesis that TECH will drive RENC is confirmed.
The positive impact of FIND on RENC is expected. It has been established that access to capital, which raises the standard of living and promotes economic expansion, is encouraged by a well-established financial system [11]. A financial system that functions properly is the outcome of the adoption of cutting-edge technologies that conserve more energy. Furthermore, financial channel linkages and FDI are brought about by the FIND and liberalization of the capital market, which facilitates the transfer of green technology with sufficient financial and technical capabilities [24]. Ref. [32] stated that to use greater amounts of clean energy, adequate funding is a prerequisite for investments in green R&D. Ref. [40] stated that Nigerian financial institutions remain committed to facilitating or promoting the development and use of renewable energy in Nigeria for the country to accomplish its ecological objectives. This is strikingly comparable to the conclusions of [37,38,40]. Lastly, the hypothesis that FIND will spur RENC is ascertained.
Finally, the short-run results, which demonstrate that GDP reduces RENC at no lag and lag 1, but raises RENC at lag 2, imply a dynamic (time-dependent) relationship between GDP and RENC in Nigeria. This type of reversal across lags is common in time-series models like ARDL, particularly in developing economies going through structural change. First, the negative association at lags 0 and 1 shows Nigeria’s current energy structure. In the short run, GDP growth is frequently driven by fossil fuel-dependent industries such as oil production, gas-powered electricity generation, transportation, and manufacturing. Nigeria is a large oil-producing country; hence, economic expansion tends to boost fossil fuel use faster than RENC. Renewable energy infrastructure, including solar, wind, and hydro mini-grids, requires planning, financing, and installation time. As a result, as GDP rises, RENC may not respond immediately; instead, fossil fuels cover the demand gap, resulting in a negative consequence. On the other hand, the positive association at lag 2 suggests a medium-term structural adjustment mechanism. Following a two-year period, the income generated from economic growth may increase government revenue, allowing greater public investment in clean energy infrastructure, improving private sector access to finance, and encouraging policy reforms or the implementation of renewable energy programmes. In summary, while economic progress may initially depend on conventional energy, it eventually generates the financial resources, technological diffusion, and institutional advancement required for the emergence of clean energy. In the long run, the negative result shows that renewable energy is yet to be embedded in the country’s long-term growth plan. The negative association between GDP and RENC is confirmed by [29], while the positive association is confirmed by [37,45]. It is also essential to state that the hypothesis that rising economic expansion will hinder clean energy use is established.
5. Conclusions and Policy Recommendation
5.1. Conclusions
This research investigates the effect of FGLO and TECH on RENC in Nigeria from 1990 to 2020 using the ARDL model and the Frequency Domain Causality Approach. In addition, control variables such as FIND and GDP were employed. The ARDL result is as follows: (1) The bounds test confirms a long-run association between the variables. (2) In the long-run, TECH and FIND spur RENC, while GDP reduces RENC. In addition, FGLO has a positive long-run coefficient, but the evidence is not strong enough to claim a clear long-run effect. (3) In the short-run, FGLO and FIND increase RENC, while GDP reduces RENC. Furthermore, the Frequency Domain Causality results confirm that TECH Granger causes RENC in the medium and long term, FIND Granger causes RENC in the medium and long term, while GDP Granger causes RENC in the short, medium, and long term. In addition, FGLO does not Granger cause RENC in the short, medium, and long term.
5.2. Policy Recommendations
- First, clear policies that steer foreign investment toward renewable energy products should be established by Nigerian policymakers. This can be accomplished by attracting foreign investors into the renewable energy space with incentives including tax cuts, investment guarantees, and green bonds.
- Second, it has been ascertained that one of the factors that makes RENC progress is R&D in technologies. Thus, much emphasis should be channelled to R&D in clean technologies to enable Nigeria to realize its clean energy potential.
- Third, obtaining funding from the nation’s finance industry to support the shift to clean energy utilization is inevitable, given the enormous capital requirements of clean energy projects. Therefore, the Central Bank of Nigeria (CBN) ought to think about offering clean energy investors a better interest rate. Furthermore, given Nigeria’s poor credit availability, the CBN ought to expand its financial inclusion initiative to increase loan availability, especially for households and businesses interested in eco-friendly products.
5.3. Limitations and Future Research Suggestions
Despite the contribution made by this research to existing studies, some limitations are observed. Firstly, the focus of this research is on Nigeria only. Thus, other studies can use other countries as a case study to derive much more robust policies. Secondly, other dimensions of the FIND indicators can be employed in further studies. At the same time, more studies should investigate the link between GDP, FGLO, and RENC. Thirdly, aside from the ARDL and frequency domain causality methods employed in this research, other non-linear techniques can be used, such as the wavelet techniques.
Funding
This research received no external funding.
Institutional Review Board Statement
Not applicable.
Informed Consent Statement
Not applicable.
Data Availability Statement
The data sources used in this research are available in the manuscript. In addition, data are available on request from the authors.
Conflicts of Interest
The author declares no conflicts of interest.
References
- Mukhtarov, S.; Yüksel, S.; Dinçer, H. The impact of financial development on renewable energy consumption: Evidence from Turkey. Renew. Energy 2022, 187, 169–176. [Google Scholar] [CrossRef] [Scilit]
- Awosusi, A.A.; Özkan, O.; Ahmed, Z.; Sevinç, D.E.; Adebayo, T.S. Formulating a road map for decarbonization in United States via resource efficiency, renewable energy, and globalization: Evidence from time-frequency-quantile approach. Nat. Resour. Forum 2026, 50, 323–348. [Google Scholar] [CrossRef] [Scilit]
- Reverter, M.; Sarter, S.; Caruso, D.; Avarre, J.-C.; Combe, M.; Pepey, E.; Pouyaud, L.; Vega-Heredía, S.; De Verdal, H.; Gozlan, R.E. Aquaculture at the crossroads of global warming and antimicrobial resistance. Nat. Commun. 2020, 11, 1870. [Google Scholar] [CrossRef] [Scilit]
- Mikayilov, J.I.; Mukhtarov, S.; Dinçer, H.; Yüksel, S.; Aydın, R. Elasticity Analysis of Fossil Energy Sources for Sustainable Economies: A Case of Gasoline Consumption in Turkey. Energies 2020, 13, 731. [Google Scholar] [CrossRef] [Scilit]
- Liu, Y.; Gong, X.; Yüksel, S.; Dinçer, H.; Aydın, R. A multidimensional outlook to energy investments for the countries with continental shelf in East Mediterranean Region with Hybrid Decision Making Model based on IVIF logic. Energy Rep. 2021, 7, 158–173. [Google Scholar] [CrossRef] [Scilit]
- Du, L.; Dinçer, H.; Ersin, İ.; Yüksel, S. IT2 Fuzzy-Based Multidimensional Evaluation of Coal Energy for Sustainable Economic Development. Energies 2020, 13, 2453. [Google Scholar] [CrossRef] [Scilit]
- Panwar, N.L.; Kaushik, S.C.; Kothari, S. Role of renewable energy sources in environmental protection: A review. Renew. Sustain. Energy Rev. 2011, 15, 1513–1524. [Google Scholar] [CrossRef] [Scilit]
- Kim, J.; Park, K. Financial development and deployment of renewable energy technologies. Energy Econ. 2016, 59, 238–250. [Google Scholar] [CrossRef] [Scilit]
- Ahmad, M.; Dai, J.; Mehmood, U.; Abou Houran, M. Renewable energy transition, resource richness, economic growth, and environmental quality: Assessing the role of financial globalization. Renew. Energy 2023, 216, 119000. [Google Scholar] [CrossRef] [Scilit]
- Fung, M.K. Financial development and economic growth: Convergence or divergence? J. Int. Money Financ. 2009, 28, 56–67. [Google Scholar] [CrossRef] [Scilit]
- Sadorsky, P. Financial development and energy consumption in Central and Eastern European frontier economies. Energy Policy 2011, 39, 999–1006. [Google Scholar] [CrossRef] [Scilit]
- Chiu, Y.-B.; Lee, C.-C. Effects of financial development on energy consumption: The role of country risks. Energy Econ. 2020, 90, 104833. [Google Scholar] [CrossRef] [Scilit]
- Khan, K.; Su, C.-W.; Umar, M.; Zhang, W. Geopolitics of technology: A new battleground? Technol. Econ. Dev. Econ. 2022, 28, 442–462. [Google Scholar] [CrossRef] [Scilit]
- Cheng, C.; Ren, X.; Dong, K.; Dong, X.; Wang, Z. How does technological innovation mitigate CO2 emissions in OECD countries? Heterogeneous analysis using panel quantile regression. J. Environ. Manag. 2021, 280, 111818. [Google Scholar] [CrossRef] [Scilit]
- Irandoust, M. Innovations and renewables in the Nordic countries: A panel causality approach. Technol. Soc. 2018, 54, 87–92. [Google Scholar] [CrossRef] [Scilit]
- Wang, W.; Xiao, W.; Bai, C. Can renewable energy technology innovation alleviate energy poverty? Perspective from the marketization level. Technol. Soc. 2022, 68, 101933. [Google Scholar] [CrossRef] [Scilit]
- Apergis, N.; Payne, J.E. Renewable energy consumption and growth in Eurasia. Energy Econ. 2010, 32, 1392–1397. [Google Scholar] [CrossRef] [Scilit]
- Bhattacharya, M.; Paramati, S.R.; Ozturk, I.; Bhattacharya, S. The effect of renewable energy consumption on economic growth: Evidence from top 38 countries. Appl. Energy 2016, 162, 733–741. [Google Scholar] [CrossRef] [Scilit]
- Salari, M.; Kelly, I.; Doytch, N.; Javid, R.J. Economic growth and renewable and non-renewable energy consumption: Evidence from the U.S. states. Renew. Energy 2021, 178, 50–65. [Google Scholar] [CrossRef] [Scilit]
- Somoye, O.A.; Ozdeser, H.; Seraj, M. Modeling the determinants of renewable energy consumption in Nigeria: Evidence from Autoregressive Distributed Lagged in error correction approach. Renew. Energy 2022, 190, 606–616. [Google Scholar] [CrossRef] [Scilit]
- Somoye, O.A. Energy crisis and renewable energy potentials in Nigeria: A review. Renew. Sustain. Energy Rev. 2023, 188, 113794. [Google Scholar] [CrossRef] [Scilit]
- Breitung, J.; Candelon, B. Testing for short- and long-run causality: A frequency-domain approach. J. Econom. 2006, 132, 363–378. [Google Scholar] [CrossRef] [Scilit]
- Bayar, Y.; Sasmaz, M.U.; Ozkaya, M.H. Impact of Trade and Financial Globalization on Renewable Energy in EU Transition Economies: A Bootstrap Panel Granger Causality Test. Energies 2020, 14, 19. [Google Scholar] [CrossRef] [Scilit]
- Majeed, A.; Ahmad, M.; Rasheed, M.F.; Khan, M.K.; Popp, J.; Oláh, J. The Dynamic Impact of Financial Globalization, Environmental Innovations and Energy Productivity on Renewable Energy Consumption: Evidence from Advanced Panel Techniques. Front. Environ. Sci. 2022, 10, 894857. [Google Scholar] [CrossRef] [Scilit]
- Chen, Y.; Zhang, X. Does financial globalization promote renewable energy investment? Empirical insights from China. Environ. Sci. Pollut. Res. 2023, 30, 101366–101378. [Google Scholar] [CrossRef] [Scilit]
- Alam, M.M.; Murshed, M.; Ozturk, I.; Khudoykulov, K. Macroeconomic determinants of non-renewable and renewable energy consumption in India: The roles of international trade, innovative technologies, financial globalization, carbon emissions, financial development, and urbanization. Energy 2024, 308, 132939. [Google Scholar] [CrossRef] [Scilit]
- Fan, C.; Usman, A. How Does Renewable Energy Respond to Financial Globalization and Information and Communications Technology Trade? Energies 2024, 17, 750. [Google Scholar] [CrossRef] [Scilit]
- Jóźwik, B.; Sarıgül, S.S.; Topcu, B.A.; Çetin, M.; Doğan, M. Trade Openness, Economic Growth, Capital, and Financial Globalization: Unveiling Their Impact on Renewable Energy Consumption. Energies 2025, 18, 1244. [Google Scholar] [CrossRef] [Scilit]
- Adebayo, T.S.; Razi, U.; Uzun, B.; Staniewski, M.W.; Olanrewaju, V.O. Unshielding the effect of financial globalisation and technological innovation on renewable energy consumption: A multivariate wavelet quantile-based approach. Energy Environ. 2025, 0958305X251385237. [Google Scholar] [CrossRef] [Scilit]
- Geng, J.B.; Ji, Q. Technological innovation and renewable energy development: Evidence based on patent counts. Int. J. Glob. Environ. Issues 2016, 15, 217. [Google Scholar] [CrossRef] [Scilit]
- Sharma, R.; Shahbaz, M.; Kautish, P.; Vo, X.V. Analyzing the impact of export diversification and technological innovation on renewable energy consumption: Evidences from BRICS nations. Renew. Energy 2021, 178, 1034–1045. [Google Scholar] [CrossRef] [Scilit]
- Khan, A.; Chenggang, Y.; Hussain, J.; Kui, Z. Impact of technological innovation, financial development and foreign direct investment on renewable energy, non-renewable energy and the environment in belt & Road Initiative countries. Renew. Energy 2021, 171, 479–491. [Google Scholar] [CrossRef] [Scilit]
- Khan, K.; Su, C.W.; Rehman, A.U.; Ullah, R. Is technological innovation a driver of renewable energy? Technol. Soc. 2022, 70, 102044. [Google Scholar] [CrossRef] [Scilit]
- Chu, C.-C.; Narayan, P.K.; Ji, Y. Technology innovation, digital finance and renewable energy consumption: Evidence from China. Energy Econ. 2025, 150, 108762. [Google Scholar] [CrossRef] [Scilit]
- He, Z.-X.; Xu, S.-C.; Li, Q.-B.; Zhao, B. Factors That Influence Renewable Energy Technological Innovation in China: A Dynamic Panel Approach. Sustainability 2018, 10, 124. [Google Scholar] [CrossRef] [Scilit]
- Palage, K.; Lundmark, R.; Söderholm, P. The innovation effects of renewable energy policies and their interaction: The case of solar photovoltaics. Environ. Econ. Environ. Policy Stud. 2019, 21, 217–254. [Google Scholar] [CrossRef] [Scilit]
- Eren, B.M.; Taspinar, N.; Gokmenoglu, K.K. The impact of financial development and economic growth on renewable energy consumption: Empirical analysis of India. Sci. Total Environ. 2019, 663, 189–197. [Google Scholar] [CrossRef] [Scilit]
- Lahiani, A.; Mefteh-Wali, S.; Shahbaz, M.; Vo, X.V. Does financial development influence renewable energy consumption to achieve carbon neutrality in the USA? Energy Policy 2021, 158, 112524. [Google Scholar] [CrossRef] [Scilit]
- Anton, S.G.; Afloarei Nucu, A.E. The effect of financial development on renewable energy consumption. A panel data approach. Renew. Energy 2020, 147, 330–338. [Google Scholar] [CrossRef] [Scilit]
- Dimnwobi, S.K.; Madichie, C.V.; Ekesiobi, C.; Asongu, S.A. Financial development and renewable energy consumption in Nigeria. Renew. Energy 2022, 192, 668–677. [Google Scholar] [CrossRef] [Scilit]
- Habiba, U.; Xinbang, C. The impact of financial development on CO2 emissions: New evidence from developed and emerging countries. Environ. Sci. Pollut. Res. 2022, 29, 31453–31466. [Google Scholar] [CrossRef] [Scilit] [PubMed]
- Yu, M.; Jin, H.; Zhang, H.; Chong, A.Y.L. ICT, Financial Development and Renewable Energy Consumption. J. Comput. Inf. Syst. 2023, 63, 190–203. [Google Scholar] [CrossRef] [Scilit]
- Sun, Z.; Zhang, X.; Gao, Y. The Impact of Financial Development on Renewable Energy Consumption: A Multidimensional Analysis Based on Global Panel Data. Int. J. Environ. Res. Public Health 2023, 20, 3124. [Google Scholar] [CrossRef] [Scilit] [PubMed]
- Ankrah, I.; Lin, B. Renewable energy development in Ghana: Beyond potentials and commitment. Energy 2020, 198, 117356. [Google Scholar] [CrossRef] [Scilit]
- Alam, M.M.; Murad, M.W. The impacts of economic growth, trade openness and technological progress on renewable energy use in organization for economic co-operation and development countries. Renew. Energy 2020, 145, 382–390. [Google Scholar] [CrossRef] [Scilit]
- EL-Karimi, M.; El-houjjaji, H. Economic growth and renewable energy consumption nexus in G7 countries: Symmetric and asymmetric causality analysis in frequency domain. J. Clean. Prod. 2022, 342, 130618. [Google Scholar] [CrossRef] [Scilit]
- Obobisa, E.S.; Chen, H.; Mensah, I.A. The impact of green technological innovation and institutional quality on CO2 emissions in African countries. Technol. Forecast. Soc. Change 2022, 180, 121670. [Google Scholar] [CrossRef] [Scilit]
- Somoye, O.A.; Seraj, M.; Ozdeser, H.; Mar’I, M. Modelling the connection between energy intensity, renewable energy, globalization, technological innovation and CO2 emissions: A Quantile–on–Quantile technique. Geol. J. 2024, 59, 1322–1336. [Google Scholar] [CrossRef] [Scilit]
- Chen, C.; Pinar, M.; Stengos, T. Renewable energy consumption and economic growth nexus: Evidence from a threshold model. Energy Policy 2020, 139, 111295. [Google Scholar] [CrossRef] [Scilit]
- World Bank. World Bank Open Data. 2025. Available online: https://data.worldbank.org/ (accessed on 1 November 2025).
- KOF. KOF Globalization Index. 2025. Available online: https://kof.ethz.ch/en/forecasts-and-indicators/indicators/kof-globalisation-index.html (accessed on 1 November 2025).
- Pesaran, M.H.; Shin, Y.; Smith, R.J. Bounds testing approaches to the analysis of level relationships. J. Appl. Econom. 2001, 16, 289–326. [Google Scholar] [CrossRef] [Scilit]
- Uddin, H.; Rahman, M.H.; Majumder, S.C. The impact of agricultural production and remittance inflows on economic growth in Bangladesh using ARDL technique. SN Bus. Econ. 2022, 2, 32. [Google Scholar] [CrossRef] [Scilit]
- Gokmenoglu, K.; Kirikkaleli, D.; Eren, B.M. Time and frequency domain causality Testing: The causal linkage between FDI and economic risk for the case of Turkey. J. Int. Trade Econ. Dev. 2019, 28, 649–667. [Google Scholar] [CrossRef] [Scilit]
- Dickey, D.A.; Fuller, W.A. Distribution of the Estimators for Autoregressive Time Series with a Unit Root. J. Am. Stat. Assoc. 1979, 74, 427–431. [Google Scholar] [CrossRef] [Scilit] [PubMed]
- Phillips, P.C.B.; Perron, P. Testing for a unit root in time series regression. Biometrika 1988, 75, 335–346. [Google Scholar] [CrossRef]
- Xie, F.; Liu, Y.; Guan, F.; Wang, N. How to coordinate the relationship between renewable energy consumption and green economic development: From the perspective of technological advancement. Environ. Sci. Eur. 2020, 32, 71. [Google Scholar] [CrossRef] [Scilit]
- Usman, M.; Hammar, N. Dynamic relationship between technological innovations, financial development, renewable energy, and ecological footprint: Fresh insights based on the STIRPAT model for Asia Pacific Economic Cooperation countries. Environ. Sci. Pollut. Res. 2021, 28, 15519–15536. [Google Scholar] [CrossRef] [Scilit]

Disclaimer/Publisher’s Note: The statements, opinions and data contained in all publications are solely those of the individual author(s) and contributor(s) and not of MDPI and/or the editor(s). MDPI and/or the editor(s) disclaim responsibility for any injury to people or property resulting from any ideas, methods, instructions or products referred to in the content. |
© 2026 by the author. Licensee MDPI, Basel, Switzerland. This article is an open access article distributed under the terms and conditions of the Creative Commons Attribution (CC BY) license.