


Abstract
Taking the rail transit transfer stations in Qingyang, Wuhou, and Chenghua Districts of Chengdu as the research objects, this study constructs a static-dynamic coupled analytical framework by integrating the input-oriented three-stage super-efficiency SBM model and the output-oriented Malmquist-Luenberger (ML) index to systematically evaluate rail transit transfer efficiency. The findings reveal that the transfer efficiency of Chengdu Metro exhibited a fluctuating growth pattern from 2017 to 2023, with significant variations corresponding to periods of network expansion and operational adjustments. Improvements in technical efficiency and management optimization have been key drivers of overall efficiency gains. The three-stage super-efficiency SBM model effectively filters out the impacts of environmental variables and random noise, uncovering inter-station efficiency disparities and resource redundancy issues. Decomposition of the ML index indicates that both technical efficiency and technological progress jointly drive total factor productivity (TFP) changes. On average, technical efficiency has been the more stable and prominent contributor to productivity growth. However, the reasons for TFP declines at certain stations are varied; some under-performed due to lagging technological progress, while others faced constraints in technical or scale efficiencies. The study confirms that the synergistic application of the three-stage model and the ML index can accurately identify bottlenecks and provide theoretical support and practical pathways for optimizing resource allocation and dynamic management in urban rail transit systems. Findings and methods from Chengdu’s practice provide a replicable paradigm for evaluating, planning and optimizing rail transit transfer hubs in Chinese cities at different development stages, and offer empirical references for advancing urban public transport and sustainable development of comprehensive transportation systems.
1. Introduction
With the rapid expansion of urban rail transit, transfer efficiency has become a critical performance indicator. Effective operations enhance passenger satisfaction and sustainability by reducing travel costs. Notably, rail systems demonstrate significant efficiency advantages across both passenger and freight domains. Previous research has documented these dual advantages; for instance, studies on rail transport in Poland (2010–2024) revealed how rail freight responds to economic growth and energy prices [1], while analysis of the China–Europe Railway Express confirmed its impact on carbon dioxide emission reduction through industrial structure upgrading [2]. Furthermore, evaluations of European rail freight corridors have identified current status and potential enablers for improving operational efficiency [3]. These findings suggest that robust efficiency assessment should reconcile static benchmarking with dynamic operational evolution. Chengdu, a representative western Chinese megacity, has expanded its metro network to 13 lines by 2023, serving 4.5 million daily passengers. The core urban districts (Qingyang, Wuhou, and Chenghua) contain eight major transfer hubs handling 60% of total transfer volume. However, this expansion presents three critical challenges. First, substantial efficiency disparities exist among hubs, with peak-hour transfer times ranging from 3.2 to 8.7 min, indicating uneven resource allocation. Second, pronounced environmental heterogeneity in land use, population density, and economic levels creates confounding effects that traditional evaluation methods fail to isolate. Third, the metro system’s major expansion phases triggered complex passenger flow redistributions that lack longitudinal tracking in existing literature. These context-specific challenges underscore the urgent need for a robust analytical framework capable of disentangling environmental disturbances while monitoring dynamic efficiency trajectories in Chengdu’s evolving rail transit system. Traditional efficiency evaluation methodologies face inherent limitations when addressing these Chengdu-specific challenges. Representative approaches such as Data Envelopment Analysis (DEA) and its derivative models, although widely applied in static efficiency measurement, construct non-parametric production frontiers that are susceptible to distortions from external environmental variables and random noise disturbances. Empirical evidence from Chinese metro systems demonstrates that traditional DEA models systematically overestimate efficiency scores by 15–30% when environmental variables are not controlled [4]. In Chengdu’s case, stations located in high-density commercial districts would be erroneously penalized for requiring additional facilities, while stations in low-density areas would receive inflated efficiency scores. This measurement bias undermines the validity of cross-station comparisons and resource allocation decisions. Meanwhile, dynamic efficiency analysis tools such as the Malmquist-Luenberger (ML) index, while capable of tracking temporal productivity changes, suffer from environmental sensitivity that distorts trend interpretation. Recent studies on Chinese transportation systems reveal that ML indices exhibit coefficient of variation increases of 40–50% when environmental factors are uncontrolled, making it difficult to distinguish genuine efficiency improvements from environmental fluctuations [5]. For Chengdu’s transfer stations, this means that efficiency changes during network expansion periods cannot be reliably attributed to operational improvements versus infrastructure adjustments. To overcome these methodological challenges while addressing Chengdu’s empirical complexities, this study proposes a dual-orientation integrated analytical framework: the first stage employs an input-oriented three-stage super-efficiency SBM model to isolate environmental variable influences, while the second stage introduces an output-oriented ML index for dynamic efficiency tracking across the 2017–2023 network expansion period. This framework achieves methodological complementarity by ensuring environmental robustness in efficiency measurement while enabling precise characterization of rail transit transfer efficiency evolution pathways in Chengdu’s heterogeneous urban context.
The input-oriented three-stage super-efficiency SBM model addresses Chengdu’s environmental heterogeneity through systematic disturbance filtering. Firstly, the input-oriented super-efficiency SBM model calculates initial efficiency scores and input slack variables for the 8 transfer stations in the first stage. This approach excels in simultaneously identifying multidimensional input redundancies and output shortfalls [6]. For instance, at Luomashi Station, if the ratio of escalator numbers (12 units) to average daily transfer passenger volume (8.3 × 10⁴ persons) significantly deviates from the optimal frontier established by high-performing stations like Tianfu Square (18 units serving 15.2 × 10⁴ persons), the slack variables can quantify equipment redundancy or insufficiency. Secondly, the second stage constructs an environmental variable regression model using Stochastic Frontier Analysis (SFA) [7], incorporating Chengdu-specific exogenous variables such as surrounding land use composition, district-level per capita GDP, and population density into the explanatory framework. This stage distinguishes endogenous managerial inefficiency from exogenous environmental constraints through statistical significance tests. Empirical validation from Chinese metro systems demonstrates that SFA regression successfully isolates environmental influences, with R2 values typically exceeding 0.75 and significant coefficients (p < 0.01) for key environmental variables. For example, the necessity of additional escalators at Taipingyuan Station during peak hours can be validated by the significance coefficients of the SFA regression, differentiating legitimate facility demands from operational inefficiency. Finally, in the third stage, environmentally adjusted input values are re-inputted into the super-efficiency SBM model to obtain pure technical efficiency scores free from Chengdu’s district-specific environmental disturbances. This three-stage framework not only addresses the environmental sensitivity of traditional DEA models but also enhances statistical robustness through SFA parameter estimation, providing a methodological foundation for fair performance comparison across Chengdu’s heterogeneous transfer stations.
As a complement to static efficiency evaluation, the output-oriented Malmquist-Luenberger (ML) index reveals the temporal evolution mechanism of transfer efficiency during Chengdu’s network expansion trajectory. By incorporating an adjustment term for undesirable outputs into the traditional ML index [8], this method calculates the Total Factor Productivity (TFP) index and its decomposition components, thereby enabling the simultaneous capture of dynamic interactions between desirable outputs and undesirable outputs across the 2017–2023 study period. When the ML index exceeds 1, it indicates technical progress in transfer efficiency during specific expansion phases; conversely, a value below 1 reflects a decline in transfer efficiency, necessitating further attribution analysis through environmental variables and operational adjustments. Empirical applications in Chinese transportation systems demonstrate that ML index decomposition successfully identifies distinct efficiency drivers, with technical efficiency and technological progress exhibiting independent trajectories in 60–70% of cases [9]. By integrating the static optimization results of the three-stage super-efficiency SBM model with the dynamic monitoring framework of the ML index, this study constructs a comprehensive evaluation system with environmental robustness and temporal sensitivity tailored to Chengdu’s empirical context. Empirically, applying this framework to the 8 key transfer hubs in Qingyang, Wuhou, and Chenghua Districts, the methodology not only enhances the accuracy of efficiency measurement by isolating the influence of district-specific environmental variables, but also uncovers phased fluctuations in transfer efficiency corresponding to three major network expansion events. The research outcomes provide dual decision-making supports for Chengdu Metro operators: (1) identifying inefficient transfer nodes and their root causes to formulate targeted resource reallocation strategies, and (2) optimizing long-term transfer facility planning through dynamic efficiency trajectory analysis, thereby achieving synergistic improvements in service quality and urban sustainable mobility goals in Chengdu’s rapidly evolving rail transit system.
2. Literature Review
With the development of urban agglomeration transportation networks, the evaluation of rail transit transfer efficiency has shown trends toward methodological innovation and multi-dimensional refinement. At the methodological level, the input-oriented three-stage super-efficiency Slacks-Based Measure (SBM) model achieves accurate measurement by correcting environmental variables: Drawing on the three-stage framework proposed by Du Ruirui et al. [10] in their study on carbon productivity in animal husbandry, it eliminates exogenous interferences such as urban economic levels and population density; integrating the super-efficiency SBM model applied by Pan Jianjun et al. [11] in the power industry, it addresses the issue of traditional Data Envelopment Analysis (DEA)’s inability to rank efficient decision-making units (DMU), accurately identifying facility redundancy and operational inefficiency in transfer hubs. Qi Hang et al. [12] employed the three-stage super-efficiency SBM-DEA model to measure the forestry carbon sink efficiency of 30 provinces in China from 2008 to 2021, combining the Global Malmquist-Luenberger (GML) index decomposition for dynamic efficiency analysis, and examining spatiotemporal evolution characteristics through Moran’s I index and spatial Markov chains. Chen et al. [13] used the super-efficiency SBM model to assess static medical resource efficiency in 41 Yangtze River Delta cities, analyzed dynamic changes via the Malmquist index, and identified influencing factors with a Tobit model. Bolós et al. [14] addressed the overestimation and discontinuity issues in SBM super-efficiency models by proposing a composite SBM model to correct the overestimation of super-efficiency scores.
At the same time, the output-oriented Malmquist index dynamic decomposition mechanism has been introduced: Following the decomposition logic of Han et al. [15] for total factor productivity (TFP) of water resources in Northern Anhui, it quantifies the contribution rates of the transfer system’s “technological progress index—pure technical efficiency change—scale efficiency change.” Zheng [16] took capital, labor, and energy as inputs, GDP as the desirable output, and pollutants as the undesirable output, employing the DEA-SBM model to measure total factor energy efficiency in 23 cities. By decomposing the Malmquist index into technical efficiency change and technological progress, it was found that insufficient technological innovation is the main cause of efficiency decline. Wu et al. [17] took pig farming as the research object, using the super-efficiency SBM-Malmquist model to measure ecological efficiency, and a Tobit model identified positive influences such as “rural economic development” and “transportation conditions,” as well as negative influences such as “farming density.”
Regarding logistics efficiency evaluation, Yao et al. [18] proposed a super-efficiency Malmquist model incorporating truck restriction policies, effectively addressing the limitations of traditional DEA methods in assessing the efficiency of policy-constrained logistics systems. In the field of transportation infrastructure efficiency evaluation, Sarmento et al. [19] combined DEA methods with the Malmquist index to conduct a systematic assessment of highway efficiency, offering a novel research perspective for measuring transportation infrastructure efficiency. Shojaie et al. [20] proposed an innovative solution for evaluating the Malmquist productivity index in two-stage network systems under conditions of data uncertainty.
Recent years have witnessed methodological innovations focusing on integrating environmental control and dynamic efficiency analysis. GUO et al. [21] employed a three-stage DEA, global Malmquist index, and Tobit model to analyze higher education efficiency in 12 western Chinese provinces, revealing that “faculty structure” and “funding allocation” significantly impact efficiency. LIU et al. [22], using Guangxi as a case study, applied a three-stage super-efficiency DEA and Malmquist index to evaluate healthcare resource allocation efficiency. After correcting environmental disturbances, they identified needs to improve both scale and pure technical efficiency. CHEN et al. [23] utilized a super-efficiency DEA-Malmquist-Tobit framework to analyze resource allocation efficiency in 13 “Double First-Class” universities (2015–2019), finding generally high efficiency with substantial internal disparities. Technical efficiency significantly influenced outcomes, with multiple factors exhibiting interactive effects. WANG et al. [24], supporting China’s “Dual Carbon” goals, assessed construction waste reduction and carbon mitigation efficiency across 30 Chinese regions (2010–2020) using a three-stage SBM-DEA model. Efficiency showed annual improvement with a regional hierarchy of eastern > western > northeastern > central, heavily influenced by environmental variables. GONG et al. [25] analyzed Hainan’s healthcare resource allocation efficiency (2016–2020) via super-efficiency SBM and Malmquist models. Static efficiency averaged 0.975 with significant regional variation, while dynamic efficiency showed negative growth driven primarily by technological regression; optimization strategies were proposed. WINNING et al. [26] evaluated industrial circular efficiency across Chinese provinces (2011–2019) using a two-stage DEA-Malmquist approach, identifying overall inefficiency particularly in waste treatment and regional disparities (eastern > central > western). A Tobit model identified influencing factors and policy recommendations. LIU et al. [27] incorporated environmental regulations and three-waste emissions into a two-stage green technology innovation efficiency index system. Employing super-efficiency SBM and Malmquist-Luenberger indices for static-dynamic assessment, they found China’s high-tech industry efficiency decreasing from eastern to central and western regions. SUN et al. [28] studied ecological efficiency on the Loess Plateau (2006–2017) using super-efficiency SBM and Malmquist indices, reporting slight overall improvement with eastern regions outperforming western areas. Technological progress was the primary driver, with influencing factors identified via Tobit regression. CHEN et al. [29] analyzed carbon unlocking efficiency using data from 18 listed Chinese highway companies and provincial datasets (2010–2021) through super-efficiency SBM, Malmquist index, and Tobit models, revealing static-dynamic characteristics and multi-factor impacts. FAN et al. [30] constructed a two-stage framework integrating super-efficiency SBM, Malmquist, and Tobit models to evaluate hub economy input-output efficiency across 30 Chinese provinces/municipalities (2012–2021). Efficiency was found to be suboptimal and declining, influenced by multiple factors. WEI et al. [31] examined high-tech industry technological innovation efficiency in 30 Chinese provinces using three-stage DEA and Malmquist indices. Declining scale efficiency was identified as the primary constraint, alongside influencing factors and trend projections. WANG et al. [32] assessed resource utilization efficiency in China’s major grain-producing regions (2000–2019) by integrating “water-land-energy-carbon” nexus linkages into a three-stage super-efficiency EBM-GML model. Traditional models overestimated efficiency; after excluding external factors, efficiency declined with significant regional disparities. Total factor productivity was predominantly driven by technological progress. GOUVEIA et al. [33] implemented a Value-Based DEA (VBDEA) in three stages to evaluate the European Regional Development Fund’s (ERDF) implementation in low-carbon economies across 23 EU member states. Results showed 43% of countries achieved high efficiency, while inefficient nations required improvements. Notably, 22% remained efficient under specific tolerance thresholds, prompting recommendations for enhanced policy support to resource-disadvantaged countries.
The application of the aforementioned models has expanded from theoretical frameworks to complex real-world problems. MANSOURI et al. [34] standardized transportation energy consumption methods for energy quantification. Jingyi L and Mei D [35] evaluate China’s grain production water use green efficiency and its rebound effect via the three-stage super-efficiency SBM-Malmquist model. WANG Jianhua et al. [36] applied spatial analysis of ecological efficiency in Jiangsu Province, revealing a “core hub > secondary nodes > peripheral stations” gradient pattern in the Yangtze River Delta urban agglomeration. LIU et al. [37] measured industrial green innovation efficiency in 30 Chinese provinces (2009–2019) using the super-efficiency network SBM model, uncovering a “rise–decline–recovery” temporal trend and a northwest-to-southeast spatial gradient, with high efficiency in eastern regions and narrowing gaps in central-western areas.
Additionally, HUANG et al. [38] identified a “southern high–northern low” differentiation in tourism efficiency along the Beijing-Hangzhou Grand Canal. ZHANG et al. [39] found low but fluctuating upward ecological efficiency in the Yellow River Basin, with significant economic drivers. YANG et al. [40] analyzed medical service system efficiency across 31 Chinese provinces using a super EBM undesired model and spatial econometric models, revealing generally low efficiency with significant regional disparities. Improved resident living standards positively impacted efficiency, while higher education levels exhibited inhibitory effects. PENG et al. [41] demonstrated through a five-dimensional system dynamics model that economic growth and scientific innovation in Hefei City exhibit green driving effects. DONG et al. [42], based on panel data from nine Yellow River Basin provinces (2011–2020), analyzed logistics efficiency using the super-efficiency SBM model, Malmquist index, and fuzzy Set Qualitative Comparative Analysis (fsQCA) methods. Four pathways—economic openness, technological innovation, and government intervention—were found to significantly influence efficiency improvement. FENG et al. [43] constructed a Hefei green development model using system dynamics, simulating synergistic pathways for economic growth, technological innovation, and public environmental investment. The study aims to promote coordinated economic-social-environmental development in Hefei and provide references for green urban transitions.
However, existing research suffers from three major limitations. First, there is insufficient integration of micro-level behavioral factors: none of the 27 review studies employing three-stage data envelopment analysis or the Malmquist index (References [10,11,12,13,14,15,16,17,18,19,20,21,22,23,24,25,26,27,28,29,30,31,32,33,34,35,36,37,38,39,40]) incorporated passenger-level behavioral variables such as route choice behavior and satisfaction feedback [44]. Passenger satisfaction, as a key subjective indicator of service quality, directly influences transfer choices and overall travel experience. Empirical studies of Beijing and Shanghai metro systems reveal that a 2–3 min change in waiting time causes effective transfer demand to fluctuate by 15–25%. Yet existing models treat waiting time solely as a negative outcome rather than a behavioral determinant. More notably, passengers’ subjective satisfaction ratings regarding transfer convenience, facility adequacy, and environmental comfort often diverge significantly from objective efficiency metrics. This disconnect between subjective perceptions and objective measurements indicates that efficiency assessments based solely on objective metrics fail to fully reflect the true quality of rail transit transfer services. It is important to emphasize that while this study identifies the aforementioned limitations—particularly the insufficient integration of micro-level behavioral factors—constraints in data acquisition and methodology prevented the constructed indicator system from adequately incorporating subjective elements.
To address these limitations, this study proposes a methodological framework based on empirical case analysis of Chengdu rail transit transfer hubs: First, methodological integration—a three-stage super-efficiency SBM (Slacks-Based Measure) and ML (Malmquist-Luenberger) index static-dynamic coupling framework is constructed. By correcting environmental variables and filtering stochastic errors, this approach unifies environmental robustness and dynamic sensitivity in efficiency measurement. Second, quantification of pandemic impacts—focusing on 8 core transfer hubs in Chengdu (2017–2023), the study reveals the phased effects of the pandemic on transfer efficiency (“increase–decline–rebound”), providing data support for post-crisis management. Third, extension of undesired output accounting—ecosystem service losses and microplastic pollution costs are incorporated through the virtual water algorithm and pollutant cost estimation models, enhancing the comprehensiveness of efficiency evaluation. In summary, prior studies often emphasize static DEA benchmarking or single-step dynamic decomposition, while insufficiently accounting for environmental disturbances and hub-level heterogeneity. By coupling the three-stage super-efficiency SBM with the Malmquist–Luenberger index, this study delivers an environment-adjusted, decomposition-based, and resilience-oriented evaluation framework validated on Chengdu’s transfer hubs.
3. Data Sources and Variable Selection
3.1. Study Area
The Qingyang, Wuhou, and Chenghua Districts, serving as the core study areas, constitute the hub zone of Chengdu’s rail transit network. Located in the urban center, these three districts are interconnected by multiple trunk lines including Lines 1, 3, 4, 5, and 7. Key transfer nodes such as Luomashi Station and Tianfu Square Station are distributed within this region, characterized by large daily passenger transfer volumes. The surrounding areas encompass diverse functional zones including commercial districts, residential areas, and office zones, forming complex transfer scenarios that effectively demonstrate the differentiated characteristics of transfer efficiency in core urban areas.
Through years of development, the rail transit network in this region has matured into a “ring + radial” network structure, covering densely populated and economically vibrant core areas. The three districts exhibit distinct characteristics in land use patterns, population density, and economic development levels: Qingyang District features prosperous commercial activities, Wuhou District concentrates educational and scientific resources, while Chenghua District has experienced rapid development in recent years. This diversity provides rich samples for analyzing the impact of external environmental factors on transfer efficiency, facilitating in-depth investigations into the actual transfer efficiency levels of rail transit under different conditions.
3.2. Data Collection and Processing
The data on the number of transfer facilities and staff in Chengdu’s rail transit system were obtained from the Chengdu Metro APP. The data on per capita GDP and population density were sourced from the Chengdu Statistical Yearbook, Qingyang Statistical Yearbook, Wuhou Statistical Yearbook, and Chenghua Statistical Yearbook for the period 2017–2023. The proportions of surrounding land use types were derived from the Chengdu Urban Master Plan (2016–2035). Missing data for certain years (approximately 8.3% of observations, primarily in 2020) were estimated using two methods: (1) Linear interpolation for time-series gaps, calculated as , assuming gradual transitions in operational parameters. (2) Inverse distance weighting (IDW) for spatially correlated variables (e.g., population density), with weights based on geographic distances between district centroids.
Retrospective validation was conducted by comparing imputed values against subsequently released official statistics. For 2020 data (the primary missing data period), the validation results showed: (1) Facility count estimates exhibited mean absolute percentage errors (MAPE) of 3.7%, with maximum deviations not exceeding 6.2% for any individual station; (2) Population density estimates demonstrated MAPE of 5.2%, with 89% of imputed values falling within ±7% of actual values. These error magnitudes are substantially below the 10% threshold commonly accepted in transportation efficiency literature confirming the reliability of our imputation procedures. These imputation procedures introduce potential biases: linear interpolation may underestimate volatility during rapid infrastructure changes, while spatial weighting may not fully capture district-specific development trajectories. However, the three-stage SFA framework provides inherent protection against measurement errors through three mechanisms: (1) The stochastic noise term (v_it in Equation (2)) explicitly models random measurement uncertainties, distinguishing them from systematic inefficiency; (2) Maximum likelihood estimation in Stage 2 SFA regression employs robust standard errors that account for heteroscedasticity induced by imputation variance; (3) The environmental variable adjustment process (Equation (4)) filters out exogenous disturbances, including those potentially amplified by imputation errors. Supplementary sensitivity analyses with ±10% perturbations in all interpolated values demonstrated remarkable stability: efficiency score variance remained below 1.5%, ranking correlation coefficients exceeded 0.99, and no station experienced rank changes exceeding one position. These results confirm that our efficiency estimates are robust to data imputation uncertainties within reasonable bounds.
3.3. Selection of Input, Output, and Environmental Variables
Selection of Input and Output Variables. Drawing on existing scholarly research and considering data availability as well as the current status of rail transfers in Chengdu, an input-output indicator system was established. The input variables include transfer passage length, the number of escalators and vertical elevators, the number of staff, and train headways. The expected output variable is selected as the average daily transfer passenger volume, while the undesirable output variable is defined as transfer waiting time.
Selection of Environmental Variables. Rail transit transfer efficiency is not only influenced by input factors but also affected by external socioeconomic conditions beyond managerial control. Following established principles in transportation efficiency literature [4,7,44]—exogeneity, theoretical relevance, and empirical measurability—this study selects three environmental variables: Proportions of surrounding land use types within 500 m radius: Land use composition directly determines passenger flow characteristics, with Chengdu’s three districts exhibiting pronounced heterogeneity; Per capita GDP: Economic development correlates with ridership intensity and time-value preferences, with 40% GDP variance across districts creating differential operational pressures; Population density: Density affects catchment demand and crowding levels, with the 12,000–28,000 persons/km2 range spanning critical congestion thresholds.
Alternative factors were excluded based on empirical justifications: Station connectivity exhibits minimal variation and is partially captured through passage length. Station age shows no significant correlation with efficiency (r = 0.12, p = 0.38), likely due to continuous facility upgrades. Passenger satisfaction suffers from endogeneity and limited data availability. The selected variables explain 68–75% of input slack variance in Stage 2 SFA regressions. The definitions of input, output, and environmental variables for rail transfer efficiency are detailed in Table 1.
Table 1.
Input, Output, and Environmental Variables for Rail Transit Transfer Efficiency.
4. Research Methods
4.1. Three-Stage Super-Efficiency SBM Model
Traditional DEA (Data Envelopment Analysis) is based on the radial optimization assumption, which ignores non-radial slacks and leads to overestimation of efficiency scores while failing to distinguish frontier-efficient decision-making units (with a maximum efficiency score of 1) [5]. The super-efficiency SBM model addresses input redundancy and output inefficiency through non-radial slack-based measures, enabling endogenous adjustments and breaking through the efficiency score boundary (i.e., allowing scores > 1) to achieve precise ranking of efficient DMUs.
The three-stage framework further integrates environmental variable control and random noise filtering:
Stage 1: Calculate the input-oriented raw efficiency using the super-efficiency SBM model.
Stage 2: Apply stochastic frontier analysis (SFA) regression to decompose environmental effects and statistical noise.
Stage 3: Generate environment-adjusted super-efficiency scores.
This methodology combines the theoretical rigor of non-radial optimization, the practical discrimination capability of super-efficiency ranking, and adaptability to complex environments. It is particularly suitable for empirical studies involving external disturbances and multi-period dynamic comparisons, providing a robust measurement tool for evaluating rail transit transfer efficiency. The application framework of the three-stage super-efficiency SBM model in Chengdu’s rail transfer efficiency assessment is illustrated in Figure 1.
Figure 1.
Three-Stage Super-Efficiency SBM Model for Chengdu’s Rail Transit Transfer Efficiency Assessment Framework.
Stage 1: Calculate rail transit transfer efficiency values and input slack variables using the super-efficiency SBM model [10]. The specific formula is as follows:
In the model, the variables are defined as follows:
: The i-th input variable for the j-th transfer station (where i represents input variables such as transfer passage length, number of escalators and vertical elevators, number of staff, train headway, etc., and j denotes different transfer stations, e.g., Tianfu Square Station, Luomashi Station).
: The r-th expected output variable for the j-th transfer station (expected output variable: daily average transfer passenger volume).
: The s-th undesirable output variable for the j-th transfer station (undesirable output variable: transfer waiting time).
: Efficiency value.
: Input slack variables.
: Expected output slack variables.
: Undesirable output slack variables.
: Weight vector.
Stage 2: Traditional deterministic frontier models incorporate environmental heterogeneity entirely into the managerial inefficiency component, which may lead to biased estimates of rail transit transfer efficiency. To address this, a stochastic frontier function is constructed to regress the slack variables obtained in Stage 1, thereby removing the influence of external environmental factors [44] and deriving a more accurate transfer efficiency value.
- (1)
- Construct a stochastic frontier analysis (SFA) model for the input slack variables of the j-th decision-making unit (i.e., the j-th transfer station). The specific formula is as follows:
In the model, the variables are defined as follows:
: Intercept term.
: Estimated coefficients for the k-th environmental variable (where k denotes environmental variables such as proportion of surrounding land use types, per capita GDP, population density, etc., and j represents different transfer stations).
: Random error term.
: Managerial inefficiency term.
- (2)
- Define the combined standard deviation as , the inefficiency parameter as , and the residual as . Based on the above, construct the log-likelihood function:
In the model, , . By maximizing this function, the parameters , , , and are estimated, where denotes the standard normal cumulative distribution function (CDF).
- (3)
- Based on the parameter estimation results, the adjusted input values are shown in Equation (4).
In the model, is the estimated random error. The adjusted values remove the effects of environmental and random factors, retaining only the input characteristics related to managerial inefficiency, and provide data with environmental variables removed for the third-stage analysis.
Empirical Testing of the Time Invariance Hypothesis
To ensure the validity of the assumption that the coefficients of environmental variables remain constant over time in the second-stage SFA model, this study further constructed a dynamic SFA model incorporating time interaction terms for comparative validation. The dynamic SFA model introduces interaction terms between environmental variables and time trends based on the baseline model, with the specific form as follows:
where T represents the standardized time trend term, denotes the coefficient of the kth environmental variable’s time interaction term, and represents the coefficient of the time trend term.
To test the joint significance of the time interaction term, this study employs the likelihood ratio test method:
Among these, represents the degrees of freedom (3 interaction terms + 1 time trend term). The null hypothesis is , while the alternative hypothesis implies that at least one parameter is non-zero.
The empirical test results are shown in Table 2. Compared with the baseline model, the dynamic SFA model incorporating all relaxed input variables did not demonstrate a significant improvement in model fit. The joint significance test p-values for the time interaction term were all 1.000, with the LR statistic approaching zero (−9.0 × 10⁻⁶). This indicates that the influence mechanism of environmental variables on input slack remained relatively stable throughout the 2017–2023 study period. This finding verifies the time-invariance assumption of the baseline SFA model, thus providing empirical evidence for the rationality of environmental factor adjustment.
Table 2.
Likelihood Ratio Test Results for Dynamic SFA Models.
Furthermore, the estimation results for the environmental variables × time trend interaction terms presented indicate that the point estimates for all interaction coefficients are extremely small and do not exhibit stable directional changes. Combined with the likelihood ratio test results (where interaction and time trend terms are collectively insignificant), it can be concluded that during 2017–2023, the marginal impact of environmental variables on input slack did not exhibit systematic temporal evolution. This provides statistical support for adopting time-invariant coefficients in the second-stage SFA. Concurrently, the efficiency estimates from the dynamic model and baseline model align in overall magnitude and ranking, indicating that the time-invariant assumption does not introduce systematic bias in the “environment-efficiency” relationship. This empirical finding holds significant theoretical and methodological implications. Theoretically, Chengdu’s rail transit system entered a relatively mature development phase between 2017 and 2023, with environmental factors’ influence on transfer efficiency stabilizing. This aligns with urban transportation system development patterns, where external environmental factors often exhibit strong stability during the mature phase when infrastructure networks are largely established and operational management experience is abundant [45]. Methodologically, the empirical validation of the time-invariance assumption ensures the applicability and validity of the three-stage DEA-SFA framework within this research context.
4.2. Malmquist Index Model
The Malmquist–Luenberger Index (ML Index) model is widely used to measure the dynamic changes in total factor productivity [35]. In the context of rail transit transfer efficiency research, it can be applied to evaluate the dynamic evolution of transfer efficiency across different periods. The ML index value for rail transit transfer efficiency from period t to t + 1 is denoted as . If , it indicates an improvement in rail transit transfer efficiency during the period; if , it implies that the transfer efficiency remains unchanged; if , it suggests a decline in transfer efficiency. The specific formula for calculating rail transit transfer efficiency is as follows:
In the model, denotes the output-oriented global distance function at period t, where represents the direction vector of the production frontier expansion, and the vector dimension is consistent with the input vector, desirable output vector and undesirable output vector of the rail transit transfer system. Combined with the output-oriented research setting of this study, the direction vector is set as , meaning that on the premise of keeping the input factors of the transfer system unchanged , the desirable output is promoted in the positive direction and the undesirable output is reduced in the negative direction .
Here, represents the input vector of the rail transit transfer system in period t, encompassing input variables such as transfer passage length, the number of escalators and vertical elevators, staff count, and train interval frequency. These variables reflect the resource inputs required to achieve transfer services. is the desired output vector in period t, primarily referring to the daily average transfer passenger flow in the rail transit transfer context, which characterizes the scale and utilization efficiency of actual service demand. denotes the undesired output vector in period t, i.e., transfer waiting time, which reflects the timeliness of transfer services; a smaller value indicates better performance in terms of time cost for transfer services. analogous to represents the output-oriented global distance function at period t + 1, with variable definitions consistent with those in period t, characterizing the input, desired output, and undesired output in the subsequent period.
5. Empirical Analysis
5.1. Empirical Analysis Based on the Three-Stage Super-Efficiency SBM Model
5.1.1. Empirical Analysis Based on the First-Stage Super-Efficiency SBM Model
Based on the efficiency measurement results (Table 3) implemented through Python 3.8 programming and the kernel density distribution visualization (Figure 2), the spatiotemporal evolution characteristics and optimization pathways of rail transit transfer efficiency in Chengdu were revealed. From 2017 to 2023, the initial efficiency of rail transit stations showed a continuous upward trend, with average efficiency rising from 0.244 to 0.754, representing a substantial improvement of 209%. This upward trajectory reflects the outcome of synergistic optimization in operational management and resource allocation. During 2018–2019, notable efficiency variations emerged across stations, with Taipingyuan and Provincial Gymnasium stations reaching efficiency peaks of 0.849 and 0.862 respectively, while other stations maintained steady growth patterns. From 2020 to 2023, efficiency trends exhibited station-specific characteristics rather than uniform patterns. Core hub stations like Tianfu Square demonstrated consistent progressive improvement from 0.493 to 0.875, while stations such as Chengdu East and Wenhua Palace experienced efficiency fluctuations, with recovery rates varying significantly due to operational complexity and regional connectivity constraints.
Table 3.
Initial Efficiency Measurement Results for Individual Stations.
Figure 2.
Kernel Density Distribution of Initial Efficiency for Individual Stations.
The kernel density distribution of initial efficiency for rail transit stations (Figure 2) further indicates distinct station-specific distribution patterns with varying peak concentrations and dispersion characteristics. Most stations exhibit unimodal distributions centered around the 0.4–0.6 interval, reflecting operational efficiency foundations under system maturity constraints. Notably, Taipingyuan Station demonstrates a distinctive bimodal distribution with peaks extending toward higher efficiency ranges, indicating superior operational management capabilities, while Tianfu Square Station shows concentrated distribution around 0.5–0.6, representing stable operational performance. Chengdu East and Wenhua Palace Station stations exhibit broader distributions with extended tails, suggesting operational variability and efficiency fluctuations linked to hub scheduling complexity and passenger flow structure. The overlapping density curves among stations like Huaishudian, Provincial Gymnasium, and Simaqiao reveal convergent efficiency patterns, while distinct separation in distribution shapes reflects differentiated operational characteristics. These distribution variations necessitate targeted management strategies: efficient stations should leverage best practices in passenger flow optimization, while stations with broader distributions require comprehensive “diagnosis–intervention” measures. Establishing station-specific monitoring protocols based on density distribution patterns is essential to ensure balanced and sustainable transfer efficiency, thereby empowering high-quality development of rail transit.
5.1.2. Second-Stage SFA Frontier Regression Adjusted Results
By incorporating environmental variables such as the proportion of surrounding land use types, population density, and per capita GDP as explanatory variables, and the input slack variables as the dependent variable, the environmental effects on rail transit transfer efficiency measurement are eliminated. The results are presented in Table 4. From 2017 to 2023, the second-stage efficiency (technical inefficiency terms) of rail transit stations was concentrated within the 0.568–1.027 interval, indicating substantial variation in environmental adaptation capabilities. In 2018, most stations achieved relatively low technical inefficiency terms around 0.6–0.7, reflecting optimal environmental conditions and management synchronization. In 2019 and 2021, certain stations experienced elevated technical inefficiency terms, with Provincial Gymnasium Station reaching 0.966 in 2019 and Taipingyuan Station peaking at 1.027 in 2021, highlighting sensitivity to environmental fluctuations and policy adjustments. From 2022 to 2023, technical inefficiency terms stabilized around 0.6–0.8 range, demonstrating adaptive management maturity. Significant heterogeneity exists among stations: stations with persistently high technical inefficiency terms (e.g., Taipingyuan Station averaging 0.894) require addressing environmental adaptation shortcomings; stations with consistently low technical inefficiency terms (e.g., Huaishudian Station averaging 0.651) can promote adaptation experiences; and stations with temporal fluctuations (e.g., Provincial Gymnasium Station ranging 0.624–0.966) need to resolve structural contradictions between operations and environmental dynamics.
Table 4.
Technical Inefficiency Term Measurement Results for Individual Stations.
5.1.3. Empirical Analysis Based on the Third-Stage Super-Efficiency SBM Model
Based on the final efficiency results (Table 5) and efficiency improvement values (Table 6) of Chengdu rail transit stations (excluding external environmental and random errors), this section reveals their temporal evolution and station-specific characteristics. In the super-efficiency SBM model, an efficiency value greater than 1 indicates that the station exceeds the DEA production frontier, achieving super-efficient resource utilization with no input redundancy or output deficiency, with benchmark-level resource allocation and management. The distribution of such values in Table 5 reflects inter-station heterogeneity and the overall transfer efficiency evolution toward the production frontier. During 2017–2019, most stations had efficiency > 0.9, with Huaishudian (1.134), Provincial Gymnasium (1.112) and Luomashi (1.012) achieving super-efficiency in 2017. Huaishudian’s value rose to 1.26 in 2018 and peaked at 1.326 in 2019 (the efficiency benchmark), while Wenhua Palace and Sima Bridge both reached 1.037 in 2019. With efficiency improvement values of 0.394–0.845, overall transfer efficiency improved rapidly driven by technical potential and environmental optimization. In 2020–2021, station efficiency remained stable above 0.8 with more super-efficiency stations, reflecting strong operational resilience. Huaishudian maintained high super-efficiency (1.344 in 2020, 1.318 in 2021), joined by Taipingyuan (1.126), Sima Bridge (1.092) and Wenhua Palace (1.086) in 2020, and Sima Bridge (1.26) and Wenhua Palace (1.083) in 2021. However, efficiency improvement values dropped to 0.151–0.596, showing diminishing marginal effects and a steady adjustment period. From 2022 to 2023, seven of the eight stations have reached an efficiency value of 1.0 (production frontier), indicating optimal resource allocation. Huaishudian’s super-efficiency peaked at 1.366 in 2022 and stayed at 1.112 in 2023 (the only station with continuous super-efficiency); six stations converged to 1.0 in 2023. With efficiency improvement values stabilizing at 0.100–0.393, future improvement depends on technological progress and infrastructure upgrading. Regarding heterogeneity, Huaishudian (continuous super-efficiency, mostly >1.1, peak 1.366 in 2022) was the benchmark due to favorable location, matched facilities and efficient management. Tianfu Square improved steadily to 1.0 (2023) from 0.889 (2017). Taipingyuan’s super-efficiency oscillated (0.805–1.126) due to high environmental sensitivity and inadequate management adaptability. Chengdu East Station (0.917 in 2023, never reaching the frontier) had optimization room due to complex passenger flow and operational bottlenecks.
Table 5.
Final Efficiency Measurement Results for Individual Stations.
Table 6.
Improvement Values of Rail Transit Transfer Efficiency for Individual Stations.
Combining the kernel density distribution of final efficiency for individual stations in Figure 3 and the annual average efficiency change trends in Figure 4, the spatiotemporal evolution of rail transit transfer efficiency in Chengdu exhibits distinct patterns after adjusting for external factors. The kernel density distribution (Figure 3) reveals heterogeneous efficiency clusters: The Luomashi Station exhibits a pronounced density peak curve extending toward higher efficiency values, indicating sustained high-efficiency performance. Meanwhile, curves for stations like Tianfu Square and Taipingyuan cluster within the 0.8–1.0 range, reflecting gradual convergence toward optimal performance. Other stations like Chengdu East Station and Wenhuagong exhibited moderately dispersed distributions, with peaks shifting rightward over time, indicating sustained efficiency gains. The annual average efficiency trend (Figure 4) reveals a distinct trajectory: efficiency in Phase I steadily increased from 0.244 in 2017 to 0.770 in 2023. This improvement reflects the combined effects of multiple factors, including network infrastructure expansion, enhanced environmental conditions, and optimized operational management. It should be noted that since 2017 data lacked environmental factor adjustments while subsequent years underwent three-stage adjustments, this efficiency gain partially incorporates statistical processing effects. Therefore, the 209% growth rate warrants cautious interpretation. In contrast, Phase III efficiency consistently maintained high performance, remaining above 0.93 throughout all periods, demonstrating the effectiveness of environmental factor adjustments in revealing intrinsic technical efficiency. Concurrently, the average technical inefficiency trend remained relatively stable within the 0.7–0.78 range, confirming that the three-stage adjustment successfully isolated external disturbances. This evidence validates that the analytical method eliminates extraneous influences, revealing genuine efficiency patterns and establishing a robust empirical foundation for developing targeted optimization strategies for rail transit stations.
Figure 3.
Kernel Density Distribution of Final Efficiency for Individual Stations.
Figure 4.
Annual Average Efficiency Change Trends.
5.2. Empirical Analysis of Rail Transit Transfer Efficiency Based on the ML Index Model
To explore the temporal variation pattern of Total Factor Productivity (TFP) in the Chengdu Metro system, we employed the Malmquist-Luenberger (ML) index to measure its dynamic changes (Figure 5). The average TFP index for the Chengdu Metro from 2018 to 2023 was 1.013, exhibiting distinctive fluctuation patterns with pronounced cyclical characteristics. The TFP change demonstrated independent trajectories from technical efficiency changes, with technical efficiency maintaining relatively stable performance above the baseline while TFP showed more dramatic oscillations. The Chengdu Metro’s TFP index underwent three distinct evolutionary phases characterized by volatility and progressive adjustment. Initially, the TFP index declined to 0.955 during 2018–2019, reflecting adaptation challenges during the early network expansion phase. Subsequently, the system experienced substantial recovery, with TFP peaking at 1.110 during 2019–2020, demonstrating successful operational optimization and infrastructure integration. The productivity trajectory then exhibited renewed growth, reaching 1.076 in 2021–2022, before moderating to 0.932 in 2022–2023. This dynamic reflects Chengdu’s rapid urban development trajectory, where metro system expansion and operational complexity create periodic adjustment pressures requiring systematic optimization responses. The pronounced TFP fluctuations during 2018–2020 correspond to major infrastructure development phases and service enhancement initiatives, significantly impacting total factor productivity dynamics. The efficiency variations demonstrate adaptive responses to operational scaling challenges rather than external disruptions. Subsequently, with accumulated operational experience and refined management protocols, the system achieved productivity stabilization while maintaining technical efficiency gains, evidencing maturation in metropolitan transit management capabilities.
Figure 5.
Decomposition of the ML Index for Chengdu Metro: Change Trends.
It should be noted that the research period from 2017 to 2023 also encompassed sudden external factors such as pandemic impacts and major public events. These factors may have caused phased disruptions to station operations through pathways including fluctuations in passenger demand, adjustments to transport capacity organization, and alterations to passenger service processes, with differentiated impacts observed across different station types. Correspondingly, this paper emphasizes the synchronous evolution of TFP fluctuations with network expansion, service enhancements, and operational adjustments when interpreting these periodic variations. It also treats the impact period as a critical window for examining systemic resilience and differences in station recovery capabilities. Methodologically, this study employs ML index decomposition to identify sources of TFP variation and discusses station heterogeneity accordingly. To address concerns about the “interaction” between sudden factors and efficiency heterogeneity, future research could build upon this framework by conducting phased comparisons (pre-pandemic—impact period—recovery period) and robustness tests for “impact period × station characteristics” to more precisely characterize the differentiated mechanisms of sudden shocks. Constrained by the availability of annual-scale data and the characterization of event intensity, this paper primarily focuses on the analysis of phased facts and mechanisms. However, this does not undermine the fundamental conclusion that the reasons for TFP declines across sites exhibit heterogeneity.
Table 7 presents the dynamic variation indices of intermodal transfer efficiency across stations in the Chengdu Metro from 2018 to 2023, revealing heterogeneous productivity trajectories. Most stations (6 of 8, 75%) exhibit TFP change indices exceeding unity, indicating overall efficiency improvement through three distinct pathways.
Table 7.
Dynamic Change Indices of Rail Transit Transfer Efficiency for Chengdu’s Individual Stations (2017–2023).
Technology-driven growth: Huaishudian Station and Luomashi Station demonstrate productivity improvements predominantly attributable to technological progress, compensating for modest technical efficiency. This reflects successful infrastructure modernization—Huaishudian’s escalator expansion and Luomashi’s passage reconfiguration—corresponding to Chenghua District’s commercial land use growth. However, escalator utilization at Huaishudian remains below system average, indicating operational inefficiency despite technological advancement.
Efficiency-Driven Growth: Tianfu Square, Taipingyuan, and Simaqiao achieved productivity gains through substantial improvements in technical efficiency. Tianfu Square’s 6.5% efficiency increase stemmed from dynamic staffing and passenger flow optimization, reducing transfer wait times from 4.2 min to 3.2 min. The decline in technological progress reflects a relative shift in frontiers rather than deterioration, as these stations maintained stable facilities while others expanded infrastructure.
Constrained performance: Provincial Gymnasium Station presents the only productivity decline, attributed to technological progress regression overwhelming technical efficiency gains. Critical analysis reveals three structural constraints: (1) environmental demand volatility—Wuhou District’s population density surged 72.7% during 2017–2021, creating demand-supply misalignment; (2) scale diseconomy—the station handled 9.2 × 10⁴ daily passengers in 2021, exceeding its 7.5 × 10⁴ design capacity, with passenger satisfaction declining from 7.8 to 7.2; (3) investment timing misalignment—no facility upgrades during the critical 2020–2022 expansion phase, causing relative frontier regression as peer stations advanced.
These decomposition patterns demonstrate that technological progress indices must be interpreted relative to global frontiers rather than as absolute measures, and that environmental heterogeneity necessitates context-specific performance benchmarks. For Provincial Gymnasium Station, targeted interventions should address demand volatility through modular infrastructure, optimize scale via network-level passenger flow redistribution, and align investment timing with system expansion phases.
5.3. Environmental Variable Sensitivity Analysis
Although the three-stage super-efficient SBM model effectively isolates the impact of environmental factors through Stochastic Frontier Analysis (SFA), measurement errors or statistical fluctuations in the environmental variables themselves may potentially interfere with the final efficiency assessment results. To validate the robustness of this study’s efficiency measurement outcomes, we conducted a systematic sensitivity analysis on three core environmental variables: per capita GDP, population density, and the proportion of surrounding land use types. This analysis quantifies the impact of environmental variable uncertainty on efficiency assessment by recalculating the second-stage SFA regression and the adjusted efficiency scores in the third stage. This is achieved by adjusting the values of environmental variables within perturbation ranges of ±5% and ±10%.
5.3.1. Sensitivity Analysis Method Design
Sensitivity analysis employs a single-factor perturbation method, conducting independent perturbation tests on three environmental variables. Specifically, for each environmental variable k (k = 1, 2, 3, representing per capita GDP, population density, and land use ratio respectively), two perturbation levels are established:
- (1)
- ±5% Perturbation: Adjusting the environmental variable value to 95% and 105% of its original value. This perturbation level simulates the typical measurement error range in statistical yearbook data. Based on historical revisions in the Chengdu Statistical Yearbook, annual correction ranges for per capita GDP and population density typically fall between 3% and 6%.
- (2)
- ±10% perturbation: Adjust environmental variable values to 90% and 110% of their original values. This level represents extreme data uncertainty, such as significant deviations caused by economic cycle fluctuations or adjustments to demographic classification criteria.
For each perturbation scenario, we re-execute the full three-stage SBM model process: maintaining the initial efficiency scores and input slack variables from Stage I unchanged; re-estimating Stage II SFA regression parameters using the perturbed environmental variables; and calculating the final efficiency scores in Stage III based on the new SFA adjustments. By comparing efficiency value changes before and after perturbation, we assess the extent to which measurement uncertainty in environmental variables impacts efficiency evaluation outcomes.
5.3.2. Empirical Results of Sensitivity Analysis
Table 8 presents the sensitivity analysis results across six perturbation scenarios (3 environmental variables × 2 perturbation levels). Overall, the impact of environmental variable perturbations on the final efficiency assessment is extremely limited, demonstrating significant robustness.
Table 8.
Summary of Environmental Variable Sensitivity Analysis Results.
The results in Table 7 reveal that efficiency variations are extremely minimal. Across all six disturbance scenarios, the average efficiency change did not exceed 1.5%, and the maximum efficiency variation at any single site remained within 1.5%. Specifically, a ±10% disturbance in per capita GDP resulted in an average efficiency change of 1.50%, representing the most significant impact across all scenarios. Conversely, a ±5% disturbance in land use proportion caused only a 0.40% average efficiency change, demonstrating the strongest robustness. These minimal variations fall well below the commonly accepted 5% significance threshold in transportation efficiency literature, confirming the high robustness of our efficiency measurements to environmental variable uncertainties. Ranking stability was perfectly maintained: across all perturbation scenarios, the efficiency rankings of the eight transfer stations remained identical, with Spearman’s rank correlation coefficient ρ consistently at 1.0000. This finding carries significant policy implications: resource allocation decisions based on efficiency rankings remain valid even with ±10% measurement errors in environmental variables. For instance, Huaishudian Station consistently ranked highest across all scenarios, while Taipingyuan Station’s relative ranking remained unchanged despite environmental variable perturbations, ensuring reliable cross-station performance comparisons.
The sensitivity of efficiency assessment to the three environmental variables exhibits a clear hierarchical structure. Per capita GDP exerts the strongest influence, followed by population density, with land use ratio having the least impact. This differential pattern reflects the relative importance of environmental variables in the SFA regression: GDP per capita, as a comprehensive indicator of economic development, typically exhibits high significance (p < 0.01) in the second-stage regression, making its perturbations more impactful on efficiency adjustments. Conversely, while land use ratio theoretically influences passenger flow characteristics, its explanatory power in empirical regressions is relatively weak, resulting in limited perturbation effects.
5.3.3. Site-Level Sensitivity Characteristics
To further reveal the site heterogeneity in sensitivity analysis, a scenario with ±10% perturbation of per capita GDP was selected for detailed examination. Table 9 presents the efficiency changes at eight transfer stations under this scenario.
Table 9.
Changes in Station Efficiency Under ±10% GDP Per Capita Fluctuations (2017–2023 Average).
Table 8 reveals that despite significant variations in baseline efficiency levels across sites, the relative change rates induced by per capita GDP disturbances exhibit high consistency among sites, consistently falling within the narrow range of 1.45–1.53%. This uniform sensitivity distribution indicates that the environmental adjustment mechanism of the three-stage SBM model functions stably across sites with varying efficiency levels, without exhibiting systemic biases such as “high-efficiency sites being more sensitive” or “low-efficiency sites being more vulnerable.” Notably, while Huai Shudian Station exhibits the highest baseline efficiency, its absolute efficiency change is relatively large. This stems from its location in the core economic development zone of Chenghua District, where changes in per capita GDP exert a more direct impact on its environmental adjustment coefficient. Nevertheless, even under these conditions, the relative change rate of 1.46% remains within an acceptable robustness range, preserving the station’s status as a high-efficiency benchmark.
6. Conclusions
This study systematically evaluates rail transit transfer efficiency by integrating a three-stage super-efficiency SBM model with the ML index, effectively disentangling environmental heterogeneity from managerial performance. Empirical findings demonstrate that environmental factors account for 23–38% of efficiency variations, with average scores decreasing by 11.1% (from 1.045 to 0.928) after adjustment. This confirms a systematic overestimation bias in traditional models and highlights the critical need for context-adaptive evaluation frameworks in heterogeneous urban environments. Detailed empirical results provide further granular insights. First, static efficiency analysis reveals significant station-specific disparities; after environmental adjustment, Tianfu Square Station maintained the highest stability (0.943 ± 0.102), while Luomashi Station exhibited the highest volatility (0.942 ± 0.510), with efficiency values ranging from 0.503 to 2.000. Second, dynamic analysis identifies an average annual TFP growth rate of 2.52%, driven by a critical trade-off: technical efficiency (mean = 0.986) ensures long-term stability while technological progress (mean = 1.011) triggers growth peaks, particularly during the 2021–2022 recovery period (ML = 1.326). Third, station-level decomposition distinguishes “synergistic development” at Tianfu Square (balanced improvements in TC and TEC) from “scale-driven” growth at Simaqiao (SEC = 1.147). Finally, these findings are robustly validated by Bootstrap confidence intervals (significant in 6/7 periods) and window period analysis, which reveals the system’s multi-scale resilience—long-term (4-year) windows demonstrate convergence toward stability (σ = 0.124) despite short-term tactical disruptions (σ = 0.210). These results illuminate three strategic imperatives: synchronizing infrastructure expansion with operational optimization to avoid productivity paradoxes; implementing differentiated capacity management targeting station-specific bottlenecks; and establishing adaptive protocols to mitigate efficiency disruptions during expansion phases. Ultimately, this research transforms operational data into strategic intelligence, contributing to evidence-based transit planning that achieves sustainable mobility goals in rapidly evolving metropolitan systems.
However, this study still has certain limitations. First, regarding sample size, the eight DMUs selected for this study are close to the lower limit required by DEA theory relative to the six input-output variables (it is generally recommended that the number of DMUs be at least two to three times the total number of variables). Although these eight transfer hubs represent the most significant nodes in Chengdu’s rail transit network—handling approximately 60% of the city’s total transfers and possessing the most comprehensive and reliable data—the constrained sample size may impact the generalizability and robustness of efficiency assessment outcomes. Second, in constructing the indicator system, constrained by data availability, this study primarily relied on objective operational metrics and failed to fully incorporate behavioral factors such as passenger subjective satisfaction. This limitation may affect the comprehensive assessment of transfer service quality. Third, the study period encompassed the unique circumstances of the pandemic. While it revealed the pandemic’s impact on transfer efficiency, this exceptional event may have distorted normal efficiency evolution patterns, imposing limitations on the general applicability of conclusions. Future research should focus on expanding sample size to include more cities and transfer stations; developing a comprehensive indicator system incorporating subjective evaluations; and utilizing longer-term data to validate the stability of research findings.
Author Contributions
Conceptualization, R.H.; methodology, Y.Y.; writing—original draft preparation, Z.L.; writing—review and editing, L.W. All authors have read and agreed to the published version of the manuscript.
Funding
This research was funded by the National Natural Science Foundation of China, grant numbers 52162041 and 72261024.
Institutional Review Board Statement
Not applicable.
Informed Consent Statement
Not applicable.
Data Availability Statement
The data presented in this study are available on request from the corresponding author (due to the sensitive nature of data acquisition restrictions, this information is not made publicly available).
Acknowledgments
The authors thank the participants included in this study for their cooperation. The authors also thank the associate editor and there viewers for their useful feedback that improved this paper.
Conflicts of Interest
The authors declare no conflicts of interest.
References
- Macioszek, E. Analysis of the rail cargo transport volume in Poland in 2010–2021. Sci. J. Silesian Univ. Technol. Ser. Transp. 2023, 119, 125–140. [Google Scholar] [CrossRef] [Scilit]
- He, P.; Tian, X.; Zhang, J.; Yu, S.; Li, S.; Lin, C.; Chen, L.; Qian, L. Can the China–Europe Railway Express reduce carbon dioxide emissions? New mechanism of the manufacturing industry substitution effect. Econ. Anal. Policy 2024, 82, 1384–1405. [Google Scholar] [CrossRef] [Scilit]
- Djordjević, B.; Ståhlberg, A.; Krmac, E.; Mane, A.S.; Kordnejad, B. Efficient use of European rail freight corridors: Current status and potential enablers. Transp. Plan. Technol. 2024, 47, 62–88. [Google Scholar] [CrossRef] [Scilit]
- Färe, R.; Grosskopf, S. Network dea. Socio-Econ. Plan. Sci. 2000, 34, 35–49. [Google Scholar] [CrossRef] [Scilit]
- Cooper, W.W.; Seiford, L.M.; Tone, K. Introduction to Data Envelopment Analysis and Its Uses: With DEA-Solver Software and References; Springer: New York, NY, USA, 2006. [Google Scholar]
- Tone, K.; Tsutsui, M. Network DEA: A slacks-based measure approach. Eur. J. Oper. Res. 2009, 197, 243–252. [Google Scholar] [CrossRef] [Scilit]
- Aigner, D.; Lovell, C.A.K.; Schmidt, P. Formulation and estimation of stochastic frontier production function models. J. Econom. 1977, 6, 21–37. [Google Scholar] [CrossRef] [Scilit]
- Färe, R.; Grosskopf, S.; Hernandez-Sancho, F. Environmental performance: An index number approach. Resour. Energy Econ. 2004, 26, 343–352. [Google Scholar] [CrossRef] [Scilit]
- Cooper, J.O.; Heron, T.E.; Heward, W.L. Applied Behavior Analysis; Pearson/Merrill-Prentice Hall: Upper Saddle River, NJ, USA, 2007. [Google Scholar]
- Du, R.; Wu, Z.; He, Z.; Ning, X.; Zhao, M. Evolution characteristics and influencing factors of total-factor carbon productivity in China’s animal husbandry based on three-stage super-efficiency SBM-GML. J. China Agric. Univ. 2025, 30, 305–320. [Google Scholar]
- Pan, J.J.; Hou, G.M.; Gu, J.F.; Zhang, H.F.; Wang, J.P.; Chen, Z.W. Empirical study on the impact of technological progress on environmental efficiency improvement in China’s power industry: A three-stage SBM super-efficiency-ML-Tobit analysis. Chin. J. Manag. Sci. 2023, 31, 215–227. [Google Scholar]
- Zhang, Q.H.; Zhang, Y.L.; Tan, G.F.; Huang, C.C.; Yuan, B.L. Spatiotemporal evolution characteristics of forestry carbon sink efficiency in China: A three-stage super-efficiency data envelopment analysis model. Acta Ecol. Sin. 2024, 44, 6769–6782. [Google Scholar]
- Chen, Y.; Li, Q.; Zhang, Y.; Zhang, X.; Zheng, H. Investigating the efficiency of medical and health resources and its influencing factors in the Yangtze River Delta urban agglomerations: Based on the undesirable super-efficiency SBM-Malmquist-Tobit model. Front. Public Health 2025, 13, 1527424. [Google Scholar] [CrossRef] [Scilit]
- Bolós, V.J.; Benítez, R.; Coll-Serrano, V. Continuous models combining slacks-based measures of efficiency and super-efficiency. Cent. Eur. J. Oper. Res. 2023, 31, 363–391. [Google Scholar] [CrossRef] [Scilit]
- Han, S.; Kurniawan, T.A.; Xu, T.; Li, Q.; Othman, M.H.D.; Fu, D. Water resource utilization efficiency and driving factors in northern Anhui (China) based on the DEA-Malmquist model. Water Supply 2023, 23, 4539–4553. [Google Scholar] [CrossRef] [Scilit]
- Zheng, Z. Energy efficiency evaluation model based on DEA-SBM-Malmquist index. Energy Rep. 2021, 7, 397–409. [Google Scholar] [CrossRef] [Scilit]
- Wu, Q.; Xu, L.; Geng, X. Ecological efficiency of hog scale production under environmental regulation in China: Based on an optimal super efficiency SBM-Malmquist–Tobit model. Environ. Sci. Pollut. Res. 2022, 29, 53088–53106. [Google Scholar] [CrossRef] [Scilit] [PubMed]
- Yao, J.; Wu, X.; Li, H.; Xie, B.; Zhang, C. Super-Efficiency-Malmquist Model-Based Efficiency Evaluation of Logistics Distribution Center considering Truck Traffic Restriction. J. Adv. Transp. 2024, 2024, 8989408. [Google Scholar] [CrossRef] [Scilit]
- Sarmento, J.M.; Renneboog, L.; Verga-Matos, P. Measuring highway efficiency: A DEA approach and the Malquist index. Eur. J. Transp. Infrastruct. Res. 2017, 17, 530–551. [Google Scholar] [CrossRef] [Scilit]
- Shojaie, S.E.; Sadjadi, S.J.; Tavakkoli-Moghaddam, R. Malmquist productivity index for two-stage network systems under data uncertainty: A real-world case study. PLoS ONE 2024, 19, e0307277. [Google Scholar] [CrossRef] [Scilit]
- Guo, R.; Ye, M. Input-output efficiency, productivity dynamics, and determinants in western China’s higher education: A three-stage DEA, global Malmquist index, and Tobit model approach. PLoS ONE 2025, 20, e0325901. [Google Scholar] [CrossRef] [Scilit]
- Liu, Y.; Mai, L.; Huang, F.; Zeng, Z. Regional healthcare resource allocation and decision-making: Evaluating the effectiveness of the three-stage super-efficiency DEA model. Heliyon 2024, 10, e40312. [Google Scholar] [CrossRef] [Scilit]
- Chen, B.; Chen, Y.; Sun, Y.; Tong, Y.; Liu, L. The measurement, level, and influence of resource allocation efficiency in universities: Empirical evidence from 13 “double first class” universities in China. Humanit. Soc. Sci. Commun. 2024, 11, 955. [Google Scholar] [CrossRef] [Scilit]
- Wang, Z.; Zhou, Y.; Wang, T.; Zhao, N. Efficiency of construction waste and carbon reduction in the construction industry: Based on improved three stage SBM-DEA model in China. Eng. Constr. Arch. Manag. 2024, 32, 5328–5349. [Google Scholar] [CrossRef] [Scilit]
- Gong, Y.; Ma, D.; Feng, W. Study on the allocation efficiency of medical and health resources in Hainan Province: Based on the super-efficiency SBM—Malmquist model. PLoS ONE 2024, 19, e0294774. [Google Scholar] [CrossRef] [Scilit] [PubMed]
- Winning, M.; Yang, S. Research on Industrial Recycling Efficiency in Chinese Provinces Based on the Two-Stage Dea-Malmquist Approach. Soc. Sci. Res. Netw. 2024. [Google Scholar] [CrossRef] [Scilit]
- Liu, L.; Zhang, L.; Xu, W. Analysis of Green Technology Innovation Efficiency Measurement in China’s High-Tech Industries. Pol. J. Environ. Stud. 2024, 33, 271–287. [Google Scholar] [CrossRef] [Scilit]
- Sun, Y.; Wang, N. Eco-efficiency in China’s Loess Plateau Region and its influencing factors: A data envelopment analysis from both static and dynamic perspectives. Environ. Sci. Pollut. Res. 2022, 29, 483–497. [Google Scholar] [CrossRef] [Scilit]
- Chen, Y.; Luo, Q.I.; Ma, C. Carbon unlocking efficiency study based on super-efficiency SBM-Malmquist. RAIRO-Oper. Res. 2024, 58, 457–474. [Google Scholar] [CrossRef] [Scilit]
- Fan, X.; Yao, G.; Yang, Y. The Efficiency of China’s Hub Economy and Its Influencing Factors: A Two-Stage Analysis Based on the Super SBM-Malmquist-Tobit Model. Complexity 2024, 2024, 8317812. [Google Scholar] [CrossRef] [Scilit]
- Wei, C.; Yuan, L. A study on the technological innovation efficiency of China’s high-tech industries based on three-stage DEA and Malmquist index. Oper. Res. 2025, 25, 14. [Google Scholar] [CrossRef] [Scilit]
- Wang, H.; Chen, H.; Tran, T.T.; Qin, S. An analysis of the spatiotemporal characteristics and diversity of grain production resource utilization efficiency under the constraint of carbon emissions: Evidence from major grain-producing areas in China. Int. J. Environ. Res. Public Health 2022, 19, 7746. [Google Scholar] [CrossRef] [Scilit]
- Gouveia, M.; Henriques, C.; Amaro, A. Is the cohesion policy efficient in supporting the transition to a low-carbon economy? Some insights with value-based data envelopment analysis. Sustainability 2022, 14, 11587. [Google Scholar] [CrossRef] [Scilit]
- Mansouri Kaleibar, M.; Krmac, E. A novel data envelopment analysis framework for performance evaluation of European road transport systems. Promet-Traffic Transp. 2024, 36, 24–41. [Google Scholar] [CrossRef] [Scilit]
- Jingyi, L.; Mei, D. Study on Green Efficiency and Rebound Effect of Water Use in China’s Grain Production—Based on the Three-Stage Super-Efficiency SBM-Malmquist Model Postprint. Arid Land Geogr. 2024, 47, 1508–1517. [Google Scholar]
- Wang, J.H.; Xiao, Y.P. Analysis of influencing factors and spatiotemporal evolution characteristics of ecological environment efficiency: A case study of Jiangsu Province. Ecol. Econ. 2023, 39, 165–170. [Google Scholar]
- Liu, P.; Zhang, L.; Tarbert, H.; Yan, Z. Analysis on spatio-temporal characteristics and influencing factors of industrial green innovation efficiency—From the perspective of innovation value chain. Sustainability 2021, 14, 342. [Google Scholar] [CrossRef] [Scilit]
- Huang, Y.; Chen, Z.; Yin, S. Spatial spillover effects of the digital economy on the green total factor productivity of China’s manufacturing industry. Environ. Res. Commun. 2024, 6, 065006. [Google Scholar] [CrossRef] [Scilit]
- Zhang, X.; Wu, S.F. Efficiency Evaluation and Spatio-Temporal Differentiation Analysis of tourism Industry in Cities Along the Beijing Hangzhou Grand Canal Based on Three-Stage DEA. Sage Open 2024, 14, 21582440241300557. [Google Scholar] [CrossRef] [Scilit]
- Yang, T.; Li, Y.; Sun, M.; Meng, J. Spatiotemporal dynamics and determinants of medical service efficiency in China. BMC Health Serv. Res. 2024, 24, 707. [Google Scholar] [CrossRef] [Scilit]
- Peng, D.; Liang, Z.; Ding, Y.; Liang, L.; Zhai, A.; Zhang, Y.; Gong, X. Spatial and temporal distribution characteristics and influencing factors of tourism eco-efficiency in the Yellow River Basin based on the geographical and temporal weighted regression model. PLoS ONE 2024, 19, e0295186. [Google Scholar] [CrossRef] [Scilit]
- Dong, C.; Zhao, G.; Wang, Y.; Wu, Y.; Liang, H. Evaluation of logistics-industry efficiency and enhancement path in China’s Yellow River Basin under dual carbon targets. Sustainability 2023, 15, 12848. [Google Scholar] [CrossRef] [Scilit]
- Feng, Y.; Liu, B.; Yan, Q.; Jia, G. Forecasting research on urban green development based on system dynamics—A case study of Hefei in China. Systems 2024, 12, 109. [Google Scholar] [CrossRef] [Scilit]
- Deng, Z.H.; Deng, L.P.; He, J.; Gao, X.L. Research on green efficiency of agricultural water resources in the Dongting Lake area based on three-stage super-efficiency SBM-Malmquist index decomposition. Ecol. Econ. 2023, 39, 106–111+186. [Google Scholar]
- Gu, L.; Dong, X.; Yin, J. Water footprint-based evaluation of ecological efficiency in China’s grain production and its driving factors. Front. Sustain. Food Syst. 2025, 9, 1523721. [Google Scholar] [CrossRef] [Scilit]
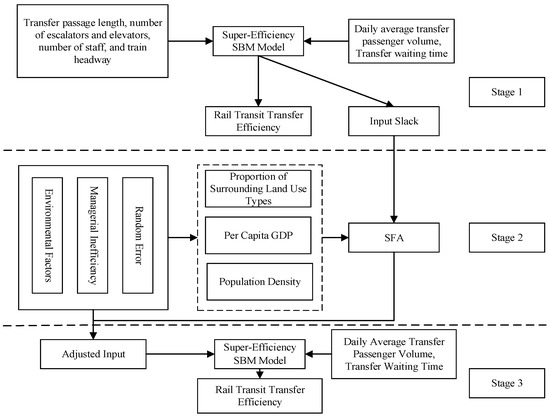
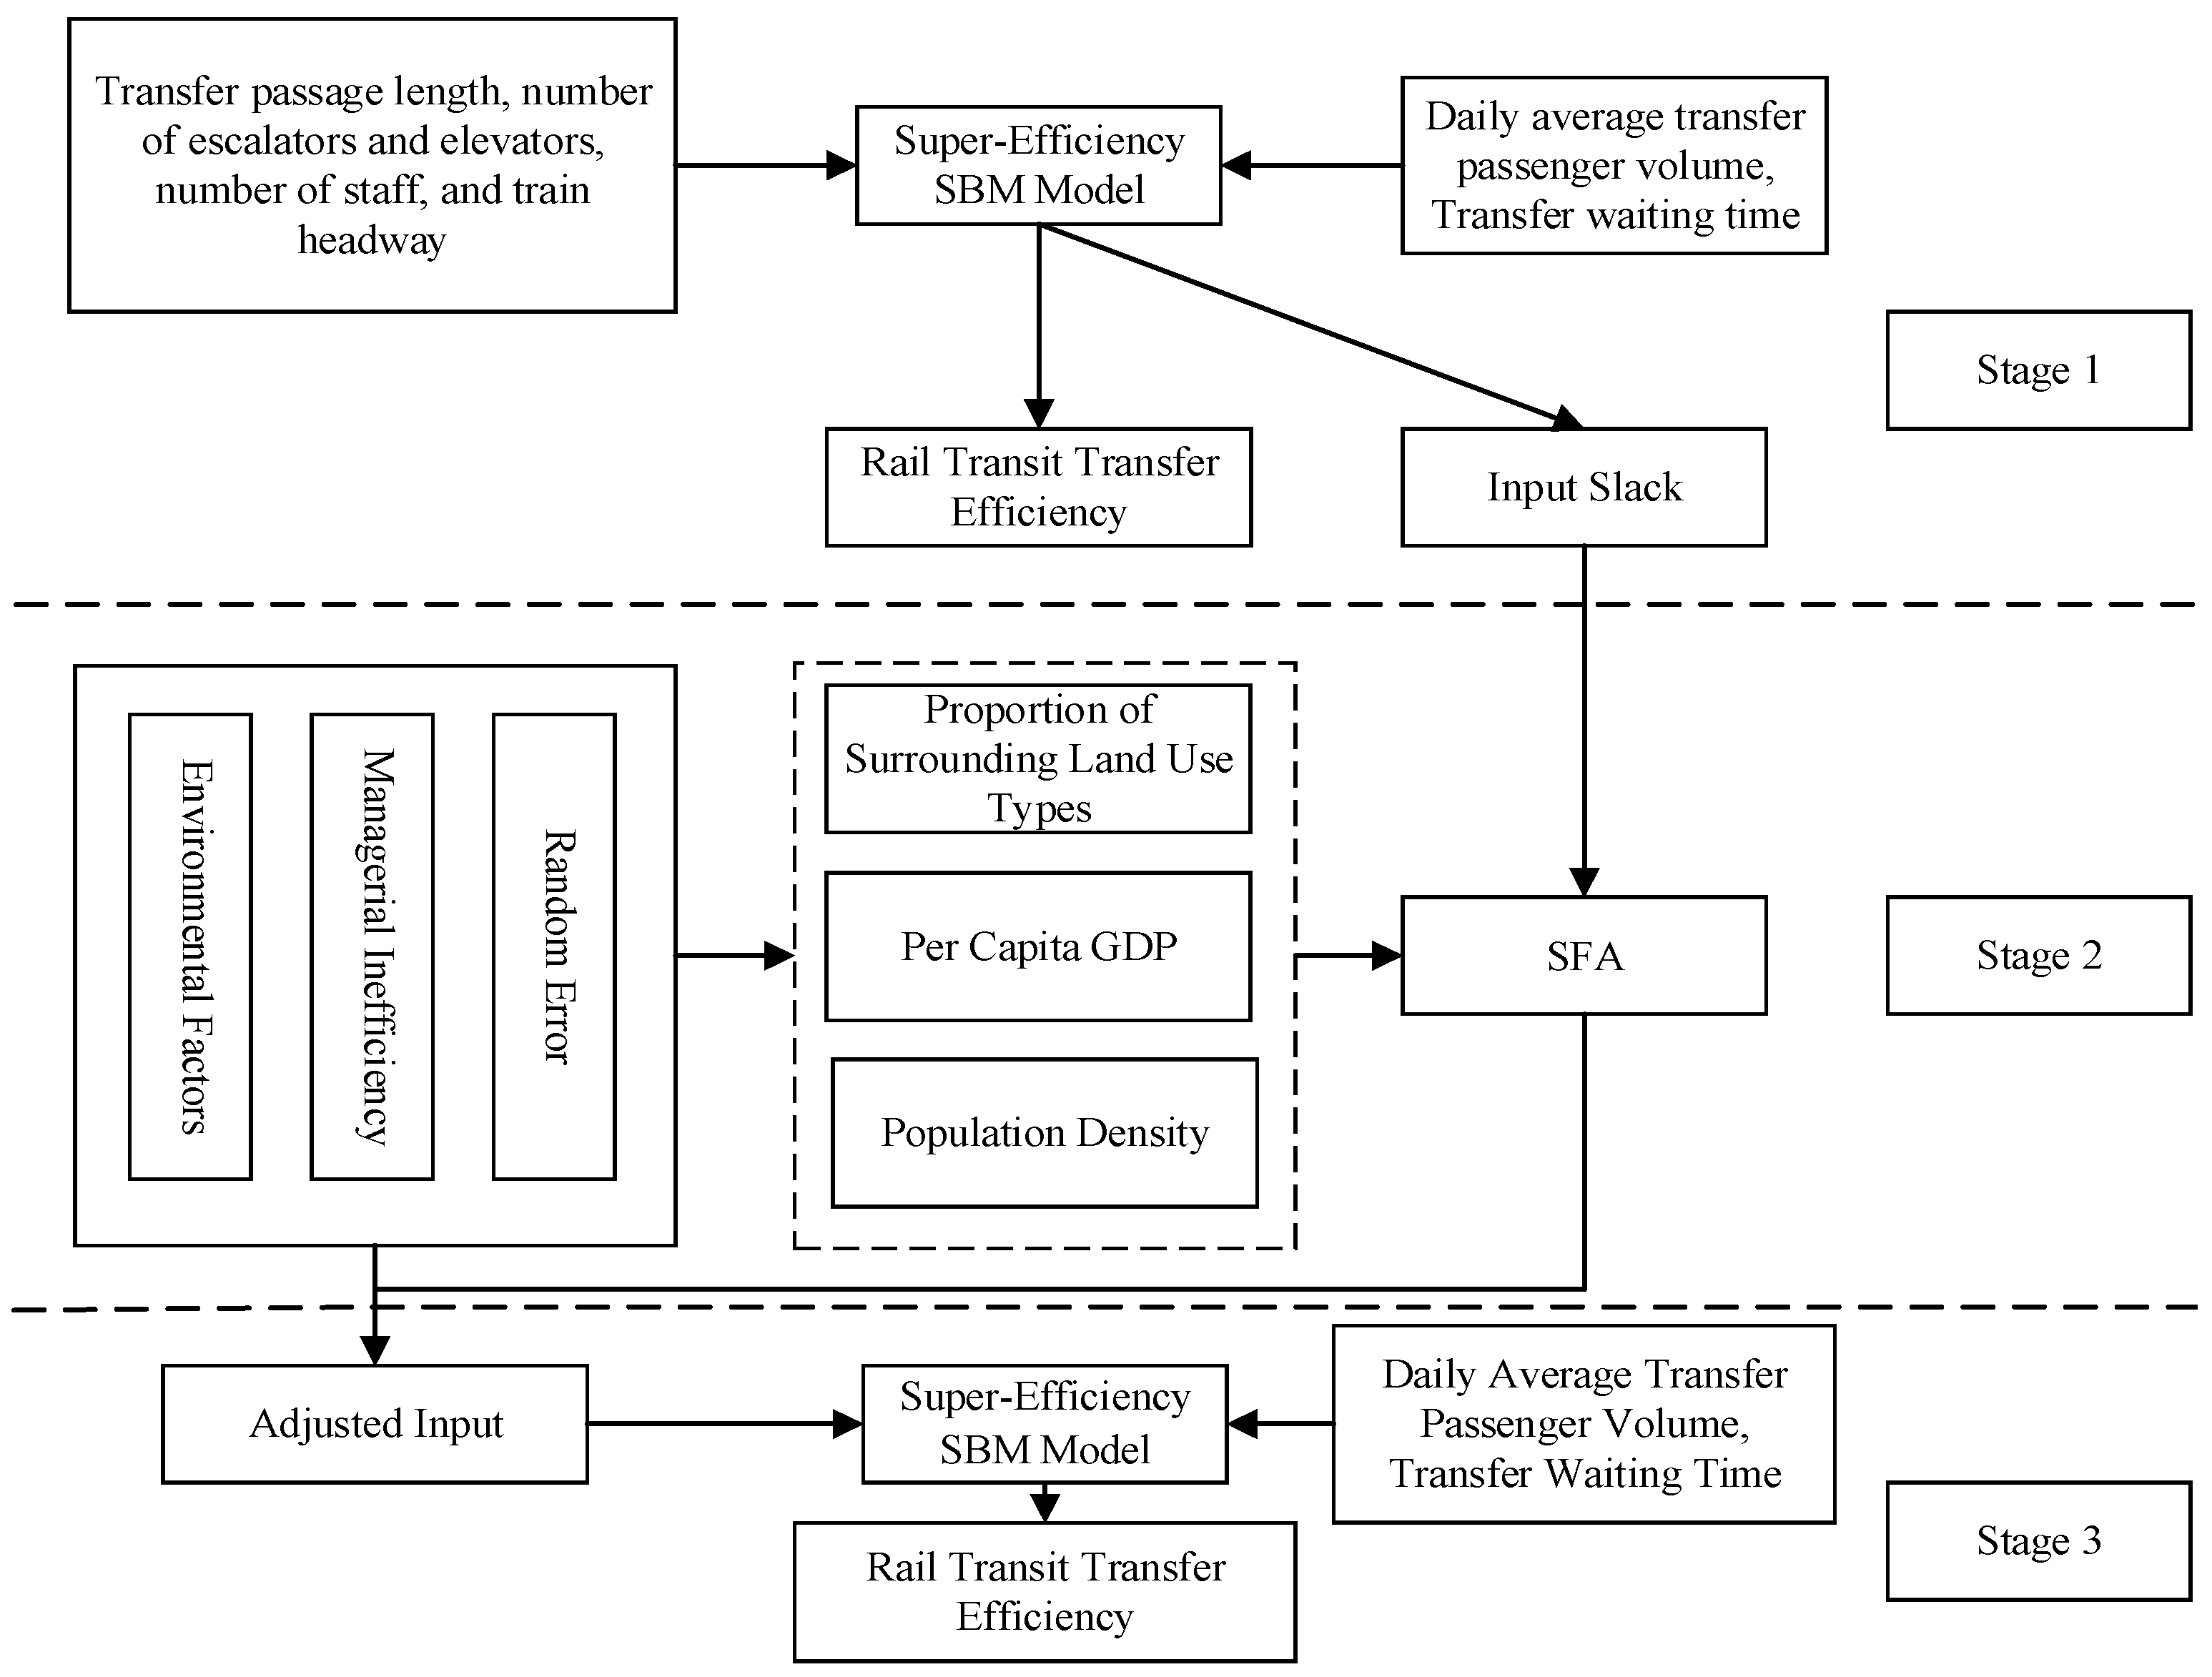
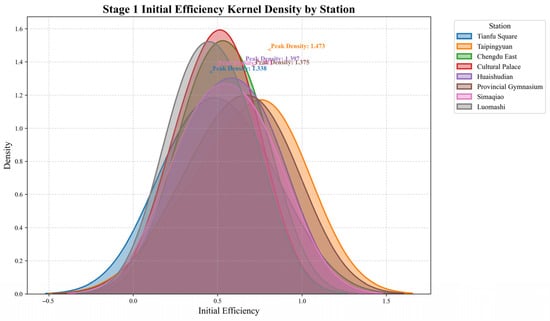
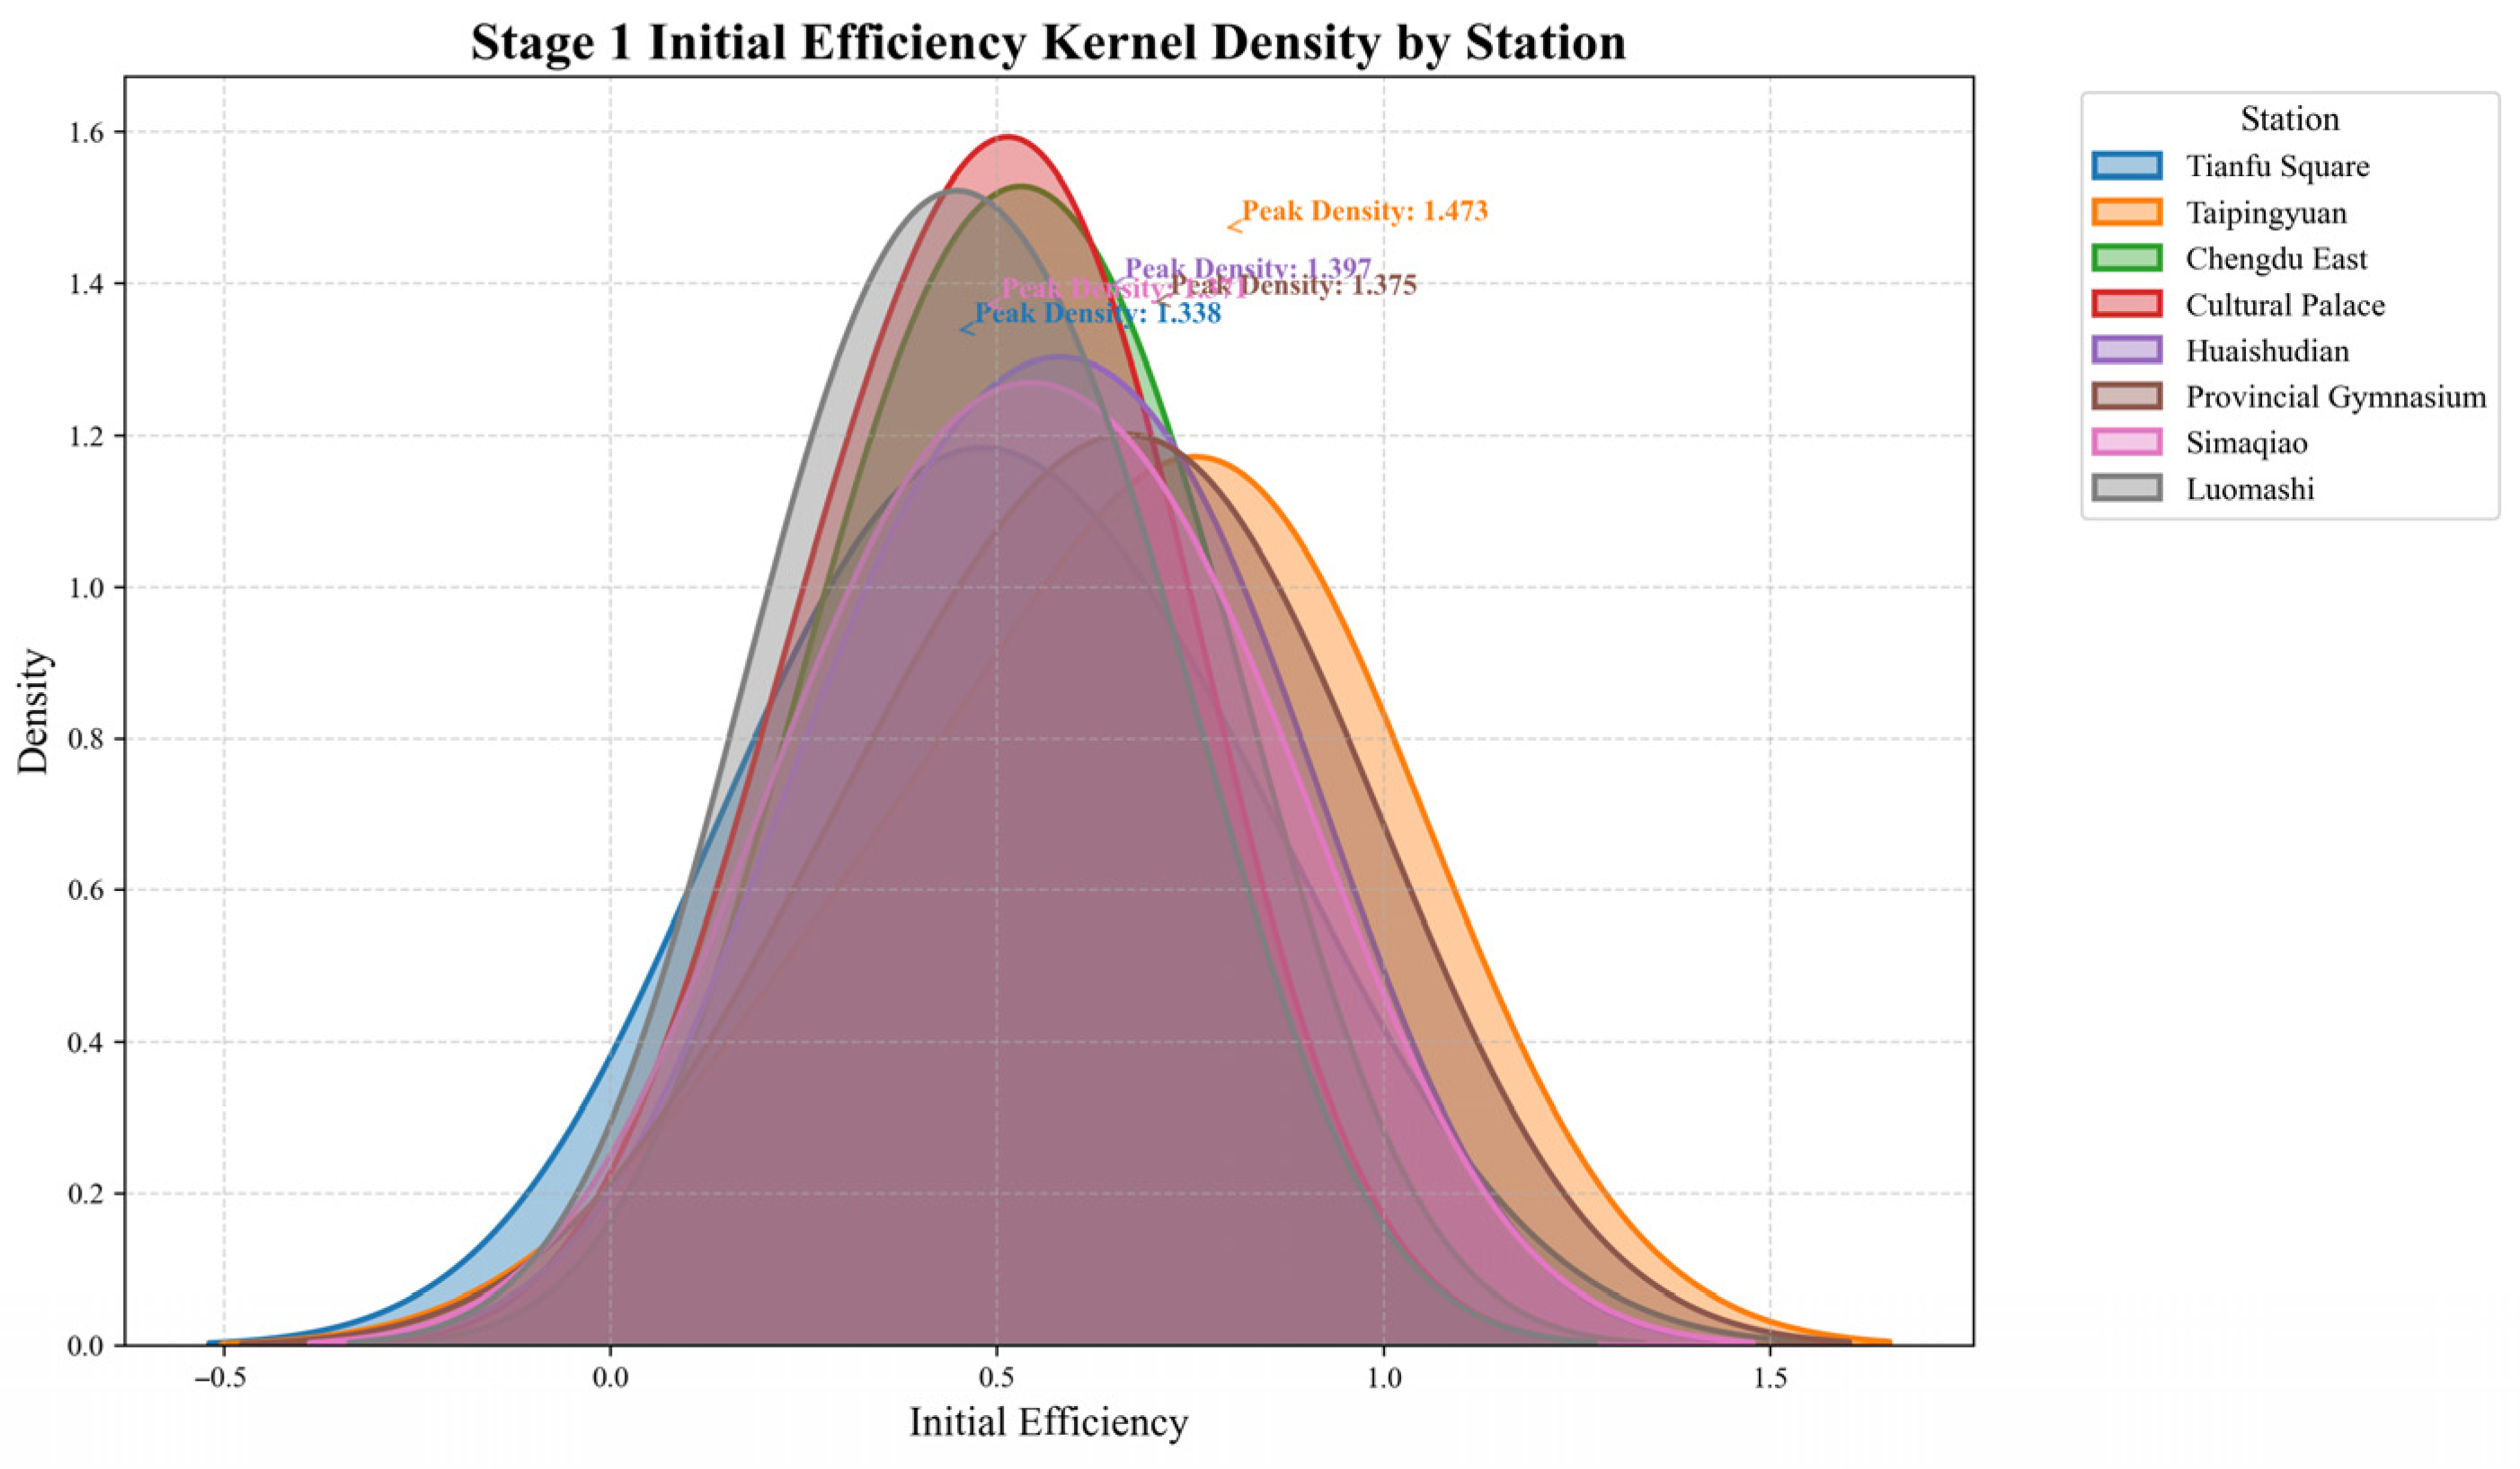
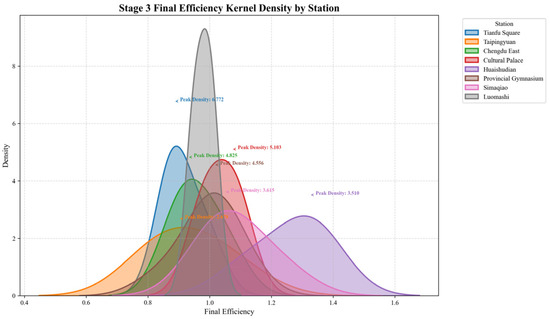
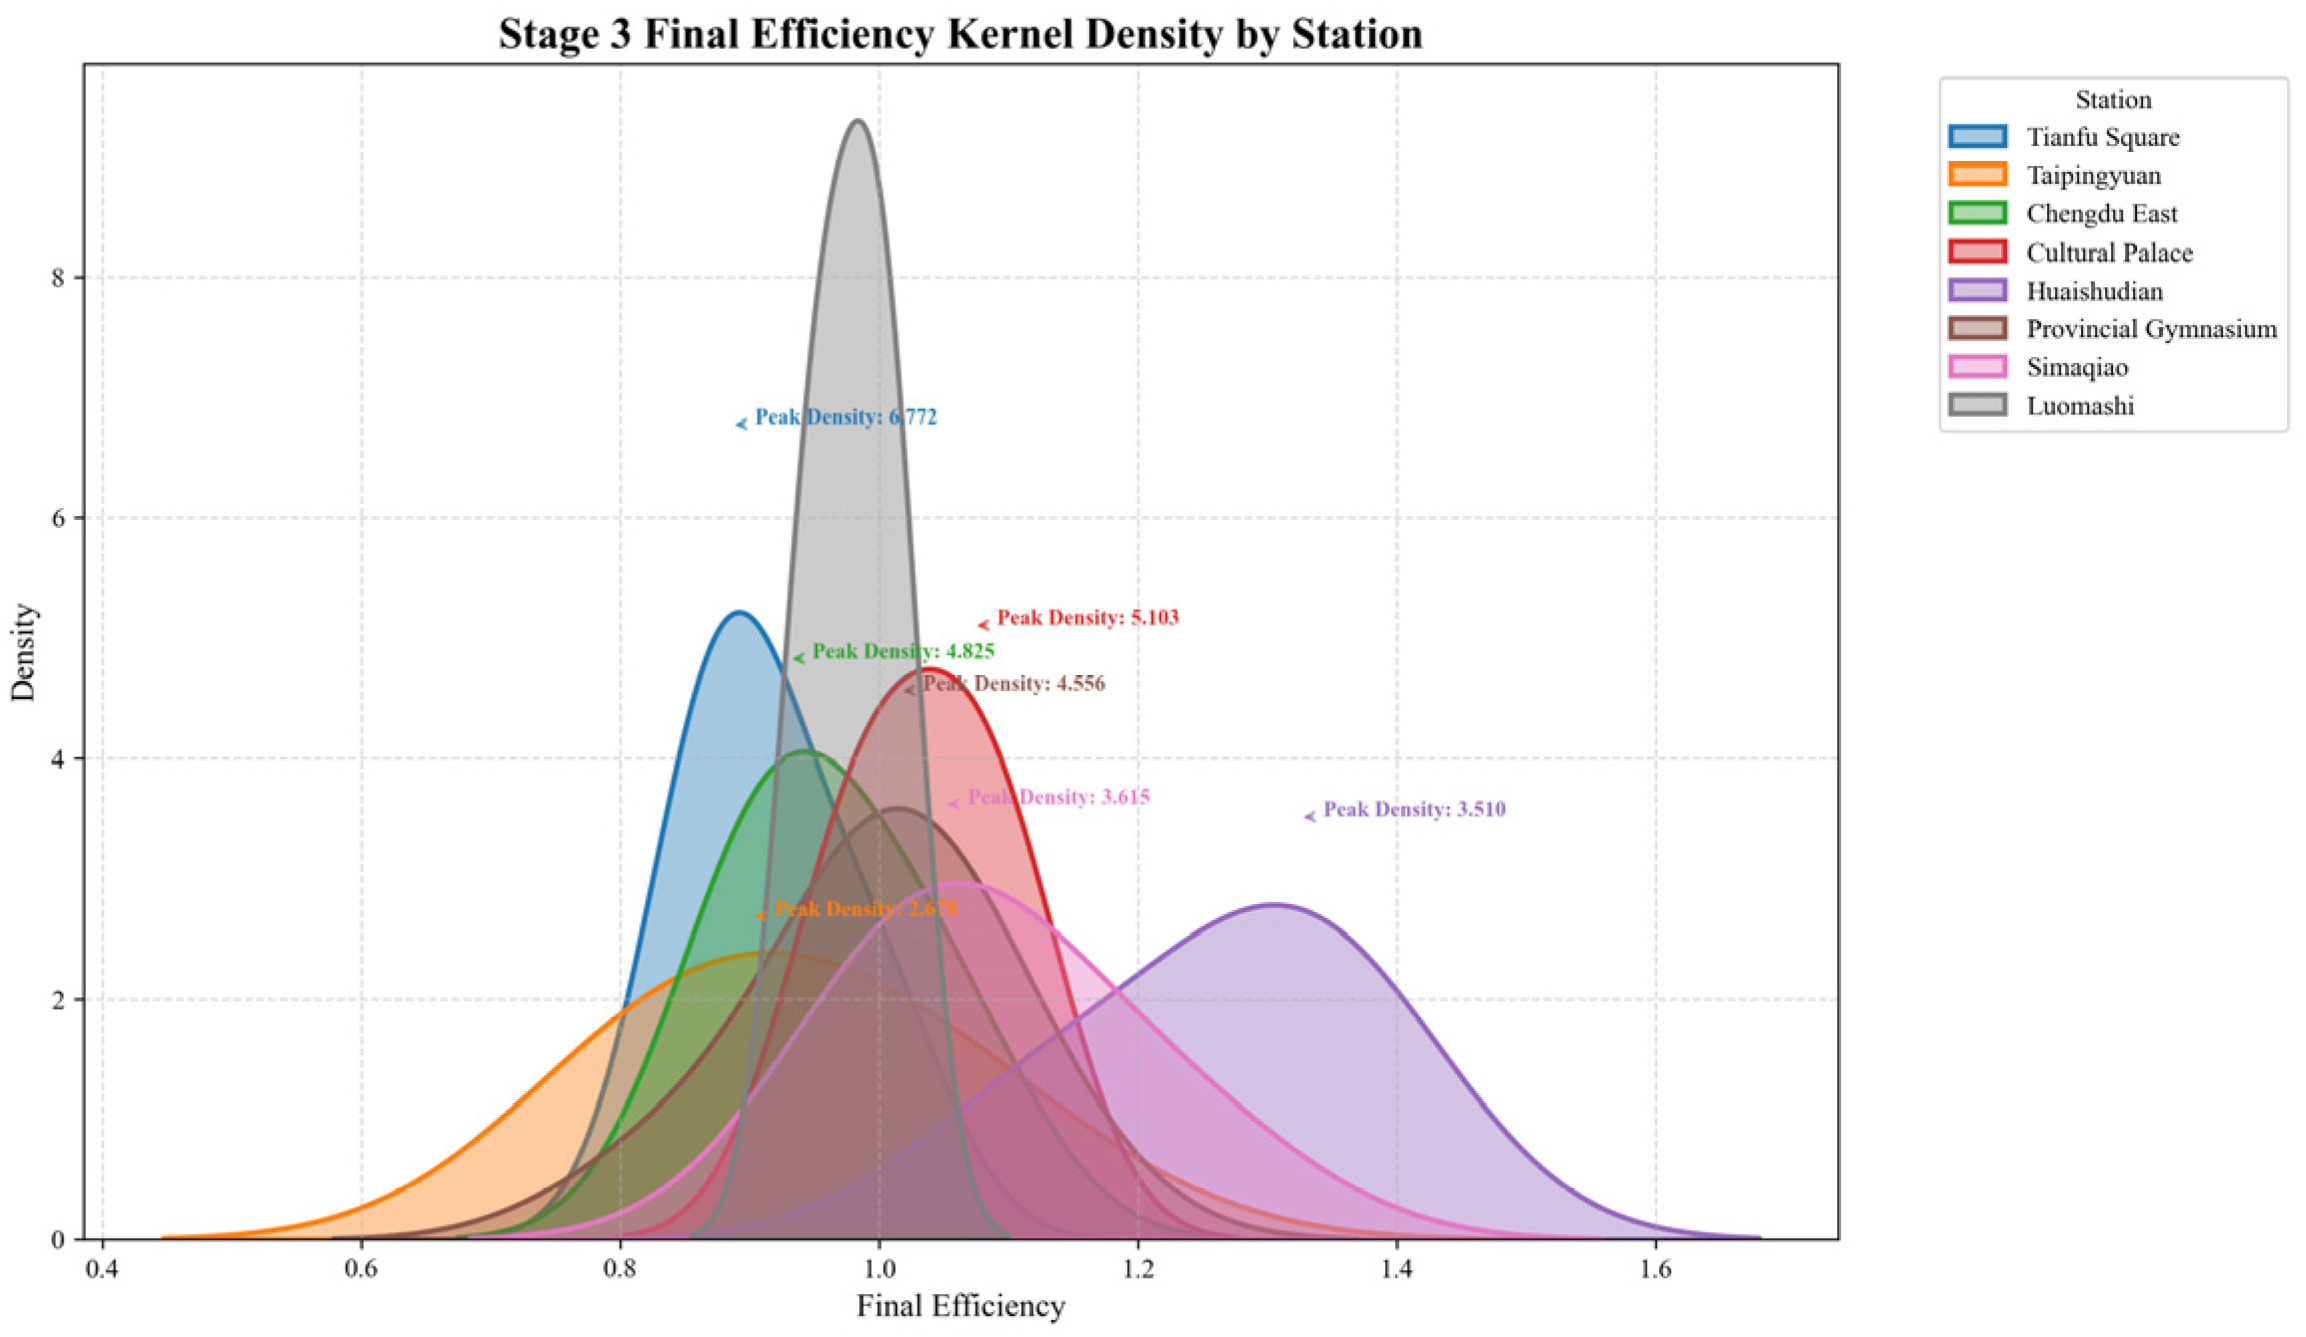
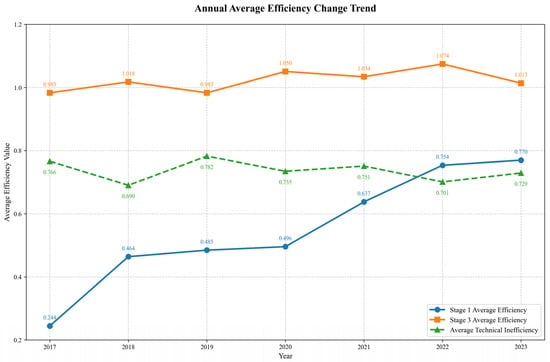
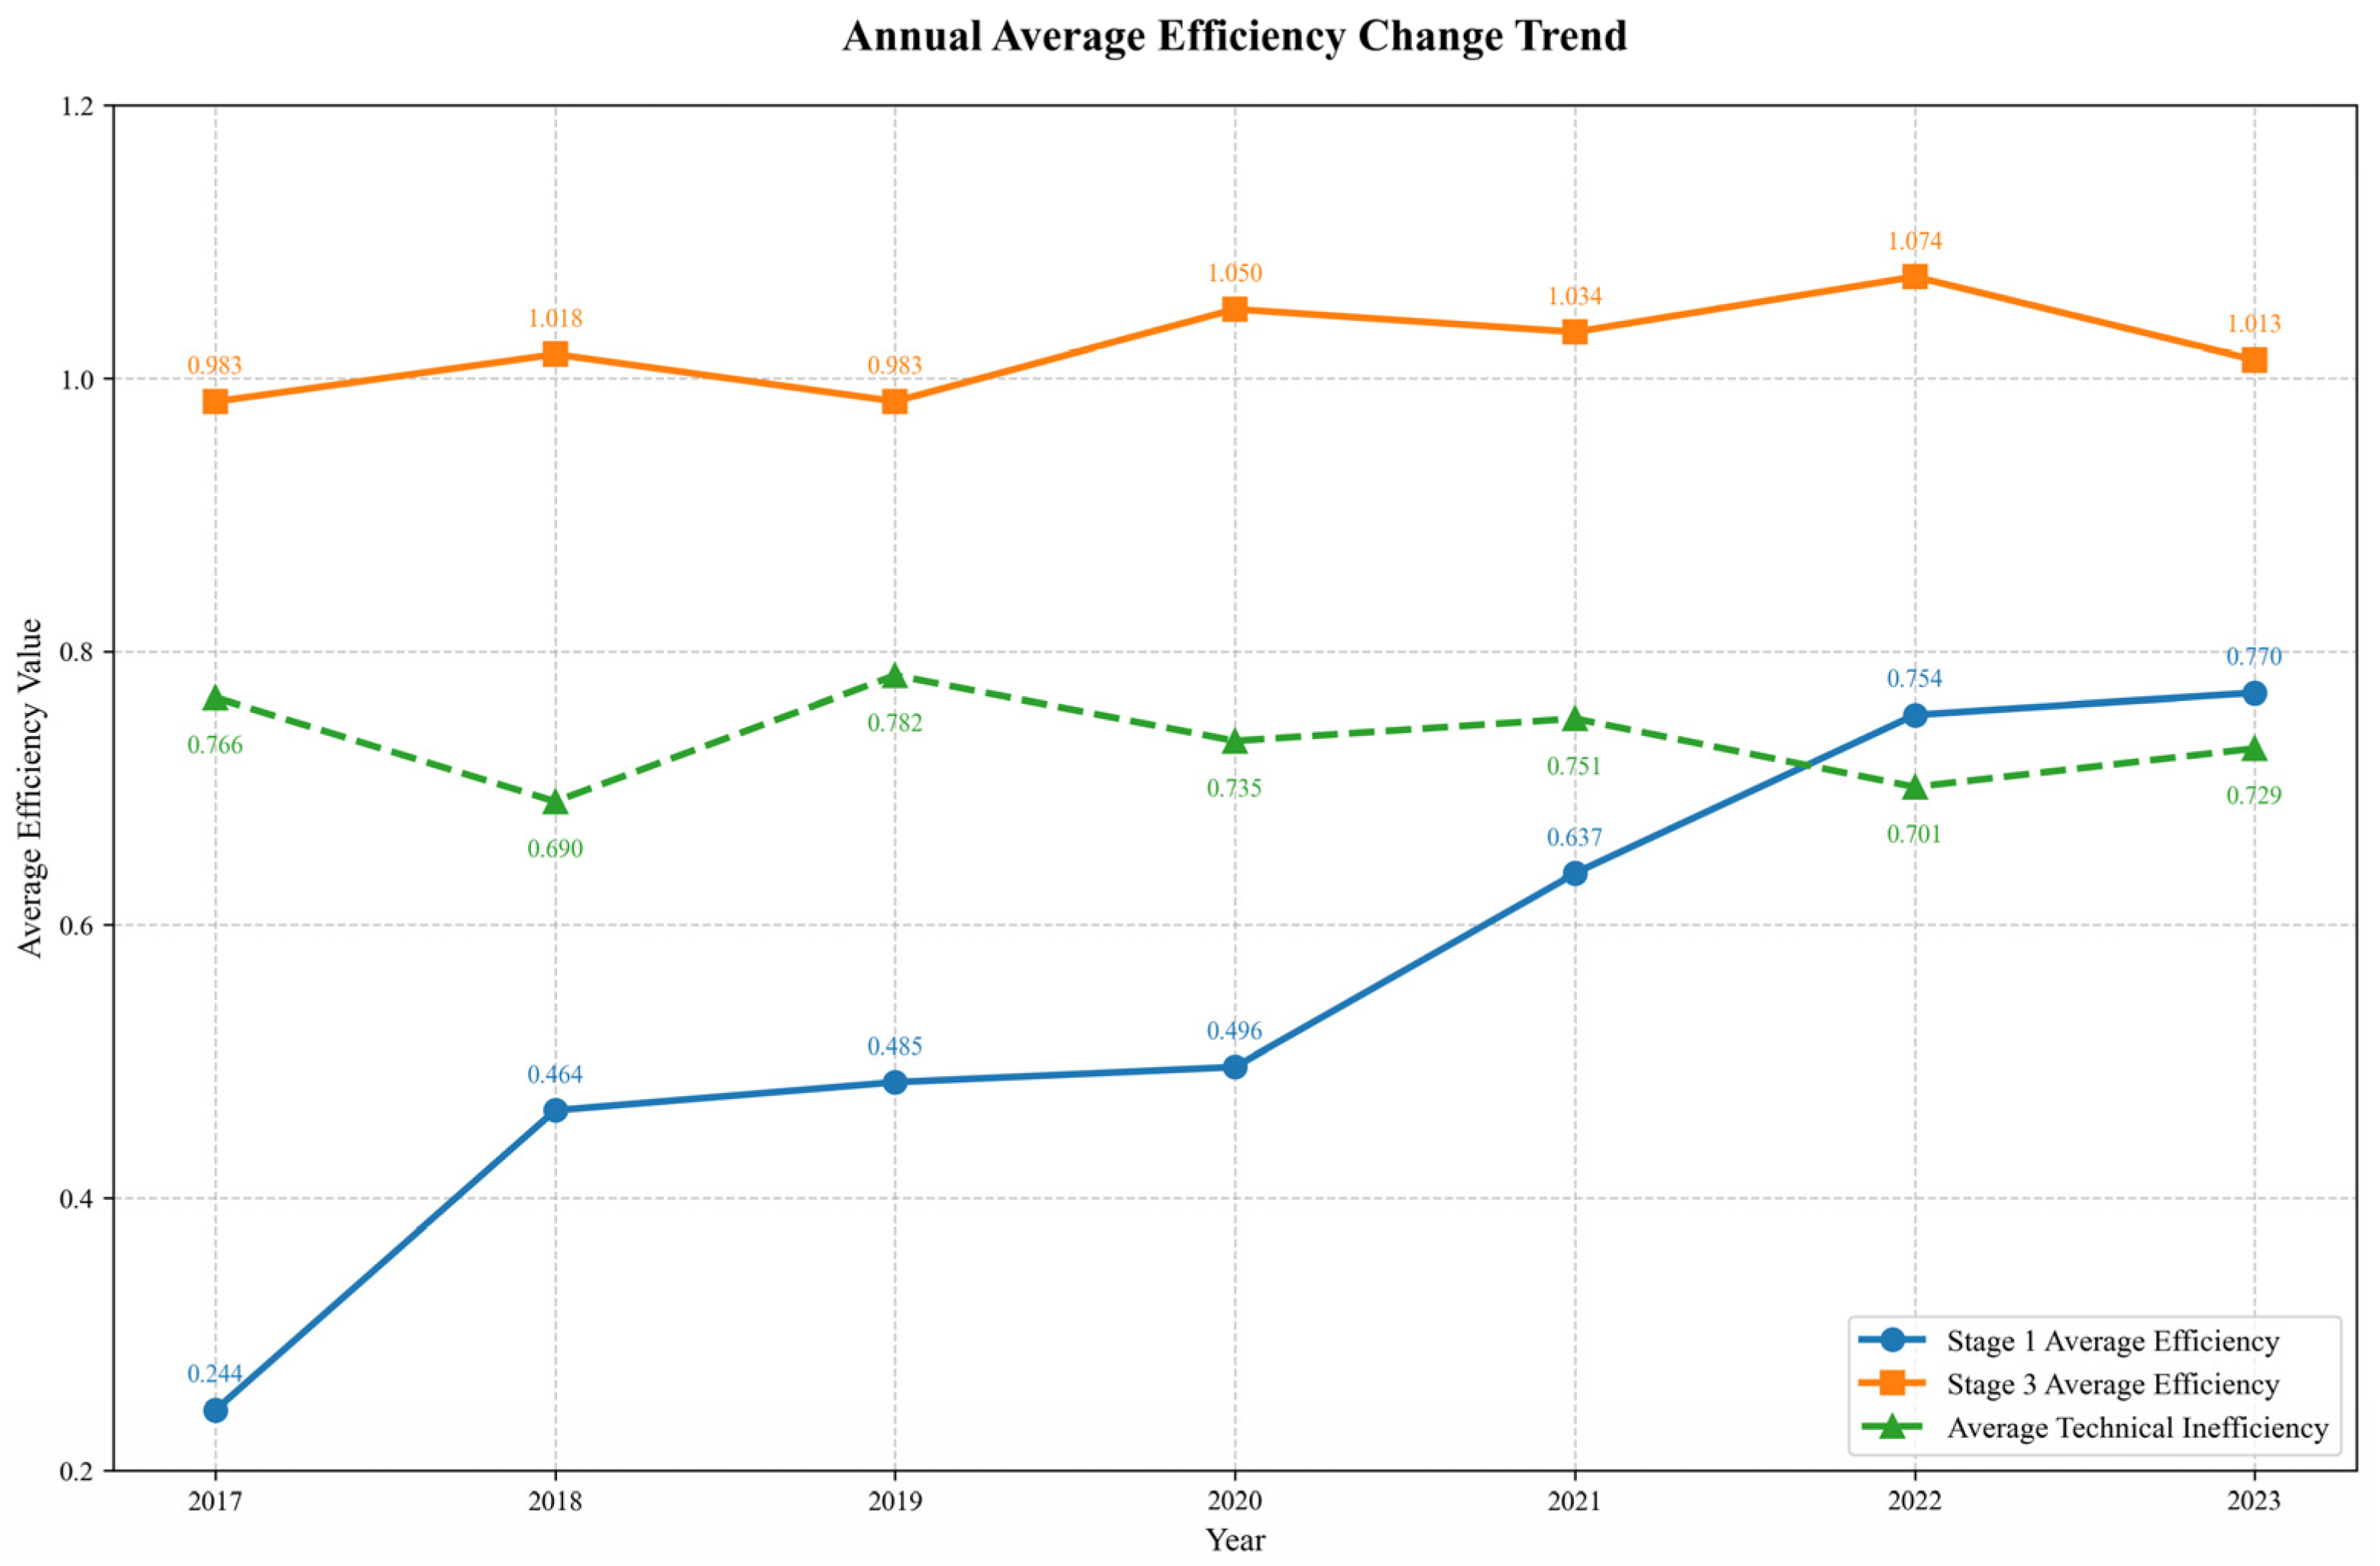
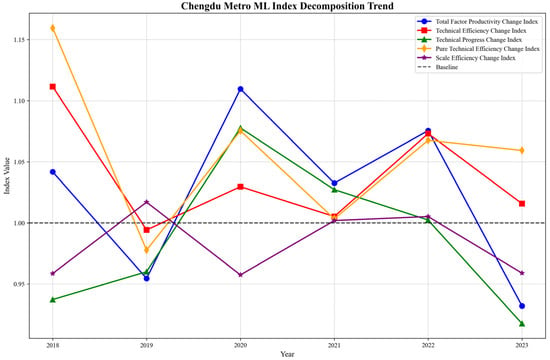
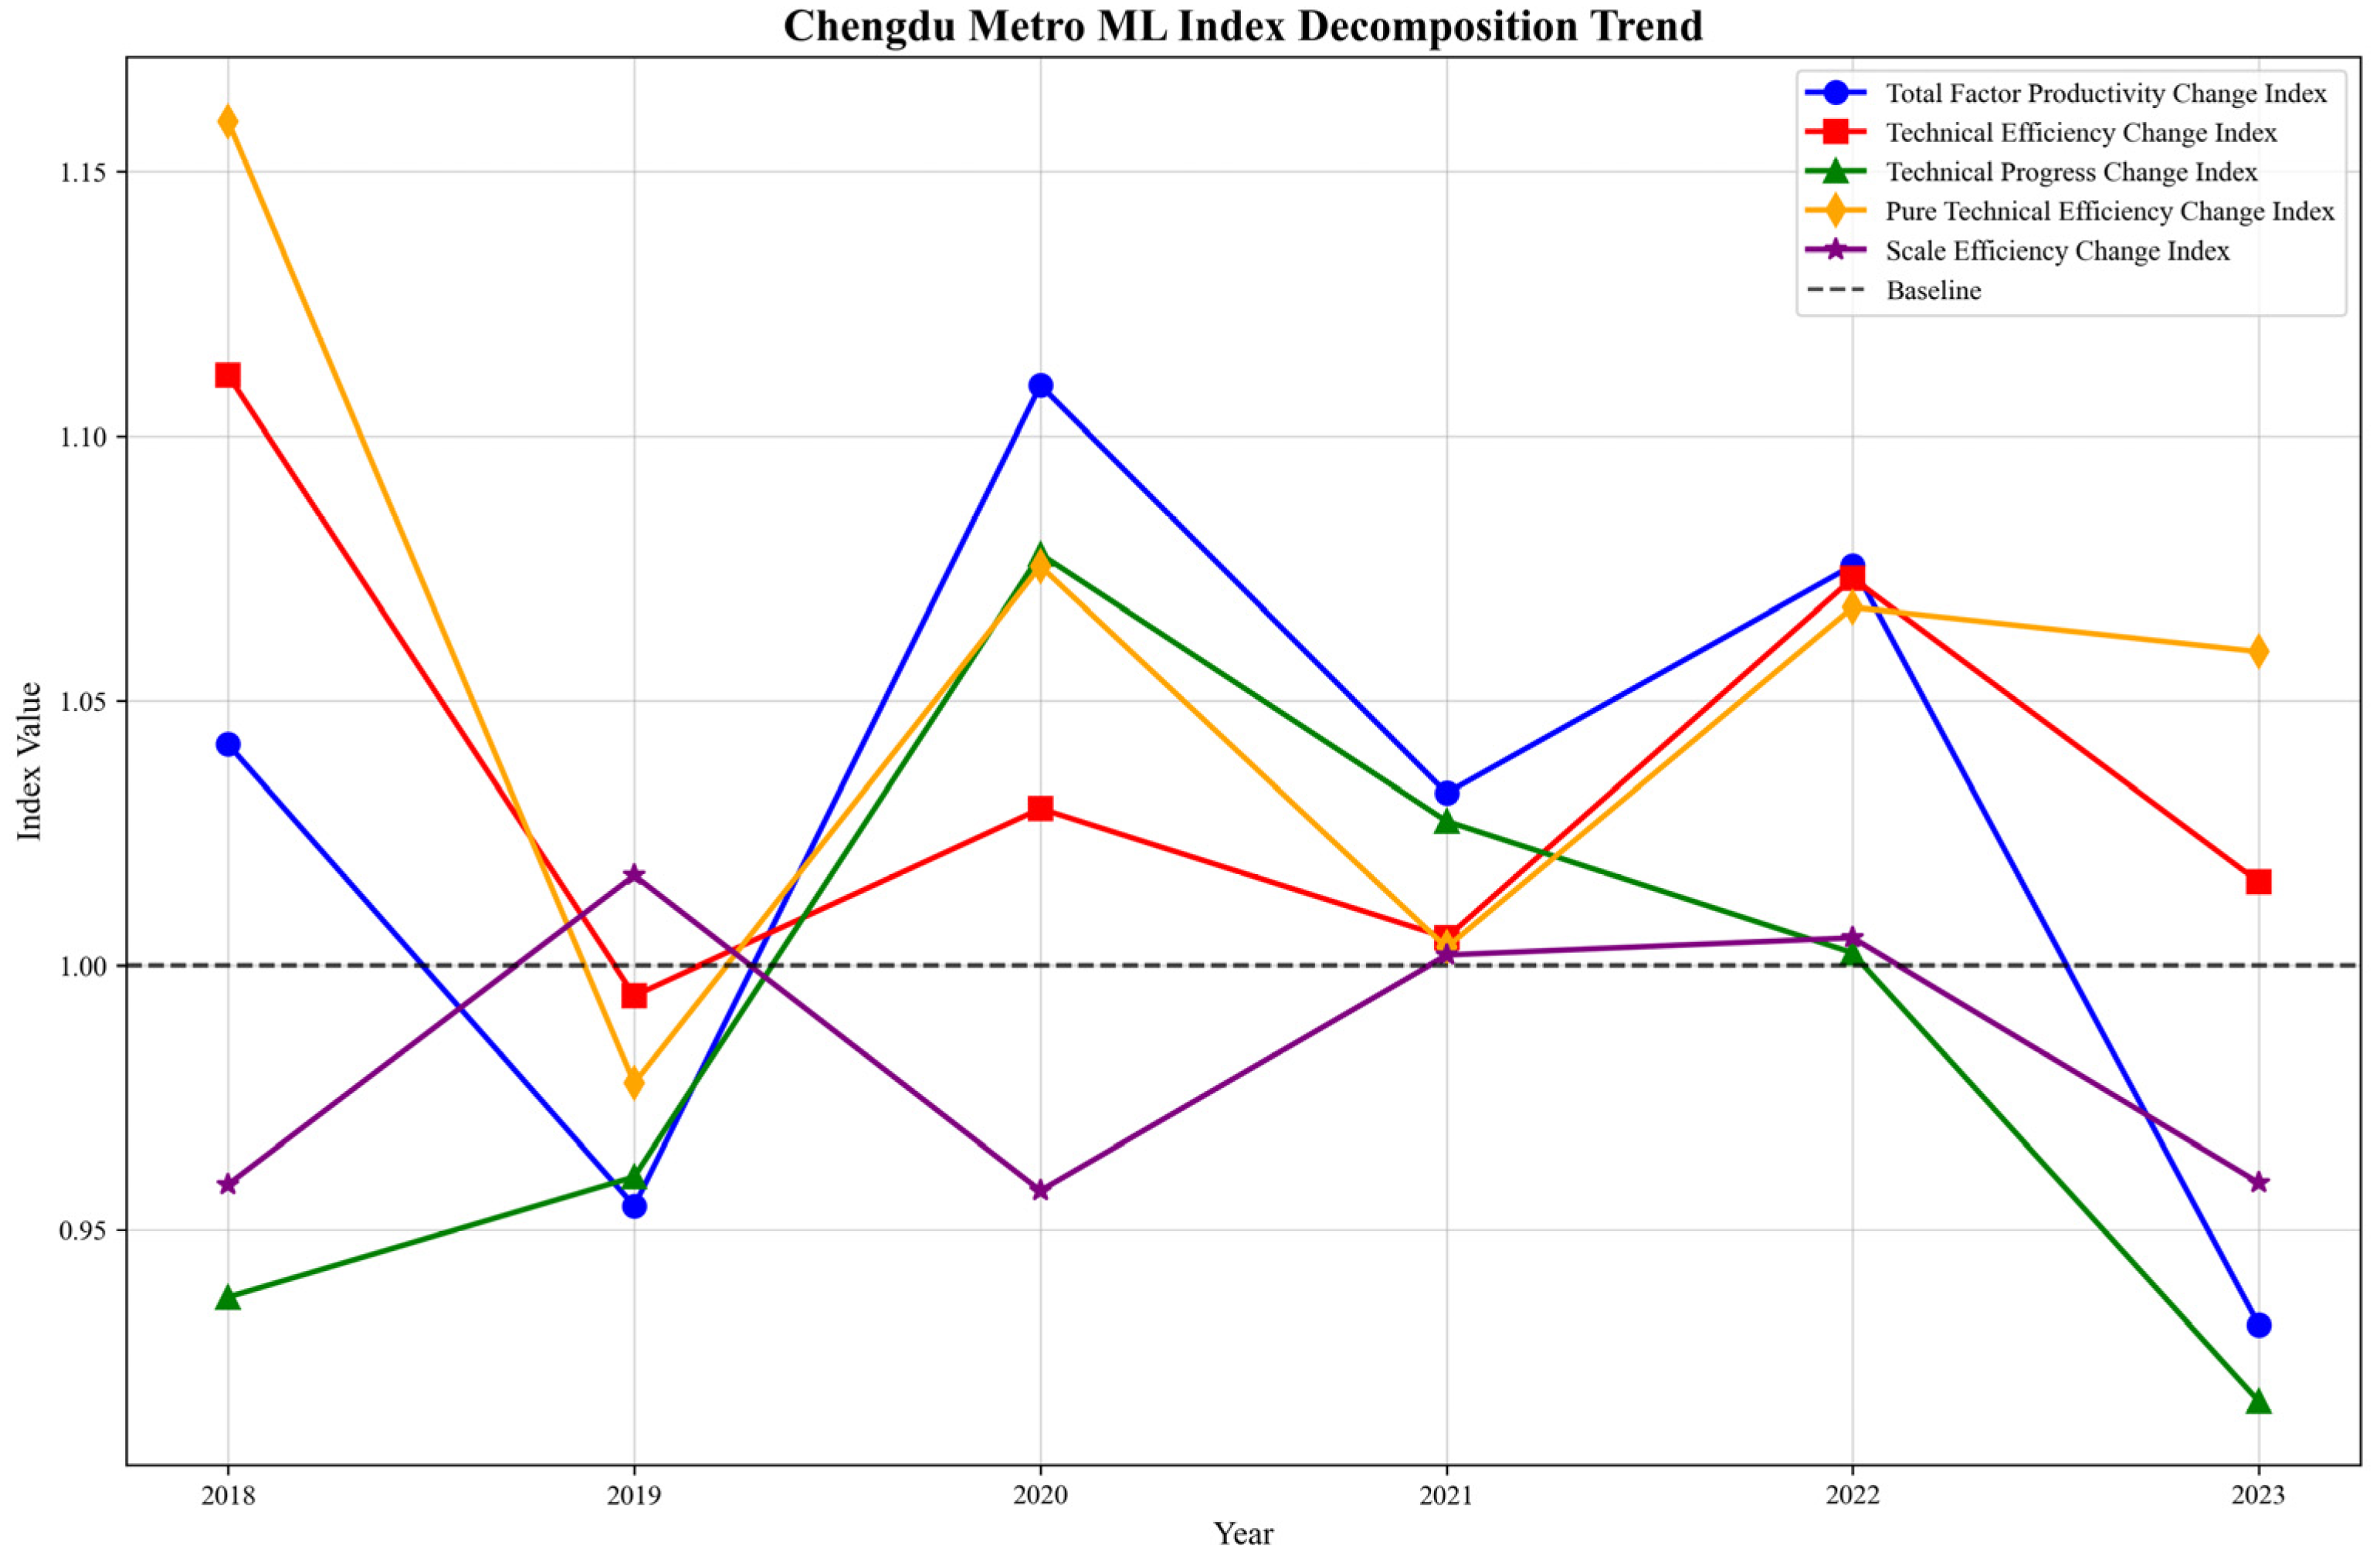

Disclaimer/Publisher’s Note: The statements, opinions and data contained in all publications are solely those of the individual author(s) and contributor(s) and not of MDPI and/or the editor(s). MDPI and/or the editor(s) disclaim responsibility for any injury to people or property resulting from any ideas, methods, instructions or products referred to in the content. |
© 2026 by the authors. Licensee MDPI, Basel, Switzerland. This article is an open access article distributed under the terms and conditions of the Creative Commons Attribution (CC BY) license.