


Abstract
Optimizing layout schemes for multi-branch river hubs is complex due to the need to balance conflicting goals—safety, ecology, and economy—under significant uncertainty. To address these challenges, this study proposes a comprehensive evaluation method integrating a dynamic weighting mechanism and a two-dimensional cloud model. First, we constructed an evaluation index system covering engineering safety and benefits. A multi-agent game theory approach was employed for combination weighting to reconcile the diverse interests of government, environmental, and community agents. Furthermore, a dynamic mechanism was introduced to adjust indicator importance across three key stages: dam site selection, hub layout, and detail optimization. Subsequently, the schemes’ uncertainty and risk status were quantified using a two-dimensional cloud model within a “probability-loss” framework. The methodology was validated using the Ganjiang River Hub Project. The results demonstrate that the method effectively captures the evolutionary path of decision-making priorities, transitioning from “safety-first” in early stages to “benefit-maximization” later. This study provides robust, stage-aware, and visual decision support for complex hydraulic engineering layouts, ensuring a scientific trade-off between risk control and comprehensive benefits.
1. Introduction
With the acceleration of urbanization and rapid economic development, the evaluation and optimization of hydraulic engineering hub layouts, serving as a pivotal link for harmonizing efficient water resource utilization with effective riverine environmental protection, have become key issues in the field of urban planning and management [1]. Multi-branch rivers, characterized by their intricate river network structures and stable bifurcated channels along the main stem, represent a common river type found in numerous watersheds globally. The layout planning of hubs on such rivers directly impacts the rational allocation of regional water resources, the health of riverine ecosystems, and the quality of life for residents along the banks [2]. However, a scientifically rigorous comparative selection process for engineering layout schemes is generally lacking in current multi-branch river hub planning. Problems such as the disconnection between economic development demands and ecological environmental protection, and the imbalance between partial and overall benefits, persist. Some layout schemes, while boosting regional economies in the short term, often induce or exacerbate long-term ecological risks [3]. Consequently, developing multi-branch river hub layouts that balance economic growth with ecological and social benefits remains an urgent challenge.
Research on the optimization and evaluation of hydraulic engineering hub layouts has garnered significant attention, focusing primarily on environmental, economic, and social impacts. However, most studies still concentrate on single or dual benefits, with relatively few offering comprehensive and systematic evaluations. For instance, Córdoba et al. (2022) [4] focused on the economic costs of engineering construction in remote areas of developing countries, proposing a genetic algorithm-based optimization method for the three-dimensional topographic layout of micro-hydropower stations. Schmitt et al. (2019) [5] centered on the environmental impacts of engineering plans, introducing a planning framework for dam construction sequences and applying it to assess and optimize the trade-off between power generation and sediment transport in dam construction schemes within the Mekong River Basin. Regarding social impacts, Navarro et al. (2024) [6] employed the Analytic Network Process (ANP) to synthesize the social performance of infrastructure schemes into a single comparative index, providing a reference for life-cycle evaluation. In parallel, numerous studies have focused on the integration and innovation of evaluation methods: Qu et al. (2023) [7] applied an improved TOPSIS model combined with the entropy weight method to conduct performance evaluations of small-scale water conservancy project management models in three representative areas of Guangdong Province. Tan et al. (2025) [8] selected water conservancy facilities in the Huitong River section of the Grand Canal, comprehensively utilizing social network analysis, kernel density estimation, and the TOPSIS method to construct an importance evaluation system. Nevertheless, uncertainties are pervasive across the various stages of the life cycle of the hydraulic engineering hub, spanning from project inception to operation management. Therefore, comprehensive, multi-perspective analysis and scheme evaluation are conducive to mitigating bias and ensuring robust and accurate assessment results.
Due to factors like water flow division, complex terrain, and variable geological conditions, the layout planning of hubs on multi-branch rivers necessitates the holistic consideration of various elements, including geological site selection, structural safety, aquatic ecological protection, investment efficiency, and construction organization. This leads to pronounced characteristics of uncertainty and multi-dimensional trade-offs [9]. Traditional evaluations have often prioritized qualitative judgments regarding geological safety, relying on singular evaluation systems with limited indicator coverage. This approach struggles to reflect the dynamically changing practical requirements during the scheme selection process. To address these multi-dimensional trade-offs, scholars have employed various methods such as subjective weighting, objective weighting, and combined subjective-objective weighting in their research. Hussainzada et al. (2023) [10], based on the Analytic Hierarchy Process (AHP) and considering factors like drainage conditions, soil type, and land acquisition costs, aimed to determine dam sites and assess their impacts in the arid regions of northern Afghanistan. Hassan et al. (2025) [11] combined AHP with spatial analysis to evaluate the suitability of rainwater harvesting stations in Iraq’s Karbala Desert, examining nine factors (e.g., rainfall, runoff depth, and soil texture) affecting spatial potential. Abdi-Dehkordi et al. (2021) [12], based on modern portfolio theory, developed a composite index considering environmental, economic, and water use efficiency factors to assess the sustainability of various scenarios within the water resource system of Brazil’s Big Karun River Basin. Bouramdane (2023) [13] integrated AHP with the Saaty scale to construct an evaluation system for water resource management, comprehensively considering ten indicators, including environmental impact, public acceptance, and investment return rate. Zhou et al. (2022) [14] employed the BWM and CRITIC to determine the subjective and objective weights of 15 indicators across three criteria layers to assess water security status. However, existing research predominantly relies on fixed weighting mechanisms. These static approaches fail to adequately capture the dynamic shifts in the relative importance of indicators across different stages and scenarios, thereby limiting the adaptability and scientific rigor of the evaluation results.
In parallel with the limitations in dynamic weighting, the scope of stakeholder representation in current engineering scheme optimization also remains narrow, with most studies prioritizing single or dual interests. For instance, Thomas et al. (2023) [15] took the wind farm owner as a single stakeholder, optimizing wind farm layout with the goal of maximizing annual power generation. Uribe et al. (2024) [16] addressed two distinct groups, namely profit-driven managers and engineering planners concerned with safety and collaboration, by employing the GRASP algorithm to balance their competing demands for optimal scheme selection. However, existing research often lacks a comprehensive multi-stakeholder perspective, failing to sufficiently account for the comprehensive benefits of projects and overlooking the varying priorities that different departments assign to influencing factors in hub projects [17,18]. Relying solely on combined subjective-objective weights makes it difficult to balance the interests of all parties and accurately reflect actual preferences [19,20]. Therefore, constructing a scientific and reasonable evaluation indicator system for multi-branch river hub projects, incorporating multi-stakeholder participation and scientific weight allocation, is of significant importance for balancing diverse interests and achieving maximized comprehensive benefits [21,22,23].
In such complex evaluations involving multiple stakeholders and criteria, effectively characterizing and integrating the subjective judgments and objective uncertainties of all parties is a key consideration in method selection. The cloud model has gradually emerged as a prominent method for engineering uncertainty analysis in recent years, owing to its ability to simultaneously characterize both the fuzziness of evaluation indicator grade boundaries and the randomness of subjective judgments through digital features (such as entropy and hyper-entropy), thereby enabling a unified, quantitative representation of both. It has been widely applied in engineering performance evaluation [24], hydraulic engineering construction [25], seepage safety risk assessment [26,27], railway operation management [28], power system operation and maintenance [29], and other engineering domains. Furthermore, the introduction of dynamic weighting mechanisms has also, to some extent, enhanced the model’s adaptability and flexibility to the demands of different project stages [30,31].
This study takes a typical multi-branch river site as the research object and con-structs an evaluation system integrating two core dimensions: engineering safety and engineering benefits (specifically, economic, social, and environmental benefits). It adopts cloud model theory to quantitatively analyze the performance of each scheme under uncertainty and introduces a dynamic weighting mechanism to reflect the actual influence of each indicator on the scheme’s suitability in different scenarios. Finally, the proposed methodology is applied to the Ganjiang River Hub Project to verify its scientific validity and robustness. This study aims to achieve a whole-process, multi-dimensional, and non-linear evaluation of multi-branch river hub layout schemes, providing a more flexible and robust scientific decision-making method for similar complex hydraulic engineering hub layouts.
2. Methods
2.1. Construction of Evaluation Index System
The construction of major water conservancy hub projects is a complex system engineering task involving multiple domains such as society, resources, environment, and safety. To ensure the comprehensiveness and scientific rigor of the evaluation results, this study is grounded in sustainable development theory. A candidate set of indicators was initially constructed by strictly referring to relevant technical standards and codes regarding engineering geology, hydraulic structural design, and project economic evaluation, and by drawing on existing research findings regarding hydraulic hub layout optimization. On this basis, a hybrid screening mechanism combining “Literature Frequency Analysis” and “Structured Expert Consultation” was adopted to refine the system. The screening process followed three core dimensions: (1) Indicator Independence: We analyzed the physical connotation of candidate indicators to eliminate informational redundancy. For instance, generic “Groundwater Level Fluctuations” were excluded because their impact is more effectively captured by the dynamic evolution of “Geotechnical Mechanics Parameters” (e.g., shear strength degradation) under environmental loads, thus avoiding double-counting of risks; (2) Environmental Dynamic Adaptability: Priority was given to indicators that reflect the evolutionary laws of physical properties under complex environmental conditions (such as wetting-drying cycles and temperature effects) rather than static descriptions, ensuring the model captures the coupling effect between the project and its environment; and (3) Data Accessibility: Indicators difficult to quantify or with high acquisition costs were removed. Ultimately, the candidate indicators were converged into 18 core metrics.
Ultimately, the index evaluation system of the multi-branch river hub layout schemes constructed in this study covers two core dimensions: Engineering Safety (S) and Engineering Benefits (E) [32,33]. This framework adopts a “Dual-Pillar” logic that couples intrinsic safety constraints with external benefit outputs. Specifically, the Engineering Safety dimension focuses on the stability and reliability of the hub structure under complex hydro-geological loads, serving as the physical carrier for environmental adaptability and the prerequisite for sustainable operation. Meanwhile, the Engineering Benefits dimension explicitly quantifies the project’s contribution to socio-economic development and ecological regulation services (e.g., water quality improvement and habitat maintenance). Consequently, the attributes of environmental sustainability are effectively internalized within the mechanism of “safety constraints safeguarding benefit realization,” rather than being treated as an isolated factor. This design ensures the structural coherence of the evaluation model and accurately reflects the systemic coupling of the project. To clearly illustrate the physical meaning and hierarchical classification of the indicators, the evaluation index system is presented in Table 1.
Table 1.
Evaluation index system for multi-branch river hub layout schemes.
Engineering safety (S) is the top priority of hub layout, which is directly related to whether the hub can be operated stably, as well as the safety of the surrounding area. The complexity and uncertainty of the multi-branch rivers make the hubs need to have strong resilience in the face of risks such as floods and geological hazards. To comprehensively quantify safety risks under complex geological and environmental conditions, this dimension encompasses four hierarchical levels. First, regarding external environmental factors (S1, S2), the inundated area (S1) derived from regional topographical surveys, serves as a rigid constraint for social feasibility, determining the scale of immigration and land compensation, while overburden thickness (S2), identified through geological borehole exploration, characterizes the geological conditions of the riverbed and floodplain, dominating the bearing capacity and the complexity of seepage control schemes. Second, geological characteristics (S3, S4) reveal intrinsic structural risks; specifically, lithological composition (S3) is the key basis for assessing the stability of the dam foundation against weak interlayers. The slope reclamation type (S4) indicates deformation modes under natural or engineering disturbances. Considering that soil mechanical behavior degrades significantly under wetting-drying cycles caused by hydrological rhythms [34], this indicator is critical for characterizing the slope’s sensitivity to environmental dynamic loading. Third, construction site conditions (S5, S6), including bank slope lithology and the width of the beach obtained from field investigations, determine the spatial suitability for diversion works and cofferdam layout, directly correlating with construction difficulty and temporary engineering safety. Finally, geotechnical mechanics parameters (S7–S11) quantify the shear strength, deformation characteristics, and permeability of the rock-soil body, primarily acquired through in situ tests and laboratory experiments. For shear strength (S7, S8), while traditional acquisition relies on physical experiments, it is acknowledged that emerging data-driven approaches like machine learning have demonstrated superior potential in predicting complex contact interface behaviors [35]. Regarding hydraulic conductivity (S10), recognizing that the material’s micro-pore connectivity fundamentally determines macro-seepage risks [36], this indicator is strictly evaluated via high-pressure water injection tests. These micro-physical parameters provide fundamental quantitative inputs for calculating the safety factors of anti-sliding stability and seepage stability.
Engineering benefits (E) are an important measure of whether a hub layout scheme is worth implementing, involving a trade-off between economic investment and comprehensive social-ecological returns. The direct and indirect, short-term and long-term benefits of hub engineering benefits can be fully weighed by a scientific index evaluation system. Specifically, economic benefits (E1–E3) cover engineering investment costs, social return on investment, and unit project construction costs. These indicators define the direct financial threshold, construction efficiency, and the long-term economic rationality of the project; their quantitative values are strictly extracted from the engineering feasibility study reports and financial budget estimates. On the other hand, social and ecological benefits (E4–E7) reflect the multi-functional value and external contributions of modern hydraulic projects. Navigation benefits (E5) quantify the magnitude of improvement in channel grade and transport efficiency. Water ecology benefits (E6) and water landscape benefits (E4) represent the project’s contribution to ecosystem restoration and recreational value, responding to the requirements of sustainable development. Urban benefits (E7) comprehensively reflect the hub’s capacity to support urban water supply security and flood control systems, embodying the integration of the project with regional development. Given the comprehensive nature of these macro-indicators, their assessment is not based on single-source measurement but is synthesized from administrative statistical data, Environmental Impact Assessments (EIA), and regional urban planning documents. The clear hierarchy and correlation between these indicators help decision-makers to fully understand the comprehensive value of the project.
Through the rigorous screening and hierarchical definition described above, the evaluation system is finally converged into 18 core indicators (comprising 11 safety indicators and 7 benefit indicators). The rationality of this quantity lies in the necessity to maintain the “Decision Sensitivity” of the evaluation model. On one hand, these 18 indicators provide sufficient resolution to cover the coupling of hydro-geological risks and socio-ecological returns, preventing the omission of any rigid constraints (e.g., permeability S10 or ecological utility E6). On the other hand, a constrained number of indicators ensures that the weight distribution remains concentrated on controlling factors. If the indicator system were overly expansive, the weight of critical safety parameters (such as shear strength S7–S8 or lithology S3) would be mathematically diluted, potentially masking fatal engineering defects under a high total score. Therefore, this converged configuration guarantees that key safety constraints and core benefits retain sufficient weight to effectively distinguish superior schemes from inferior ones.
2.2. Weight Determination Based on Multi-Agent
2.2.1. Identification of Multi-Agent
In the layout and evaluation process of large-scale water conservancy hub projects, the functional division of different agents determines their value orientation in decision-making. To comprehensively integrate multi-party demands, this study identifies four representative agents: government construction departments, ecological environment departments, local communities, and construction enterprises.
Constructing an evaluation alliance with these four agents is scientifically justified. The government represents public interests and macro-safety will; the ecological department represents the rigid constraints of the natural environment; the community represents the livelihood demands of directly affected groups; and the enterprise represents the techno-economic rationality of engineering implementation. These four agents correspond to the critical dimensions of “safety-environment-society-economy” in engineering decision-making, forming a closed loop of interests that can balance each other and cover the full evaluation perspective. This configuration effectively avoids the bias of single-perspective decision-making, which can cover the majority of evaluation needs.
2.2.2. Determination of Subjective Weights for Each Agent Based on AHP
Given the distinct priorities in weight determination among different agents, the Analytic Hierarchy Process (AHP) is adopted to assign subjective weights and analyze the structural differences in preferences across agents. AHP is a practical multi-criteria decision-making method that treats complex decision-making problems as a system [37,38]. Since the indicators often differ in units and have large numerical variations, directly comparing them is inappropriate. Therefore, it is necessary to transform the indicators into dimensionless relative numbers and normalize the values into the range of [0, 1]. In order to integrate the analysis of each indicator’s impact on the composite index, the indicators are normalized using the min-max normalization method defined in Equation (1):
where X is the actual value of the indicator; Xmin is the negative ideal solution of the indicator, i.e., the worst solution of the indicator; Xmax is the positive ideal solution of the indicator, i.e., the optimal solution of the indicator.
The normalized indicators are transformed into positive indicators (the larger, the better). However, since the indicator system contains both positive and negative indicators, negative indicators need to be transformed as defined in Equation (2):
A five-point scoring system is used for specific scoring, with the scoring rules defined in Table 2.
Table 2.
Five-point rating scale.
Note that the elements of the lower layer governed by the criterion layer element C are U1, U2, … Un, the decision maker needs to compare which of the two elements Ui and Uj is more important and how important it is for the criterion C, and to form the judgement matrix A = (aij), where a is the scale of importance ratio of the elements Ui and Uj with respect to criterion C. Therefore, aij satisfies the properties where aij > 0, aji = 1/aij, and 3) aii = 1; thus, the judgement matrix can be defined in Equation (3):
The relative weight vector of the indicators is denoted as W = (w1, w2, …, wn)T. Mathematically, this vector corresponds to the eigenvector of the judgment matrix A associated with its maximum eigenvalue λmax, which satisfies the characteristic equation in Equation (4):
where λmax is the maximum eigenvalue of matrix A. The vector W, after being normalized, represents the final subjective weights of the agent. Finally, to verify the logical rationality of the judgment matrix, the Consistency Ratio (CR) is checked, and the result must satisfy the criterion CR < 0.1.
A·W = λmax W
2.2.3. Synthesis of Subjective Weights Based on Game Theory
Game theory combinatorial weighting is a model used to describe multiple subjects cooperating to allocate resources under specific conditions, and the current research using game theory combinatorial weighting is mainly used when there is only a single subject and subjective and objective weighting are combined. In order to reflect the rights and interests between different agents, the cooperative game theory is applied, assuming that the government departments, ecological environment departments, local communities and construction enterprises form an alliance through cooperation, and the importance of each subject in the alliance is determined by its own independent weight and influence in the group, which is then calculated by using the Shapley value method of the cooperative game. The Shapley value is chosen because it provides a unique and strictly fair solution that satisfies the axioms of efficiency and symmetry, thereby ensuring the mathematical stability of the weight distribution among agents [39].
In order to calculate the integrated subjective weights, the cooperative utility function of each subject is established first:
where wg is the weight vector of the g-th stakeholder, S is the union of different agents, and all cases will be traversed in the calculation.
According to the cooperative utility function, the Shapley value formula is used to calculate the marginal contribution of each subject to the coalition as a whole, so as to determine its weight allocation in the cooperation. The Shapley value is calculated using Equation (6):
where N denotes the set of all subjects; S denotes a subset of subjects that does not contain g; |S| is the size of the set S (the number of subjects contained); v(S∪{g}) − v(S)) − v(S) denotes the marginal contribution of subject g to the subset S, i.e., the value of the increase in weight for the total weight after subject g joins the subset S.
The adoption of the Shapley value method provides a mathematically rigorous guarantee for the stability of the subjective weight distribution. Unlike arbitrary averaging or voting methods, the Shapley value is the unique solution that simultaneously satisfies the axioms of efficiency, symmetry, and linearity in cooperative game theory. This uniqueness implies that the derived weight vector represents a strict deterministic equilibrium rather than a stochastic result. By strictly calculating the average marginal contribution of each agent g to all possible coalitions S, the model ensures that the final weight allocation reflects the true “power index” of each stakeholder within the decision-making structure. Consequently, this allocation satisfies Coalitional Rationality, meaning that no individual agent or sub-coalition has a rational incentive to deviate from this cooperative solution to seek a higher payoff elsewhere. This mathematical property inherently immunizes the weight system against the bias of any single expert, ensuring that the final subjective weights are robust and structurally stable. Recent studies on complex engineering systems have also validated that this game-theoretic coordination mechanism significantly enhances the reliability and rationality of weight determination [40,41].
2.2.4. Subjective-Objective Combination Weighting
Subjective weights are mainly employed to integrate multi-agent demands via a cooperative game model described in Section 2.2.3. To enhance the rationality and objectivity of the weight distribution, it is essential to incorporate objective weights to achieve combination weighting [42]. The entropy weight method is chosen to calculate the objective weights in this study. In the stage of combination weighting, the subjective and objective weights should be aligned as closely as possible to minimize information loss, and this alignment is quantified by the Euclidean distance [43].
Let the subjective weight vector be denoted as Wsub = ()1×n, and the objective weight vector be denoted as Wobj = ()1×n, (j = 1, 2, …, n represents the indicator index, n = 18) The final combined weight vector W = (wj)1×n is defined as a linear combination of the two:
where α and β are the preference coefficients for the subjective and objective weights, respectively. To determine the optimal coefficients, an optimization model is constructed to minimize the deviation of Euclidean distances:
Wcom = αWsub + βWobj
Subject to the following constraints, which ensure the normalization of coefficients and weights:
From the mathematical analysis of the model, since the objective function F(α, β) represents a sum of squares, it is a quadratic function. Its Hessian matrix is positive definite, indicating that the function is strictly convex. Furthermore, the constraints (where the sum of coefficients equals 1 and coefficients are non-negative) define a standard simplex, which is geometrically a convex set. Since a convex function is minimized over a convex set, this problem constitutes a standard convex optimization problem. This mathematical property guarantees that a unique global optimal solution exists for the coefficients α and β, ensuring the stability and uniqueness of the final weight distribution results.
2.3. Stage-Aware Dynamic Weighting Mechanism
In order to achieve dynamic adjustment of weights in multi-stage and multi-indicator comprehensive evaluation, a dynamic weight model based on time change is constructed in this paper. The basic idea is that under the premise of setting a set of basic weights, combined with the trend of the importance of different indicators in each stage, the stage adjustment factor is introduced, so as to generate dynamic weights that evolve over time. The construction of the model is outlined in the steps below [30,31]:
For the index system (n = 18), according to the initial weight vector of each index obtained in Section 3.2, after which the whole engineering evaluation process is divided into a number of typical stages, which are noted as , where tk denotes the k-th time stage (k = 1, 2, 3), which is divided into: the dam site selection stage, the hub layout stage, and the detail optimization stage.
In the design process of the entire project, dam site selection, as the first and key decision-making stage, is directly related to the project’s site suitability, construction feasibility, and initial investment control. It also profoundly affects the subsequent hub layout, hydrological regulation capacity, and socio-spatial impact distribution. Therefore, it holds a decisive position in the evaluation system. During the hub layout stage, with the dam site already established, the evaluation shifts toward coordinating functional areas and enhancing overall efficiency. While engineering safety remains a fundamental prerequisite, greater emphasis is placed on functional integration and resource optimization. Eventually, in the detail optimization stage, the scheme framework is basically stable, the design focus shifts to the optimization of structural parameters, the construction organization is perfected and the economy is deepened, and the evaluation target focuses on the cost control, the operation efficiency and the ecological compensation, and strives to achieve the maximization of the engineering benefits on the basis of guaranteeing the function realization.
To capture this evolutionary trend mathematically, we introduce the Stage Relevance Degree (Rjk) to quantify the logical correlation between indicator j and k. Based on expert scoring, the indicator stage adjustment factor matrix θ = [θjk] is formalized in Equation (10):
where Rjk represents the relevance score of the j-th indicator in phase k, and the denominator denotes the average relevance of all indicators in that stage. Generally, a value of θjk > 1 indicates that acts as a dominant factor in the current stage, implying its weight should be amplified; conversely, θjk < 1 signifies a recessive factor, suggesting a reduction in weight importance; while θjk = 1 maintains the baseline importance.
Based on this adjustment factor, the dynamic weight expression for the j-th indicator in phase k is defined in Equation (11):
where denotes the dynamic weight value of the j-th indicator in phase k, denotes the initial combination weight of the j-th indicator (corresponding to the ‘Game theory combined weights’), p is a dummy variable for summation, n = 18 is the total number of indicators.
2.4. Evaluation Model Based on Dynamic Weight and Two-Dimensional Cloud Model
2.4.1. Cloud Model Building
Two-Dimensional Cloud Model represents an extension of the conventional One-Dimensional Cloud Model, designed to simultaneously characterize both the fuzziness and stochasticity inherent in the relationship between two correlated variables (indicators). Specifically, this approach enables the modeling and assessment of uncertainty in contexts involving dual indicators [24,25]. Two-Dimensional Cloud Model incorporates two numerical feature dimensions accompanied by a certainty degree measurement, where each fundamental unit (‘cloud droplet’) constitutes a three-element tuple:
where xq, yq denote the two-dimensional spatial coordinates; μq represents the membership grade (or certainty measure) quantifying the point’s belongingness to the target concept, q is the cloud droplet serial number, q = 1, 2, …, m, m is the total number of cloud droplets.
The entire Two-Dimensional Cloud Model is governed by three key parameters: Expectation, Entropy, and Hyper-entropy. Unlike the One-Dimensional Cloud Model, the Expectation in the model defines the ‘conceptual position’, the Entropy represents the ‘conceptual ambiguity degree’, and the Hyper-entropy encapsulates the ‘probabilistic fluctuation of the ambiguity degree’. These function parameters independently across two orthogonal dimensions, thereby facilitating the expansion of the concept from ‘a line’ to ‘a surface’. The specific characteristics are summarized and detailed in Table 3.
Table 3.
Two-dimensional cloud model characteristics.
Two-Dimensional Cloud Model generates a large number of ‘cloud droplets’ from known two-dimensional characteristic parameters (Ex, Ey, Enx, Eny, Hex, Hey) to characterize the uncertainty distribution of a specific concept within a numerical space. Typically, Hex = Hey, defining the standard cloud model. The specific procedure begins with initializing an empty set of cloud droplets:
For the q-th cloud droplet, the local entropy value is first sampled from the normal distribution of entropy:
Based on the local entropy value generated in the previous step, the position of the cloud droplet in the two-dimensional space is sampled from a two-dimensional normal distribution:
The position (xq, yq) quantifies the location of cloud droplet, forming a ‘sample’ within the two-dimensional conceptual space. The certainty degree μq representing the cloud droplet’s membership to the concept, is determined by the two-dimensional Gaussian function defined in Equation (16):
The generated value lies within the interval (0, 1]. A value closer to 1 signifies that the cloud droplet better conforms to the concept and is nearer to its ideal center. The produced ternary (xq, yq, μq) is incrementally added to the cloud droplet set C. This iterative process continues until a predetermined number of N cloud droplets are generated. Consequently, a two-dimensional cloud droplet set is formed, constituting a cloud map in a two-dimensional plane. This cloud map is characterized by a ‘center-boundary-ambiguity’ uncertainty distribution.
The backward cloud generator is designed to extract the Expectation (Ex), Entropy (En), and Hyper-entropy (He) of the cloud model corresponding to a specific category of samples from an existing dataset. These parameters characterize the distribution of fuzzy concepts for the samples and are calculated using Equation (17):
2.4.2. Standard Evaluation Cloud
In the comprehensive evaluation of multiple schemes using the Two-Dimensional Cloud Model, it is essential to establish a reference standard. To quantify how closely each evaluated object approximates the ‘ideal state’, a standard cloud map representing the idealized concept must be constructed first. This standard cloud map serves as the benchmark for the entire evaluation framework. Regarding engineering safety, geological samples collected through engineering exploration need to be normalized. Subsequently, the characteristic values of the cloud model are obtained via the backward cloud generator.
Regarding engineering benefits, the evaluation criteria are primarily qualitative and semi-quantitative, such as water landscape benefits, ecological benefits, and urban development support. Uniform data from objective monitoring is hard to obtain. Consequently, this paper employs a hybrid approach of expert scoring and classification for constructing the standard cloud model, as illustrated in Table 4. Specifically, it organizes numerous experts with extensive experience in engineering design, operation management, and watershed management. Based on the realistic performance range of each engineering benefit indicator and the engineering objectives’ requirements, these experts establish a qualitative rating system of 5 or 7 grades (e.g., ‘very good’, ‘good’, ‘fair’, etc.).
Table 4.
Classification standards and numerical characteristics of the evaluation cloud.
Each grade is allocated a corresponding subordinate score interval [Cmax, Cmax], To determine the specific numerical characteristics (Ex, En, He), we adopt the “3 En Rule” of the normal cloud model. This rule allows for the transformation of qualitative interval boundaries into quantitative cloud parameters [25,29]:
where Cmax and Cmax represent the upper and lower limits of the score interval for a specific grade. Cmax is the mathematical expectation, representing the center of the qualitative concept. En is the entropy, determined by the range coverage (6 En covers 99.7% of the interval). He is the hyper-entropy, reflecting the dispersion of the cloud drops; based on empirical calibration in engineering studies, we set the constant l = 0.05 to ensure a moderate degree of atomization.
Subsequently, the cloud model for each classification grade, referred to as the ‘standard evaluation cloud’, is generated as shown in Table 4.
2.4.3. Generation of Scheme Evaluation Cloud
To address the multi-stage evaluation requirements for multi-branch river hub layout schemes, a comprehensive evaluation framework based on the two-dimensional cloud model is established. We explicitly selected this two-dimensional topology to visually present the trade-off relationship (i.e., Pareto optimality) between the core conflicting objectives of “engineering safety” and “engineering benefits.”
Unlike three-dimensional models that often introduce a “detectability” dimension for hidden fault diagnosis [44] or characterize evolutionary processes through a third dimension [45], the key to hub layout optimization lies in the decision balance of explicit indicators rather than hazard detection. Furthermore, the temporal evolution characteristics are already internalized within the aforementioned dynamic weighting mechanism, avoiding dimensional redundancy.
To quantify the comprehensive status of schemes under uncertain conditions, we adopt the “Probability-Loss” paradigm commonly used in engineering risk assessment as the two fundamental evaluation dimensions [46,47]. However, considering that this study is a comprehensive evaluation and optimization of hub layout schemes, rather than a pure disaster assessment, we adapted the definitions of these dimensions based on the engineering attributes of the evaluation indicators: the ‘probability’ dimension (X-axis) aggregates engineering safety-related indicators, characterizing the likelihood of adverse events or stability risks arising from geological or environmental uncertainties. The ‘loss’ dimension (Y-axis) aggregates engineering benefit-related indicators. In this context, it measures the extent to which a scheme fails to meet expected functional, economic, or ecological targets, representing the potential “loss of utility” or consequence magnitude.
The normalized indicator data is weighted and calculated through dynamic weighting to yield the coordinate values for each scheme in the ‘probability-loss’ space, as defined in Equation (19), thereby constructing the scheme cloud droplet distribution. Using the standard evaluation cloud as a reference, membership degrees are calculated to achieve a risk-sensitive comprehensive evaluation.
where , represents the two-dimensional coordinate values of scheme h in stage k. The coordinate point (, ) constitutes the dynamic projection of scheme h in the ‘probability-loss’ space. ΓX and ΓY represent the indicator sets of the X-axis and Y-axis, respectively. represents the normalised score of the h-th scheme on the j-th indicator.
In this study, the data processing and weight calculations were implemented using Python (Version 3.8), and the cloud model figures were generated using MATLAB (Version R2021a, MathWorks, Natick, MA, USA).
3. Case Study: Results and Discussion
3.1. Project Overview
The Gan River and Fu River converge in Nanchang to form the Gan-fu tail reaches, which is the political, economic, and cultural center of Jiangxi Province, China. This area features relatively flat terrain, abundant resources, and convenient transportation. It is also the most economically developed and densely populated region in the province. The Ganjiang River serves as Nanchang’s urban water supply source and constitutes a vital part of the Yangtze River Golden Waterway. In recent years, however, altered flow and sediment dynamics, intensive sand mining, and a lack of regulatory infrastructure have significantly prolonged the dry season in the Gan-Fu tail reaches. This has led to a decline in water levels and a continuous deterioration of the ecological environment and water landscape. Subsequently, navigation conditions have worsened, which has severely restricted regional water supply security and urban development. Additionally, some river sections are experiencing severe bank erosion and instability, increasing the challenges of river management.
The Ganjiang Multi-Branch River Hub Project is the key control project to address the aforementioned issues, consisting of the Main branch, North branch, Central branch, and South branch. As shown in Figure 1, the dam site layout ranges of each hub cover the main diversion channels of the lower Gan River, corresponding to the Main (a), North (b), Central (c), and South (d) branches, respectively. This geographical layout forms the basis for the subsequent engineering geological assessment.
Figure 1.
Extent of multi-branch river hub layout. (a) Main branch; (b) North branch; (c) Central branch; (d) South branch.
Hydrologically, the project area has a developed water system. The hydrological characteristics are analyzed based on the long-term observation data (spanning 1953–2018) from the Waizhou Hydrological Station, which controls a catchment area of 80,948 km2 and serves as the primary control station for the Ganjiang mainstream. According to these statistically reliable records, the multi-year average flow of the Gan River basin is 2158 m3/s. The runoff distribution is uneven throughout the year, with the wet season (April to July) accounting for 58.59% of the annual runoff, while the average flow in the dry season (October to the following February) is only 993 m3/s. This significant seasonal difference places clear demands on the hub’s water level regulation capability and ecological flow guarantee during the dry period.
Geologically and tectonically, the project area belongs to the alluvial plain of the Gan-Fu tail reaches. It is situated within the Jiuling-Gaotai Mountain Poyang Depression and the Fengcheng-Leping Fault structural units. With a basic seismic intensity of Grade VI, the area demonstrates good tectonic stability, making it suitable for project construction. Regarding the engineering geological conditions, the four branches share a consistent geological genesis (Quaternary alluvial plain) and tectonic background. Although specific physical-mechanical parameters vary slightly across branches, the primary engineering geological problems (e.g., bank slope stability and seepage) remain consistent. Considering that the Main Branch project involves the highest navigation standard (3000-ton class) and the most complex construction requirements (involving deep foundation pit excavation), it represents the most critical and challenging geological scenario among the four branches. Therefore, the Main Branch is selected as the typical representative for detailed geological elaboration in this study to reflect the maximum risk boundary. The specific characteristics of bank slope structure, stratigraphic lithology, and rock-soil physical-mechanical properties are detailed in Table 5.
Table 5.
Summary of engineering geological characteristics for typical sections (Main branch).
Groundwater is dominated by Quaternary pore phreatic water and bedrock fissure water, which is closely hydraulically connected to the Gan River. It exhibits a confined state during the flood season, and some water bodies are corrosive to engineering structures, necessitating material compatibility assessments and anti-corrosion treatments. The hydrological conditions within the reservoir’s storage area remain largely controllable. The hub’s storage water level is generally maintained within the original river channel, avoiding extensive inundation. It only affects localized embankments and riverbanks, requiring focused attention on the stability of the embankment toe and the risk of bank collapse/reshaping.
3.2. Results and Discussion on Weight Distribution
3.2.1. Analysis of Multi-Agent Combination Weights
Based on the AHP and the Shapley value method, the game theory combined weights were calculated (Figure 2 and Table 6). As shown in Figure 2, the weight distribution curves of individual agents exhibit significant volatility and discrete characteristics, intuitively reflecting the differences in focus among different stakeholders in engineering evaluation.
Figure 2.
Weight distribution of indicators.
Table 6.
Weight distribution comparison: agent-specific combined weights vs. game theory combined weights.
Government construction departments exhibit a balance between safety and benefits, assigning higher weights to bank slope lithology (S5) and cohesion of rock-soil layers (S7) (0.0737). Notably, the weight for navigation benefits (E5) reaches the highest value for this agent (0.0842), reflecting an orientation that balances engineering safety with public functions. Ecological environment departments present a distinct ecological orientation. Their weight for water ecology benefits (E6) is as high as 0.1967, forming a significant “peak.” In the safety dimension, their focus is also concentrated on the width of beach outside the embankment (S6, 0.1148), which involves ecological disturbance. Local communities, as direct beneficiaries, focus on the living environment and immediate interests, assigning the highest weights to water landscape benefits (E4) and urban benefits (E7, 0.0976), and are highly sensitive to inundated area (S1, 0.0732). Construction enterprises prioritize economic and technical feasibility. Their weights peak at unit project construction cost (E3, 0.1148) and dry density (S11, 0.0984), while showing extremely low concern for water ecology benefits (E6, 0.0164). This significant dispersion in weights indicates that evaluation from a single perspective struggles to account for multi-dimensional objectives, easily leading to one-sided decision-making.
To rigorously quantify the degree of divergence in stakeholder focus, we calculated the Standard Deviation (SD) and Coefficient of Variation (CV) for the subjective weights of all 18 indicators. The statistical results highlight a distinct structure of “Conflict vs. Consensus.” On the one hand, economic and ecological indicators exhibit high volatility. For instance, water ecology benefits (E6) show the most significant divergence (CV reaches 120.39%), quantitatively confirming the sharp contrast described above between the Ecological Environment Department’s rigid requirement (0.1967) and the Construction Enterprise’s low prioritization (0.0164). Similarly, unit project construction cost (E3) displays a high dispersion (CV = 102.41%), reflecting the Construction Enterprise’s extreme sensitivity (0.1148) compared to the indifference of local communities (0.0122). On the other hand, safety constraints demonstrate strong consensus. Indicators such as lithological composition (S3) and slope reclamation type (S4) maintain relatively low CV values (approximately 28.79% and 19.57%, respectively), indicating that regardless of their role, all agents consistently view geological stability as a non-negotiable baseline. This statistical evidence necessitates a weighting method capable of reconciling such structural heterogeneity.
In contrast, as shown by the red curve in Figure 2, the distribution of game theory combined weights is flatter and more convergent. Its fluctuation amplitude is significantly smaller than that of the single-agent curves, falling generally between the weights of individual agents and those derived from the entropy weight method. This reflects a deep coordination and integration of multi-party interests.
Among the safety indicators, the core structural indicators such as lithological composition (S3, 0.0659), slope reconstruction type (S4, 0.0624) and dry density (S11, 0.0607) are at the top of the fusion weights, indicating that they are regarded as hard constraints on the safety of the project under the consensus of many parties. Meanwhile, the inundated area (S1, 0.060) and the width of the beach outside the embankment (S6, 0.0645) are also given high weights, which indicated the effective expression of ecological and community concerns. Among the benefit indicators, the social return on investment (E2, 0.0687), water landscape benefits (E4, 0.0569) and engineering investment cost (E1, 0.0564) were given relatively high weights, demonstrating a synergistic distribution pattern of ‘macro benefit-ecological improvement-cost control’. In contrast, the combination weights of water ecological benefits (E6, 0.0525) and urban benefits (E7, 0.0449) were slightly moderate, indicating that although this type of indicator is important, it is easy to be compressed in the game of multiple interests.
In summary, the game theory combined weighting method demonstrates significant mathematical robustness in handling these conflicts. Despite the extreme statistical divergence observed in indicators like E6 (CV > 120%), the model effectively coordinates the conflicting demands to stabilize its final Game Theory Combined Weight at a rational equilibrium (0.0525). This result integrates the “strong signal” from the ecological expert without allowing it to skew the overall system, proving that the model is not overly sensitive to single-agent biases. Consequently, the game theory combined weights reflect a weighted equilibrium result after the coordination of multi-party games, providing a unified, robust, and strictly fair input basis for the subsequent comprehensive evaluation and the quantitative analysis of the cloud model.
3.2.2. Evolution Analysis of Stage-Based Dynamic Weights
The multi-stage evaluation model based on dynamic weights involves a three-step process for weight calculation. First, the “Universal Standard Weights” are adopted directly from the Game Theory Combined Weights (wj) calculated in Section 3.2.1, serving as the foundational baseline for the importance of each indicator.
Second, combining the characteristics of different stages of the project, the Analytic Hierarchy Process (AHP) is used to calculate the engineering standard weights and normalise them, reflecting the key focus of that stage. In the dam site selection stage, the dam’s location fundamentally determines the project’s investment scale, resettlement scope, and hydrological regulation capacity. Therefore, indicators related to geological topography and social costs are naturally assigned higher weights. This priority is substantiated by the data in Table 7: the engineering standard weight (probability dimension) for the geological safety indicator S10 (Hydraulic conductivity) surges to 0.0764, significantly exceeding its universal baseline of 0.0453. This indicates that controlling seepage risk is the non-negotiable prerequisite during initial site selection. Conversely, the weight for the economic indicator E1 (Engineering investment cost) is compressed to 0.0372 (lower than its universal value of 0.0564), reflecting that at this nascent stage, cost control is subordinate to the rigid constraints of engineering safety and topographic adaptability. As the engineering scheme deepens, the focus of evaluation is gradually shifting from macro-site selection to functional refinement and ecological synergy. Consequently, the weights of indicators related to later-stage designs—such as water landscape and navigation functions—progressively rise. This shift demonstrates the model’s sensitive response to “temporal dominance” in decision-making.
Table 7.
Dynamic weights (the dam site selection stage).
Finally, the relative importance adjustment factor θjk is introduced to dynamically adjust the engineering standard weights based on the variability of data across stages, resulting in dynamic weights. Taking indicator S2 (Overburden thickness) as a prime example, due to the high geological uncertainty in the early phase, its dynamic weights (probability dimension) for the dam site selection (Table 7), hub layout (Table 8), and detail optimization (Table 9) stages are 0.1486, 0.1435, and 0.1333, respectively. This decreasing trend aligns with the evolutionary law of geotechnical risks: as exploration precision improves from macro-scale to micro-scale, the uncertainty of geological parameters is effectively reduced. Crucially, this weight reduction is not a passive artifact of mathematical normalization (i.e., being diluted by other indicators), but an active response to the changing “risk exposure.” It reflects the proposed model’s adaptability to complex geotechnical environments—dynamically reducing the influence of geological factors as they transition from dominant “veto constraints” in the early stage to solvable “technical parameters” later on. In stark contrast, the dynamic weight of indicator E5 (Navigation benefits) exhibits a continuous upward trajectory, climbing from 0.0703 in the first stage (Table 7) to 0.0844 in the third stage (Table 9). This “scissors difference” phenomenon (one falling, one rising) quantitatively illustrates the logical shift in engineering decision-making: moving from “strictly avoiding geological risks” to “maximizing comprehensive functional benefits.”
Table 8.
Dynamic weights (the hub layout stage).
Table 9.
Dynamic weights (the detail optimization stage).
The cross-stage comparison also reveals a dialectical consistency between “Static Indicator Values” and “Dynamic Weights.” As observed in Table 7, Table 8 and Table 9, while the physical indicator values (e.g., lithological composition S3) remain constant due to their objective constitutive nature, their weights fluctuate significantly. This design effectively captures the impact of the evolutionary laws of parameters under specific environmental conditions. It implies that while the physical state of the rock and soil is objective and static, its decision significance evolves according to the specific engineering goals of each stage (e.g., shifting from a safety barrier in site selection to a cost variable in optimization). By decoupling physical values from their weights, the model ensures theoretical inclusivity and accurately models the dynamic interaction between the project and its changing environment.
Based on this dynamic logic, this ‘Universal baseline—Stage adjustment—Dynamic correction’ calculation method not only captures the dynamic evolution of safety, functionality, and economic weightings across stages but also ensures the rationality and scientific rigor of weight allocation. Aligning with the practical logic of engineering design, provides precise, stage-specific weighting inputs for the comprehensive evaluation of the subsequent two-dimensional cloud model.
3.3. Evaluation Results and Discussion of Cloud Characteristic Values
By calculating cloud parameters for each indicator in stages through the backward cloud model, and combining the dynamic weights of the indicators with their cloud characteristic values, the eigenvalues of the criterion layer (Probability Cloud and Loss Cloud) are obtained. Similarly, the comprehensive evaluation cloud eigenvalues are synthesized. To demonstrate the calculation process of the cloud model and the evolutionary laws across different stages, the 40 m Sluice Gate Net Width scheme of the Central Branch was selected for detailed analysis. This scheme serves as a calculation example to illustrate the evaluation mechanism.
The calculated results for the three stages are summarized in Table 10, Table 11 and Table 12. These quantitative results provide a multi-dimensional perspective on the project’s evolution: the weights reflect the input decision preferences, the Expectation (Ex) reflects the central level of risk or benefit, the Entropy (En) reveals the uncertainty of geological or design conditions at that stage, and the Hyper-entropy (He) quantifies the dispersion of this uncertainty.
Table 10.
Evaluation cloud feature values (the dam site selection stage).
Table 11.
Evaluation cloud feature values (the hub layout stage).
Table 12.
Evaluation cloud feature values (the detail optimization stage).
In the dam site selection stage (Table 10), the probability dimension (Ex, En, He) of the comprehensive evaluation cloud was (4.3911, 0.1757, 0.0578), and the loss dimension was (3.8711, 0.1596, 0.0632), indicating a high level of engineering risk and significant geological uncertainty, which is consistent with the characteristics of the reconnaissance phase where data is often limited. These numerical characteristics intuitively reveal the high-risk, high-uncertainty decision-making environment of this phase. From the perspective of the criterion layer, the Engineering Safety (S) dimension occupies a predominant position. Its internal key indicators, particularly the Inundated Area (S1), exhibit pronounced risk characteristics (Ex = 9.40) combined with substantial weight. This data combination of “high weight and high risk value” quantifies the “rigid constraint” nature of the dam site selection stage: geological and social constraints, such as inundation losses, serve as decisive exclusionary criteria that must be prioritized.
Furthermore, the relatively high hyper-entropy objectively reflects the limitations and discreteness of early survey data, alerting decision-makers to maintain high vigilance regarding latent geological risks and to strictly adhere to risk avoidance principles.
Entering the hub layout stage (Table 11), the evaluation data exhibits a critical transition from “passive risk avoidance” to “active functional coordination.” The Expectation (Ex) of the comprehensive probability cloud decreased to 4.2646, while that of the benefit cloud increased, indicating that the scheme is moving closer to a better state. From the perspective of the criterion layer, while the weight of the Engineering Safety (S) dimension is adjusted down to 0.6488, its Cloud Expectation improves (decreases) from 5.3901 in the first stage to 5.2129. Simultaneously, the weight of the Engineering Benefits (E) criterion climbs to 0.3512, and its corresponding Cloud Expectation rises slightly to 2.5129. The shift in the expectation value of the Engineering Benefit criterion reflects the need to seek a balance between functional layout and economic benefits while ensuring safety at this stage. This trend in data suggests that the focus of engineering evaluation is gradually shifting from single-dimensional risk control to multi-dimensional comprehensive coordination. In addition, Hyper entropy (He) decreased compared to the previous stage, indicating that the randomness of the design scheme in this stage has slightly decreased, but the impact of construction disturbances on safety still needs to be considered.
In the detailed optimization stage (Table 12), the evaluation results achieve a stable state of “risk convergence and benefit maximization.” The Expectation (Ex) of the comprehensive evaluation Cloud is further optimized to 4.0693, representing the lowest comprehensive risk level across the entire lifecycle.
At this point, the weight of the Engineering Benefit (E) dimension peaks at 0.3930, with its Cloud Expectation adjusted to 2.8195. Although the benefit dimension assumes greater weight pressure, the Ex of the Engineering Safety (S) dimension significantly drops to 4.8786. This robust safety optimization offsets the potential fluctuations introduced by the pursuit of benefits, driving the overall improvement of the evaluation results. Furthermore, the hyper-entropy (He) of the comprehensive cloud converges from 0.0578 in the initial stage to 0.0513 in this stage. This continuous decline provides mathematical proof that as refined design is implemented, the uncertainty of geological and environmental conditions is substantially eliminated, and the engineering system enters a highly predictable, low-dispersion stable period.
A deeper examination reveals that the optimization of the comprehensive cloud features is directly driven by the evolutionary shift in geotechnical evaluation logic. In the macro-site selection stage, geological parameters act as “qualitative safety barriers”. The high uncertainty of micro-mechanical parameters (e.g., S7 and S10) necessitates higher attention weights, which significantly elevates the comprehensive Hyper-entropy (He = 0.0578). As the design deepens, the evaluation transitions to the “quantitative control of micro-mechanical parameters”. The active reduction in the weights of these now-controllable uncertainties effectively suppresses the transmission of geological fuzziness. This mechanism physically explains the convergence of the comprehensive cloud to a stable, low-dispersion state (He = 0.0513) in the final stage.
Through the analysis of the cloud parameters at each stage and comparison with the standard cloud, it can be seen that the dam site selection stage mainly focused on safety indicators, the hub layout stage gradually added economic indicators to balance safety and benefits, and the detailed optimization stage further achieves risk control and improved the comprehensive benefits of the project through optimized management. The changes in cloud parameters at each stage effectively reflect the emphasis placed on uncertainty, functional optimization, and risk control during project implementation, embodying the evolutionary path of hydropower engineering design: “Safety First—Efficiency Enhancement—Dual-Objective Coordination.”
3.4. Program Preferences and Comparative Discussion
The Ganjiang Multi-Branch River Hub Project comprises four distinct branches: the Main, North, Central, and South branches. To achieve functional synergy in flood control, navigation, and ecology, each branch involves specific layout contents based on its geographical characteristics (detailed in Table 13). Specifically, the Main, South, and Central branches all cover four core contents: dam site, ship lock layout, sluice gate layout, and sluice gate net width. The North Branch covers three contents: dam site, sluice gate layout, and net width.
Table 13.
Layout schemes of the Ganjiang multi-branch river hub project.
To facilitate subsequent quantitative analysis and graphical presentation, a unified coding system (Format: Branch-Content Abbreviation-Sequence, e.g., MDS-1) is established in Table 13. These codes are consistently applied throughout the cloud model evaluation and final scheme comparison.
From the comprehensive list in Table 13, ten representative schemes covering the core layout contents of each branch were selected for detailed cloud model evaluation. These schemes are typical in engineering design, and their quantitative assessment is critical for validating the model’s effectiveness and determining the optimal combination. The calculated membership degrees for these specific schemes across the three stages are visualized in Figure 3, Figure 4 and Figure 5.
Figure 3.
Distribution of membership degrees for representative schemes in the dam site selection stage.
Figure 4.
Distribution of membership degrees for representative schemes in the hub layout stage.
Figure 5.
Distribution of membership degrees for representative schemes in the detailed optimization stage.
In these figures, the horizontal axis represents the codes of the comparative schemes (as defined in Table 13), while the vertical axis quantifies the membership degree (ranging from 0 to 1). Following the “Maximum Membership Principle,” the level associated with the peak membership value is identified as the scheme’s definitive evaluation grade. Furthermore, to fully reflect comprehensive performance, each scheme is evaluated independently along two dimensions: “Engineering Safety (S)” and “Engineering Benefits (E).”
The calculation results reveal distinct performance differences among the schemes. Taking the Central Branch ship lock layout as an example, the Left Bank Ship Lock (CSL-1) consistently exhibits superior safety performance across all stages, with its Level I membership degree in the hub layout stage reaching 0.981. In contrast, the Right Bank Ship Lock (CSL-2) shows significantly lower safety membership values (e.g., 0.488 in the same stage), quantitatively indicating higher potential geological or construction risks associated with the right bank. Similarly, the South Branch Lower Gate Site (SDS-2) demonstrates exceptional stability, with its safety and benefit membership degrees maintaining high values (above 0.90) throughout the evaluation process. Additionally, schemes such as the Main Branch Upper Gate Site (MDS-1) show a steady improvement in their evaluation grades as the design depth increases, validating the effectiveness of the optimization process.
From a holistic perspective, across the three stages, the majority of the scheme’s safety and benefit indicators achieve the highest membership degree in Level I. This indicates that the design scheme largely fulfills the evaluation requirements. The membership degrees for Levels IV and V are low, with all schemes showing values below 0.2, and some even at 0, suggesting a low probability of risk or negative impacts. Overall, the optimal scheme’s indicators predominantly align with Level I. Notably, the evaluation indices fluctuate across stages. The dam site selection and hub layout stages prioritize engineering safety, while the detailed optimization stage places greater emphasis on engineering benefits.
Based on the cloud model evaluation results mentioned above, a quantitative comparison was conducted for the key representative layout schemes under each branch. Table 14 presents the detailed comparison of these schemes in the dimensions of Engineering Safety (S) and Engineering Benefits (E). The scheme with the higher comprehensive membership degree is determined as the preferred scheme for that specific layout content.
Table 14.
Comparison and selection of representative layout schemes.
As indicated by the comparison results in Table 14, the preferred schemes (e.g., MDS-2, CSL-1, SDS-2) achieve a superior balance between safety and benefits, demonstrating significant quantitative superiority that reflects clear scheme dominance rather than marginal numerical variance. For instance, the preferred South Branch Dam Site scheme (SDS-2) achieves a 46.0% increase in safety and a 49.2% increase in benefits compared to the eliminated SDS-1. From a macro perspective, this disparity primarily stems from the schemes’ adaptability to the geological environment: The preferred schemes typically adopt layouts that avoid weak foundations or complex flow conditions (e.g., the Central Branch Left Bank Ship Lock CSL-1, which exhibits a 32.4% higher safety membership than CSL-2), thereby establishing a solid safety foundation. On this basis, the functional potential of the project is further unleashed through the optimization of aperture sizes or gate types (e.g., the South Branch SGL-1). In contrast, the eliminated schemes often suffer from low safety scores due to “rigid geological constraints” or insufficient benefit scores caused by disproportionate investment-to-output ratios (e.g., the Main Branch Sluice Gate Net Width MGW-1, whose benefit score is 33.7% lower than the preferred MGW-2).
Combining all the preferred schemes constitutes the “Integrated Optimal Scheme” for this project. To validate its holistic performance under uncertainty, the three-dimensional (3D) comprehensive evaluation cloud maps and their corresponding top views were generated for the three stages (Figure 6, Figure 7 and Figure 8).
Figure 6.
Three-dimensional comprehensive evaluation cloud map and its top view projection for the dam site selection stage.
Figure 7.
Three-dimensional comprehensive evaluation cloud map and its top view projection for the hub layout stage.
Figure 8.
Three-dimensional comprehensive evaluation cloud map and its top view projection for the Detailed Optimization Stage.
In the 3D view, the X-axis represents the Probability Dimension (Safety Risk), the Y-axis represents the Loss Dimension (Benefit Loss), and the Z-axis represents the Membership Degree (0–1). The top view is the projection of these cloud droplets onto the “Probability-Loss” plane. The five colored background clouds correspond to the standard classification levels defined in Table 4 (Levels I to V), while the dense, dark cluster of cloud droplets represents the evaluation result of the optimal scheme.
On the evolutionary trajectory, the migration path of the evaluation cloud’s centroid is clearly observable from the top view projection. In the dam site selection stage (Figure 6), the expectation value (Ex) of the comprehensive cloud is approximately 2.30, with cloud droplets distributed mainly at the intersection of Level II (Good) and Level I (Excellent), reflecting the complexity of the initial environment. Moving into the hub layout stage (Figure 7), the cloud centroid shifts to Ex ≈ 1.75, largely entering the Level I region. Finally, in the detailed optimization stage (Figure 8), the expectation value is optimized to Ex ≈ 1.25, achieving a reduction of approximately 45.7% across the evolutionary trajectory and closely approaching the ideal center of Level I (1.0). This quantitative convergence clearly indicates that the scheme has achieved a superior state.
Beyond the positional shift, the dispersion of cloud droplets (controlled by Entropy En and Hyper-entropy He) exhibits significant convergence characteristics in the 3D space. The cloud droplets in Figure 6 are relatively scattered with a broader peak along the Z-axis, indicating initial uncertainty. In contrast, the droplets in Figure 8 exhibit high cohesion and peak characteristics, mathematically proving the elimination of systemic uncertainty.
In summary, the cloud maps visually validate the effectiveness of the “Safety First—Efficiency Enhancement—Dual-Objective Coordination” path, demonstrating that the final scheme successfully transitioned from “Risk Control” to “Benefit Maximization.”
Furthermore, compared to traditional multi-criteria decision-making methods (such as TOPSIS or VIKOR), the proposed evaluation framework demonstrates significant methodological advantages in complex hydraulic engineering. Traditional methods typically rely on the mere weighted summation of static parameters, which fails to capture the dynamic interaction between the project and its geological context. In contrast, the proposed model highlights a profound inclusivity regarding complex geotechnical environments. By coupling stage-aware dynamic weights with the two-dimensional cloud model, it not only handles the fuzziness of indicator boundaries but also effectively accounts for the impact of the evolutionary laws of parameters (e.g., the transition of geological risks from veto constraints to solvable costs) under specific environmental conditions on the final evaluation results. While TOPSIS only provides a rigid distance score, the cloud map intuitively visualizes the spatial distribution of uncertainty via Entropy and Hyper-entropy, providing decision-makers with a robust, transparent, and stage-aware theoretical basis.
4. Conclusions
This study established a comprehensive evaluation framework for optimizing multi-branch river hub layouts by integrating a dynamic weighting mechanism with a two-dimensional cloud model. By applying this framework to the Ganjiang River Hub Project, the study successfully quantified the uncertainty risks and benefit losses of different schemes. The main conclusions and scientific contributions are summarized as follows:
- The empirical application verified a distinct evolutionary path in engineering decision-making priorities. The evaluation results quantitatively revealed a transition from “Safety First” (dominated by geological constraints) in the dam site selection stage to “Efficiency Enhancement” in the hub layout stage, and finally achieved “Dual-Objective Coordination” in the detailed optimization stage. The cloud model data showed that as the design deepened, the hyper-entropy (He) of the schemes gradually converged, indicating that the uncertainty of the engineering system was effectively controlled. The optimal schemes identified (e.g., MDS-2 and CSL-1) demonstrated robust adaptability to complex flow conditions while maximizing comprehensive benefits.
- The proposed framework overcame the limitations of static weighting and deterministic evaluation in traditional hydraulic planning. By employing a multi-agent game theory combination weighting approach, the method scientifically reconciled the conflicting interests of four distinct stakeholders: government construction departments, ecological environment departments, local communities, and construction enterprises. Furthermore, the stage-aware dynamic mechanism effectively captured the “temporal dominance” of indicators, resolving the issue where traditional methods fail to reflect the shifting importance of safety versus benefits across the project lifecycle.
- The two-dimensional cloud model, constructed under the “Probability-Loss” paradigm, provided a visual quantitative tool for decision-making under uncertainty. It successfully characterized the vagueness and randomness inherent in geological and environmental indicators. Unlike conventional single-dimensional assessments, this approach explicitly mapped the trade-off relationship between engineering risks and utility losses, providing a more rigorous theoretical basis for identifying high-quality schemes that are “risk-averse and benefit-preferred.”
Regarding the generalizability of the proposed framework, it establishes a highly adaptable methodological paradigm for complex hydraulic engineering projects characterized by multi-stage decision-making, multi-agent conflicts, and high uncertainty. The core evaluation engine—integrating game theory-based combination weighting, stage-aware dynamic mechanisms, and the two-dimensional cloud model—exhibits strict structural invariance and conceptual universality. When transferring this framework to other complex layouts (e.g., large-scale high dams or cross-basin water diversions), successful application does not necessitate algorithmic redesign but relies on targeted contextual calibration. Specifically, this transferability is predicated on two fundamental methodological conditions. First, the evaluation boundary must be topologically reconstructed; the baseline indicator system should be flexibly tailored to capture the unique geological, ecological, and socio-economic hazard drivers of the new environment. Second, the temporal boundaries of the stage-aware mechanism must be precisely aligned with the actual exploration and design lifecycle of the target project, ensuring that the dynamic adjustment factors accurately reflect shifting engineering priorities. This structural flexibility ensures that the proposed method transcends a specific case study, providing a robust, project-specific decision-support paradigm.
Future efforts should address the following key areas to enhance the practical application of this method. First, the current reliance on static survey data should be upgraded by integrating real-time hydrological monitoring and digital twin technology. This integration would enable dynamic updating of cloud model parameters, making the evaluation responsive to real-time environmental changes. Second, the stakeholder framework could be expanded to include transboundary water governance bodies. This extension would improve the methodology’s applicability to large-scale infrastructure projects involving cross-regional coordination. Finally, building upon the environmental dynamic adaptability discussed earlier, future research should integrate advanced data-driven methods such as machine learning and deep learning algorithms. These algorithms are essential for the precise prediction of key geotechnical constitutive parameters including shear strength and permeability under complex environmental coupling effects. By utilizing these predictive models to continuously optimize the physical inputs of the two-dimensional cloud model, the evaluation framework’s accuracy, real-time responsiveness, and resilience to environmental degradation can be fundamentally enhanced.
Author Contributions
Conceptualization, X.H. and X.G.; methodology, X.H. and Z.Y.; software, F.W. and Y.X.; validation, X.G. and Z.Y.; formal analysis, X.G. and Y.X.; investigation, F.W. and Y.X.; resources, X.G. and Z.Y.; data curation, F.W. and Y.X.; writing—original draft, X.H.; writing—review and editing, X.H. and X.G.; visualization, Y.X.; supervision, X.H.; project administration, X.H.; funding acquisition, X.H., F.W. and Z.Y. All authors have read and agreed to the published version of the manuscript.
Funding
This research was funded by the National Key Research and Development Program of China (2023YFC3209005), and the Research Project on the Comprehensive Improvement of the Lower Reaches of the Ganjiang River (824103416).
Institutional Review Board Statement
Not applicable.
Informed Consent Statement
Not applicable.
Data Availability Statement
The original contributions presented in the study are included in the article, further inquiries can be directed to the corresponding authors.
Acknowledgments
We wish to express our gratitude to all the authors of this study, and all provided useful feedback on our manuscript.
Conflicts of Interest
Authors Fagen Weng and Zhihua Yang were employed by China Railway Water Resources and Hydropower Planning and Design Group. The remaining authors declare that the research was conducted in the absence of any commercial or financial relationships that could be construed as a potential conflict of interest.
References
- Bi, Y.; Zheng, L.; Wang, Y.; Li, J.; Yang, H.; Zhang, B. Coupling relationship between urbanization and water-related ecosystem services in China’s Yangtze River economic Belt and its socio-ecological driving forces: A county-level perspective. Ecol. Indic. 2023, 146, 109871. [Google Scholar] [CrossRef] [Scilit]
- Terui, A.; Ishiyama, N.; Urabe, H.; Ono, S.; Finlay, J.C.; Nakamura, F. Metapopulation stability in branching river networks. Proc. Natl. Acad. Sci. USA 2018, 115, E5963. [Google Scholar] [CrossRef] [Scilit]
- Yao, J.; Mo, F.; Zhai, H.; Sun, S.; Feger, K.-H.; Zhang, L.; Zhu, H. A spatio-temporal prediction model theory based on deep learning to evaluate the ecological changes of the largest reservoir in North China from 1985 to 2021. Ecol. Indic. 2022, 145, 109618. [Google Scholar] [CrossRef] [Scilit]
- Córdoba, A.T.; Gata, P.M.; Reina, D.G. Optimizing the layout of run-of-river powerplants using cubic hermite splines and genetic algorithms. Appl. Sci. 2022, 12, 8133. [Google Scholar] [CrossRef] [Scilit]
- Schmitt, R.; Bizzi, S.; Castelletti, A.; Opperman, J.; Kondolf, G. Planning dam portfolios for low sediment trapping shows limits for sustainable hydropower in the Mekong. Sci. Adv. 2019, 5, eaaw2175. [Google Scholar] [CrossRef] [Scilit] [PubMed]
- Navarro, I.J.; Villalba, I.; Lozano-Bellver, Y.; Alcalá, J. Social life cycle assessment of railway track substructure alternatives. J. Clean. Prod. 2024, 450, 142008. [Google Scholar] [CrossRef] [Scilit]
- Qu, S.; Chen, H.; Shen, Z.; Ma, H. The performance evaluation of management mode of small water resources projects. PLoS ONE 2023, 18, e0282357. [Google Scholar] [CrossRef] [Scilit]
- Tan, L.; Qiu, X.; Wang, C.; Sun, Z.; Hou, X.; Qiao, J.; Yang, C.; Xin, J. A comprehensive model for assessing water engineering facilities heritage in grand canal’s huitong river during the ming and qing dynasties. Sci. Rep. 2025, 15, 3436. [Google Scholar] [CrossRef] [Scilit]
- Liu, B.; Wang, Y.; Xia, J.; Quan, J.; Wang, J. Optimal water resources operation for rivers-connected lake under uncertainty. J. Hydrol. 2021, 595, 125863. [Google Scholar] [CrossRef] [Scilit]
- Hussainzada, W.; Cabrera, J.S.; Samim, A.T.; Lee, H.S. Water resource management for improved crop cultivation and productivity with hydraulic engineering solution in arid northern Afghanistan. Appl. Water Sci. 2023, 13, 41. [Google Scholar] [CrossRef] [Scilit]
- Hassan, W.H.; Mahdi, K.; Kadhim, Z.K. GIS-based multi-criteria decision making for identifying rainwater harvesting sites. Appl. Water Sci. 2025, 15, 45. [Google Scholar] [CrossRef] [Scilit]
- Abdi-Dehkordi, M.; Bozorg-Haddad, O.; Chu, X. Development of a combined index to evaluate sustainability of water resources systems. Water Resour. Manag. 2021, 35, 2965–2985. [Google Scholar] [CrossRef] [Scilit]
- Bouramdane, A. Optimal water management strategies: Paving the way for sustainability in smart cities. Smart Cities 2023, 6, 2849–2882. [Google Scholar] [CrossRef] [Scilit]
- Zhou, Y.; Tao, W.; Song, M. Regional water resource security in China based on a new fuzzy method with combination weighting. Int. J. Fuzzy Syst. 2022, 24, 3584–3601. [Google Scholar] [CrossRef] [Scilit]
- Thomas, J.; Baker, N.; Malisani, P.; Quaeghebeur, E.; Perez-Moreno, S.; Jasa, J.; Bay, C.; Tilli, F.; Bieniek, D.; Robinson, N.; et al. A comparison of eight optimization methods applied to a wind farm layout optimization problem. Wind Energy Sci. 2023, 8, 865–891. [Google Scholar] [CrossRef] [Scilit]
- Uribe, N.R.; Herrán, A.; Colmenar, J.M. A GRASP method for the bi-objective multiple row equal facility layout problem. Appl. Soft Comput. 2024, 163, 111897. [Google Scholar] [CrossRef] [Scilit]
- Wang, W.; Guo, X.; Cao, Q.; Tang, A. A stakeholder perspective on social stability risk of public–private partnerships project for water environmental governance in China: A social network analysis. Front. Ecol. Evol. 2023, 10, 1022383. [Google Scholar] [CrossRef] [Scilit]
- Goodwin, D.; Raffin, M.; Jeffrey, P.; Smith, H. Stakeholder evaluations of risk interventions for non-potable recycled water schemes: A case study. Sci. Total Environ. 2019, 674, 439–450. [Google Scholar] [CrossRef] [Scilit]
- Liu, Y.; Eckert, C.M.; Earl, C. A review of fuzzy AHP methods for decision-making with subjective judgements. Expert Syst. Appl. 2020, 161, 113738. [Google Scholar] [CrossRef] [Scilit]
- Zhong, C.; Yang, Q.; Liang, J.; Ma, H. Fuzzy comprehensive evaluation with AHP and entropy methods and health risk assessment of groundwater in Yinchuan Basin, northwest China. Environ. Res. 2022, 204, 111956. [Google Scholar] [CrossRef] [Scilit]
- Cui, B.; Ma, J.; Hao, X.; Liu, L.; Si, Y.; Xiao, M. A study on the construction and application of the evaluation index system for the water conservancy photography creation base. Water Policy 2021, 23, 1489–1505. [Google Scholar] [CrossRef] [Scilit]
- Surachman, E.; Perwitasari, S.; Suhendra, M. Stakeholder management mapping to improve public-private partnership success in emerging country water projects: Indonesia’s experience. Util. Policy 2022, 78, 101411. [Google Scholar] [CrossRef] [Scilit]
- Zhu, Q.; Fang, G. Evaluation index system for positive operation of water conservancy projects. Water Sci. Eng. 2009, 2, 110–117. [Google Scholar] [CrossRef]
- Yang, Z.; Huang, X.; Fang, G.; Ye, J.; Lu, C. Benefit evaluation of east route project of south to north water transfer based on trapezoid cloud model. Agric. Water Manag. 2021, 254, 106960. [Google Scholar] [CrossRef] [Scilit]
- Li, Q.; Wang, Z.; Lu, L.; Ma, Q. Construction risk evaluation of poor geological channels based on Cloud model-improved AHP–Matter–Element theory. Sustainability 2021, 13, 9632. [Google Scholar] [CrossRef] [Scilit]
- Qian, J.; Xue, F.; Wang, T.; Lin, Z.; Cai, M.; Shou, F. Combining SfM and deep learning to construct 3D point cloud models of shield tunnels and realize spatial localization of water leakages. Measurement 2025, 250, 117114. [Google Scholar] [CrossRef] [Scilit]
- Huang, J.; Xie, J.; Ren, H. Research on safety risk evaluation system for seepage in ship lock foundation pit engineering. Buildings 2024, 14, 2972. [Google Scholar] [CrossRef] [Scilit]
- Tan, M.; Yang, Y.; Bian, L.; Zhang, J.; Ohno, S. Safe operation plan for high-speed rail based on dynamical prediction model of short-term rainfall. KSCE J. Civ. Eng. 2025, 29, 100058. [Google Scholar] [CrossRef] [Scilit]
- Zhang, B.; Xu, L.; Shu, H.; Gao, S.; Li, M.; Ma, Z.; Xu, K. A cloud model-based optimal combined weighting framework for the comprehensive reliability evaluation of power systems with high penetration of renewable energies. Sustainability 2025, 17, 2273. [Google Scholar] [CrossRef] [Scilit]
- Miao, Y.; Liu, Z.; Zheng, X.; Chen, X.; Wang, X.; Zeng, Y. An improved water yield evaluation method based on partition variable-weight theory. Water 2025, 17, 486. [Google Scholar] [CrossRef] [Scilit]
- Zhou, W.; Abdullah, A.; Xu, X. Safety risk assessment of deep excavation for metro stations using the second improved CRITIC cloud model. Buildings 2025, 15, 1342. [Google Scholar] [CrossRef] [Scilit]
- Zhao, Y.; Liu, H.; Qu, W.; Luan, P.; Sun, J. Research on geological safety evaluation index systems and methods for assessing underground space in coastal bedrock cities based on a back-propagation neural network comprehensive evaluation–Analytic Hierarchy Process (BPCE-AHP). Sustainability 2023, 15, 8055. [Google Scholar] [CrossRef] [Scilit]
- Feng, C.; Guo, Q.; Liu, Q.; Jian, F. An optimized dynamic benefit evaluation method for pumped storage projects in the context of the “Dual Carbon” goal. Energies 2025, 18, 2815. [Google Scholar] [CrossRef] [Scilit]
- Chao, Z.; Shi, D.; Fowmes, G. Mechanical behaviour of soil under drying–wetting cycles and vertical confining pressures. Environ. Geotech. 2024, 11, 714–724. [Google Scholar] [CrossRef] [Scilit]
- Chao, Z.; Liu, Y.; Jiang, D.; Du, H.; You, W.; Feng, X.; Lin, J.; Cui, P.; Wang, Z. Comparative study of machine learning and deep learning in predicting the shear strength of marine sand and polymer layer interfaces under marine temperature effects. Front. Mar. Sci. 2025, 12, 1615580. [Google Scholar] [CrossRef] [Scilit]
- Chao, Z.; Wang, H.; Hu, S.; Wang, M.; Xu, S.; Zhang, W. Permeability and porosity of light-weight concrete with plastic waste aggregate: Experimental study and machine learning modelling. Constr. Build. Mater. 2024, 411, 134465. [Google Scholar] [CrossRef] [Scilit]
- Malefaki, S.; Markatos, D.; Filippatos, A.; Pantelakis, S. A comparative analysis of multi-criteria decision-making methods and normalization techniques in holistic sustainability assessment for engineering applications. Aerospace 2025, 12, 100. [Google Scholar] [CrossRef] [Scilit]
- Abdelkader, E.M.; Zayed, T.; Elshaboury, N. A novel hybrid fuzzy analytical hierarchy process–game theory model for prioritizing factors affecting the deterioration of water pipelines. Appl. Water Sci. 2024, 14, 265. [Google Scholar] [CrossRef] [Scilit]
- Huang, J.; Chen, C. Resource allocation of cooperative alternatives using the analytic hierarchy process and analytic network process with Shapley values. Algorithms 2024, 17, 152. [Google Scholar] [CrossRef] [Scilit]
- Tang, M.; Li, R.; Dai, X.; Yu, X.; Cheng, X.; Yang, S. New electric power system stability evaluation based on game theory combination weighting and improved cloud model. Sustainability 2024, 16, 6189. [Google Scholar] [CrossRef] [Scilit]
- Zhao, B.; Shao, Y.-B.; Yang, C.; Zhao, C. The application of the game theory combination weighting-normal cloud model to the quality evaluation of surrounding rocks. Front. Earth Sci. 2024, 12, 1346536. [Google Scholar] [CrossRef] [Scilit]
- Yan, F.; Yi, F.; Chen, L. Improved entropy weighting model in water quality evaluation. Water Resour. Manag. 2019, 33, 2049–2056. [Google Scholar] [CrossRef] [Scilit]
- McCarty, D.; Kim, M.; Jo, H.; Yim, E.; Yun, H.; Sims, S.; Kim, M.; Kwon, S. Accessible water quality monitoring through hybrid human–machine colorimetric methods. Environ. Monit. Assess. 2025, 197, 555. [Google Scholar] [CrossRef] [Scilit] [PubMed]
- Wang, Z.; Zhang, H. Quality risk evaluation of the whole process of assembly building based on game theory-combinatorial empowerment and three-dimensional cloud modeling. Appl. Sci. 2025, 15, 3417. [Google Scholar] [CrossRef] [Scilit]
- Zhao, Y.; Li, Z.; Zhang, Y. A dynamic evaluation method for pumped storage units adapting to asymmetric evolution of power system. Symmetry 2025, 17, 1900. [Google Scholar] [CrossRef] [Scilit]
- Li, X.; Ran, Y.; Zhang, G.; He, Y. A failure mode and risk assessment method based on cloud model. J. Intell. Manuf. 2020, 31, 1339–1352. [Google Scholar] [CrossRef] [Scilit]
- Dong, L.; Wang, P.; Yan, F. Damage forecasting based on multi-factor fuzzy time series and cloud model. J. Intell. Manuf. 2019, 30, 521–538. [Google Scholar] [CrossRef] [Scilit]
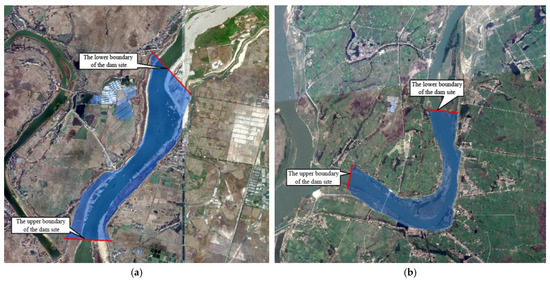
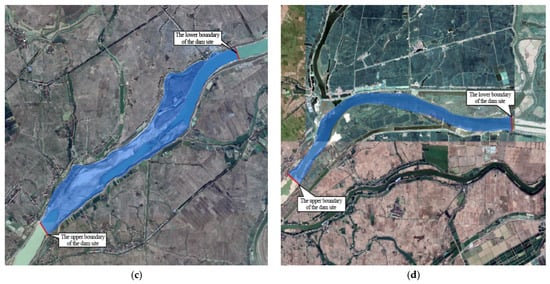
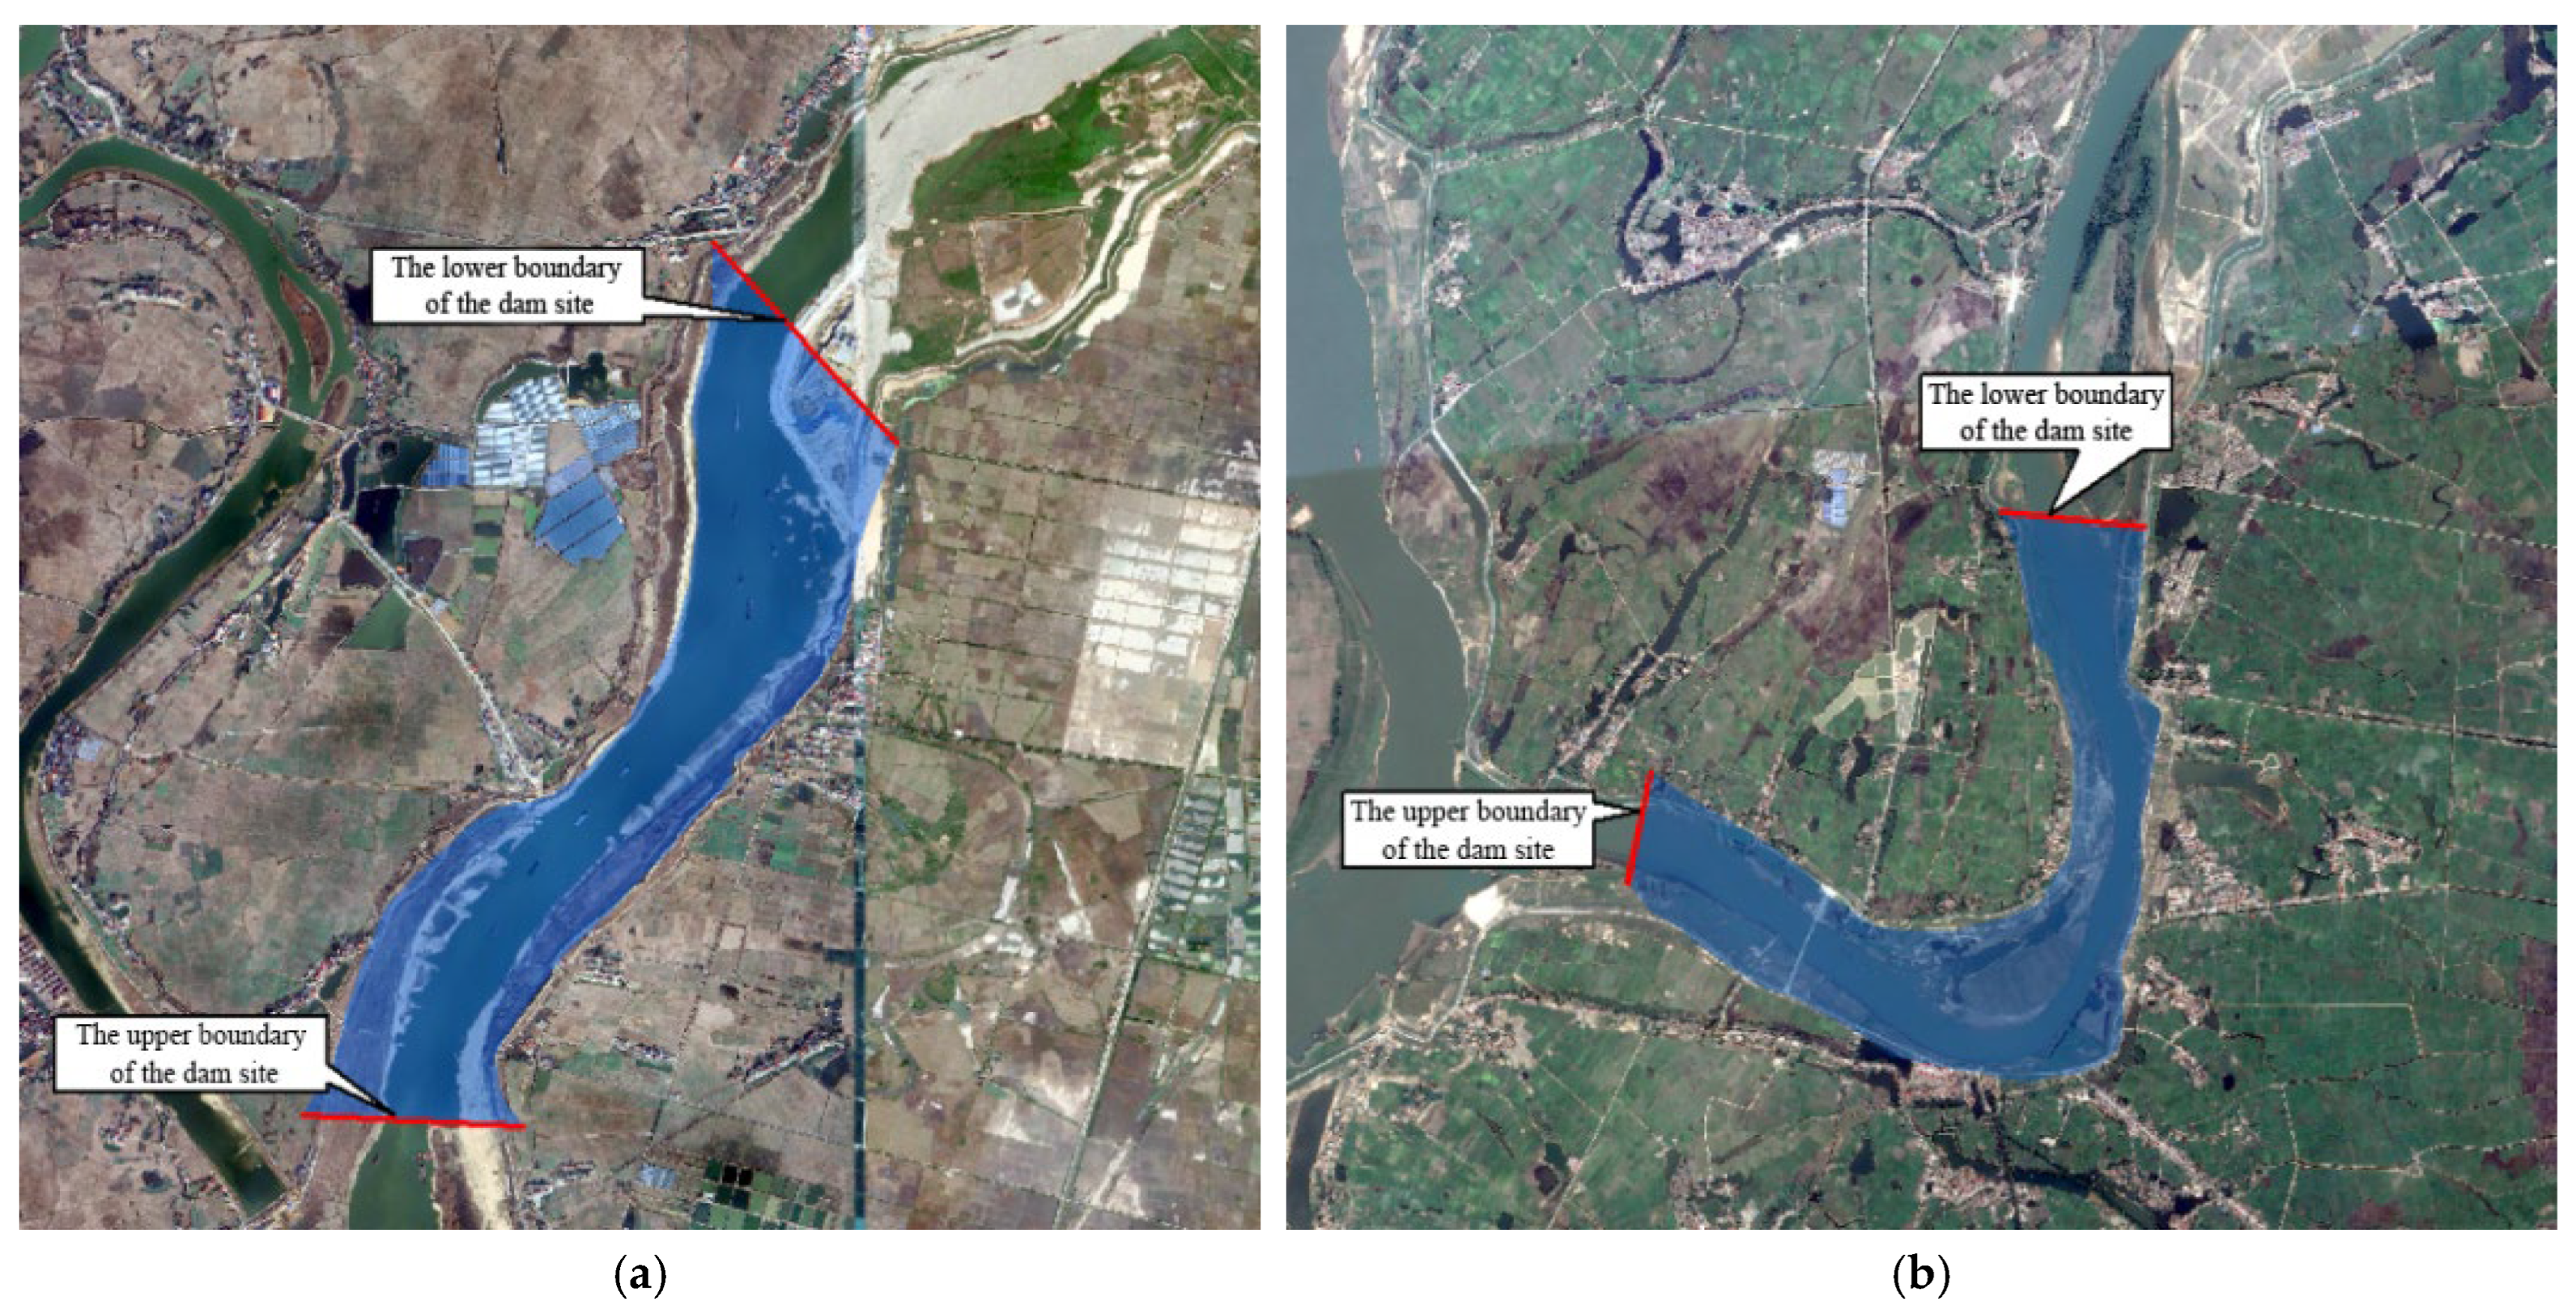
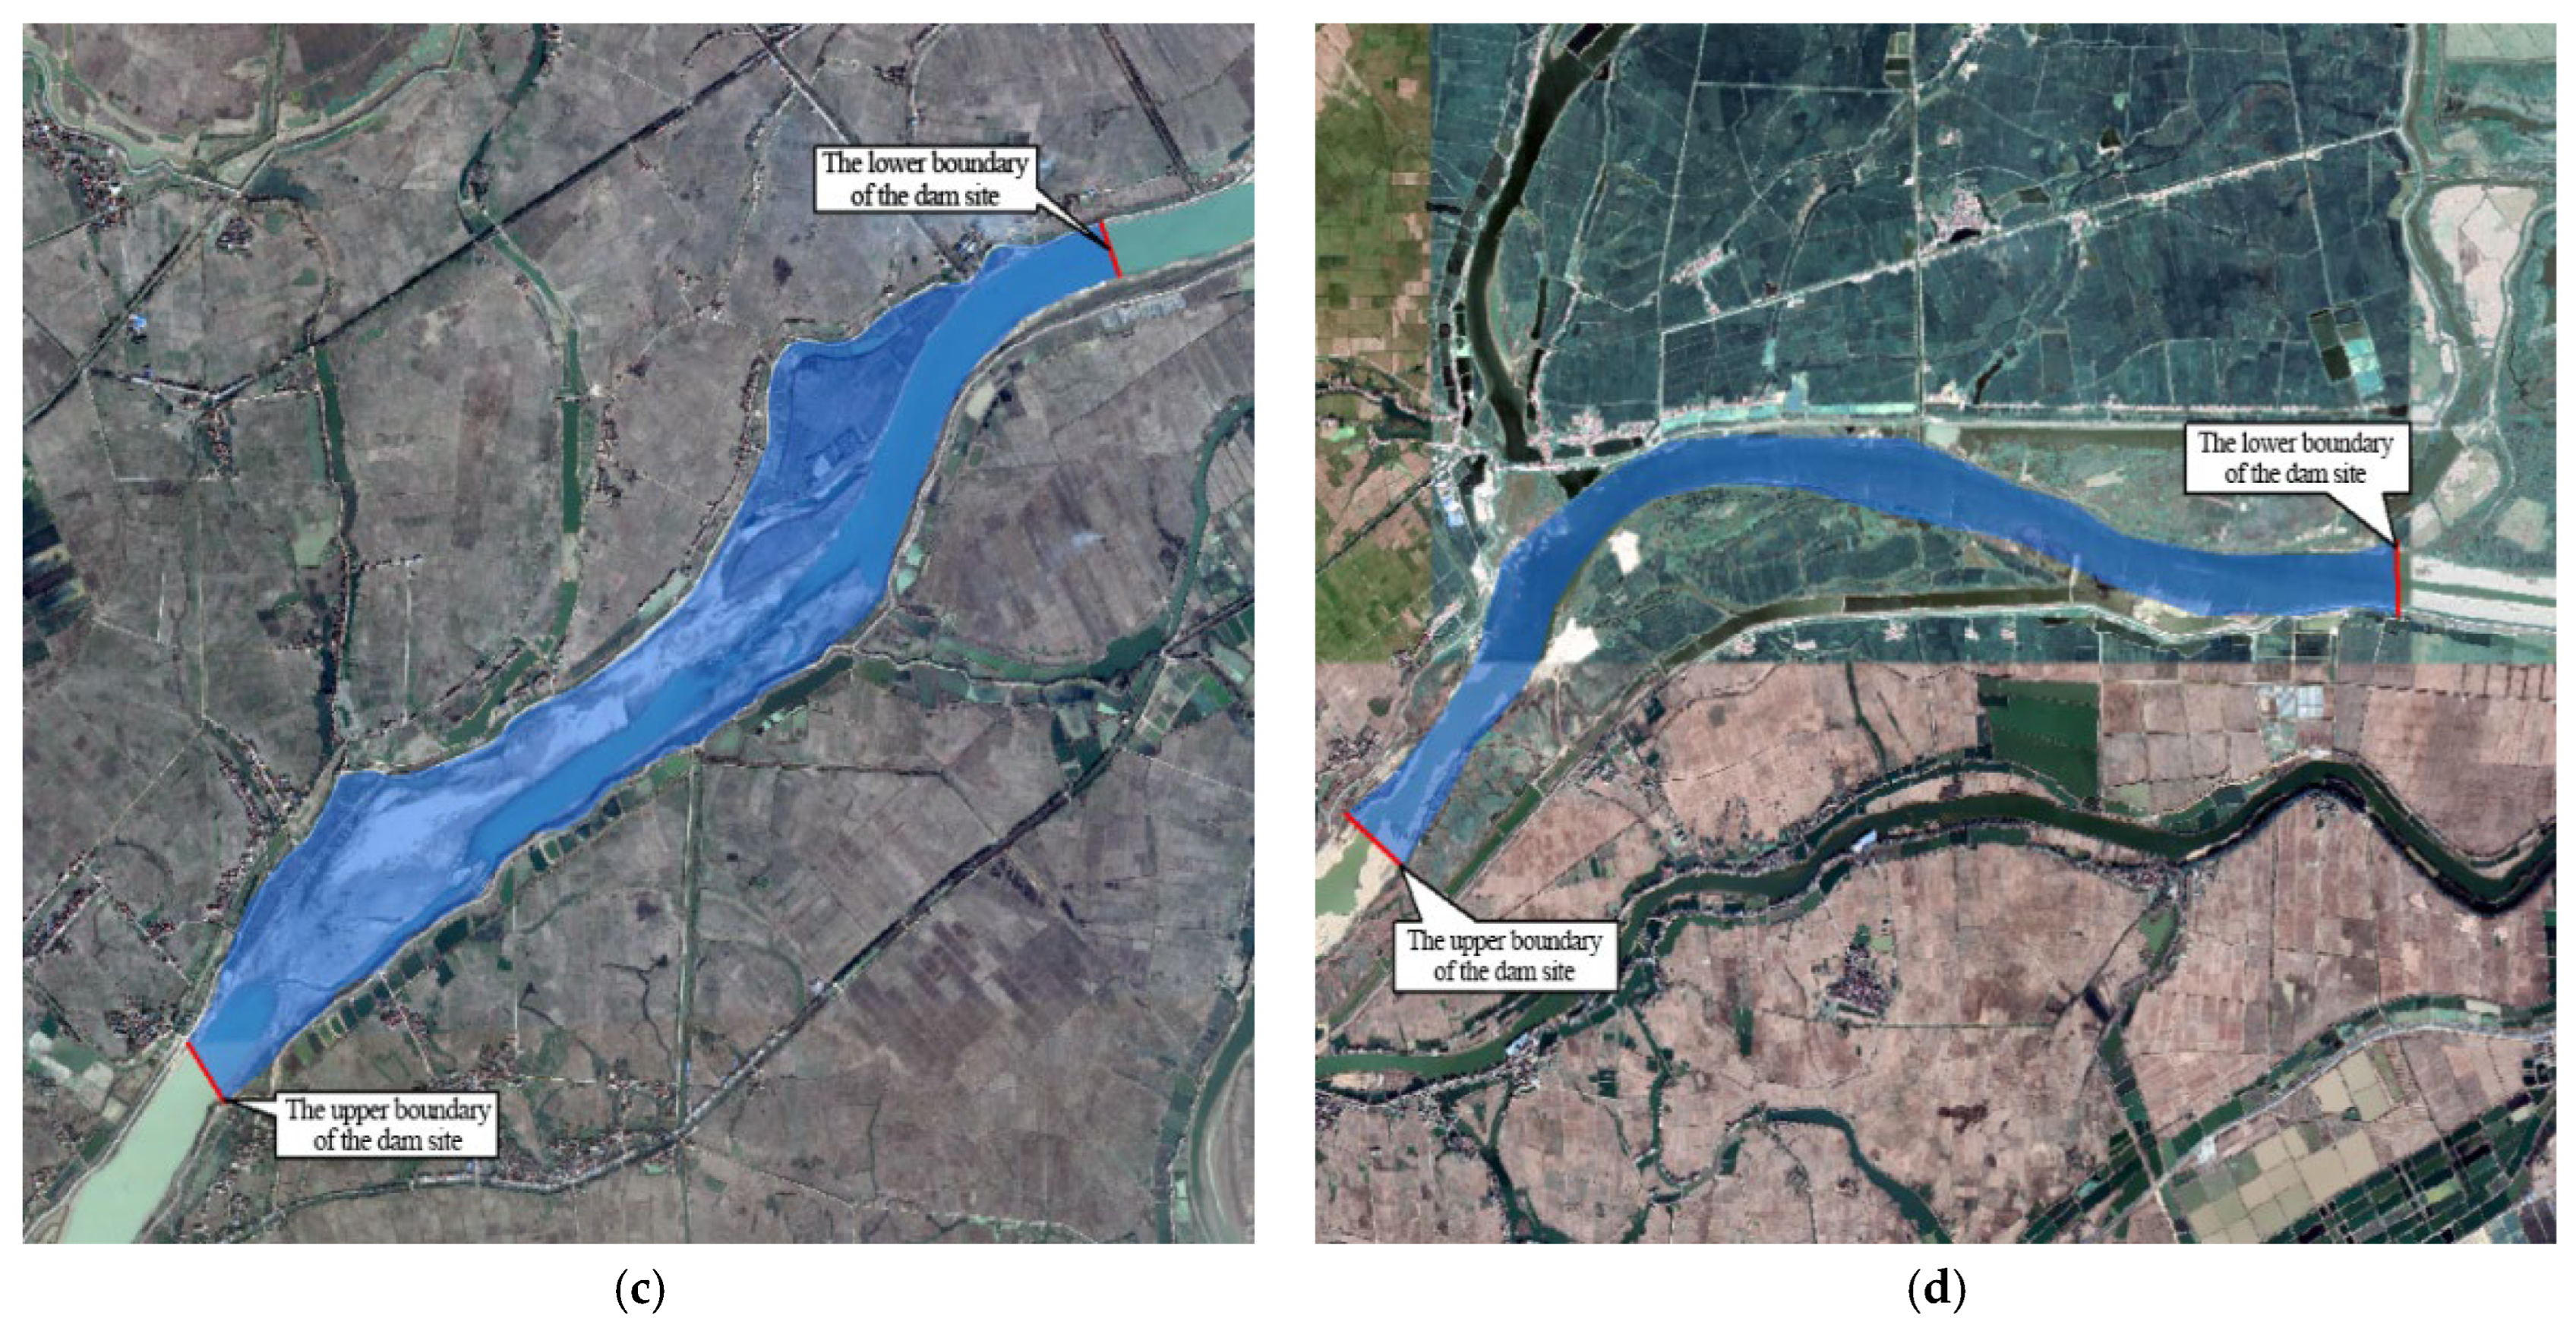
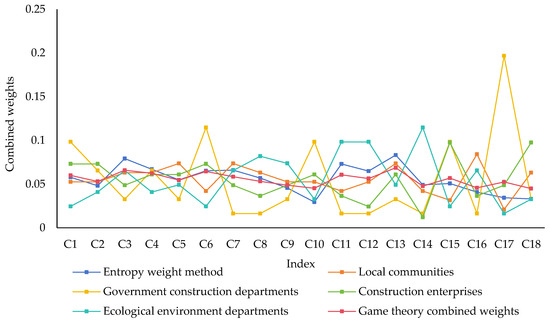
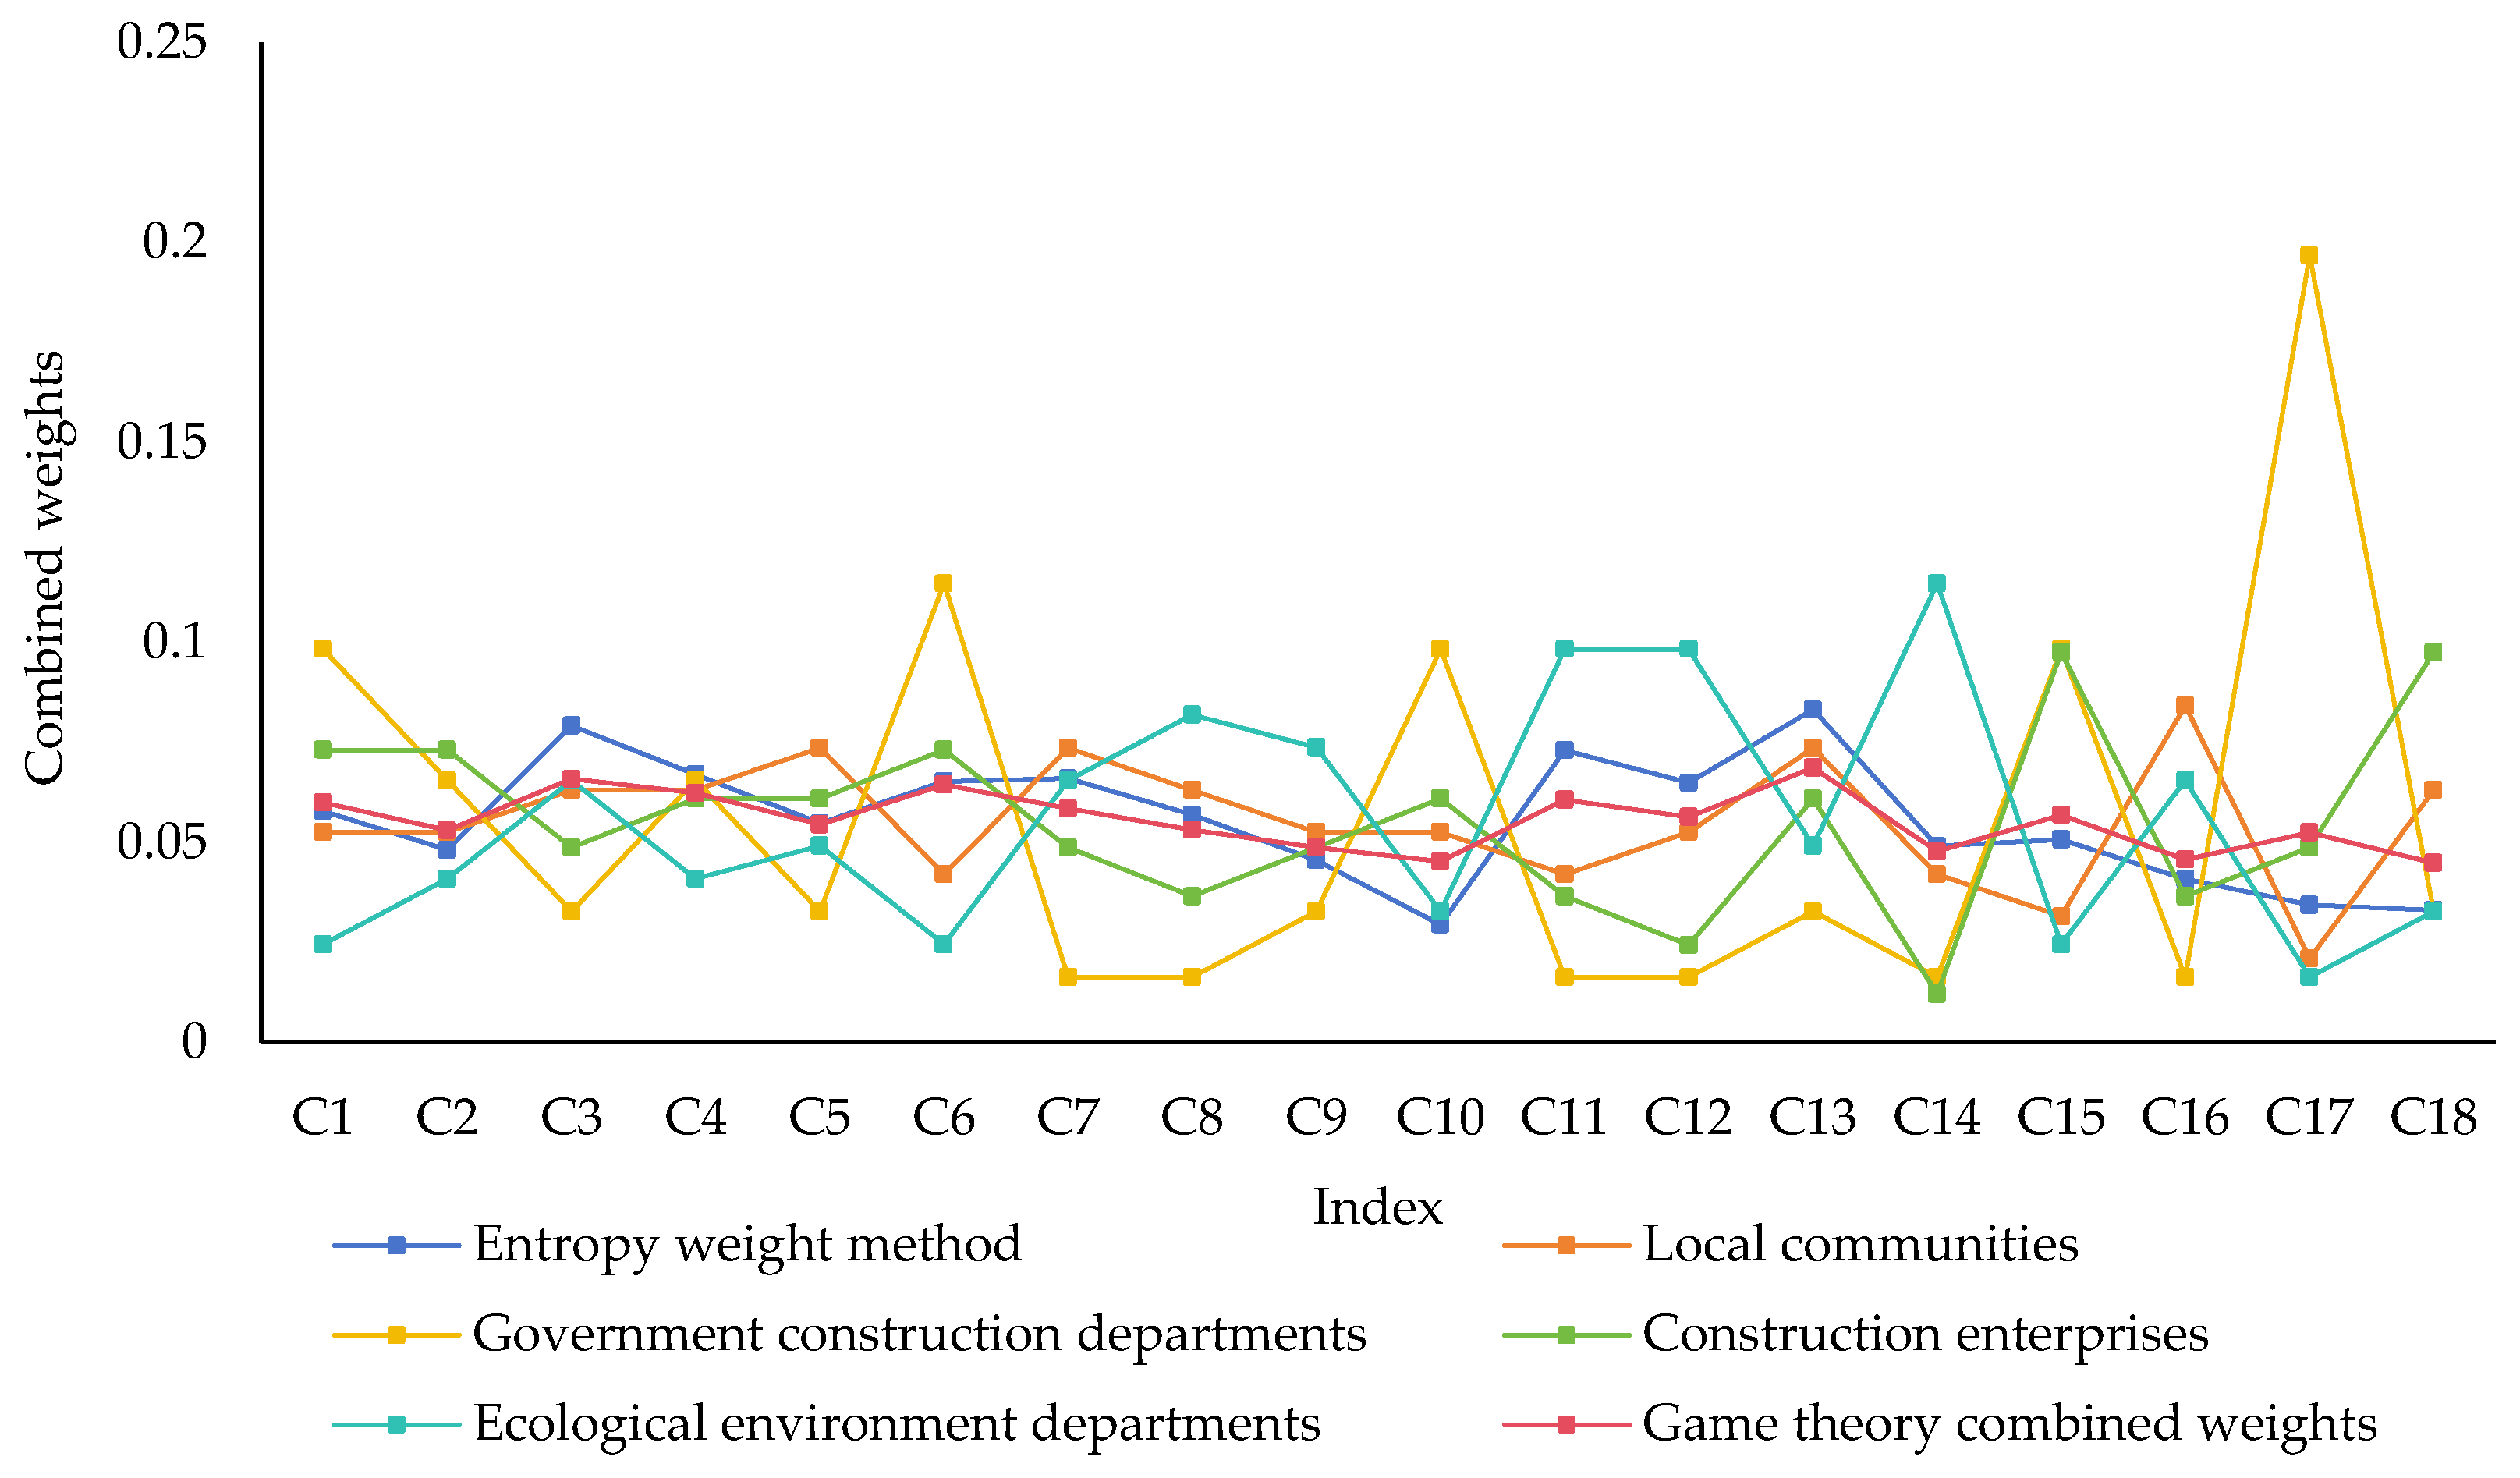
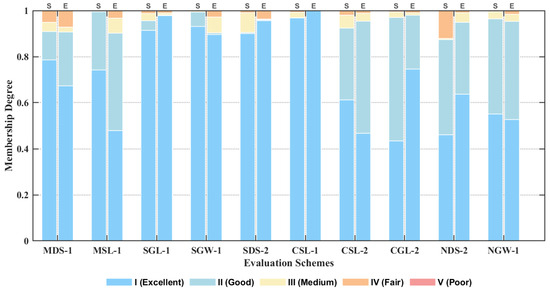
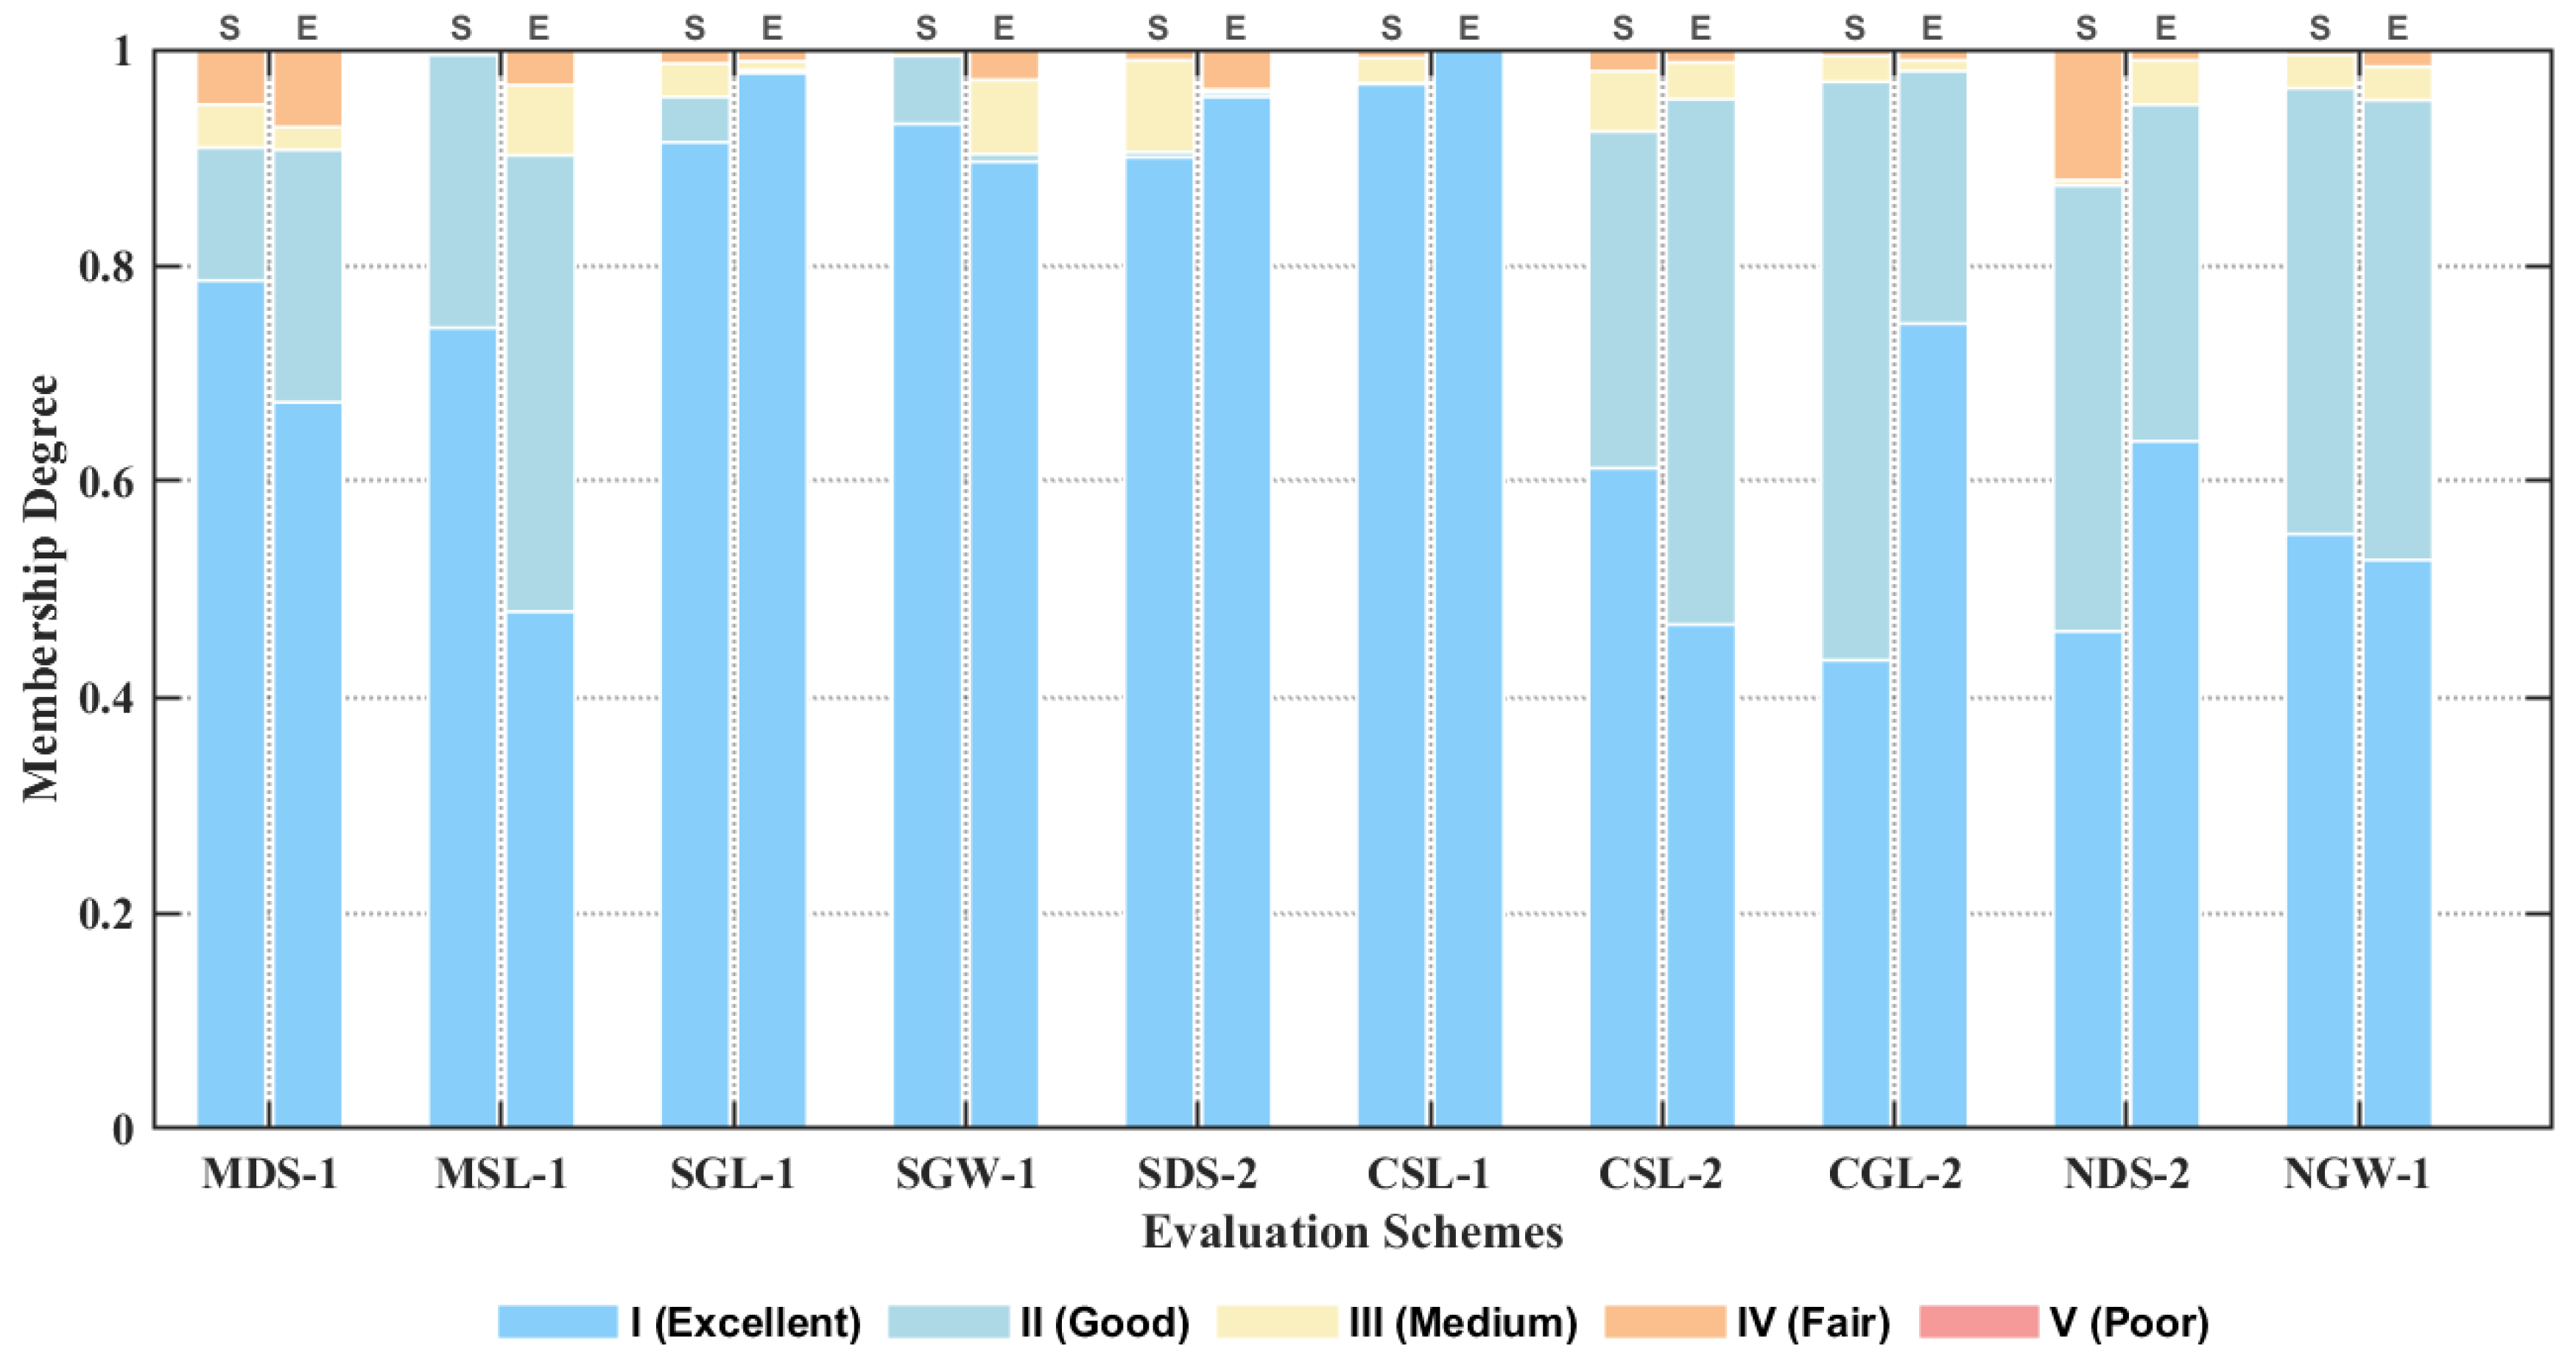
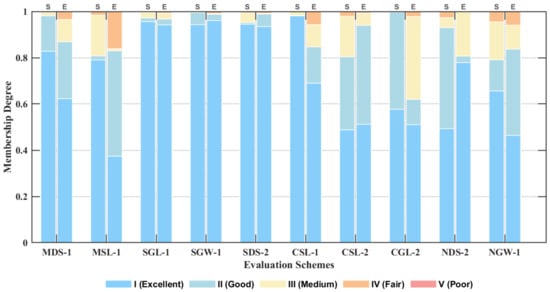
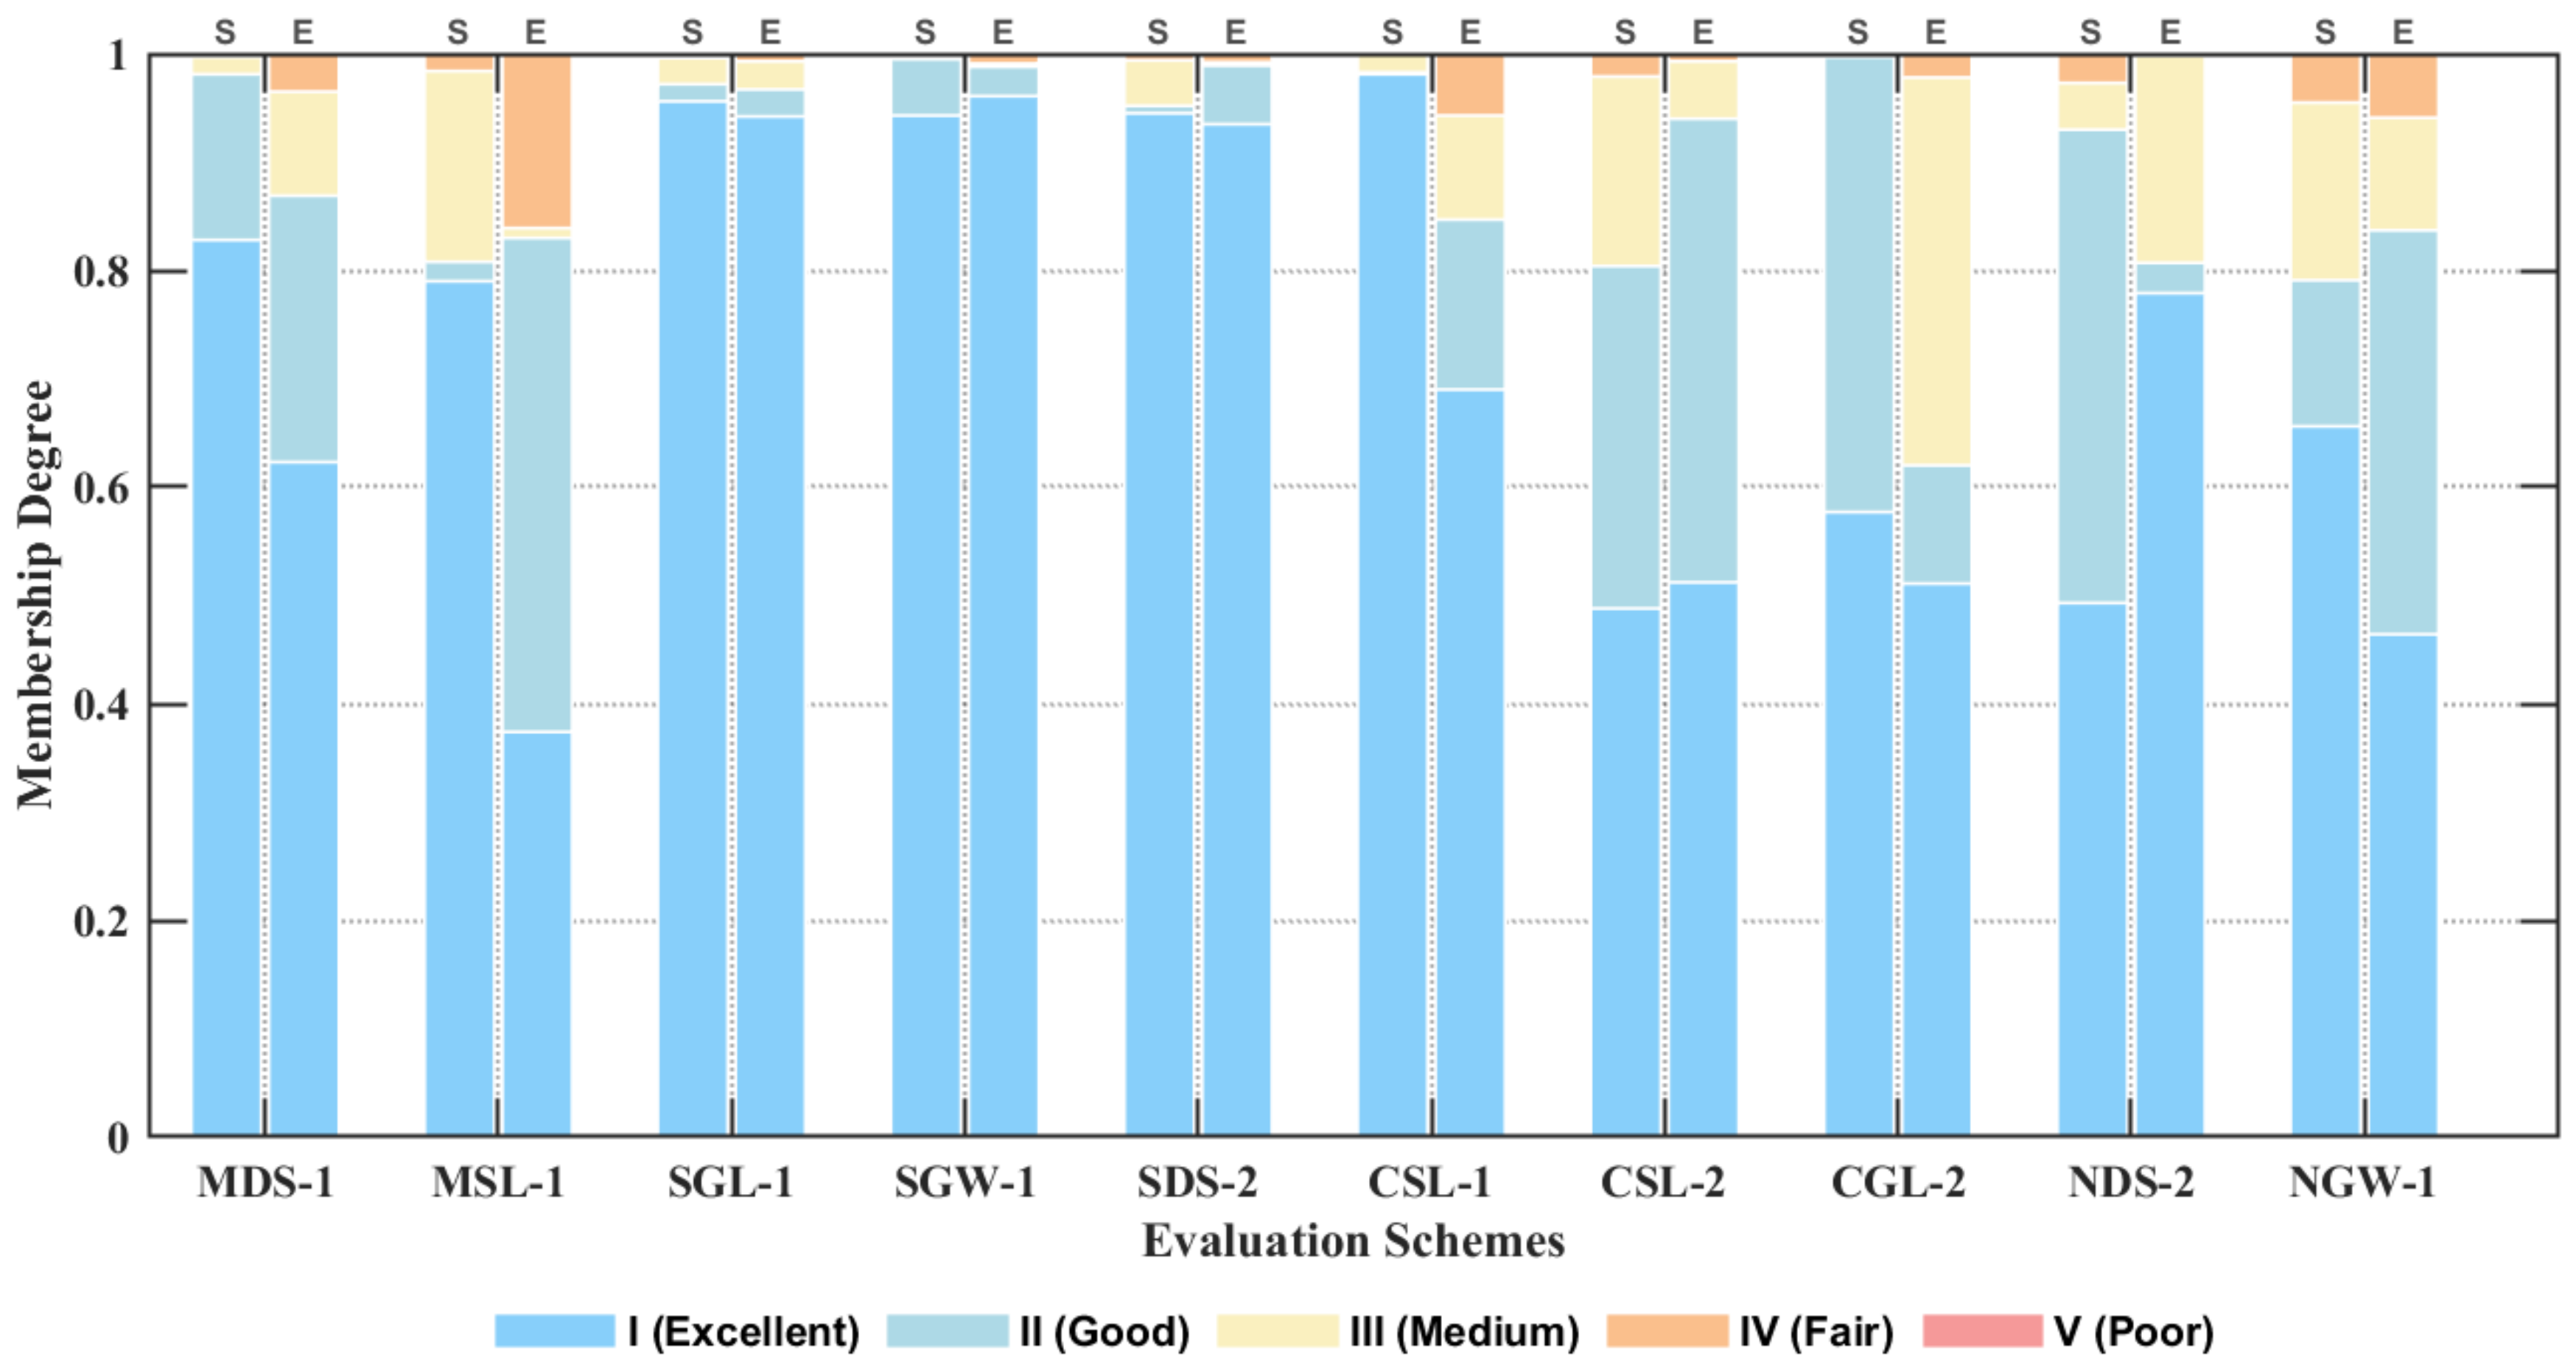
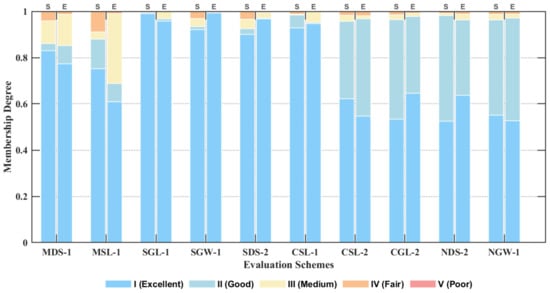
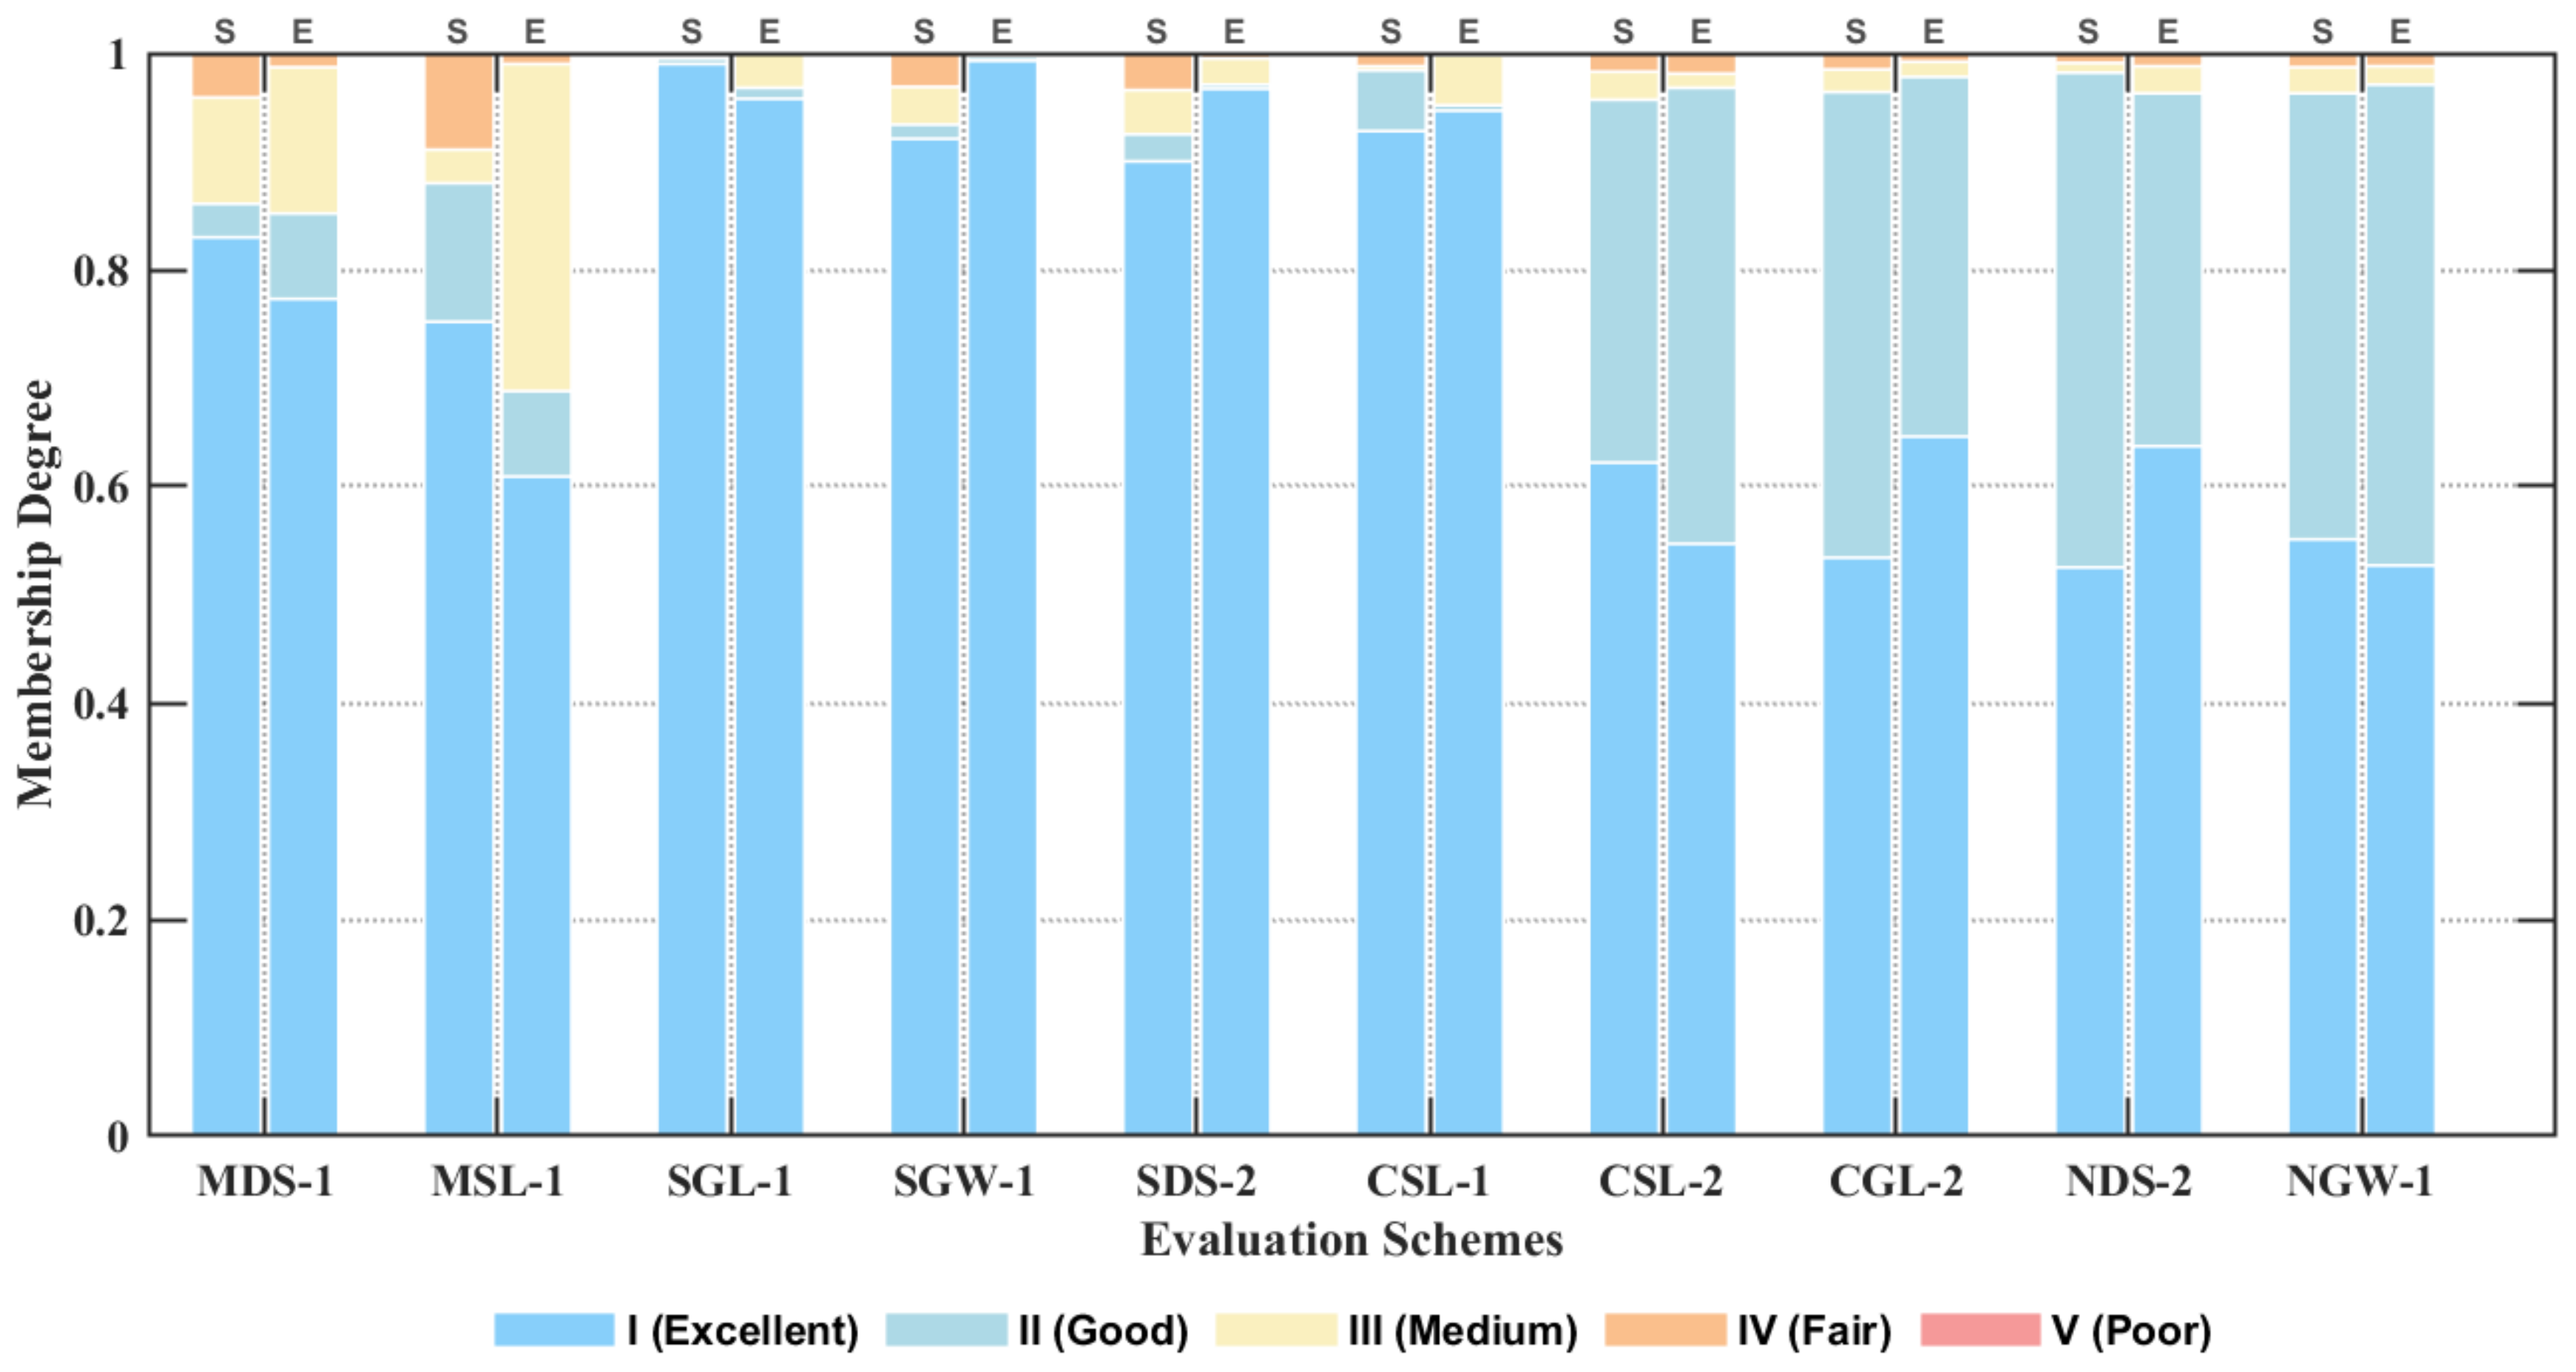
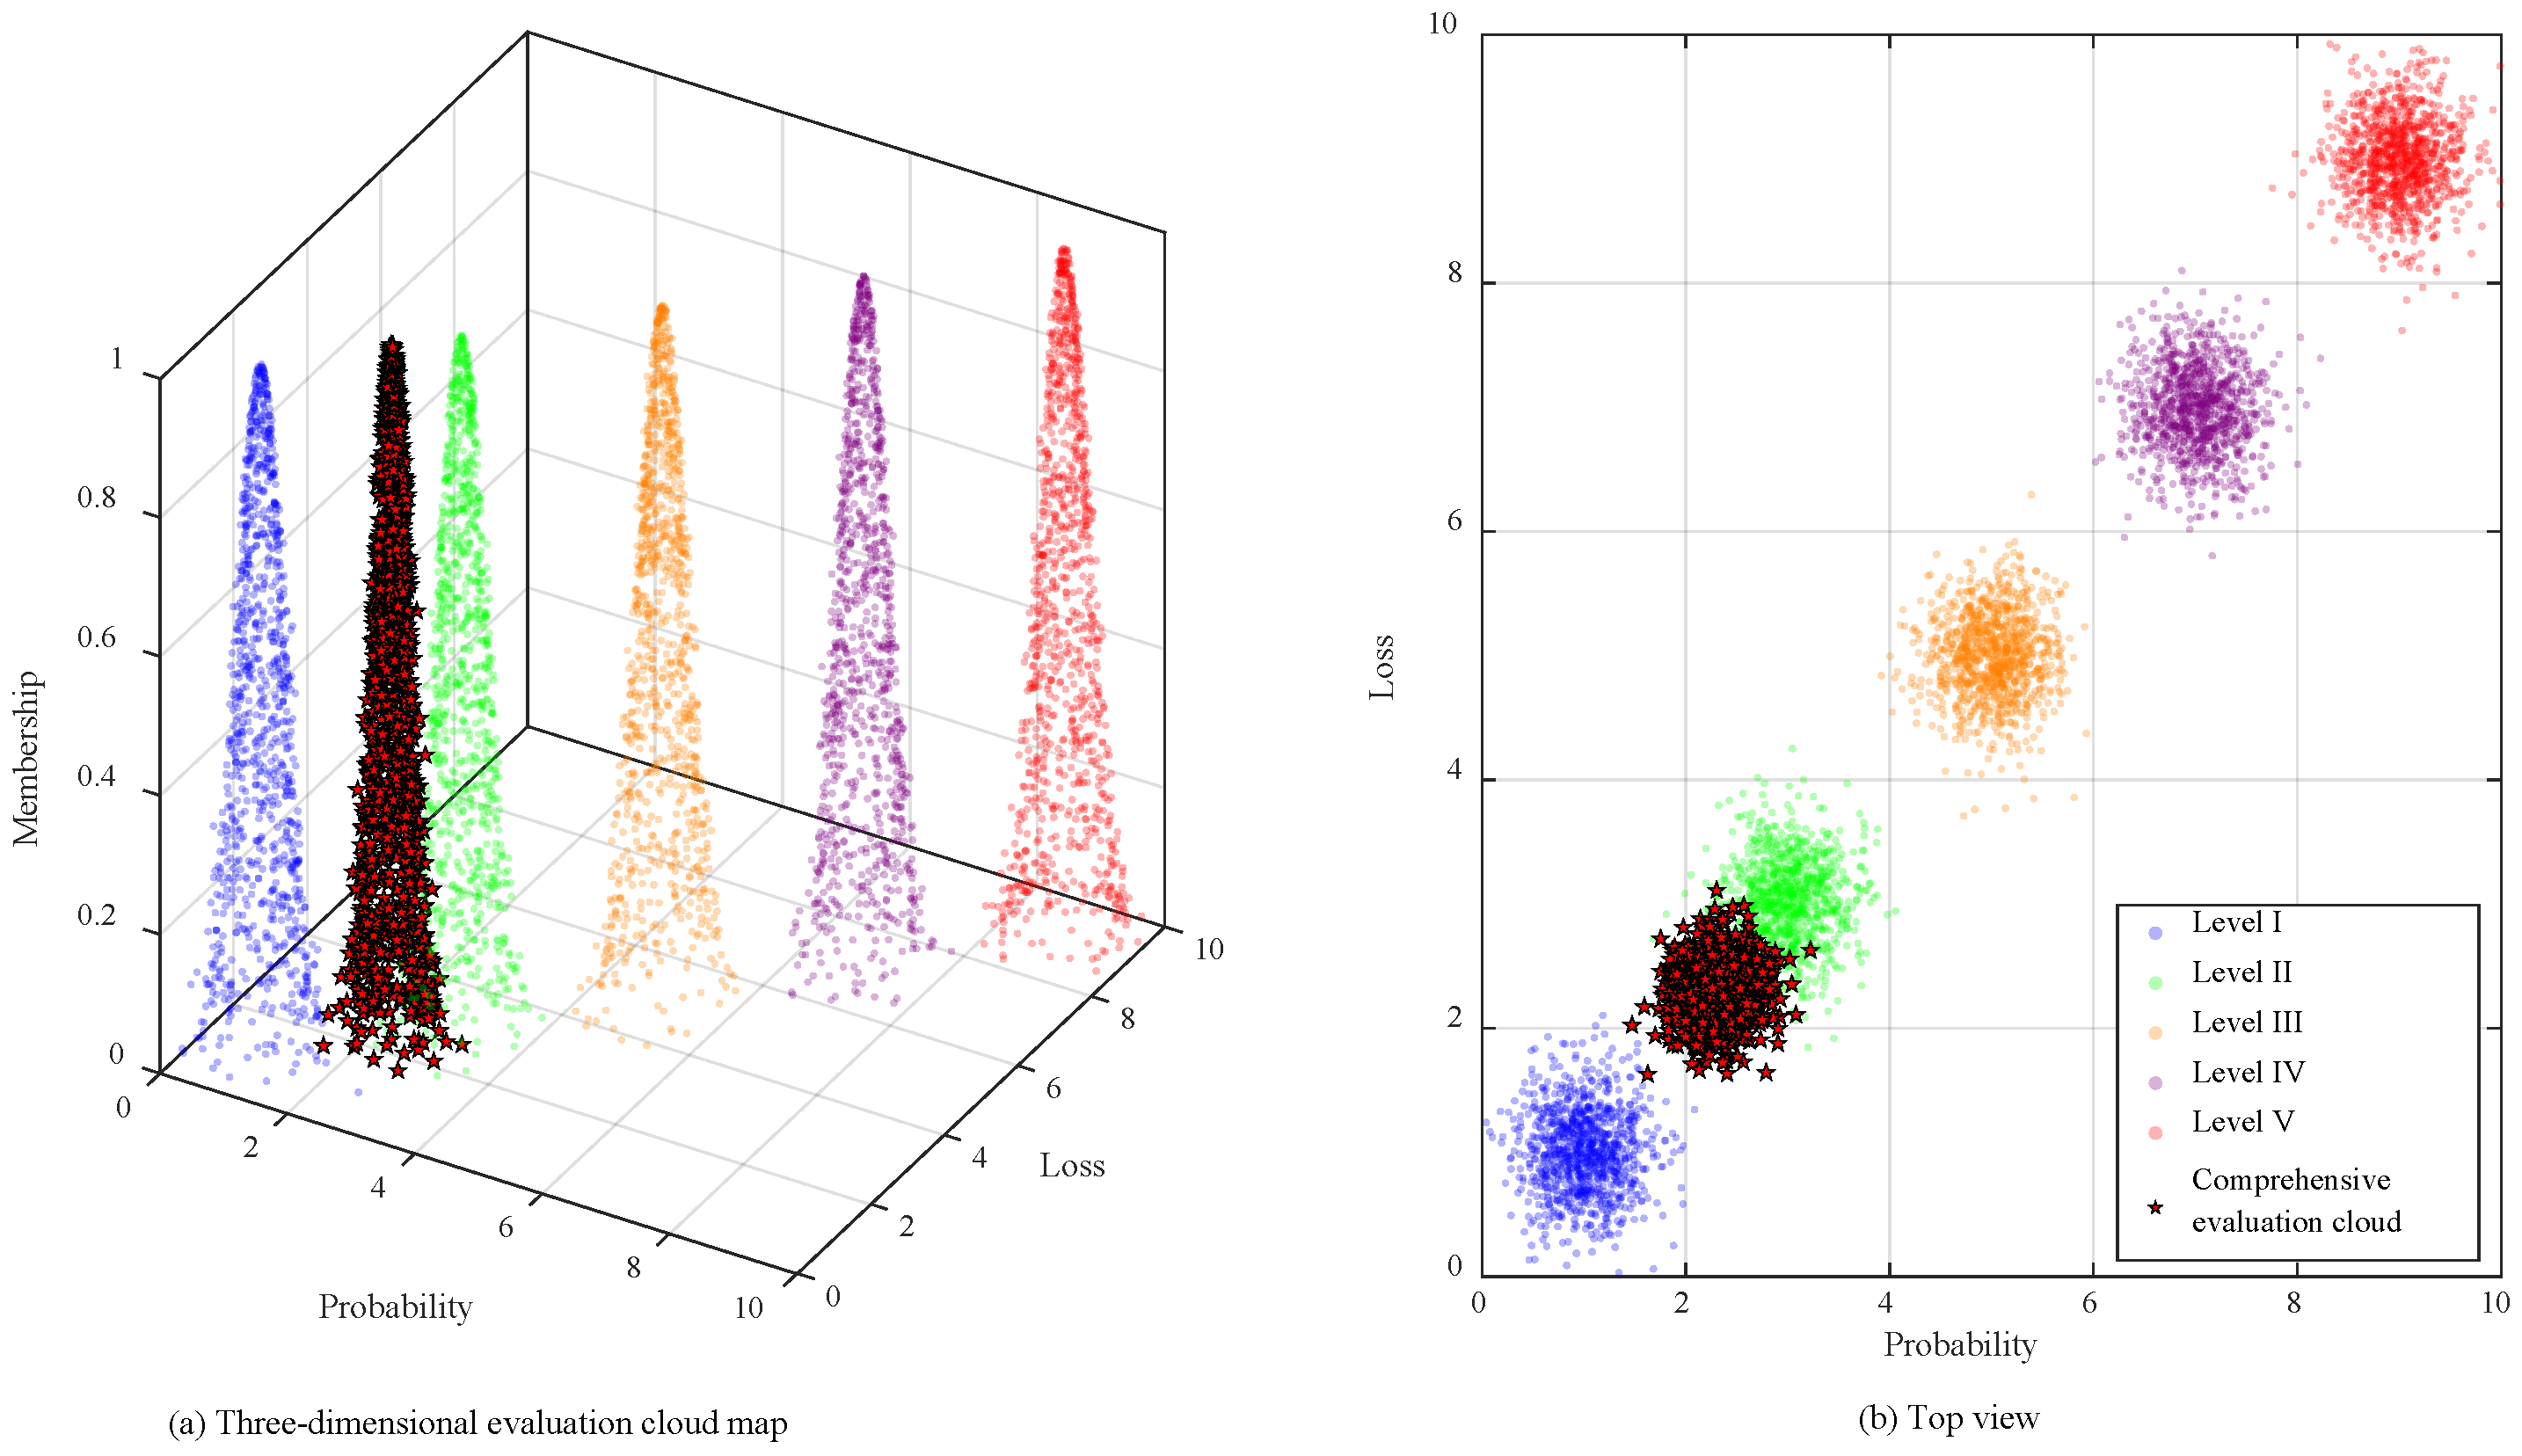
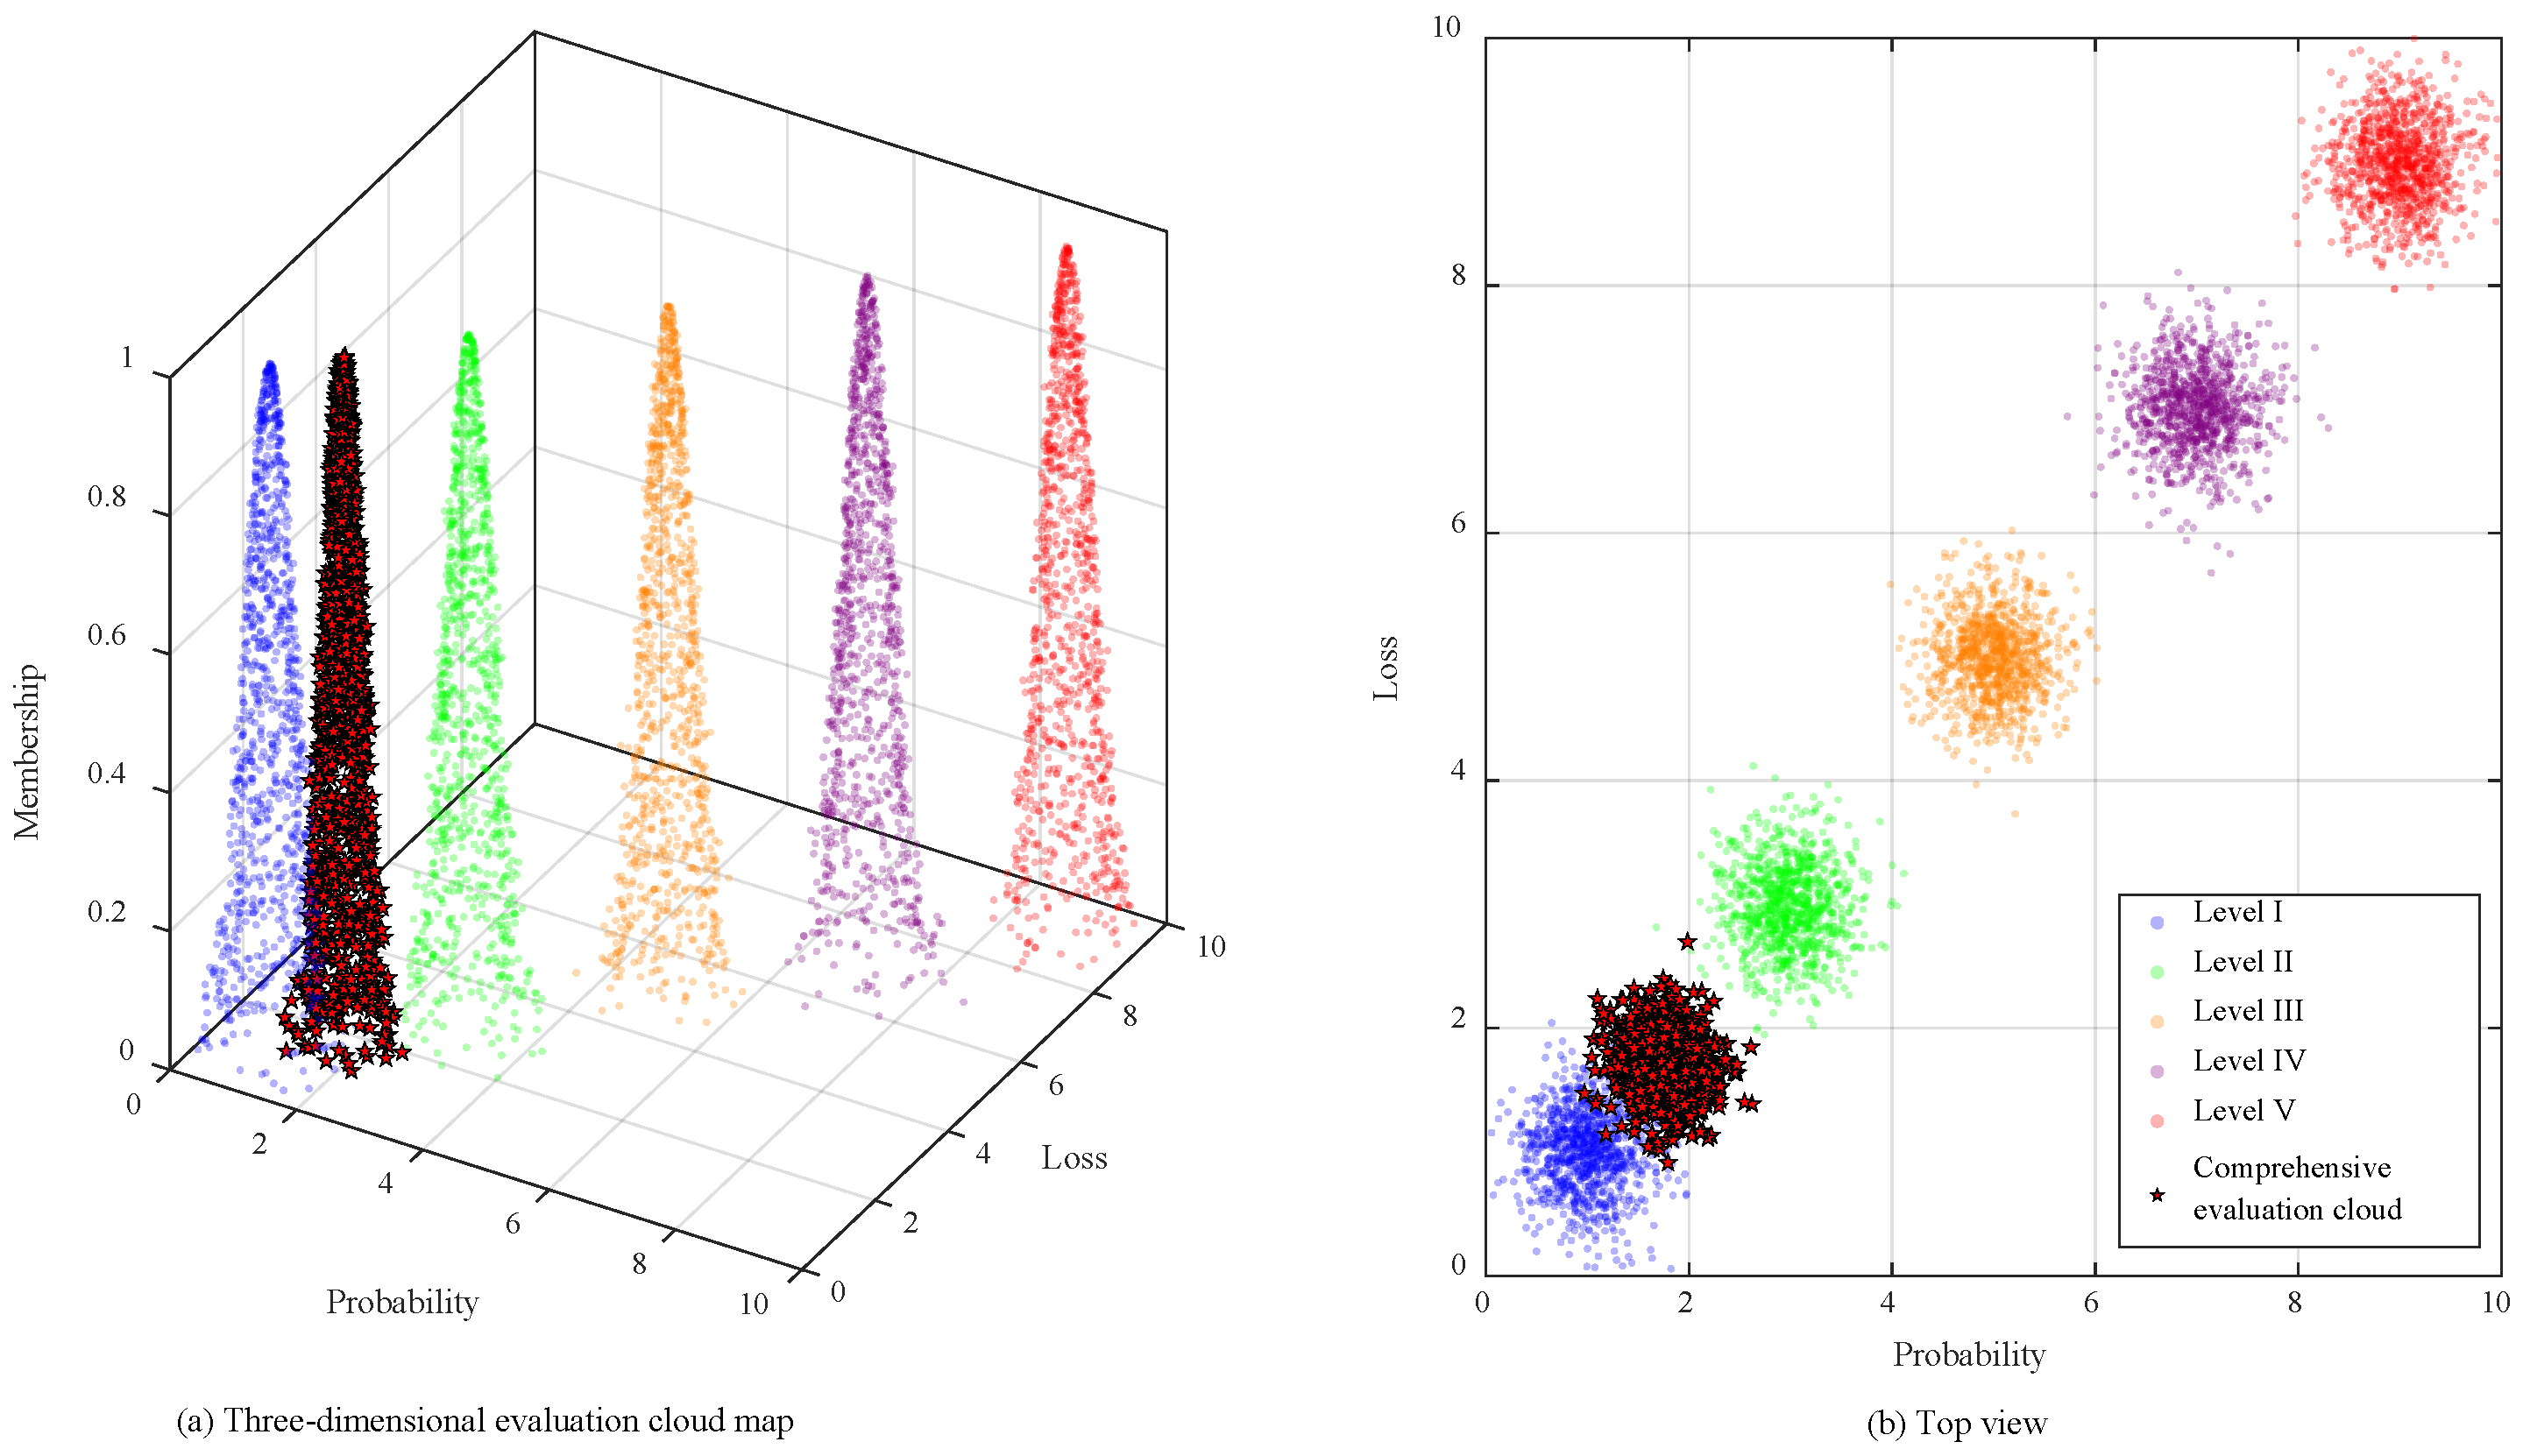
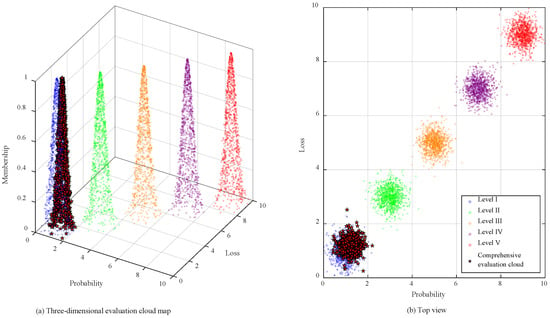
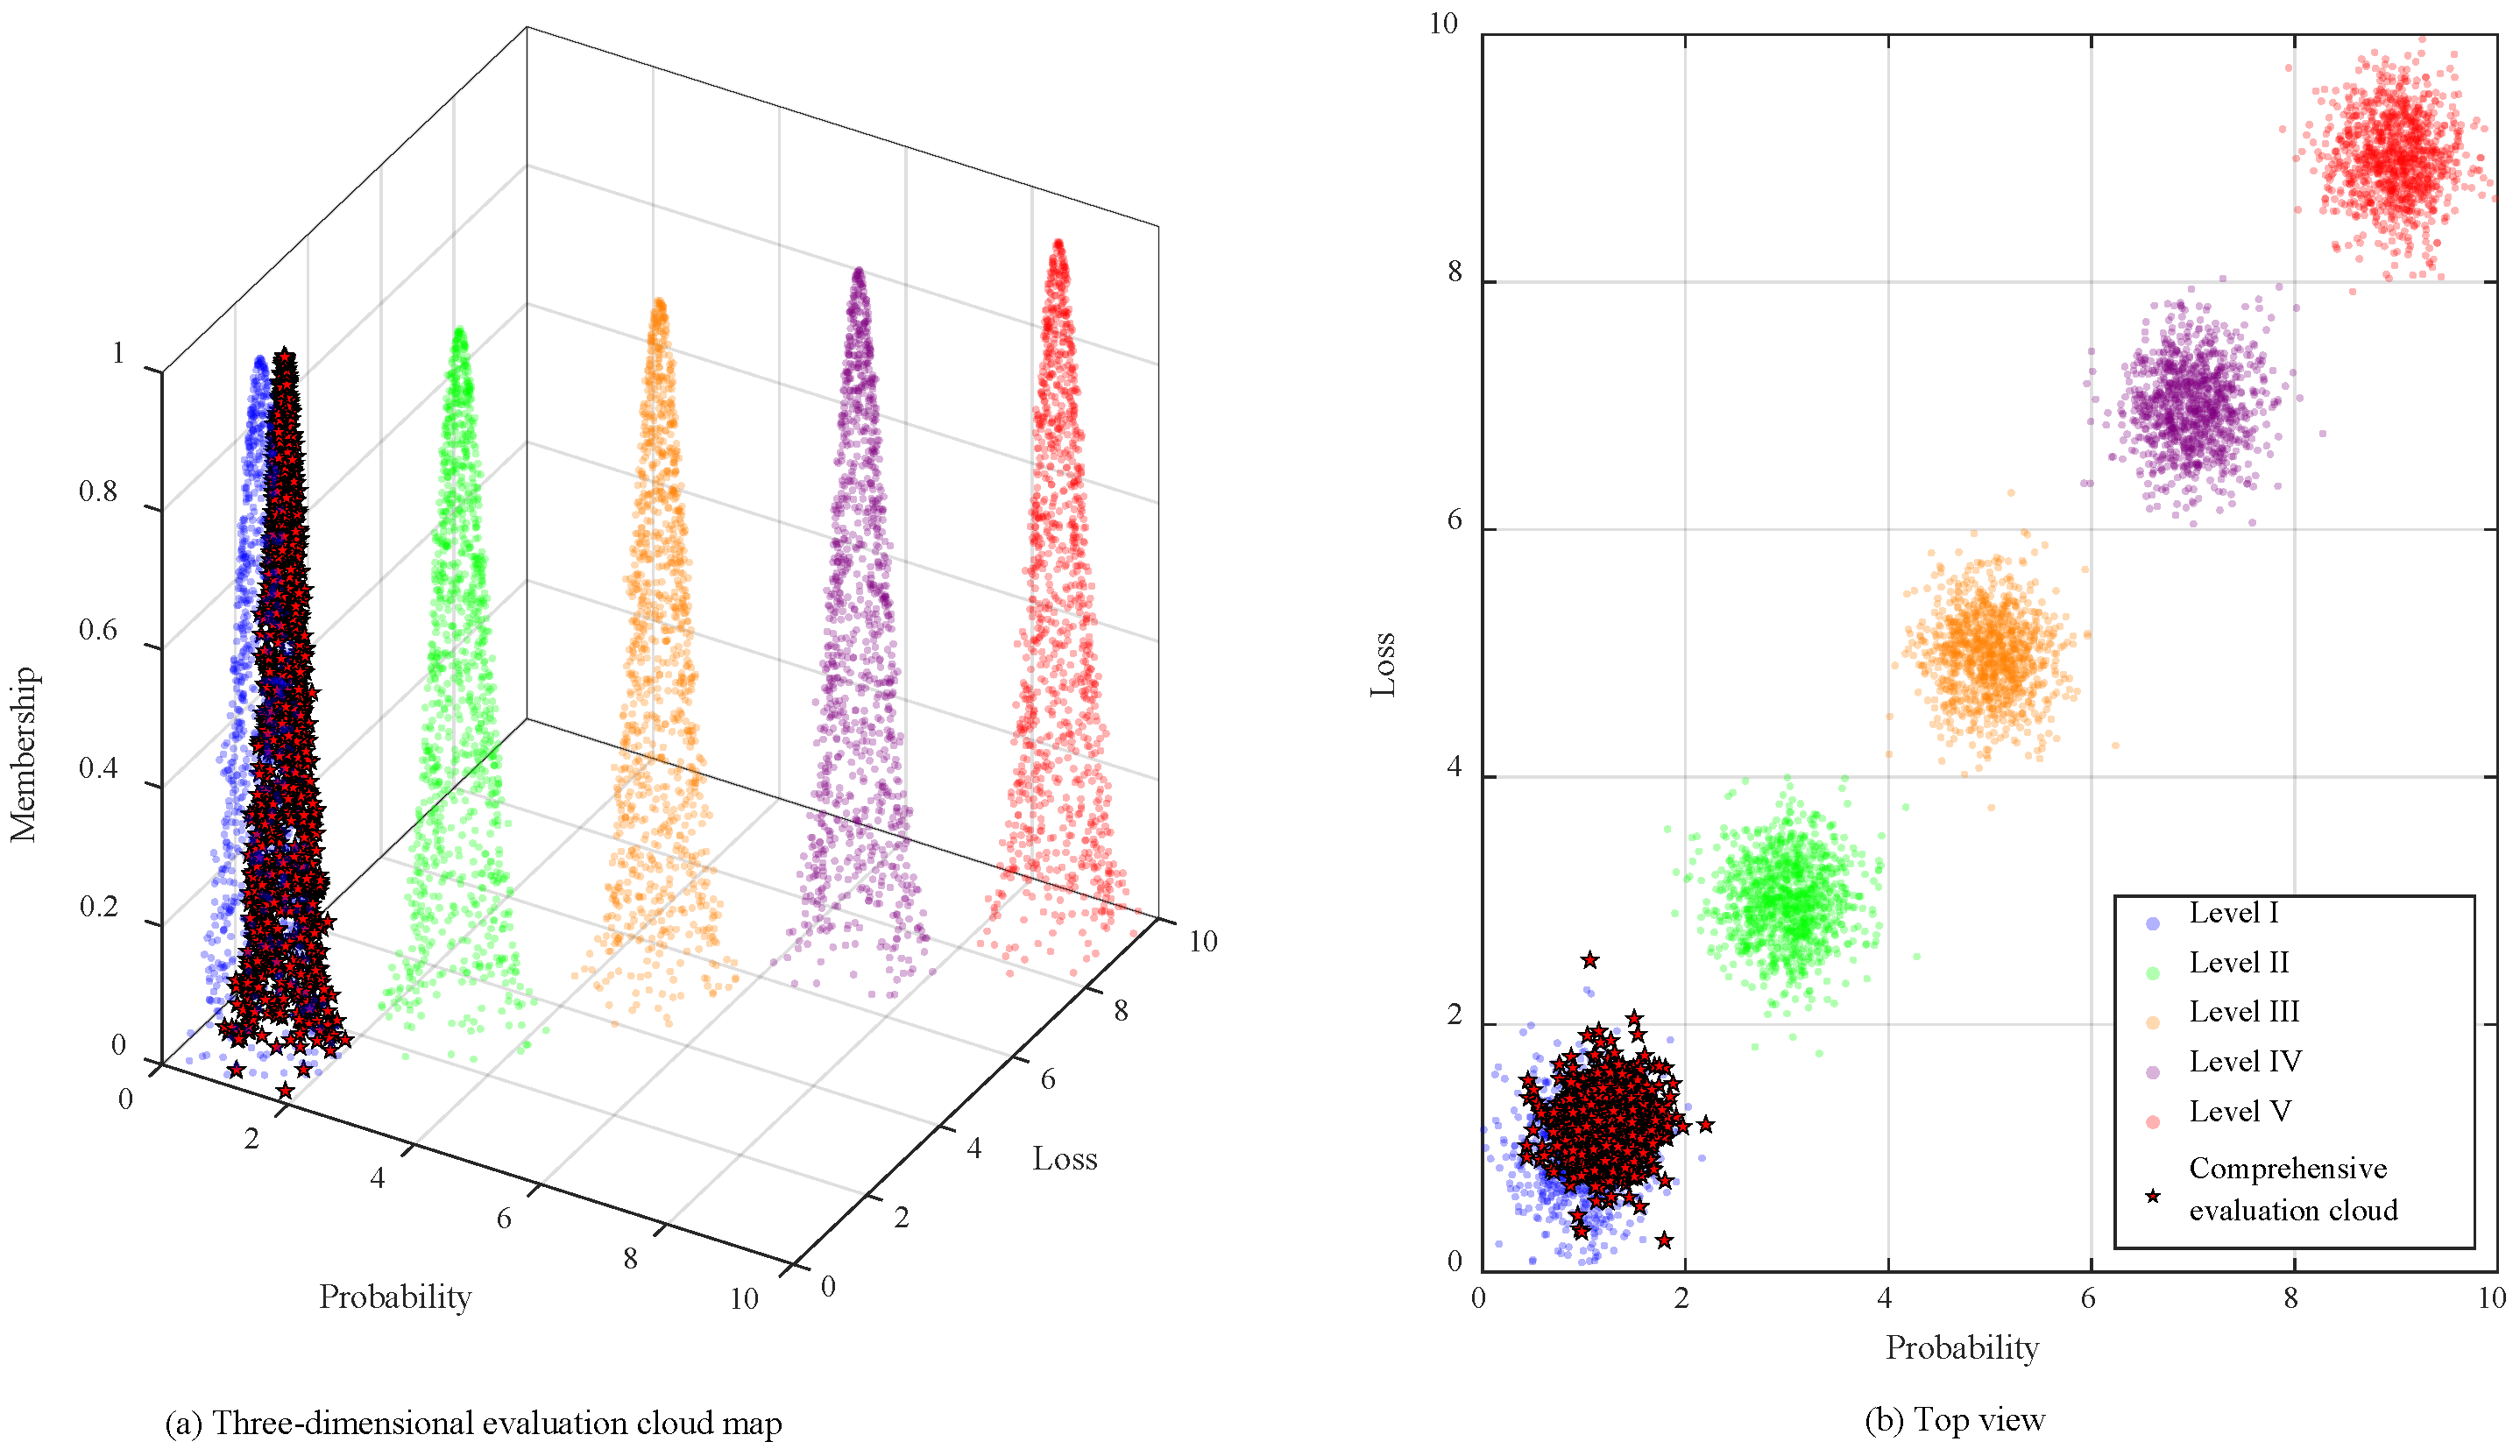

Disclaimer/Publisher’s Note: The statements, opinions and data contained in all publications are solely those of the individual author(s) and contributor(s) and not of MDPI and/or the editor(s). MDPI and/or the editor(s) disclaim responsibility for any injury to people or property resulting from any ideas, methods, instructions or products referred to in the content. |
© 2026 by the authors. Licensee MDPI, Basel, Switzerland. This article is an open access article distributed under the terms and conditions of the Creative Commons Attribution (CC BY) license.