


Abstract
The evaluation of resources and environmental carrying capacity (RECC) is of great significance for achieving harmony between humans and resources and the environment to realize sustainable development. However, current research has not reached a consensus on the research objects, theories, and methods for RECC evaluation. Therefore, this study defined the research object of regional RECC evaluation and designed an evaluation process for regional RECC based on the mutation progression method developed from the mutation theory. Then, the RECCs of 16 cities in Shandong Province during 2013–2022 were calculated, and their temporal and spatial evolution characteristics were analyzed. The result shows that: (1) the research object of regional RECC evaluation is essentially the concentrated reflection of the interaction between resources, the environment, the economy, and society; (2) the process of “construct a multilevel evaluation index system–determine the mutation types of the evaluation index system–standardize the lowest level indexes–evaluate the comprehensive regional RECC” could provide reference for RECC evaluation; and (3) from 2013 to 2022, the RECC in Shandong Province showed a steady increasing trend, and the RECC in eastern and central areas in Shandong Province was relatively higher. By analyzing these results, we found that the natural background conditions, the mode of production and life, and the decisions of the central government are the important factors affecting regional RECCs.
1. Introduction
Resources and the environment are the foundation of human survival and development. As the world continues to progress, human socio-economic activities have profoundly influenced resources and the environment, leading to resource exhaustion and environmental deterioration. Now, in order to realize sustainable development, humans have realized the need to promote harmonious development with resources and the environment, and to consciously master the state of resources and the environment for sustaining humanity. RECC has generated great attention.
RECC is an important yardstick for measuring the relationship between human socio-economic activities, resources, and the environment. It can be understood as the capacity of resources and environmental elements within a given region to support human socio-economic activities at a given stage of development, with specific economic, technical, and production and living conditions [1]. It evolved from the concept of carrying capacity, which was initially a mechanical concept. At that time, carrying capacity attracted attention and research interest from disciplines such as ecology, and has taken on new connotations as it has been studied. Once it was expanded to the field of resources and the environment for research, the concept of RECC was formed. Therefore, early studies on RECC originated in the study of carrying capacity, which can be traced back to Malthus’ An Essay on the Principle of Population in 1798 [2] and to the logistic equation proposed by Verhulst, based on Malthus’ theory, in 1838 [3]. They are considered the ideological origins of the concept of carrying capacity. In the 20th century, ecologists Park and Burges proposed the idea that carrying capacity is the maximum number of individuals that can exist under certain conditions in 1921 [4]. The next year, Hawden and Palmer conducted research under specific pasture conditions. They concluded that carrying capacity is the maximum number of livestock the pasture can support without damaging the pasture [5]. After that, many scholars have carried out similar studies [6,7]. Although the contents of these studies differed, the connotations expressed were similar. Overall, these studies focused on the maximum number that the condition of resources the environment in a habitat can support for a species, without reducing the habitat’s ability to support the species’ population size in the future. Usually, the study of the maximum population size is referred to as research on ecological carrying capacity (ECC), which not only broadens the connotation of carrying capacity but also prompts human reflection on natural resources and the environment, and lays the foundation for future research on RECC. In the 1960s, amid growing concerns about resource scarcity, research on resource carrying capacity (RCC) gained prominence. Until the end of the 1960s, research on the RCC was basically a direct extension of the research on ECC. Since the late 1960s and early 1970s, discussions of Earth’s carrying capacity have received increasing attention due to resource and environmental issues arising from population growth and economic development. One example was Limits to Growth, published by Meadows et al. in 1972, which pointed out that rapid industrialization and an increasing floating population would push the Earth’s carrying capacity to its limit [8]. Since then, research on RCC has placed greater emphasis on the relationships between population, food, and resources. Resources and the environment are interdependent, and research on environmental carrying capacity (ECC) based on the relationship between population and environment extends research on ECC and RCC. To a certain extent, the global environmental damage and pollution since the 1970s have prompted research on ECC. Furthermore, RECC is generally considered to be a composite of RCC and ECC [9,10]. Since the 1970s and 1980s, with continuous in-depth development, research on the evaluation of RCC [11,12,13,14], ECC [15,16,17], and RECC [18,19,20] has been widely conducted. They have become some of the most frequently used methods for evaluating the degree of restriction on human activities. Subsequently, and until now, studies on RECC have focused on evaluating carrying capacity.
Research on RECC evaluation has undergone a transition from focusing on single resource elements or environmental elements, such as land resources [21,22,23,24,25,26], water resources [27,28,29,30,31,32], and atmospheric-environment carrying capacity evaluation [33,34,35], to the comprehensive carrying capacity of resources and the environment [26,36,37,38,39]. Correspondingly, the evaluation objects of RECC are also divided into two categories: one is a specific resource element or environmental element, and the other is the comprehensive RECC from the perspective of the overall region. Many scholars actively developed methods of combining theory with practice, such as ecological footprint [40,41,42,43], water footprint [44,45], virtual water [46,47,48], energy analysis [49,50,51], system dynamics [52,53,54], PSR [55,56], DPSIR [57,58], and multi-angle evaluation index systems [59,60,61], for RECC evaluations. These methods have been well applied in practice. For example, GFN calculated the ecological footprint of many countries to determine whether each country’s demand for resources and environment was overloaded [62]. Wang et al. used the SD model to predict and analyze the water resource carrying capacity of Urumqi city, which opened a new path for the prediction of water resource carrying capacity in China [63]. Hughey et al. used the PSR model as a framework to study the environmental situation in New Zealand [64]. These evaluation studies provided decision-making support based on the threshold for sustaining human society and the economy in a definite period and region, and at a definite level of resources and environmental status [65,66,67,68,69], and also provided an important basis for the timely grasp of regional RECC. Overall, there were various studies on RECC. It is generally believed that it is of great significance for us to better respond to changes in resources and the environment and to address their adverse impacts on human survival and development.
China, the world’s largest developing country, in the current context of deepening conflict between human development and resources and the environment, should adjust and optimize its high-resource-consumption, high-environmental-pollution development model. For this reason, the carrying capacity of China’s resources and environment for social and economic development has become a major concern. In 2013, the third plenary session of the 18th Communist Party of China Central Committee included “building monitoring and warning mechanisms for RECC” as one of the important tasks of the Central Reform in the new era in Decision on Major Issues Concerning Comprehensively Deepening Reforms [70]. This has sparked great interest among researchers in RECC, and the public has also paid increasing attention to RECC evaluation. In China, evaluation results are conducive to a comprehensive understanding of RECC and to a comprehensive analysis of the supply and feedback between resources, the environment, and human activities, thereby providing measures to coordinate the relationships between resource utilization, economic development, population growth, and environmental protection. The government has successively introduced a series of policies to strengthen the fundamental position of RECC evaluation [1,71,72]. Given this background, correctly evaluating and understanding the RECC of a region has become an important task for China. However, current research has not reached a consensus on the research objects, theories, and methods for RECC evaluation [73]. We believe that in order to make the RECC evaluation become one of the effective tools that can provide recommendations for regional policymakers and stakeholders, it is important to define the evaluation objects of regional RECC, and to ensure that the evaluation methods are simple and practical, the evaluation processes are scientific and clear, and data sources are authoritative and reliable. Considering all of these, this study, based on the existing research, analyzed the research object of regional RECC, combined with the mutation progression method developed from the mutation theory, to explore an evaluation process for regional RECCs. Shandong Province in China was used as a case study. This study will enrich the theory and practice of RECC evaluation and, at the same time, provide a solid scientific basis for improving the utilization efficiency of China’s resource environment and for formulating a reasonable, sustainable development strategy.
2. Study Area
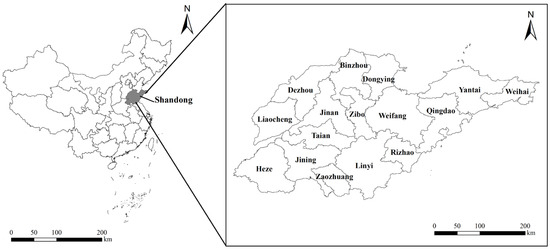
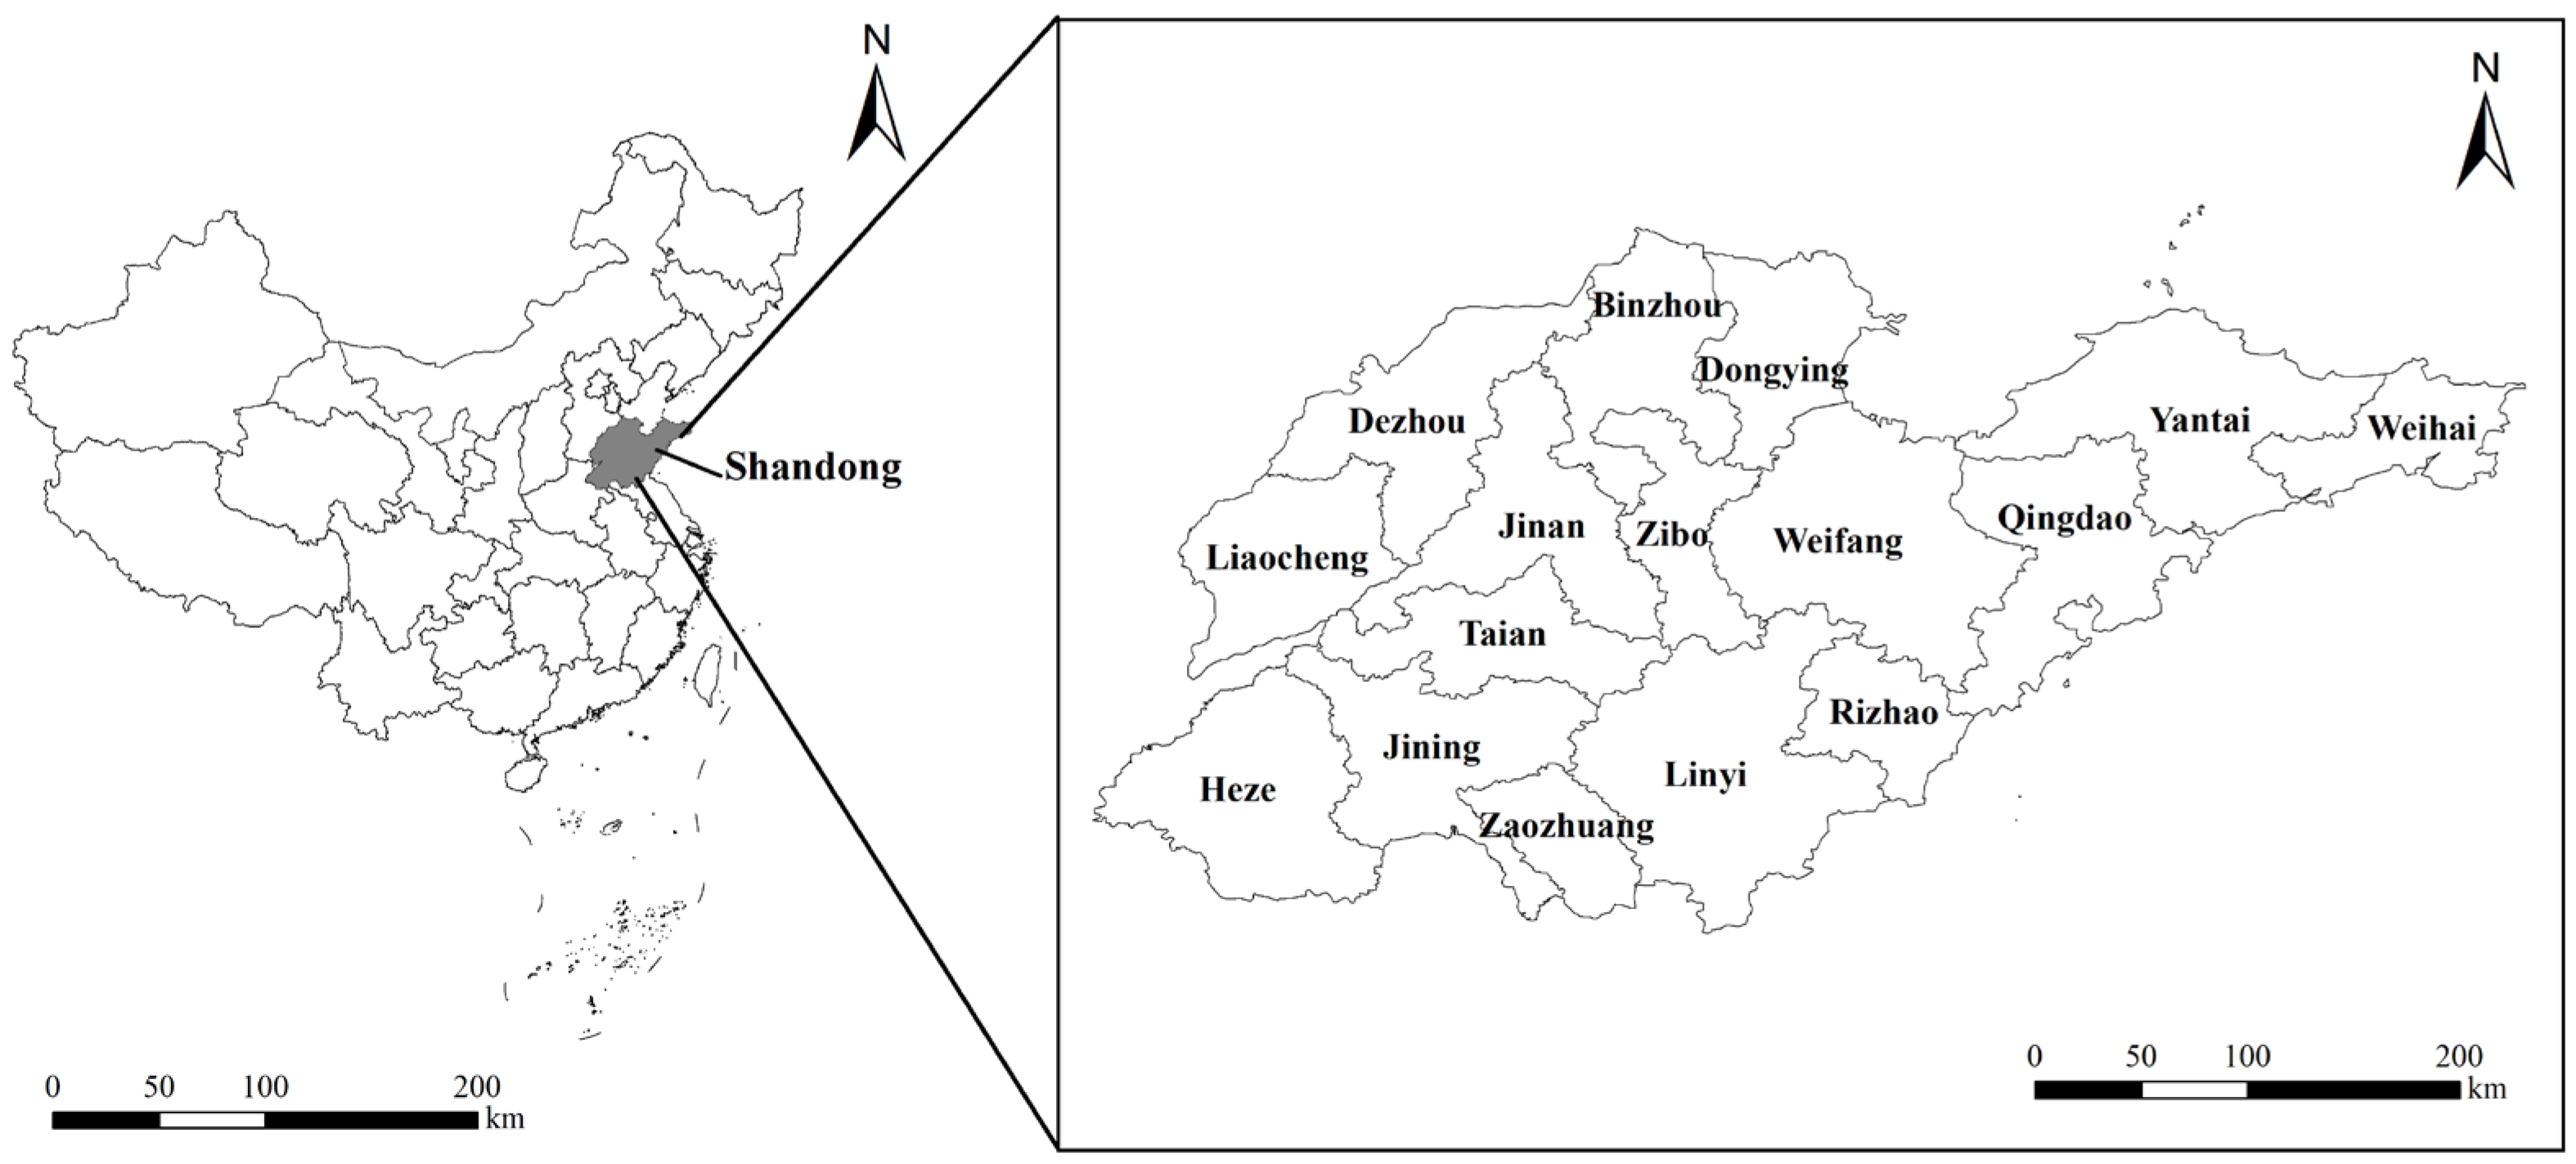
Shandong Province is a coastal province in East China, the only demonstration province of the United Nations Biodiversity Finance Project in China, ranging from 34°22.9′~38°24.01′ N latitude and 114°47.5′~122°42.3′ E longitude (Figure 1). Its land area is 155,800 square kilometers, about 721.03 km long from east to west and 437.28 km wide from south to north, including mountains, hills, plains, lakes, and other landforms, and it has a temperate and monsoonal climate. It governs 16 cities: Jinan, Qingdao, Zibo, Zaozhuang, Dongying, Yantai, Weifang, Jining, Taian, Weihai, Rizhao, Binzhou, Dezhou, Liaocheng, Linyi, and Heze. By the end of 2022, Shandong Province’s regional GDP reached CNY 8,743,513 million, ranking third among all provinces in China, with a per capita GDP of CNY 86,034.573. In the same year, the permanent population of Shandong Province was 101.628 million, ranking second in China. It can be seen that Shandong Province, as a large province in terms of population and economy, faces significant pressure on RECC, which indicates that Shandong Province should scientifically and effectively evaluate RECC and develop plans for socio-economic development and resource environmental protection after mastering information on RECC evaluation.
Figure 1.
Location of Shandong Province.
3. Data Sources and Study Methods
3.1. Data Sources
This study comprehensively considered various indices that might affect the regional RECC. The data used to evaluate the RECC of Shandong Province from 2013 to 2022 were mainly raw data on the lowest-level indices. In order to ensure the authenticity and reliability of the data, they are obtained from the Statistical Yearbook of Shandong Province and Its 16 Cities from 2014 to 2023, using cities as the basic statistical unit.
3.2. Study Methods
Research on RECC usually takes a certain region as the research scope. A region is a unified organism, with complex interrelationships and interactions among resource, environmental, economic, and social elements. Meanwhile, according to the RECC concept [1], the research on regional RECC studies this organism. It can also be said that the regional RECC is a concentrated reflection of the interaction among resources, the environment, the economy, and society, which should be the research object of regional RECC evaluation; the states of these four elements have an indicative effect on it, and are constantly changing. These changes seem disordered, but they are actually within a certain range. Once the range is exceeded, the state of the RECC will change from one to another. Therefore, to master the state of the regional RECC, it is necessary to evaluate the concentrated reflection. Rene Thom proposed and systematically elaborated the mutation theory [74]. This theory studies how continuous, gradual changes cause mutations in states and strives to describe them using a unified mathematical method. Based on this, this study used the mutation progression method, derived from mutation theory, to evaluate regional RECC.
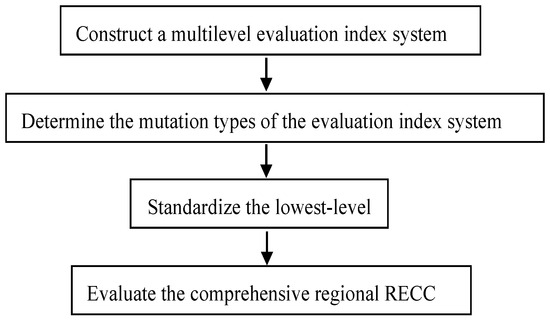
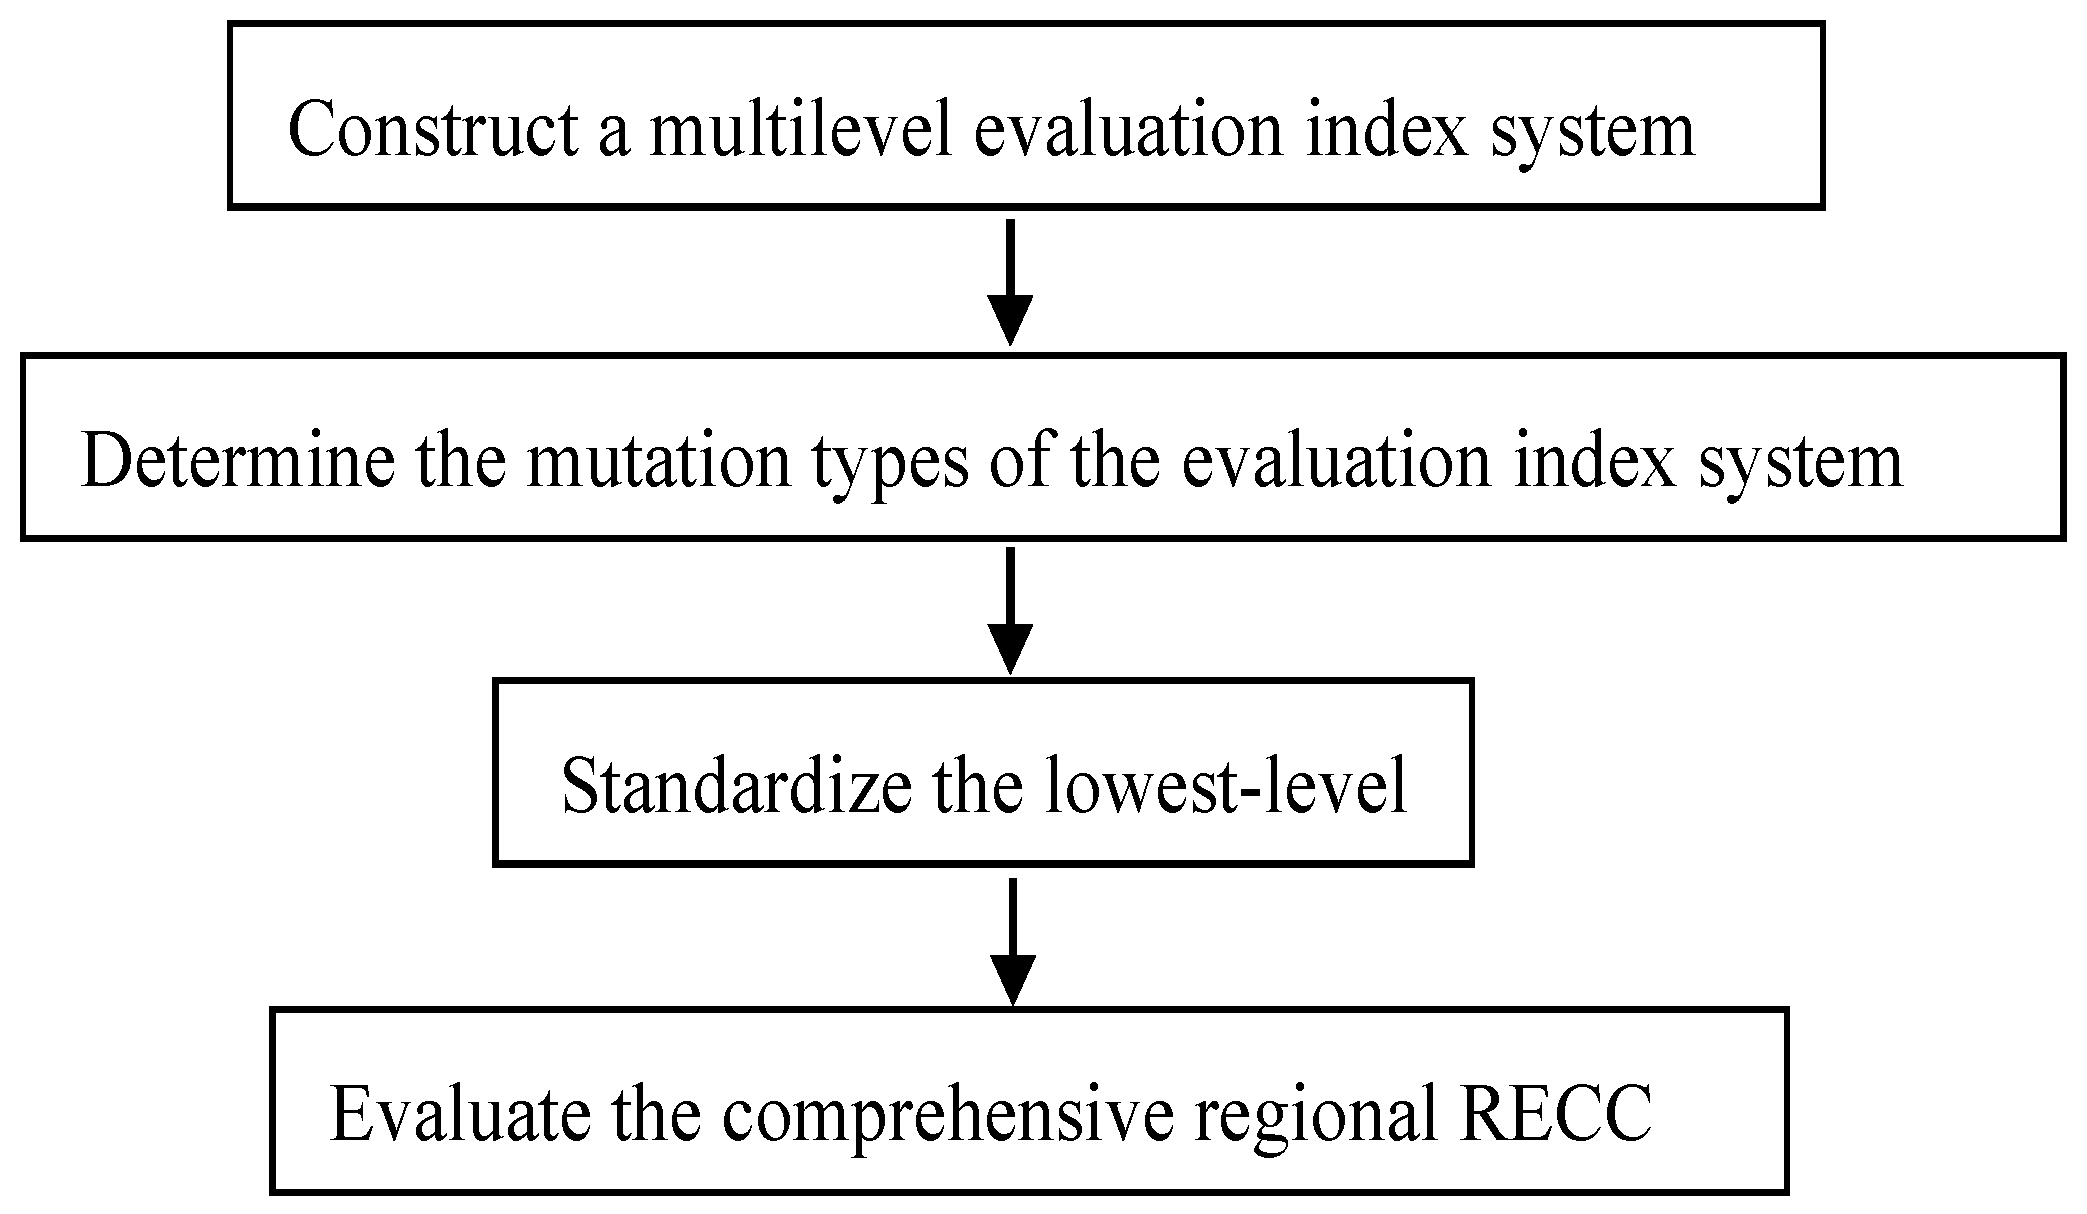
Learning from the basic steps of the mutation progression method, this study designed the following evaluation process for regional RECC (Figure 2).
Figure 2.
The evaluation process for the regional RECC.
3.2.1. Construction of an Evaluation Index System
The core and foundation of regional-RECC evaluation is the construction of an index system, and its appropriateness directly affects evaluation effectiveness. To objectively, scientifically, and comprehensively reflect the state of the regional RECC, the index system must embody the research object of RECC evaluation, which should be the concentrated reflection of the interaction between resources, the environment, the economy, and society. And the construction of the evaluation index system should include two tasks: designing the hierarchical relationship of indices and selecting specific indices. In the mutation progression method, each index is usually decomposed into at most four indices at the next level, and the indices at each level are sorted by importance. When evaluating, only the index data at the lowest level needs to be collected.
Based on the mutation progression method, combined with expert consultation and literature review, this study constructed the regional-RECC evaluation index system according to the principles of scientific nature, systematicity, hierarchy, quantifiability, and practicality (Table 1). This index system can be divided into four levels: target layer, criterion layer, index layer, and basic index layer. Among them, the target layer is the overall target of the index system, that is, the regional RECC; the criterion layer is the index established in accordance with the research object of RECC evaluation, reflecting the state of regional RECC from the four elements: resource utilization, environmental safety, economic development, and social progress; the index layer, based on the criterion layer, selects the index that reflects the essential characteristics of the four elements; and the basic index layer is a refinement of the index layer, which further explains the index layer.
Table 1.
The evaluation index system ofregional RECC.
3.2.2. Determination of the Mutation Types of the Evaluation Index System
The mutation progression method proposes four common mutation types: folding mutation, cusp mutation, swallowtail mutation, and butterfly mutation. The classification criteria for each type are that when a higher-level index is decomposed into one, two, three, or four lower-level indices, the higher-level index and its decomposed indices constitute a folding mutation, cusp mutation, swallowtail mutation, and butterfly mutation, respectively.
3.2.3. Standardization of the Lowest-Level Indices
According to the requirements of the mutation progression method, it is necessary to standardize the raw data for the lowest-level indices at the beginning of the evaluation to eliminate dimensional effects. This study adopts the fuzzy membership function method [75,76] to standardize these indices, and the standardized formulas for these three types of indices are as follows:
Positive indices:
Negative indices:
Moderate indices:
where represents the standardized value of the i-th index in the j area in one evaluation year; represents the raw data of the i-th index in the j area in one evaluation year; represents the maximum value in the raw data of the i-th index over the research period within the study area; represents the minimum value in the raw data of the i-th index over the research period within the study area; and represents the most ideal raw data of the i-th index over the research period within the study area.
3.2.4. Evaluation of the Comprehensive Regional RECC
Based on the mutation progression method, the most important approach to evaluating regional RECC is to use the normalization formula for each mutation type in relevant calculations. The comprehensive evaluation is a process that calculates the mutation progression values for each index layer by layer until the overall target’s mutation progression value is determined.
As mentioned above, an index in a certain layer and its decomposition indices in the next layer constitute a mutation type; the calculation of mutation progression values is based on this combination. The calculation process requires two steps: (1) the mutation progression values of the decomposition indexes in the next layer are calculated using the normalization formulas of the mutation types they belong to, and the normalization formulas of different mutation types are shown in Table 2; (2) the mutation progression value of the index from the previous layer is determined based on whether there is a complementary relationship between these decomposition indices, that is, whether they can compensate for each other’s shortcomings. This study assumes that the various components of regional RECC are complementary, so the mutation progression value of the index in the previous layer is taken as the average of the decomposition indices’ mutation progression values.
Table 2.
Normalization formulas of different mutation types.
Here, , , and represent the mutation progression values of the decomposition indices; , , , and represent the calculation bases.
In this study, the evaluation of the comprehensive regional RECC mainly consisted of three steps: First, combining the mutation types constituted by indices in the basic index layer and using the standardized values of the indices in the basic index layer as the calculation bases, we followed the above two calculation steps to calculate the mutation progression values of each index in the two layers over the research period in the study area. Then, based on the mutation types constituted by indices in the index layer and criterion layer and using the mutation progression values of indices in the index layer as the calculation bases, we calculated the new mutation progression values for the indices in the index layer and the mutation progression values for the indices in the criterion layer according to the two calculation steps mentioned above over the research period in the study area. Finally, similarly, by using the mutation progression values of the indices in the criterion layer calculated in the previous step as the calculation bases, and considering the mutation type constituted by the indices in the criterion layer and the total index, we can obtain the new mutation progression values of the indices in the criterion layer and the mutation progression value of the total target, and then we can proceed with the evaluation.
4. Results
4.1. Mutation Types of the Evaluation Index System
On the basis of the classification criteria for mutation types, the results for the mutation types of the evaluation index system are presented in Table 3.
Table 3.
The mutation types of the evaluation index system.
4.2. Standardized Processing of Raw Data
This study is based on the raw data for the lowest-level indices of Shandong Province from 2013 to 2022. Their standardized values were calculated using the standardized formulas and the attributes of the lowest-level indices. For moderate indices, the most ideal raw data for construction land per capita, land development intensity, and water resource utilization rate were set at 0.01 ha/person [77], 4.62% [78], and 40.00% [79], respectively. Considering the large number of standardized values in this study, we present the standardized values of Jinan, the capital city of Shandong Province (Table 4).
Table 4.
The standardized values of the lowest-level indices in Jinan from 2013 to 2022.
4.3. Comprehensive Evaluation of RECC in Shandong Province
4.3.1. Temporal Evolution Characteristics of RECC
All mutation progression values are calculated in accordance with the mutation types of the evaluation index system and the standardized values of the lowest-level indices, and the time series of the mutation progression values for the total target showed the trends of RECC in Shandong Province during 2013–2022 (Table 5). The time series of the mutation progression values of the criterion layer and index layer of the 16 cities in Shandong Province during 2013–2022 are displayed in Table A1, Table A2, Table A3, Table A4, Table A5, Table A6, Table A7, Table A8, Table A9, Table A10, Table A11, Table A12, Table A13, Table A14, Table A15, Table A16, Table A17, Table A18, Table A19, Table A20, Table A21, Table A22, Table A23, Table A24, Table A25, Table A26, Table A27, Table A28, Table A29, Table A30, Table A31 and Table A32 in Appendix A.
Table 5.
The mutation progression values of the total target in Shandong Province from 2013 to 2022.
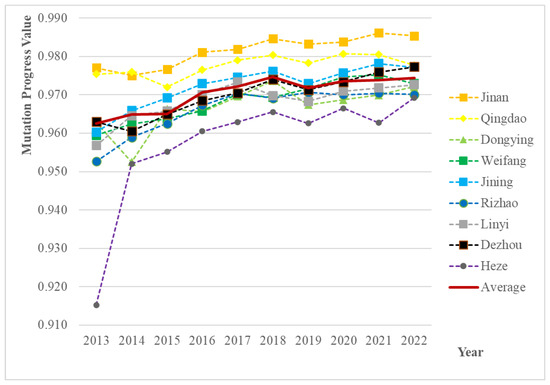
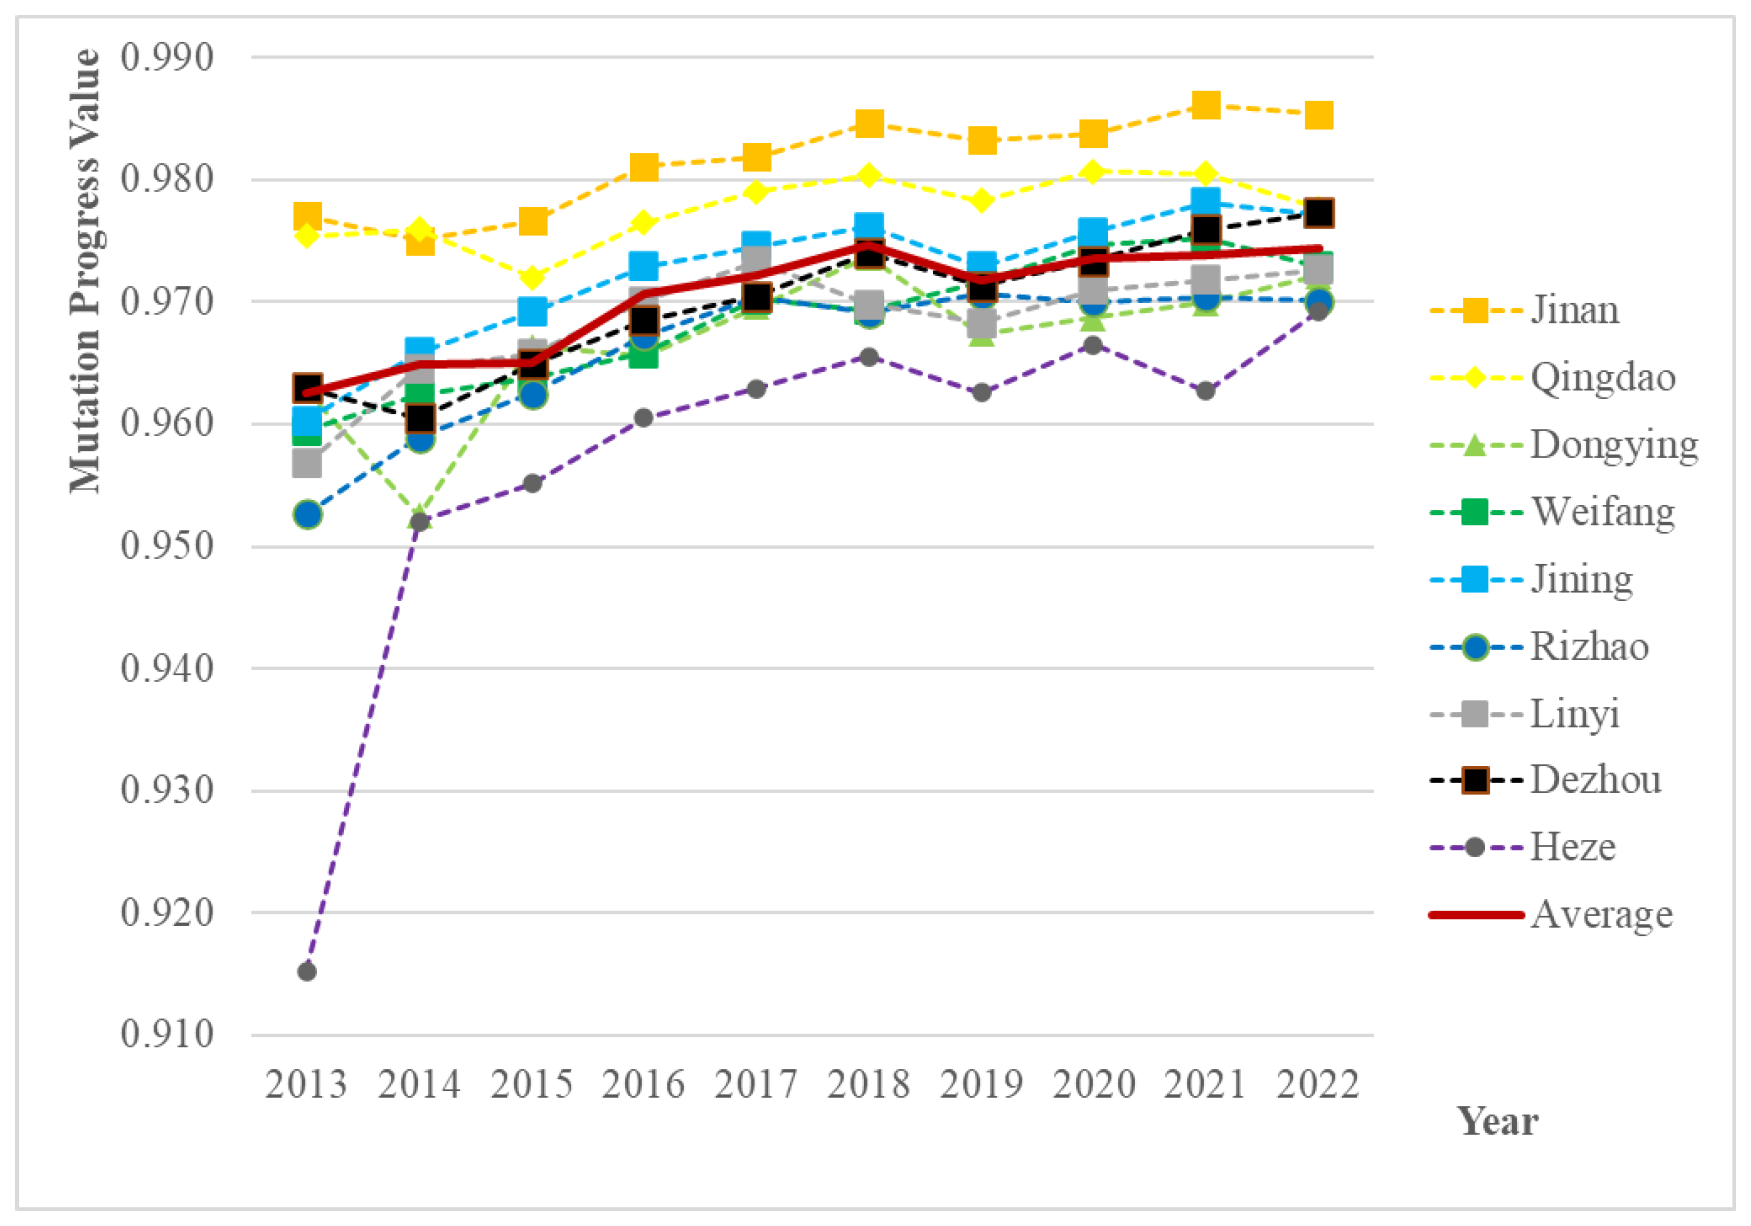
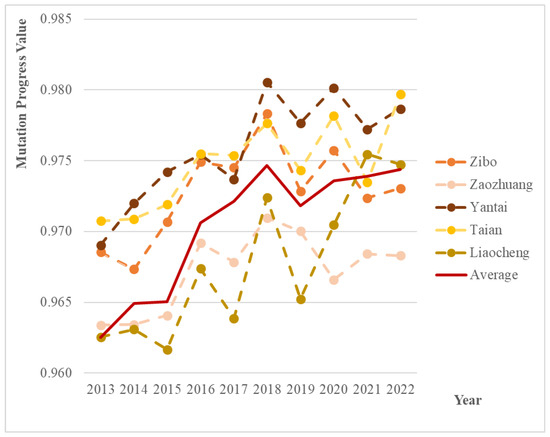
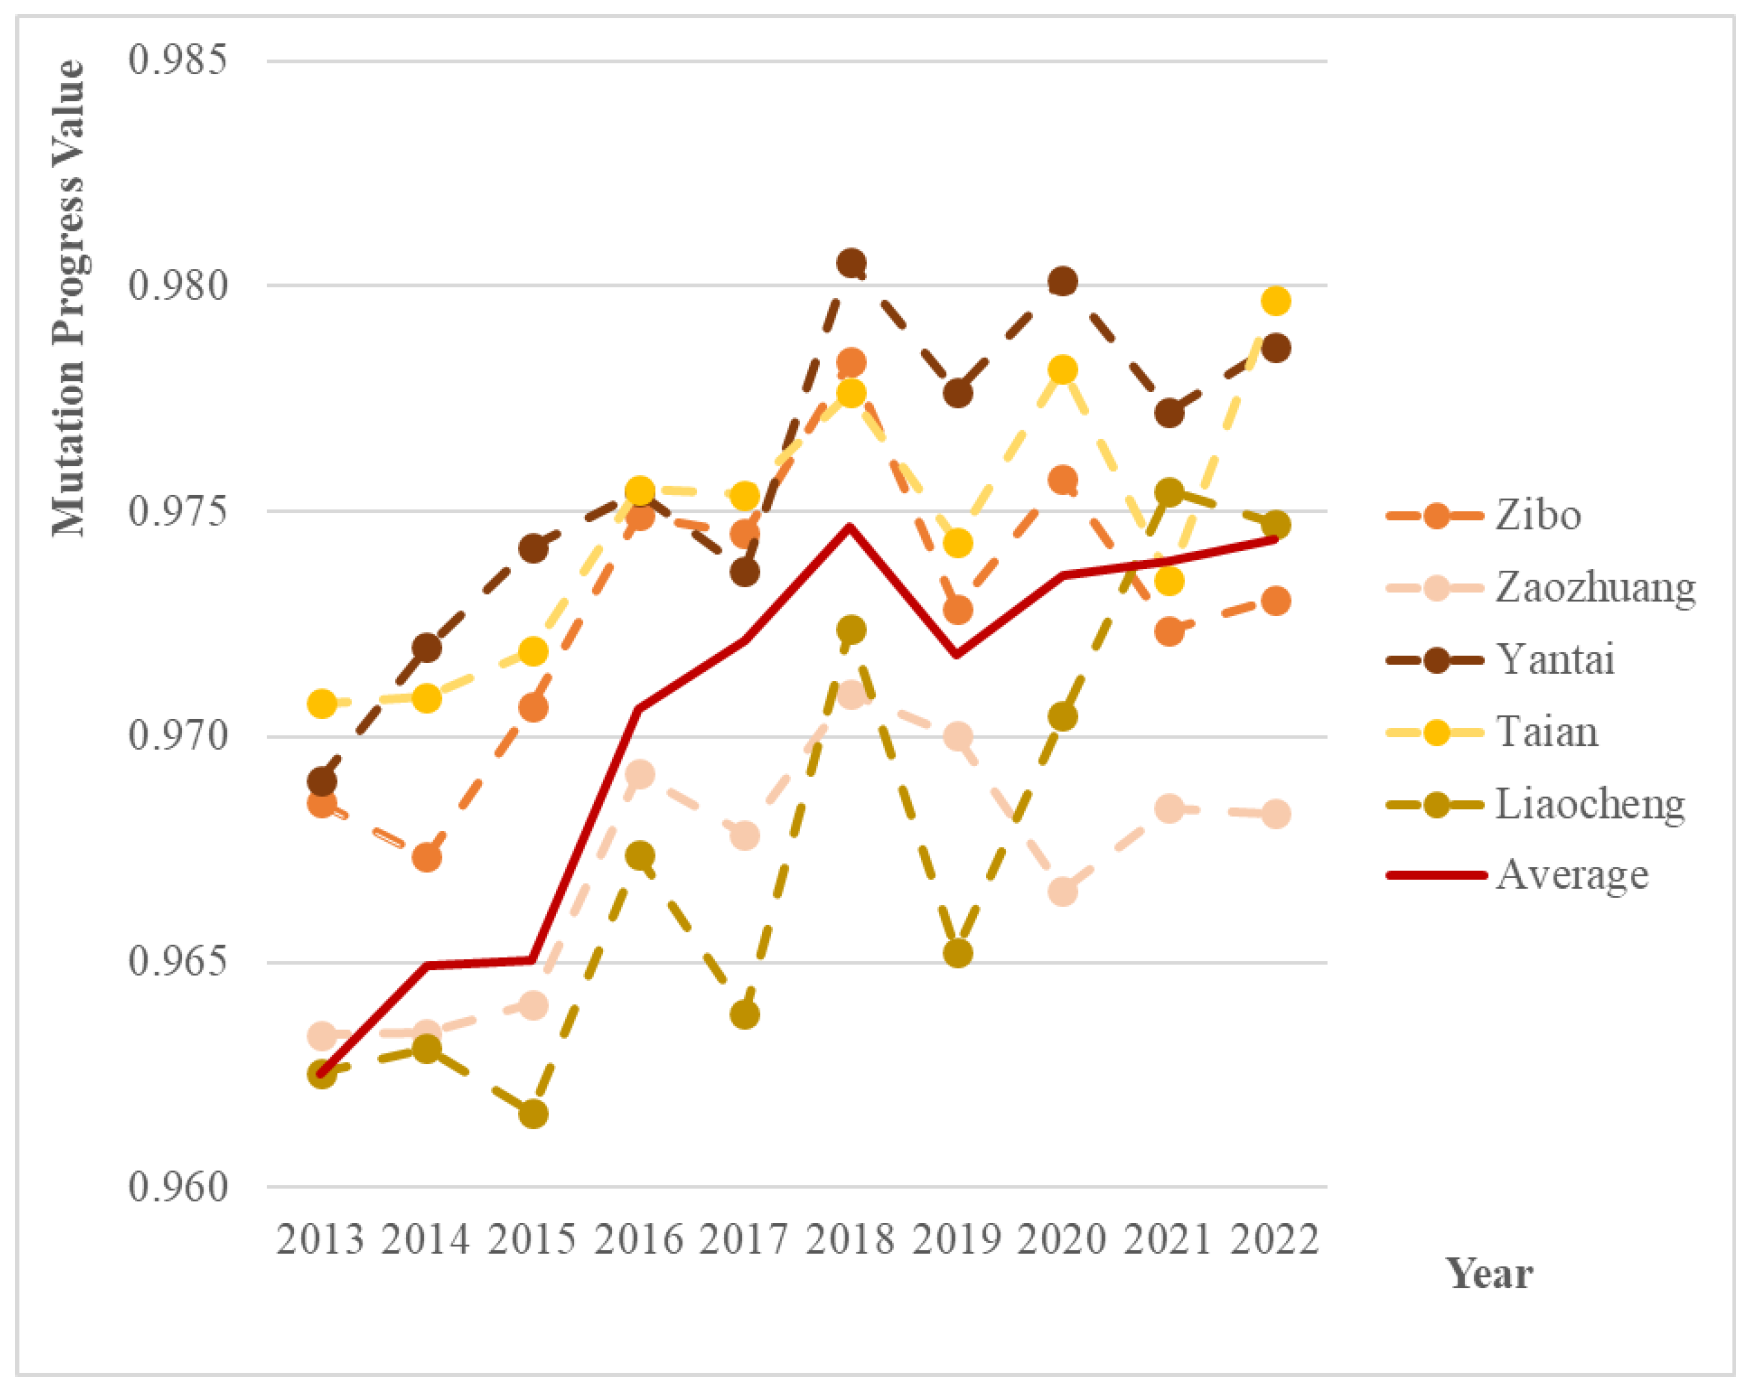
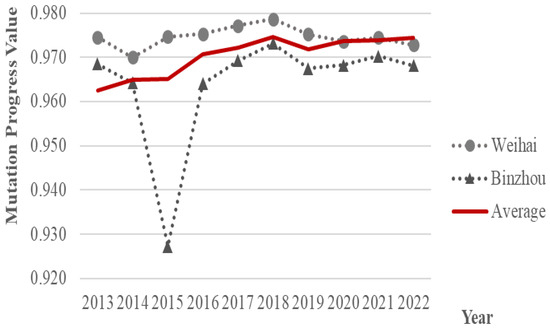
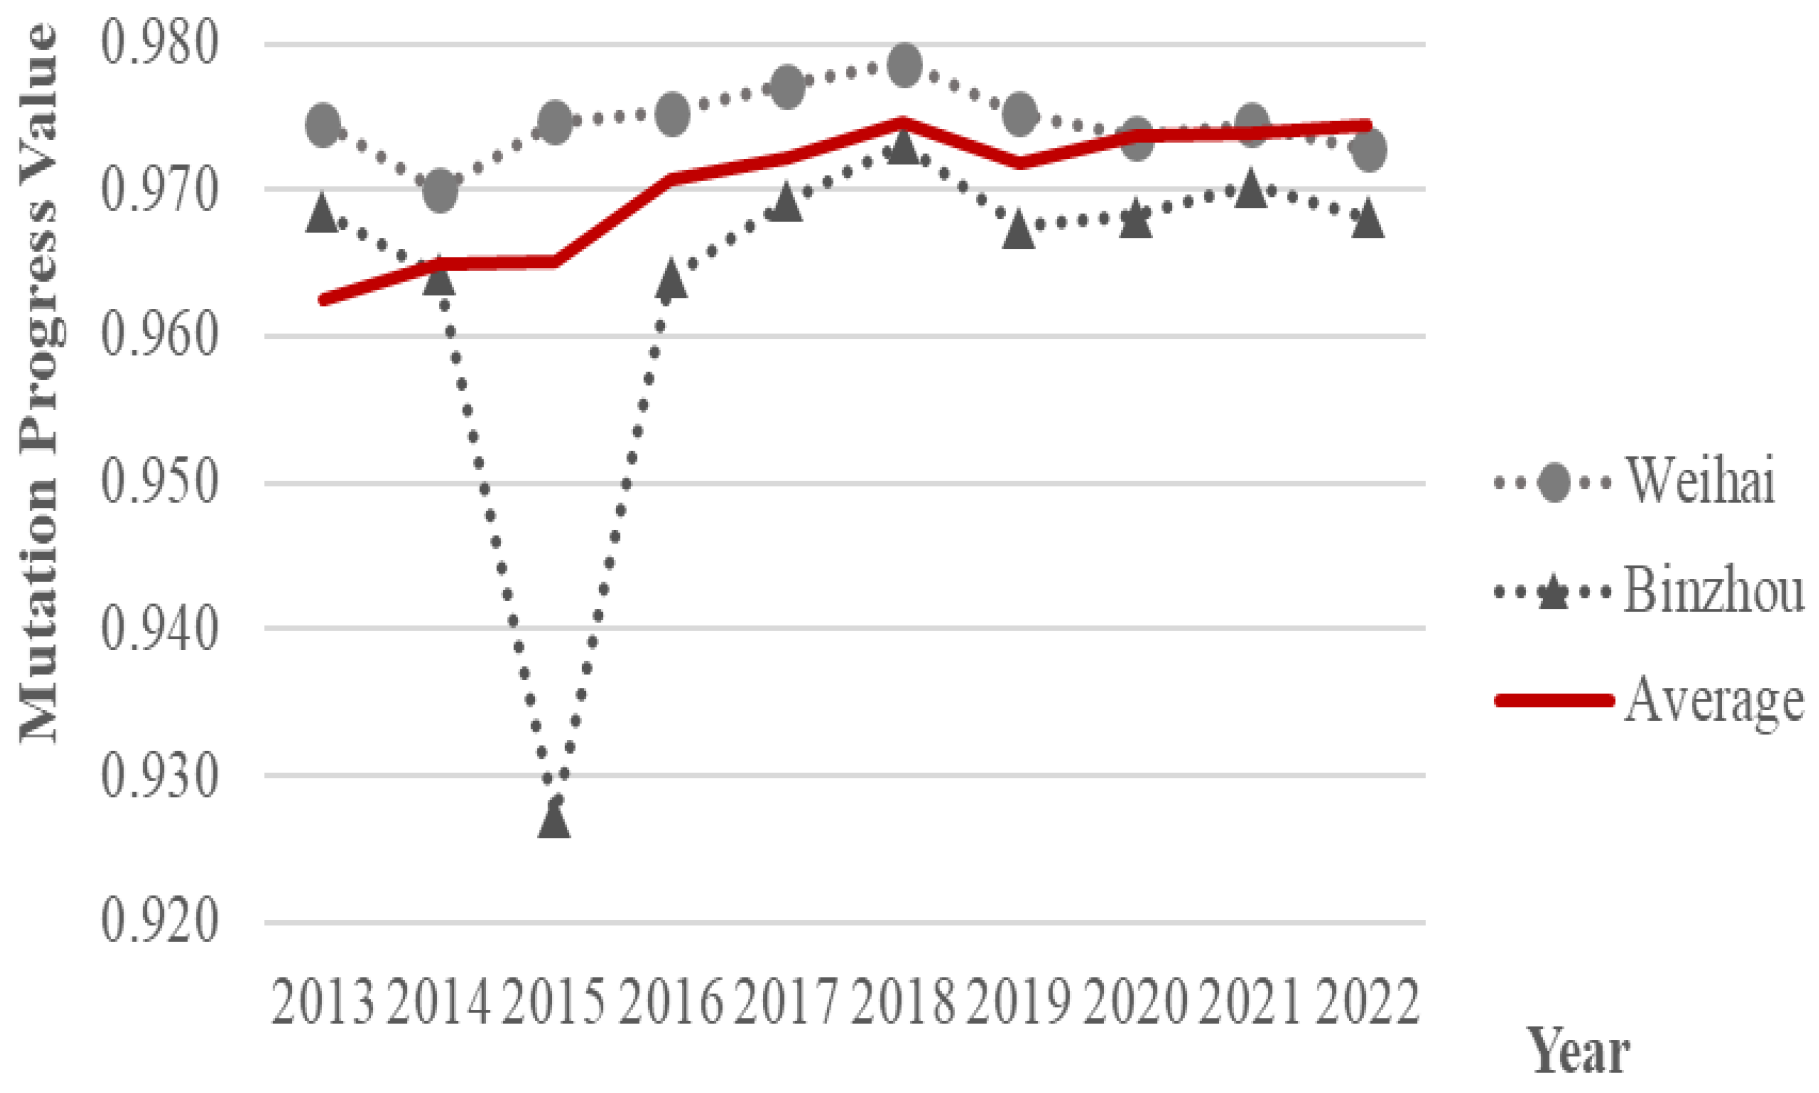
Based on comparing the mutation progression values for each city in Shandong Province in 2013 and 2022, we found that the trends in RECC across cities can be divided into two categories: increases and decreases. Then, by analyzing changes in mutation progression values for each year and city between 2013 and 2022, we further divided the trends into three types. The first type is a steady increase, which refers to two or fewer decreases in values compared with the previous year during the period (Figure 3). These cities include Jinan, Qingdao, Weifang, Jining, Rizhao, Linyi, Dezhou and Heze. The second type is a fluctuating increase, which shows that there were three or more times the decreases in values compared with the previous year, including Zibo, Zaozhuang, Yantai, Taian, and Liaocheng (Figure 4). The third type is a fluctuating decrease: there was more than three times the increase in values compared with the previous year during the decreasing process, including Weihai and Benzhou (Figure 5). The average mutation progression value of RECC in Shandong Province during 2013–2022 showed a steady increase. In these cities, the highest RECC was Jinan in 2021 (0.986), and the lowest was Heze in 2013 (0.915), with an average of 0.970. From the perspective of the evaluation index system, the reasons for the high RECC in Jinan are its outstanding construction land per capita, water resource utilization rate, afforestation area, contribution rate of tertiary industry, density of water supply, number of beds per 1000 persons, and number of college students per 10,000 persons. The reasons for the low RECC in Heze are its low GDP per capita, low contribution rate of tertiary industry, low disposable income per capita, low expense on household consumption per capita, low urbanization rate, low density of water supply, low number of college students per 10,000 persons, and low proportion of R&D personnel to the total population. The average RECC showed a maximum value of 0.975 in 2018 and a minimum value of 0.963 in 2013, and remained at 0.974 from 2020 to 2023, indicating that the level of RECC in Shandong Province has been relatively stable in recent years.
Figure 3.
The steady increase in RECC in Shandong Province during 2013–2022.
Figure 4.
The fluctuating increase in RECC in Shandong Province during 2013–2022.
Figure 5.
The fluctuating decrease in RECC in Shandong Province during 2013–2022.
4.3.2. Spatial Distribution Characteristics of RECC
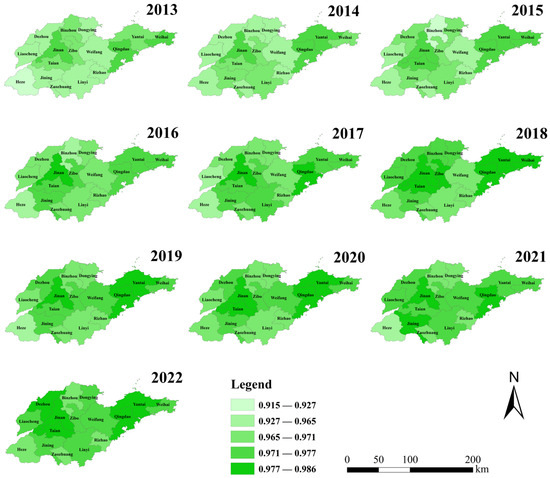
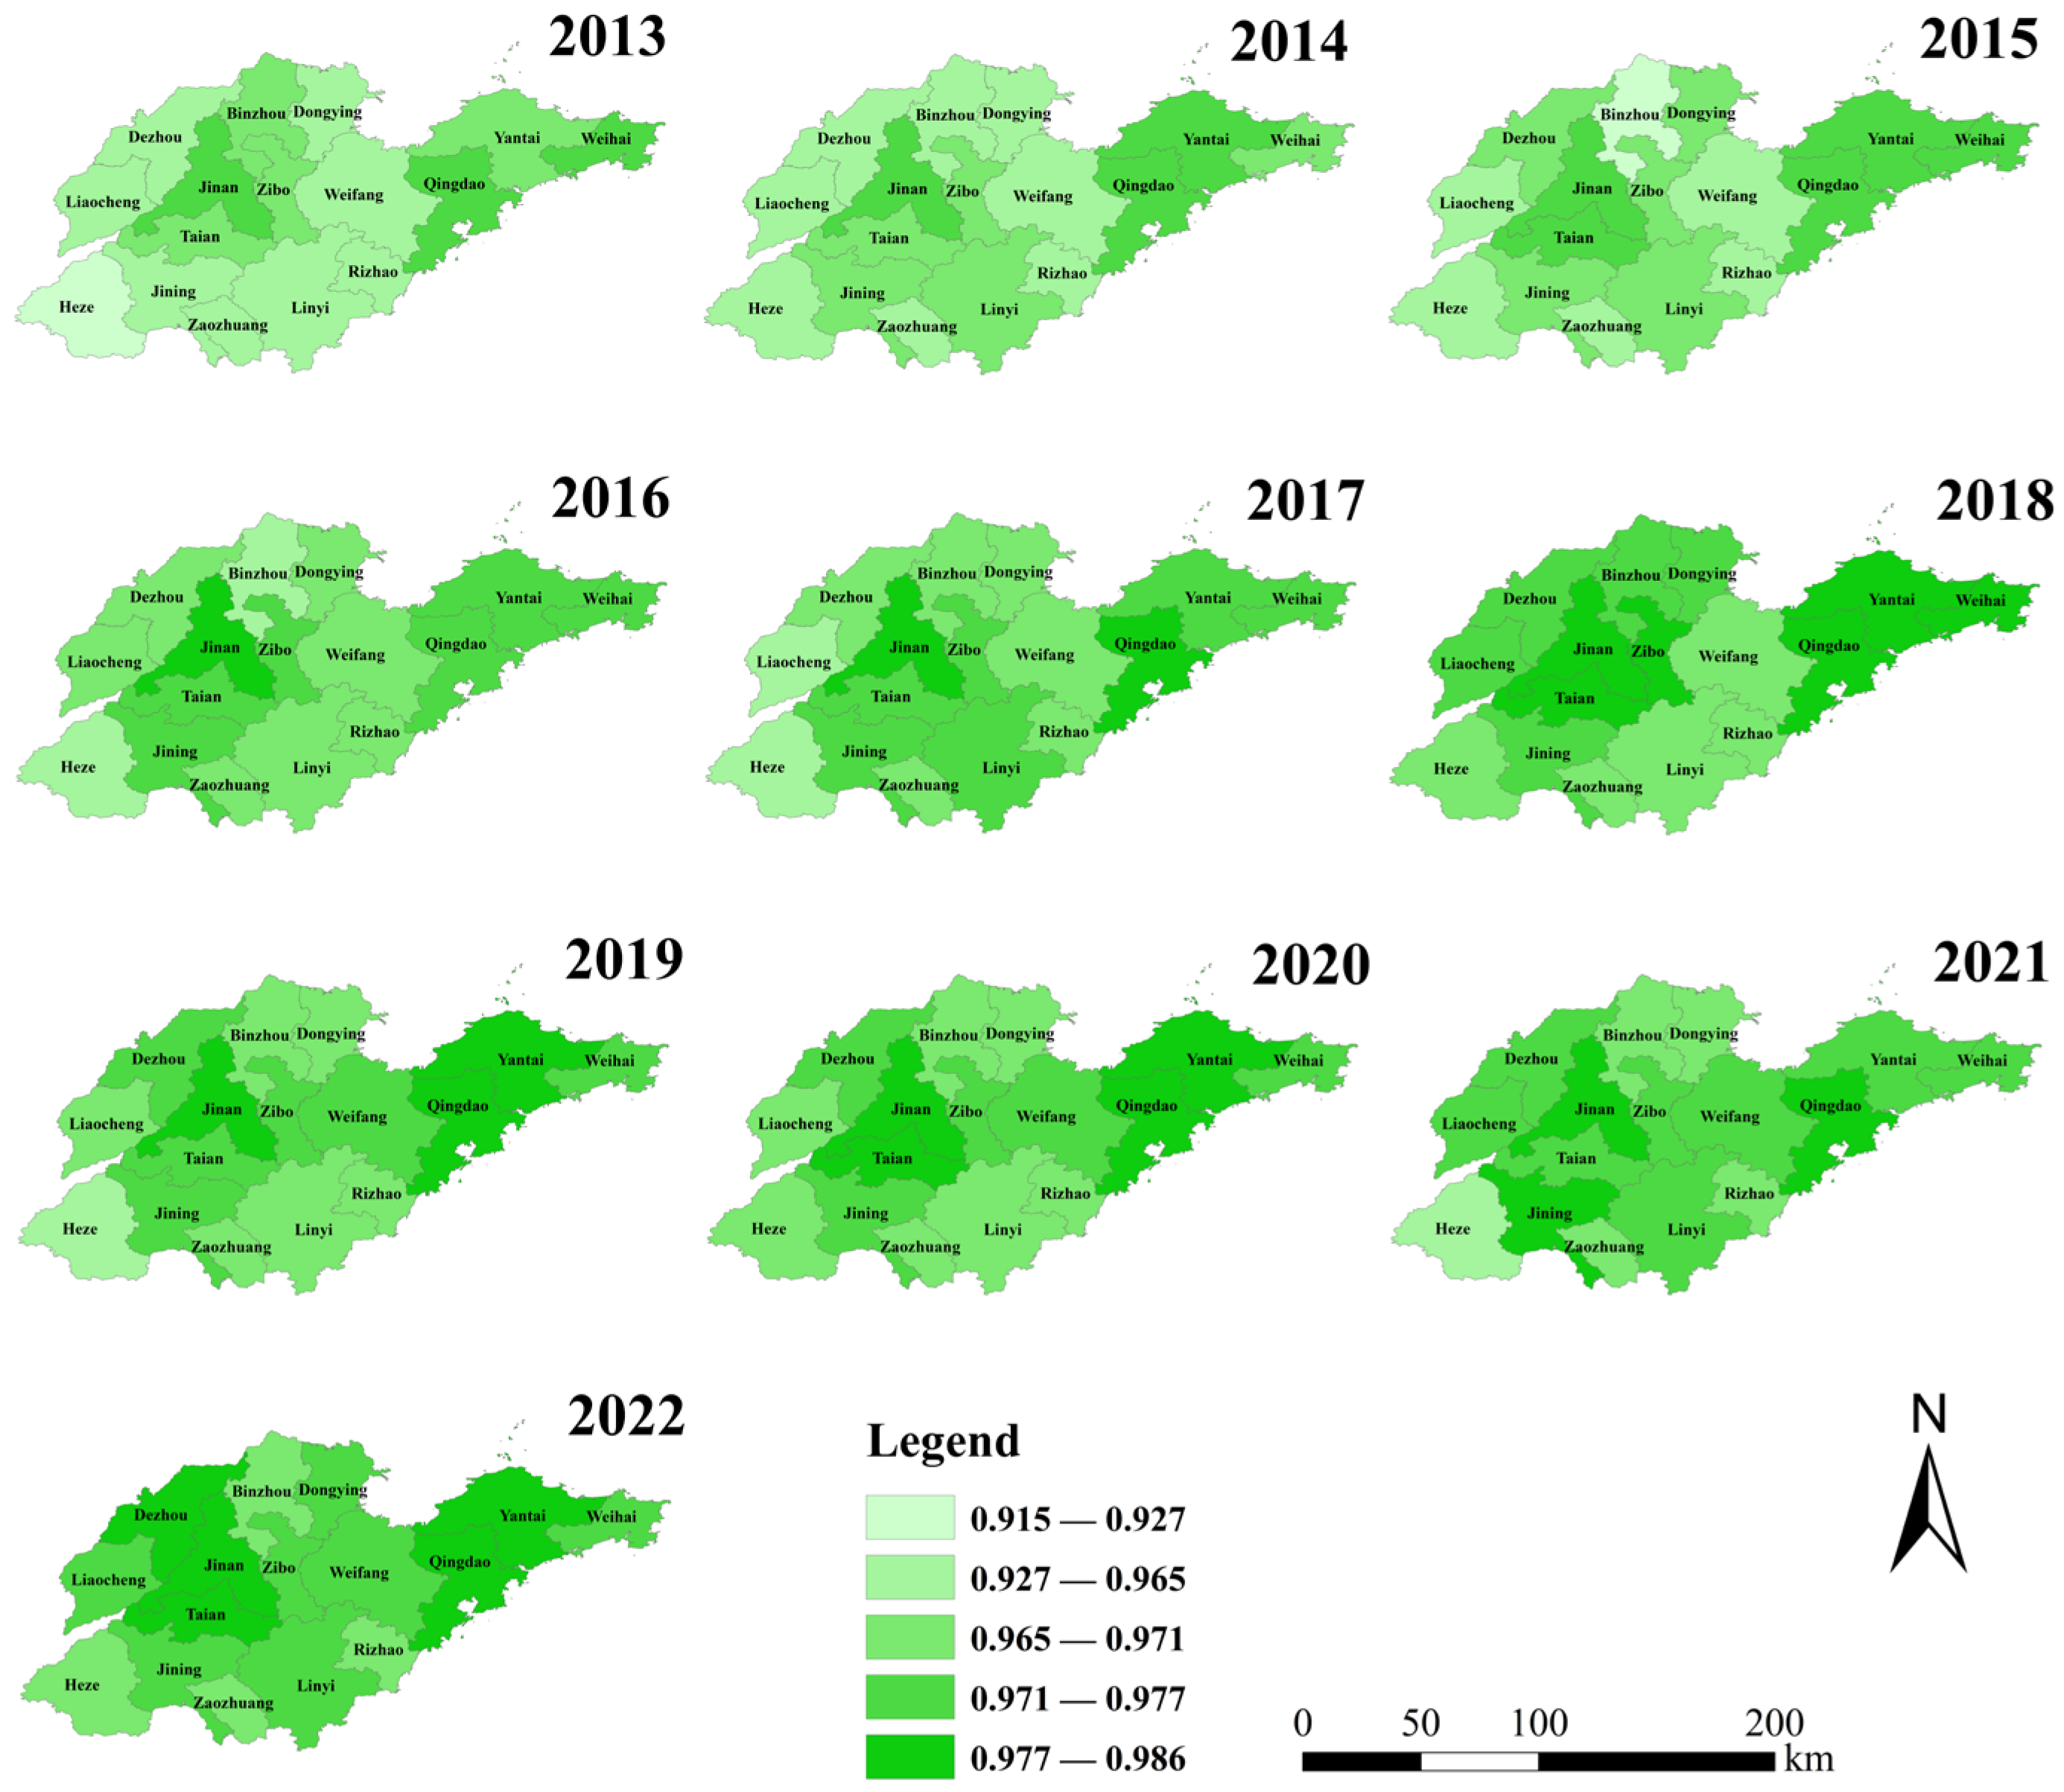
The spatial distribution of RECC levels during 2013–2022 is shown in Figure 6. The natural breaks method was used to classify the RECC level into five grades, with the first grade indicating the lowest and the fifth the highest. Overall, the RECC in eastern and central Shandong Province was relatively higher than in other parts of the province. From 2013 to 2022, the RECC in the western region showed an overall upward trend, with Heze recording the largest increase, from 0.915 in 2012 to 0.969 in 2022, with an increase of 5.902%. In central and eastern regions, except for Weihai and Benzhou, the RECC also showed an overall upward trend, with Weihai showing the largest decrease, from 0.975 in 2012 to 0.973 in 2022, a decrease of 0.205%.
Figure 6.
The spatial distribution of RECC in Shandong Province during 2013–2022.
5. Discussion
To better evaluate regional RECC in China, this study established an evaluation index system and calculated the RECC of Shandong Province for 2013–2022 using the mutation progression method.
From the perspective of temporal evolution characteristics, the average mutation progression value of RECC in Shandong Province during 2013–2022 showed a trend of first increasing, then decreasing, and then increasing again. It increased until 2018, decreased in 2019, and then increased gradually. From the mutation progression values of the 16 cities in 2013 and 2018 (Table 5), the overall RECC of each city increased during those 6 years, although there were some increases or decreases during the period. This finding may be explained as follows. Shandong has always held a pivotal position in Chinese history and is a huge province in the economic, social, ecological, cultural, and political landscape of modern China. Especially after the conclusion of the 18th National Congress of the Communist Party of China in 2012, Shandong Province was the first province inspected by the General Secretary. Subsequently, in order to conscientiously implement the major strategic initiatives of the congress, Shandong Province released the Major Function Oriented Zone Planning in 2013, which clearly stated that the development direction of the region should be based on its RECC, thus achieving harmonious development of resources, the environment, the economy, and society [80]. Since then, Shandong Province has changed the way it pursues socio-economic development, at the cost of excessive resource consumption and environmental destruction. In addition, since 2013, Shandong Province has released a series of policies such as the Notice on Implementing the 2013 Municipal Government’s Responsibility Target for Cultivated Land Protection [81], Opinions on Further Promoting Land Conservation and Intensive Use [82], Notice on the Implementation of the Strictest Assessment Method for Water Resources Management System in Shandong Province [83], The 13th Five Year Plan for Ecological Environment Protection in Shandong Province [84], and Action Plan for the Construction of Basic Public Service System in Shandong Province (2013–2015) [85]. The implementation of these policies has enabled Shandong Province to achieve a series of achievements in optimizing resource utilization, consolidating environmental security, promoting economic development, and advancing social progress [86], as well as enhancing its RECC; therefore, its RECC has been increasing since 2013. This shows that the decisions of the central government are important factors affecting regional RECCs.
Then, the mutation progression values of the 16 cities in Shandong Province in 2019 all decreased compared to 2018, which is also a unified characteristic of the RECC of the 16 cities in Shandong Province in the time series, as shown in Figure 3, Figure 4 and Figure 5. The first of the big causes is that the change in the identified standard of cultivated land in the third national land resource survey [87] and the strict restrictions of construction land based on the urban growth boundary [88] resulted in a decrease in the land resource carrying capacity (Appendix A). The second main reason is due to the amount of precipitation and the local water resources decreasing significantly compared with the previous year [89], the water resource carrying capacity decreased (Appendix A). And the decline in national economic development caused by changes in GDP accounting [90] is the third main reason (Appendix A). These indicate that the natural background conditions and the decisions of the central government are the important factors affecting regional RECCs. Still, the RECC in Shandong Province has increased again after 2019 and has remained relatively stable since then. However, the increase is not due to the four aspects of resource utilization, environmental safety, economic development, and social progress all being improved: the increase in the discharge of major pollutants caused by regional production and living activities, as well as the overall reduction in afforestation area, have led to a decrease in the environmental safety level of many cities over the three years. However, the government’s support for the tertiary industry, employment, social security, health care, education, science and technology, etc., in these three years [91,92,93] has improved the economic development and social progress of Shandong Province, making up for the decrease in RECC caused by the decrease in environmental safety. This indicates that the mode of production and life and the decisions of the central government are the important factors affecting regional RECCs.
From the perspective of the spatial distribution characteristics of RECC in Shandong Province, the RECC in eastern and central Shandong Province is relatively higher than that in the other parts of the province. This finding may be explained as follows. The Spatial Planning of National Land in Shandong Province has made a major contribution to all cities in the province. It is determined in the planning that the national-level urbanized areas in Shandong Province are concentrated in the east. As is well known, in China, these areas already have a strong carrying capacity or need to increase it. The high RECC in central Shandong is due to the provincial capital, Jinan, which is also a national-level urbanized area, driving the development of surrounding areas, many of which have become provincial-level urbanized areas. It is not unique; Cheng et al. also found that regional RECCs are influenced by their main function in their evaluation study in 31 provinces of China [94]. This once again shows that the central government’s decisions are important factors affecting regional RECCs.
This study has achieved some results, but it still faces several limitations. First, selecting the research scale is crucial for studying RECC. In this study, to ensure the accessibility, continuity, and integrity of the data, we selected 16 provincial-level cities in Shandong Province for research, and the results were obtained according to the actual situation. If we can collect relevant data at the micro-scale in the future, the research results will be more accurate. Second, there is currently no unified, ready-made index system for evaluating regional RECC. From a practical perspective, the data of the evaluation index system constructed in this study is relatively easy to obtain. The evaluation index system can be supplemented or modified in subsequent work. When the data of some indices cannot be publicly obtained, cross-departmental collaboration can be considered to obtain them, such as obtaining indices reflecting soil quality from the agricultural sector, to more comprehensively evaluate the regional land carrying capacity. In addition, future research can also make full use of GIS spatial-analysis technology to obtain index data, such as interpreting remote sensing images to obtain the percentage of forest cover, to more comprehensively evaluate the regional environmental status.
6. Conclusions
This study defined the research object of regional RECC evaluation and introduced the mutation progression method into the evaluation. Based on this method, this study developed an evaluation index system and elaborated on the detailed evaluation process of regional RECC. An empirical study was conducted in Shandong Province. The main conclusions are as follows:
1. According to the research scope and concept of RECC, the core of regional RECC is resources, the environment, the economy, and society. Therefore, this study clarifies that the research object of regional RECC evaluation is essentially the concentrated reflection of the interaction between resources, the environment, the economy, and society. Based on this, an evaluation index system reflecting regional resource utilization, environmental safety, economic development, and social progress was constructed. This evaluation index system consists of four levels, fully reflecting the core of regional RECC, and it combines the four components of regional RECC with the comprehensive regional RECC. It provided a good idea and reference for evaluating the state of RECC across different regions and also expanded the research system for regional RECC.
2. Based on the mutation progression method developed from this theory, this study proposes an evaluation process of “construct a multilevel evaluation index system–determine the mutation types of the evaluation index system–standardize the lowest level indexes–evaluate the comprehensive regional RECC“ for RECC evaluation, which enriches the method for evaluating the regional RECC. Regions can evaluate their RECCs through this process to understand their current state. The application of this evaluation process can effectively assist local governments in conducting RECC evaluations, helping formulate and optimize policies and regulations related to RECC.
3. The main findings of the evaluation are as follows: (a) The RECC in Shandong Province showed a steady increasing trend during 2013–2022, with the lowest RECC in Heze in 2013 and the highest RECC in Jinan in 2021. (b) From the perspective of spatial distribution, the RECC in eastern and central Shandong Province was relatively higher than in other areas during 2013–2022. (c) Based on RECC evaluations in Shandong Province, we found that the natural background conditions, the mode of production and life, and the decisions of the central government are the important factors affecting regional RECCs.
Author Contributions
Conceptualization, L.T. and D.W.; methodology, L.T.; software, L.T., Y.W. and J.H.; validation, L.T.; formal analysis, L.T. and D.W.; investigation, J.H., Q.C., X.C. and B.X.; resources, L.T. and J.H.; data curation, J.H., Q.C., X.C. and B.X.; writing—original draft preparation, L.T. and J.H.; writing—review and editing, L.T., J.H., Q.C., X.C., B.X. and Y.W.; visualization, L.T. and J.H.; supervision, D.W.; project administration, L.T.; funding acquisition, L.T. and Y.W. All authors have read and agreed to the published version of the manuscript.
Funding
This research was funded by the project ZR2023QG131 supported by the Shandong Provincial Natural Science Foundation.
Institutional Review Board Statement
Not applicable.
Informed Consent Statement
Not applicable.
Data Availability Statement
The data presented in this study are available on request from the corresponding author.
Conflicts of Interest
The authors declare no conflicts of interest.
Appendix A
Table A1.
The mutation progression values of the index layer in Jinan from 2013 to 2022.
Table A2.
The mutation progression values of the index layer in Qingdao from 2013 to 2022.
Table A3.
The mutation progression values of the index layer in Zibo from 2013 to 2022.
Table A4.
The mutation progression values of the index layer in Zaozhuang from 2013 to 2022.
Table A5.
The mutation progression values of the index layer in Dongying from 2013 to 2022.
Table A6.
The mutation progression values of the index layer in Yantai from 2013 to 2022.
Table A7.
The mutation progression values of the index layer in Weifang from 2013 to 2022.
Table A8.
The mutation progression values of the index layer in Jining from 2013 to 2022.
Table A9.
The mutation progression values of the index layer in Taian from 2013 to 2022.
Table A10.
The mutation progression values of the index layer in Weihai from 2013 to 2022.
Table A11.
The mutation progression values of the index layer in Rizhao from 2013 to 2022.
Table A12.
The mutation progression values of the index layer in Linyi from 2013 to 2022.
Table A13.
The mutation progression values of the index layer in Dezhou from 2013 to 2022.
Table A14.
The mutation progression values of the index layer in Liaocheng from 2013 to 2022.
Table A15.
The mutation progression values of the index layer in Binzhou from 2013 to 2022.
Table A16.
The mutation progression values of the index layer in Heze from 2013 to 2022.
Table A17.
The mutation progression values of the criterion layer in Jinan from 2013 to 2022.
Table A18.
The mutation progression values of the criterion layer in Qingdao from 2013 to 2022.
Table A19.
The mutation progression values of the criterion layer in Zibo from 2013 to 2022.
Table A20.
The mutation progression values of the criterion layer in Zaozhuang from 2013 to 2022.
Table A21.
The mutation progression values of the criterion layer in Dongying from 2013 to 2022.
Table A22.
The mutation progression values of the criterion layer in Yantai from 2013 to 2022.
Table A23.
The mutation progression values of the criterion layer in Weifang from 2013 to 2022.
Table A24.
The mutation progression values of the criterion layer in Jining from 2013 to 2022.
Table A25.
The mutation progression values of the criterion layer in Taian from 2013 to 2022.
Table A26.
The mutation progression values of the criterion layer in Weihai from 2013 to 2022.
Table A27.
The mutation progression values of the criterion layer in Rizhao from 2013 to 2022.
Table A28.
The mutation progression values of the criterion layer in Linyi from 2013 to 2022.
Table A29.
The mutation progression values of the criterion layer in Dezhou from 2013 to 2022.
Table A30.
The mutation progression values of the criterion layer in Liaocheng from 2013 to 2022.
Table A31.
The mutation progression values of the criterion layer in Binzhou from 2013 to 2022.
Table A32.
The mutation progression values of the criterion layer in Heze from 2013 to 2022.
References
- Ministry of Natural Resources of the People’s Republic of China. Guidelines for Evaluating the Carrying Capacity of Resources and Environment and the Suitability of National Land Space Development (Trial). Available online: https://gi.mnr.gov.cn/202001/t20200121_2498502.html (accessed on 19 January 2020).
- Malthus, T.R. An Essay on the Principle of Population; J. Johnson: London, UK, 1798. [Google Scholar]
- Verhulst, P.F. Notice Sur La Loi Que La Population Suit Dans Son Accroissement. Correspondance Mathématique Et Physique Publiée Par A. Quetelet 1983, 10, 113–121. [Google Scholar]
- Park, R.E.; Burgess, E.W. An Introduction to the Science of Sociology; The University of Chicago Press: Chicago, IL, USA, 1921. [Google Scholar]
- Hadwen, I.A.S.; Palmer, L.J. Reindeer in Alaska; Government Printing Office: Washington, USA, 1922.
- Leopold, A. Wilderness ss A Land Laboratory. Living Wild. 1941, 6, 3. [Google Scholar]
- Clarke, A.L. Assessing the Carrying Capacity of the Florida Keys. Popul. Environ. 2003, 23, 405–418. [Google Scholar] [CrossRef] [Scilit]
- Meadows, D.H.; Meadows, D.L.; Randers, J.; Behren, W.W. The Limits to Growth: A Report for the Club of Rome’s Project on the Predicament of Mankind; Universe Books: New York, NY, USA, 1972. [Google Scholar]
- Zhang, F.; Wang, Y.; Ma, X.; Wang, Y.; Yang, G.; Zhu, L. Evaluation of resources and environmental carrying capacity of 36 large cities in China based on a support-pressure coupling mechanism. Sci. Total Environ. 2019, 688, 838–854. [Google Scholar] [CrossRef] [Scilit]
- Fu, J.; Zang, C.; Zhang, J. Economic and resource and environmental carrying capacity trade-off analysis in the Haihe River basin in China. J. Clean. Prod. 2020, 270, 122271. [Google Scholar] [CrossRef] [Scilit]
- UNESCO; FAO. Carrying Capacity Assessment with a Pilot Study of Kenya: A Resource Accounting Methodology for Exploring National Options for Sustainable Development; Food and Agriculture Organization of the United Nations: Rome, Italy, 1985. [Google Scholar]
- Harris, G.M.; Kennedy, S. Carrying Capacity in Agriculture: Globe and Regional Issue. Ecol. Econ. 1999, 129, 443–461. [Google Scholar] [CrossRef] [Scilit]
- Shapiro, I. Resources, Capacities, and Ownership: The Workmanship Ideal and Distributive Justice. Polit. Theory 1991, 19, 47–72. [Google Scholar] [CrossRef] [Scilit]
- Graymore, M.L.M.; Sipe, N.G.; Rickson, R.E. Sustaining Human Carrying Capacity: A Tool for Regional Sustainability Assessment. Ecol. Econ. 2010, 69, 459–468. [Google Scholar] [CrossRef] [Scilit]
- Godchalk, D.R.; Parker, F.H. Carrying Capacity: A Key to Environment Planning. J. Soil Water Conserv. 1975, 30, 160–165. [Google Scholar]
- Schneider, W.A. Integral Formulation for Migration in Two and Three Dimensions. Geophysics 1978, 43, 49–76. [Google Scholar] [CrossRef] [Scilit]
- Arrow, K.; Bolin, B.; Costanza, R.; Dasgupta, P.; Folke, C.; Holling, C.S.; Jansson, B.-O.; Levin, S.; Mäler, K.-G.; Perrings, C.; et al. Economic Growth, Carrying Capacity, and the Environment. Ecol. Econ. 1995, 15, 89–90. [Google Scholar] [CrossRef] [Scilit]
- Peng, T.; Deng, H.W. Evaluating Urban Resource and Environment Carrying Capacity by Using an Innovative Indicator System Based on Eco-Civilization—A Case Study of Guiyang. Environ. Sci. Pollut. R. 2020, 28, 6941–6955. [Google Scholar] [CrossRef] [Scilit]
- Liao, S.J.; Wu, Y.; Wong, S.W.; Shen, L.Y. Provincial Perspective Analysis on the Coordination between Urbanization Growth and Resource Environment Carrying Capacity (RECC) in China. Sci. Total Environ. 2020, 730, 138964. [Google Scholar] [CrossRef] [Scilit]
- Shen, L.Y.; Shu, T.H.; Liao, X.; Yang, N.; Ren, Y.T.; Zhu, M.C.; Cheng, G.Y.; Wang, J.H. A New Method to Evaluate Urban Resources Environment Carrying Capacity from the Load-and-Carrier Perspective. Resour. Conserv. Recy. 2020, 154, 104616. [Google Scholar] [CrossRef] [Scilit]
- Luo, W.Z.; Ren, Y.T.; Shen, L.Y.; Zhu, M.C.; Jiang, Y.M.; Meng, C.H.; Zhang, P.X. An Evolution Perspective on the Urban Land Carrying Capacity in the Urbanization Era of China. Sci. Total Environ. 2020, 744, 140827. [Google Scholar] [CrossRef] [Scilit] [PubMed]
- Shen, L.Y.; Cheng, G.Y.; Du, X.Y.; Meng, C.H.; Ren, Y.T.; Wang, J.H. Can Urban Agglomeration bring “1 + 1 > 2Effect”? A Perspective of Land Resource Carrying Capacity. Land Use Policy 2022, 117, 106094. [Google Scholar] [CrossRef] [Scilit]
- He, Y.H.; Wang, Z.R. Water-Land Resource Carrying Capacity in China: Changing Trends, Main Driving Forces, and Implications. J. Clean. Prod. 2022, 331, 130003. [Google Scholar] [CrossRef] [Scilit]
- Wang, S.Z.; Zhang, Y.X.; Fan, J.W.; Zhang, H.Y.; Fang, H.J. Comprehensive Sustainability Indicator for Land Resource-Carrying Capacity in a Farming-Pastoral Region. Remote Sens. 2023, 15, 3726. [Google Scholar] [CrossRef] [Scilit]
- Lu, B.B.; Shi, Y.L.; Qin, S.X.; Yue, P.; Zheng, J.H.; Harris, P. Evaluating Urban Land Resource Carrying Capacity with Geographically Weighted Principal Component Analysis: A Case Study in Wuhan, China. Trans. GIS 2024, 28, 2346–2356. [Google Scholar] [CrossRef] [Scilit]
- Yin, L.G.; Li, H.; Liu, D.; Zhang, L.L.; Wang, C.Q.; Li, M.; Faiz, M.A.; Li, T.X.; Cui, S. Interpretation and Comprehensive Evaluation of Regional Water–Land–Energy Coupling System Carrying Capacity. Sustainability 2025, 17, 1669. [Google Scholar] [CrossRef] [Scilit]
- Dai, D.; Sun, M.D.; Lv, X.B.; Lei, K. Evaluating Water Resource Sustainability from the Perspective of Water Resource Carrying Capacity, a case study of the Yongding River watershed in Beijing-Tianjin-Hebei region, China. Environ. Sci. Pollut. Res. 2020, 27, 21590–21603. [Google Scholar] [CrossRef] [Scilit] [PubMed]
- Khorsandi, M.; Homayouni, S.; van Oel, P. The Edge of the Petri Dish for a Nation: Water Resources Carrying Capacity Assessment for Iran. Sci. Total Environ. 2022, 817, 153038. [Google Scholar] [CrossRef] [Scilit]
- Hadipour, M.; Pourebrahim, S.A.; Heidari, H.; Nikooy, F.; Ahmed, A.N.; Ern, C.J. Evaluation of Water Resource Balance in the Urmia Lake Basin: Integrating Carrying Capacity and Water Footprint Model for Sustainable Management. Ecol. Indic. 2024, 166, 112464. [Google Scholar] [CrossRef] [Scilit]
- Liu, Z.L.; Bao, Y.Y. Spatial and Temporal Divergence of Water Resource Carrying Capacity in Hubei Province, China, from the Perspective of Three Major Urban Agglomerations. Sustainability 2024, 16, 5059. [Google Scholar] [CrossRef] [Scilit]
- Utomo, A.D.; Aida, S.N.; Yosmaniar; Fatah, K.; Zaidan, M.H.M.; Wulandari, T.N.M. A Review on the Challenges of Balancing Fisheries Resource Management in Indonesia’s Inland Waters. Pol. J. Environ. Stud. 2024, 33, 5003–5015. [Google Scholar] [CrossRef] [Scilit]
- Yu, X.G.; Deng, R.M.; Li, F.Q.; Zhai, D.T.; Meng, C. Evaluation and Obstacle Factors of Water Resources Carrying Capacity in Tai’an, China. Sustainability 2025, 17, 1814. [Google Scholar] [CrossRef] [Scilit]
- Zhou, Y.J.; Zhou, J.X. Urban Atmospheric Environmental Capacity and Atmospheric Environmental Carrying Capacity Constrained by GDP–PM2.5. Ecol. Indic. 2017, 73, 637–652. [Google Scholar] [CrossRef] [Scilit]
- Guo, Q.; Wang, J.Y.; Yin, H.L.; Zhang, G. A Comprehensive Evaluation Model of Regional Atmospheric Environment Carrying Capacity: Model Development and a Case Study in China. Ecol. Indic. 2018, 91, 259–267. [Google Scholar] [CrossRef] [Scilit]
- Shen, L.Y.; Yang, Z.C.; Du, X.Y.; Wei, X.X.; Chen, X. A Health Risk-Based Threshold Method to Evaluate Urban Atmospheric Environment Carrying Capacity in Beijing-Tianjin-Hebei (BTH) Region. Environ. Impact Asses. 2022, 92, 106692. [Google Scholar] [CrossRef] [Scilit]
- European Environment Agency. Europe’s Environment: The Second Assessment; Elsevier Ltd: Oxford, UK, 1998. [Google Scholar]
- Liu, H.M. Comprehensive Carrying Capacity of the Urban Agglomeration in the Yangtze River Delta, China. Habitat Int. 2012, 36, 462–470. [Google Scholar] [CrossRef] [Scilit]
- Zhao, L.L.; Li, J.Y.; Shao, Q.L. Evaluation of Urban Comprehensive Carrying Capacity: Case Study of the Beijing–Tianjin–Hebei Urban Agglomeration, China. Environ. Sci. Pollut. Res. 2020, 27, 19774–19782. [Google Scholar] [CrossRef] [Scilit]
- Zou, H.; Ma, X.H. Identifying Resource and Environmental Carrying Capacity in the Yangtze River Economic Belt, China: The Perspectives of Spatial Differences and Sustainable Development. Environ. Dev. Sustain. 2021, 23, 14775–14798. [Google Scholar] [CrossRef] [Scilit]
- Rees, W.E. Ecological Footprints and Appropriated Carrying Capacity: What Urban Economics Leaves Out. Environ. Urban. 1992, 4, 121–130. [Google Scholar] [CrossRef] [Scilit]
- Rees, W.E. Revisiting Carrying Capacity: Area-Based Indicators of Sustainability. Popul. Environ. 1996, 17, 195–215. [Google Scholar] [CrossRef] [Scilit]
- Jiang, R.R.; Fei, L.J.; Kang, S.X. Analysis and Prediction of Urban Agglomeration Ecological Footprint Based on Improved Three-Dimensional Ecological Footprint and Shared Socioeconomic Pathways. Ecol. Indic 2025, 170, 113079. [Google Scholar] [CrossRef] [Scilit]
- Wu, J.M.J.; Yang, X. Assessment of Ecological Carrying Capacity in Xilingol League Based on Three-Dimensional Ecological Footprint Model. Sustainability 2025, 17, 128. [Google Scholar] [CrossRef] [Scilit]
- Zhu, X.; Wang, Z. Study on the Assessment of Carbon and Water Footprint and Its Spatial-Temporal Pattern in the Yellow River Basin. Environ. Sci. Technol. 2020, 43, 200–211. [Google Scholar]
- Li, Q.; Huo, A.D.; Liu, Y.R.; Zhang, P.; Zhao, Z.X.; Zhao, X.T. Evolution Analysis of the Ecological Footprint and the Ecological Carrying Capacity of Water Resources at Different Spatial and Temporal Scales: A Case Study of Gansu Province. Sustainability 2024, 16, 11000. [Google Scholar] [CrossRef] [Scilit]
- Hoekstra, A.Y.; Hung, P.Q. Globalisation of Water Resources: International Virtual Water Flows in Relation to Crop Trade. Glob. Environ. Change 2005, 15, 45–56. [Google Scholar] [CrossRef] [Scilit]
- Chapagain, A.K.; Hoekstra, A.Y. The Global Component of Freshwater Demand and Supply: An Assessment of Virtual Water Flows between Nations as a Result of Trade in Agricultural and Industrial Products. Water Int. 2008, 33, 19–32. [Google Scholar] [CrossRef] [Scilit]
- Zhang, Z.M.; Ou, G.L.; Elshkaki, A.; Liu, R.L. Evaluation of Regional Carrying Capacity under Economic-Social-Resource-Environment Complex System: A Case Study of the Yangtze River Economic Belt. Sustainability 2022, 14, 7117. [Google Scholar] [CrossRef] [Scilit]
- Ma, S.H.; Xue, M.G.; Ji, S.W. An Improved Emergy Ecological Footprint Method for Ecological Security Assessment and Quantitative Analysis of Influencing Factors: A Case Study of Zhejiang Province. J. Environ. Plann. Man. 2023, 66, 2878–2902. [Google Scholar] [CrossRef] [Scilit]
- Enayat, F.F.; Ghanbari, S.A.; Asgharipour, M.R.; Seyedabadi, E. Emergy Ecological Footprint Analysis of Yaghooti Grape Production in the Sistan Region of Iran. Ecol. Model. 2023, 481, 110332. [Google Scholar] [CrossRef] [Scilit]
- Hu, M.; Bian, Y.T.; Ji, G.X. Assessing the Sustainability of China’s Coastal Regions: A Perspective on Local Coupling and Telecoupling. Ecol. Model. 2025, 501, 110974. [Google Scholar] [CrossRef] [Scilit]
- Bao, C.; Wang, H.J.; Sun, S. Comprehensive Simulation of Resources and Environment Carrying Capacity for Urban Agglomeration: A System Dynamics Approach. Ecol. Indic. 2022, 138, 108874. [Google Scholar] [CrossRef] [Scilit]
- Yan, L.F.; Ye, W.Z.; Long, H.; Zhang, Q. The Influence of Innovative Resources on the Comprehensive Carrying Capacity of China’s Urban Agglomerations: A System Dynamics Perspective. Sustainability 2024, 16, 6191. [Google Scholar] [CrossRef] [Scilit]
- Manshadi, Z.D.; Parivar, P.; Sotoudeh, A.; Sharifabadi, A.M. Modeling Urban Growth Effects on Carrying Capacity in Arid and Semi-Arid Regions Using System Dynamics. Ecol. Model. 2024, 487, 110565. [Google Scholar] [CrossRef] [Scilit]
- Chen, J.; Huang, X.; Jing, Y.; Wen, Z.; Zang, C. Spatial and temporal variation and driving factors of ecological carrying capacity in the Pan-Pearl River Basin, China. Ecol. Indic. 2023, 151, 110318. [Google Scholar] [CrossRef] [Scilit]
- Peng, Y.; Tan, X.Y.; Zhu, Z.L.; Liao, J.Y.; Xiang, L.J.; Wu, F. Evaluation of Resource and Environmental Carrying Capacity at Provincial Level in China Using a Pressure–Support–Adjustment Ternary System. Sustainability 2024, 16, 8607. [Google Scholar] [CrossRef] [Scilit]
- Wang, Z.; Fu, X. Scheme simulation and predictive analysis of water environment carrying capacity in Shanxi Province based on system dynamics and DPSIR model. Ecol. Indic. 2023, 154, 110862. [Google Scholar] [CrossRef] [Scilit]
- Tang, S.Y.; Yang, H.; Li, Y. Environmental Assessment and Restoration of the Hunjiang River Basin Based on the DPSIR Framework. Sustainability 2024, 16, 8861. [Google Scholar] [CrossRef] [Scilit]
- Ye, W.; Xu, X.Y.; Wang, H.X.; Wang, H.Q.; Yang, H.C.; Yang, Z.W. Quantitative Assessment of Resources and Environmental Carrying Capacity in the Northwest Temperate Continental Climate Ecotope of China. Environ. Earth Sci. 2016, 75, 868. [Google Scholar] [CrossRef] [Scilit]
- Daneshvar, M.R.M.; Khatami, F.; Zahed, F. Ecological Carrying Capacity of Public Green Spaces as a Sustainability Index of Urban Population: A Case Study of Mashhad City in Iran. Model. Earth Syst. Environ. 2017, 3, 1161–1170. [Google Scholar] [CrossRef] [Scilit]
- Wu, M.W.; Wu, J.Q.; Zang, C.F. A Comprehensive Evaluation of the Eco-Carrying Capacity and Green Economy in the Guangdong-Hong Kong-Macao Greater Bay Area, China. J. Clean. Prod. 2021, 281, 124945. [Google Scholar] [CrossRef] [Scilit]
- Global Footprint Network. Human Development Index and Ecological Footprint. 2022. Available online: https://data.footprintnetwork.org/#/sustainableDevelopment?cn=all&yr=2022&type=BCpc,EFCpc (accessed on 5 June 2022).
- Wang, J.H.; Jiang, D.; Gu, D.F.; Qi, W.H.; Tang, Q.W. Research on the Prediction of Urban Water Resources Carrying Capacity in Arid Areas Based on SD Model. Geogr. Territ. Res. 1999, 15, 18–22. (In Chinese) [Google Scholar]
- Hughey, K.F.D.; Cullen, R.; Kerr, G.N.; Kerr, G.N. Application of the Pressure-State-Response framework to perceptions reporting of the state of the New Zealand environment. J. Environ. Manag. 2004, 70, 85–93. [Google Scholar] [CrossRef] [Scilit]
- Daily, G.C.; Ehrlich, P.R. Population, Sustainability, and Earth’s Carrying Capacity. Bioscience 1992, 42, 761–771. [Google Scholar] [CrossRef] [Scilit]
- Oh, K.; Jeong, Y.; Lee, D.; Lee, W.; Choi, G. Determining Development Density Using the Urban Carrying Capacity Assessment System. Landsc. Urban Plan. 2005, 73, 1–15. [Google Scholar] [CrossRef] [Scilit]
- Graymore, M.L.M.; Sipe, N.G.; Rickson, R.E. Regional Sustainability: How Useful are Current Tools of Sustainability Assessment at the Regional Scale? Ecol. Econ. 2008, 67, 362–372. [Google Scholar] [CrossRef] [Scilit]
- Running, S.W. A Measurable Planetary Boundary for the Biosphere. Science 2012, 337, 1458–1459. [Google Scholar] [CrossRef] [Scilit] [PubMed]
- Abdelatif, I.; Djiar, K.A. Developing Indicators for Water-Energy-Food Nexus Based on Urban Carrying Capacity: Implications for Algiers Resource Management. J. Clean. Prod. 2025, 513, 145736. [Google Scholar] [CrossRef] [Scilit]
- The Central People’s Government of the People’s Republic of China. Decision on Major Issues Concerning Comprehensively Deepening Reforms. Available online: https://www.gov.cn/zhengce/2013-11/15/content_5407874.htm (accessed on 15 November 2013).
- National Development and Reform Commission. Monitoring and Early Warning Technology of Resource Environment Carrying Capacity (Trial). Available online: https://www.ndrc.gov.cn/xwdt/gdzt/135ghbz/201609/t20160928_1198957.html (accessed on 28 September 2016).
- The General Office of the Communist Party of China Central Committee and the General Office of the State Council. Opinions on Establishing a National Spatial Planning System and Supervising its Implementation. Available online: https://www.gov.cn/gongbao/content/2019/content_5397679.htm (accessed on 23 May 2019).
- Feng, Z.M.; Yang, Y.Z.; Yan, H.M.; Pan, T.; Li, P. A Review of Resources and Environment Carrying Capacity Research since the 20th Century: From Theory to Practice. Resour. Sci. 2017, 39, 379–395. (In Chinese) [Google Scholar]
- Thom, R. Structural Stability and Morphogenesis: An Outline of a General Theory of Models; Benjamin Cumnings: New York, NY, USA, 1972. [Google Scholar]
- Chouhan, H.A.; Parthasarathy, D.; Pattanaik, S. Urban Development, Environmental Vulnerability and CRZ Violations in India: Impacts on Fishing Communities and Sustainability Implications in Mumbai coast. Environ. Dev. Sustain. 2016, 19, 971–985. [Google Scholar] [CrossRef] [Scilit]
- Yang, J.; Guan, Y.Y.; Li, X.M.; Xi, J.C. Urban Fringe Area Ecological Vulnerability Space-Time Evolution Research: The Case of Ganjingzi District, Dalian. Acta Ecol. Sin. 2018, 38, 778–787. (In Chinese) [Google Scholar] [CrossRef] [Scilit]
- Department of Natural Resources of Shandong Province. Shandong Province Construction Land Control Standards (2024 Edition). Available online: http://fgw.shandong.gov.cn/art/2024/9/19/art_91546_10447203.html (accessed on 19 September 2024).
- The State Council. National Land Planning Outline (2016–2030). Available online: https://www.gov.cn/gongbao/content/2017/content_5171326.htm (accessed on 3 January 2017).
- The National People’s Congress of the People’s Republic of China. Development and Utilization of Water Resources. Available online: http://www.npc.gov.cn/zgrdw/npc/flsyywd/xingzheng/2003-09/17/content_321402.htm (accessed on 17 September 2003).
- The People’s Government of Shandong Province. Major Function Oriented Zone Planning of Shandong Province. Available online: http://gb.shandong.gov.cn/art/2013/2/18/art_2267_19484.html (accessed on 18 February 2013).
- The People’s Government of Shandong Province. Notice on Implementing the 2013 Municipal Government’s Responsibility Target for Cultivated Land Protection. Available online: http://www.shandong.gov.cn/art/2013/7/25/art_100623_24727.html (accessed on 25 June 2013).
- The People’s Government of Shandong Province. Opinions on Further Promoting Land Conservation and Intensive Use. Available online: http://m.sd.gov.cn/art/2013/11/22/art_2259_24828.html (accessed on 25 June 2013).
- The People’s Government of Shandong Province. Notice on the Implementation of the Strictest Assessment Method for Water Resources Management System in Shandong Province. Available online: http://www.shandong.gov.cn/art/2013/7/5/art_100619_31649.html (accessed on 5 July 2013).
- The People’s Government of Shandong Province. The 13th Five Year Plan for Ecological Environment Protection in Shandong Province. Available online: http://xxgk.sdein.gov.cn/xxgkml/zhxgh/201706/t20170627_1122724.html (accessed on 24 April 2017).
- The People’s Government of Shandong Province. Action Plan for the Construction of Basic Public Service System in Shandong Province (2013–2015). Available online: http://gb.shandong.gov.cn/art/2013/9/18/art_100623_25238.html (accessed on 26 August 2013).
- Shandong Provincial Bureau of Statistics. Series Analysis of Shandong’s Economic and Social Development Achievements Since the 18th National Congress of the Communist Party of China. Available online: http://tjj.shandong.gov.cn/art/2017/10/1/art_6109_407598.html (accessed on 1 October 2017).
- Water Resources Department of Shandong Province. Shandong Provincial Water Resources Bulletin in 2019. Available online: http://wr.shandong.gov.cn/zwgk_319/fdzdgknr/tjsj/szygb/202011/t20201126_3607047.html (accessed on 20 November 2020).
- People’s Government of Shandong Province. The Results of the Third National Land Resource Survey Have Been Presented, and Shandong Province Has Thoroughly Investigated Its Land Resource. Available online: http://gb.shandong.gov.cn/art/2021/12/17/art_97904_516875.html (accessed on 17 December 2021).
- General Office of the Communist Party of China Central Committee and General Office of the State Council. Guidelines to Coordinating the Delineation and Implementation of Three Control Lines in National Spatial Planning. Available online: https://www.gov.cn/gongbao/content/2019/content_5453396.htm (accessed on 1 December 2019).
- National Bureau of Statistics. What Are the Three Major Accounting Reforms. Available online: https://www.stats.gov.cn/zs/tjws/tjzn/202301/t20230101_1903793.html (accessed on 17 December 2024).
- People’s Government of Shandong Province. Government Work Report (Third Session of the 13th Provincial People’s Congress, 2020). Available online: http://www.shandong.gov.cn/art/2020/1/23/art_101626_345657.html (accessed on 23 January 2020).
- People’s Government of Shandong Province. Government Work Report (Fifth Session of the 13th Provincial People’s Congress, 2021). Available online: http://www.shandong.gov.cn/art/2021/2/7/art_101626_399212.html (accessed on 7 February 2021).
- People’s Government of Shandong Province. Government Work Report (7th Session of the 13th Provincial People’s Congress, 2022). Available online: http://www.shandong.gov.cn/art/2022/1/28/art_101626_523160.html (accessed on 28 January 2022).
- Cheng, J.; Zhou, K.; Chen, D.; Fan, J. Evaluation and Analysis of Provincial Differences in Resources and Environment Carrying Capacity in China. Geogr. Sci. 2016, 26, 539–549. (In Chinese) [Google Scholar] [CrossRef] [Scilit]

Disclaimer/Publisher’s Note: The statements, opinions and data contained in all publications are solely those of the individual author(s) and contributor(s) and not of MDPI and/or the editor(s). MDPI and/or the editor(s) disclaim responsibility for any injury to people or property resulting from any ideas, methods, instructions or products referred to in the content. |
© 2026 by the authors. Licensee MDPI, Basel, Switzerland. This article is an open access article distributed under the terms and conditions of the Creative Commons Attribution (CC BY) license.