


Abstract
Minibus taxis are Cape Town’s ubiquitous public transport mode, carrying about 69% of public transport users. As electric mobility accelerates, the implications of electrifying this paratransit fleet must be quantified. We present a multi-perspective assessment of energy, environmental and operator impacts of electric minibus taxis (eMBTs). Using a high-resolution tracking dataset representative of MBT operations in Cape Town, South Africa, we estimate daily charging energy demand, compare greenhouse gas and particulate matter emissions for electric and internal combustion operation under South Africa’s coal-dominated grid, and evaluate the operator’s total cost of ownership. Key results show that eMBTs require approximately 50.8 kWh of energy per day, based on the fleet’s median daily distance. Under current grid conditions, diesel minibus taxis emit 14.37% less CO2e than eMBTs, but eMBTs drastically reduce noise pollution and particulate matter emissions when compared to diesel vehicles. Despite higher purchase prices, eMBTs can reduce operating costs and become financially attractive under favourable electricity prices and financing conditions. The study provides evidence to guide charging infrastructure planning, grid policy and incentive design for paratransit electrification in developing regions.
1. Introduction
1.1. Global Context: Transport and Decarbonisation
With the global drive to decarbonise transport, electrifying public transport fleets may offer early pathways towards achieving sustainable transport goals. In sub-Saharan Africa, this proposition is complicated by the predominance of informal transport, characterised by highly variable operating patterns and a lack of central coordination of both fleets and operations. This raises critical questions about the environmental and financial implications of electrification. This paper evaluates the potential impacts of electrifying the South African minibus taxi sector from environmental, energy, and operator perspectives.
Since 1996, the transport sector has been the second largest contributor to global greenhouse gas emissions (GHGs), accounting for approximately 16.1% of total emissions [1] and 24% of CO2 emissions [2]. Road transport alone accounts for around 74.5% of these emissions [1], primarily from internal combustion engine (ICE) vehicles powered by fossil fuels. In response, there is a global shift toward electric mobility, driven by the expectation that electric vehicles (EVs) offer environmental benefits and, increasingly, lower operational costs despite higher or comparable capital investment. This shift is reinforced by decisions from the European Parliament and original equipment manufacturers (OEMs) to cease the production of internal combustion engine vehicles (ICEVs) by 2035 [3]. However, the effectiveness of electrification in reducing emissions depends heavily on local context, particularly the electricity grid mix, vehicle usage patterns, and socio-economic factors. In regions where electricity generation is heavily reliant on fossil fuels, such as coal, the anticipated environmental benefits of EVs may not materialise immediately [4]. Therefore, a nuanced understanding of these local factors is essential for evaluating the true impact of electrifying transport systems.
1.2. The Sub-Saharan African Context
Although Africa accounts for only around 4% of global GHG emissions, the region is nevertheless under pressure to electrify transport [5]. In sub-Saharan Africa (SSA), the dominant mode of public transport is informal, also referred to as paratransit or “popular transport(ation)”, serving as the primary means of mobility in many urban and semi-rural environments. These transport systems emerged organically as a response to inadequate and inequitable formal transport provision, particularly in the post-colonial period [6,7]. They are demand-driven, unscheduled, loosely regulated, and decentralised in ownership, evolving to meet unmet mobility needs in underserved areas [6]. Similar systems exist across SSA, such as Dala-Dalas in Tanzania, Matatus in Kenya, and Ndiaga Ndiaye vehicles in Senegal [8,9,10]. Unlike public transport in developed countries, these services offer intra-city, inter-city, and long-distance trips and are operated by private individuals affiliated with local cooperatives or associations [10]. Owners purchase licences to operate on specified routes, but drivers retain substantial autonomy regarding route choice and operating hours [11].
In South Africa, the development of the minibus taxi sector was shaped by apartheid-era exclusion, with the majority of taxis operating illegally by the early 1980s, many already converted to MBTs [7]. In South Africa alone, approximately 300,000 minibuses operate, according to the South African National Taxi Council (SANTACO) [12,13].
Although lagging behind other regions, countries in sub-Saharan Africa are beginning to transition toward electric mobility. However, the unique challenges faced by SSA, including limited grid infrastructure, high poverty levels, and reliance on coal-based electricity generation, complicate the electrification process [14]. Therefore, localised research is essential to understand the specific implications of electrifying paratransit systems in this context.
1.3. The South African Minibus Taxi Sector
The public transport sector in South Africa, and more broadly in sub-Saharan Africa, differs substantially from that in most other parts of the world [15]. Paratransit, which serves 69% of public transport commuters in Cape Town (and over two-thirds nationally) [16,17], is therefore central to any discussion on transport electrification. Any policy decisions concerning the electrification of minibus taxis will directly affect the majority of commuters and the wider economy. Electricity generation is dominated by coal, which accounted for 82.8% of electricity supply in 2023/24, with renewable energy contributing only 8.8% [18,19,20], resulting in significant CO2, methane, and particulate matter emissions. Under these conditions, electrification may not achieve the anticipated environmental benefits, and further research tailored to the region is urgently needed.
In South Africa, decarbonisation efforts in the minibus sector have seen limited progress [21]. The sector is typically characterised by ageing and inefficient 16-seater ICEVs, for which lenient or absent emission regulations result in disproportionate contributions to urban air pollution and GHG emissions [22]. The global momentum toward EVs, combined with the phasing out of ICEV production by major OEMs, provides further justification for the sector to begin planning for electrification [23,24].
1.4. South Africa’s Energy and Infrastructure Context
In South Africa, approximately 95% of electricity is supplied by the state-owned utility Eskom, which relies heavily on coal-fired power stations [25]. Coal combustion produces large quantities of CO2, CH4, and particulate matter, all of which have well-documented health impacts [26].
Given this reliance on coal, the environmental benefits of shifting to electric vehicles are uncertain. The emissions produced by coal-dominated electricity generation must be compared directly with emissions from ICEVs to determine whether net reductions are achievable [14]. In 2023, the South African grid emission factor was 0.906 kg CO2/kWh [27], which forms a key parameter for estimating EV-related emissions in this study.
Planning for electrification is further complicated by the irregular driving patterns typical of the sector, the inadequate grid infrastructure, and limited generation capacity. These challenges are exacerbated by a lack of reliable data on paratransit mobility patterns. With the transition to electric minibus taxis (eMBTs) increasingly likely, the central question becomes what environmental and financial impacts this shift will entail.
1.5. Health Impacts of Pollution
The health impacts of air pollution from internal combustion engine vehicles (ICEVs) are well documented, with particular concern about particulate matter (PM) emissions. The World Health Organisation has linked exposure to air pollution in the region to a rise in cardiopulmonary and cardiovascular diseases, classifying it as a significant health threat [28]. Road traffic is a major source of PM in Africa, contributing significantly to urban air pollution [29]. In particular, black carbon (BC) and PM2.5 emissions from vehicles have been identified as primary contributors to poor air quality in several West African cities [29]. Recent estimates indicate that in 2021, approximately 950,000 deaths in SSA were attributable to PM2.5 exposure, accounting for over 10% of all deaths in the region [30]. A meta-analysis of studies from 1982 to 2012 confirmed the association between PM exposure and adverse health outcomes, highlighting the substantial public health burden resulting from even small individual effects [31]. These findings highlight the urgent need for interventions to reduce vehicular emissions, particularly in high-exposure settings such as those created by the minibus taxi sector in SSA.
1.6. Research Gap and Contribution
While previous research has established frameworks for evaluating the impacts of electrification in developing regions, significant gaps remain in understanding how these transitions affect specific transport modes in local contexts. Buresh et al. [14] pioneered a multi-perspective assessment of electrification in South Africa, incorporating residential, commercial, and energy-supplier viewpoints [14]. Their framework recognised the potential of strong solar resources in developing regions, whilst acknowledging financial constraints that limit adoption. Building on this foundation, Booysen et al. [32] integrated technical and systemic requirements specific to paratransit electrification, highlighting critical linkages between mobility patterns, energy systems, and infrastructure planning.
However, these studies do not empirically quantify the scale of electrification in South Africa’s minibus taxi industry using real-world mobility data. Additionally, there is a lack of comprehensive analyses that combine mobility pattern analysis with energy, environmental, and financial modelling specific to this sector. Therefore, this paper addresses this gap by leveraging a relatively large floating-car dataset from Cape Town, South Africa, to conduct an evidence-based assessment of electrifying minibus taxis in South Africa. The paper is unique in its use of a large dataset of representative urban minibus taxi operations, whereas previous studies have been limited to small samples in non-metro areas [33,34]. Specifically, we combine mobility pattern analysis with energy and economic modelling to quantify the implications for operators, the electricity grid, and national emissions for a large coastal metropolitan context. The analysis is strategic rather than tactical, asking what the broad implications of electrification would be, assuming that it is technically feasible to achieve. In doing so, this work provides localised insights essential for informing policy decisions and investment strategies in the South African paratransit sector.
To provide a clearer basis for comparison, this study evaluates electric and internal combustion engine (ICE) minibuses across three key dimensions: energy demand, environmental performance, and operator economics. Under current South African conditions, electric minibuses exhibit substantially lower particulate matter emissions due to the absence of tailpipe exhaust and reduced brake wear, but greenhouse gas emissions remain sensitive to the coal-dominated electricity grid. Using the current grid emission factor, electric minibuses produce slightly higher CO2e emissions than diesel vehicles, while petrol vehicles remain the most carbon-intensive due to their relatively low fuel efficiency. From an operator’s perspective, electric minibuses offer large reductions in daily operating costs, primarily driven by lower energy and maintenance costs, although higher purchase prices delay financial break-even. These contrasting outcomes highlight the need for a multi-dimensional assessment of electrification in the South African minibus taxi sector.
2. Conceptual Framework
Electrifying South Africa’s minibus taxi fleet implies a complex socio-technical transition that necessitates a comprehensive evaluation across multiple dimensions. To effectively assess the implications of this transition, we adopt a multi-perspective framework inspired by the works of Buresh et al. [14] and Booysen et al. [32]. Illustrated in Figure 1, this framework integrates three perspectives: Energy, Environmental, and Operator, each addressing specific concerns and metrics relevant to the electrification of the minibus sector in South Africa. These perspectives are interdependent: energy expenditure and supply choices affect emissions, while both influence operator costs and adoption rates. The framework enables a holistic assessment of the impacts of electrification, supporting evidence-based recommendations for policy and investment.
Figure 1.
Framework for assessing the impact of electrifying minibus taxis. The framework links three interdependent perspectives: energy, environment, and owner, to evaluate the systemic effects of electrifying South Africa’s minibus taxi fleet.
2.1. Energy Perspective
This perspective focuses on quantifying the required daily energy and on identifying the temporal charging requirements and opportunities. This perspective is critical for understanding the systemic impact of current mobility patterns on energy demand and grid integration.
2.2. Environmental Perspective
This perspective assesses the exhaust and non-exhaust emissions impacts of electrification, including greenhouse gas (GHG) and particulate matter (PM) emissions, by comparing ICE and electric vehicle operation under South African grid conditions. The ICE minibus’s GHG emissions are evaluated from a operational life-cycle boundary perspective, including tailpipe emissions and upstream fuel transport. On the other hand, eMBT emissions are calculated based on its energy efficiency and South Africa’s electricity generation emissions. Finally, the economic impact of these emissions is derived. This perspective informs policy and environmental benefit analysis.
2.3. Operator Perspective
This perspective evaluates the financial implications for vehicle owners and drivers. Assessment metrics include vehicle retail price, and operating costs such as fuel/electricity, maintenance, tyres and insurance. The analysis compares the vehicle retail price for three EV import scenarios and the daily operating cost savings for three EV charging scenarios. Since capital expenditure (CAPEX) increases while operational expenditure (OPEX) decreases, the total cost of ownership (TCO) analysis determines the utilisation threshold at which electric minibuses become financially competitive with diesel vehicles. This perspective informs the financial viability of electrification for operators and is essential for stakeholder buy-in.
3. Methodology
This section outlines the key parameters and metrics employed in the multi-perspective analysis, describes the mobility analysis based on the tracking data, and describes how the perspectives were analysed.
3.1. Analytical Metrics and Parameters
Parameters are critical for assessing the energy demand, environmental impact, and the subsequent economic implications and financial outcomes of the transition from ICE MBT to eMBTs. Table 1 summarises the parameters, values, and sources. Key limitations include variability in real-world driving conditions that affect efficiency estimates [35], uncertainties in emission factors due to limited local data, and fluctuations in electricity and fuel prices over time. Assumptions include average vehicle usage patterns based on the vehicle-tracking dataset (discussed in Section 3.2), static emission factors from the literature, vehicle retail prices disclosed by manufacturers, and typical operating costs provided by industry experts and minibus taxi drivers.
Table 1.
Summary of analytical parameters and their sources.
3.2. Mobility Analysis: Data Source and Extraction
To assess the mobility patterns of minibus taxis in South Africa (SA), tracking data obtained from the City of Cape Town’s (CoCT’s) Blue Dot Programme [48] was used. This dataset comprises 616 minibus taxis over a 30-day period in November 2022, providing high-resolution GPS traces of minibus taxi operations, offering insights into daily distances driven, temporal activity patterns, and potential charging opportunities for electric minibuses. Each participating vehicle was equipped with a telematics device that continuously recorded its location and performance metrics. After applying data-cleaning procedures, including geofencing within the CoCT boundaries and filtering out weekend trips and low-activity days, the dataset yielded 11,940 vehicle-days suitable for analysis. Records before 5 AM and after 9 PM were unavailable for privacy reasons, which may limit analysis of early-morning and late-night activity patterns. Figure 2 shows the geographical locations of the case study area, as well as the GPS point density for the CoCT dataset.
Figure 2.
(a) Map of South Africa showing the location of Cape Town. (b) GPS point density heatmap for the CoCT dataset in Cape Town.
Assumptions and Limitations
Some concerns limit the validity of the CoCT dataset. The data was collected in November of 2022, which may not fully reflect current mobility patterns, especially considering the potential impacts of the COVID-19 pandemic on transport behaviour and the decline of South Africa’s passenger rail services [49]. These factors may have led to changes in minibus taxi usage patterns, such as increased demand due to reduced public transport options or altered commuting behaviours. However, given the scarcity of detailed mobility data for paratransit systems in SSA [50], this dataset provides valuable insights into typical minibus taxi operations during this period and is deemed representative enough for the purposes of this analysis.
3.3. Energy Modelling
This study assumes an energy consumption rate of 0.457 kWh/km for fully loaded electric minibus taxis (eMBTs), based on the empirically validated simulation models of Abraham et al. [35], developed under South African driving conditions and for the gross vehicle mass (GVM) listed in Table 1. This rate accounts for typical driving patterns, vehicle load, and road conditions experienced by minibus taxis in the region. When applied to the median daily distance data extracted from each dataset, the typical daily energy requirement is estimated. To determine the confidence intervals (CIs) for daily distance, block-bootstrapping techniques were employed, resampling the daily distance data 10,000 times, with a block size of 5, to generate a distribution of median daily distance values. This approach was chosen over a simple bootstrap to account for potential autocorrelation in daily distance data, ensuring that the CIs accurately reflect the variability in daily distances driven by individual vehicles over consecutive days.
For the CoCT dataset, temporal patterns in vehicle activity and inactivity were extracted, which is crucial for understanding charging behaviour and its alignment with time-of-use (ToU) electricity tariffs. To extract the activity profile, the number of unique vehicle IDs exceeding a speed threshold of 5 km/h was binned into 1-min intervals for each vehicle-day. Periods during which vehicles remained below this speed threshold were identified as inactivity periods, suggesting potential charging opportunities for eMBTs. This speed-based method may overlook periods when drivers engage in low-speed ‘touting’ behaviour to find passengers, potentially overestimating the number of charging opportunities.
After extracting the diurnal activity profile, it was analysed in relation to South Africa’s solar irradiance, NASA’s POWER API [51], and Eskom’s ToU electricity tariffs [52] to evaluate the potential for cost-effective charging strategies.
Assumptions and Limitations
The analysis assumes that all identified inactivity periods are potential charging opportunities, without accounting for driver preferences or operational constraints that may affect actual charging behaviour. Additionally, vehicle-charger interactions are not explicitly modelled, and it is assumed that the grid can accommodate the additional load from eMBT charging without significant infrastructure upgrades. For the ICEVs, it is assumed that fuel consumption rates are 30% higher than the catalogue specifications to better represent passenger loading and real-world conditions, to align with findings from an ongoing driver survey and discussions with industry experts. Finally, the analysis assumes that the obtained dataset is representative of typical minibus taxi usage patterns in South Africa, despite potential variations across different regions and times.
3.4. Environmental Modelling
3.4.1. Greenhouse Gas Emission Factors
The environmental impact assessment focuses on quantifying greenhouse gas (GHG) emissions associated with both internal combustion engine (ICE) minibus taxis and eMBTs. In the ICEV case, the greenhouse gas (GHG) emission factors include the tank-to-wheel combustion emissions and fuel transport to South Africa (shipping and land transport). For the EV case, the GHG emissions are derived from the electricity generation emissions factor of the South African electricity grid. Emissions from vehicle manufacturing, battery production, fuel refining, and end-of-life are excluded.
ICE: Tank-to-Wheel Emissions
The combustion emissions for each fuel type were calculated using the emission factors in Table 1. These factors account for CO2 emissions only, as they constitute the majority of GHG emissions from fuel combustion [1]. The petrol combustion emissions factor for South Africa is 0.421 kgCO2/km, while the diesel combustion emissions factor is 0.341 kgCO2/km. It is important to note that these emission factors are subject to uncertainties, including minibus engine efficiency, driving conditions, fuel quality, and the ageing fleet of vehicles operating in South Africa’s paratransit.
ICE: Fuel Shipping Emissions
The shipping emissions associated with fuel importation to South Africa were calculated using a well-to-tank (WTT) sea freight emissions intensity of 4.6 gCO2e/tonne-km for oil-tankers (heavy load) [40]. This emissions intensity is used to calculate the total CO2e emissions due to shipping the fuel, using Equation (1),
where is the total CO2e emissions from fuel importation via shipping in kg, is the emissions intensity of shipping in kgCO2e/kg-km, is the distance travelled by the tanker in km, is the volume of fuel imported in litres, and is the density of the fuel in kg/L.
The fuel density used to convert from litres to kilograms is 850.8 g/L and 748.9 g/L for diesel and petrol, respectively [53]. With respect to the total import volume, for both petrol and diesel, a weighted average of shipping emissions was calculated based on the volume of each fuel type imported by South Africa and its major fuel import countries [54], where the total volume of fuel imported by South Africa in 2023 with respect to each country is shown in Figure 3.
Figure 3.
2023 Diesel and Petrol Imports per Country of Origin (SARS, 2023) [54].
The shipping distances were calculated using the sea distance between each country’s most suitable port city and Cape Town using the sea-distances.org web tool [55]. After dividing total emissions by total volume imported, the mean fuel importation emissions density was found to be 0.034826 kgCO2e/L for diesel and 0.033464 kgCO2e/L for petrol.
These emission densities are then applied to the fuel consumption of ICEVs (in Table 1) to calculate the effective emissions associated with fuel shipping, per km of vehicle operation, resulting in shipping-related emission factors of 4.482 gCO2e/km for diesel and 6.221 gCO2e/km for petrol vehicles. This calculation does not consider fuel produced domestically, which constitutes a small percentage of total fuel consumption in South Africa [54] as well as the emissions associated with its transport.
ICE: Fuel Land Transport Emissions
For illustration purposes, the land transport emissions from the port to the end-user were calculated using an emissions factor of 130 gCO2e/tonne-km for heavy-duty trucks [41]. With the same fuel densities as above and Johannesburg (South Africa’s largest city) as the destination city and Durban as the port city (total distance 634 km [56]), the land transport-related emission factors were estimated to be 6.942 gCO2e/km for diesel and 8.827 gCO2e/km for petrol. This was chosen as a representative distance for fuel transport within South Africa, although actual distances will vary based on the location of fuel distribution centres and filling stations. Additionally, this calculation does not account for variations in transport mode, route, or traffic conditions.
EV: Electricity Emissions
For electric vehicles, the GHG emissions are derived from the electricity generation emissions factor of the South African grid in 2023, 0.906 kgCO2e/kWh [27]. By multiplying this emissions factor by the EV’s energy consumption (0.457 kWh/km), the GHG emissions factor for the EV was calculated to be 0.414 kgCO2e/km.
Assumptions and Limitations
The GHG environmental analysis assumes that the emission factors and intensities used for both ICE and electric vehicles are static and representative of typical operating conditions in South Africa. The grid emission factor is treated as constant, based on the latest official figure from 2023, without accounting for temporal variations in the electricity generation mix. We did not consider the option of charging eMBTs from solar panels at taxi ranks, as previous research indicated that infeasibly large areas would have to be dedicated to solar farms, approximately half a tennis court per taxi [57]. Additionally, for the fuel combustion part, methane (CH4) and nitrous oxide (N2O) emissions are excluded from the analysis due to data limitations and their relatively small contribution to overall CO2e emissions compared to CO2 [1]. It is important to emphasise that the current analysis focuses primarily on operational emissions, specifically excluding emissions related to vehicle manufacturing, battery production, and end-of-life disposal. These components represent significant factors in a comprehensive life-cycle assessment (LCA), and their inclusion could substantially alter the overall environmental impact results. Further research is needed to incorporate these emissions to provide a more holistic understanding of the environmental impacts of electric minibuses.
3.4.2. Particulate Matter Emission Factors
To derive the PM2.5 and PM10 emission factors for both ICEVs and EVs, the methodology developed by Beddows and Harrison [58] was used. In their model, a relationship between vehicle mass and non-exhaust PM emissions is established, allowing for the estimation of PM2.5 and PM10 emission factors based on the mass of the ICE and eMBT in question. Equation (2) presents the general form of the model,
where is the PM2.5 or PM10 emission factor in mg/km, is the gross vehicle mass in kg, and b and c are empirically derived constants specific to PM2.5 and PM10 emissions. After fitting a non-linear regression model to the vehicle masses and emission factors from the EMEP/EEA Emissions Inventory Guidebook [42], the values of b and c for PM2.5 and PM10 emissions from tyre wear, brake wear, and road abrasion in urban environments were obtained, as shown in Table 2.
Table 2.
Urban PM2.5 and PM10 emission parameter estimates (b, c) based on Beddows and Harrison [58].
Tailpipe PM emissions result from incomplete fuel combustion and are regulated under the Euro emission standards. According to the EMEP/EEA Emission Inventory Guidebook [42], exhaust PM emissions from road vehicles are dominated by fine particles, such that PM2.5 is approximately equal to PM10 emissions. Consequently, PM2.5 emission factors can be approximated using reported exhaust PM emission factors. Estimating tailpipe emissions is challenging. Currently, there is a lack of reliable empirical measurements of tailpipe PM emissions for MBTs, particularly within informal paratransit operations. Furthermore, the South African MBT fleet is heterogeneous and relatively old [59], and is therefore likely to include vehicles that do not comply with modern emission standards. However, manufacturer specifications indicate that the Toyota Hiace Ses’fikile models widely used in the South African MBT fleet, equipped with the 2TR-FE (petrol) and 2KD-FTV (diesel) engines, comply with Euro II emission standards [60]. Using Euro-standard emission limits as a proxy, the EMEP/EEA Guidebook reports that tailpipe PM emissions from petrol vehicles were historically considered negligible and were not reported in earlier inventory methodologies, whereas diesel exhaust PM emissions for Euro II heavy-duty vehicles below 7.5 t are limited to 61 mg/km. Battery electric vehicles do not produce tailpipe emissions, and therefore their tailpipe PM2.5 emission factor is assumed to be zero.
3.4.3. Noise Pollution
All vehicles emit noise pollution, including electric vehicles. Sources of noise pollution include tyre-road noise, propulsion noise, brake noise, and aerodynamic noise. According to Danish Road Directorate (Vejdirektoratet) [61], the noise pollution of an electric bus depends on the speed at which it travels. Higher speeds attract more noise pollution than lower speeds. At 27 km/h, the average speed of a minibus taxi in Cape Town (CoCT data), the noise pollution reduction from transitioning to electric propulsion is approximately 30%.
3.4.4. Economic Cost of Environmental Impact
The monetary value of the negative side effects that transport activities impose on society and the environment, which are not reflected in market prices, is considered the economic cost of environmental transport impacts [62]. These effects include impacts on physical and psychological health that negatively impact the economy. Consequently, the environmental impacts were monetised to quantify the economic costs, using the environmental modelling outputs as a key input.
The PM and GHG emission factors per mg/km (as discussed in Section 3.4.2) were multiplied by the economic cost factor (in Rands) associated with one kilometre. The economic cost factors were derived from the handbook on the external cost of transport published by the European Commission [62], assuming an exchange rate of R20 per Euro, and adjusting for inflation. In terms of noise pollution, the economic cost per km was derived from [62] as R12.3/100 km.
3.5. Financial Modelling
3.5.1. Capital Expenditure
The retail price of two ICE minibus taxis and three eMBTs was included in the analysis of capital expenditure. These vehicles were selected because they are currently in use in South Africa or other parts of SSA. Complete built-up (CBU) imports, with and without import duty, and complete knocked-down (CKD) with local assembly were costed based on quotations received from manufacturers. While VAT and uplift costs were included, the homologation cost was excluded. The latter refers to the process through which a vehicle model is formally evaluated and approved by the National Regulator for Compulsory Specifications (NRCS) before it is sold for use on public roads. Homologation costs can vary significantly depending on the required amendments determined by the NRCS’s evaluation, making costing uncertain.
For ICE minibuses, the Toyota Hiace Ses’fikile petrol and diesel versions were selected. These vehicles are manufactured locally. According to Transaction Capital Ltd. [63], these vehicles account for 88% of new minibus sales in South Africa. The diesel version is particularly popular [64]. For EV minibuses, the Higer H5C is one of the three EVs selected, since a prototype has been imported to South Africa (CBU), though it is not operational as of 24 November 2025 due to ongoing homologation. The Chufeng H series and the Joylong EA5 were also included in the analysis because they are operational in Ghana and Kenya, respectively.
Capital expenditure for charging infrastructure was excluded from the analysis. For the purpose of this study, it is assumed that vehicle operators will not purchase, maintain and install charging infrastructure. This assumption seems reasonable given the fragmented ownership structure of the minibus taxi industry, their limited access to finance for large capital expenditures, and the fact that taxi ranks and terminals are typically owned and managed by local authorities, who are better positioned to invest in charging infrastructure. It is also assumed that the portable AC charger, typically included with the purchase of an EV, is used for home charging and that its cost is included in the vehicle’s retail price.
3.5.2. Operational Expenditure
To model eMBT operating expenses, the business-as-usual ICE scenario served as the baseline. Vehicle operating expenses, including maintenance, tyres, and insurance for ICE operations, were adjusted in line with best practices that account for differences in vehicle weight and purchase price. Other OPEX, such as washing and membership association fees, were excluded because they are unlikely to differ by vehicle transmission type. Costing assumes a loaded vehicle. Energy cost, a key vehicle operating expense, was determined for three charging scenarios: S1, S2 and S3, to capture the range of options available. S2 assumes that electricity is provided by the government at cost (reflecting an implicit energy subsidy for eMBTs); S1 assumes that 35% of charging occurs at home and the rest at the prices shown in Table 3; and S3 assumes private-sector provision at market prices. All three EV scenarios assume that the energy infrastructure, except for home-charging, is owned by an external party. Table 3 summarises the parameters for the calculation of the daily OPEX of ICE versus eMBT operations.
Table 3.
Operational expenditure values for ICE and EV minibus taxis across three charging scenarios.
Assumptions and Limitations
The maintenance costs for both vehicle types are estimated based on data from Golden Arrow Bus Services, which operates ICE and EV 60-seater buses. Only the vehicle, not the charging infrastructure, is assumed to be purchased by the operator. The model assumes fixed fuel and electricity prices, despite their fluctuations over time. The TCO assumes the Joylong EA5’s purchase price. This vehicle was selected based on its battery capacity, purchase price, and availability of real-world data, as it is operational in Kenya for minibus taxi (matatu) purposes.
The analysis excludes the costs of battery degradation and replacement, which are significant factors in the long-term economics of eMBTs. The cost of battery degradation can be substantial, as it affects the vehicle’s range and performance over time, and eventually necessitates battery replacement. However, this cost is not included in the TCO model primarily since it is assumed that the lithium iron phosphate (LFP) batteries used in eMBTs will not require replacement within the 10-year horizon. In this study, the TCO is evaluated at two representative points in the financing horizon (years 6 and 10) to capture the transition from capital-dominated to operating-cost-dominated ownership, which falls within the battery’s expected lifespan. Additionally, its inclusion would require complex modelling of battery performance over time, which may introduce additional uncertainties. Furthermore, it is assumed that second-life applications for retired EV batteries will mitigate replacement costs, as these batteries can be repurposed for stationary energy storage or other applications after their automotive use has ended [65]. This assumption is supported by research indicating that LFP batteries exhibit long cycle life and mild degradation, and with proper management, can be effectively repurposed for second-life applications [65]. Despite these assumptions, it is acknowledged that battery degradation and replacement costs could have a significant impact on the long-term economics of eMBTs, and future research should aim to incorporate these factors into TCO analyses as more real-world data becomes available.
4. Results
4.1. Energy Perspective
4.1.1. Distances Travelled and Energy Required
To evaluate the energy requirements of eMBTs, the daily distance distribution shown in Figure 4 was extracted from the CoCT dataset, along with the median daily distance. The distance distribution is right-skewed, with a long tail extending towards higher daily distances. The median daily distance and corresponding 95% confidence interval (CI) were calculated using a block bootstrap method. The median and 95% CI are 111.09 km and (108.55, 113.69) km. These findings indicate that typical eMBTs in Cape Town are able to support their operations with a reasonably sized battery of around 50.8 kWh, assuming a static energy consumption rate of 0.457 kWh/km [35], which is within the range of current eMBT battery capacities. However, this is highly influenced by factors such as driving conditions, vehicle load, terrain, city size, and urban structure, which can cause variations in typical energy requirements. If we assume a ±20% variation in energy consumption, the daily energy requirements range from 40.6 kWh to 61.0 kWh. This estimate provides a basis for understanding the energy needs of eMBTs in different urban contexts and can inform infrastructure planning and operational strategies.
Figure 4.
Daily distance distributions for Cape Town extracted from the Blue Dot minibus taxi dataset. Shown is the median daily distance and the 95% confidence interval obtained using a block bootstrap method.
Table 4 shows the daily energy requirements of eMBTs as a function of daily driving distance, based on the energy consumption rate of 0.457 kWh/km. The table illustrates that while the median daily distance of 111.09 km corresponds to an energy requirement of approximately 50.8 kWh, some vehicles travel up to 250 km per day, which would require around 114.25 kWh. This highlights the importance of considering the full range of daily distances when planning for eMBT energy needs and infrastructure development.
Table 4.
Daily energy requirement of electric minibuses as a function of daily driving distance.
4.1.2. Load Profiles, Time-of-Use and Solar Overlap
Figure 5 shows two important temporal interplays between minibus taxi movement and energy provision: in the top part of the figure, how movement activity, or lack thereof, overlaps with ToU tariffs; the bottom shows how insolation (solar intensity) through the year and time of day ties up to the mobility shown in the top part of the figure. The former is analysed next, while the latter is considered as part of the Environmental perspective.
Figure 5.
Alignment of taxi activity in Cape Town with Eskom’s high-demand weekday time-of-use tariff structure and solar availability and hourly mean global horizontal irradiance (GHI). The top part of the figure shows the percentage of taxis active per minute, with the shaded areas indicating Eskom’s high-demand tariff periods. The bottom part of the figure shows the mean hourly GHI for each month, with warmer colours indicating higher solar availability.
Eskom’s weekday high-demand tariff periods (Figure 5) span 06:00–08:00 and 17:00–20:00, with standard tariffs applying from 08:00–17:00 and 20:00–22:00, and off-peak rates from 22:00–06:00 [52]. The activity profiles show that taxis are highly active during the morning peak period and therefore unavailable for charging. By contrast, many vehicles have completed their evening peak movements by 18:00–20:00, leaving a sizeable share of the fleet inactive during the most expensive tariff window. Without intervention, much of this evening’s inactivity would translate into charging at peak prices, coinciding with peak grid demand. With managed scheduling, however, operators could shift charging to the more favourable standard and off-peak periods. Overall, the concentration of inactivity during nighttime and mid-day suggests multiple viable charging windows. Using these periods enables operators to take advantage of lower tariffs, reduce costs, and integrate charging with minimal disruption to existing service patterns. Such alignment underscores the scope for optimised charging strategies that strengthen the financial case for eMBTs.
4.2. Environmental Perspective
4.2.1. Greenhouse Gas Emissions
When accounting for the combined emissions generated from combustion, and fuel transport (shipping and land transport), the total CO2e emissions for petrol and diesel minibus taxis were calculated to be 438.4 gCO2e/km and 354.56 gCO2e/km respectively. In comparison, the CO2e emissions for eMBTs, based on the South African grid emission factor, were calculated to be 414.0 gCO2e/km. Shown in Figure 6a, this indicates that eMBTs show an increase in CO2e emissions of 14.37% when compared to diesel MBTs, while petrol MBTs exhibit a slight increase of 5.88% in CO2e emissions relative to eMBTs. Therefore, under current grid conditions in South Africa, diesel minibus taxis are more environmentally favourable than their electric counterparts from a GHG perspective, primarily due to South Africa’s coal-dependent electricity grid [27]. However, this advantage is contingent on the continued grid composition and may be reversed as renewable energy sources are integrated into the electricity supply. According to South Africa’s updated Nationally Determined Contribution (NDC) targets and 2025 Integrated Resource Plan (IRP), a 15% to 27% reduction in grid emissions by 2030 was committed [66,67], which would make eMBTs more environmentally favourable than diesel vehicles in terms of GHG emissions. Under the committed 2030 grid emission reductions, the South African eMBT emissions factor would fall somewhere between 302.2 and 352.0 gCO2e/km, outperforming diesel vehicles. Looking beyond 2030, integrating higher proportions of wind and solar energy could further reduce the carbon footprint of eMBTs, making them even more advantageous over time. Various decarbonisation pathways, depending on the speed and scale of renewable energy adoption and technological advancements in battery storage, could further reduce the emissions factor for eMBTs. These potential changes highlight the dynamic nature of emissions comparisons over time, stressing the importance of future-proofing transport decisions with flexible and adaptive policies. Therefore, while the current analysis indicates that eMBTs have higher GHG emissions than diesel vehicles, this conclusion is time-sensitive and may change as South Africa’s grid decarbonises in line with its NDC targets.
Figure 6.
Comparison of the environmental impacts for petrol, diesel, and electric vehicles: (a) CO2e emission factors under South African grid and fuel importation conditions; (b) PM2.5 and PM10 emission factors including tailpipe and non-tailpipe sources; (c) Per-100 km economic cost of environmental externalities for ICE versus electric minibus taxis. Note: the Pm emissions of brake ware in an EV is highly dependent on driving style, which affects the proportion of braking achieved by regenerative braking [68].
4.2.2. Opportunities for Solar Charging
The alignment between taxi inactivity and solar availability is illustrated in Figure 5, which shows the hourly mean global horizontal irradiance (GHI) for Cape Town alongside the average taxi active diurnal profile. This shows that eMBTs in Cape Town could effectively utilise decentralised solar energy during these hours to charge their batteries, reducing reliance on the grid and associated GHG emissions. Although rank-level solar charging may be impractical, the midday lull in taxi activity, where roughly 60 per cent of vehicles are inactive, coincides with periods of high solar availability, suggesting that a combination of distributed and utility-scale solar energy provision could be a viable strategy for eMBTs, reducing their carbon footprint and operational costs. This alignment highlights the potential to integrate renewable energy sources into eMBT charging infrastructure, thereby enhancing their environmental benefits and supporting the transition to cleaner transport in urban areas.
4.2.3. Particulate Matter
Using the PM2.5 and PM10 emission factor regression parameters derived in Section 3.4.2, total particulate emissions were estimated for diesel, petrol, and electric minibus taxis (MBTs). Table 5 summarises the resulting emission factors and their decomposition into exhaust and non-exhaust sources. The results show a strong divergence between diesel vehicles and the petrol/electric alternatives. Diesel MBTs emit 84.9 mg/km of PM2.5 and 110.8 mg/km of PM10, driven primarily by the Euro II tailpipe emission factor of 61 mg/km. In contrast, petrol MBTs emit 23.7 mg/km of PM2.5 and 49.4 mg/km of PM10, while eMBTs emit 20.3 mg/km of PM2.5 and 37.2 mg/km of PM10. This represents a reduction of approximately 76% in PM2.5 and 66% in PM10 when transitioning from diesel to electric drivetrains.
Table 5.
PM2.5 and PM10 emission factors (mg/km) for ICE and electric MBTs derived from the EMEP/EEA Guidebook and the non-exhaust regression model.
A key observation is that once tailpipe emissions are removed, non-exhaust sources account for the majority of total particulate emissions. For petrol and eMBTs, tyre wear, brake wear, and road abrasion account for essentially all PM emissions. Brake particle emissions vary significantly depending on braking strategy, vehicle design, mass, terrain, brake material, and traffic conditions [68]. Electric MBTs benefit from regenerative braking, which reduces friction brake usage through electro-magnetic braking and therefore lowers brake wear emissions relative to petrol vehicles (from 8.6 to 3.8 mg/km for PM2.5 and from 24.3 to 10.9 mg/km for PM10, despite the higher vehicle mass). Without regenerative braking, the higher eMBT mass would increase brake-wear emissions such that total eMBT particulate emissions would be slightly higher than for petrol MBTs, by about 8% for PM2.5 and about 6% for PM10. On this basis, eMBTs require roughly 21% regenerative braking (equivalently, friction braking limited to approximately 79% of total braking) for their total PM emissions to fall below those of petrol MBTs.
Once tailpipe emissions are removed, total PM is governed by non-exhaust sources that scale mainly with vehicle mass rather than drivetrain type. In the estimates here, eMBTs are heavier, which slightly increases tyre wear and road abrasion, but regenerative braking substantially reduces friction-brake wear, so the overall particulate totals are actually lower than for petrol MBTs (20.3 vs. 23.7 mg/km for PM2.5). For PM10, the same pattern holds: diesel MBTs remain substantially higher due to the added exhaust contribution, while petrol and eMBTs have purely non-exhaust emissions, with eMBTs lower overall (37.2 mg/km) than petrol (49.4 mg/km) because the reduction in brake wear more than offsets the mass-related increases in tyre and abrasion contributions.
Figure 6b illustrates the breakdown of PM2.5 and PM10 emissions by source. Diesel MBTs exhibit a dominant tailpipe contribution that accounts for approximately 72% of PM2.5 and 55% of PM10 emissions. In contrast, petrol and eMBTs show no tailpipe contribution, with emissions arising entirely from tyre wear, brake wear, and road abrasion.
These results demonstrate that electrification can substantially reduce particulate emissions in paratransit systems primarily through the elimination of diesel exhaust PM, while regenerative braking can reduce reliance on friction braking and therefore brake wear. In Dimopoulos Eggenschwiler et al. [68], mechanical (friction) braking accounted for 32–48% of braking energy across three BEVs (mean 42%), although the proportion varies with operating conditions and braking behaviour. At the same time, the findings highlight that non-exhaust emissions remain a persistent and significant source of urban particulate matter, which limits the achievable reductions in total PM through electrification alone.
4.2.4. Economic Cost of Environmental Externalities
The results, shown in Figure 6c, indicate that the environmental impact on the economy increases by approximately 40% for petrol and 100% for diesel minibuses relative to their electric counterpart. The total cost of environmental externalities amounts to R50.68/100 km for petrol, R72.26/100 km for diesel, and R36.13/100 km for electric minibuses. The largest contributor for diesel vehicles is tailpipe particulate matter emissions (R24.92/100 km), while petrol vehicles are dominated by carbon dioxide equivalent emissions from vehicle operation and fuel supply (R18.21/100 km). An eMBT travelling at an average speed of 27 km/h is associated with costs of R3.78/100 km for noise, R16.73/100 km for carbon dioxide equivalent emissions, and R15.61/100 km for non-tailpipe particulate matter. Non-tailpipe particulate matter emissions for ICE minibuses (R20.17/100 km for petrol and R20.32/100 km for diesel) are slightly higher than for electric minibuses due to the increased vehicle mass of battery-electric vehicles, while carbon dioxide equivalent emissions are slightly lower for diesel (R14.73/100 km) and slightly higher for petrol (R18.21/100 km), reflecting differences in energy supply and the largely coal-based electricity grid. Overall, the economic cost of environmental externalities for electric minibuses remains substantially lower than for their internal combustion engine counterparts.
4.3. Operator Financial Perspective
Table 6 shows the estimated CAPEX for the commonly used ICE minibus and three types of EV minibus alternatives, under three types of import scenarios. While the CAPEX (vehicle retail price) of an ICE minibus is typically less than its EV counterpart, some exceptions may exist—such as the Chufeng H Series. While this particular vehicle is in use in Ghana, homologation of this and other EV minibuses has yet to be completed in South Africa, as mentioned in Section 3.5.1. It is assumed that the addition of homologation costs could also cause the Chufeng H Series to surpass the retail price of its ICE counterpart.
Table 6.
CAPEX Comparison for Vehicle Options.
When comparing the Hiace H5C and Joylong EA5, the retail price of an EV minibus is 1.4 to 2 times that of an ICE Toyota Ses’fikile petrol or diesel. However, if the import duty on EVs is removed, the retail price of EVs reduces to approximately 1.2 to 1.7 times the cost of its ICE counterpart. The estimated cheapest option among the three is to import CKD with local assembly in South Africa, which could result in a retail price that is nearly the same as, or 1.5 times, the ICE retail price. Based on the three EV scenarios, CKD may be 13% to 21% cheaper than importing these vehicles CBU (with import duty). The same cost differences in percentages apply whether the vehicle is purchased cash or financed.
The operational expenditures are shown in Table 7. The dominant driver of the operational expenditure difference is the energy cost, which decreases from R4.09/km (petrol) and R2.57/km (diesel) to R1.10/km (Scenario S1), R1.37/km (Scenario S2), and R2.74/km (Scenario S3). This corresponds to energy cost reductions ranging from 33% to 73%, depending on the charging scenario and the internal combustion engine baseline.
Table 7.
Per-kilometre operational expenditures.
Electric vehicle maintenance costs are assumed to decrease by 40% to R0.51/km, while tyre and insurance costs increase to R0.23/km and R0.41/km, respectively, due to higher vehicle mass and purchase price.
Overall, the total operational cost per kilometre is estimated at R5.41/km for petrol, R3.96/km for diesel, R2.26/km for EV Scenario S1, R2.52/km for EV Scenario S2, and R3.89/km for EV Scenario S3. These results show that operational expenditure savings are strongly dependent on electricity pricing and charging strategy, with Scenario S1 providing the lowest per-kilometre operating cost and Scenario S3 approaching parity with diesel vehicles.
Figure 7 presents the total cost of ownership at two representative points in the financing horizon (year 6 and year 10) as a function of daily driving distance. This formulation highlights the sensitivity of financial viability to utilisation levels rather than time alone. Because vehicle financing is completed by year 6, the difference between year 6 and year 10 primarily reflects operational expenditure rather than capital repayment. Repayment is assumed for a financed deal where monthly instalments are paid. Typical loan repayment terms of 10% deposit, 20% interest rate, and 72 months repayments are assumed [63]. The results show that financial outcomes depend strongly on vehicle utilisation. The distance at which each curve crosses the zero line represents the utilisation threshold at which electrification becomes financially competitive with diesel. At lower daily driving distances, the higher capital cost dominates, and the TCO difference between electric and diesel vehicles is small. As daily driving distance increases, the TCO of diesel vehicles increases more steeply than that of electric vehicles, and S1 and S2 show significant savings compared to diesel, whereas S3 does not due to the high energy cost. The results also show that the TCO of petrol vehicles is higher than that of diesel vehicles, and therefore, the savings of electric vehicles compared to petrol are more significant than those compared to diesel. Additionally, CKD with local assembly shows a lower TCO than CBU, and therefore, the savings of electric vehicles compared to diesel are more significant in the CKD scenario than in the CBU scenario. Table 8 and Table 9 provide a direct comparison, summarising the differences in capital and operational expenditures for each vehicle and across all evaluated scenarios.
Figure 7.
Total cost of ownership (left) and cost difference relative to diesel (right) as a function of daily driving distance for three vehicle import and manufacturing pathways: (a) completely built units, (b) completely built units without import duty, and (c) completely knocked down kits with local assembly. Negative values indicate savings compared to diesel. Results are shown for year 6 and year 10 and include petrol, diesel, and three electric vehicle scenarios: EV S1, which assumes 35% home charging and 65% AC public charging at R2.42/kWh; EV S2, which assumes 100% AC public charging at R3.00/kWh; and EV S3, which assumes 100% AC and DC public charging at R6/kWh.
Table 8.
CAPEX differences between ICE and EV minibus taxis.
Table 9.
OPEX differences between ICE and EV minibus taxis across three EV scenarios.
5. Discussion
5.1. Energy Perspective
The analysis of taxi activity profiles in relation to Eskom’s time-of-use (ToU) tariff structure reveals significant opportunities for cost savings and operational efficiency for eMBT operators. The observed inactivity periods of taxis, particularly during off-peak and standard tariff hours, align well with lower electricity rates, suggesting that operators can strategically schedule charging during these times to minimise energy costs. This alignment not only enhances the economic viability of eMBTs but also supports grid stability by reducing the inevitable demand during peak hours. Furthermore, the potential for solar charging during these inactive periods presents an additional avenue for cost reduction and sustainability.
Additionally, integrating eMBTs into the energy system can help mitigate excess solar curtailment in the larger grid, as taxis can serve as flexible loads that absorb surplus solar generation during periods of high availability. However, the viability of this approach depends on the continued alignment of taxi activity patterns with ToU tariffs and solar availability, which can vary substantially across cities depending on local operating patterns.
Overall, the synergy between taxi activity patterns, ToU tariffs, and solar energy utilisation offers a promising pathway for enhancing the economic and environmental performance of electric minibus taxis.
5.2. Environmental Perspective
The analysis of GHG emissions for eMBTs compared to ICEVs in Cape Town reveals that, under current grid conditions, eMBTs produce higher CO2e emissions than their diesel counterparts. This is primarily due to South Africa’s high carbon intensity in its electricity generation mix, which is heavily reliant on coal-fired power plants. As a result, the environmental benefits of transitioning to electric vehicles are not fully realised in this context. However, there is significant potential for improvement as South Africa’s grid undergoes decarbonisation efforts [69]. The overlap between taxi inactivity periods and periods of high solar availability suggests that greater integration of renewable energy sources into the grid could enhance the GHG-reduction benefits of eMBTs. By utilising solar energy during these periods, eMBT operators can reduce their reliance on grid electricity, thereby lowering their overall emissions. As the grid continues to incorporate more renewable energy, the environmental advantages of electric vehicles are expected to become more pronounced, making them a more sustainable option for public transport in South Africa.
The environmental benefits of PM emissions from eMBTs compared to ICEVs are more pronounced. The absence of tailpipe emissions in eMBTs, results in substantially lower total PM2.5 and PM10 emissions for eMBTs when compared to diesel MBTs and comparable emissions when no regenerative braking is applied. While the increased mass of eMBTs contributes to higher tyre and road wear emissions, overall PM emissions remain comparable to those of petrol-powered minibus taxis. With diesel MBTs being the most pervasive vehicle type operating in South Africa, due to their better fuel efficiency, their replacement with eMBTs is particularly important in urban areas where air quality is a major concern, as PM pollution has been linked to various health issues. These substantial PM reductions effectively offset the GHG emissions advantage that diesel vehicles currently hold over eMBTs on South Africa’s coal-dominated grid, particularly given the immediate and direct health impacts of particulate matter exposure in densely populated urban environments. The implementation of regenerative braking systems in eMBTs plays a crucial role in minimising brake wear emissions, further enhancing their environmental performance. Overall, the transition to eMBTs offers significant advantages by reducing particulate matter emissions, thereby improving air quality and public health outcomes.
The economic analysis of environmental externalities associated with eMBTs compared to ICEVs highlights substantial cost savings from adopting electric vehicles. Despite the high GHG emissions of eMBTs under current grid conditions, the overall economic cost of environmental externalities is significantly lower for eMBTs. This is primarily due to significant reductions in noise pollution, elimination of tailpipe emissions, and reductions in PM emissions facilitated by regenerative braking systems. The combined effect of these factors results in a markedly lower economic burden for eMBTs, making them a more favourable option from an environmental and economic perspective. As the grid continues to decarbonise and the environmental performance of eMBTs improves, these economic benefits are expected to increase, further supporting the case for transitioning to eMBTs.
Although we acknowledge that this study is not a full life-cycle assessment of eMBTs, we note that the manufacturing and disposal of vehicles and their battery packs have significant effects on their environmental impact. Electric vehicles typically have higher manufacturing emissions than their ICE counterparts due to battery production, although these impacts can be partially offset over time through lower operating emissions, especially as electricity grids continue to decarbonise. Additionally, end-of-life management, including battery second-life applications and recycling, is a rapidly developing area of research and is expected to further reduce the lifecycle impacts.
5.3. Operator Perspective
The financial incentive for the operator to transition to eMBT lies in the OPEX savings from reduced fuel and maintenance costs. However, CAPEX, tyre and insurance costs are expected to increase. TCO analysis indicated that financial feasibility depends on several factors, including vehicle purchase price, loan repayment terms, import type (CBU vs. CKD), and energy costs, which are key determinants. For the transition to be financially feasible, the charging cost must be lower than R4.50/kWh, inclusive of electricity cost and charging infrastructure usage cost. Consequently, should the minibus taxi industry utilise currently available charging infrastructure offered by the private sector in South Africa (e.g., Gridcars) (EV S3), operators would be worse off financially. The inclusion of at-home charging increases not only operational (driving range) viability but also financial feasibility, as off-peak electricity tariffs yield cost savings. Since an EV (Joylong EA5) is approximately 1.5 times the cost of the commonly used diesel Ses’Fikile, the removal of import duties and the doubling of the scrapping allowance through the Taxi Recapitalisation Programme could offset the price difference, making the purchase price the same for an ICE and EV minibus taxi.
5.4. Future Work
The study acknowledges several limitations that could be addressed in future research. The mobility dataset provides rich new insights into minibus operations in Cape Town but does not reflect the diversity of minibus taxi operations across different regions and seasons in South Africa, potentially affecting the generalisability of the findings. Future studies could aim to collect and analyse long-term paratransit datasets from a wider range of cities and rural areas to capture the full spectrum of operational patterns and their implications for electrification. Additionally, the lack of real-world fuel consumption data specific to minibus taxis introduces uncertainty into the energy consumption estimates. Future studies could focus on collecting empirical data on fuel efficiency to enhance the accuracy of such analyses. The assumptions made regarding emission factors and the grid emission factor also present areas for refinement. Future research could explore more holistic emission factors that account for variations in vehicle age, driving conditions, vehicle manufacturing, and battery production. Furthermore, investigating various grid decarbonisation scenarios would provide insights into how changes in the electricity generation mix could impact the environmental performance of eMBTs over time. The study assumes minibus owners and drivers are willing to adopt eMBTs; the true market readiness may be tested using results such as those in this study. Overall, addressing these limitations would contribute to a more comprehensive understanding of the implications of transitioning to electric minibus taxis in South Africa.
6. Conclusions
In this paper, we presented the first large-scale, multi-perspective evaluation of electrifying South Africa’s minibus taxi fleet using real-world mobility data from Cape Town. By integrating energy, environmental, and operator-focused analyses, the study provides an evidence-based assessment of the opportunities and challenges of transitioning to electric minibus taxis (eMBTs).
From an energy perspective, daily driving patterns reveal substantial periods of inactivity that align well with off-peak electricity tariffs and energy availability. These temporal overlaps indicate that, with managed charging, eMBTs can be integrated into the energy system without exacerbating peak demand, while also supporting improved utilisation of renewable energy. However, substantial differences in mobility patterns exist between cities, which may affect adoption readiness (or the number of operational changes needed to transition towards electrification) across cities.
The environmental analysis shows that, under South Africa’s current coal-dominated electricity mix, eMBTs have higher lifecycle GHG emissions than diesel minibuses but lower emissions than petrol minibuses. However, eMBTs provide pronounced reductions in particulate matter emissions, primarily by eliminating tailpipe pollutants and reducing brake wear through regenerative braking. Similarly, eMBTs are associated with lower noise pollution despite moderate travel speeds. These reductions translate directly into lower health-related externalities, resulting in a significantly lower daily economic burden than with ICEVs.
From an operator’s perspective, electrification presents both opportunities and risks. Although eMBTs currently carry a higher upfront cost, their lower energy and maintenance expenses can deliver long-term operating savings, provided that charging costs remain below approximately R4.50/kWh. The results further show that savings from eMBT operations increase over time and with distance, for inter and intra regional routes, but not long-distance inter-provincial routes. The importance of favourable financing structures, targeted incentives, and reduced import duties is highlighted by the utilisation threshold at which electrification becomes financially competitive. Under supportive policy conditions—such as local assembly, scrapping allowance reform, or tariff restructuring—eMBTs could become financially competitive with conventional diesel taxis.
The policy implications of this research are multifaceted. To facilitate the transition to eMBTs and realise their economic and environmental benefits, policymakers should consider investing in charging infrastructure that incorporates renewable energy sources and is strategically located to align with taxi inactivity periods, particularly in areas with high solar potential. Grid coordination will be essential to manage the additional load from eMBT charging and to maximise the use of renewable energy while minimising additional costs incurred under time-of-use electricity tariffs. Additionally, subsidy design should focus on reducing the upfront cost barrier for operators, potentially through import duty exemptions, local assembly incentives, or enhanced scrapping allowances for old ICE minibuses. A holistic approach that integrates energy planning, transport regulation, and financial support will be crucial to securing operator buy-in and realising the full benefits of electrifying Cape Town’s minibus taxi fleet.
Overall, the results indicate that electrifying Cape Town’s minibus taxi fleet is feasible and offers tangible public health and long-term economic benefits, but its environmental benefits depend critically on accelerated grid decarbonisation. The path towards electrification is complex, and ensuring operator buy-in requires coordinated action across energy planning, transport regulation, and operator financing. As renewable energy penetration increases and charging ecosystems mature, the case for eMBTs will strengthen, positioning electrification as a viable and ultimately necessary pathway for a cleaner, more sustainable transport system.
Author Contributions
Conceptualization, J.T.S., M.K. and M.J.B.; Methodology, J.T.S., M.K., M.E.M. and M.J.B.; Software, J.T.S., M.K. and M.E.M.; Validation, J.T.S., C.V. and M.J.B.; Formal analysis, J.T.S. and M.K.; Investigation, J.T.S. and M.K.; Resources, M.J.B.; Data curation, J.T.S., M.K., S.A. and C.V.; Writing—original draft, J.T.S., M.K. and M.E.M.; Writing—review and editing, S.A., C.V. and M.J.B.; Visualization, J.T.S. and S.A.; Supervision, C.V. and M.J.B.; Project administration, M.J.B.; Funding acquisition, M.J.B. and M.K. All authors have read and agreed to the published version of the manuscript.
Funding
This research received funding from the Western Cape Government Motorised Transport (WC GMT) under grant S009285. J.T.S. received funding from the Global Strategic Communications Council (GSCC) and D.W. Ackerman Bursary scheme. M.K. received funding through the Lee Schipper Memorial Scholarship, which is provided by the Volvo Research and Educational Foundations (VREF), World Resources Institute (WRI), and the Schipper Family.
Institutional Review Board Statement
Not applicable.
Informed Consent Statement
Not applicable.
Data Availability Statement
The original contributions presented in this study are included in the article. Further inquiries can be directed to the corresponding author.
Conflicts of Interest
The authors declare no conflicts of interest.
References
- Ritchie, H.; Rosado, P.; Roser, M. Breakdown of Carbon Dioxide, Methane, and Nitrous Oxide Emissions by Sector. 2020. Available online: https://ourworldindata.org/emissions-by-sector (accessed on 29 January 2026).
- Ritchie, H. Cars, Planes, Trains: Where Do CO2 Emissions from Transport Come From? 2020. Available online: https://ourworldindata.org/co2-emissions-from-transport (accessed on 29 January 2026).
- European Parliament. EU Ban on Sale of New Petrol and Desel Cars from 2035 Explained. 2023. Available online: https://www.europarl.europa.eu/topics/en/article/20221019STO44572/eu-ban-on-sale-of-new-petrol-and-diesel-cars-from-2035-explained (accessed on 18 November 2025).
- Bankole, S.O.; Donaldson, D.L.; Dissanayake, D.; Sakamoto Ferranti, E.J. Electrifying Paratransit in Sub-Saharan Africa: Perspectives from Practitioners. Transp. Res. Part D Transp. Environ. 2026, 150, 105113. [Google Scholar] [CrossRef] [Scilit]
- Statista Inc. Climate Change in Africa. Contains Statistical Overview and Charts on Climate Change Indicators Across Africa. 2025. Available online: https://www.statista.com/topics/9715/climate-change-in-africa/ (accessed on 18 November 2025).
- Ndibatya, I.; Booysen, M. Minibus Taxis in Kampala’s Paratransit System: Operations, Economics and Efficiency. J. Transp. Geogr. 2020, 88, 102853. [Google Scholar] [CrossRef] [Scilit]
- Vegter, I. South Africa’s Minibus Taxi Industry: Resistance to Formalisation and Innovation; Technical Report; South African Institute of Race Relations: Richmond Johannesburg, South Africa, 2020. [Google Scholar]
- Kumar, A.; Barrett, F. Stuck in Traffic: Urban Transport in Africa; World Bank: Washington, DC, USA, 2008. [Google Scholar]
- Onderwater, P.; Da Silva, E. Cycling to Public Transport Stations: The Most Sustainable Transport Mode Combination. In 40th Annual Southern African Transport Conference 2022; Southern African Transport Conference: Pretoria, South Africa, 2022. [Google Scholar]
- Booysen, M.; Andersen, S.; Zeeman, A. Informal Public Transport in Sub-Saharan Africa as a Vessel for Novel Intelligent Transport Systems. In Proceedings of the 16th International IEEE Conference on Intelligent Transportation Systems (ITSC 2013); IEEE: Piscataway, NJ, USA, 2013; pp. 767–772. [Google Scholar] [CrossRef] [Scilit]
- Behrens, R.; McCormick, D.; Mfinanga, D. An Introduction to Paratransit in Sub-Saharan African Cities. In Paratransit in African Cities, 1st ed.; Routledge: London, UK, 2015. [Google Scholar] [CrossRef] [Scilit]
- Friedman, R. Minibus Taxis. 2018. Available online: https://hsf.org.za/publications/hsf-briefs/minibus-taxis (accessed on 29 January 2026).
- SANTACO—South African National Taxi Council. Available online: https://santaco.org/ (accessed on 29 January 2026).
- Buresh, K.M.; Apperley, M.D.; Booysen, M.J. Three Shades of Green: Perspectives on at-Work Charging of Electric Vehicles Using Photovoltaic Carports. Energy Sustain. Dev. 2020, 57, 132–140. [Google Scholar] [CrossRef] [Scilit]
- Giliomee, J.; Hull, C.; Collett, K.A.; McCulloch, M.; Booysen, M. Simulating Mobility to Plan for Electric Minibus Taxis in Sub-Saharan Africa’s Paratransit. Transp. Res. Part D Transp. Environ. 2023, 118, 103728. [Google Scholar] [CrossRef] [Scilit]
- City of Cape Town; Urban Mobility Directorate. Comprehensive Integrated Transport Plan 2023–2028: 2024 Annual Update; City of Cape Town: Cape Town, South Africa, 2024. Available online: https://resource.capetown.gov.za/documentcentre/Documents/City%20strategies,%20plans%20and%20frameworks/CITP_2024_Annual_Update.pdf (accessed on 13 February 2026).
- Statistics South Africa. National Households Transportation Survey 2020: Statistical Release P0320; Technical Report; Statistics South Africa: Pretoria, South Africa, 2022.
- Fitzgerald, D.; Le Roux, M.; Bekker, B.; Pierce, W.; Auret, C.; Morison, S.; Snyman, L. SA Electricity Made Visual. 2025. Available online: https://www.crses.sun.ac.za/sa-energy-stats/ (accessed on 29 January 2026).
- U.S. Energy Information Administration. Fiscal Country Analysis Brief: South Africa; Country Analysis Brief; U.S. Energy Information Administration: Washington, DC, USA, 2024.
- Mkoko, S. Renewable Energy: A Small but Growing Share in South Africa. ESI Africa. 21 October 2024. Available online: https://www.esi-africa.com/industry-sectors/future-energy/renewable-energy-a-small-but-growing-share-in-south-africa/ (accessed on 13 February 2026).
- Galuszka, J.; Martin, E.; Nkurunziza, A.; Achieng’ Oginga, J.; Senyagwa, J.; Teko, E.; Lah, O. East Africa’s Policy and Stakeholder Integration of Informal Operators in Electric Mobility Transitions—Kigali, Nairobi, Kisumu and Dar Es Salaam. Sustainability 2021, 13, 1703. [Google Scholar] [CrossRef] [Scilit]
- van Benthem, A. Arthur van Benthem on New Cars, Old Cars, and Air Pollution Today|Penn Today. 2021. Available online: https://penntoday.upenn.edu/news/wharton-arthur-van-benthem-new-cars-old-cars-and-air-pollution-today (accessed on 29 January 2026).
- Hall, D.; Xie, Y.; Minjares, R.; Lutsey, N.; Kodjak, D. Decarbonizing Road Transport by 2050: Effective Policies to Accelerate the Transition to Zero-Emission Vehicles; Technical Report; International Council on Clean Transportation: Washington, DC, USA, 2021; Available online: https://theicct.org/publication/zevtc-effective-policies-dec2021/ (accessed on 13 February 2026).
- Cassius, S.; El Deeb, N.; Sorour, M.; Turner, S. Future of Paratransit and Shared Mobility: Mapping Report; Technical Report; Institute for Transportation and Development Policy (ITDP): New York, NY, USA, 2021. [Google Scholar]
- BusinessTech. Big Win for Eskom Comes at a Steep Cost. BusinessTech. 31 March 2025. Available online: https://businesstech.co.za/news/energy/818917/big-win-for-eskom-comes-at-a-steep-cost/ (accessed on 13 February 2026).
- Gasparotto, J.; Da Boit Martinello, K. Coal as an Energy Source and Its Impacts on Human Health. Energy Geosci. 2021, 2, 113–120. [Google Scholar] [CrossRef] [Scilit]
- Department of Forestry, Fisheries and the Environment (DFFE), Republic of South Africa. South Africa’s 2023 Grid Emission Factors Report (G53079 GON 6454); Technical Report; Government Gazette Notice G53079 GON 6454, 25 July 2025; Department of Forestry, Fisheries and the Environment: Pretoria, South Africa, 2025.
- Pretorius, B.G.; Strauss, J.M.; Booysen, M.J. Grid and Mobility Interdependence in the Eventual Electrification of Operational Minibus Taxis in Cities in Sub-Saharan Africa. Energy Sustain. Dev. 2024, 79, 101411. [Google Scholar] [CrossRef] [Scilit]
- Naidja, L.; Ali-Khodja, H.; Khardi, S. Sources and Levels of Particulate Matter in North African and Sub-Saharan Cities: A Literature Review. Environ. Sci. Pollut. Res. 2018, 25, 12303–12328. [Google Scholar] [CrossRef] [Scilit]
- Bao, J.F.; Yang, J.; Guo, B.C.; Mo, J.J.; She, Q.Y.; Li, A. Trends in All-Cause Mortality Attributable to Particulate Matter 2.5 Pollution in Sub-Saharan Africa: An Age-Period-Cohort Analysis. Ecotoxicol. Environ. Saf. 2025, 303, 118979. [Google Scholar] [CrossRef] [Scilit]
- Anderson, J.O.; Thundiyil, J.G.; Stolbach, A. Clearing the Air: A Review of the Effects of Particulate Matter Air Pollution on Human Health. J. Med. Toxicol. 2012, 8, 166–175. [Google Scholar] [CrossRef] [Scilit]
- Booysen, M.J.; Abraham, C.J.; Pretorius, B.G. A System-of-Systems Framework for Planning the Electrification of Paratransit. Energy Strategy Rev. 2025, 62, 101892. [Google Scholar] [CrossRef] [Scilit]
- Booysen, M.J.; Abraham, C.J.; Rix, A.J.; Giliomee, J.H. Electrification of minibus taxis in the shadow of load shedding and energy scarcity. S. Afr. J. Sci. 2022, 118, 1–5. [Google Scholar] [CrossRef] [Scilit]
- Jahura, A.; Vanderschuren, M.; Booysen, M. A Web of Factors and Dependencies to Consider in the Electrification of South Africa’s Minibus Taxi Industry. In Proceedings of the Southern African Transport Conference, Pretoria, South Africa, 8–11 July 2024. [Google Scholar]
- Abraham, C.J.; Lacock, S.; du Plessis, A.A.; Booysen, M.J. Empirically Validated Method to Simulate Electric Minibus Taxi Efficiency Using Tracking Data. Energies 2025, 18, 446. [Google Scholar] [CrossRef] [Scilit]
- Toyota South Africa Motors. Toyota HiAce Ses’fikile; Toyota South Africa Motors. 2025. Available online: https://www.toyota.co.za/vehicles/hiace-sesfikile (accessed on 13 February 2026).
- HS Electric Bus. Joylong EA5—100% Full Electric Vehicle. Features Include 86.1 kWh Battery, WLTP Range of 335 km, Seating Capacity 13+1. 2025. Available online: https://www.hseb.sg/joylong-ea5/ (accessed on 17 November 2025).
- Lilleike, G. Toyota Hiace Ses’fikile (2019) Specs & Price. 2019. Available online: https://www.cars.co.za/motoring-news/toyota-hiace-sesfikile2019-specs-price/27141/ (accessed on 5 November 2025).
- Kornelius, G.; Forbes, P.; Fischer, T.; Govender, M. Tier 2 greenhouse gas emission factors for South African liquid and gaseous fuels. Clean Air J. 2022, 32. [Google Scholar] [CrossRef] [Scilit]
- Climatiq Ltd. Emission Factor: a202fb65-92b5-4fa1-b81a-35660fe7f423. 2025. Available online: https://www.climatiq.io/data/emission-factor/a202fb65-92b5-4fa1-b81a-35660fe7f423 (accessed on 6 November 2025).
- du Plessis, M.J.; van Eeden, J.; Botha, M. Development of Emission Intensity for a South African Road-Freight Logistics Service Provider. S. Afr. J. Ind. Eng. 2022, 33, 15–28. [Google Scholar] [CrossRef] [Scilit]
- European Environment Agency (EEA). EMEP/EEA Air Pollutant Emission Inventory Guidebook 2019; Technical Report 13/2019; European Environment Agency: Copenhagen, Denmark, 2019.
- Fuels Industry Association of South Africa. Fuel Prices—Current & Past; Fuels Industry Association of South Africa: Johannesburg, South Africa, 2025. [Google Scholar]
- GridCars. ChargeMap: Public Electric-Vehicle Charging Station Locator—South Africa. Interactive Map of EV Charger Locations and Status Across South Africa. 2025. Available online: https://www.chargestations.co.za/ChargeMap.aspx?UserGroupID=facf9751-58ca-490f-8ca5-d2b433e6b2e5 (accessed on 17 November 2025).
- Eskom Distribution. Tariffs and Charges—Distribution. Overview of Tariff Categories (Residential, Urban, Rural, Municipal, Generator) and Links to Detailed Pricing Documents. 2025. Available online: https://www.eskom.co.za/distribution/tariffs-and-charges/ (accessed on 17 November 2025).
- flx EV. Flx EV—Electric Minibus Taxis & Charging Solutions in South Africa. 2025. Available online: https://www.flxev.com/ (accessed on 29 January 2026).
- Higer. HIGER H5C EV Brochure; Product Brochure for the HIGER H5C EV van with Technical Specifications; Higer: Suzhou, China, 2023. [Google Scholar]
- Ribbonaar, D.; Martin, G.; Hendricks, N.; Jackpersad, Z.; Grey, P.; Weber, M. Bue Dot Taxi System in the Western Cape: Systems and Technology Overview. In Proceedings of the 41st Southern African Transport Conference, Pretoria, South Africa, 10–13 July 2023. [Google Scholar]
- Behrens, R.; Onderwater, P.; Shah, K. Towards a Revitalization of Passenger Rail Services in South African Cities: Lessons from International Institutional Reforms. Res. Transp. Econ. 2026, 115, 101692. [Google Scholar] [CrossRef] [Scilit]
- Collett, K.A.; Hirmer, S.A. Data Needed to Decarbonize Paratransit in Sub-Saharan Africa. Nat. Sustain. 2021, 4, 562–564. [Google Scholar] [CrossRef] [Scilit]
- NASA POWER Project, NASA/GSFC (Langley Research Center). NASA POWER API—Hourly Temporal Point Data Service. Returns Hourly Meteorological and Ssolar Parameters for a Specified Latitude/Longitude. 2025. Available online: https://power.larc.nasa.gov/api/temporal/hourly/point (accessed on 14 November 2025).
- Eskom Holdings SOC Ltd. Tariffs and Charges Booklet 2025/2026; Technical Report; Eskom Holdings SOC Ltd.: Sandton, South Africa, 2025. [Google Scholar]
- Aqua-Calc.com. Density Table—Gasoline & Diesel, 2025. Density of Gasoline = 748.9 kg/m3. Density of Diesel = 850.8 kg/m3. Available online: https://www.aqua-calc.com/page/density-table/substance/diesel (accessed on 6 November 2025).
- Department of Mineral Resources and Energy (South Africa). 2023 South African Energy Trade Report; Technical Report; Directorate: Energy Economics and Statistics; Data Based on Import and Export Statistics from the South African Revenue Service; Department of Mineral Resources and Energy: Pretoria, South Africa, 2023.
- SEA-DISTANCES.ORG. Sea-Distances/Port Distances—Online Tool for Calculation of Distances Between Sea Ports. Database claims “More than 4,000,000 Distances” and “More than 4,000 Sea Ports”. 2025. Available online: https://www.sea-distances.org/ (accessed on 6 November 2025).
- Google LLC. Google Maps—Explore the World with Maps and Navigation. 2025. Available online: https://www.google.com/maps (accessed on 6 November 2025).
- Abraham, C.; Rix, A.; Ndibatya, I.; Booysen, M. Ray of Hope for Sub-Saharan Africa’s Paratransit: Solar Charging of Urban Electric Minibus Taxis in South Africa. Energy Sustain. Dev. 2021, 64, 118–127. [Google Scholar] [CrossRef] [Scilit]
- Beddows, D.C.S.; Harrison, R.M. PM10 and PM2.5 emission factors for non-exhaust particles from road vehicles: Dependence upon vehicle mass and implications for battery electric vehicles. Atmos. Environ. 2021, 244, 117886. [Google Scholar] [CrossRef] [Scilit]
- van Ryneveld, P. Urban Transport Analysis for the Urbanisation Review; Technical Report; World Bank/National Treasury (Urbanisation Review Project): Washington, DC, USA, 2018.
- Waterberg Toyota. Sesfikile Engine Specifications; Waterberg Toyota: Bela-Bela, South Africa, 2016. [Google Scholar]
- Danish Road Directorate (Vejdirektoratet). Noise from Electric Vehicles: Measurement and Analysis of Noise Emissions from Battery Electric and Internal-Combustion Engine Passenger Cars; Technical Report; Part of the COMPETT (Competitive Electric Town Transport) Project; Danish Road Directorate: Copenhagen, Denmark, 2013.
- European Commission. Directorate General for Mobility and Transport; In Handbook on the External Costs of Transport: Version 2019—1.1; CE Delft: Delft, The Netherlands; Publications Office of the European Union: Luxembourg, 2020. [Google Scholar]
- Transaction Capital Ltd. Half Year 2022 SA Taxi Holdings Financial Prospectus; Technical Report; Transaction Capital Ltd.: Johannesburg, South Africa, 2022. [Google Scholar]
- Department of Trade, Industry and Competition (South Africa). Minister Patel Launches Half a Billion Rand Toyota Hiace Ses’fikile Plant Expansion. 2019. Available online: https://www.thedtic.gov.za/minister-patel-launches-half-a-billion-rand-toyota-hiace-sesfilikile-plant-expansion/ (accessed on 29 January 2026).
- Cao, Z.; Gao, W.; Fu, Y.; Turchiano, C.; Kurdkandi, N.V.; Gu, J.; Mi, C. Second-Life Assessment of Commercial LiFePO4 Batteries Retired from EVs. Batteries 2024, 10, 306. [Google Scholar] [CrossRef] [Scilit]
- Department of Mineral Resources and Energy. Integrated Resource Plan 2025; Government Policy Report; Department of Mineral Resources and Energy: Pretoria, South Africa, 2025.
- NDC Partnership. South Africa. NDC Partnership. Available online: https://ndcpartnership.org/country/zaf (accessed on 13 February 2026).
- Dimopoulos Eggenschwiler, P.; Schreiber, D.; Schüller, N. Brake Particle PN and PM Emissions of Battery Electric Vehicles (BEVs): On-Vehicle Chassis Dynamometer Measurements. Atmosphere 2025, 17, 59. [Google Scholar] [CrossRef] [Scilit]
- Odhiambo, E.; Kipkoech, D.; Hegazy, A.; Manuel, M.; Schalekamp, H.; Klopp, J.M. The Potential for Minibus Electrification in Three African Cities: Cairo, Nairobi, and Cape Town; Technical Report; Volvo Research & Educational Foundations: Gothenburg, Sweden, 2021. [Google Scholar]
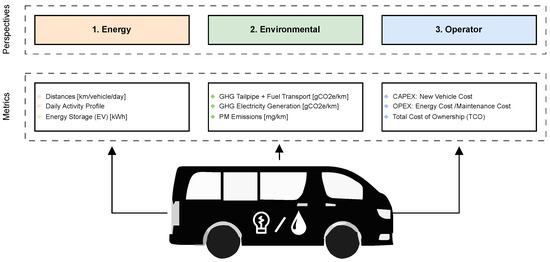
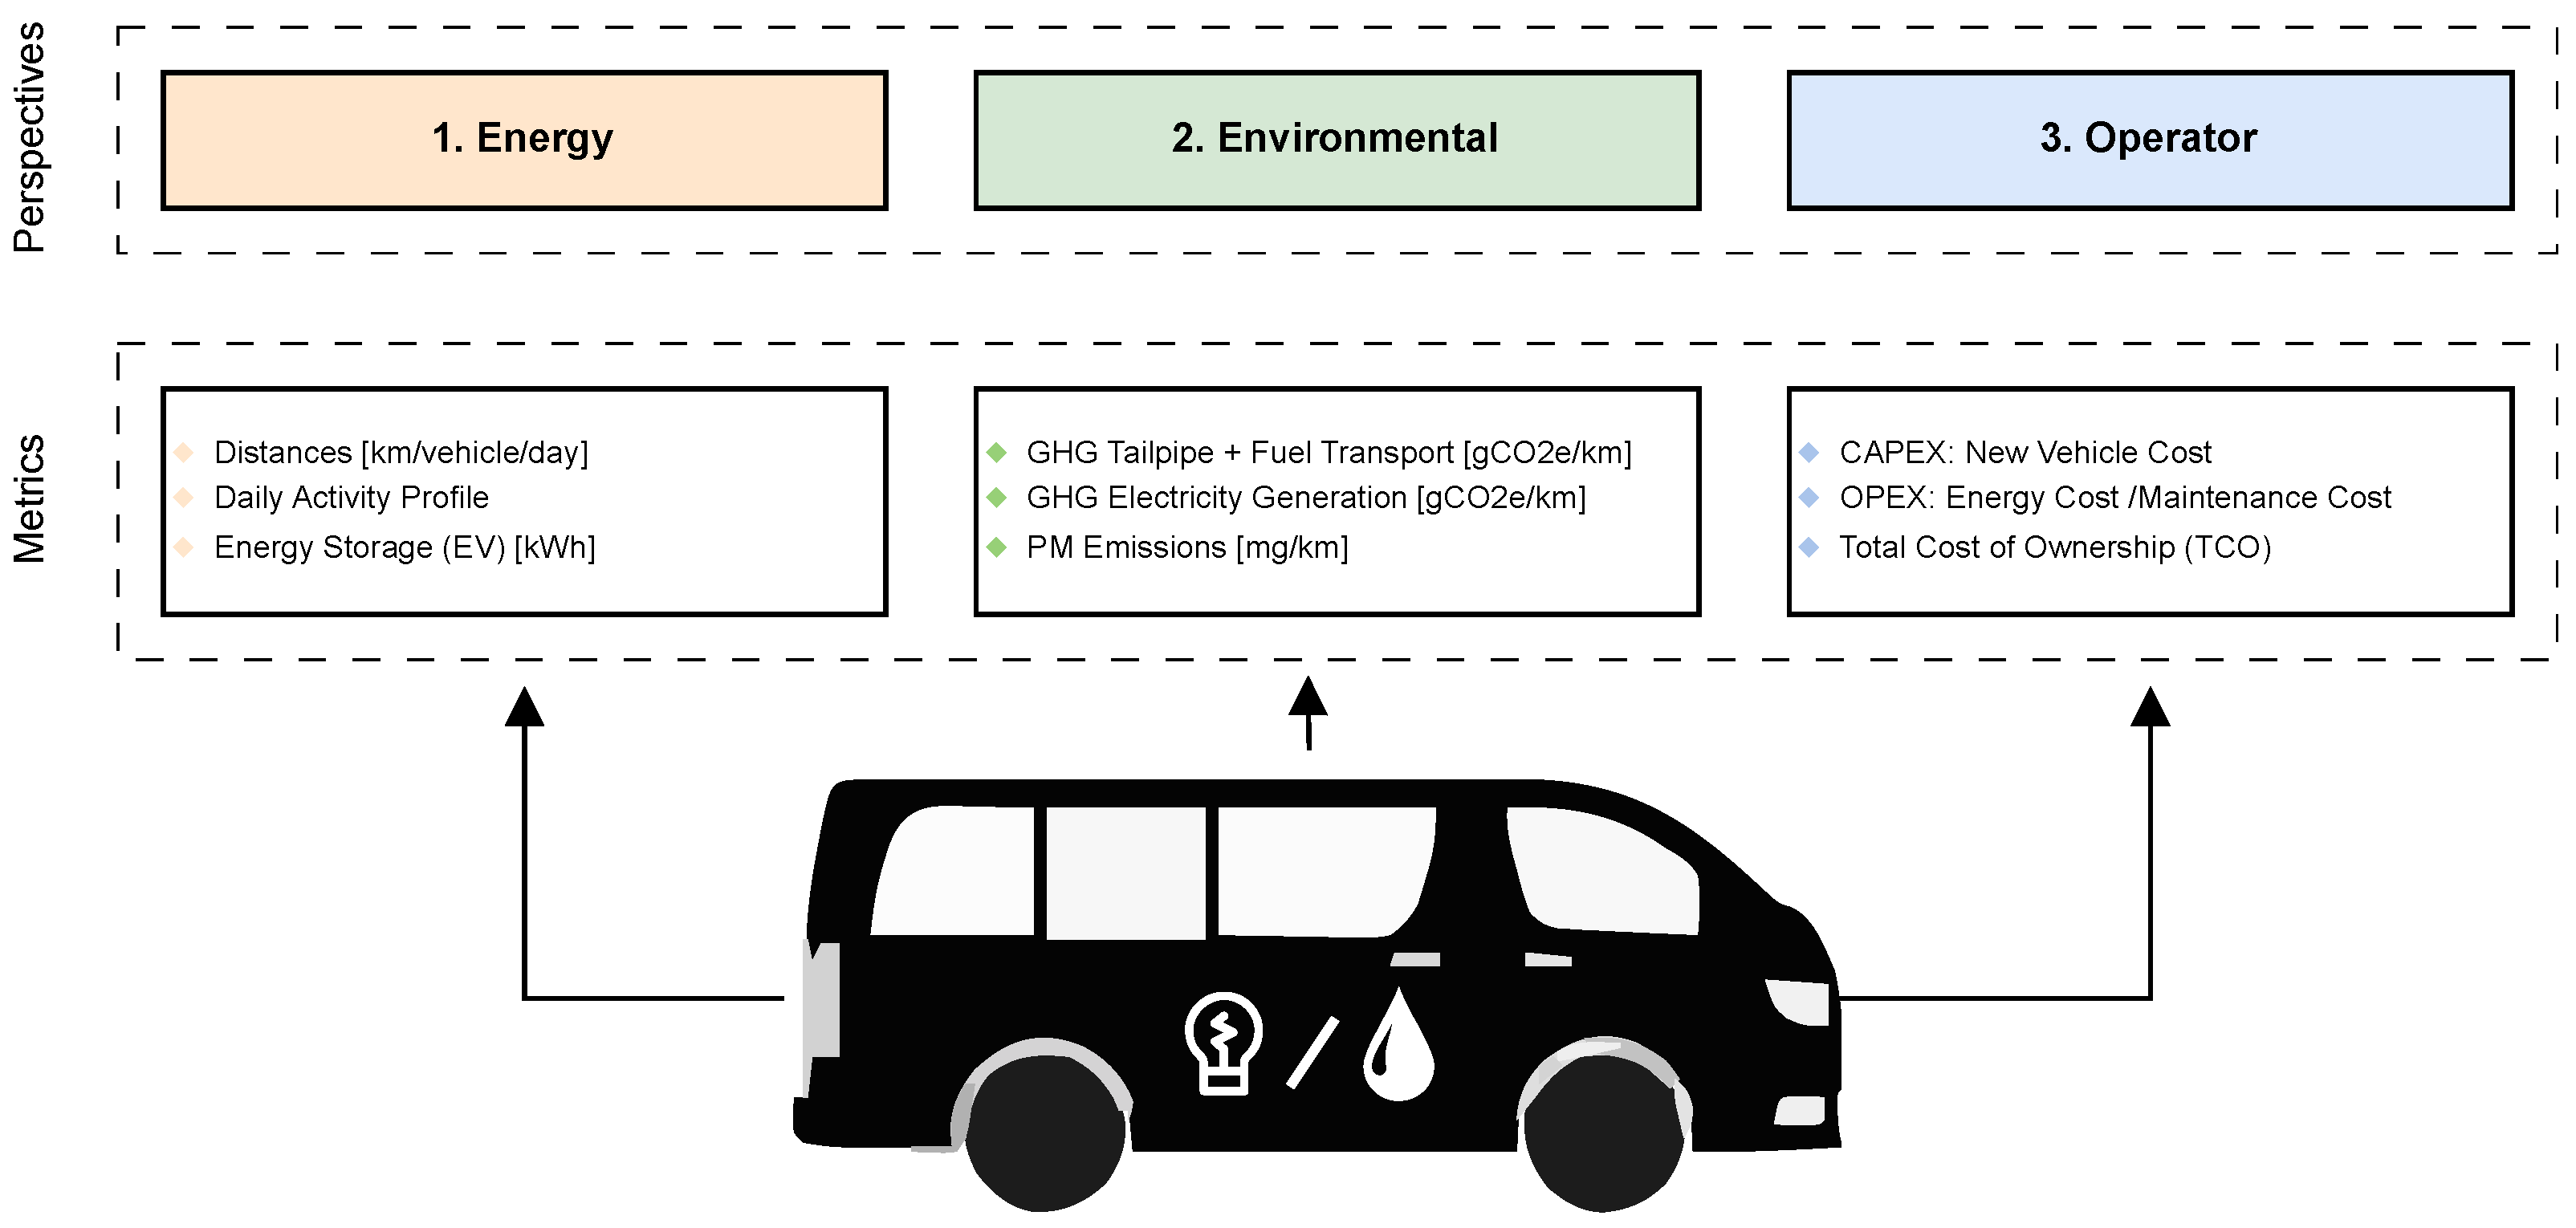
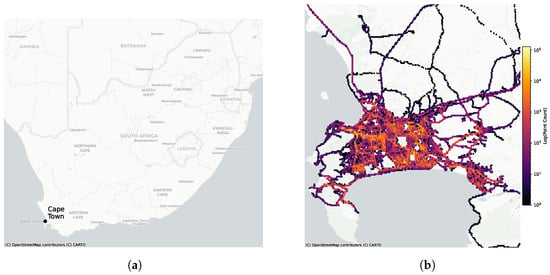
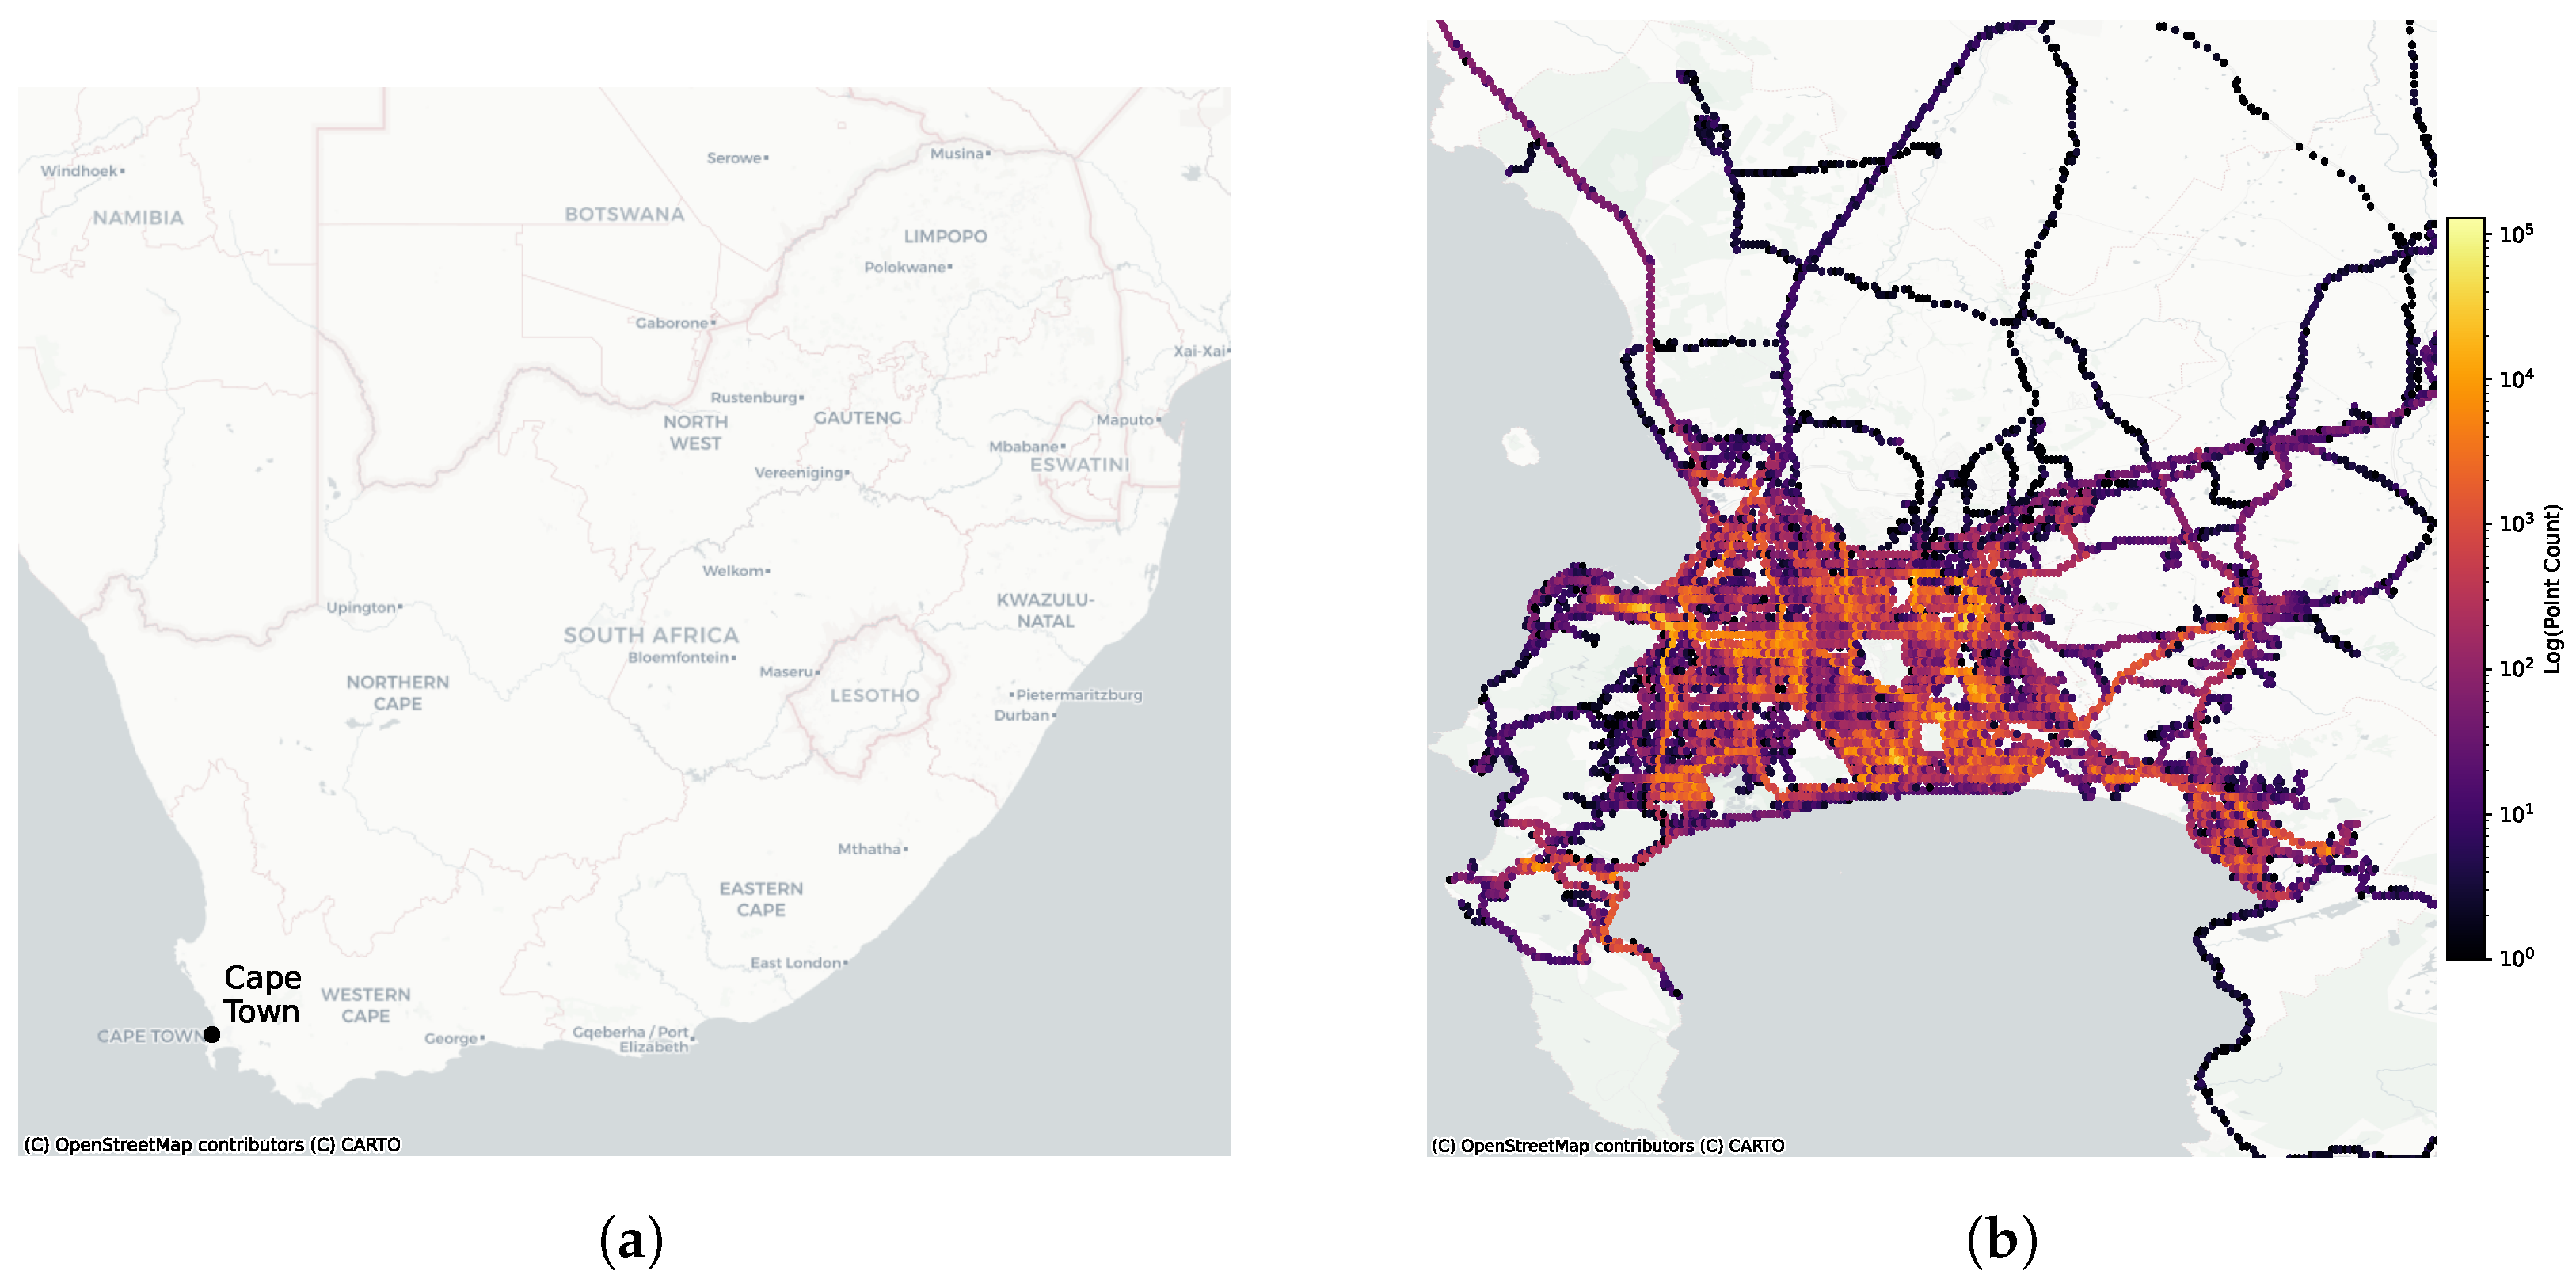
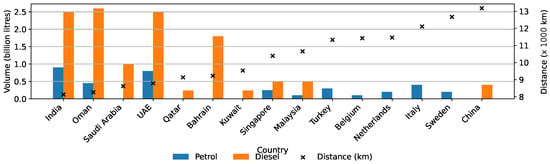
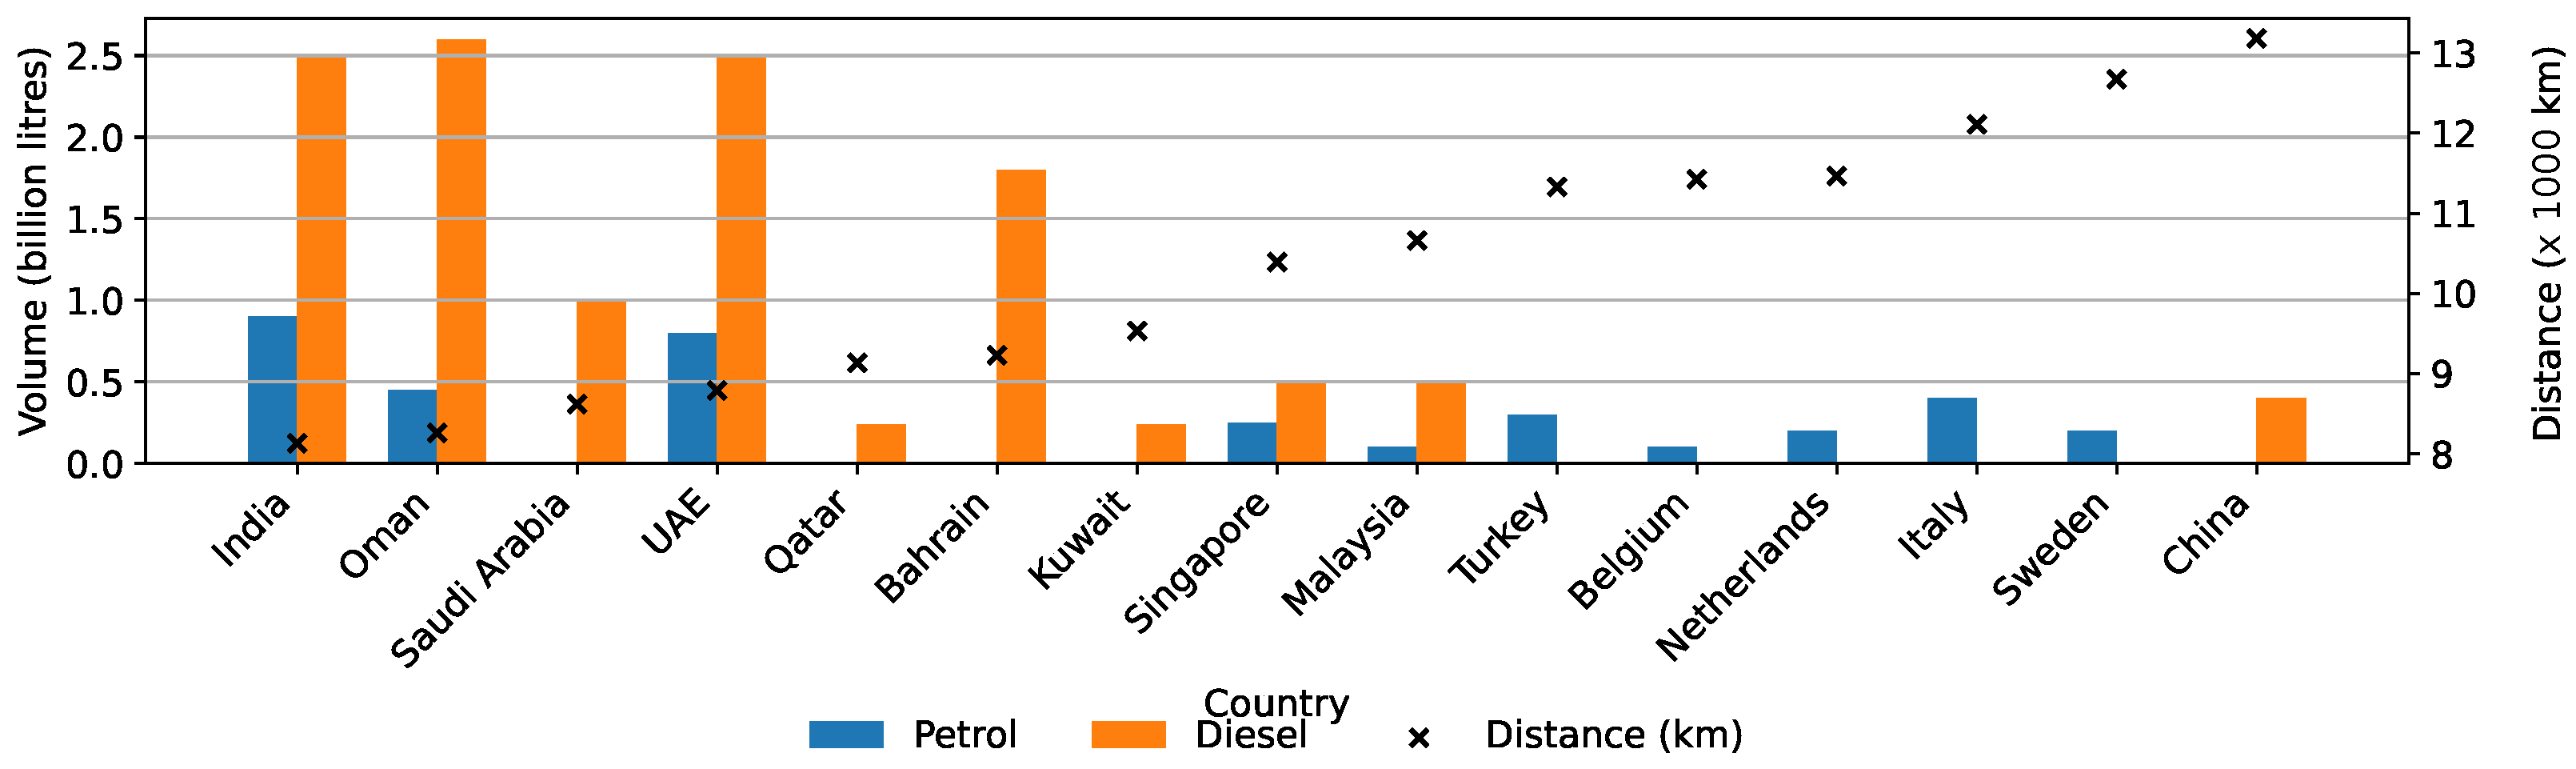
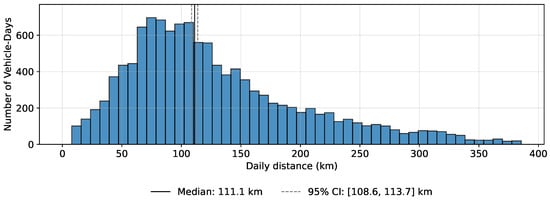
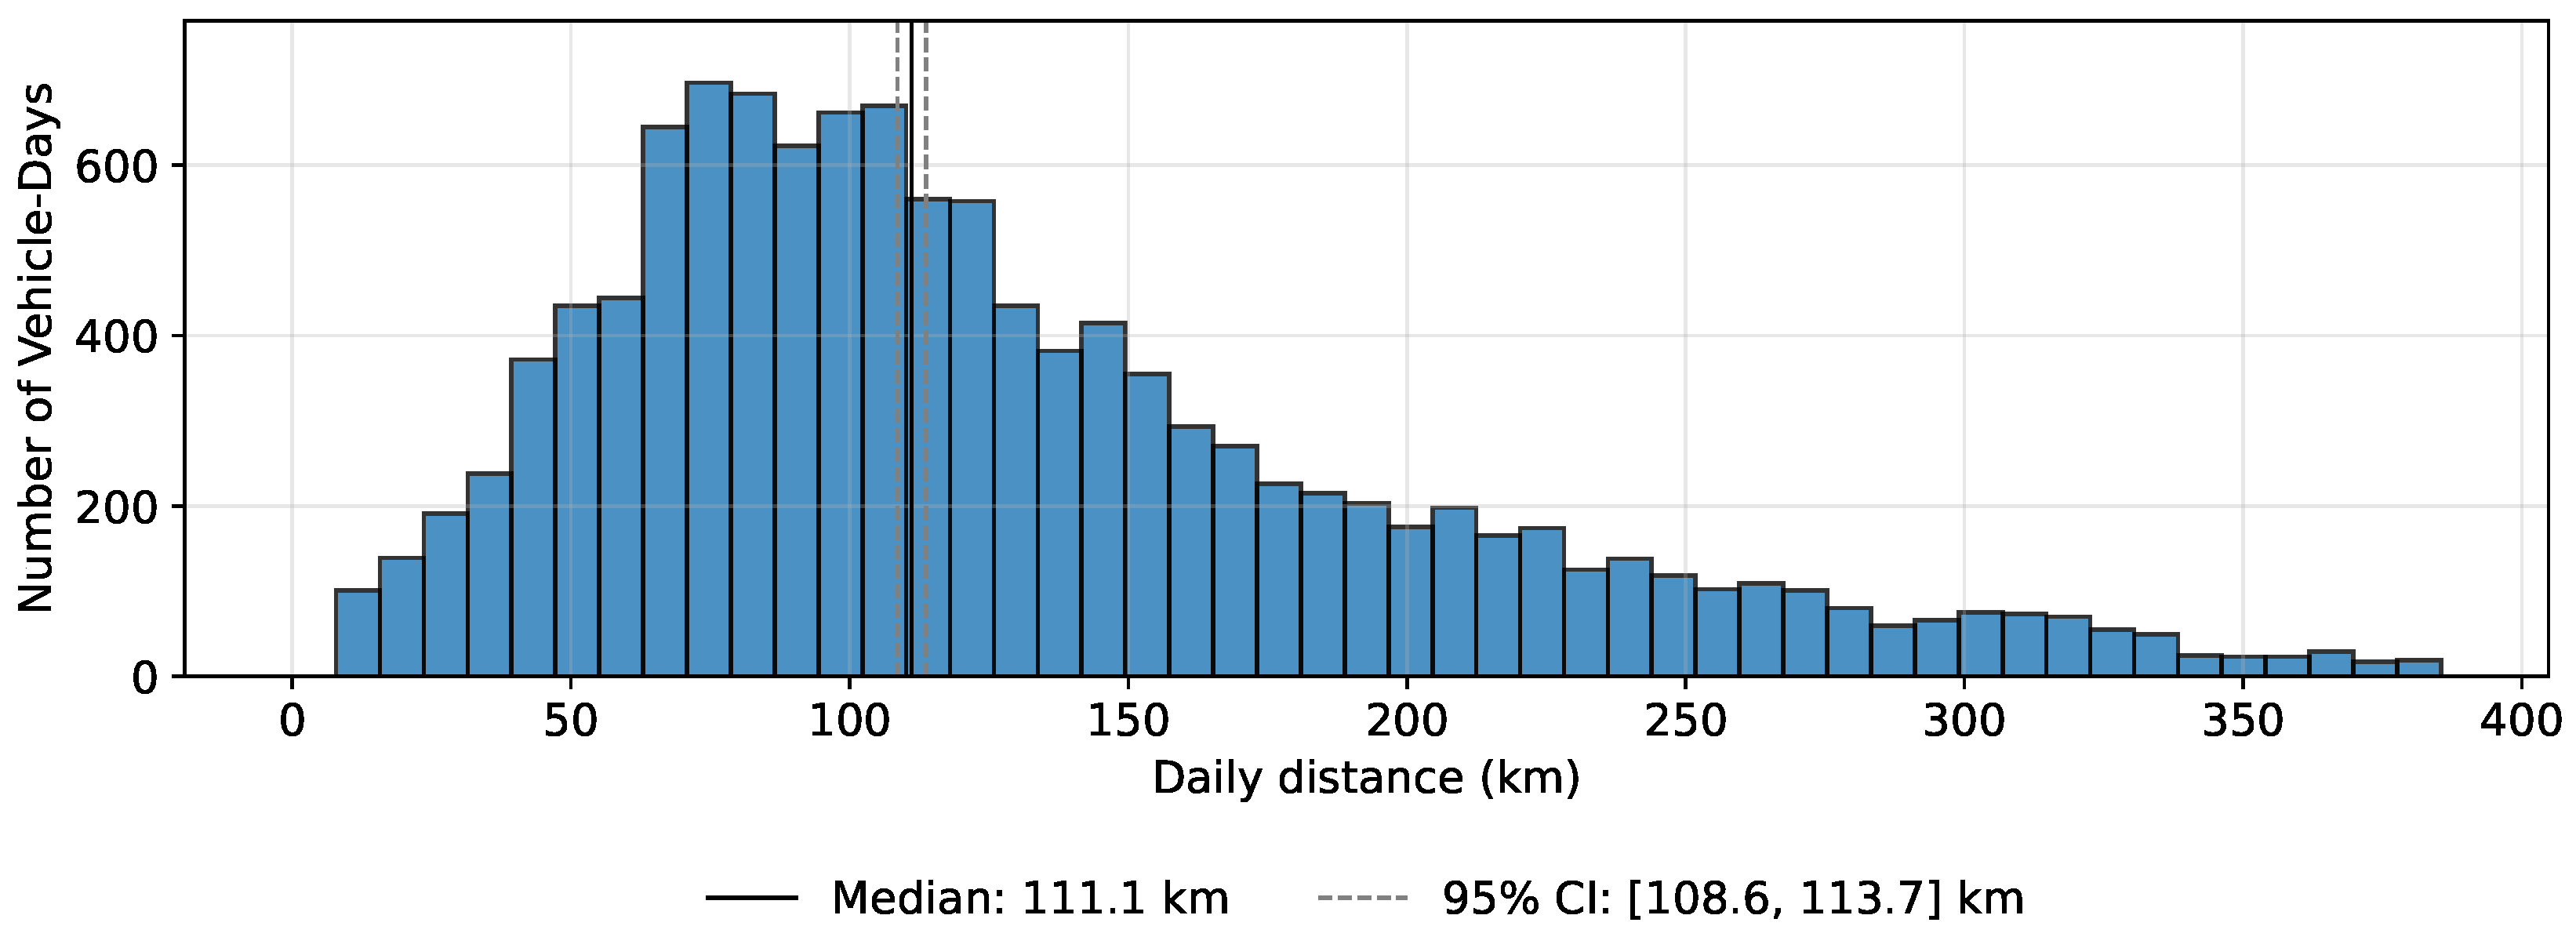
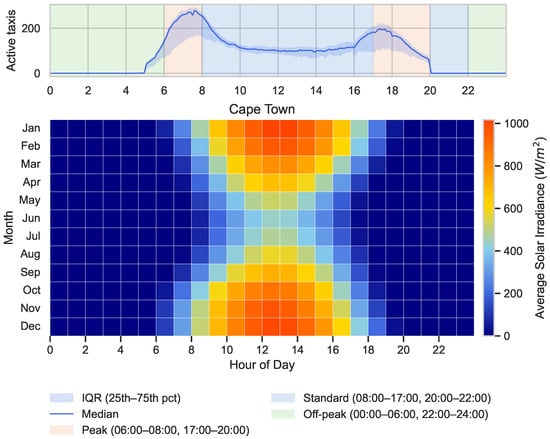
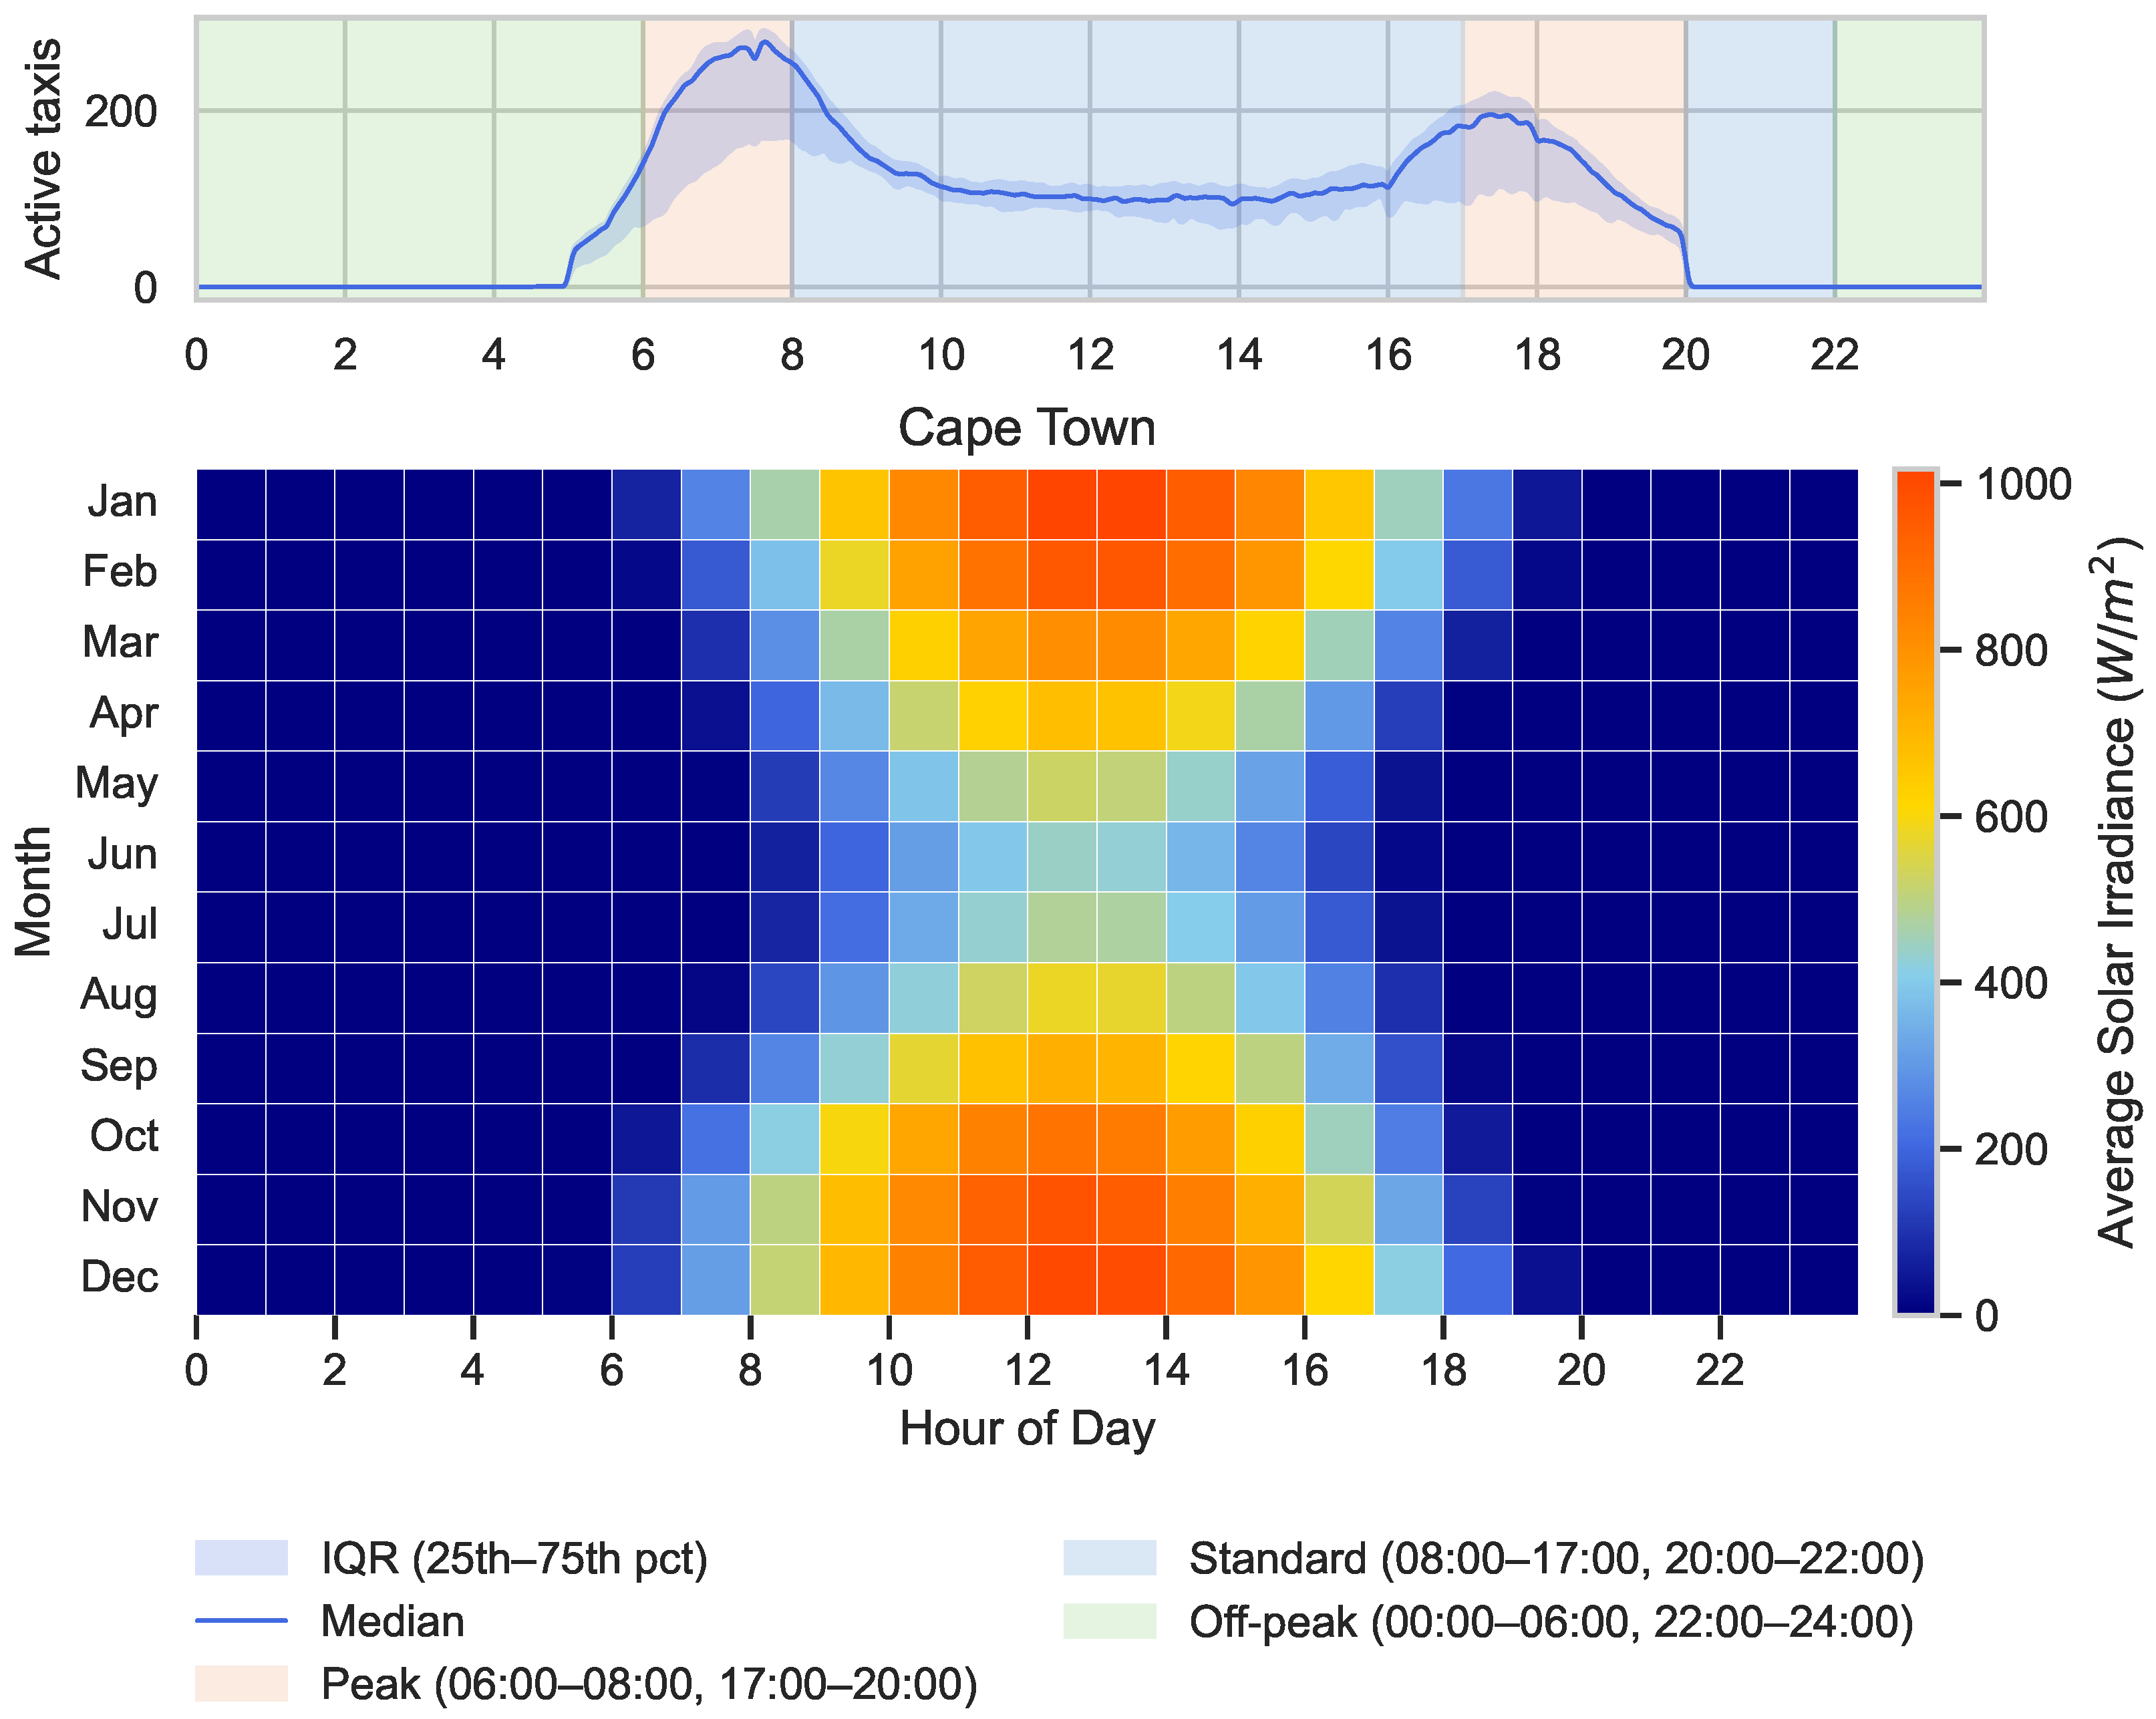
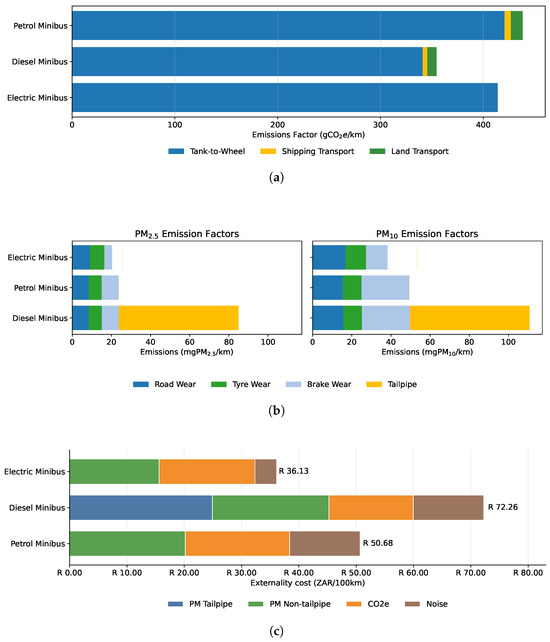
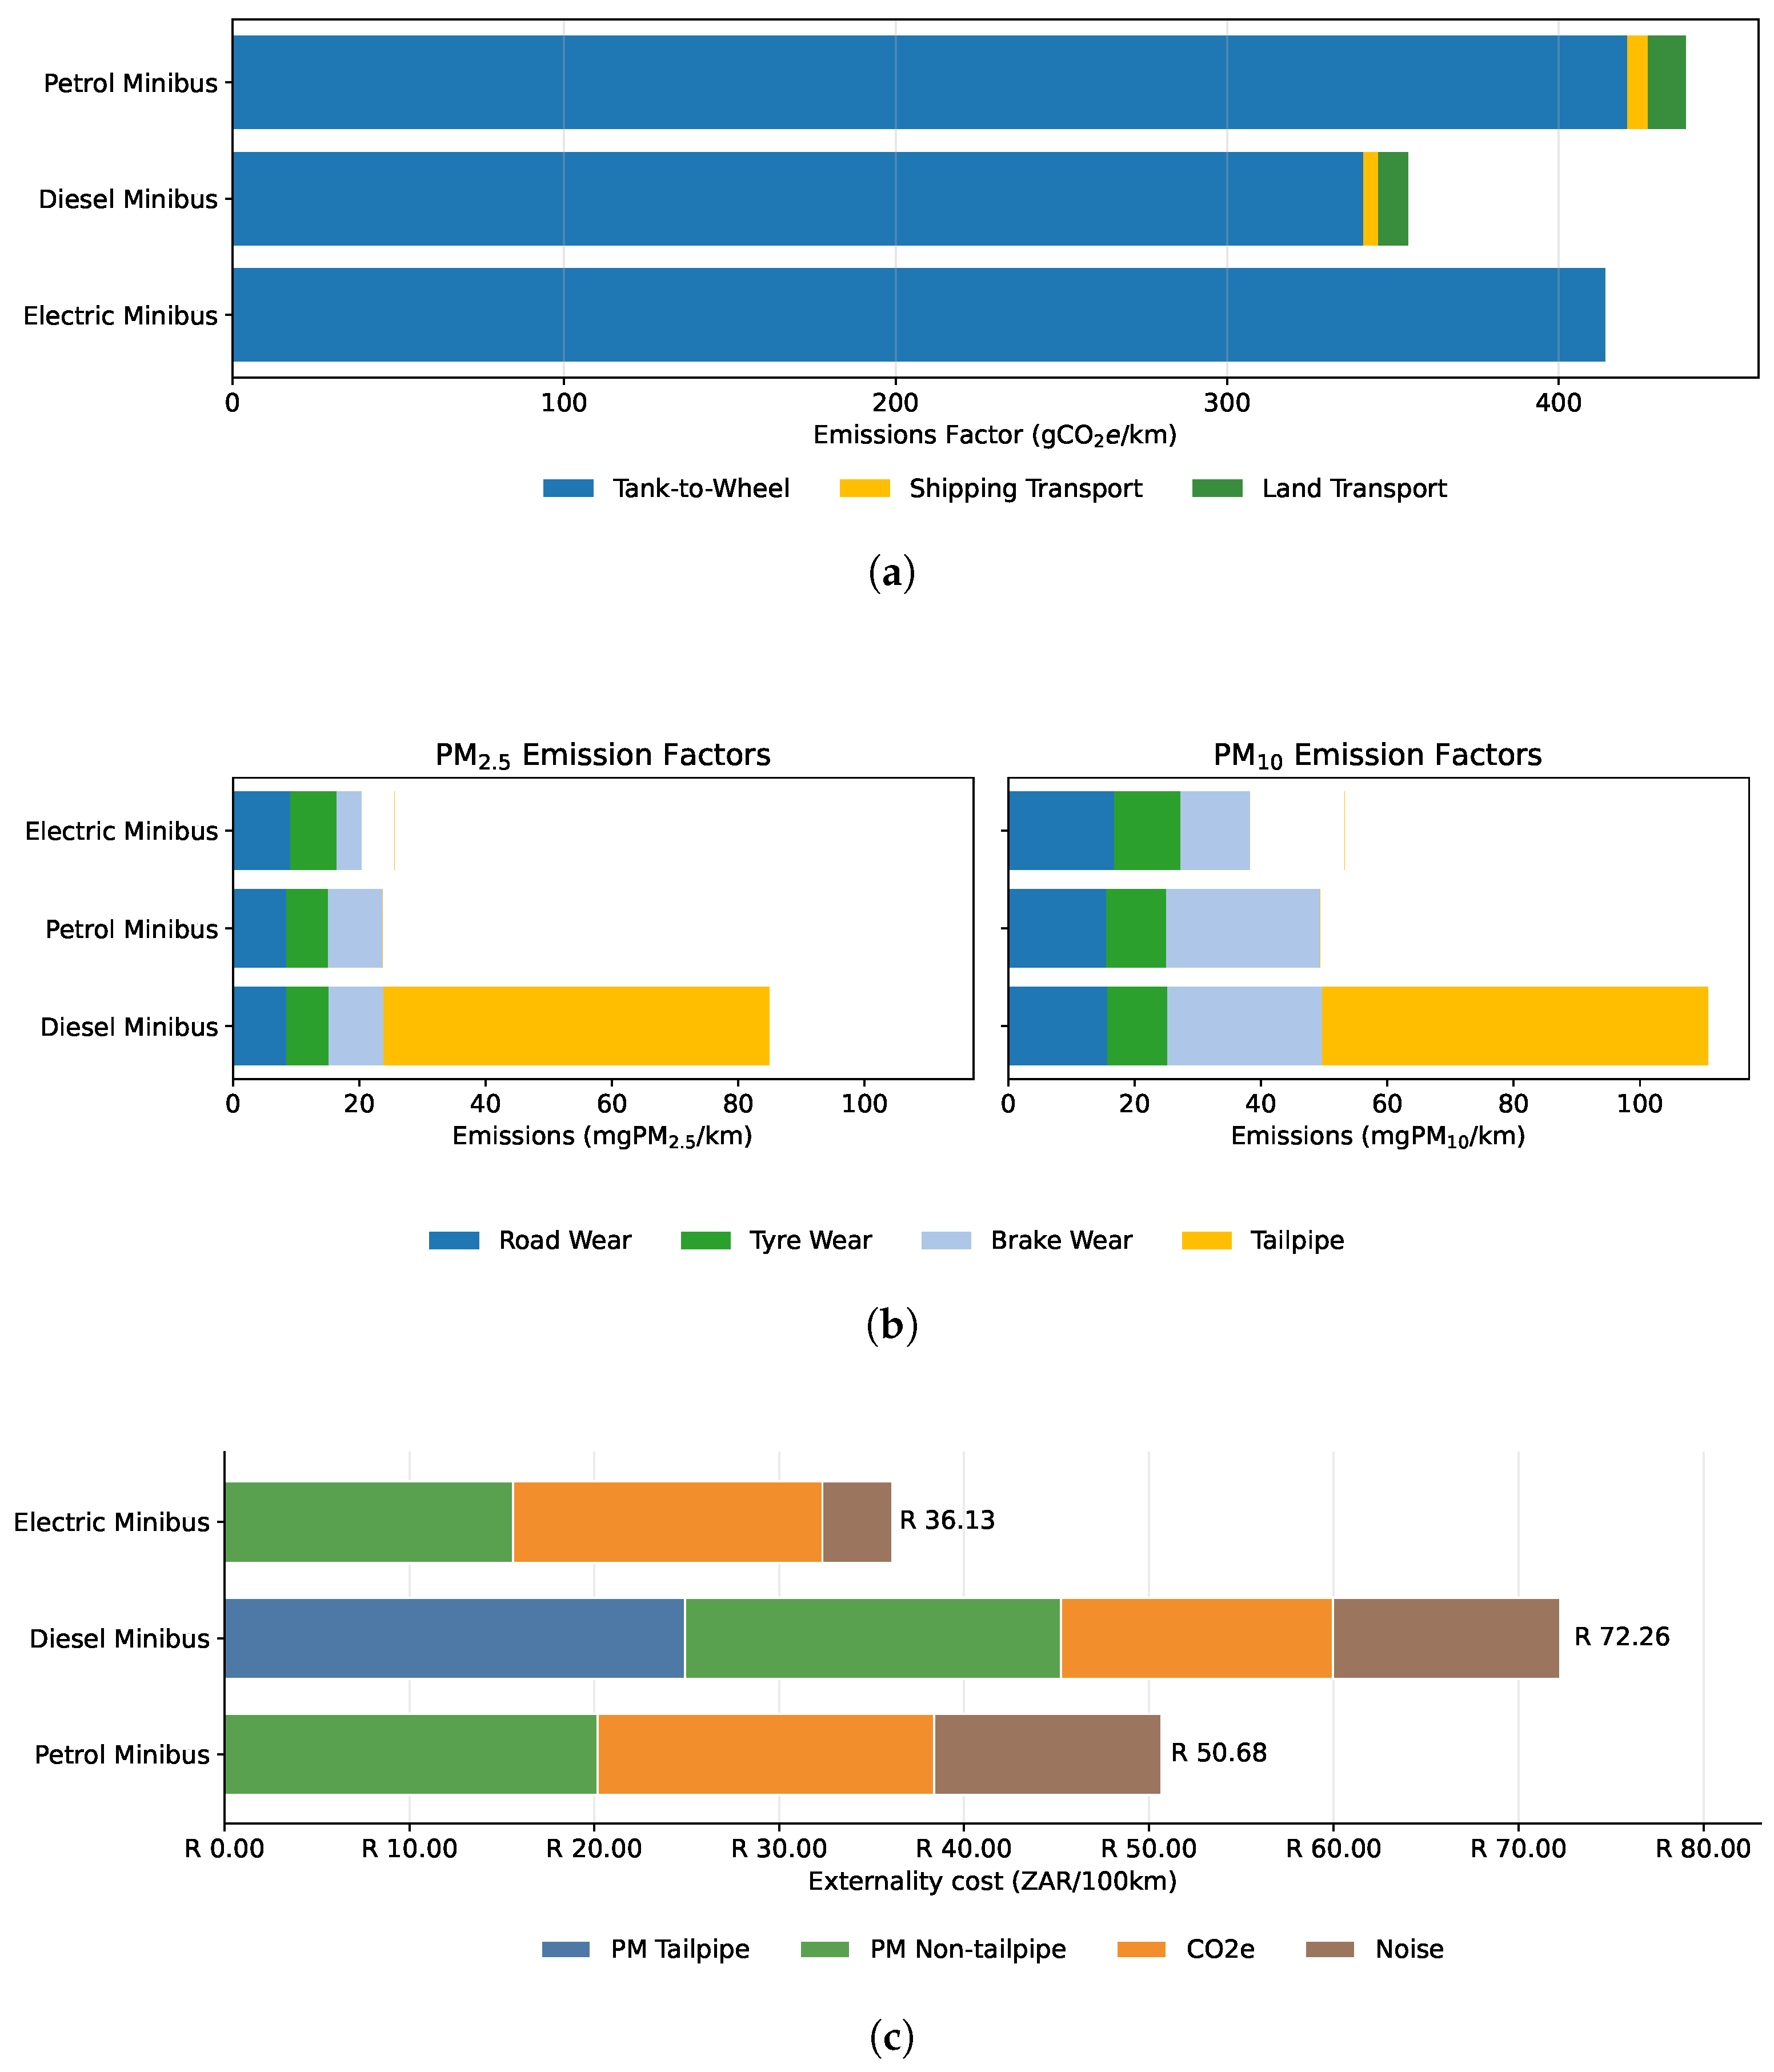
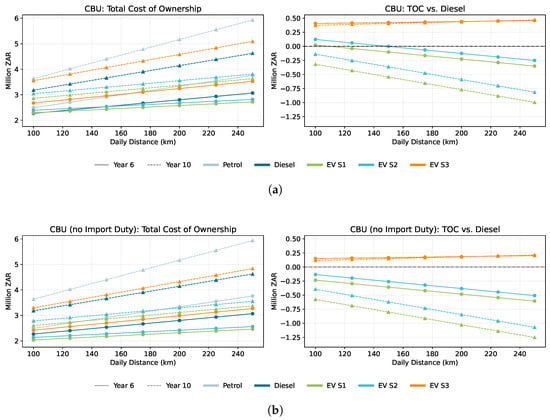
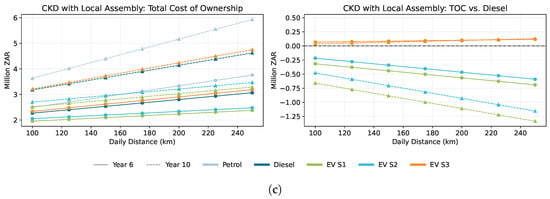
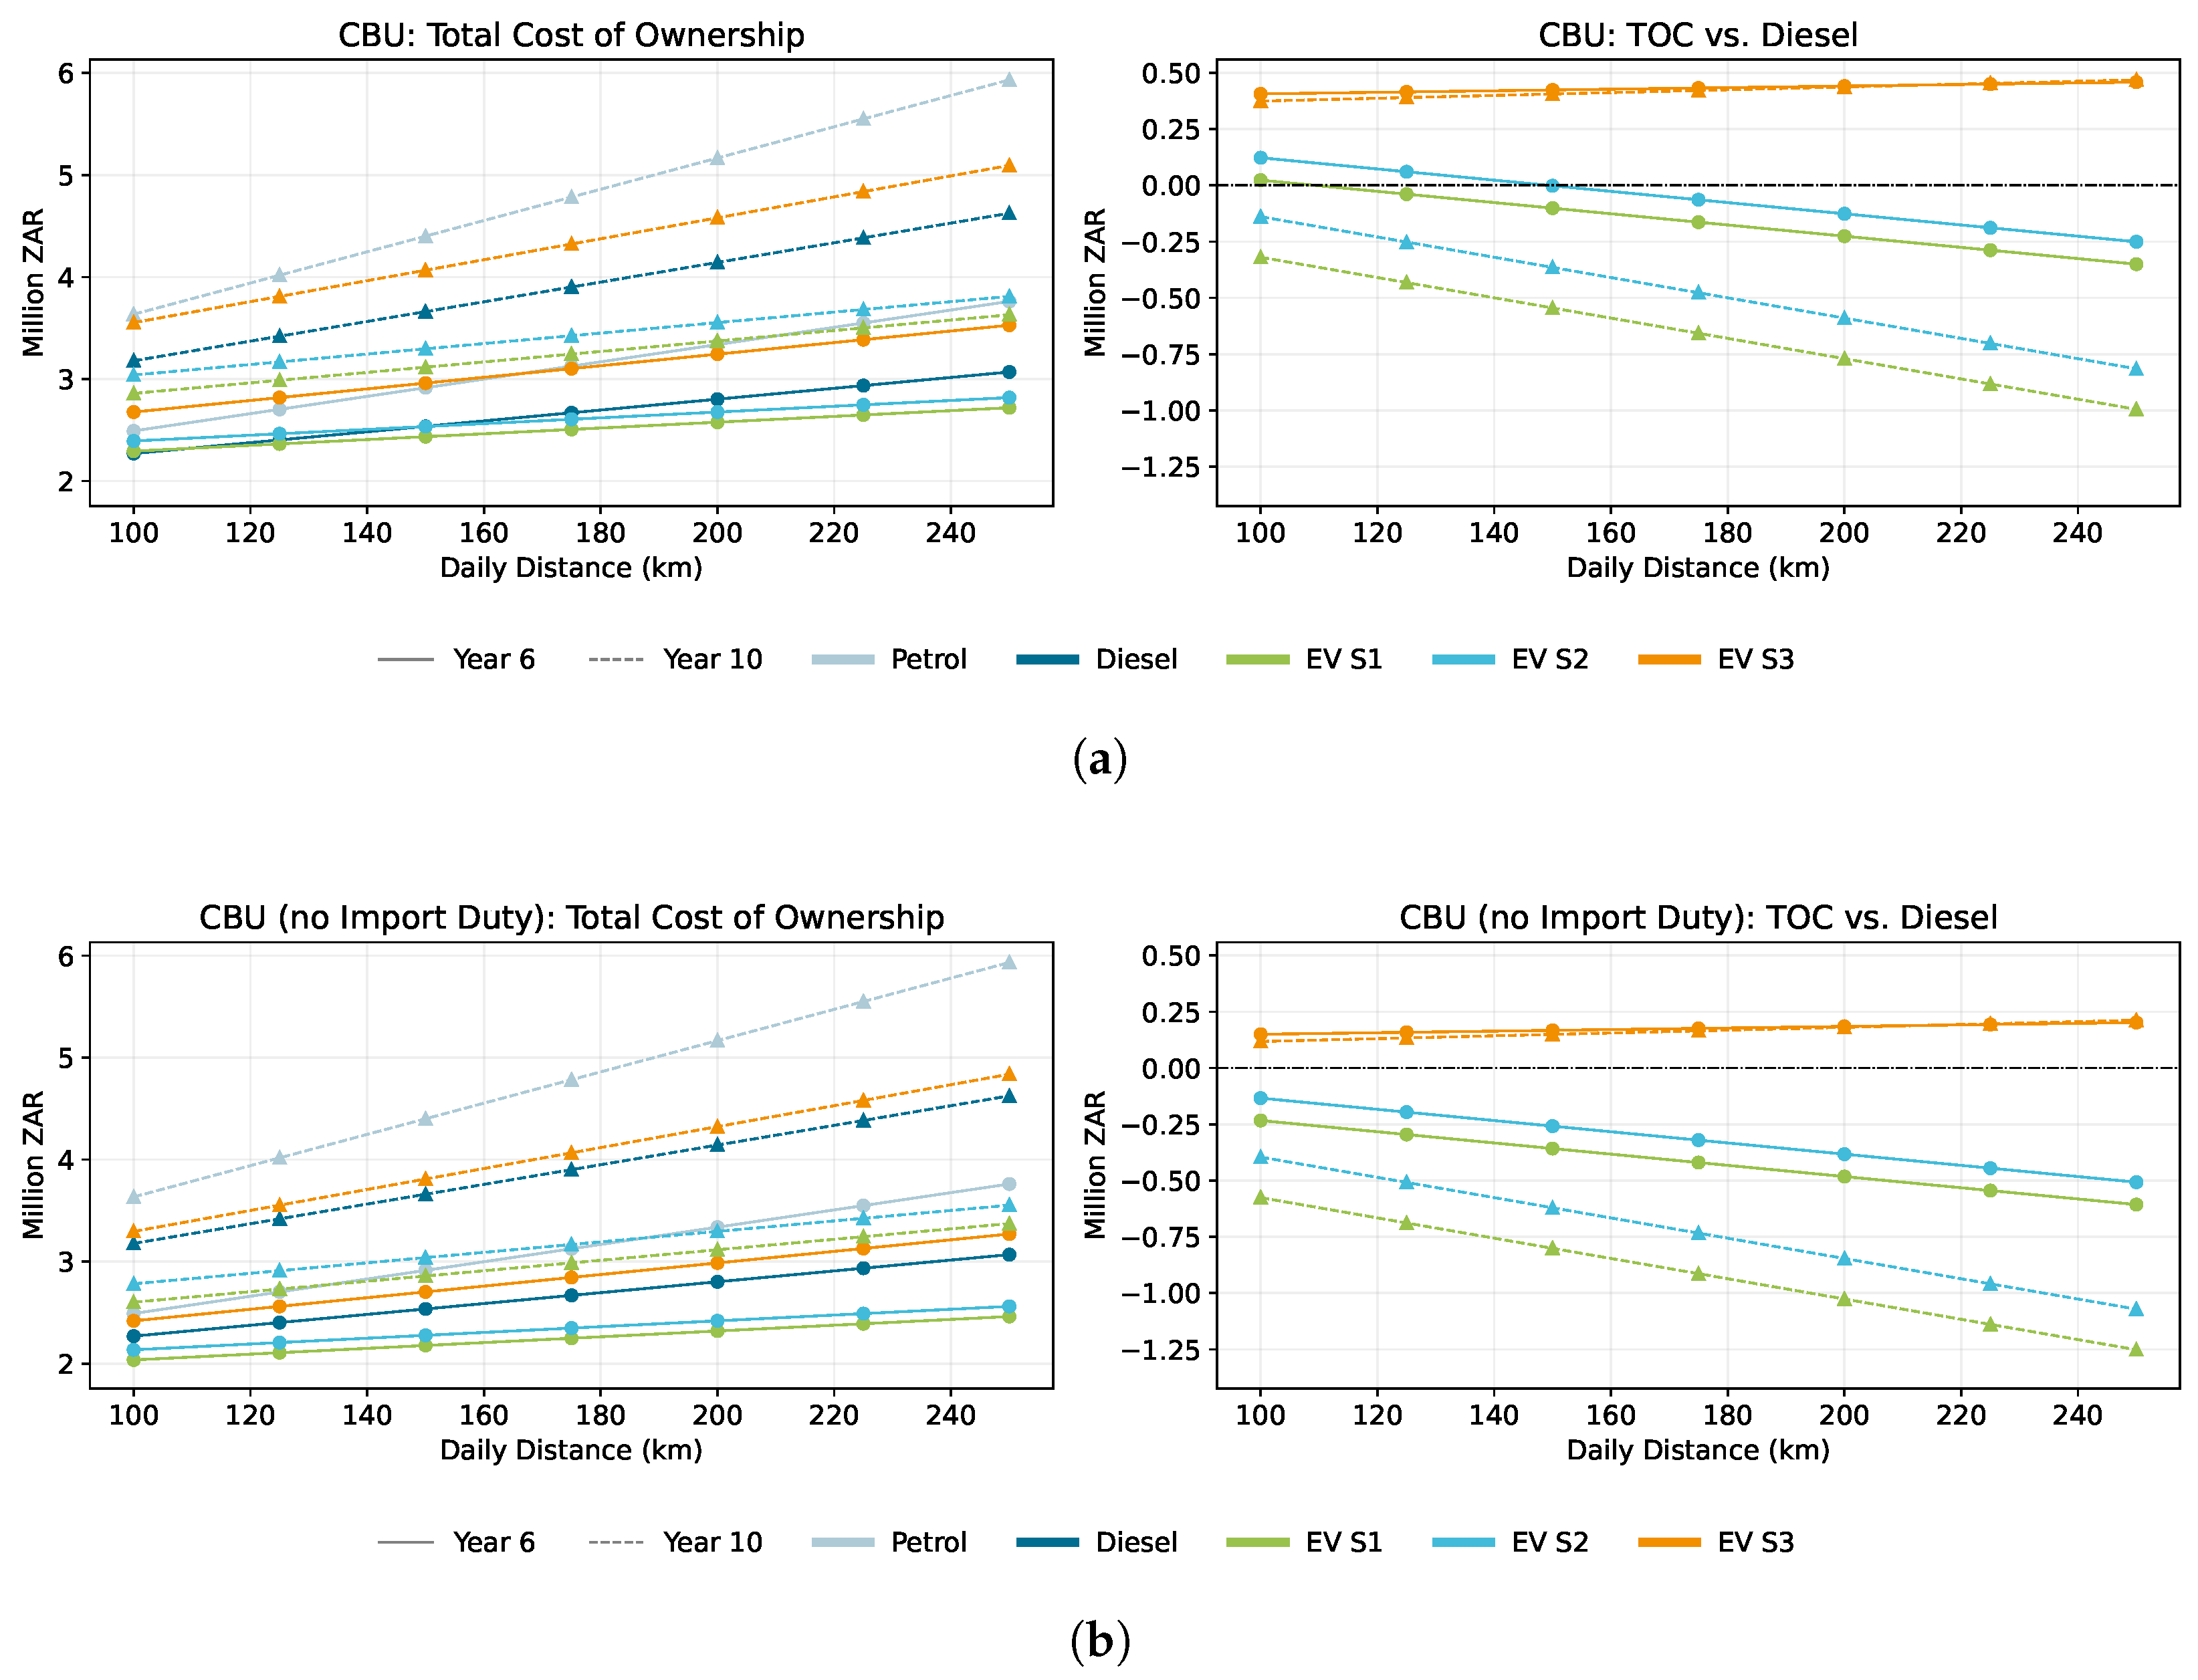
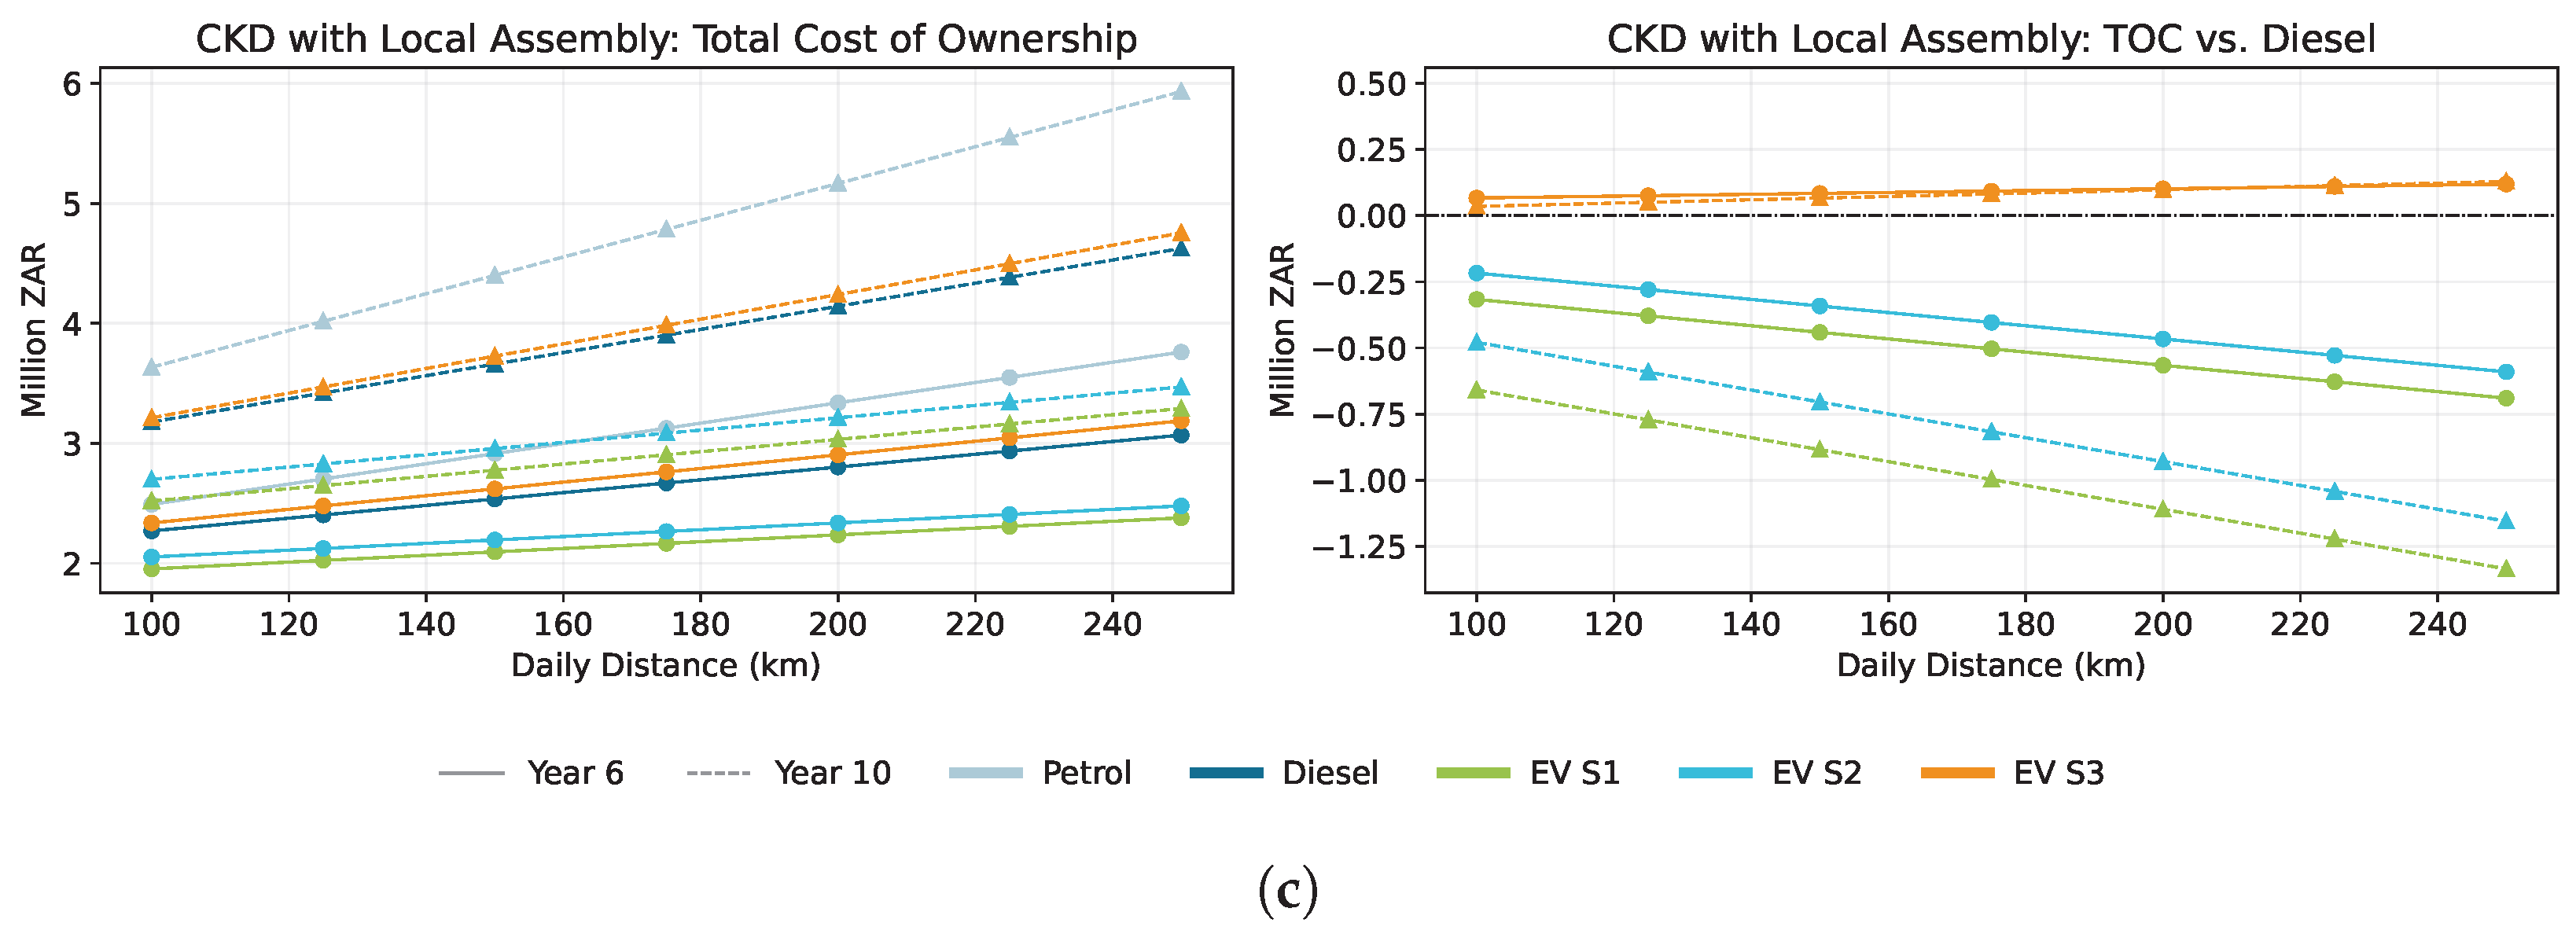

Disclaimer/Publisher’s Note: The statements, opinions and data contained in all publications are solely those of the individual author(s) and contributor(s) and not of MDPI and/or the editor(s). MDPI and/or the editor(s) disclaim responsibility for any injury to people or property resulting from any ideas, methods, instructions or products referred to in the content. |
© 2026 by the authors. Licensee MDPI, Basel, Switzerland. This article is an open access article distributed under the terms and conditions of the Creative Commons Attribution (CC BY) license.