

Article

Making It Look Green: Big Data Analytics, External Pressure, and Corporate Greenwashing

1
School of Economics and Management, Fuzhou University, Fuzhou 350108, China
2
Renmin Business School, Renmin University of China, Beijing 100872, China
*
Author to whom correspondence should be addressed.
These authors contributed equally to this work.
Sustainability 2026, 18(4), 2121; https://doi.org/10.3390/su18042121
Submission received: 26 January 2026 / Revised: 9 February 2026 / Accepted: 16 February 2026 / Published: 21 February 2026

Abstract

Digital technologies are widely viewed as important tools for enhancing corporate environmental performance. However, there is growing recognition that their environmental impacts are not uniformly positive and may even generate unintended negative consequences. Drawing on institutional theory and impression management theory, we argue that big data analytics (BDA) provides firms with powerful capabilities to strategically manage environmental impressions in response to external pressures. Using panel data of Chinese listed firms from 2012 to 2023, we provide empirical evidence that BDA significantly promotes corporate greenwashing. Specifically, BDA facilitates greenwashing through the reinforcement of three core dimensions of impression management: self-serving bias, symbolic management, and accounting rhetoric. Moreover, by distinguishing between different types of external pressures, our results show that constraint-based non-market pressures weaken the relationship between BDA and greenwashing, whereas opportunity-based market pressures strengthen it. Our study enriches the digitalization and corporate environmental performance literature by revealing the dark side of digital technologies and offering a more nuanced understanding of how specific technologies shape corporate environmental misconduct.

1. Introduction

Environmental sustainability has become a critical concern for both companies and society, as climate change, resource scarcity, and ecological degradation intensify. Faced with mounting environmental pressure from regulators, investors, and the public, and enabled by the rapid advancement of digital technologies, many firms have adopted big data analytics (BDA) to achieve and demonstrate sustainability goals. Firms leverage the vast amounts of environmental data generated by modern sensors, Internet-of-Things devices, and supply-chain databases to optimize energy use, reduce emissions, and track resource consumption. This data-driven approach is widely hailed in the literature as a route to greater transparency and accountability in sustainability efforts.
Existing research generally suggests that big data analytics (BDA) plays a positive role in environmental disclosure by reducing information asymmetry and limiting corporate greenwashing. They argue that BDA helps firms anticipate and address stakeholder concerns, thereby improving the relevance of environmental governance [1]. It also facilitates large-scale data processing and dissemination, which reduces external information gaps [2] and expands disclosure channels to make environmental performance more transparent [3,4,5]. In addition, it provides more comprehensive non-financial information and supports sustainability management across the product life cycle [6,7]. Overall, scholars emphasize the potential of BDA to improve the quality of environmental disclosure and curb greenwashing.
However, this positive view overlooks a hidden risk: the very capabilities of BDA can also be used for strategic impression management. Corporate practices provide clear examples of this issue. For instance, British Petroleum has been criticized for using digital campaigns to showcase renewable energy projects while simultaneously expanding fossil fuel operations. Similarly, Shell promoted a green image through selective data visuals and messages, prompting UK regulators to ban some of its advertisements as misleading. Beyond company cases, the European Securities and Markets Authority (ESMA) has warned that digital tools and data visualization in ESG disclosures can be misused to create misleading “green” impressions. Scholars further note that big data can be applied to data commodification and manipulation, raising privacy, ethical, and environmental risks [8,9]. Taken together, these insights show that in practice, BDA can sometimes facilitate greenwashing rather than prevent it.
This contradictory situation raises some critical questions: Why might BDA enable greenwashing instead of reducing it? Under what conditions do firms use big data to manage impressions rather than achieve real environmental progress? And in what ways do they apply BDA to carry out greenwashing?
Previous research explains firms’ digital greenwashing through the fraud triangle, where pressure is viewed as an internal factor, such as financial distress [10]. In contrast, we argue from an institutional perspective that pressure is largely external: firms face legitimacy demands from regulators, investors, media, and the public. These external pressures do not always result in substantive environmental improvements but often lead to symbolic actions and ceremonial disclosure. Impression management theory further explains how firms operationalize such behavior, as BDA enables selective disclosure, symbolic amplification, and rhetorical framing, allowing companies to present a favorable green image while concealing inconvenient facts.
While digital transformation encompasses a broad set of technologies, we focus specifically on big data analytics for two reasons. First, from a motivation perspective, in a data-driven governance environment, firms increasingly rely on data-based indicators to showcase sustainability achievements. BDA provides flexible tools to filter, quantify, and highlight favorable information, making it particularly suited for amplifying “selective green signals” when managers intend to shape perceptions rather than improve performance. Second, the underlying logic of BDA aligns closely with the mechanisms of greenwashing: both involve collecting, selecting, analyzing, and presenting information to influence stakeholder perceptions. Other digital technologies, such as artificial intelligence, blockchain, the Internet of Things, and cloud computing, focus mainly on operational automation, transparency, operational efficiency, or infrastructure capacity. These functions are less about selective information framing and therefore have a weaker connection to greenwashing practices. This unique alignment makes BDA a theoretically and empirically salient lens for examining the digital drivers of corporate greenwashing.
We chose Chinese firms as our research setting for the following reasons. First, the Chinese government strongly promotes big data applications, including establishing big data pilot zones across cities and implementing policies to encourage firms to adopt BDA and unlock data value [11,12,13,14,15]. Second, China has introduced a series of environmental protection and CSR regulations, accompanied by penalties for non-compliance, which raise expectations on firms’ environmental performance [16,17,18,19]. In this context, firms may use BDA to selectively disclose environmental information to gain legitimacy [20,21]. Thus, China provides a unique empirical setting where external institutional pressures and digital opportunities interact, potentially driving BDA-enabled greenwashing.
This study makes several contributions to the literature on digitalization and corporate environmental performance. First, it reveals a previously overlooked downside of big data in environmental performance by showing that BDA can facilitate, rather than reduce, corporate deception. We provide empirical evidence of the negative effects of BDA. In doing so, we challenge the common assumption that more data always leads to better outcomes. Second, this study extends prior research on digitalization and environmental performance by shifting the focus from broad digital transformation to a specific digital technology—big data analytics. Unlike Jia et al. (2025) [10], who examine the overall effect of corporate digital transformation on greenwashing, we are among the first to investigate the potential negative impact of BDA on greenwashing. This more fine-grained focus provides a more detailed understanding of how firms leverage BDA in environmental disclosure to shape external perceptions. Third, drawing on institutional theory, this study advances understanding of the motivations behind BDA-enabled greenwashing by highlighting the role of external pressures. We distinguish between constraint-based non-market pressures and opportunity-based market pressures and show that they have asymmetric effects on firms’ use of BDA for greenwashing. By integrating external pressure into the analysis of BDA and greenwashing, this study offers a more nuanced explanation of when and why firms strategically deploy big data analytics in environmental disclosure.

2. Theoretical Background

2.1. Big Data Analytics

Big data analytics (BDA) is defined as the application of multiple analytic methods that address the diversity of big data to provide actionable descriptive, predictive, and prescriptive results [22,23,24,25]. BDA revolves around three main characteristics: the data itself, the analytics applied to the data, and the presentation of results in a way that allows the creation of business value. The literature highlights the positive impact of BDA on firms’ decision making [26,27,28], information disclosure [2,3] and environment performance [4,5,29].
However, BDA also comes with potential negative side effects. In information disclosure, the complexity of BDA can create opacity, as algorithms and data sources remain “black boxes” and managers may selectively release favorable data. Within organizations, the complexity of data may foster knowledge hiding among analysts, reducing knowledge sharing and effectiveness [30]. BDA may also cause information overload and overreliance on data, weakening managerial judgment and experience-based insights [8,9]. As a result, when examining the role of BDA in the environmental performance domain, we must also account for its possible drawbacks. Thus, we explore the potential negative consequences of BDA when companies are prone to shirking their social responsibilities.

2.2. Corporate Greenwashing

Corporate greenwashing refers to the selective disclosure of positive environmental or social information while withholding negative aspects, creating an overly positive image [31]. It can be seen as the intersection of two behaviors: poor environmental performance and positive communication. From the perspective of institutional theory, organizations are rewarded for maintaining legitimacy [32,33,34]. Under strong societal attention to the environment, firms may adopt greenwashing as a strategic response to external institutional pressures. This practice allows them to symbolically comply with stakeholder expectations and social norms without making substantive operational changes, thereby securing legitimacy, resources, and competitive advantage in environments that value environmental responsibility.
Prior research has identified several drivers of corporate greenwashing: non-market external factors such as regulation and media monitoring [35,36], market external drivers such as investor demand and competition [37], organizational drivers such as firm characteristics, incentive structure and culture [38,39], and managers’ individual drivers [40]. Some scholars also note that digital technologies can act as drivers of greenwashing [10]. Building on this discussion, we take a different perspective: rather than treating digital technologies as direct drivers, we see external institutional pressures as the key drivers. We position BDA not as a cause but as a means through which firms, facing different external pressures, strategically engage in greenwashing.

2.3. Impression Management Theory

Impression management theory originates from social psychology and focuses on how individuals regulate and control the information they present in order to be perceived favorably by others [41,42]. At the organizational level, it explains how firms strategically influence public perceptions through communication, disclosure, and behavior to gain legitimacy, strengthen competitive advantage, and gain access to external resources [33,43,44].
Merkl-Davies & Brennan (2011) [45] identify three common modes of impression management. Self-serving bias refers to managers’ tendency to highlight favorable outcomes while attributing negative results to external conditions. Symbolic management involves ceremonial actions, such as CSR reporting or environmental pledges, which signal responsibility without leading to substantive change. Accounting rhetoric uses technical language, indicators, and rational arguments to present decisions as objective and legitimate, thereby reducing external skepticism. Through these three modes, firms can shape perceptions of environmental responsibility and engage in greenwashing.
Building on this foundation, we use impression management theory to explain how firms employ BDA for greenwashing. Specifically, BDA can reinforce these three modes of impression management, making it a powerful tool for firms to construct favorable environmental images without substantive change.

3. Hypothesis Development

3.1. Effect of Big Data Analytics on Corporate Greenwashing

As environmental issues receive growing public attention, firms under external pressure increasingly adopt impression management to shape a positive image of environmental responsibility. By leveraging BDA, they can strategically select, process, and visualize environmental information to construct sustainability narratives that align with stakeholder expectations. Importantly, BDA reduces the marginal cost of greenwashing by enabling automated data processing, repeated narrative generation, and scalable customization of disclosures at relatively low incremental effort. This creates information asymmetry, enabling firms to meet external demands symbolically while avoiding substantive changes. Specifically, BDA reinforces the three modes of impression management, making it a powerful tool for greenwashing.
Self-serving bias: By efficiently filtering environmental data, firms can use BDA to exclude unfavorable information and highlight data that supports a green narrative. Natural Language Processing (NLP)-based sentiment analysis tools can automatically generate texts with a positive tone and favorable bias, portraying management as competent and responsible. Since tone and readability play a key role in report persuasiveness [46,47], BDA serves as an effective tool in optimizing these attributes. Thus, firms achieve “selective transparency” by manipulating disclosure within the bounds of legitimacy, misleading the public without engaging in outright deception.
Symbolic management: BDA enhances symbolic management by enabling faster adaptation and response. Through web scraping and social media sentiment analysis, firms can identify real-time public concerns and regulatory trends [1,48,49], allowing them to quickly issue responsive green statements. Furthermore, semantic analysis and keyword extraction techniques help generate professionalized CSR reports that align with mainstream expectations and increase perceived credibility [50]. In this way, BDA supports the construction of a green image that is more symbolic than substantive.
Accounting rhetoric: BDA’s powerful modeling and visualization capabilities allow firms to build complex scenario simulations and performance forecasts that present optimistic environmental progress, such as high future electrification rates, while omitting hidden environmental costs [51,52]. BDA also facilitates the generation of complex charts and technical language that convey scientific authority. By framing data as truth, firms create an illusion of objectivity and reinforce their legitimacy through algorithmic modeling, thereby giving rise to a new form of BDA-enabled greenwashing.
In summary, BDA not only strengthens traditional impression management techniques but also transforms greenwashing into a more technological form. It shifts disclosure practices from manual manipulation to algorithmic automation, making them more scalable, adaptive, and continuous. By using real-time monitoring, text engineering, and model-based projections, firms can construct green narratives, manage regulatory scrutiny, and increase persuasiveness by exploiting stakeholders’ limited technical knowledge. In this context, we propose the following hypothesis:
H1. 
BDA has a positive effect on corporate greenwashing.

3.2. Moderating Role of Different External Pressures

From the perspective of institutional theory, firms facing external legitimacy pressures evaluate the risks and benefits of disclosing environmental information and may strategically use BDA in their reporting. However, external pressures are not homogeneous. According to Delmas& Burbano (2011) [40], we distinguish them into non-market and market external pressures.
Although both types of pressures influence firms’ environmental disclosure, their underlying mechanisms differ fundamentally. Non-market pressures are rooted in a constraint-based institutional logic that emphasizes rule adherence, accountability, and the avoidance of sanctions. Under this logic, deviations from substantive environmental performance significantly increase the likelihood of detection and punishment. The expected benefits of using BDA for greenwashing are substantially reduced or even become negative, thereby limiting firms’ room for greenwashing. In contrast, market pressures follow an opportunity-based institutional logic, in which legitimacy is derived more from value creation, investor recognition, and firms’ ability to secure external resources. Within this logic, the expected benefits of BDA-enabled greenwashing are amplified, giving firms greater discretion and stronger incentives to strategically use BDA for symbolic environmental disclosure. As a result, different types of external pressures shape firms’ use of BDA through distinct institutional logics, leading to opposite moderating effects on the relationship between BDA capability and corporate greenwashing.

3.2.1. Impact of Non-Market External Pressure

Non-market external pressures are reflected in institutional regulations and social oversight, such as government environmental policies and media exposure. These non-market pressures are constraint-based and operate through a punishment logic: violations may result in legal liability, administrative penalties, or reputational damage [53,54]. Under such conditions, the likelihood of improper disclosure being detected is higher, and once identified, firms face severe sanctions. As a result, firms are more inclined to pursue substantive improvements or adopt more cautious disclosure practices.
From an institutional perspective, non-market pressures reduce firms’ ability to decouple symbolic disclosure from actual environmental performance. This constraining effect operates through two interrelated mechanisms. First, regulatory enforcement decreases the expected benefit of greenwashing. Stricter environmental regulations, mandatory disclosure requirements, and enhanced auditing systems raise the likelihood that opportunistic BDA-driven disclosure will be scrutinized and sanctioned. Once detected, firms face administrative penalties and legal consequences, making symbolic manipulation of environmental data less sustainable. Second, media scrutiny reinforces normative accountability by expanding the scope of legitimacy evaluation beyond regulators to the broader public. Investigative journalism, social media monitoring, and third-party ESG rating platforms increase transparency and facilitate comparisons between firms’ environmental claims and observable outcomes. Such exposure not only damages corporate legitimacy but may also trigger intensified regulatory intervention, creating a reinforcing cycle of monitoring and punishment.
This institutional logic is particularly salient in pollution-intensive industries such as chemicals, steel, or thermal power generation. Firms in these sectors operate under heightened regulatory scrutiny and persistent media attention, which significantly narrows the space for symbolic compliance. Even when firms possess advanced BDA capabilities, attempts to strategically frame environmental data are more likely to be challenged by regulators or uncovered by the media. Consequently, BDA is less effective as a tool for greenwashing, and firms tend to adopt conservative disclosure strategies or pursue substantive environmental improvements.
In sum, under strong non-market external pressures, legitimacy is contingent upon demonstrable compliance rather than persuasive narratives. Firms therefore recognize that BDA-based greenwashing is both more detectable and less profitable, weakening the positive association between BDA capability and corporate greenwashing. Accordingly, we propose the following hypothesis:
H2. 
Non-market external pressures (government environmental regulation and media coverage) negatively moderate the relationship between BDA capability and corporate greenwashing.

3.2.2. Impact of Market External Pressure

Market external pressures stem from the expectations and preferences of key market actors, such as institutional investors, securities analysts, and major customers [55,56]. From an institutional theory perspective, these pressures are fundamentally opportunity-based, reflecting a market-oriented logic in which legitimacy is granted through favorable evaluations by capital market audiences rather than formal enforcement. The core mechanism is reward rather than punishment: firms that appear environmentally responsible may gain tangible benefits such as lower capital costs, higher investment ratings, or larger market share [57].
In such institutional environments, legitimacy judgments rely heavily on disclosed information and comparative signals rather than the direct observation of environmental performance. As a result, firms face incentives to engage in symbolic conformity, aligning their disclosures with dominant ESG templates and expectations while decoupling disclosure from underlying practices. BDA plays a critical role in enabling this decoupling by enhancing firms’ capacity to construct sophisticated, data-driven environmental narratives.
At the motivation level, institutional investors reward environmentally responsible firms through capital allocation, lower financing costs, and governance support. Analysts disseminate ESG-related information to the market, and positive analyst evaluations can amplify a firm’s responsible image and generate favorable market reactions. Positive evaluations from these actors can substantially enhance a firm’s market legitimacy. To secure such legitimacy, firms are motivated to leverage BDA to increase the apparent precision, consistency, and credibility of their environmental disclosures [58,59,60]. At the action level, BDA enables firms to mine large datasets, selectively emphasize indicators prioritized by market audiences, and produce structured ESG reports aligned with prevailing benchmarks and rating methodologies [56,57]. Through advanced analytics and visualization, firms can frame environmental performance in ways that resonate with investors and analysts. In this sense, BDA increases the expected benefit of symbolic compliance and expands firms’ capacity for greenwashing.
This dynamic is particularly evident in highly marketized sectors such as technology, consumer goods, and service industries, where firms are subject to intensive analyst coverage and high institutional ownership but relatively weaker environmental regulation. In these contexts, environmental legitimacy is primarily evaluated by capital market audiences. Firms often employ BDA to generate detailed sustainability dashboards, carbon metrics, and forward-looking environmental scenarios aimed at investors, thereby reinforcing symbolic legitimacy without necessarily altering underlying environmental practices.
Therefore, under strong market external pressures, the institutional environment rewards symbolic disclosure and provides fertile ground for BDA-enabled greenwashing. Accordingly, we propose the following hypothesis:
H3. 
Market external pressures (institutional ownership and analyst attention) positively moderate the relationship between BDA capability and corporate greenwashing.
The theoretical framework is shown in Figure 1.

4. Methodology

4.1. Data and Sample

This study is based on panel data of Chinese A-share listed firms from 2012 to 2023. The data are drawn from the China Stock Market and Accounting Research Database (CSMAR) and the Chinese Research Data Service Platform (CNRDS), both of which provide comprehensive and reliable information on firms’ financial performance, ownership structure, top management teams, and other key indicators. These databases are widely recognized and extensively used in research on Chinese listed companies. The annual reports are sourced from CNINFO, the official disclosure platform designated by the China Securities Regulatory Commission (CSRC), which provides authoritative information services for listed companies. After excluding firms under special treatment (ST) and those with substantial missing values, the final sample consists of around 5500 firms, yielding approximately 41,000 firm-year observations.

4.2. Measurement of the Variables

4.2.1. Independent Variable

The key independent variable in this study is firms’ Big Data Analytics (BDA). Following prior approaches to measuring digital transformation [61,62], we use Python (version 3.7.0) for textual analysis of annual reports to construct a proxy for BDA.
To systematically construct a keyword list for BDA, we adopted the following steps to ensure objectivity and comprehensiveness. First, we selected four core terms, namely “information,” “network,” “digital,” and “data,” as seed words and used key national-level data policies and regulatory documents in China as the main corpus, including the Action Plan for Promoting Big Data Development, the 14th Five-Year Plan for Big Data Industry Development, the Data Security Law, the Cybersecurity Law, and annual reports issued by the Ministry of Industry and Information Technology. Second, we trained a Word2Vec model on this corpus to automatically expand the word set based on semantic similarity, generating a broad list of terms related to the seed words. Third, we carefully reviewed the expanded keyword set by cross-referencing policy documents and existing literature, removing overly general or ambiguous terms, and ultimately producing a standardized keyword list of over 200 terms that accurately represent big data technologies, applications, and analytics capabilities.
Based on this keyword list, we collected firms’ annual reports from 2012 to 2023 from CNINFO, the information disclosure platform designated by the China Securities Regulatory Commission (CSRC) for listed companies, and extracted the Management Discussion and Analysis (MD&A) sections. Finally, using machine learning algorithms, we calculate the frequency of BDA-related keywords in each firm’s annual report for each year, which serves as a measure of the firm’s BDA capability.

4.2.2. Dependent Variable

Following prior studies, we measure corporate greenwashing as the difference between symbolic efforts (Sym) and substantive efforts (Sub). Sub refers to substantial environmental actions, such as the allocation of resources, equipment, and technologies to achieve green performance. Sym, in contrast, captures symbolic initiatives aimed at enhancing a firm’s green reputation and legitimacy.
Drawing on Jia et al. (2025) [10], we obtain disclosure data for Sym and Sub from the CSMAR database. Specifically, CSMAR provides standardized disclosure indicators for each sub-index, which allow for consistent comparisons of disclosure practices across firms. The detailed measurement of Sub, Sym, and greenwashing is presented in Table 1. Specifically, Sub is measured as a weighted index of firms’ environmental governance and operational practices. Sym captures firms’ symbolic environmental activities and reputational claims. We deduct negative signals from Sym to better capture the net effect of symbolic efforts as perceived by external audiences. Positive signals, such as environmental statements or honors, enhance a firm’s green image, but negative events, such as regulatory penalties and environmental violations, can substantially undermine symbolic initiatives. Combining positive and negative signals into a net measure aligns with impression management theory, which posits that corporate image is shaped by the dynamic interplay of favorable and unfavorable information. In practice, a company promoting “green visions” while being penalized or exposed for violations sees its symbolic effectiveness diminished; deducting negative signals reflects this real-world perception more accurately.
Finally, the degree of greenwashing is calculated as the standardized difference between symbolic and substantive efforts. A higher GW score reflects greater reliance on symbolic rather than substantive environmental efforts, indicating a higher degree of greenwashing.

4.2.3. Moderating Variables

We employ two types of moderating variables. For non-market external pressures, we use the frequency of environmental keywords in municipal government work reports, which are sourced from city government websites, to capture government environmental regulation. These keywords include “low-carbon,” “environmental protection,” “green,” “pollution,” “emission reduction,” “energy consumption,” “PM2.5,” “PM10,” “chemical oxygen demand,” “carbon dioxide,” “sulfur dioxide,” “ecological,” and “discharge,” among others. We use the number of times a firm is covered by mainstream media within a year to measure media coverage. For market external pressures, we use the shareholding ratio of institutional investors as a proxy for institutional ownership, where institutional investors include mutual funds, banks, qualified foreign institutional investors, insurance companies, brokers, securities funds, trust funds, financial firms, and other investment institutions. Analyst attention is measured by the number of analysts and analyst teams tracking a firm within a year. All firm-level moderating variables are obtained from the CSMAR database.

4.2.4. Control Variables

Following prior studies, we include a set of control variables that may affect firms’ BDA and greenwashing. These include firm age (number of years since establishment), firm size (natural logarithm of total assets), revenue (natural logarithm of total operating income), leverage (ratio of total debt to total assets), profitability (return on total assets, ROA), fixed asset ratio, board size (number of directors on the board), female director (number of female directors on the board), and growth opportunities (Tobin’s Q).
Table 2 provides the definitions of all variables used in this study.

4.3. Empirical Strategy

To test the proposed hypotheses, we estimate the following models:
G W i t = α + β B D A i t + γ X i t + e i + e t + ε i t
G W i t = α + β B D A i t + δ M i t × B D A i t + ρ M i t + γ X i t + e i + e t + ε i t
where G W i t represents the greenwashing level of firm i in year t, B D A i t refers to the big data analytics capability of firm i in year t, X i t denotes a set of control variables included in the model, e i and e t capture firm and year fixed effects, and ε i t is the error term. Model 1 serves as the baseline specification to test Hypothesis 1. Model 2 incorporates moderating effects to test Hypotheses 2 and 3, where M i t represents the moderators, including government environmental regulation, media coverage, institutional ownership, and analyst attention.

5. Results

5.1. Descriptive Statistics and Correlations

The descriptive statistics and correlation analysis of the variables are presented in Table 3. The correlation matrix shows that most variables are significantly correlated at conventional levels. Notably, BDA is positively associated with GW (coefficient = 0.136, p < 0.01), providing preliminary evidence in line with Hypothesis 1. We further conduct a variance inflation factor (VIF) test to examine potential multicollinearity. The results indicate that all VIF values are well below the threshold of 10 (the highest being 2.55 for firm size), suggesting that multicollinearity is not a concern in our models. Table 3 also reports the minimum, maximum, mean, and standard deviation of each variable, which are consistent with findings from prior studies [10].

5.2. Baseline Results

Table 4 presents the baseline regression results. Column (1) reports the specification with only the key independent variable BDA and the dependent variable GW. Column (2) adds firm and year fixed effects. Column (3) includes control variables, and column (4) includes both control variables and fixed effects. Across all columns, the coefficient of BDA remains significantly positive at the 1% level (0.103, p < 0.01 in column 2; 0.095, p < 0.01 in column 4). The magnitude of the coefficients changes only slightly after introducing control variables and fixed effects, suggesting that the positive association between BDA and greenwashing is not driven by omitted firm characteristics. These findings provide empirical support for Hypothesis 1, which posits that firms’ big data analytics capabilities facilitate greenwashing.
Table 5 reports the regression results on the moderating effects. Column (1) presents the model with the interaction term between government environmental regulation and BDA. The coefficient of the interaction term is significantly negative (coefficient = −0.044, p < 0.1), indicating that stricter government oversight attenuates the positive effect of BDA on greenwashing. Similarly, Column (2) introduces the interaction between media coverage and BDA, and the coefficient is also significantly negative (coefficient = −0.044, p < 0.01). These results imply that non-market pressures, including environmental regulation and media coverage, restrict firms’ use of advanced data technologies for opportunistic greenwashing purposes, and provide evidence for Hypothesis 2. Columns (3) and (4) test the moderating roles of market pressures. Column (3) incorporates the interaction between institutional ownership and BDA, while Column (4) introduces the interaction between analyst attention and BDA. Both coefficients are significantly positive (coefficient = 0.170, p < 0.001; coefficient = 0.019, p < 0.05). These findings provide support for Hypothesis 3: market pressures (institutional ownership and analyst attention) strengthen the effect of BDA on greenwashing.

5.3. Robustness Tests

We conducted several tests to verify the robustness of the baseline regression results. First, we use the alternative measures of both the independent and dependent variables to check the consistency of the findings. Second, we applied an instrumental variable approach to address potential endogeneity issues in the regression model.
On the dependent variable side, following Hu et al. (2023) [63], we construct a greenwashing dummy variable. The dummy equals 1 if the number of keywords such as “green,” “environmental protection,” or “low carbon” in the annual report is above the median and the firm receives an environmental punishment in the same year; otherwise, it equals 0. Second, following Zhang (2023) [64], we construct GW_diver, defined as the divergence between firms’ Bloomberg ESG ratings and Huazheng ESG ratings. A larger divergence reflects greater inconsistency in external ESG assessments and thus indicates a higher likelihood of symbolic or opportunistic environmental disclosure. Third, we develop a tone-based proxy of greenwashing, denoted as GW_tone. Specifically, we measure the positivity of environmental tone in firms’ social responsibility reports and compute the standardized difference between positive environmental tone and substantive environmental actions measured by Sub. A higher value of GW_tone indicates a greater gap between rhetorical environmental claims and actual environmental performance, and thus a higher degree of greenwashing. We then re-estimate the baseline regression using these alternative dependent variables. As reported in Columns (1)–(3) of Table 6, the coefficient of BDA remains positive and statistically significant at the 1% level across all three specifications.
On the independent variable side, we employ three alternative proxies to capture different dimensions of firms’ big data analytics. First, we use the proportion of BDA-related keywords in firms’ annual reports, which serves as an alternative text-based indicator of BDA intensity. Second, we construct a patent-based proxy, BDA_patent, measured as the number of firm-year patent applications related to key digital technologies: artificial intelligence, high-end chips, quantum information, the Internet of Things, blockchain, industrial internet, and metaverse technologies. Third, we employ an asset-based proxy, BDA_asset, defined as the proportion of digital-related intangible assets, such as software, networks, client terminals, management systems, and digital platforms, in total intangible assets. Taken together, BDA_patent and BDA_asset reflect firms’ digital technology intensity and digital infrastructure and asset base, respectively, both of which facilitate firms’ ability to collect, process, and analyze large volumes of data and thereby support the adoption and use of big data analytics.
As reported in Columns (4)–(6) of Table 6, the estimated coefficients on BDA_ratio, BDA_patent, and BDA_asset are all positive and statistically significant at the 1% level. These findings are consistent with the baseline results, suggesting that our estimates are robust.
A potential endogeneity concern arises because big data analytics (BDA) can be both a driver and a consequence of corporate greenwashing. On the one hand, BDA provides firms with effective tools to facilitate greenwashing. On the other hand, when firms intend to engage in greenwashing, they may increase their investment in BDA to enhance the credibility and sophistication of such practices. This reverse causality may bias the estimation results. To address this issue, we adopt a two-stage least squares (2SLS) approach and employ the National Big Data Pilot Zone as an instrumental variable. Specifically, we construct a dummy variable that equals one if a firm is located in a city designated as a National Big Data Pilot Zone and zero otherwise.
Since 2016, the Chinese government has established pilot zones in selected cities to promote digital transformation and data utilization. The relevance condition is satisfied because firms located in pilot zones are more likely to access preferential policies, infrastructure, and data resources, thereby enhancing their adoption of BDA. The exogeneity condition is also plausible, as the designation of pilot zones was determined by national strategic considerations at the regional level rather than by firm-level outcomes. The policy is exogenous to individual firms’ greenwashing performance and affects it only through its impact on corporate BDA.
A potential concern is that the National Big Data Pilot Zone policy may affect corporate greenwashing through city-level characteristics. Specifically, the designation of pilot zones may influence corporate environmental behavior by shaping local government regulatory intensity, regional economic policies, environmental supervision standards, or the development of green finance. These region-level institutional factors may affect firms’ greenwashing behavior independently of their use of BDA. Accordingly, our empirical specification includes city fixed effects, which absorb time-invariant unobservable characteristics at the city level. By exploiting within-city variation over time, the inclusion of city fixed effects helps mitigate endogeneity concerns arising from persistent regional factors.
The instrumental variable regression results are presented in Table 7. Column (1) reports the baseline IV regression, which confirms a statistically significant and positive effect of BDA on greenwashing. To ensure robustness, we employ alternative proxies for the key explanatory variable in columns (2) to (4), and for the dependent variable in columns (5) to (7). Across all specifications, the estimated coefficients remain positive and significant at the 1% level, reinforcing the reliability of our main finding. In the first stage, the coefficient of the instrumental variable on the endogenous dependent variables is significantly positive, confirming the relevance of the instrument. We further conduct a weak instrument test and an underidentification test. The results show a Cragg-Donald Wald F statistic far exceeding the threshold of 10 and a large Kleibergen–Paap LM statistic. Taken together, these findings indicate that our instrumental variable is valid and that the baseline regression results are robust.
Although the instrumental variable approach helps address potential endogeneity concerns, its validity may still be challenged if the policy instrument affects corporate greenwashing through other time-varying city-level channels. To further alleviate concerns related to reverse causality and omitted dynamic effects, we employ a dynamic panel data model and estimate it using the system generalized method of moments. In the system GMM estimation, the lagged dependent variable (L.GW) and firms’ BDA are treated as endogenous variables and instrumented by their own lagged values. Other firm-level control variables are treated as exogenous, and firm and year fixed effects are included. The estimation is conducted using a two-step robust system GMM procedure.
The estimation results are reported in Table 8, column (1). The coefficient on L.GW is positive and statistically significant, indicating strong persistence in corporate greenwashing behavior. More importantly, the coefficient on BDA remains positive and highly significant at the 1% level, suggesting that firms’ use of BDA continues to exacerbate greenwashing behavior even after accounting for dynamic effects and endogeneity concerns. Diagnostic tests support the validity of the System GMM estimation. The AR (1) test indicates the presence of first-order serial correlation, while the AR (2) test fails to reject the null hypothesis, suggesting no second-order serial correlation in the differenced errors. In addition, the Hansen test does not reject the null hypothesis of instrument validity, indicating that the chosen instruments are appropriate.
The baseline regression results may also suffer from sample selection bias because corporate greenwashing (GW) is observable only for firms that voluntarily disclose environmental information. If a firm’s disclosure decision is systematically correlated with its level of big data analytics (BDA) or with unobserved greenwashing propensity, estimates based solely on the disclosing subsample would be biased and inconsistent. To address this concern, we employ the Heckman two-stage procedure.
In the first stage, we model a firm’s probability of entering the observable sample, using whether it discloses environmental information in its annual report (Disclosure) as the selection variable. The industry-average level of environmental disclosure (Indus_average) is used as the exclusion restriction, capturing industry-level disclosure norms that affect firms’ disclosure decisions but are plausibly exogenous to their greenwashing behavior.
In the second stage, we include the inverse Mills ratio (IMR) derived from the first stage to correct for selection bias. As reported in Table 8, column (2)–(3), the coefficient on the IMR is positive and statistically significant at the 1% level, confirming the presence of non-random sample selection. This result suggests that firms that do not disclose environmental information exhibit a higher latent tendency toward greenwashing. After correcting for this bias, the coefficient on the core explanatory variable, BDA, remains positive and significant at the 5% level. Overall, these findings are consistent with the baseline results and demonstrate that our core conclusion remains robust after accounting for endogeneity arising from non-random sample selection.

6. Discussion and Conclusions

With the global rise of digitalization and growing concerns over the environment, the relationship between digital technologies and corporate green responsibility has become increasingly important. This study examines the impact of big data analytics (BDA) on corporate greenwashing. While prior research generally suggests that BDA promotes firms’ green development [4,5], it often overlooks the darker side of digital technologies [8,9,10]. Using panel data of Chinese listed firms from 2012 to 2023, we find that BDA tends to facilitate greenwashing. Drawing on impression management theory, we argue that BDA enables firms to embellish their green image through three core strategies: self-serving bias, symbolic management, and accounting rhetoric, thereby making it look green and intensifying greenwashing. From an institutional perspective, external legitimacy pressures are the main drivers of firms’ use of BDA for greenwashing. Specifically, constraint-based non-market pressures (environmental regulation and media coverage) suppress such behavior, whereas opportunity-based market pressures (institutional ownership and analyst attention) amplify it, suggesting that firms respond differently to different types of external pressures.

6.1. Theoretical Implication

This study makes three theoretical contributions to the literature on greenwashing and digital technologies.
First, this study adds to research on corporate environmental performance by revealing the dark side of digital technologies in greenwashing. Prior research connecting BDA to corporate environment performance has mainly highlighted its positive impacts [4,5]. Scholars have described several pathways through which BDA enhances environmental performance and sustainability, such as strengthening environmental monitoring, improving disclosure quality, and increasing transparency [1,6,7]. However, the same technical means can also be used for deception and greenwashing. We argue that BDA, as a digital capability, inherently carries the potential to enable greenwashing. There, our findings provide one of the earliest empirical examinations showing that BDA can also facilitate corporate greenwashing. From an institutional theory perspective, whether big data analytics serves as a solution or as a tool for greenwashing depends on the institutional context. We further develop this view by focusing on corporate environmental performance across different external environments. By doing so, this study challenges the prevailing assumption that more data always leads to better outcomes. This contribution advances the sustainability and digital transformation literature by demonstrating that digital technologies, when embedded in legitimacy-driven contexts, may generate unintended ethical and environmental risks.
Second, we shed novel light on how and why big data analytics facilitates greenwashing by linking it to impression management and institutional theory. Our findings can be understood from the view that big data analytics alters the marginal cost and marginal benefit structure of greenwashing. Big data analytics lowers the marginal cost of symbolic disclosure through large-scale data processing, automation, and algorithmic generation. Firms can repeatedly produce tailored reports, selectively highlight favorable indicators, and make disclosures appear objective at relatively low incremental cost. The expected benefits of using BDA for greenwashing differ across institutional contexts, and these differences shape firms’ strategic decisions under both market and non-market pressures. This integration of impression management theory and institutional theory with digital technology deepens the understanding of the mechanisms and boundary conditions through which BDA enables greenwashing.
Third, this study extends institutional theory to the context of digital sustainability. Although prior research has identified various external institutional pressures affecting greenwashing, such as governmental, market, and social oversight [35,36,37,40], these pressures are typically examined separately, lacking an integrated framework that explains how they shape the use of digital technologies. We distinguish between constraint-based and opportunity-based external legitimacy pressures and provide empirical evidence that they have opposing effects on BDA-enabled greenwashing: the former suppresses the misuse of BDA, whereas the latter amplifies it. This dual-path framework shows that external legitimacy pressures can steer digital capabilities toward either transparency or deception, thereby enriching institutional theory within digital contexts.
Finally, we differentiate our study from Jia et al. (2025) [10], who examine the overall effects of digital transformation on greenwashing, by focusing specifically on big data analytics. This more granular approach allows us to uncover how BDA facilitates greenwashing through impression management tactics. By moving beyond a general discussion of digitalization, this study illustrates at a more operational and technical level how data tools can be used to shape external perceptions. In addition, we extend the analysis to listed companies across all industries, enhancing the generalizability of our findings. In doing so, we enrich research on digital technology-enabled corporate deception.

6.2. Practical Implications

This study discusses why and how firms use BDA to engage in greenwashing. The research provides meaningful implications for both firms and their stakeholders.
For firms, they should recognize the “double-edged sword” nature of BDA: while BDA can unlock data value for substantive environmental improvement, it should not be used as a tool for impression management. Firms need to balance BDA investment with substantive environmental actions, strengthen internal oversight of environmental information disclosure, and avoid using data analytics to manipulate stakeholder perceptions.
External institutional pressure is a key driver of BDA-enabled greenwashing. For policymakers, governments should further standardize the disclosure of environmental information and increase penalties for data-driven greenwashing. For the media, it is necessary to give full play to its role as a supervisor and information intermediary, and use public opinion pressure to constrain enterprises’ improper behaviors. For investors and analysts, they should enhance their ability to identify BDA-enabled greenwashing: for example, investors can request third-party audits of firms’ environmental reports, and analysts can focus on verifying the consistency between firms’ digital environmental claims and actual environmental performance.

6.3. Limitations and Directions for Future Research

Finally, this study has several limitations, which also point out directions for future research. First, the research sample only covers Chinese listed companies. Future studies can extend the analysis to firms in other emerging or developed economies to test the cross-country generalizability of the research findings, with particular attention to the potential impacts of different institutional environments. Second, this study explores the impact of BDA on greenwashing. It is possible to further explore different big data analytics scenarios, such as those applied to supply chain monitoring and environmental marketing. By disaggregating big data analytics into different dimensions, a more granular understanding of its relationship with greenwashing can be achieved. Third, our study examines firms’ use of BDA primarily through text analysis of annual reports, adopting an external observation perspective. While this approach effectively captures firms’ disclosure orientation toward BDA, we acknowledge that such disclosures may also function as strategic signals within impression management. As a result, the frequency of BDA-related keywords may not fully reflect the actual scale or depth of BDA implementation and may mechanically correlate with corporate greenwashing. Future research could incorporate internal data, conduct managerial surveys, or use case-study methods to gain deeper insights into firms’ internal decision-making logic, thereby deepening insights into the mechanisms of corporate greenwashing in the digital era.

Author Contributions

H.S.: Conceptualization, validation, resources, writing—review and editing, supervision, project administration, funding acquisition. S.L.: methodology, software, formal analysis, investigation, data curation, writing—original draft, visualization. H.S. and S.L. have contributed equally to this work and share first authorship. All authors have read and agreed to the published version of the manuscript.

Funding

This work was supported by the Social Science Foundation of Fujian Province, China (Grant No. FJ2025C046).

Institutional Review Board Statement

Not applicable.

Informed Consent Statement

Not applicable.

Data Availability Statement

Restrictions apply to the availability of these data. Data were obtained from the CSMAR database and CNRDS database.

Acknowledgments

The authors would like to thank the Social Science Foundation of Fujian Province, China (Grant No. FJ2025C046) for the support of this research project.

Conflicts of Interest

The authors declare no conflicts of interest.

References

  1. Tseng, M.L.; Wu, K.J.; Lim, M.K.; Wong, W.P. Data-driven sustainable supply chain management performance: A hierarchical structure assessment under uncertainties. J. Clean. Prod. 2019, 227, 760–771. [Google Scholar] [CrossRef] [Scilit]
  2. Albarrak, M.S.; Elnahass, M.; Papagiannidis, S.; Salama, A. The effect of Twitter dissemination on cost of equity: A big data approach. Int. J. Inf. Manag. 2020, 50, 1–16. [Google Scholar] [CrossRef] [Scilit]
  3. Ndou, V.; Secundo, G.; Dumay, J.; Gjevori, E. Understanding intellectual capital disclosure in online media big data: An exploratory case study in a university. Meditari Account. Res. 2018, 26, 499–530. [Google Scholar] [CrossRef] [Scilit]
  4. Waqas, M.; Honggang, X.; Ahmad, N.; Ullah, S.; Khan, S.A.R. Big data analytics as a roadmap towards green innovation, competitive advantage and environmental performance. J. Clean. Prod. 2021, 323, 128998. [Google Scholar] [CrossRef] [Scilit]
  5. Choi, H.Y.; Park, J. Do data-driven CSR initiatives improve CSR performance? The importance of big data analytics capability. Technol. Forecast. Soc. Change 2022, 182, 121802. [Google Scholar] [CrossRef] [Scilit]
  6. Soni, G.; Mangla, S.K.; Singh, P.; Dey, B.L.; Dora, M. Technological interventions in social business: Mapping current research and establishing future research agenda. Technol. Forecast. Soc. Change 2021, 169, 120818. [Google Scholar] [CrossRef] [Scilit]
  7. Bag, S.; Rahman, M.S.; Srivastava, G.; Sahu, A.K.; Grover, P. Examining the role of virtue ethics and big data in enhancing viable, sustainable, and digital supply chain performance. Technol. Forecast. Soc. Change 2023, 186, 122154. [Google Scholar] [CrossRef] [Scilit]
  8. Seele, P.; Schultz, M.D. From greenwashing to machinewashing: A model and future directions derived from reasoning by analogy. J. Bus. Ethics 2022, 178, 1063–1089. [Google Scholar] [CrossRef] [Scilit]
  9. Agostini, M.; Arkhipova, D.; Mio, C. Corporate accountability and big data analytics: Is non-financial disclosure a missing link? Sustain. Account. Manag. Policy J. 2023, 14, 62–89. [Google Scholar] [CrossRef] [Scilit]
  10. Jia, F.; Du, K.; Chen, L.; Zhang, Y.; Li, Y. The side effects of corporate digitalization on corporate social responsibility: A fraud triangle perspective. Br. J. Manag. 2025; in press. [CrossRef] [Scilit]
  11. Liu, L. The rise of data politics: Digital China and the world. Stud. Comp. Int. Dev. 2021, 56, 45–67. [Google Scholar] [CrossRef] [Scilit]
  12. Wang, J.; Xu, C.; Zhang, J.; Li, Y. Big data analytics for intelligent manufacturing systems: A review. J. Manuf. Syst. 2022, 62, 738–752. [Google Scholar] [CrossRef] [Scilit]
  13. Li, L.; Lin, J.; Ouyang, Y.; Luo, X. Evaluating the impact of big data analytics usage on the decision-making quality of organizations. Technol. Forecast. Soc. Change 2022, 175, 121355. [Google Scholar] [CrossRef] [Scilit]
  14. Wei, X.; Jiang, F.; Yang, L. Does digital dividend matter in China’s green low-carbon development? Environmental impact assessment of the big data comprehensive pilot zones policy. Environ. Impact Assess. Rev. 2023, 101, 107143. [Google Scholar] [CrossRef] [Scilit]
  15. Qin, C.; Zhang, M.; Yang, C. Can national big data comprehensive experimental zones boost the development of regional green finance? Evidence from China. Emerg. Mark. Financ. Trade 2024, 60, 541–556. [Google Scholar] [CrossRef] [Scilit]
  16. Liao, L.; Lin, T.; Zhang, Y. Corporate board and corporate social responsibility assurance: Evidence from China. J. Bus. Ethics 2018, 150, 211–225. [Google Scholar] [CrossRef] [Scilit]
  17. Wang, W.; Zhao, C.; Jiang, X.; Liu, Y. Corporate environmental responsibility in China: A strategic political perspective. Sustain. Account. Manag. Policy J. 2021, 12, 220–239. [Google Scholar] [CrossRef] [Scilit]
  18. Nguyen, T.H.H.; Elmagrhi, M.H.; Ntim, C.G.; Wu, Y. Environmental performance, sustainability, governance and financial performance: Evidence from heavily polluting industries in China. Bus. Strategy Environ. 2021, 30, 2313–2331. [Google Scholar] [CrossRef] [Scilit]
  19. Wu, G.; Sun, M.; Feng, Y. How does the new environmental protection law affect the environmental social responsibility of enterprises in Chinese heavily polluting industries? Humanit. Soc. Sci. Commun. 2024, 11, 1–14. [Google Scholar] [CrossRef] [Scilit]
  20. Li, Z.; Huang, Z.; Su, Y. New media environment, environmental regulation and corporate green technology innovation: Evidence from China. Energy Econ. 2023, 119, 106545. [Google Scholar] [CrossRef] [Scilit]
  21. Wang, S.; Lai, Y.; Zhang, S. Greening by digitization? Exploring the effect of enterprise digital transformation on greenwashing. Bus. Strategy Environ. 2024, 33, 6616–6639. [Google Scholar] [CrossRef] [Scilit]
  22. George, G.; Haas, M.R.; Pentland, A. Big data and management. Acad. Manag. J. 2014, 57, 321–326. [Google Scholar] [CrossRef] [Scilit]
  23. Tsai, C.W.; Lai, C.F.; Chao, H.C.; Vasilakos, A.V. Big data analytics: A survey. J. Big Data 2015, 2, 21. [Google Scholar] [CrossRef] [Scilit]
  24. Grover, V.; Chiang, R.H.L.; Liang, T.P.; Zhang, D. Creating strategic business value from big data analytics: A research framework. J. Manag. Inf. Syst. 2018, 35, 388–423. [Google Scholar] [CrossRef] [Scilit]
  25. Mikalef, P.; Pappas, I.O.; Krogstie, J.; Giannakos, M. Big data analytics capabilities: A systematic literature review and research agenda. Inf. Syst. e-Bus. Manag. 2018, 16, 547–578. [Google Scholar] [CrossRef] [Scilit]
  26. Janssen, M.; Van Der Voort, H.; Wahyudi, A. Factors influencing big data decision-making quality. J. Bus. Res. 2017, 70, 338–345. [Google Scholar] [CrossRef] [Scilit]
  27. Awan, U.; Shamim, S.; Khan, Z.; Zia, N.U.; Shariq, S.M.; Khan, M.N. Big data analytics capability and decision-making: The role of data-driven insight on circular economy performance. Technol. Forecast. Soc. Change 2021, 168, 120766. [Google Scholar] [CrossRef] [Scilit]
  28. Chatterjee, S.; Chaudhuri, R.; Gupta, S.; Kumar, A.; Singh, S. Assessing the impact of big data analytics on decision-making processes, forecasting, and performance of a firm. Technol. Forecast. Soc. Change 2023, 196, 122824. [Google Scholar] [CrossRef] [Scilit]
  29. Li, Y.; Zheng, L.; Xie, C.; Chen, J. Big data development and enterprise ESG performance: Empirical evidence from China. Int. Rev. Econ. Financ. 2024, 93, 742–755. [Google Scholar] [CrossRef] [Scilit]
  30. Ghasemaghaei, M.; Turel, O. Possible negative effects of big data on decision quality in firms: The role of knowledge hiding behaviours. Inf. Syst. J. 2021, 31, 268–293. [Google Scholar] [CrossRef] [Scilit]
  31. Dumitrescu, A.; Gil-Bazo, J.; Zhou, F. Defining greenwashing. SSRN Electron. J. 2022. [Google Scholar] [CrossRef] [Scilit]
  32. Meyer, J.W.; Rowan, B. Institutionalized organizations: Formal structure as myth and ceremony. Am. J. Sociol. 1977, 83, 340–363. [Google Scholar] [CrossRef] [Scilit]
  33. Ashforth, B.E.; Gibbs, B.W. The double-edge of organizational legitimation. Organ. Sci. 1990, 1, 177–194. [Google Scholar] [CrossRef] [Scilit]
  34. Suchman, M.C. Managing legitimacy: Strategic and institutional approaches. Acad. Manag. Rev. 1995, 20, 571–610. [Google Scholar] [CrossRef] [Scilit]
  35. Li, R.; Ramanathan, R. Exploring the relationships between different types of environmental regulations and environmental performance: Evidence from China. J. Clean. Prod. 2018, 196, 1329–1340. [Google Scholar] [CrossRef] [Scilit]
  36. Li, W.; Li, W.; Seppanen, V.; Wang, Y.; Chen, X. Effects of greenwashing on financial performance: Moderation through local environmental regulation and media coverage. Bus. Strategy Environ. 2023, 32, 820–841. [Google Scholar] [CrossRef] [Scilit]
  37. Pizzetti, M.; Gatti, L.; Seele, P. Firms talk, suppliers walk: Analyzing the locus of greenwashing in the blame game and introducing vicarious greenwashing. J. Bus. Ethics, 2021; in press. [CrossRef] [Scilit]
  38. Roulet, T.J.; Touboul, S. The intentions with which the road is paved: Attitudes to liberalism as determinants of greenwashing. J. Bus. Ethics 2015, 128, 305–320. [Google Scholar] [CrossRef] [Scilit]
  39. Wang, J.; Ke, Y.; Sun, L.; Zhang, J. Speculative culture and corporate greenwashing: Evidence from China. Int. Rev. Financ. Anal. 2024, 95, 103447. [Google Scholar] [CrossRef] [Scilit]
  40. Delmas, M.A.; Burbano, V.C. The drivers of greenwashing. Calif. Manag. Rev. 2011, 54, 64–87. [Google Scholar] [CrossRef] [Scilit]
  41. Goffman, E. The presentation of self in everyday life. In Social Theory Re-Wired; Routledge: London, UK, 2023; pp. 450–459. [Google Scholar]
  42. Leary, M.R.; Kowalski, R.M. Impression management: A literature review and two-component model. Psychol. Bull. 1990, 107, 34–47. [Google Scholar] [CrossRef]
  43. Elsbach, K.D.; Sutton, R.I. Acquiring organizational legitimacy through illegitimate actions: A marriage of institutional and impression management theories. Acad. Manag. J. 1992, 35, 699–738. [Google Scholar] [CrossRef] [Scilit]
  44. Elsbach, K.D. Managing organizational legitimacy in the California cattle industry: The construction and effectiveness of verbal accounts. Adm. Sci. Q. 1994, 39, 57–88. [Google Scholar] [CrossRef] [Scilit]
  45. Merkl-Davies, D.M.; Brennan, N.M. A conceptual framework of impression management: New insights from psychology, sociology and critical perspectives. Account. Bus. Res. 2011, 41, 415–437. [Google Scholar] [CrossRef] [Scilit]
  46. Cho, C.H.; Patten, D.M. The role of environmental disclosures as tools of legitimacy: A research note. Account. Organ. Soc. 2007, 32, 639–647. [Google Scholar] [CrossRef] [Scilit]
  47. Li, F. Annual report readability, current earnings, and earnings persistence. J. Account. Econ. 2008, 45, 221–247. [Google Scholar] [CrossRef] [Scilit]
  48. Kitchens, B.; Dobolyi, D.; Li, J.; Abbasi, A. Advanced customer analytics: Strategic value through integration of relationship-oriented big data. J. Manag. Inf. Syst. 2018, 35, 540–574. [Google Scholar] [CrossRef] [Scilit]
  49. Barchiesi, M.A.; Colladon, A.F. Big data and big values: When companies need to rethink themselves. J. Bus. Res. 2021, 129, 714–722. [Google Scholar] [CrossRef] [Scilit]
  50. Bansal, P.; Clelland, I. Talking trash: Legitimacy, impression management, and unsystematic risk in the context of the natural environment. Acad. Manag. J. 2004, 47, 93–103. [Google Scholar] [CrossRef] [Scilit]
  51. Cho, C.H.; Michelon, G.; Patten, D.M. Impression management in sustainability reports: An empirical investigation of the use of graphs. Account. Public Interest 2012, 12, 16–37. [Google Scholar] [CrossRef] [Scilit]
  52. Gupta, M.; George, J.F. Toward the development of a big data analytics capability. Inf. Manag. 2016, 53, 1049–1064. [Google Scholar] [CrossRef] [Scilit]
  53. Marquis, C.; Qian, C. Corporate social responsibility reporting in China: Symbol or substance? Organ. Sci. 2014, 25, 127–148. [Google Scholar] [CrossRef] [Scilit]
  54. Christensen, H.B.; Hail, L.; Leuz, C. Mandatory CSR and sustainability reporting: Economic analysis and literature review. Rev. Account. Stud. 2021, 26, 1176–1248. [Google Scholar] [CrossRef] [Scilit]
  55. Lyon, T.P.; Maxwell, J.W. Greenwash: Corporate environmental disclosure under threat of audit. J. Econ. Manag. Strategy 2011, 20, 3–41. [Google Scholar] [CrossRef] [Scilit]
  56. Ioannou, I.; Serafeim, G. The impact of corporate social responsibility on investment recommendations: Analysts’ perceptions and shifting institutional logics. Strateg. Manag. J. 2015, 36, 1053–1081. [Google Scholar] [CrossRef] [Scilit]
  57. Kim, E.H.; Lyon, T.P. Greenwash vs. brownwash: Exaggeration and undue modesty in corporate sustainability disclosure. Organ. Sci. 2015, 26, 705–723. [Google Scholar] [CrossRef] [Scilit]
  58. Mahoney, L.S.; Thorne, L.; Cecil, L.; LaGore, W. A research note on standalone corporate social responsibility reports: Signaling or greenwashing? Crit. Perspect. Account. 2013, 24, 350–359. [Google Scholar] [CrossRef] [Scilit]
  59. Dyck, A.; Lins, K.V.; Roth, L.; Wagner, H.F. Do institutional investors drive corporate social responsibility? International evidence. J. Financ. Econ. 2019, 131, 693–714. [Google Scholar] [CrossRef] [Scilit]
  60. Shaik, A.S.; Nazrul, A.; Alshibani, S.M.; Khan, A.A.; Alqahtani, F. Environmental and economical sustainability and stakeholder satisfaction in SMEs: Critical technological success factors of big data analytics. Technol. Forecast. Soc. Change 2024, 204, 123397. [Google Scholar] [CrossRef] [Scilit]
  61. Gong, C.; Ribiere, V. Developing a unified definition of digital transformation. Technovation 2021, 102, 102217. [Google Scholar] [CrossRef] [Scilit]
  62. Xu, Q.; Li, X.; Guo, F. Digital transformation and environmental performance: Evidence from Chinese resource-based enterprises. Corp. Soc. Responsib. Environ. Manag. 2023, 30, 1816–1840. [Google Scholar] [CrossRef] [Scilit]
  63. Hu, X.; Hua, R.; Liu, Q.; Zhang, J.; Wang, Y. The green fog: Environmental rating disagreement and corporate greenwashing. Pac.-Basin Financ. J. 2023, 78, 101952. [Google Scholar] [CrossRef] [Scilit]
  64. Zhang, D. Subsidy expiration and greenwashing decision: Is there a role of bankruptcy risk? Energy Econ. 2023, 118, 106530. [Google Scholar] [CrossRef] [Scilit]
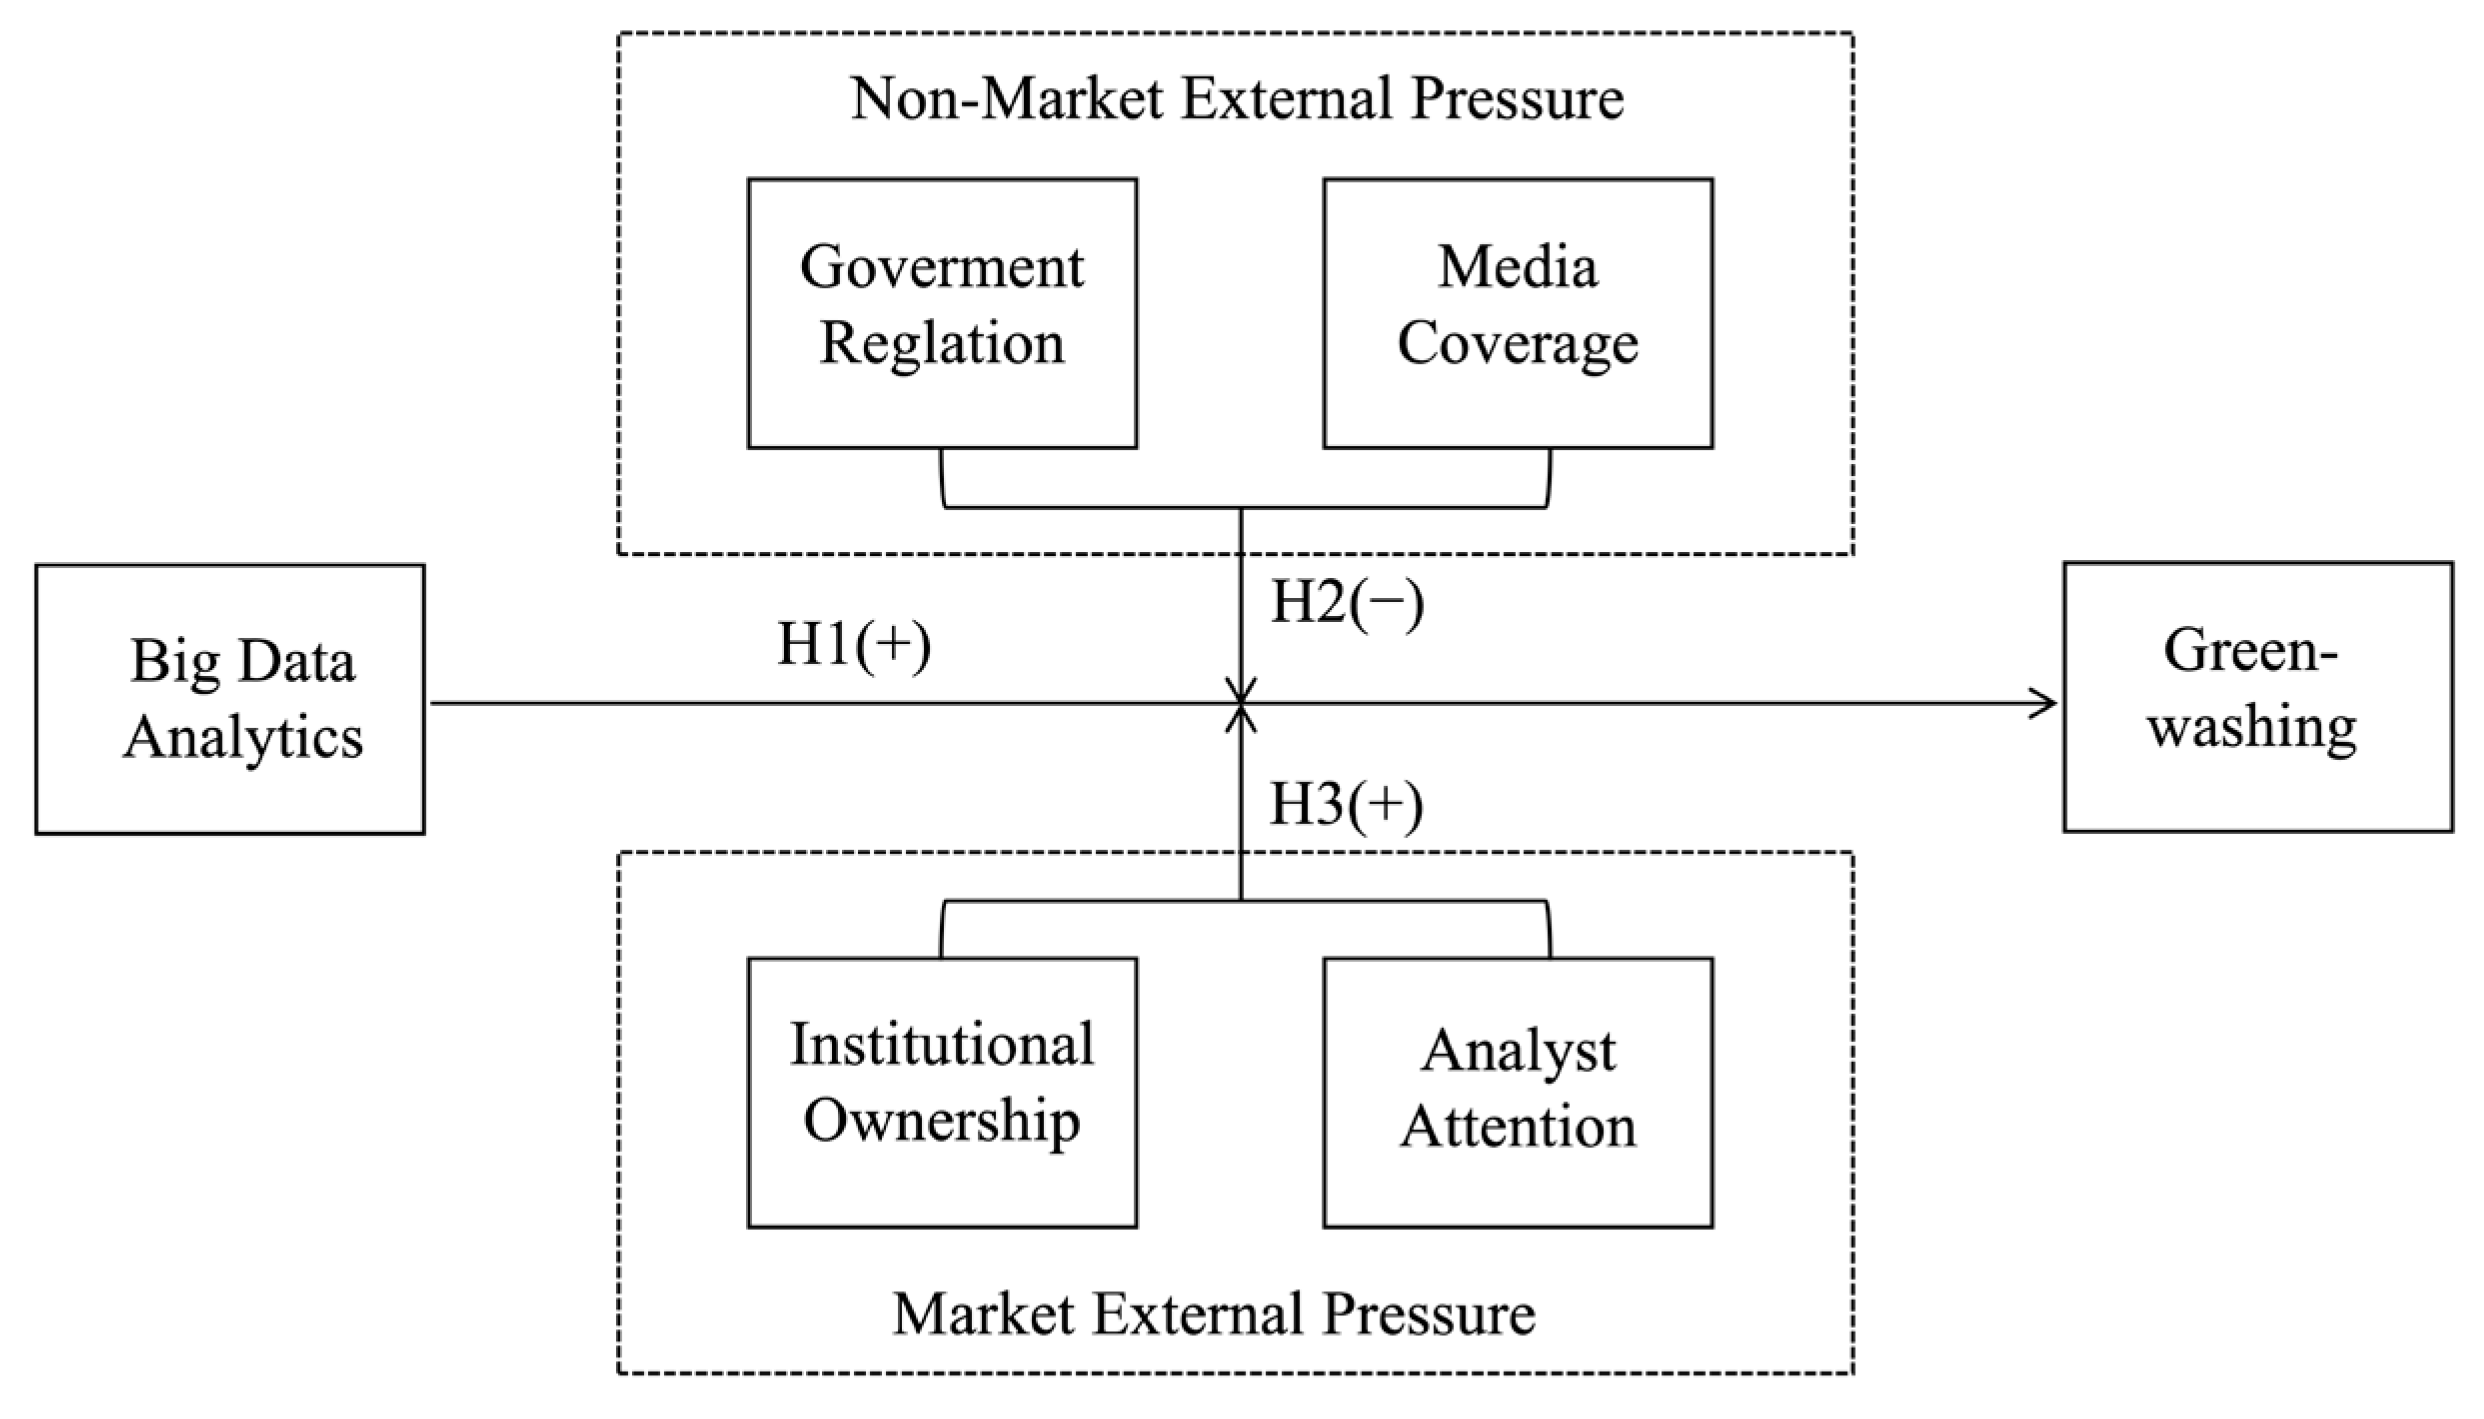
Figure 1. Theoretical Framework.
Sustainability 18 02121 g001
Table 1. Measurement of Greenwashing.
CategoryIndicatorDefinitionScoring Rule
Substantive efforts (Sub)Sub1governance of exhaust emissions controlQuantitative and qualitive descriptions: 2;
Only qualitive descriptions: 1;
Not disclosed: 0
Sub2emissions of exhaust
Sub3governance of wastewater discharge reduction
Sub4wastewater discharge
Sub5governance of dust and smoke control
Sub6smoke and dust emissions
Sub7utilization and disposal of solid waste
Sub8industrial solid waste emissions
Sub9governance of noise, light pollution, radiation
Sub10clean production implementation
Sub11environmental management systemDisclosed: 1;
Not disclosed: 0
Sub12environmental education and training
Sub13environmental special actions
Sub14environmental emergency response mechanisms
Sub15“three simultaneous” systems
Symbolic efforts (Sym)Sym1environmental protection conceptsDisclosed: 1;
Not disclosed: 0
Sym2environmental protection goals
Sym3environmental protection honors or awards
Sym4sudden environmental incidents
Sym5environmental violations
Sym6environmental petitions
Sym7key pollution monitoring units
Sub = Sub1 × Sub2 + Sub3 × Sub4 + Sub5 × Sub6 + Sub7 × Sub8 + Sub9 + Sub10 + Sub11 + Sub12 + Sub13 + Sub14 + Sub15
Sym = Sum1 + Sum2 + Sym3 − (Sym4 + Sym5 + Sym6 + Sym7)
GW = Z-score (Sym) − Z-score (Sub)
Table 2. Definitions of Variable.
VariableDefinitions
GWThe difference between substantive efforts and symbolic efforts
BDAThe logarithm of the frequency of big data–related keywords in annual reports
AgeThe difference between the current year and the firm’s founding year
SizeThe logarithm of total assets
IncomeThe logarithm of total operating income
ROAReturn on total assets
Fixed AssetsRatio of fixed assets
LeverageThe ratio of total debt to total assets
Board SizeThe number of directors on the board
Female DirectorThe number of female directors on the board
Tobin’s Qdegree of Tobin’s Q
RegulationThe logarithm of the frequency of environmental keywords in the government work report of the city where the firm is located
MediaThe logarithm of the number of times the firm is reported by mainstream media in a given year
InstitutionThe proportion of shares held by institutional investors
AnalystThe logarithm of the number of analysts covering the firm in a given year
Table 3. Descriptive Statistics and Correlations.
GWBDARegulationMediaInstitutionAnalystAgeSizeROAFixed AssetsLeverageBoard SizeFemale DirectorTobin’s Q
GW1
BDA0.136 ***1
Regulation−0.011 **0.026 ***1
Media0.009 *0.011 **−0.0061
Institution−0.004−0.138 ***0.0020.056 ***1
Analyst0.022 ***0.053 ***0.029 ***0.294 ***0.247 ***1
Age−0.076 ***−0.026 ***0.013 ***−0.081 ***0.065 ***−0.142 ***1
Size0.008−0.026 ***0.027 ***0.216 ***0.435 ***0.386 ***0.218 ***1
ROA−0.026 ***−0.074 ***0.011 **0.046 ***0.099 ***0.332 ***−0.106 ***−0.020 ***1
Fixed Assets−0.213 ***−0.292 ***−0.033 ***−0.0050.100 ***−0.015 ***−0.014 ***0.030 ***−0.040 ***1
Leverage0.050 ***−0.089 ***0.0060.127 ***0.202 ***0.023 ***0.194 ***0.539 ***−0.368 ***0.037 ***1
Board Size0.025 ***−0.028 ***0.013 ***0.068 ***0.214 ***0.085 ***0.096 ***0.306 ***−0.058 ***0.071 ***0.208 ***1
Female Director0.038 ***0.102 ***0.023 ***0.020 ***−0.051 ***0.017 ***0.032 ***−0.054 ***0.021 ***−0.107 ***−0.064 ***−0.026 ***1
Tobin’s Q0.021 ***0.057 ***0.0020.135 ***−0.068 ***0.086 ***−0.054 ***−0.377 ***0.095 ***−0.074 ***−0.241 ***−0.099 ***0.035 ***1
min−3.5191.7922.7730.6930.0030719.751−0.2780.0020.053500.834
max2.5245.7464.6256.6860.9293.7613627.1940.1980.6750.9321748.549
mean−0.0463.2493.8414.3050.4321.30819.41522.2690.0340.1960.4229.2781.0631.998
SD1.1890.7080.3451.0670.251.1766.1081.4370.0670.1550.2142.3751.0181.295
VIF-1.1511.191.331.611.152.551.401.121.741.101.031.36
Note: *, **, and *** denote significance at the 10%, 5%, and 1% levels, respectively.
Table 4. Baseline Results.
DV:GW(1)(2)(3)(4)
BDA0.225 ***0.103 ***0.143 ***0.095 ***
(0.007)(0.021)(0.007)(0.021)
Age −0.017 ***−0.004
(0.001)(0.023)
Size −0.0030.028
(0.005)(0.020)
ROA 0.013−0.405 ***
(0.035)(0.111)
Fixed Assets −1.481 ***−0.179 *
(0.042)(0.098)
Leverage 0.440 ***0.038
(0.031)(0.069)
Board Size 0.020 ***0.005
(0.003)(0.003)
Female Director 0.021 ***−0.009
(0.006)(0.010)
Tobin Q 0.0020.000
(0.002)(0.007)
Fixed EffectsNOYESNOYES
Observations42,73142,73141,52441,524
R20.0180.0630.0640.064
Note: Robust standard errors are reported in parentheses. * and *** denote significance at the 10% and 1% levels, respectively.
Table 5. Moderating results.
DV:GW(1)(2)(3)(4)
BDA0.096 ***0.089 ***0.094 ***0.101 ***
(0.021)(0.021)(0.021)(0.021)
Regulation × BDA−0.044 *
(0.024)
Regulation−0.046 **
(0.022)
Media × BDA −0.044 ***
(0.009)
Media −0.024 ***
(0.009)
Institution × BDA 0.170 ***
(0.063)
Institution −0.020
(0.083)
Analyst × BDA 0.019 **
(0.010)
Analyst −0.040 ***
(0.010)
Control VariablesYESYESYESYES
Fixed EffectsYESYESYESYES
Observations41,42440,12541,52441,354
R20.0640.0700.0650.066
Note: Robust standard errors are reported in parentheses. *, **, and *** denote significance at the 10%, 5%, and 1% levels, respectively.
Table 6. Robustness test: Alternative proxy for Key Variables.
Model(1)(2)(3)(4)(5)(6)
DVGW_dumGW_diverGW_toneGWGWGW
BDA0.270 ***0.269 ***0.253 ***
(0.071)(0.056)(0.054)
BDA_ratio 0.466 ***
(0.068)
BDA_patent 0.215 ***
(0.009)
BDA_assets 0.406 ***
(0.052)
Control VariablesYESYESYESYESYESYES
Fixed EffectsYESYESYESYESYESYES
Observations20,340919210,80741,52441,64233,264
R2-0.0140.1740.0650.0980.058
Note: Robust standard errors are reported in parentheses. *** denotes significance at the 1% level.
Table 7. Robustness test: 2SLS instrumental variable estimations.
Model(1)(2)(3)(4)(5)(6)(7)
DVGWGWGWGWGW_dumGW_diverGW_tone
BDA2.498 *** 0.649 ***1.350 ***1.680 ***
(0.501) (0.080)(0.300)(0.332)
BDA ratio 5.164 ***
(0.462)
BDA_patent 0.726 ***
(0.054)
BDA_asset 3.559 ***
(0.281)
first stage0.135 ***0.039 ***0.325 ***0.062 ***0.124 ***0.117 ***0.122 ***
(0.005)(0.003)(0.017)(0.003)(0.008)(0.017)(0.016)
C-D Wald F121.036194.846283.891305.075-49.59264.514
K-P LM98.751163.638257.934258.978-46.14060.568
Control VariablesYESYESYESYESYESYESYES
Fixed EffectsYESYESYESYESYESYESYES
Observations41,52441,52441,64233,26420,340919210,807
R20.4210.4740.4530.399-0.3820.321
Note: Robust standard errors are reported in parentheses. *** denotes significance at the 1% level.
Table 8. Robustness test: System GMM and Heckman two-stage analysis.
Model(1) SGMM(2) First Stage(3) Second Stage
DVGWDisclosureGW
BDA1.378 *** 0.050 **
(0.185) (0.024)
L.GW0.254 **
(0.113)
AR (1)−6.37 ***
[0.000]
AR (2)0.74
[0.462]
Hansen Test40.97
(0.133)
Indus_average 1.130 ***
(0.056)
IMR 1.354 ***
(0.108)
Control VariablesYESYESYES
Fixed EffectsYESYESYES
Observations30,11840,33835,589
R2--0.074
Note: Robust standard errors are reported in parentheses. p-values for the AR (1), AR (2), and Hansen tests are reported in brackets. **, and *** denote significance at the 5% and 1% levels, respectively.
Disclaimer/Publisher’s Note: The statements, opinions and data contained in all publications are solely those of the individual author(s) and contributor(s) and not of MDPI and/or the editor(s). MDPI and/or the editor(s) disclaim responsibility for any injury to people or property resulting from any ideas, methods, instructions or products referred to in the content.



